T3 T1 Physical Layer Analyzer · 3 GL’s Products 3 Voice, Fax, ... Physical Layer Analyzer 1...
32
1 T3 T1 Physical Layer Analyzer
Transcript of T3 T1 Physical Layer Analyzer · 3 GL’s Products 3 Voice, Fax, ... Physical Layer Analyzer 1...

1
T3 T1 Physical Layer Analyzer

2
Company Profile
• A global leader in Test and Measurement Solutions for Telecom
• 30 years in business, all major Equipment Vendors & Service Providers
• Comprehensive telecom testing solutions to ensure 'quality & reliability' of telecom networks
- Expertise in 4G (LTE), 3G (UMTS), All-IP, Ethernet, T1 E1, T3 E3, Optical, and PSTN
- Provides unprecedented capture, storage, visualization, centralized access & control, portability, convenience, & cost-effectiveness
- Widely used for troubleshooting networks, conformance, performance, & automated testing
• Consulting services for system design of wireless, satellite, fibre optic, & microwave networks,
• Please visit http://www.gl.com for more information.

3
GL’s Products
3
Voice, Fax, Data, & Video Quality TestingVoIP, TDM, PSTN, Wireless, Bluetooth
PESQ, POLQA, PAMS
TDM Simulation & AnalysisT1, E1, Analog, FXO, FXS
High Speed Telecom LinesOC-3, OC-12, STM-1, STM-4, T3, E3
Channelized & Unchannelized
Network-wide Monitoring SolutionsSignaling & Traffic over VoIP, TDM, Wireless
Wireless Simulation & AnalysisLTE, VoLTE, UMTS, GSM, TRAU, GPRS
Wireless Drive Testing, GPS Mapping
Signaling, Traffic, Voice & Data QoS
IP and Ethernet Simulation & AnalysisGigE Ethernet -10Mbps,1/10/40 Gbps,
MPLS, VLAN, RFC2544, EtherSAM
All Protocols over IP, TCP, UDP

4
What You Need?
Description Quantity ITEM
Custom 19” 2U Rack Enclosure for 3 USB T3 E3 Units + 1 USB T3 E3 unit 1 Other T1/E1
19” 1U Rack Mount PC w/o Monitor, but with
Keyboard, Mouse, Xeon 8 GB, 500 GB
1 TE3005
Dual T3 E3 / T1 E1 Hardware USB Base Unit 1 TE3001
T3 / T1 / E1 Analyzer Basic Software 1 TT3001
Direct T1 Analysis for up to 28 T1s from a T3 – Basic Software 1 TT3200
Physical Layer Analyzer 1 XX100
Record File T1 within T3 1 TTT020
T3 Notification Sender (SNMP) 1 Other T1/E1
T1 Notification Sender (SNMP) 1 Other T1/E1
5
Introduction
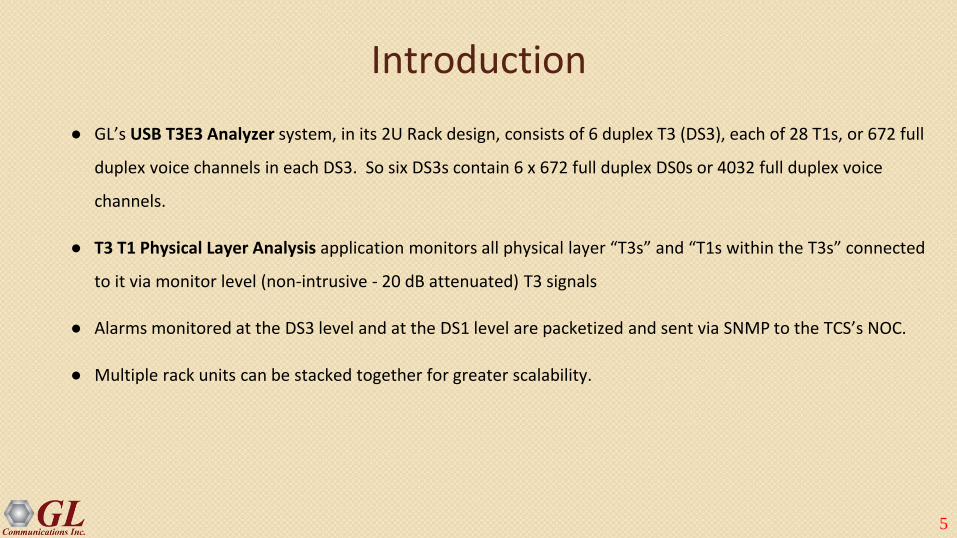
● GL’s USB T3E3 Analyzer system, in its 2U Rack design, consists of 6 duplex T3 (DS3), each of 28 T1s, or 672 full
duplex voice channels in each DS3. So six DS3s contain 6 x 672 full duplex DS0s or 4032 full duplex voice
channels.
● T3 T1 Physical Layer Analysis application monitors all physical layer “T3s” and “T1s within the T3s” connected
to it via monitor level (non-intrusive - 20 dB attenuated) T3 signals
● Alarms monitored at the DS3 level and at the DS1 level are packetized and sent via SNMP to the TCS’s NOC.
● Multiple rack units can be stacked together for greater scalability.

6
2U Rackmount USB T3 E3 Analyzer System for One Site● 5x 19” (2U) Custom Rackmount Enclosures housing USB T3 E3 Units, pre-installed. Four of the Rack
enclosures have three USB T3 E3 Analyzers installed in each. One Rack enclosure has just one USB T3 E3 Analyzers installed
○ 2 for Spokane, 2 for Seattle, and One for Lab - All are Labeled

7
Server Grade PC for One Site
● 3x 19” (1U) Rack Mount Server Grade PCs w/o Monitor, but with Keyboard, Mouse, Xeon CPU, 8 GB RAM, 500 GB SSD
○ 1 for Spokane, 1 for Seattle, and 1 for Lab - All are Labeled
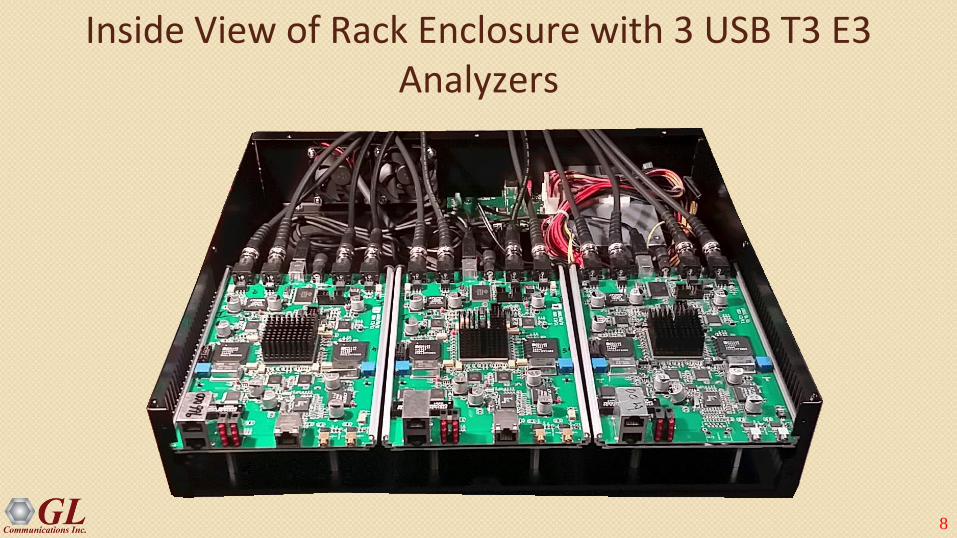
8
Inside View of Rack Enclosure with 3 USB T3 E3 Analyzers
9
USB Cables and Accessories Requirement
● 5 USB Cables - Two for Spokane, two for Seattle, one for Lab
○ USB Type B connector cable only for USB 2.0 compliant interface
● External power cables for the Rack Enclosures and Server Grade PCs
10
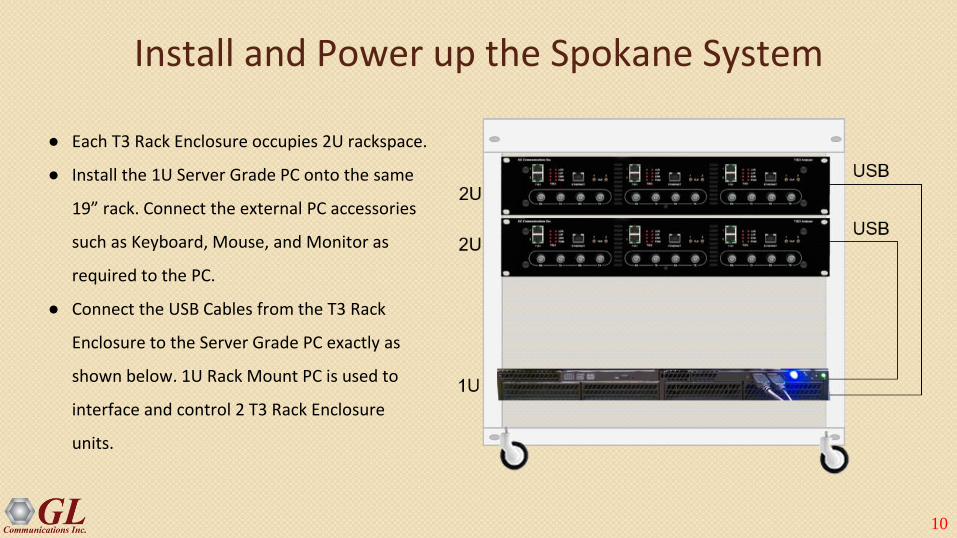
Install and Power up the Spokane System
● Each T3 Rack Enclosure occupies 2U rackspace.
● Install the 1U Server Grade PC onto the same
19” rack. Connect the external PC accessories
such as Keyboard, Mouse, and Monitor as
required to the PC.
● Connect the USB Cables from the T3 Rack
Enclosure to the Server Grade PC exactly as
shown below. 1U Rack Mount PC is used to
interface and control 2 T3 Rack Enclosure
units.

11
Back Side Connection of USB Cables from T3 Rack Enclosure to the Server Grade PC
12
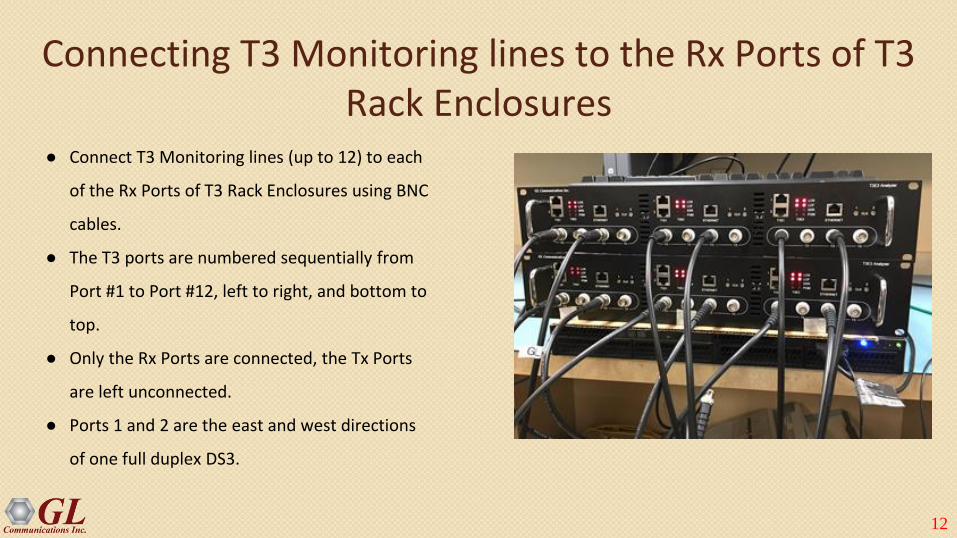
Connecting T3 Monitoring lines to the Rx Ports of T3 Rack Enclosures
● Connect T3 Monitoring lines (up to 12) to each
of the Rx Ports of T3 Rack Enclosures using BNC
cables.
● The T3 ports are numbered sequentially from
Port #1 to Port #12, left to right, and bottom to
top.
● Only the Rx Ports are connected, the Tx Ports
are left unconnected.
● Ports 1 and 2 are the east and west directions
of one full duplex DS3.

13
Verification of Proper Application Running at Spokane● There should be five to six applications running on the
“taskbar”
○ TeamViewer App - is for remote control, may only
be there temporarily during initial installation.
○ T3 E3 App - monitors all T3 E3 lines.
○ T3 E3 Physical Layer App - records and sends T3
SNMP messages to NOC
○ Soft T1 E1 App - monitors all T1 E1 lines within the
T3 E3s
○ T1 E1 Physical Layer App - records and send T1
SNMP messages to NOC
○ AlwaysUp App - (This icon may be hidden) This
ensures that the above four applications are always
running. Permits automatic restart on temporary
power failure, application failure, temporary PC
failure, etc.

14
Theory of Operation
15
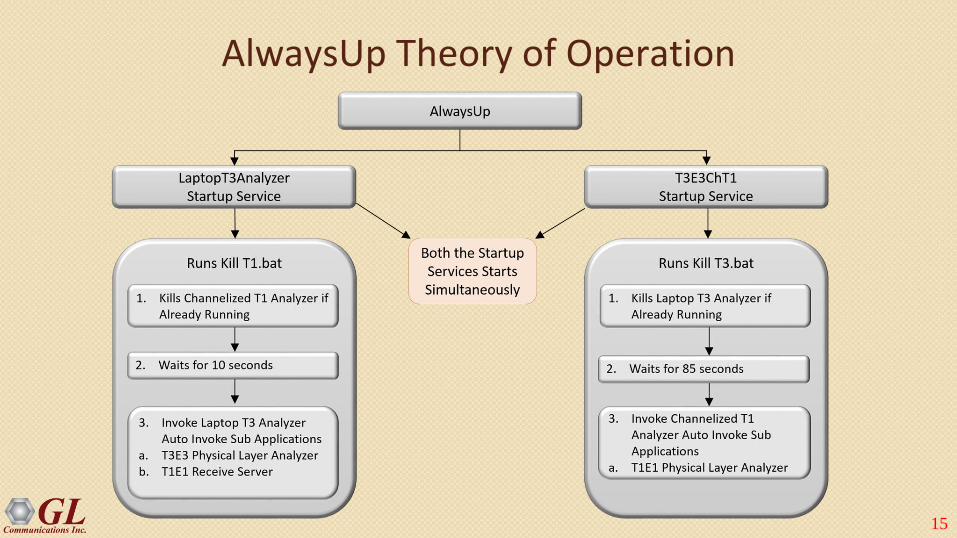
AlwaysUp Theory of Operation

16
Kill T1.battaskkill /f /im "T3E3ChT1.exe"
TIMEOUT /T 10: wait for 10 seconds.
/im: will close the T3E3ChT1.exe file.
/f: will force to close T3E3ChT1.exe file.
Kill T3.battaskkill /f /im "LaptopT3Analyzer.exe"
TIMEOUT /T 85: wait for 85 seconds.
/im: will close the LaptopT3Analyzer.exe file.
/f: will force to close LaptopT3Analyzer.exe
file.

17
Proper T3E3 App Operation

18
Proper T3E3 App Operation...
● In USB T3 E3 Analyzer application, under monitor alarms, All LEDs appear green - if T3 lines are
connected to all of the Rx Ports. There are 12 Rx ports
● Frequency should be approximately 44.736 MHz, and Level may be “Low” or -20 dBsx (minus 20
dBsx)
● No errors or just a few
● If some of the T3s are unconnected, or impaired, then the corresponding monitor boxes will show
alarms
19
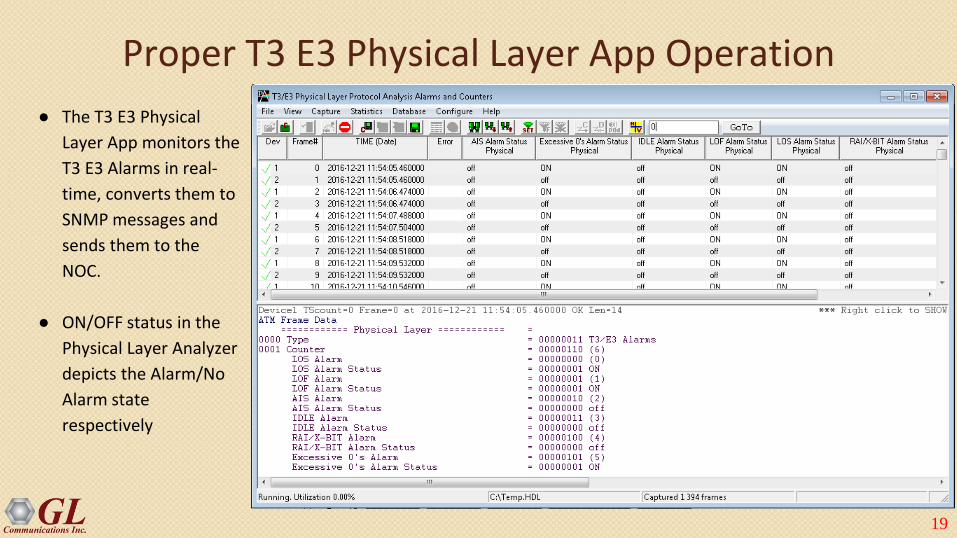
Proper T3 E3 Physical Layer App Operation
● The T3 E3 Physical
Layer App monitors the
T3 E3 Alarms in real-
time, converts them to
SNMP messages and
sends them to the
NOC.
● ON/OFF status in the
Physical Layer Analyzer
depicts the Alarm/No
Alarm state
respectively
20
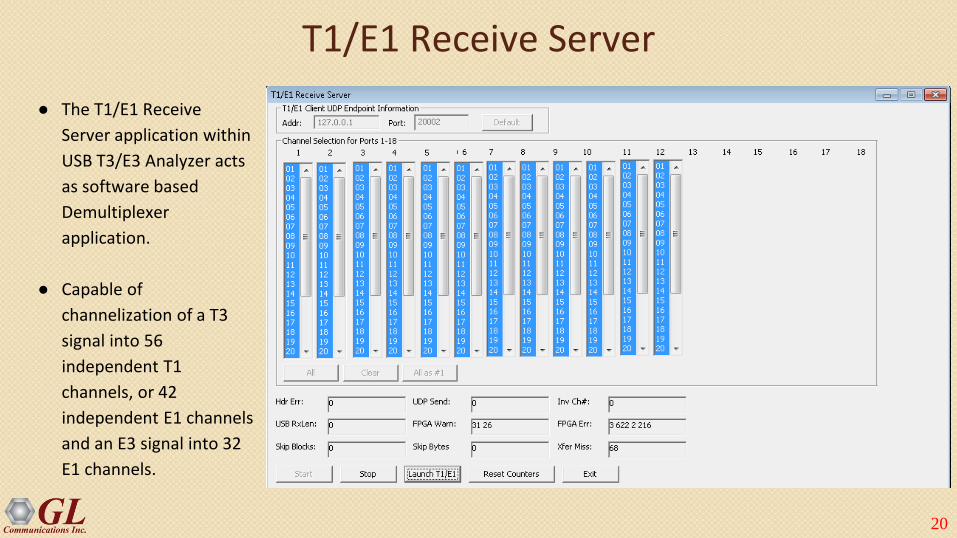
T1/E1 Receive Server
● The T1/E1 Receive
Server application within
USB T3/E3 Analyzer acts
as software based
Demultiplexer
application.
● Capable of
channelization of a T3
signal into 56
independent T1
channels, or 42
independent E1 channels
and an E3 signal into 32
E1 channels.

21
Proper Soft T1 E1 App Operation
The Soft T1 E1 App monitors in real-time all the T1s within the T3s. In the case of 6 full duplex T3s (same
as 12 Rx DS3s) one should see a GUI as shown above - for 1:1, 1:2, 2:3, 2:4, … 168:335, 168:336.
22
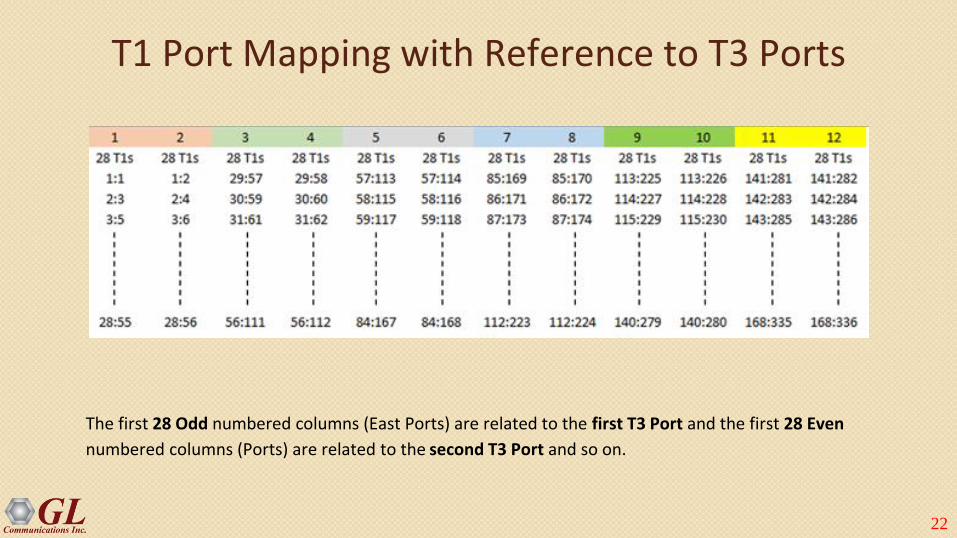
T1 Port Mapping with Reference to T3 Ports
The first 28 Odd numbered columns (East Ports) are related to the first T3 Port and the first 28 Even
numbered columns (Ports) are related to the second T3 Port and so on.
23
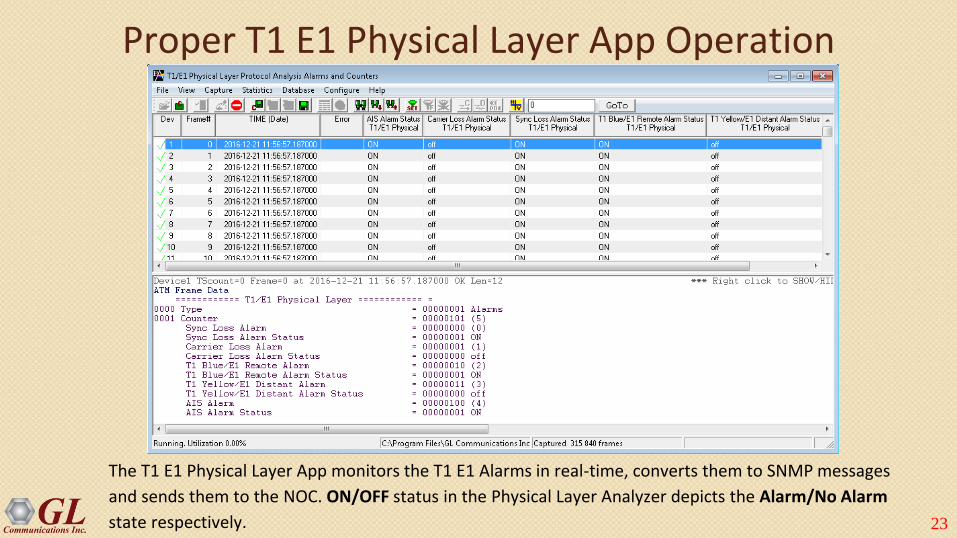
Proper T1 E1 Physical Layer App Operation
The T1 E1 Physical Layer App monitors the T1 E1 Alarms in real-time, converts them to SNMP messages
and sends them to the NOC. ON/OFF status in the Physical Layer Analyzer depicts the Alarm/No Alarm
state respectively.

24
Proper AlwaysUp App Operation
AlwaysUp is configured to run USB T3 Analyzer and Channelized T1 Analyzer for 24*7, even on automatic
restart of PC on temporary power failure, application failure, temporary PC failure, etc.
25
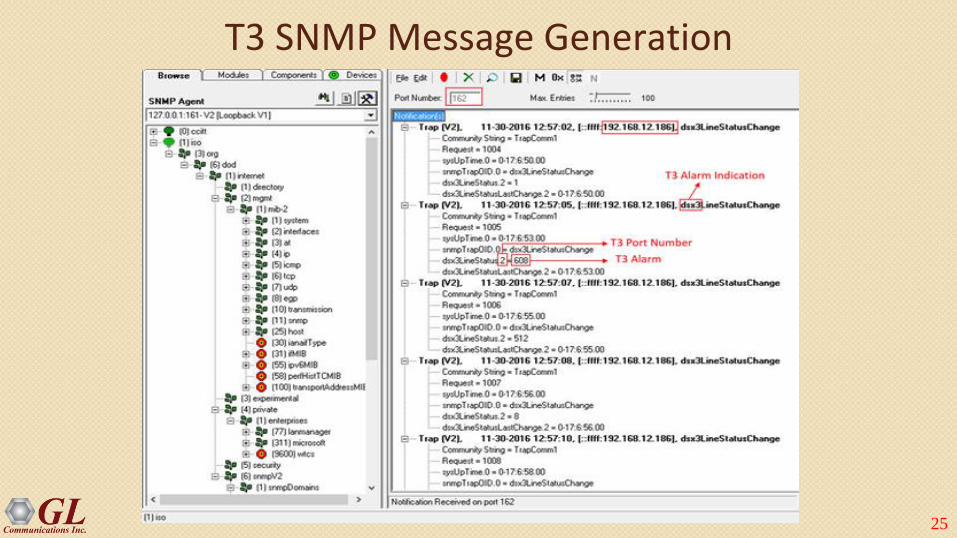
T3 SNMP Message Generation
26
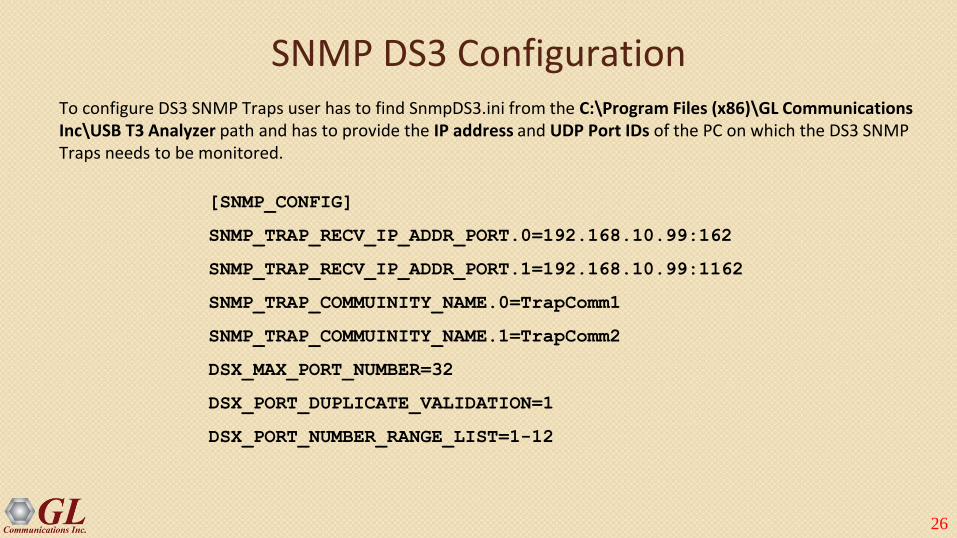
SNMP DS3 Configuration
[SNMP_CONFIG]
SNMP_TRAP_RECV_IP_ADDR_PORT.0=192.168.10.99:162
SNMP_TRAP_RECV_IP_ADDR_PORT.1=192.168.10.99:1162
SNMP_TRAP_COMMUINITY_NAME.0=TrapComm1
SNMP_TRAP_COMMUINITY_NAME.1=TrapComm2
DSX_MAX_PORT_NUMBER=32
DSX_PORT_DUPLICATE_VALIDATION=1
DSX_PORT_NUMBER_RANGE_LIST=1-12
To configure DS3 SNMP Traps user has to find SnmpDS3.ini from the C:\Program Files (x86)\GL Communications Inc\USB T3 Analyzer path and has to provide the IP address and UDP Port IDs of the PC on which the DS3 SNMP Traps needs to be monitored.

27
T1 SNMP Message Generation
28
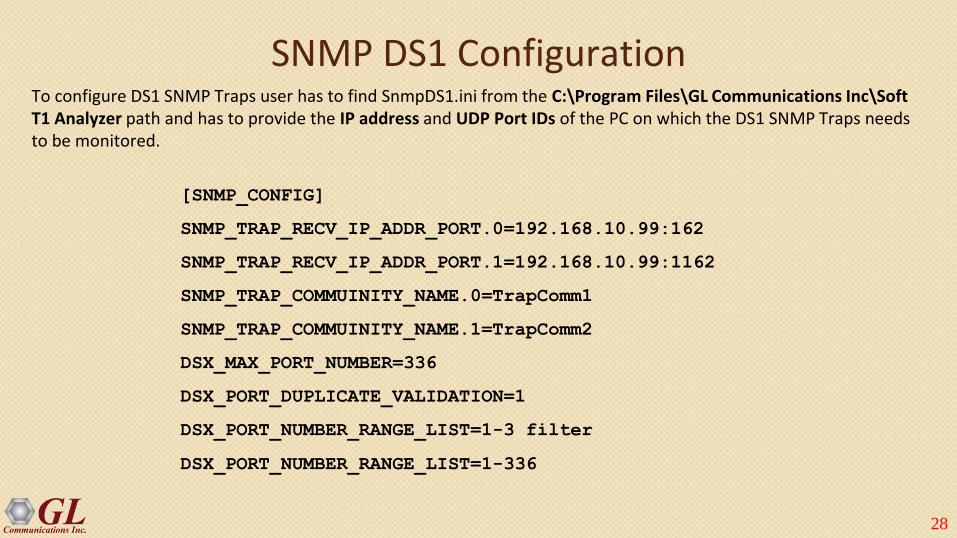
SNMP DS1 Configuration
[SNMP_CONFIG]
SNMP_TRAP_RECV_IP_ADDR_PORT.0=192.168.10.99:162
SNMP_TRAP_RECV_IP_ADDR_PORT.1=192.168.10.99:1162
SNMP_TRAP_COMMUINITY_NAME.0=TrapComm1
SNMP_TRAP_COMMUINITY_NAME.1=TrapComm2
DSX_MAX_PORT_NUMBER=336
DSX_PORT_DUPLICATE_VALIDATION=1
DSX_PORT_NUMBER_RANGE_LIST=1-3 filter
DSX_PORT_NUMBER_RANGE_LIST=1-336
To configure DS1 SNMP Traps user has to find SnmpDS1.ini from the C:\Program Files\GL Communications Inc\Soft T1 Analyzer path and has to provide the IP address and UDP Port IDs of the PC on which the DS1 SNMP Traps needs to be monitored.

29
Observing Data of T1 timeslots at DS0 Level in Channelized T1 Analyzer
● The data and signaling on DS0s of T1s
extracted from the de-multiplexed T3 link can
be monitored using various applications
included under the Monitor menu.
● Any one of the channelized T1 ports - from
Port #1 to Port #336 can be selected per
window. Open multiple instances of these
windows to monitor more than one port
simultaneously.
30
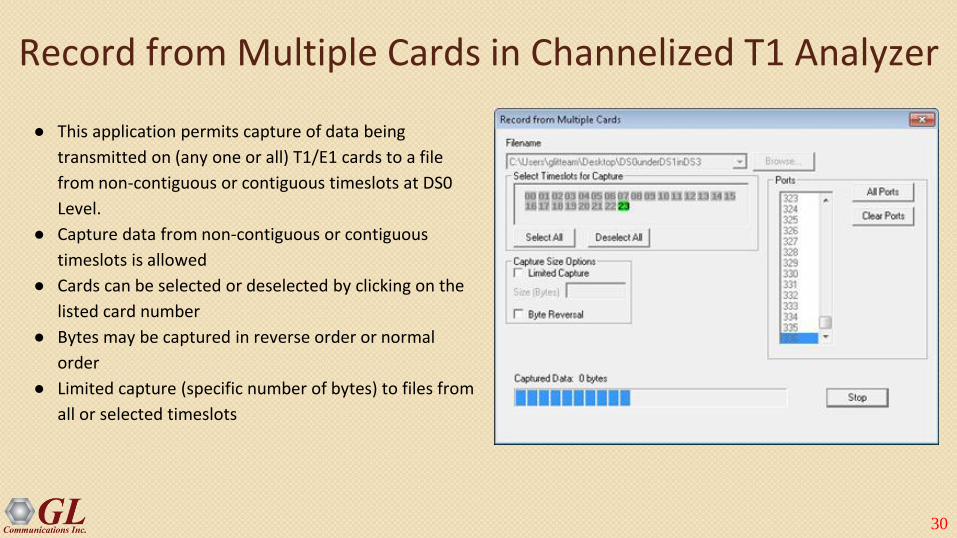
Record from Multiple Cards in Channelized T1 Analyzer
● This application permits capture of data being
transmitted on (any one or all) T1/E1 cards to a file
from non-contiguous or contiguous timeslots at DS0
Level.
● Capture data from non-contiguous or contiguous
timeslots is allowed
● Cards can be selected or deselected by clicking on the
listed card number
● Bytes may be captured in reverse order or normal
order
● Limited capture (specific number of bytes) to files from
all or selected timeslots

31
Audio Bridge Monitor in Channelized T1 Analyzer
The audio signals from selected T1 E1 channels can be dropped on the Left and Right channels of the PC sound card.

32
Thank you!