Biological Control of OliveGreen Mold in Agaricus bisporus Cultivation

Corresponding author: Phone: +381214853702 Fax: +381216350262
E-mail address: [email protected]
MODELING OF MUSHROOMS (AGARICUS BISPORUS) OSMOTIC DEHYDRATION PROCESS IN SUGAR BEET MOLASSES Šuput Z. Danijela
1*, Vladimir S. Filipović
1, Biljana Lj. Lončar
1, Milica R. Nićetin
1, Violeta M. Knežević
1,
Jasmina M. Lazarević2, Dragana V. Plavšić
2
1University of Novi Sad, Faculty of Technology Novi Sad, 21000 Novi Sad, Bulevar cara Lazara 1, Serbia
2University of Novi Sad, Institute of Food Technology, 21000 Novi Sad, Bulevar cara Lazara 1, Serbia
Abstract: Mushrooms (Agaricus bisphorus) were osmotically dehydrated in sugar beet molasses
solutions at concentrations of 60%, 70% and 80%d.m., at operating temperatures of 25 °C, 35 °C
and 45 °C during 0.5h, 1h, 1.5h, 2h, 3h, and 5 hours. Moisture content, water activity (aw),
microbiological parameters (total plate counts, Enterobacteriaceae, total yeasts and moulds count)
and content of mineral elements (potassium, magnesium, iron and calcium) were determined in the
osmodehydrated mushroom samples. Response surface methodology and analysis of variance were
selected to estimate the main effects of the process variables (temperature, time, concentration) on
process performance and selected mushroom attributes (microbiological counts, chemical
composition and mineral content). Increase in the values of applied osmotic process parameters led
to the significant increase in the content of minerals (for example, an increase in K and Ca content
by 269.42% and 939.03%, respectively) and a decrease in aw values (from 0.941 to 0.811),
decrease in microbiological load and relative protein content (decrease by 33.07%), indicating a
possibility for prolonged shelf life and suitability for further processing. The osmodehydrated
mushrooms could be considered as ingredients for new functional (semi)products due to improved
nutritive profile.
Key words: mineral composition, water loss, solid gain, microbiological load, chemical
composition
INTRODUCTION
Osmotic dehydration involves the immersion
of a substrate (food) in a solution of high con-
centration, which partially dehydrates the food
(Mújica-Paz, Valdez-Fragoso, Lopez-Malo,
Palou & Welti-Chanes, 2003; Erle & Schubert,
2001). The driving force for water removal is
the concentration gradient that is established
on the opposite sides of the cell membrane.
This gradient causes two counter currents: dis-
solved substances of osmotic solution diffuse
into the material being treated whilst water
from the material flows into osmotic solution
(Qiu, Zhang, Tang, Adhikari & Cao, 2019;
Ciurzyńska, Kowalska, Czajkowska & Lenart,
2016; Ahmed, Qazi & Jamal, 2016). Water is
removed by capillary forces and diffusion,
UDK 543.068+582.28:582.662
Original research paper DOI: 10.5937/ffr47-28436
Danijela Z. Šuput et al., Modeling of mushrooms (Agaricus bisporus) osmotic dehydration process in sugar beet molasses,
Food and Feed Research, 47 (2), 175-187, 2020
while counter current leaching and solute up-
take are transmitted by diffusion (Shi & Xue,
2009; Rahman & Perera, 2007). Both flows
depend on the cellular structure and membrane
permeability (Fernandes, Gallão & Rodrigues,
2009; Amami et al. 2007).
Products with reduced water content are ob-
tained by osmotic dehydration. They are clas-
sified as partially preserved (minimally pro-
cessed) products of high quality with pro-
longed shelf life (Silva, Fernandes & Mauro,
2014). Intermediate moisture foods (IMF) are
gaining in importance in widespread use be-
cause their characteristics are similar to fresh
food products but shelf life is extended (Qiu,
Zhang, Tang, Adhikari & Cao, 2019). If a
fresh appearance of a dehydrated product is re-
quired, the effect of dehydration must be at
least 30%, which makes such products mode-
rately stable and could be further processed
(dried, frozen or treated with additives) (Khan,
2012; Phisut, 2012) in the dairy, bakery or
confectionery industries.
Choice regarding proper osmotic solution is
important factor for successful dehydration,
and this decision is mainly influenced by the
water loss/solid gain ratio. In the case of os-
motic solution with lower concentration - the
components penetrate in deeper layers of the
treated material (Rodrigues & Mauro, 2004),
while higher osmotic solution concentrations
lead to faster water loss (Waliszewski, Del-
gado & Garcia, 2002). The osmotic solution
must have a low value of water activity (aw),
an acceptable sensory quality and must
achieve food safety requirements. Potential so-
lutions are sucrose, glucose, NaCl, corn sy-
rup, starch concentrates, etc., which are selec-
ted according to the dehydrated product pro-
perties (Ahmed, Qazi & Jamal, 2016).
Alternative osmotic solutions, such as maple
syrup, high fructose corn syrup, honey, etha-
nol, etc., have been attracting more attention
due to high dehydration rates, optimal rehy-
dration capacity, and negligible sensory effect
on the substrate (Qiu, Zhang, Tang, Adhikari
& Cao, 2019).
During osmotic dehydration, simultaneously
with the diffusion of water from the tissue into
the surrounding solution there is an antidote
diffusion of dissolved substances from the
osmotic solution into the surface layers of the
treated material (Rastogi & Raghavarao, 2004;
Chiralt & Fito, 2003). Sugar beet molasses has
been recognized as suitable osmotic solution
due to its exceptional and complex chemical
and nutritional composition. Molasses is an
important by-product of sugar beet/sugar cane
refining industry, remaining after no more
sugar can be extracted by crystallization from
the raw crop (Šarić et al., 2016). Cane and beet
molasses are viscous polycomponent systems
with a high dry matter content (around 80%)
and are significant source of many micro-
nutrients (in the dissolved state), especially
potassium, calcium, iron, magnesium and the
vitamin B complex (Sauvant, Perez & Tran,
2004). From a nutritional point of view, sugar
beet molasses significantly enriches the con-
tent that is dehydrated in terms of minerals and
vitamins (Cvetković et al., 2019; Lončar et al.,
2015; Nićetin et al., 2015a; Nićetin et al.,
2015b). Some investigations were conducted
using sugar beet molasses as osmotic solution
for dehydration of plant origin food (Knežević
et al., 2019; Nićetin et al., 2017; Koprivica,
Pezo, Ćurčić, Lević & Šuput, 2014; Mišlje-
nović, Koprivica, Jevrić & Lević, 2011) and
animal origin food (Šuput et al., 2019; Ćurčić,
Pezo, Filipović, Nićetin & Knežević, 2015;
Filipović et al., 2014).
In previous works, mushrooms were osmoti-
cally pretreated/treated with different solu-
tions: sucrose, citric acid, but mostly NaCl so-
lution (González-Pérez et al., 2019; Darvishi,
Azadbakht & Noralahi, 2018; Gupta, Bhat,
Chauhan, Ahmed & Malik, 2015; Doymaz,
2014), at different process parameters (con-
centration, time, etc.). The aim of the study
presented in this paper was to investigate and
mathematically model the effects of varying
processing parameters applied during the os-
motic dehydration of mushrooms in sugar beet
molasses on basic osmodehydration responses
(water loss, solid gain, dry matter content),
microbiological parameters, mineral and che-
mical composition of treated mushrooms.
MATERIALS AND METHODS
Sample preparation
Fresh mushrooms (Agaricus bisporus) were
bought at a local greengrocery, after which
their basic composition was determined, given
in Supplementary material, Tables S1 and S2.
Mushrooms were wiped with a damp cloth, cut
into 5 mm-slices, after which they were im-
mersed in sugar beet molasses diluted to the
concentrations of 60%, 70% and 80% of dry

Danijela Z. Šuput et al., Modeling of mushrooms (Agaricus bisporus) osmotic dehydration process in sugar beet molasses,
Food and Feed Research, 47 (2), 175-187, 2020
matter (d.m.). Basic composition of used sugar
beet molasses is given in Table 1. The sample
(mushroom slices) to osmotic solution (mo-
lasses) weight ratio was 1:5. The process was
performed in laboratory jars at temperatures of
25, 35 and 45 °C under atmospheric pressure,
in a constant temperature chamber (KMF 115
l, Binder, Germany). The samples were stirred
every 15 minutes.
Processing conditions regarding stirring, in-
tensity, duration and frequency were the same
for all experimental runs, so the results could
be comparable. Process duration was varied
between process times of 0.5, 1, 1.5, 2, 3, and
5 hours. After dehydration treatment, the sam-
ples were rapidly rinsed with running water,
absorbed from excess water and further pro-
cessed for the required tests.
Table 1.
Sugar beet molasses basic composition
Composition Content
(%d.m.)
Proteins 24.43
Carbohydrates 26.22
Ash 9.17
(mg/kg)
K 14 640
Ca 2 050
Mg 2420
Fe 47.2
Moisture content was determined at 105 ºC
until constant weight was achieved (according
to AOAC, 2000).
Water activity values (aw) were determined
on a TESTO 650 water activity tester (Testo,
Inc., 40 White Lake Rd, Sparta, NJ, USA)
with a special probe with an accuracy of ±
0.001 at 25 ºC.
Microbiological counts
Determination of total plate counts (TPC) was
performed according to ISO 4833:2013.
The determination of Enterobacteriaceae was
determined according to ISO 21528-2:2017.
The determination of the total yeasts and
moulds count (TYMC) was made according to
the ISO 21527-2: 2008.
Content of mineral elements
Content of potassium (K), magnesium (Mg),
iron (Fe) and calcium (Ca) was performed ac-
cording to ISO 6869:2000.
Calculations
Osmotic dehydration process responses of dry
matter content (DMC), water loss (WL) and
solid gain (SG) were calculated and presented
as mean values and standard deviation of three
parallel runs:
(1)
(2)
(3)
where md, mi and mf are dry matter, initial and
final samples mass (g), respectively; zi and zf
are the initial and final water fraction mass
(gwater/ gsample), respectively; si and sf are the
initial and final total solids fraction mass (gtotal
solids/ gsample), respectively.
Response Surface Methodology
Response Surface Methodology (RSM) and
Analysis of Variance (ANOVA) were selected
to estimate the main effects of the process va-
riables on osmodehydration process, micro-
biological, and compositional responses during
osmotic dehydration of mushroom samples.
The independent variables were process time
(X1), process temperature (X2) and concen-
tration of molasses as an osmotic solution
(X3). The dependent variables observed were
osmotic dehydration responses: DMC (Y1),
WL (Y2), SG (Y3), aw (Y4); microbiological
responses: TPC (Y5), TYMC (Y6); mineral
responses: K (Y7), Mg (Y8), Ca (Y9), Fe (Y10)
and chemical responses: Proteins (Y11), Sugars
(Y12) and Ash (Y13).
Models were fitted to the response surface ge-
nerated by the experiment. The model used
was function of the variables:
Yk= fk(time, temperature, concentration) (4)
The following second order polynomial (SOP)
model was fitted to the data. Thirteen models
of the following form were developed to relate
thirteen responses (Y) to three process va-
riables (X):
Danijela Z. Šuput et al., Modeling of mushrooms (Agaricus bisporus) osmotic dehydration process in sugar beet molasses,
Food and Feed Research, 47 (2), 175-187, 2020
k=1-13; (5)
where βkij are constant regression coefficients.
ANOVA and RSM were performed using
StatSoft Statistica, for Windows, ver. 12 pro-
gram. The model was obtained for each de-
pendent variable (or response) where factors
were rejected when their significance level
was less than 95%.
RESULTS AND DISCUSSION
Analysis of the osmotic dehydration process
responses
The untreated, raw mushrooms were charac-
terized by DMC and aw values of 8.51±0.31%
and 0.941±0.04, respectively. Supplementary
material, Table S1 displays the results ob-
tained for the four osmotic dehydration pro-
cess responses (DMC, WL, SG, aw) that ade-
quately represent the osmotic process. The
maximal obtained values were: 58.33±1.11%,
0.7953±0.0158 g/gi.s., 0.1009±0.0016 g/gi.s. and
0.811± 0.008 for DMC, WL, SG and aw, res-
pectively. The osmodehydrated mushroom
sample with the highest levels of DMC, WL
and SG, and lowest level of aw, indicating the
most intensive mass transfer during the pro-
cess, was obtained at the highest levels of ap-
plied technological parameters (process time
of 5 hours, process temperature of 45 °C and
molasses concentration of 80%).
By analysing the statistically significant differ-
rence between the values of different process
time and constant process temperature and
molasses concentration, it can be concluded
that the effect of the process time had sta-
tistically significant influence on all four os-
motic dehydration process parameters (for
example, comparing significance level of runs
no. from 49 to 54, at p<0.05, see in Supple-
mentary material, Table S1). This result har-
monises with the findings from other similar
studies which reported that the increase in
immersion time led to higher moisture loss
(Ispir & Toğrul, 2009; Mundada, Hathan &
Maske, 2011). Figure 1 shows changes in
DMC, WL, SG and aw during 5-h osmotic de-
hydration.
During osmodehydration, substrate is in con-
tact with osmotic medium, which has high os-
motic pressure and mass transfer is established
with respect to time. As time is longer – osmo-
dehydration effect is higher with respect to the
evaluated process parameters (DMC, WL,
SG). It was noted that the initial process period
is the most important, since mass transfer phe-
nomena are the fastest and have highest impact
on further osmodehydration flow. Studies sho-
wed that exchange of masses occurred at a
fastest rate within the initial 2 h followed by a
reduction in drying rate during further pro-
cessing time (Ramaswamy, 2005).
From the result presented in Supplementary
material, Table S1 it can be seen that the tem-
perature statistically significantly affected
mass transfer in the process, manifested via
statistically significant increase in DMC, WL
and SG values and statistically significant
decrease of aw values. Findings related to the
osmodehydration of mushrooms in molasses
are similar to those from other works which
reported that temperature affects the rate of
osmotic mass transfer (Tortoe, 2010) and that
rise in process temperature accelerates water
loss, while solid uptake is less affected (Khan,
2012; Tortoe, 2010). As in cases of the two
previously analysed technology parameters,
the effect of molasses concentration was also
statistically significant on all four osmotic
dehydration process responses, where the
increase in the concentration of molasses
solution significantly raised the values of the
three responses (DMC, WL and SG), while aw
significantly decreased. Other studies reported
similar findings (Ispir & Toğrul, 2009; Falade,
Igbeka & Ayanwuyi, 2007). The higher
concentration of osmotic solution leads to
greater osmotic pressure gradients, thereby
leading to higher solid gain and water loss
throughout the osmotic treatment period
(Mundada, Hathan & Maske, 2011).
Effect on microbiological characteristics of
the treated mushrooms
The fresh mushroom samples were character-
rized by log10 (CFU/g) values of:
5.54±1.33x10⁻²
; 3.36±1.67x10⁻²
and 4.64±1.11
x10-2
for TPC, TYMC and Enterobacte-
riaceae, respectively, (Supplementary ma-
terial, Table S2). The highest reduction of pre-
sent microorganisms and the lowest values of
TPC and TYMC (log10 (CFU/g) of
4.25±1.43x10⁻²
and 2.99±8.82x10⁻²
, respect-
tively) are obtained at the highest levels of

Danijela Z. Šuput et al., Modeling of mushrooms (Agaricus bisporus) osmotic dehydration process in sugar beet molasses,
Food and Feed Research, 47 (2), 175-187, 2020
Figure 1. Dry matter content (DMC), water loss (WL), solid gain (SG) and aw changes in mushrooms during
osmotic dehydration in sugar beet molasses
Figure 2. Changes in total plate counts (TPC) and total yeasts and moulds count (TYMC ) of mushrooms during
osmotic dehydration in sugar beet molasses

Danijela Z. Šuput et al., Modeling of mushrooms (Agaricus bisporus) osmotic dehydration process in sugar beet molasses,
Food and Feed Research, 47 (2), 175-187, 2020
applied technological parameters. Values of
Enterobacteriaceae were reduced to <1.00
log10 (CFU/g) in all osmodehydrated samples,
regardless of applied technological parameters.
The effect of the process duration had
statistically significant influence on the TPC
and TYMC log10 (CFU/g) values, where
prolonged duration of the osmotic dehydration
process led to higher reduction of present
microorganisms. An increase in process tem-
perature significantly decreased TPC and
TYMC. The effect of molasses concentration
exerted also significant effect on both TPC and
TYMC in such a way that an increase in the
molasses concentration caused a significant
decrease in TPC and TYMC. Prolonged du-
ration of osmotic dehydration has led to the
longer exposure of selected microorganisms to
high osmotic pressure environment of osmotic
solutions. Higher values of temperature and
molasses concentration has led to the inten-
sified mass transfer of the process, and re-
duced aw value. As a consequence, the treated
samples provided unfavourable conditions for
the growth and development of the tested
microorganisms. Studies on the effect of
osmotic dehydration parameters on pork and
chicken meat microbiological profiles showed
similar results (Filipović et al. 2019; Filipović
et al., 2012).
Regarding microbiological safety, the osmode-
hydrated mushrooms are not ready-to-eat
products so they are not covered by the or-
dinance of Comission Regulation (EC)
2073/2005. According to the other legal acts,
such as the national regulation on sanitary
requirements during food processing and
trading (Pravilnik o opštim i posebnim us-
lovima higijene hrane u bilo kojoj fazi proiz-
vodnje, prerade i prometa (2010)) it could be
concluded that the detection of low number of
Enterobacteriaceae in the mushrooms dehy-
drated in molasses indicates satisfactory hy-
giene of the production process.
Effect on the chemical composition and
mineral content in the treated mushrooms
The fresh mushroom samples contained
3312.53±79.64; 185.36±5.76; 90.43±5.46;
23.53±0.22 and mg/kgd.m. K, Ca, Mg, and Fe,
respectively and 24.43±0.57; 26.22±0.35 and
9.17±0.18 %d.m. proteins, sugars and ash,
respectively (Supplementary material, Tables
S3 and S4).
Osmotic dehydration process, through in-
creasing solid matter of dehydrating samples
(Rastogi & Raghavarao, 2004; Chiralt & Fito,
2003), statistically significantly affected the
amounts of all tested minerals and chemical
parameters. There was a statistically signi-
ficant increase in K, Ca, Mg, Fe, sugars and
ash contents as well as a significant decrease
in protein content (comparing the significance
level of run no. 0 with any other dehydrated
sample, except the samples dehydrated during
0.5h, at p<0.05, Suplementary material, Tables
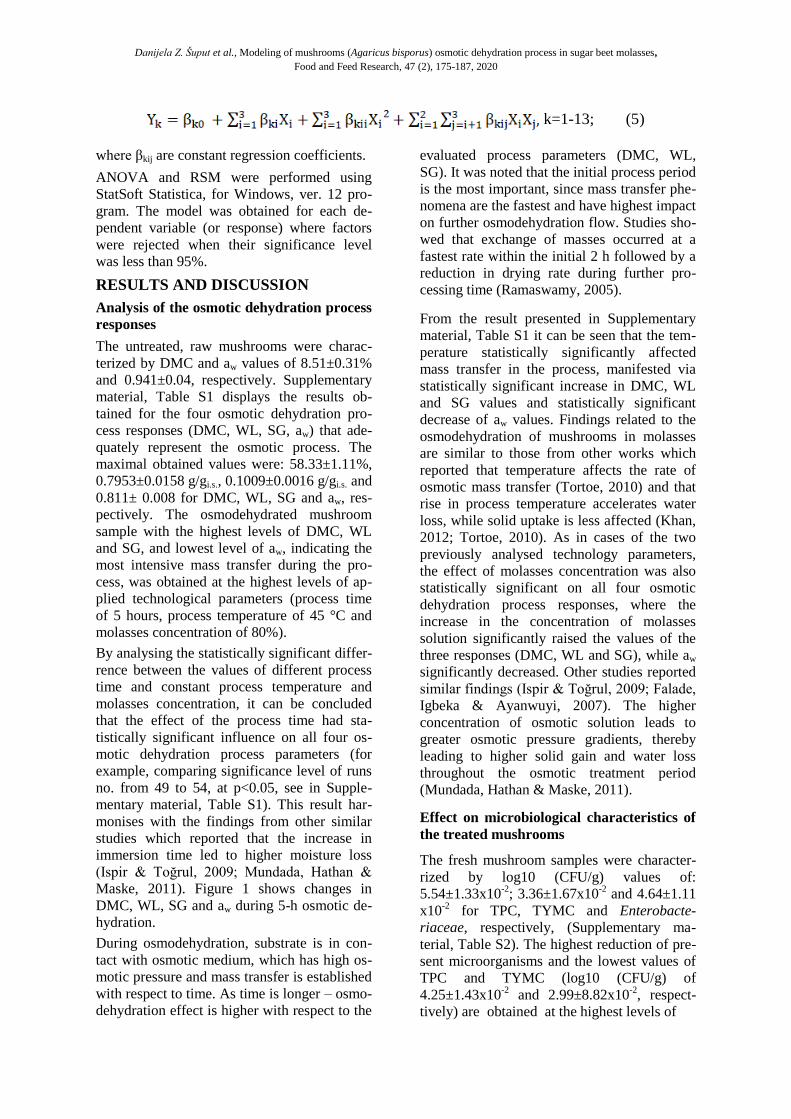
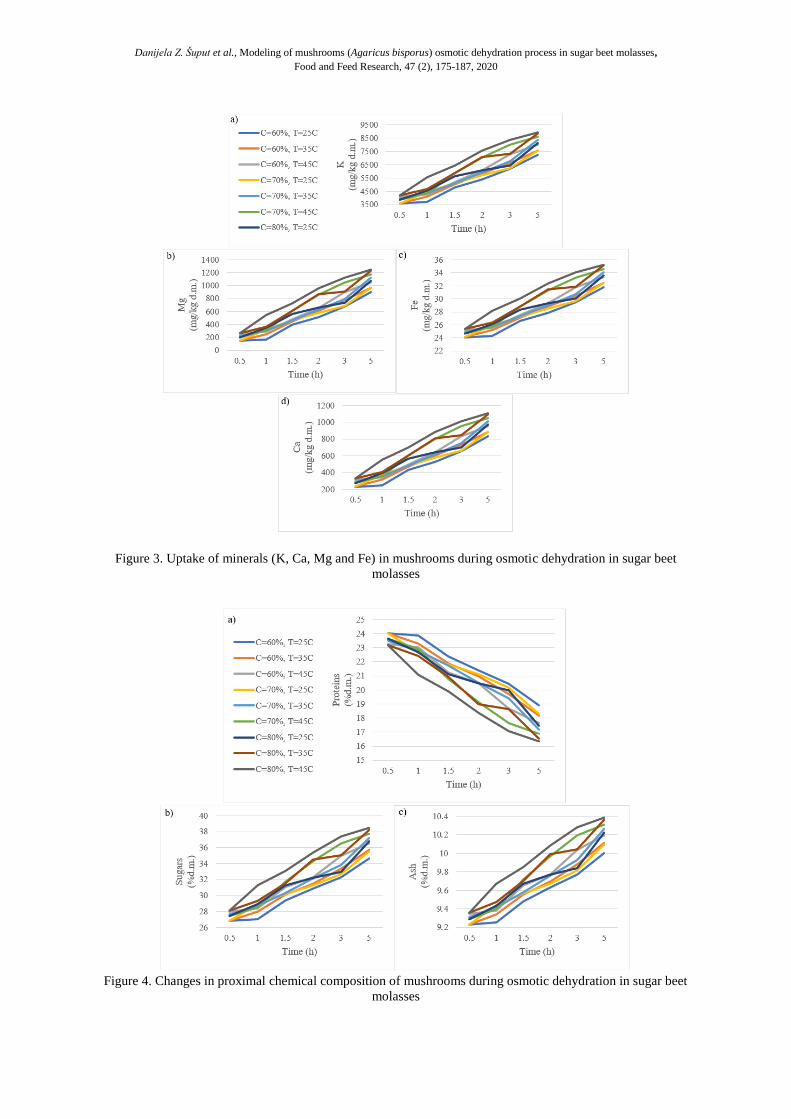
S3 and S4). Figures 3 and 4 depicts the chan-
ges in the content of minerals and proximal
chemical composition of treated mushrooms
during the osmotic dehydration in molasses.
Increase in the content of minerals is a direct
consequence of solid matter uptake from
molasses which is abundant in these com-
ponents. A decrease in the osmodehydrated
mushrooms protein content is a result of non-
protein solid matter uptake (molasses is not a
protein source), resulting in a relative decrease
of dry matter protein content, although
absolute quantities of mushrooms protein
contents did not change during the osmotic
dehydration process.
The concentrations of minerals and chemical
parameters in the mushrooms treated at the
applied highest levels of processing para-
meters (5-hour process duration, at 45 °C, in
80% molasses) were the following:
8917.78±152.90, 1241.23±4.06, 1105.08±
13.182 and 35.02±0.73 mg/kg for K, Mg, Ca
and Fe, respectively, and 16.35±0.19,
38.49±0.34 and 10.39±0.18 % for protein, su-
gar and ash contents, respectively.
The effects of individual process parameters
on mineral and chemical responses are the
same as in the case of basic osmotic de-
hydration process parameters, since process
mass transfer mechanisms are leading to
compositional changes of the dehydrating
samples. Individual increase of process time,
temperature and molasses concentration has
led to the statistically significant increase of
minerals, sugars and ash, and a significant
decrease of protein content. These results are
in correlation with previously reported results
on mineral and chemical composition of
osmodehydrated fish (Lončar et al., 2015),
pork meat (Nićetin et al., 2015b) and wild
garlic (Šobot et al., 2019).
Danijela Z. Šuput et al., Modeling of mushrooms (Agaricus bisporus) osmotic dehydration process in sugar beet molasses,
Food and Feed Research, 47 (2), 175-187, 2020
Figure 3. Uptake of minerals (K, Ca, Mg and Fe) in mushrooms during osmotic dehydration in sugar beet
molasses
Figure 4. Changes in proximal chemical composition of mushrooms during osmotic dehydration in sugar beet
molasses
Danijela Z. Šuput et al., Modeling of mushrooms (Agaricus bisporus) osmotic dehydration process in sugar beet molasses,
Food and Feed Research, 47 (2), 175-187, 2020
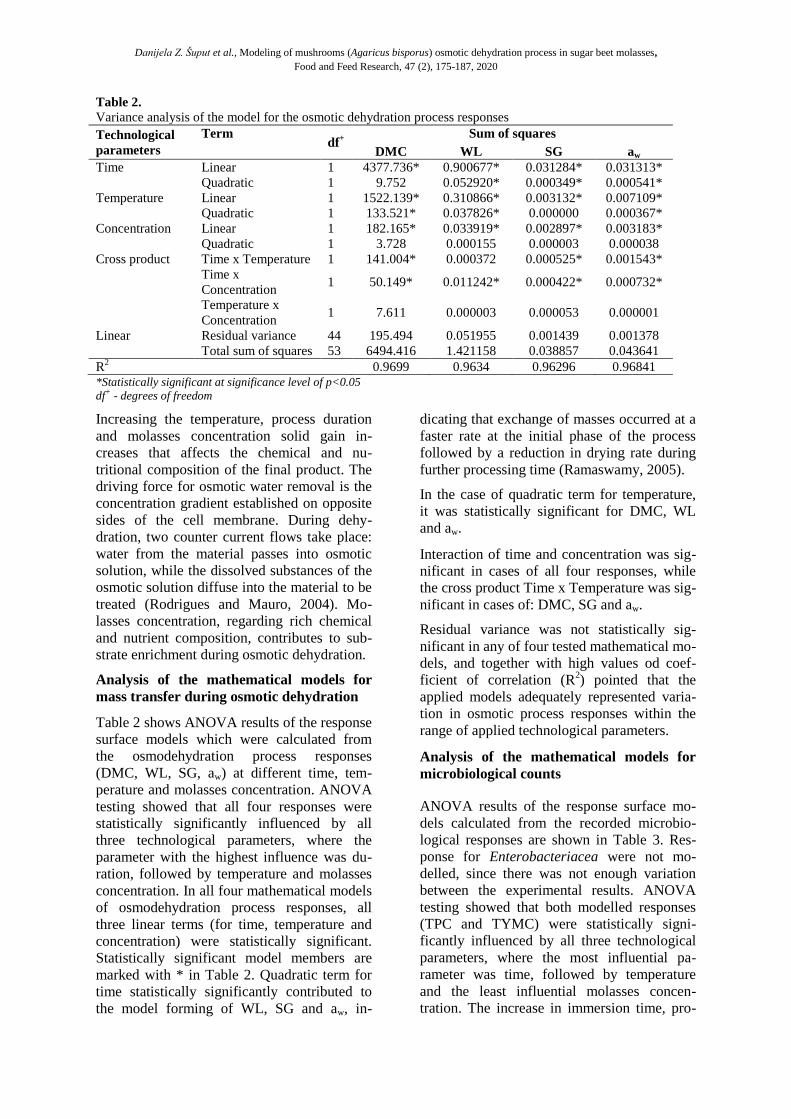
Table 2.
Variance analysis of the model for the osmotic dehydration process responses
Technological
parameters
Term df
+
Sum of squares
DMC WL SG aw
Time
Linear 1 4377.736* 0.900677* 0.031284* 0.031313*
Quadratic 1 9.752 0.052920* 0.000349* 0.000541*
Temperature Linear 1 1522.139* 0.310866* 0.003132* 0.007109*
Quadratic 1 133.521* 0.037826* 0.000000 0.000367*
Concentration Linear 1 182.165* 0.033919* 0.002897* 0.003183*
Quadratic 1 3.728 0.000155 0.000003 0.000038
Cross product
Time x Temperature 1 141.004* 0.000372 0.000525* 0.001543*
Time x
Concentration 1 50.149* 0.011242* 0.000422* 0.000732*
Temperature x
Concentration 1 7.611 0.000003 0.000053 0.000001
Linear Residual variance 44 195.494 0.051955 0.001439 0.001378
Total sum of squares 53 6494.416 1.421158 0.038857 0.043641
R2 0.9699 0.9634 0.96296 0.96841
*Statistically significant at significance level of p<0.05
df+ - degrees of freedom
Increasing the temperature, process duration
and molasses concentration solid gain in-
creases that affects the chemical and nu-
tritional composition of the final product. The
driving force for osmotic water removal is the
concentration gradient established on opposite
sides of the cell membrane. During dehy-
dration, two counter current flows take place:
water from the material passes into osmotic
solution, while the dissolved substances of the
osmotic solution diffuse into the material to be
treated (Rodrigues and Mauro, 2004). Mo-
lasses concentration, regarding rich chemical
and nutrient composition, contributes to sub-
strate enrichment during osmotic dehydration.
Analysis of the mathematical models for
mass transfer during osmotic dehydration
Table 2 shows ANOVA results of the response
surface models which were calculated from
the osmodehydration process responses
(DMC, WL, SG, aw) at different time, tem-
perature and molasses concentration. ANOVA
testing showed that all four responses were
statistically significantly influenced by all
three technological parameters, where the
parameter with the highest influence was du-
ration, followed by temperature and molasses
concentration. In all four mathematical models
of osmodehydration process responses, all
three linear terms (for time, temperature and
concentration) were statistically significant.
Statistically significant model members are
marked with * in Table 2. Quadratic term for
time statistically significantly contributed to
the model forming of WL, SG and aw, in-
dicating that exchange of masses occurred at a
faster rate at the initial phase of the process
followed by a reduction in drying rate during
further processing time (Ramaswamy, 2005).
In the case of quadratic term for temperature,
it was statistically significant for DMC, WL
and aw.
Interaction of time and concentration was sig-
nificant in cases of all four responses, while
the cross product Time x Temperature was sig-
nificant in cases of: DMC, SG and aw.
Residual variance was not statistically sig-
nificant in any of four tested mathematical mo-
dels, and together with high values od coef-
ficient of correlation (R2) pointed that the
applied models adequately represented varia-
tion in osmotic process responses within the
range of applied technological parameters.
Analysis of the mathematical models for
microbiological counts
ANOVA results of the response surface mo-
dels calculated from the recorded microbio-
logical responses are shown in Table 3. Res-
ponse for Enterobacteriacea were not mo-
delled, since there was not enough variation
between the experimental results. ANOVA
testing showed that both modelled responses
(TPC and TYMC) were statistically signi-
ficantly influenced by all three technological
parameters, where the most influential pa-
rameter was time, followed by temperature
and the least influential molasses concen-
tration. The increase in immersion time, pro-

Danijela Z. Šuput et al., Modeling of mushrooms (Agaricus bisporus) osmotic dehydration process in sugar beet molasses,
Food and Feed Research, 47 (2), 175-187, 2020
cess temperature and osmotic solution concen-
tration lead to higher and accelerated moisture
loss until equilibrium level is achieved (Mun-
dada et al., 2011; Khan, 2012; Tortoe, 2010).
Table 3.
Variance analysis of the model for changes in the microbiological responses
Technological
parameters
Term df
+
Sum of squares
TPC TYMC
Time
Linear 1 4.759147* 6.781457*
Quadratic 1 0.584806* 0.008988
Temperature Linear 1 0.401177* 0.193637*
Quadratic 1 0.022711* 0.000083
Concentration Linear 1 0.043333* 0.313438*
Quadratic 1 0.000002 0.000052
Cross product
Time x Temperature 1 0.001275 0.033880*
Time x Concentration 1 0.000005 0.154575*
Temperature x Concentration 1 0.001295 0.004181
Linear Residual variance 44 0.145756 0.162417
Total sum of squares 53 5.800317 7.504803
R2 0.97487 0.97836
*Statistically significant at significance level of p<0.05
df+- degrees of freedom
Table 4. Variance analysis of the model for mineral composition
Technological
parameters
Term df
+
Sum of squares
K Mg Fe Ca
Time
Linear 1 109780640* 4632787* 484.3570* 2979382*
Quadratic 1 7593746* 321768* 34.2301* 206338*
Temperature Linear 1 6848700* 286218* 32,9853* 185128*
Quadratic 1 17144 721 0.0204 560
Concentration Linear 1 6039284* 253727* 32.4158* 162932*
Quadratic 1 59476 2821 0.1135 1666
Cross product
Time · Temperature 1 412475* 17289* 2.1359* 11239*
Time ·
Concentration 1 127673 5334 0.6506 3329
Temperature ·
Concentration 1 218477 9267 0.4653 5733
Linear Residual variance 44 3998398 166226 19.6996 109882
Total sum of squares 53 131522730 5545108 591.0625 3569327
R2 0.9696 0.97002 0.9666 0.96221
*Statistically significant at significance level of p<0.05
df+- degrees of freedom
Table 5. Variance analysis of the model for chemical composition responses
Technological
parameters
Term df
+
Sum of squares
Proteins Sugars Ash
Time
Linear 1 225.6559* 520.8845* 5.133447*
Quadratic 1 15.8561* 36.6009* 0.360711*
Temperature Linear 1 15.4544* 35.736* 0.351572
Quadratic 1 0.0351 0.0810 0.000798
Concentration Linear 1 12.3922* 28.6051* 0.281910*
Quadratic 1 0.0823 0.1899 0.001872
Cross product
Time x Temperature 1 0.8952* 2.0664* 0.020364*
Time x Concentration 1 0.3051 0.7043 0.006941
Temperature x Concentration 1 0.2938 0.6782 0.006684
Linear Residual variance 44 8.0342 18.5454 0.182770
Total sum of squares 53 271.4764 626.6526 6.175817
R2 0.97041 0.9643 0.9743
*Statistically significant at significance level of p<0.05
df+- degrees of freedom

Danijela Z. Šuput et al., Modeling of mushrooms (Agaricus bisporus) osmotic dehydration process in sugar beet molasses,
Food and Feed Research, 47 (2), 175-187, 2020
All three linear terms (for time, temperature
and concentration) were statistically signi-
ficant in cases of both microbiological res-
ponses. Quadratic terms of time and tem-
perature statistically significantly contributed
to the TPC model forming. Cross products
Time x Temperature and Time x Concen-
tration were significant in the case of TYMC.
Residual variance was not statistically sig-
nificant in both tested mathematical models,
and together with high R2 values showed that
applied models adequately represented va-
riations of microbiological profile responses.
Analysis of the mathematical models for
responses related to mineral and chemical
composition
Significant mineral enrichment and chemical
composition change in the treated mushrooms
is a consequence of previously explained me-
chanisms of solid gain upgrowth, owing to
molasses favourable nutritional composition.
Tables 4 and 5 shows the ANOVA results of
the response surface models calculated for mi-
neral and chemical composition, respect-
tively.
The presented results show that all seven
responses were influenced by all three tech-
nological parameters, in the following order of
significance: time, temperature, concentra-
tion. In cases of all responses, linear terms of
all three dehydration parameters were sta-
tistically significant. Quadratic term for time,
together with cross product of Time x
Temperature were also statistically significant
in all cases. Residual variance was not statis-
tically significant in any of the tested mathe-
matical models. High R2 values again indi-
cated on good fit of proposed models to the
minerals and chemical responses experimental
data.
Mathematical models regression coefficients
Individual coefficients, which can be used for
forming thirteen quadratic equations of models
for selected responses (mass transfer para-
meters, microbiological counts, mineral and
chemical composition), are shown in Supple-
metary material, Tables S5 and 6, along with
their statistical significance. Using presented
equations and knowing technological parame-
ters of the process (time, temperature and mo-
lasses concentration), values of all selected
responses at the determined process conditions
can be calculated. Data obtained from these
models can be used for process and quality
control and management of the osmotic de-
hydration of mushrooms in molasses.
CONCLUSIONS
From the presented results it can be concluded
that osmotic dehydration of mushrooms in
beet molasses and an increase in its intensity
led to the significant increase in mass transfer
kinetics, mineral uptake (for example, an
increase in K content by 269.42%; and Ca
content increase by 939.03%), changes in
proximate chemical composition and a de-
crease in aw values (from 0.941 to 0.811),
microbiological load and relative protein con-
tent (33.07% decrease). The obtained osmo-
dehydrated mushroom samples were charac-
terized by high levels of DMC, low aw values
and favourable microbiological profile, in-
dicating a good base for prolonged shelf life
and further processing. Improved nutritive
profile of osmodehydrated mushrooms owing
mostly to prominent mineral enrichment due
to transfer of minerals from molasses, suggest
a possibility for production of new and fun-
ctional products. The proposed mathematical
models of changes in selected responses (mass
transfer parameters, microbiological counts,
mineral and chemical composition) were sta-
tistically significant, calculated and observed
responses corresponded very well, indicating a
satisfactory approximation of responses values
within the applied technological parameters.
АCKNOWLEDGEMENTS
This paper is a result of the research within the
project TR 31055 (451-03-68/2020-14/
200134), supported by the Ministry of Edu-
cation, Science and Technology, Republic of
Serbia.
REFERENCES
Ahmed, I., Qazi, I.M., & Jamal, S. (2016). Developments
in osmotic dehydration technique for the preser-
vation of fruits and vegetables. Innovative Food
Science and Emerging Technologies, 34, 29-43.
https://doi.org/10.1016/j.ifset.2016.01.003
Amami, E., Fersi, A., Khezami, L., Vorobiev, E., & Ke-
chaou, N. (2007). Centrifugal osmotic dehydration
and rehydration of carrot tissue pre-treated by
pulsed electric field. LWT - Food Science and
Technology, 40 (7), 1156–1166.
https://doi.org/10.1016/j.lwt.2006.08.018
AOAC. (2000). Official methods of analysis. Washington
D.C., USA: Association of Official Analytical
Chemists.

Danijela Z. Šuput et al., Modeling of mushrooms (Agaricus bisporus) osmotic dehydration process in sugar beet molasses,
Food and Feed Research, 47 (2), 175-187, 2020
Chiralt, A., & Fito, P. (2003). Transport mechanisms in
osmotic dehydration: The role of the structure.
Food Science and Technology International, 9(3),
179-186.
https://doi.org/10.1177/1082013203034757
Ciurzyńska, A., Kowalska, H., Czajkowska, K., & Lenart,
A. (2016). Osmotic dehydration in production of
sustainable and healthy food. Trends in Food
Science and Technology, 50, 186–192.
https://doi.org/10.1016/j.tifs.2016.01.017
Commission Regulation (EC) 2073/2005. (2005).
Commission Regulation (EC) No 2073/2005 of 15
November 2005 on microbiological criteria for
foodstuffs. Official Journal of the EU, 338, 1-26.
Ćurčić B., Pezo L., Filipović V., Nićetin M., & Knežević
V. (2015). Osmotic treatment of fish in two
different solutions-artificial neural network model.
Journal of Food Processing and Preservation,
39(6), 671-680.
https://doi.org/10.1111/jfpp.12275.
Cvetković, B., Pezo, L., Mišan, A., Mastilović, J.,
Kevrešan, Ž., Ilić, N., & Filipčev, B. (2019). The
effects of osmotic dehydration of white cabbage on
polyphenols and mineral content. LWT - Food
Science and Technology, 110, 332-337.
https://doi.org/10.1016/j.lwt.2019.05.001.
Darvishi, H., Azadbakht, M., & Noralahi, B. (2018).
Experimental performance of mushroom fluidized-
bed drying: Effect of osmotic pretreatment and air
recirculation. Renewable Energy, 120, 201-208.
https://doi.org/10.1016/j.renene.2017.12.068.
Doymaz, I. (2014). Drying kinetics and rehydration
characteristics of convective hot-air dried white
button mushroom slices. Journal of Chemistry,
2014, Article ID 453175.
https://doi.org/10.1155/2014/453175
Erle, U., & Schubert, H. (2001). Combined osmotic and
microwave-vacuum dehydration of apples and
strawberries. Journal of Food Engineering, 49(2-
3), 193-199.
https://doi.org/:10.1016/S0260-8774(00)00207-7.
Falade, K.O., Igbeka, J.C., & Ayanwuyi, F.A. (2007).
Kinetics of mass transfer and colour changes
during osmotic dehydration of watermelon.
Journal of Food Engineering, 80(3), 979–985.
https://doi:10.1016/j.jfoodeng.2006.06.033.
Fernandes, F.A.N., Gallão, M.I., & Rodrigues, S. (2009).
Effect of osmosis and ultrasound on pineapple cell
tissue structure during dehydration. Journal of
Food Engineering, 90(2), 186–190.
https://doi.org/10.1016/j.jfoodeng.2008.06.021.
Filipović, I., Markov, S., Filipović, V., Filipović, J.,
Vujačić, V., & Pezo, L. (2019). The effects of the
osmotic dehydration parameters on reduction of
selected microorganisms on chicken meat. Journal
of Food Processing and Preservation, 43(10), 141-
144. https://doi.org/10.1111/jfpp.14144.
Filipović, V., Ćurčić, B., Nićetin, M., Plavšić, D., Ko-
privica G. & Mišljenović, N. (2012). Mass transfer
and microbiological profile of pork meat de-
hydrated in two different osmotic solutions.
Hemijska Industrija, 66(5), 743-748.
https://doi.org/10.2298/HEMIND120130033F.
Filipović, V., Lončar, B., Nićetin, M., Knežević, V., Fili-
pović, I. & Pezo, L. (2014). Modeling counter-
current osmotic dehydration process of pork meat
in molasses. Journal of Food Process Engineering,
37(5), 533-542.
https://doi.org/10.1111/jfpe.12114.
González-Pérez, J.E., López-Méndez, E.M., Luna-Gue-
vara, J.J., Ruiz-Espinosa, H., Ochoa-Velasco, C.E.,
& Ruiz-Lópeza, I.I. (2019). Analysis of mass tran-
sfer and morphometric characteristics of white
mushroom (Agaricus bisporus) pilei during osmo-
tic dehydration. Journal of Food Engineering, 240,
120-132.
https://doi.org/10.1016/j.jfoodeng.2018.07.026
Gupta, P., Bhat, A., Chauhan, H., Ahmed N., & Malik, A.
(2015). Osmotic dehydration of button mushroom.
International Journal of Food and Fermentation
Technology, 5(2), 177-182.
https://doi.org/10.5958/2277-9396.2016.00003.9
ISO 21527-2:2008. (2008). Microbiology of food and
animal feeding stuffs - Horizontal method for the
enumeration of yeasts and moulds - Part 2: Colony
count technique in products with water activity less
than or equal to 0.95.
ISO 21528-2:2017. (2017). Microbiology of the food
chain - Horizontal method for the detection and
enumeration of Enterobacteriaceae - Part 2: Co-
lony-count technique.
ISO 4833-1:2013. (2013). Microbiology of the food chain
- Horizontal method for the enumeration of micro-
organisms. Colony count at 30 C by the pour plate
technique.
ISO 6869:2000. (2000). Animal feeding stuffs – Determi-
nation of the contents of calcium, copper, iron,
magnesium, manganese, potassium, sodium and
zinc - Method using atomic absorption spectro-
metry.
Ispir, A., & Toğrul, Đ.T. (2009). Osmotic dehydration of
apricot: Kinetics and the effect of process
parameters. Chemical Engineering Research and
Design, 87(2), 166–180.
https://doi.org/10.1016/j.cherd.2008.07.011
Khan, M. R. (2012). Osmotic dehydration technique for
fruits preservation - A review. Pakistan Journal of
Food Sciences, 22(2), 71–85.
Knežević, V., Pezo, L., Lončar, B., Filipović, V., Nićetin,
M., Gorjanović, S., & Šuput D. (2019). Anti-
oxidant capacity of nettle leaves during osmotic
treatment. Periodica Polytechnica-Chemical Engi-
neering, 63(3), 491-498.
https://doi.org/10.3311/PPch.12688.
Koprivica, G., Pezo, L., Ćurčić, B., Lević, Lj., & Šuput,
D. (2014). Optimization of osmotic dehydration of
apples in sugar beet molasses. Journal of Food
Processing and Preservation, 38(4), 1705-1715.
https://doi.org/10.1111/jfpp.12133.
Lončar, B., Filipović,V., Nićetin, M., Knežević, V.,
Gubić, J., Plavšić, D., & Pezo L. (2015). Charac-
terisation of chicken breast cubes osmotically
treated in sugar beet molasses. Journal on Pro-
cessing Energy in Agriculture, 19(4), 186-188.
Mišljenović, N., Koprivica, G., Jevrić, L., & Lević, Lj.
(2011). Mass transfer kinetics during osmotic
dehydration of carrot cubes in sugar beet molasses.
Romanian Biotechnological Letters, 16(6), 6790-
6799. https://doi.org/10.2298/APT1041047K.
Mújica-Paz, H., Valdez-Fragoso, A., Lopez-Malo, A.,
Palou, E., & Welti-Chanes, J. (2003). Impregnation
and osmotic dehydration of some fruits: effect of
the vacuum pressure and syrup concentration.

Danijela Z. Šuput et al., Modeling of mushrooms (Agaricus bisporus) osmotic dehydration process in sugar beet molasses,
Food and Feed Research, 47 (2), 175-187, 2020
Journal of Food Engineering, 57(4), 305-314.
https://doi.org/10.1016/S0260-8774(02)00344-8.
Mundada, M., Hathan, B.S., & Maske, S. (2011). Mass
transfer kinetics during osmotic dehydration of
pomegranate arils. Journal of Food Science, 75(1),
31–39.
https://doi.org/10.1111/j.1750-3841.2010.01921.x
Nićetin, M., Pezo, L., Lončar, B., Filipović, V., Šuput, D.,
Knežević, V., & Filipović, J. (2017). The
possibility of increasing the antioxidant activity of
celery root during osmotic treatment. Journal of
the Serbian Chemical Society, 82(3), 253-265.
https://doi.org/10.2298/JSC161020015N.
Nićetin, M., Lončar, B., Filipović, V., Knežević, V.,
Kuljanin, T., Pezo, L., & Plavšić, D. (2015a). The
change in microbiological profile and water
activity due to the osmotic treatment of celery
leaves and root. Journal on Processing Energy in
Agriculture, 19(4), 193-196.
Nićetin, M., Pezo L., Lončar, B., Filipović, V., Šuput, D.,
Zlatanović, S., & Dojčinović, B. (2015b). Eva-
luation of water, sucrose and minerals effective
diffusivities during osmotic treatment of pork in
sugar beet molasses. Hemijska Industrija, 69(3),
241–251.
https://doi.org/10.2298/HEMIND131003037N.
Phisut, N. (2012). Factors affecting mass transfer during
osmotic dehydration of fruits. International Food
Research Journal, 19(1), 7–18.
Pravilnik o opštim i posebnim uslovima higijene hrane u
bilo kojoj fazi proizvodnje, prerade i prometa.
(2010). Sl. glasnik RS, 72/2010; 62/2018.
Qiu, L., Zhang, M., Tang, J., Adhikari, B., & Cao, P.
(2019). Innovative technologies for producing and
preserving intermediate moisture foods: A review.
Food Research International, 116, 90-102.
https://doi.org/10.1016/j.foodres.2018.12.055.
Rahman, M.S., & Perera, C. (2007). Drying and food
preservation. In M. Shafiur Rahman (Ed.),
Handbook of food preservation (2nd ed.). Boca
Raton, FL: CRC Press.
Ramaswamy, H. S. (2005). Osmotic drying. In The
Workshop on Drying of Food and Pharmaceuticals
at the Fourth Asia Pacific Drying Conference.
Kolkata, India.
Rastogi, N.K., & Raghavarao, K.S.M.S. (2004). Mass
transfer during osmotic dehydration of pineapple:
considering Fickian diffusion in cubical
configuration. LWT - Food Science and Tech-
nology, 37(1), 43-47.
https://doi.org/10.1016/S0023-6438(03)00131-2.
Rodrigues, A.E., & Mauro, M.A. (2004). Water and
sucrose diffusion coefficients in apple during
osmotic dehydration. In Proceedings of the 14th
International Drying Symposium. São Paulo,
Brazil.
Sauvant, D., Perez, J.M., & Tran, G. (2004). Tables de
composition et de valeur nutritive des matières
premières destinées aux animaux d’élevage: Porcs,
volailles, bovins, ovins, caprins, lapins, chevaux,
poisons (2ème édition revue et corrigée).
Versailles, France: INRA Editions.
Shi, J., & Xue, J.S. (2009). Application and development
of osmotic dehydration technology in food pro-
cessing. In C. Ratti (Ed.), Advances in food
dehydration. USA: CRC Press.
Silva, K.S., Fernandes, M.A., & Mauro, M.A. (2014).
Effect of calcium on the osmotic dehydration
kinetics and quality of pineapple. Journal of Food
Engineering, 134, 37-44. https://doi.org/10.1016/j.jfoodeng.2014.02.020.
Šarić, Lj., Filipčev, B., Šimurina, O., Plavšić, D., & Šarić,
B. (2016). Sugar beet molasses: properties and
applications in osmotic dehydration of fruits and
vegetables. Food and Feed Research, 43(2), 135-
144.
https://doi.org/10.5937/FFR1602135Š.
Šobot, K., Laličić-Petronijević, J., Filipović, V., Nićetin,
M., Filipović, J. & Popović, Lj. (2019). Con-
tribution of osmotically dehydrated wild garlic on
biscuits' quality parameters. Periodica Poly-
technica Chemical Engineering, 63(3), 499-507.
https://doi.org/10.3311/PPch.13268.
Šuput, D., Lazić, V., Pezo, L., Gubić, J., Šojić, B.,
Plavšić, D., Lončar, B., Nićetin, M., Filipović, V.
& Knežević, V. (2019). Shelf life and quality of
dehydrated meat packed in edible coating under
modified atmosphere. Romanian Biotechnological
Letters, 24(3), 545-553.
https://doi.org/10.25083/rbl/24.3/545.553.
Tortoe, C. (2010). A review of osmodehydration for food
industry. African Journal of Food Science, 4(6),
303–324.
Waliszewski, K.N., Delgado, J.L., & Garcia M.A. (2002).
Equilibrium concentration and water and sucrose
diffusivity in osmotic dehydration of pineapple
slabs. Drying Technology, 20, 527-538.
https://doi.org/10.1081/DRT-120002555.
SUPPORTING INFORMATION
Additional Supplementary material may be
found in the online version of this article.
Table S1. Experimental data for osmotic de-
hydration mass transfer responses
DMC (%) - Dry matter content; WL (g/gi.s.) -Water
loss; SG (g/gi.s.) - Solid gain; aw - Water activity
Table S2. Experimental data for microbio-
logical responses
TPC(log10(CFU/g)) - Total plate count;
Enterobactericeae (log10(CFU/g)); TYMC
(log10(CFU/g)) - Total yeasts and moulds count
Table S3. Experimental data for responses
related to mineral composition
K, Mg, Ca and Fe content in mg/kgd.m.
Table S4. Experimental data of chemical
composition responses
Content of ash, sugars and proteins in %d.m.
Table S5. Regression coefficients of SOP
models for osmotic dehydration process and
microbiological responses
Table S6. Regression coefficients of SOP
models for minerals and chemical responses

Danijela Z. Šuput et al., Modeling of mushrooms (Agaricus bisporus) osmotic dehydration process in sugar beet molasses,
Food and Feed Research, 47 (2), 175-187, 2020
МОДЕЛOВАЊЕ ПРОЦЕСА ОСМОТСКЕ ДЕХИДРАТАЦИЈЕ ПЕЧУРАКА (АGARICUS BISPHORUS) У МЕЛАСИ ШЕЋЕРНЕ РЕПЕ
Дaнијела З. Шупут*1, Владимир С. Филиповић
1, Биљана Љ. Лончар
1, Mилица Р. Нићетин
1, Виолета М.
Kнежевић1, Jaсмина M. Лазаревић
2, Драгана В. Плавшић
2
1Универзитет у Новом Саду, Технолошки факултет Нови Сад,
21000 Нови Сад, Булевар цара Лазара бр. 1, Србија 2Универзитет у Новом Саду, Научни институт за прехрамбене технологије у Новом Саду,
21000 Нови Сад, Булевар цара Лазара бр. 1, Србија
Сажетак: Печурке (Agaricus bisphorus) су осмотски дехидриране у растворима
меласе шећерне репе различитих концентрација (60%, 70% и 80%), на радним
температурама од 25, 35 и 45 °C током 0,5, 1, 1,5, 2, 3 и 5 h. Садржај влаге,
активност воде (aw), микробиолошки квалитет (укупан број бактерија,
ентеробактерије, укупан број квасца и плесни) и садржај минералних материја
(садржај калијума, калцијума, магнезијума и гвожђа) одређени су на добијеним
узорцима осмотски дехидрираних печурака. Методи одзивних површина и анализе
варијансе одабрани су да би се проценили главни ефекти процесних варијабли на
микробиолошки квалитет, садржај минералних материја и хемијски састав осмотски
дехидрираних печурака. Повећање вредности процесних параметара осмотске
дехидратације довело је до значајног повећања садржаја минералних материја (на
пример, пораст садржаја K за 269,42% и садржаја Ca за 939.03%), а смањења
вредности активности воде (са 0,941 на 0,811), микробиолошког оптерећења и
релативног садржаја протеина (пад од 33,07%) у дехидрираним узорцима печурака,
што указује на могућност продуженог рока трајања и погодности овако обрађених
печурака за даљу обраду. Осмотски дехидриране печурке могу се сматрати новим
функционалним (полу)производима, узимајући у обзир њихов побољшан
нутритивни профил.
Кључне речи: минерални састав, губитак влаге, прираст суве материје,
miкробиолошки квалитет, хемијски састав
Received: 16 September 2020/ Received in revised form: 08 December 2020/ Accepted: 10 December 2020
Available online: December 2020
This is an open-access article under the CC BY license (http://creativecommons.org/licenses/by/3.0).