Agaricus bisporus mushroom production in the USA bisporus, commonly known as the white or brown...
12
LCA FOR ENERGY SYSTEMS AND FOOD PRODUCTS A life cycle assessment of Agaricus bisporus mushroom production in the USA Bethany Robinson 1 & Kiara Winans 1,2 & Alissa Kendall 1 & Jeff Dlott 3 & Franklin Dlott 3 Received: 21 July 2017 /Accepted: 20 February 2018 # The Author(s) 2018. This article is an open access publication Abstract Purpose Stakeholders across the food product supply chain are increasingly interested in understanding the environmental effects of food production. Mushrooms are a unique food crop, grown in the absence of sunlight and in climate controlled environments. Few life cycle assessment (LCA) studies have been conducted previously on mushrooms and none in the USA. This study assesses the cradle-to-gate life cycle environmental impacts of mushroom production in the USA from cultivation to harvest and preparation for bulk packaging. Methods This process-based LCA uses primary data from mushroom producers to define the foreground system. Primary data for operations were collected from compost and mushroom producers in the USA, representing approximately one third of US mushroom production. Secondary data were collected from life cycle inventory databases and other published resources to define background systems and process emissions from the foreground system. The study uses a functional unit of 1 kg mushrooms and applies the Institute of Environmental Sciences (CML) impact analysis method, supplemented with additional impact categories for energy use, freshwater use, and 20 and 100-year global warming potentials (GWPs) with and without carbon-climate feedback. Results and discussion Results show that GWP 100 impacts range from 2.13 to 2.95 kg CO 2 e/kg of mushroom product, slightly lower than previous mushroom LCAs conducted for Australian and Spanish production systems. Electricity and fossil fuels were the most impactful inputs, not just for GWP, but most other impact categories as well, followed by compost materials, compost emissions, and transportation. Transport of peat, a key input to the mushroom production substrate, and compost materials contributed to 60 and 36% of the total transportation impacts, respectively. The co-product generated by the system, spent mushroom substrate (SMS), was handled using the displacement method. SMS generated very small credits to the system, less than 1% in every impact category. Conclusions Recommendations to improve the commercial mushroom production process include reducing electricity and fossil fuel use through on-site renewable energy generation. This recommendation is primarily relevant to mushroom producers in the Eastern region of the USA, where the electricity grid is the most coal and fossil fuel-intensive. Future work should contextualize the results of this study in the context of nutrition, meal, or diet-level assessments to enable informed food choices. Keywords Carbon footprint . Compost . Environmental impacts . Food LCA . Mushroom . Sustainability 1 Introduction Global mushroom production has grown dramatically since the late 1990s, increasing more than fivefold to ap- proximately 34 million t in 2013, with average per-capita consumption growing significantly as well (Royse et al. 2016). Of produced mushrooms, cultivated edible varieties constitute just over half of economic value, with the bal- ance of production attributable to wild harvest (8%) and medicinal use (38%). China is the world’ s largest producer of edible mushrooms, supplying over 30 million t, or 87% of global supply (Royse et al. 2016). Responsible editor: Greg Thoma Electronic supplementary material The online version of this article (https://doi.org/10.1007/s11367-018-1456-6) contains supplementary material, which is available to authorized users. * Alissa Kendall [email protected] 1 Department of Civil and Environmental Engineering, University of California, Davis, CA 95616, USA 2 Agricultural Sustainability Institute, University of California, Davis, CA 95616, USA 3 Sureharvest, Soquel, CA 95073, USA The International Journal of Life Cycle Assessment https://doi.org/10.1007/s11367-018-1456-6
Transcript of Agaricus bisporus mushroom production in the USA bisporus, commonly known as the white or brown...
LCA FOR ENERGY SYSTEMS AND FOOD PRODUCTS
A life cycle assessment of Agaricus bisporus mushroomproduction in the USA
Bethany Robinson1& Kiara Winans1,2 & Alissa Kendall1 & Jeff Dlott3 & Franklin Dlott3
Received: 21 July 2017 /Accepted: 20 February 2018# The Author(s) 2018. This article is an open access publication
AbstractPurpose Stakeholders across the food product supply chain are increasingly interested in understanding the environmental effectsof food production. Mushrooms are a unique food crop, grown in the absence of sunlight and in climate controlled environments.Few life cycle assessment (LCA) studies have been conducted previously on mushrooms and none in the USA. This studyassesses the cradle-to-gate life cycle environmental impacts of mushroom production in the USA from cultivation to harvest andpreparation for bulk packaging.Methods This process-based LCA uses primary data from mushroom producers to define the foreground system. Primary data foroperations were collected from compost and mushroom producers in the USA, representing approximately one third of USmushroom production. Secondary data were collected from life cycle inventory databases and other published resources to definebackground systems and process emissions from the foreground system. The study uses a functional unit of 1 kg mushrooms andapplies the Institute of Environmental Sciences (CML) impact analysis method, supplemented with additional impact categories forenergy use, freshwater use, and 20 and 100-year global warming potentials (GWPs) with and without carbon-climate feedback.Results and discussion Results show that GWP100 impacts range from 2.13 to 2.95 kg CO2e/kg of mushroom product, slightlylower than previous mushroom LCAs conducted for Australian and Spanish production systems. Electricity and fossil fuels werethe most impactful inputs, not just for GWP, but most other impact categories as well, followed by compost materials, compostemissions, and transportation. Transport of peat, a key input to the mushroom production substrate, and compost materialscontributed to 60 and 36% of the total transportation impacts, respectively. The co-product generated by the system, spentmushroom substrate (SMS), was handled using the displacement method. SMS generated very small credits to the system, lessthan 1% in every impact category.Conclusions Recommendations to improve the commercial mushroom production process include reducing electricity and fossilfuel use through on-site renewable energy generation. This recommendation is primarily relevant to mushroom producers in theEastern region of the USA, where the electricity grid is the most coal and fossil fuel-intensive. Future work should contextualizethe results of this study in the context of nutrition, meal, or diet-level assessments to enable informed food choices.
Keywords Carbon footprint . Compost . Environmental impacts . Food LCA .Mushroom . Sustainability
1 Introduction
Global mushroom production has grown dramaticallysince the late 1990s, increasing more than fivefold to ap-proximately 34 million t in 2013, with average per-capitaconsumption growing significantly as well (Royse et al.2016). Of produced mushrooms, cultivated edible varietiesconstitute just over half of economic value, with the bal-ance of production attributable to wild harvest (8%) andmedicinal use (38%). China is the world’s largest producerof edible mushrooms, supplying over 30 million t, or 87%of global supply (Royse et al. 2016).
Responsible editor: Greg Thoma
Electronic supplementary material The online version of this article(https://doi.org/10.1007/s11367-018-1456-6) contains supplementarymaterial, which is available to authorized users.
* Alissa [email protected]
1 Department of Civil and Environmental Engineering, University ofCalifornia, Davis, CA 95616, USA
2 Agricultural Sustainability Institute, University of California,Davis, CA 95616, USA
3 Sureharvest, Soquel, CA 95073, USA
The International Journal of Life Cycle Assessmenthttps://doi.org/10.1007/s11367-018-1456-6
Agaricus bisporus, commonly known as the white orbrown button mushroom and hereafter referred to simply asmushrooms, is the most common edible mushroom in theUnited States (US), which is the second largest producer ofthe genus after China. The US mushroom supply was approx-imately 440,326 t of mushrooms in 2016, with 12% importedand 1% exported, leading to approximately 1.4 kg of mush-rooms consumed annually per capita (USDA 2017).Mushrooms contain all of the essential amino acids and havea very low fat content, which has led to efforts to increaseconsumption as part of healthier diets (USDA MushroomCouncil 2013); nevertheless, while US per-capita consump-tion has steadily increased over the last few decades, it re-mains well below the global average, which exceeds fourand a half kilogram per annum (Royse et al. 2016).
As with all food products, mushrooms require energy, ma-terial, and water inputs for their production. There has beenincreasing awareness and demand for information on the en-ergy and environmental implications of the food system(National Academies of Sciences, Engineering, andMedicine 2016). An increasing number of crops and foodproducts have been evaluated using Bfootprinting^ methodsor life cycle assessment (LCA) (Hoekstra and Mekonnen2012; Roy et al. 2009). Mushrooms present an interestingLCA case to study because they are grown under unique con-ditions, using specially formulated compost in dark, climatecontrolled environments.
Few LCAs or environmental footprints have been conduct-ed previously for mushrooms, and none for US production.Gunady et al. (2012) completed a streamlined LCA fromcradle-to-retail in Australia, and Leiva et al. (2015) completedan LCA for mushroom production in Spain. Both studies eval-uated Agaricus bisporus, and comparison of their resultsshows great variability in estimates of impact; for example,their carbon intensity estimates, 2.76 kg CO2 equivalent(CO2e) and 4.41 kg CO2e/kg mushroom, differed by 60%.These differences are a function of both real variability inproduction processes and background systems, and methodo-logical differences in the implementation of LCA. One addi-tional study was found in the published literature that under-took an LCA of shiitake mushrooms (Lentinula edodes) inThailand (Tongpool and Pongpat 2013), finding that transportand incineration processes, both functions of local conditionsand practices, were important in determining environmentalimpacts. Shiitake are cultivated quite differently thanAgaricusbisporus, but as a point of comparison to Gunady et al.’s(2012) and Leiva et al.’s (2015) findings, Tongpool andPongpat estimated carbon intensity at 1.87 kg CO2e/kgmushroom.
Mushroom production occurs across the continental US,including Western, Central, and Eastern regions. The EasternUS dominates production, supplying 71%, while the Westproduces 19% and the Central US produces 9% (United
States International Trade Commission 2010). Each regionhas different environmental and climatic conditions, electrici-ty grids, and costs and availability for compost materials andheating fuels, all of which lead to unique LCA results for eachregion.
This study conducts a cradle-to-gate LCA of mushroomproduction in the US based on a production-weighted averagefor the three regions to assess the environmental impacts fromcultivation to harvest and preparation for bulk packaging. Thestudy results provide a baseline estimate of the environmentalimpacts of mushrooms, which will facilitate improved under-standing of the environmental impacts of different steps inmushroom production and the impacts of diets that includemushrooms.
2 Methodology
2.1 Goal and scope definition
The goal of this study is to characterize a typical commercialmushroom production system in the US using process-basedLCA that largely conforms to the International Organizationfor Standardization (ISO) guidelines for LCA, ISO 14040 and14,044 (ISO 2006).Mushroom production is typically dividedinto three distinct phases: composting and composting opera-tions (phase 1), pasteurization and conditioning to finish thecompost (phase 2), and growing and harvesting of mushrooms(phase 3). In phase 1, the compost is created by wetting andmixing bulk ingredients, nitrogen supplements, and gyp-sum, and then composted using processes such as aeration,turning, and watering for 6–14 days. In phase 2, the com-post is pasteurized to kill pests and fungi and is condi-tioned to remove ammonia, all of which can damage themushroom crop (Beyer 2017).
Unlike most crops where seed is planted, the mushroom isintroduced to the compost through spawn. In phase 3, spawnis created by propagating mycelium on a grain material, andthen the spawn and additional supplements are mixed into thefinished compost. Mushrooms are grown in sealed, insulatedrooms where the temperature, humidity, and carbon dioxide(CO2) concentration are carefully controlled. Once the com-post, spawn, and supplements are in place, casing (mostlycomprised of peat moss) or casing inoculum (casing seededwith mushroom spawn) is applied over the top of the mixture.Mushrooms can be harvested 18–21 days after casing in 7–10-day cycles for 35–60 days (Beyer 2017). After the final har-vesting, the remainingmaterial, referred to as spent mushroomsubstrate (SMS), can be used for other applications, for exam-ple, as a soil amendment.
The scope of the LCA is from cradle-to-facility gate with afunctional unit of 1 kg (wet basis 92% moisture content) ofbulk mushroom product (USDA 2016). Figure 1 illustrates the
Int J Life Cycle Assess
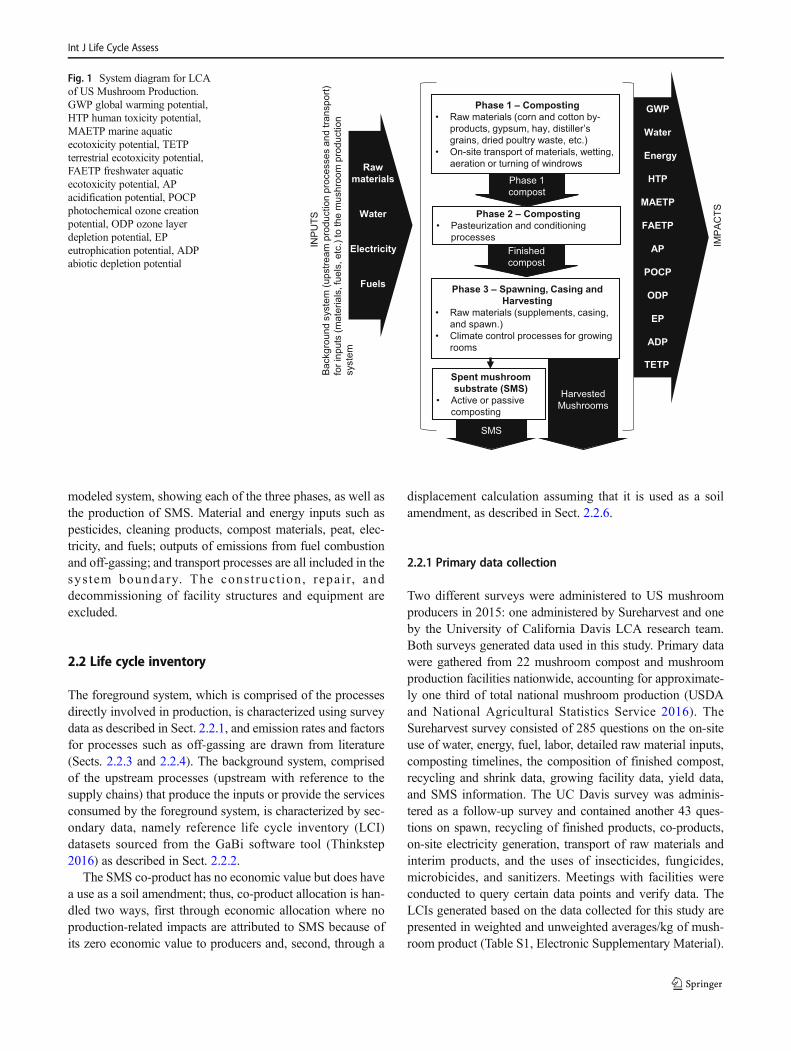
modeled system, showing each of the three phases, as well asthe production of SMS. Material and energy inputs such aspesticides, cleaning products, compost materials, peat, elec-tricity, and fuels; outputs of emissions from fuel combustionand off-gassing; and transport processes are all included in thesys tem boundary. The const ruct ion, repa i r, anddecommissioning of facility structures and equipment areexcluded.
2.2 Life cycle inventory
The foreground system, which is comprised of the processesdirectly involved in production, is characterized using surveydata as described in Sect. 2.2.1, and emission rates and factorsfor processes such as off-gassing are drawn from literature(Sects. 2.2.3 and 2.2.4). The background system, comprisedof the upstream processes (upstream with reference to thesupply chains) that produce the inputs or provide the servicesconsumed by the foreground system, is characterized by sec-ondary data, namely reference life cycle inventory (LCI)datasets sourced from the GaBi software tool (Thinkstep2016) as described in Sect. 2.2.2.
The SMS co-product has no economic value but does havea use as a soil amendment; thus, co-product allocation is han-dled two ways, first through economic allocation where noproduction-related impacts are attributed to SMS because ofits zero economic value to producers and, second, through a
displacement calculation assuming that it is used as a soilamendment, as described in Sect. 2.2.6.
2.2.1 Primary data collection
Two different surveys were administered to US mushroomproducers in 2015: one administered by Sureharvest and oneby the University of California Davis LCA research team.Both surveys generated data used in this study. Primary datawere gathered from 22 mushroom compost and mushroomproduction facilities nationwide, accounting for approximate-ly one third of total national mushroom production (USDAand National Agricultural Statistics Service 2016). TheSureharvest survey consisted of 285 questions on the on-siteuse of water, energy, fuel, labor, detailed raw material inputs,composting timelines, the composition of finished compost,recycling and shrink data, growing facility data, yield data,and SMS information. The UC Davis survey was adminis-tered as a follow-up survey and contained another 43 ques-tions on spawn, recycling of finished products, co-products,on-site electricity generation, transport of raw materials andinterim products, and the uses of insecticides, fungicides,microbicides, and sanitizers. Meetings with facilities wereconducted to query certain data points and verify data. TheLCIs generated based on the data collected for this study arepresented in weighted and unweighted averages/kg of mush-room product (Table S1, Electronic Supplementary Material).
Phase 1 – Composting• Raw materials (corn and cotton by-
products, gypsum, hay, distiller’s grains, dried poultry waste, etc.)
• On-site transport of materials, wetting, aeration or turning of windrows
Phase 2 – Composting• Pasteurization and conditioning
processes
Phase 1 compost
Finished compost
Phase 3 – Spawning, Casing and Harvesting
• Raw materials (supplements, casing, and spawn.)
• Climate control processes for growing rooms
Harvested Mushrooms
INPU
TSBa
ckgr
ound
sys
tem
(ups
tream
pro
duct
ion
proc
esse
s an
d tra
nspo
rt)
for i
nput
s (m
ater
ials
, fue
ls, e
tc.)
to th
e m
ushr
oom
pro
duct
ion
syst
em
Raw materials
Water
Electricity
Fuels
GWP
Water
Energy
HTP
MAETP
FAETP
AP
POCP
ODP
EP
ADP
IMPA
CTS
Spent mushroom substrate (SMS)
• Active or passive composting
SMS
TETP
Fig. 1 System diagram for LCAof US Mushroom Production.GWP global warming potential,HTP human toxicity potential,MAETP marine aquaticecotoxicity potential, TETPterrestrial ecotoxicity potential,FAETP freshwater aquaticecotoxicity potential, APacidification potential, POCPphotochemical ozone creationpotential, ODP ozone layerdepletion potential, EPeutrophication potential, ADPabiotic depletion potential
Int J Life Cycle Assess
2.2.2 Reference life cycle inventories
The GaBi Professional database (Thinkstep 2016) and theEcoinvent database (Ecoinvent Center 2016) provided theLCI datasets used in the model. Where available, LCIs basedon US conditions were selected. Combining LCIs from twodatabases was necessary as neither database could provide allthe needed LCIs. Table S2 in the Electronic SupplementaryMaterial reports the dataset used for each input. With oneexception, the same dataset is used regardless of the locationof a mushroom producer. Electricity is the exception, as LCIsdiffer based on the regional electricity grid of each producer asdefined by the North American Electric ReliabilityCorporation (NERC). Each grid uses different fuels and tech-nologies to produce and deliver electricity, and thus their lifecycle impacts are different.
Some inputs to mushroom production do not have existingLCI datasets, such as some pesticide, fungicide, insecticide,and sanitizer inputs. When unavailable in either of the twodatabases, LCIs were created based on the active ingredientsreported in the respective material’s material safety data sheet.Table S2 (Electronic Supplementary Material) also describesthe LCIs created for this project.
2.2.3 Transport of materials
The average transport distances for material inputs are basedon the material manufacturer and location information report-ed in facility survey data. For all materials, the transport dis-tances from manufacturer to facility (one-way transport) areaveraged separately for each material type (Table S9,Electronic Supplementary Material). The distance for eachinput is multiplied by the mass of material input and thenmultiplied by the GaBi reference LCI for US freight trucktransport, based on units of freight intensity. Freight intensityunits account for average backhaul rates, meaning only one-way transport distances need to be modeled. Transport withinfacilities is accounted for using reported annual fuel use data.
2.2.4 Compost production
Compost may be produced on site at the mushroom growingfacility or may be produced at a compost-only facility andtransported to mushroom growers. For facilities that do notproduce mushrooms, a calculated ratio is used to equate emis-sion values to a per-mass of mushroom basis (Eqs. (1) and(2)).
mass tonsð Þ of phase 1 compostmass tonsð Þ of phase 2 finishedð Þ compost ¼ 1:40 ð1Þ
mass tonsð Þ of phase 2 finishedð Þ compostmass tonsð Þ of mushrooms produced
¼ 3:63 ð2Þ
These calculated ratios are based on average mass flow ateach phase in the production system. The calculated mass ofphase 1 compost relative to phase 2 finishing compost equaled1.40 ± 0.14, and the mass of phase 2 compost to mushroomproduced equaled 3.63 ± 0.69.
Compost emissions are released during the compostingprocess, and these emissions include methane (CH4), nitrousoxide (N2O), and ammonia (NH3). Composting emissions canvary based on composting practices (e.g., aeration and turn-ing) and conditions (e.g., temperature, moisture content).Phase 1 may occur either in windrows or tunnels; phase 2always occurs indoors, in spaces often referred to as tunnels.Emission factors for composting are taken from a peer-reviewed study of a windrow system conducted by Saeret al. (2013): 4.06 × 10⁻⁴ kg (NH3)/kg compost, 1.83 ×10⁻³ kg CH4/kg compost, and 7.50 × 10⁻⁵ kg N2O/kgcompost.
Tunnel-based composting emits approximately twice theammonia emissions than windrow-based composting(Cadena et al. 2009). A source for peer-reviewed literaturevalues for tunnel-based compost emissions was not identified.As such, the Saer et al. (2013) windrow-based compost emis-sions values are used for both windrow and tunnel compostingsystems. Given the variability in the emissions generated fromwindrow and tunnel composting systems, this may lead to anunderestimation of the tunnel-based composting emissions. Itis also important to note that tunnel-based composting emis-sions can be captured in biofilters which would reduce oreliminate this difference (Cadena et al. 2009; Sánchez et al.2015); however, the surveys administered for this study didnot query biofilter use, and thus filter use and related emis-sions abatement are not accounted for in the assessment.
2.2.5 Peat emissions
Peat is a carbon-rich soil-like material that is used as casing inmushroom production. Peat forms in bogs and other similarenvironments where plant matter accumulates, rather thandegrading, and accrues and stores carbon for periods of cen-turies or millennia. Peat begins to degrade upon exposure tooxygen and in doing so releases fossil carbon dioxide (CO2).The peat emission factor for CO2 (0.3726 kg CO2/kg of peatper year) is based on peer-reviewed literature values from apeat study that sourced peat from regions across Canada in-cluding Quebec, Ontario, and Manitoba (Moore and Dalva1997). Moore and Dalva (1997) measured emissions frompeat samples held in a controlled environment (i.e., tempera-tures 15–20 °C (59–68 °F) and aerobic conditions. These en-vironmental conditions are similar to the mushroom growingenvironment (i.e., ambient temperature ≈ 18 °C (65 °F)) andaerobic conditions. Because, according to the survey data col-lected for this LCA study, US mushroom producers mainly
Int J Life Cycle Assess
source peat from Canada, and the environmental conditions(temperature and oxygen levels) in mushroom production arecomparable with the environmental conditions in the Mooreand Dalva (1997) study, the measured emissions values fromthat study are assumed adequate for estimation of peat emis-sions in this study.
2.2.6 SMS co-product and allocation
SMS is the used portion of the growing medium from mush-room production that no longer has all the nutrients needed forgrowing mushrooms but retains nitrogen (N) and phosphorus(P) content which may have value for other cultivation sys-tems. SMS also contains carbon (C), with a C/N ratio of 9–15:1 (Roy et al. 2015), and could contribute to soil C. Theprimary use of SMS is as a soil amendment in agriculturalsystems.
Based on survey data, SMS has no value to the mushroomproducer (survey respondents indicated that they received nopayment for the SMS), but they also incur no cost of disposalas SMS users pick up the SMS at no cost to the mushroomproducers. Two options for considering how to conduct co-product allocation are considered: First, allocation can be ap-plied based on economic value, which leads to no impactsattributed from mushroom production to the SMS becausethe producer receives no value for SMS generation; second,a displacement calculation can be used to estimate the envi-ronmental value of SMS production assuming that it displacessubstitutable products. Both approaches are used in this arti-cle. In all results, SMS credits are reported separately, alongwith total results with and without SMS credits. By doing so,both the economic allocation results (which allocate noproduction-related impacts to SMS) and the results of dis-placement calculations are reported.
N and P nutrients are typically provided to agricultural soilsthrough synthetic and mineral sources. As such, when SMS isused on agricultural soils, it can displace these nutrient sourcesand SMS can receive a credit for avoiding their production.While additional C may be beneficial to a soil, SMS ismodeled to displace soil amendments that provide nutrientsonly. It is important to note that the C content in SMS is alabile form that does not contribute to soil aggregate formationnor long-term soil C sequestration (Peregrina et al. 2014); assuch, this study applies no C sequestration credits for the Ccontent of SMS. This assumption errs on the side ofundervaluing the C content of SMS from a carbon accountingstandpoint.
Based on the N and P content of SMS, LCIs for two com-mon fertilizers, anN fertilizer (urea ammonium nitrate; 30%Ncontent) and a P fertilizer (triple superphosphate; 45% P con-tent), are used to estimate avoided impacts due to the produc-tion of these fertilizers. The LCIs (sourced from GaBi) areused to calculate the value of SMS as a substitute for the
synthetic and mineral fertilizers. The average nutrient contentfor SMS is 1.12% nitrogen and 0.29% phosphorus on a wetweight basis (Fidanza et al. 2010), and this information is usedas described in Eq. (3) to estimate a co-product credit.
Credit per kg SMS ¼ 0:0112 kg NSMSð Þ � N F LCIð Þþ 0:00029 kg PSMSð Þ � PF LCIð Þ ð3Þ
where SMS refers to spent mushroom substrate,NSMS refersto nitrogen content of SMS, NF LCI refers to the nitrogenfertilizer LCI (assuming a functional unit of 1 kg N), PSMS
refers to the phosphorus content of SMS, and PF LCI refersto the phosphorous fertilizer life cycle inventory (assuming afunctional unit of 1 kg P).
Impacts for other material inputs (e.g., wheat straw) that areproduced from multi-product systems are calculated usingeconomic allocation and averaged market prices for 2016–2017. All allocation calculations are documented in Table S2in the Electronic Supplementary Material.
2.3 Life cycle impact assessment
LCAs can select from among many life cycle impact methods.These methods provide the means to translate the trackedenvironmental flows into indicators of impact. Each impactcategory represents specific environmental issues that can bequantified. These categories define the impacts of an assess-ment and are evaluated and interpreted to develop conclusionsbased on the results of the study. This study applies the CMLimpact analysis method, supplemented with additional impactcategories for energy use, freshwater use, and 20- and 100-year global warming potentials (GWPs) with and withoutcarbon-climate feedback. In addition, the Tool for Reductionand Assessment of Chemicals and Other EnvironmentalImpacts (TRACI) 2.1 methodology is used for a comparisonof results and presented in the online resource materials(Tables S7 and S8, Electronic Supplementary Material).
The Intergovernmental Panel on Climate Change (IPCC)Fifth Assessment Report GWPs are used in this study (IPCC2014). Both the 20- and 100-year GWPs are evaluated withand without climate-carbon feedback mechanisms, in units ofcarbon dioxide equivalents (CO2e). Primary energy use fromrenewable and non-renewable sources is calculated and re-ported in units of megajoule. Non-renewable energy sourcesinclude coalbed CH4, crude oil, hard coal, lignite, natural gas,oil sand, peat, pit CH4, shale gas, tight gas, and uranium.Renewable energy sources include geothermic, hydropower,solar, wave, and wind power, as well as resources from pri-mary forests. The total primary energy metric is the sum of therenewable and non-renewable sources. Total freshwater usereported in kilogram of water is the life cycle water use metricused in this assessment. It includes rainwater use, surface
Int J Life Cycle Assess
water (lakes and rivers), and ground water use. In addition, theCML methodology impact categories and characterizationfactors developed by Leiden University Institute ofEnvironmental Sciences (2016) are used to assess a suite ofenvironmental impacts including human toxicity potential(HTP), marine aquatic ecotoxicity potential (MAETP), terres-trial ecotoxicity potential (TETP), freshwater aquaticecotoxicity potential (FAETP), acidification potential (AP),photochemical ozone creation potential (POCP), ozone layerdepletion potential (ODP), eutrophication potential (EP), ele-ments abiotic depletion (elements ADP), and fossil abioticdepletion (fossil ADP) per kilogram of mushroom product.Though the CML impact analysis method includes GWP, itis modeled and discussed separately from the other CML im-pact categories.
3 Results
The production-weighted average LCA results are presentedin the body of this article and are based on the regional pro-duction volumes for Eastern, Central, and Western regions.The regional production (percent) is calculated based on theregional production per the total national production and thenmultiplied by the total average impacts per category (e.g.,GWP, eutrophication, etc.). The unweighted average results(the simple mean of all production facilities’ impact results)are reported in the online resource material (Tables S3, S4, S5,and S6 in the Electronic Supplementary Material 1). In addi-tion, TRACI methodology results are reported in the onlineresource materials in production-weighted (Table S7,Electronic Supplementary Material) and unweighted(Table S8, Electronic Supplementary Material) averages.The complete LCI results, both weighted and unweighted av-erages, are also provided in the online resource materials, asElectronic Supplementary Material 2.
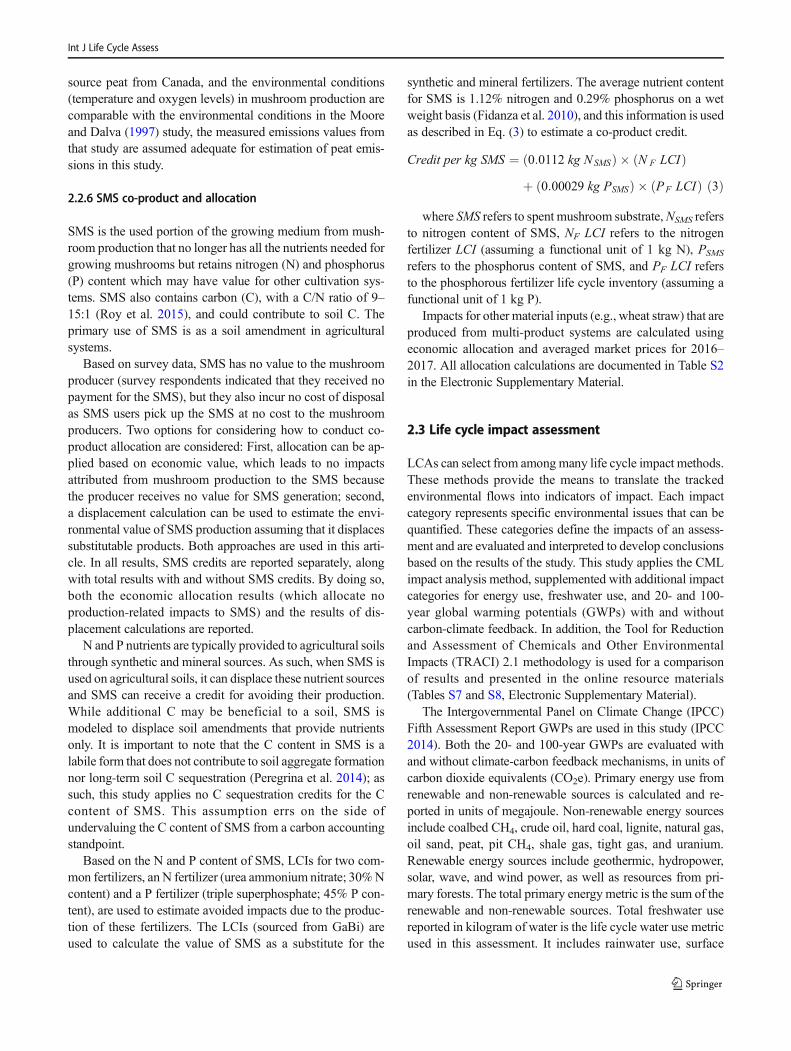
Figure 2 shows summary results for total primary energy,GWP100 (without climate-carbon feedback) and freshwateruse and demonstrates the significant contribution of electricityto all three impact categories, the importance of fuel use toboth electricity and GWP, and the particular contribution ofcompost, dominated by emissions from the composting pro-cess, to GWP. SMS credits are very small, contributing be-tween − 0.3 and − 0.4% to each category. More detailed re-sults are provided in Sects. 3.1 to 3.4 for these and otherimpact categories.
3.1 Global warming potential
Total GWP impacts range from 2.13 to 2.95 kg CO2e/kg ofmushroom product depending on the GWP metric selected(Table 1). The results from the current study are comparablein magnitude to the other mushroom (Agaricus bisporus)
LCA studies completed. Gunady et al. (2012) found that2.76 kg of CO2e is released for every kilogram of mushroomproduced, and Leiva et al. (2015) found 4.41 kgCO2e releasedper kilogram of mushroom. In addition to differences in back-ground systems, including electricity grid fuel mixes, differ-ences in cultural practices, and differences in climate, thedifference in CO2e between studies may also be partlyexplained by the streamlined approach taken by Gunadyet al. (2012) and the GWP conversion factors used by eachstudy. Gunady et al. (2012) used GWPs published in theIPCC’s Second Assessment Report (IPCC 1996), Leivaet al. (2015) used GWPs published in the IPCC’s FourthAssessment Report (IPCC, 2007), and this study used themost recent GWP estimates from the IPCC’s FifthAssessment Report (IPCC 2014). In addition, the carbon ac-counting methods in Leiva et al. (2015) may contribute todifferences between its results and those of this study andGunady et al.’s (2012). For example, they seem to accountfor a CO2 credit rather than emission for peat use, which doesnot conform with accepted practice for estimating emissionscaused by peat harvesting and decomposition (Cleary et al.2005), and it is not clear how global warming emissions fromthe growing process, which they find to be the largest contrib-utor to GWP, were modeled and accounted for.
For all GWP metrics calculated in this study, electricity,compost, and fuels are the largest contributors in descendingorder (Table 1 and Fig. 2). Combustion of coal and natural gasare the two largest contributors to GWP from electricity con-sumption, and CH4 emitted from anaerobic decomposition is adominant factor in composting GWP. The GWP of CH4 ismuch higher for the 20-year time horizon than the 100-yeartime horizon because its atmospheric lifetime is only about12 years. Because compost emissions are a significant sourceof CH4 emissions, GWP20 results are higher than GWP100results. Total transport emissions contribute 6–9% of GWPimpacts with the higher range of emissions generated from
37%
32%
74%
38%
20%
23%
13%
-0.5
0.0
0.5
1.0
1.5
2.0
2.5
3.0
Total Primary
Energy (MJ/10)
GWP
(kg CO e)
Freshwater use
(L/100)
Electricity Fuels
Compost Peat
Other inputs Transport
SMS credits On-site water use
Fig. 2 Total primary energy and GWP for 1 kg mushroom based on theUS production-weighted average
Int J Life Cycle Assess

the 100-year GWP. Refrigerants, spawn and supplements, andpeat impacts contribute 1 to 8% of total impacts.
3.2 Energy use
Energy consumption in the mushroom production system isreported in three ways: renewable, non-renewable, and totalprimary energy (Table 2). The total primary energy consumedis 29.1 MJ (27.8 MJ from non-renewable sources and 1.3 MJfrom renewable sources) per kilogram of mushroom product.Non-renewable energy use is 20 times greater than renewableenergy use. While electricity comprises 37% of energy con-sumption, fuel use is the dominant cause of energy consump-tion (38%). Combined, diesel and heating oil alone comprise26% of total primary energy. In contrast, pesticides andsanitizers account for less than 1% of energy for either renew-able or non-renewable energy use.
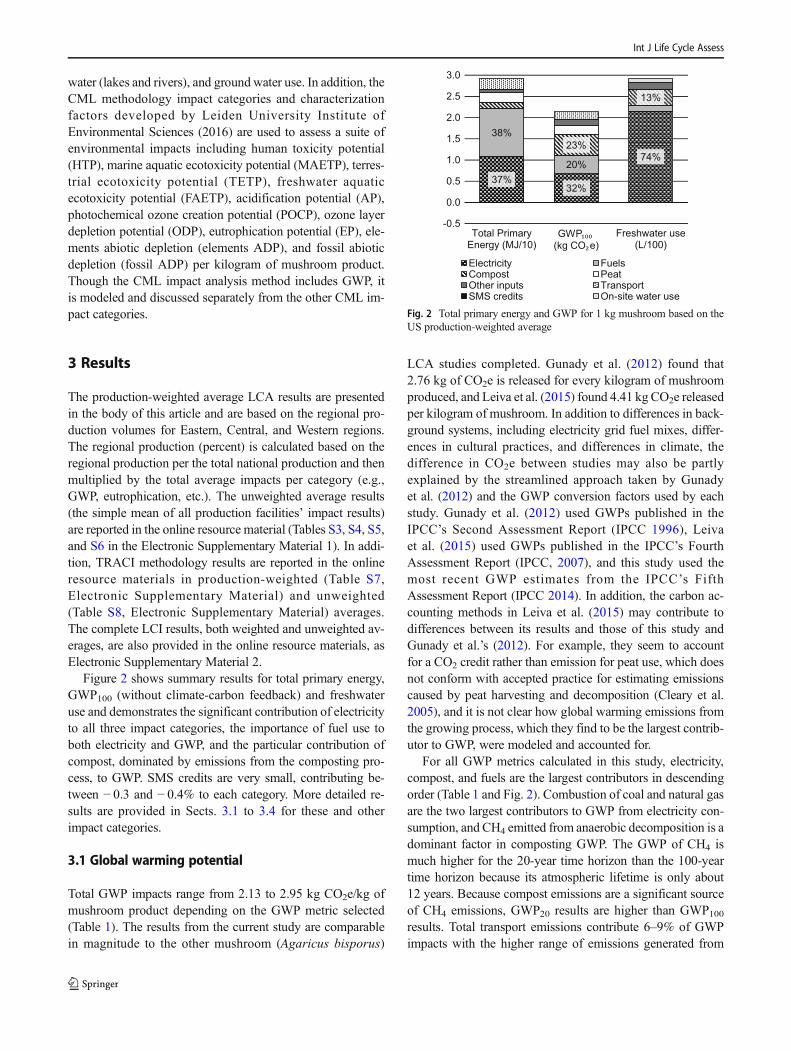
3.3 Total freshwater use
Freshwater use is dominated by the background system, and inparticular electricity production, which consumes 74% of totalfreshwater used in mushroom production (Table 3 and Fig. 2).Water is used throughout the electricity supply chain for fuelmining, production, and refinement, but mostly, it is used inthermoelectric power plants for cooling. In fact, thermoelectricpower is the single largest non-consumptive use of freshwaterin the US. On-site water use consumed 9 kg freshwater perkilogram mushroom, or 3.1% of total freshwater consumption.
Table 1 Global warmingpotential in kilograms CO2e perkilogram of mushroom productby input or process
Inputs GWP20 GWP20 with climatechange feedback
GWP100 GWP100 with climatechange feedback
Electricity 7.41 × 10⁻¹ 7.43 × 10⁻¹ 6.81 × 10⁻¹ 6.86 × 10⁻¹
Diesel 1.59 × 10⁻¹ 1.59 × 10⁻¹ 1.44 × 10⁻¹ 1.45 × 10⁻¹
Natural gas 1.46 × 10⁻¹ 1.46 × 10⁻¹ 1.10 × 10⁻¹ 1.13 × 10⁻¹
Heating oil 1.80 × 10⁻¹ 1.80 × 10⁻¹ 1.63 × 10⁻¹ 1.65 × 10⁻¹
LPG 1.87 × 10⁻² 1.87 × 10⁻² 1.70 × 10⁻² 1.72 × 10⁻²
Compost materials 1.27 × 10⁻¹ 1.28 × 10⁻¹ 1.15 × 10⁻¹ 1.20 × 10⁻¹
Spawn, supplements 4.22 × 10⁻² 4.23 × 10⁻² 3.84 × 10⁻² 3.95 × 10⁻²
Compost emissions 8.91 × 10⁻¹ 9.11 × 10⁻¹ 3.65 × 10⁻¹ 4.34 × 10⁻¹
Peat 8.21 × 10⁻² 8.18 × 10⁻² 9.71 × 10⁻² 9.60 × 10⁻²
Growing materials 4.94 × 10⁻³ 4.94 × 10⁻³ 4.98 × 10⁻³ 4.98 × 10⁻³
Refrigerants 2.10 × 10⁻¹ 2.14 × 10⁻¹ 8.23 × 10⁻² 9.73 × 10⁻²
Pesticides 2.70 × 10⁻⁴ 2.71 × 10⁻⁴ 2.27 × 10⁻⁴ 2.32 × 10⁻⁴
Sanitizers 3.02 × 10⁻⁴ 3.02 × 10⁻⁴ 2.66 × 10⁻⁴ 2.69 × 10⁻⁴
Total transport 2.01 × 10⁻¹ 2.01 × 10⁻¹ 1.88 × 10⁻¹ 1.89 × 10⁻¹
SMS credits − 7.94 × 10⁻³ − 8.00 × 10⁻³ − 6.75 × 10⁻³ − 7.13 × 10⁻³
Peat emissions 1.29 × 10⁻¹ 1.29 × 10⁻¹ 1.29 × 10⁻¹ 1.29 × 10⁻¹
Total 2.92 2.95 2.13 2.23
Table 2 Non-renewable, renewable, and total primary energy use inmegajoule per kilogram of mushroom product
Inputs Primary energy fromnon-renewableresources (MJ)
Primary energyfromrenewableresources (MJ)
Totalprimaryenergy (MJ)
Electricity 1.02 × 10 6.21 × 10⁻¹ 1.09 × 10
Diesel 3.48 2.85 × 10⁻² 3.51
Natural gas 3.30 1.06 × 10⁻³ 3.31
Heating oil 3.93 3.22 × 10⁻² 3.96
LPG 3.92 × 10⁻¹ 6.33 × 10⁻⁴ 3.93 × 10⁻¹
Compostmaterials
9.28 × 10⁻¹ 5.80 × 10⁻¹ 1.51
Spawn andsupplements
5.83 × 10⁻¹ 4.72 × 10⁻² 6.31 × 10⁻¹
Compostemissions
0 0 0
Peat 2.45 1.75 × 10⁻² 2.46
Growingmaterials
3.83 × 10⁻² 1.61 × 10⁻³ 3.99 × 10⁻²
Refrigerants 4.58 × 10⁻³ 1.88 × 10⁻⁴ 4.77 × 10⁻³
Pesticides 3.20 × 10⁻³ 1.30 × 10⁻⁴ 3.33 × 10⁻³
Sanitizers 3.69 × 10⁻³ 2.52 × 10⁻³ 6.21 × 10⁻³
Total transport 2.51 0 2.51
SMS credits − 7.65 × 10⁻² − 2.76 × 10⁻³ − 7.92 × 10⁻²
Peat emissions 0 0 0
Total (with SMScredits)
2.78 × 10 1.33 2.91 × 10
Total (withoutSMS credits)
2.79 × 10 1.33 2.92 × 10
Int J Life Cycle Assess
3.4 CML impact categories
The CML impact categories considered in this study are pre-sented in Table 4. Electricity has the largest impact of anysingle input on TETP, comprising 43% due to the mercury,arsenic, and chromium released during the combustion offuels, particularly coal. Electricity also comprises 30% of fos-sil ADP as a result of fossil fuel consumption and contributesto AP and POCP mostly through combustion-related sulfurdioxide and nitrogen oxide emissions.
When fuels (diesel, heating oil, natural gas, and LPG) areviewed as one category, they dominate many of the impactcategories. They contribute to HTP by emitting barium andcarcinogenic PAH emissions during combustion and causeMAETP impacts due to barium and hydrogen fluoride emis-sions, also mostly emitted during combustion. FAETP im-pacts are due almost entirely to barium emissions. POCP im-pacts are caused by nitrogen oxides, NMVOC, and carbonmonoxide emissions, also emitted during combustion.
Transportation has the largest single impact on marine andfreshwater aquatic ecotoxicity categories. Composting causesapproximately 48 and 68% of AP and EP, respectively, withcomposting emissions contributing more than half to bothcategories. Compost materials have the largest impact of anysingle input for elements ADP. However, compost materialsprovide a 12% credit to TETP due to chromium uptake in hayproduction. SMS credits are less than 0.3% in all impact cat-egories except elements ADP (2.7%) and MAETP (5.8%).
Leiva et al.’s (2015) study also used CML and were similar,but somewhat higher, for many impact categories. It is diffi-cult to determine the source of these differences given realdifferences in each growing region’s practices and back-ground systems, and modeling differences, such as systemboundary decisions and the choice of emission factors.
4 Discussion
4.1 Opportunities for improvement
Analyzing the inputs or processes of mushroom productionthat cause the greatest impacts can elucidate opportunities forreducing impacts with the least disruption and cost toproducers.
4.1.1 Energy use
Energy consumption either in the form of electricity or directuse of fuels is a significant cause of many impacts of concern.As evident in the results, electricity is the largest contributor tototal primary energy, GWP, freshwater use, fossil, and ele-ments ADP, and is also the second largest contributor toTETP and POCP. In mushroom production, electricity is usedfor climate control or pumping depending on the phase(phases 1, 2, or 3), so increasing energy efficiency or on-siterenewable energy generation could reduce impacts, which isfurther explored through sensitivity analysis in Sect. 4.4. Forexample, data collected fromUSmushroom producers for thisassessment show that a facility can offset 10% of their elec-tricity demand with an on-site biomass gasifier.
During mushroom production, diesel is used mostly forlarge trucks, tractors, and machinery used to mix compostinputs and move compost and peat. Heating oil is used pri-marily in colder regions that rely on generators and diesel-based heat or electricity production. One strategy for reducingemissions could be fuel switching for boilers and other equip-ment. For example, low NOX natural gas boilers could replaceheating oil in boilers or heaters and significantly reduce manycombustion-related emissions (U.S. EPA 2010). Replacingold equipment with more efficient equipment can also reducethe amount of diesel and heating oil used and the consequentemissions from combustion.
4.1.2 Compost emissions
Opportunities for reducing impacts from compost operationsinclude management practices and, where practical, controltechnologies. Turning and aerating compost frequently willprevent anaerobic conditions and can reduce the CH4 andN2O emissions created by the process (Saer et al. 2013). Theuse of biofilters can also substantially reduce compost
Table 3 Total freshwater use in kilograms of water per kilogram ofmushroom product
Inputs Total freshwater use (kg)
Electricity 2.16 × 10²
Diesel 5.59
Natural gas 4.53 × 10⁻¹
Heating oil 6.31
LPG 3.71 × 10⁻¹
Compost materials 3.88 × 10
Spawn and supplements 1.53 × 10
Compost emissions 0
Peat 2.85 × 10⁻¹
Growing materials 7.40 × 10⁻¹
Refrigerants 8.83 × 10⁻²
Pesticides 1.07 × 10⁻³
Sanitizers 1.21 × 10⁻¹
Total transport 0
On-site water use 9.00
SMS credits − 1.18Peat emissions 0
Total (with SMS credits) 2.92 × 10²
Total (no SMS credits) 2.93 × 10²
Int J Life Cycle Assess
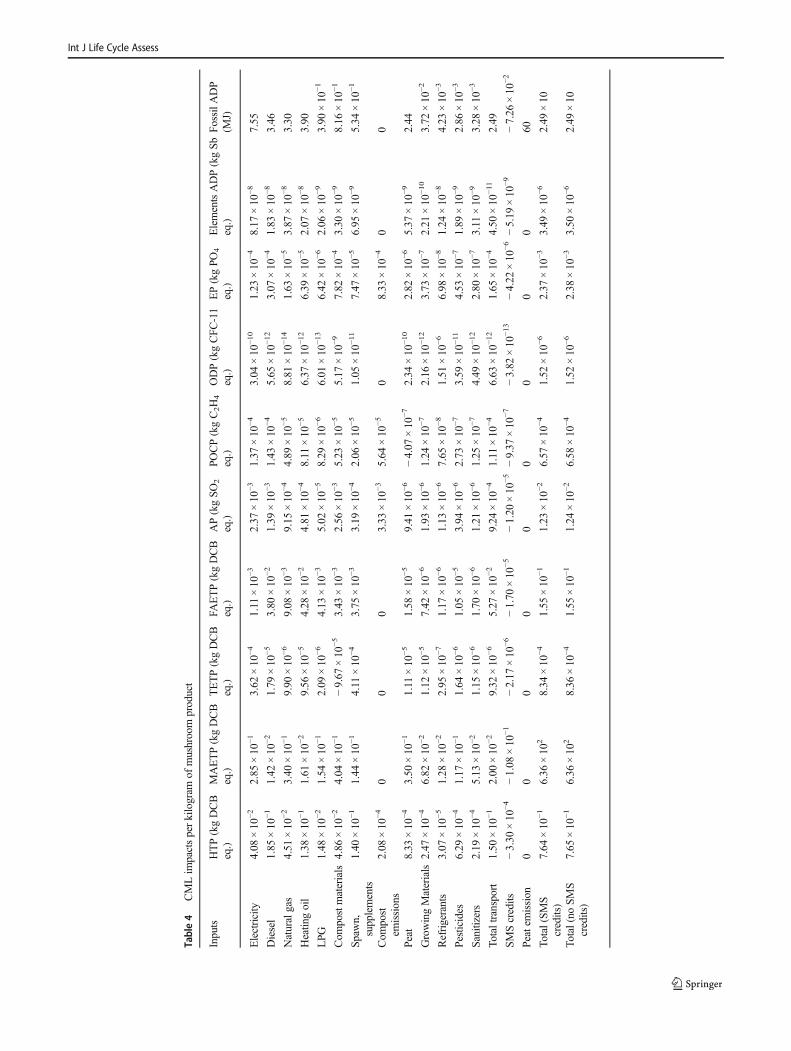
Table4
CMLim
pactsperkilogram
ofmushroom
product
Inputs
HTP(kgDCB
eq.)
MAETP(kgDCB
eq.)
TETP(kgDCB
eq.)
FAETP(kgDCB
eq.)
AP(kgSO
2
eq.)
POCP(kgC2H4
eq.)
ODP(kgCFC
-11
eq.)
EP(kgPO
4
eq.)
ElementsADP(kgSb
eq.)
FossilA
DP
(MJ)
Electricity
4.08
×10
−22.85
×10
−13.62
×10
−41.11
×10
−32.37
×10
−31.37
×10
−43.04
×10
−10
1.23
×10
−48.17
×10
−87.55
Diesel
1.85
×10
−11.42
×10
−21.79
×10
−53.80
×10
−21.39
×10
−31.43
×10
−45.65
×10
−12
3.07
×10
−41.83
×10
−83.46
Naturalgas
4.51
×10
−23.40
×10
−19.90
×10
−69.08
×10
−39.15
×10
−44.89
×10
−58.81
×10
−14
1.63
×10
−53.87
×10
−83.30
Heatin
goil
1.38
×10
−11.61
×10
−29.56
×10
−54.28
×10
−24.81
×10
−48.11
×10
−56.37
×10
−12
6.39
×10
−52.07
×10
−83.90
LPG
1.48
×10
−21.54
×10
−12.09
×10
−64.13
×10
−35.02
×10
−58.29
×10
−66.01
×10
−13
6.42
×10
−62.06
×10
−93.90
×10
−1
Com
postmaterials
4.86
×10
−24.04
×10
−1−9.67
×10
−53.43
×10
−32.56
×10
−35.23
×10
−55.17
×10
−97.82
×10
−43.30
×10
−98.16
×10
−1
Spaw
n,supplements
1.40
×10
−11.44
×10
−14.11
×10
−43.75
×10
−33.19
×10
−42.06
×10
−51.05
×10
−11
7.47
×10
−56.95
×10
−95.34
×10
−1
Com
post
emissions
2.08
×10
−40
00
3.33
×10
−35.64
×10
−50
8.33
×10
−40
0
Peat
8.33
×10
−43.50
×10
−11.11
×10
−51.58
×10
−59.41
×10
−6−4.07
×10
−72.34
×10
−10
2.82
×10
−65.37
×10
−92.44
GrowingMaterials
2.47
×10
−46.82
×10
−21.12
×10
−57.42
×10
−61.93
×10
−61.24
×10
−72.16
×10
−12
3.73
×10
−72.21
×10
−10
3.72
×10
−2
Refrigerants
3.07
×10
−51.28
×10
−22.95
×10
−71.17
×10
−61.13
×10
−67.65
×10
−81.51
×10
−66.98
×10
−81.24
×10
−84.23
×10
−3
Pesticides
6.29
×10
−41.17
×10
−11.64
×10
−61.05
×10
−53.94
×10
−62.73
×10
−73.59
×10
−11
4.53
×10
−71.89
×10
−92.86
×10
−3
Sanitizers
2.19
×10
−45.13
×10
−21.15
×10
−61.70
×10
−61.21
×10
−61.25
×10
−74.49
×10
−12
2.80
×10
−73.11
×10
−93.28
×10
−3
Totaltransport
1.50
×10
−12.00
×10
−29.32
×10
−65.27
×10
−29.24
×10
−41.11
×10
−46.63
×10
−12
1.65
×10
−44.50
×10
−11
2.49
SMScredits
−3.30
×10
−4−1.08
×10
−1−2.17
×10
−6−1.70
×10
−5−1.20
×10
−5−9.37
×10
−7−3.82
×10
−13
−4.22
×10
−6−5.19
×10
−9−7.26
×10
−2
Peatemission
00
00
00
00
060
Total(SMS
credits)
7.64
×10
−16.36
×10
28.34
×10
−41.55
×10
−11.23
×10
−26.57
×10
−41.52
×10
−62.37
×10
−33.49
×10
−62.49
×10
Total(no
SMS
credits)
7.65
×10
−16.36
×10
28.36
×10
−41.55
×10
−11.24
×10
−26.58
×10
−41.52
×10
−62.38
×10
−33.50
×10
−62.49
×10
Int J Life Cycle Assess
emissions such as ammonia (Park et al. 2002; Rosenfeld et al.2004; Sánchez et al. 2015). Some composters have imple-mented biofilter technology, reducing their compost emissionsimpacts. However, biofilter technology is best implementedwith enclosed compost operations; thus, outdoor windrowcomposting cannot benefit from this technology.
4.1.3 Transportation
The transport of peat accounts for 60% of all transport asquantified in units of tonne-kilometers. Waste products thatare used for compost materials account for 12% of transpor-tation emissions. Peat is such a large portion of transportationimpacts because of its transport from the Quebec region ofCanada to locations in the US. Waste product transportationshows significant variability, from an average of 5 mi (forhardwood tree leaves) to 413 mi (for sugar beet lime) away.Straw comes from an average of 206 mi away from facilitiesand is used in such large quantities that it is the third largestcontributor to transportation. Themost effective way to reducethese impacts is to reduce the distance traveled by inputs or touse more efficient modes of transport—namely moving fromtruck to rail when possible. The sources of peat may be limit-ed, so mode-switch is likely the most effective way to reduceimpacts. Straw and waste materials used in compost may pro-vide some opportunities for producers to reduce transport dis-tances by selecting local suppliers when possible.
4.2 Regional variance: Eastern, Central, and Westernregions
The Western region has the lowest GWP impacts and primaryenergy use, followed by the Central and Eastern regions. Thelower GWP intensity in the Western region resulted from dif-ferences in electricity and fuel use. For electricity, two factorsinfluenced the lower GWP. First, and more influential, is thedifference in the electricity grid fuel mix in each region. TheWestern regionmix has more renewables and less coal leadingto lower GWP per megajoule generated (Western ElectricityCoordinating Council 2016). In terms of fuel use and types,the Eastern region consumes heating oil for heating, which noother region consumes, and the Western region uses morenatural gas and less diesel than any other region. Second, theaverage electricity use for the Western region was affected byon-site renewable energy production at one of the Westernregion facilities. The facility uses an on-site biomass gasifica-tion unit to generate electricity, thus reducing the grid electric-ity demand. Peat transport to the Western region (fromCanada) contributed to double the environmental impacts thanpeat transport to the Central region and more than four timesthe impacts than the Eastern region. Total freshwater use isgreatest in the Western region, followed by the Central region(more than three times lower) and the Eastern region (more
than five times lower). These differences are due to differ-ences in water use for grid electricity generation. Regionaldifferences in the types and quantities of compost materialsused, e.g., corn was only used in the Eastern region, are influ-ential and are explored through scenario analysis in Sect. 4.3.
4.3 Differences in compost materials: mulch hayversus wheat straw
Impacts of GWP, primary energy, and the CML categories dif-fer for compost materials between regions. These differencesare mostly due to the use of hay as a compost input in theEastern region, while the Western and Central regions usewheat straw, a co-product from wheat production. Hay is apurpose-grown crop, usually grown for animal feed, so all theimpacts of hay production are attributed to the hay. However,mulch hay, the type of hay used for compost, has only a portionof these impacts due to its lower quality. Wheat is grown pri-marily grain, so wheat straw is a less economically valuable co-product of production, which causes most wheat productionimpacts to be attributed to the grain instead of the straw. Asan illustration of the difference between these two compostmaterials, hay is expected to emit 0.122 kg CO2e/kg hay, whilewheat straw is estimated to emit 0.005 kg CO2e/kg wheat straw.
4.4 Sensitivity analysis: on-site renewable energyproduction in the Eastern region
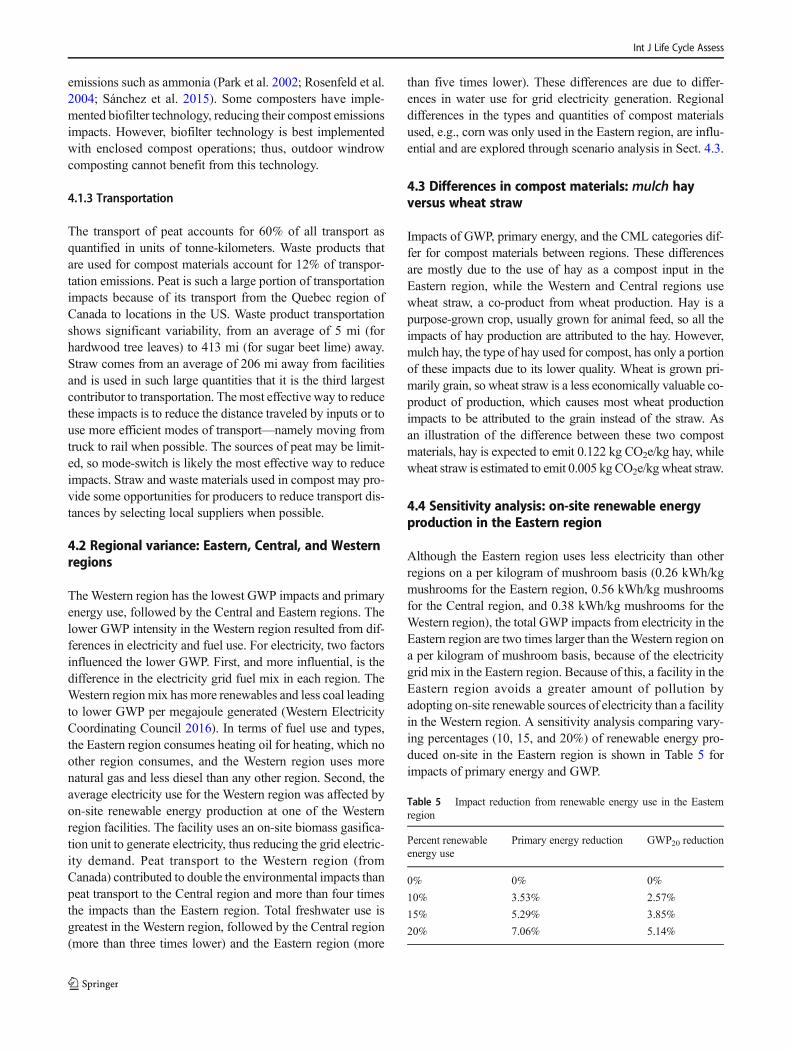
Although the Eastern region uses less electricity than otherregions on a per kilogram of mushroom basis (0.26 kWh/kgmushrooms for the Eastern region, 0.56 kWh/kg mushroomsfor the Central region, and 0.38 kWh/kg mushrooms for theWestern region), the total GWP impacts from electricity in theEastern region are two times larger than theWestern region ona per kilogram of mushroom basis, because of the electricitygrid mix in the Eastern region. Because of this, a facility in theEastern region avoids a greater amount of pollution byadopting on-site renewable sources of electricity than a facilityin the Western region. A sensitivity analysis comparing vary-ing percentages (10, 15, and 20%) of renewable energy pro-duced on-site in the Eastern region is shown in Table 5 forimpacts of primary energy and GWP.
Table 5 Impact reduction from renewable energy use in the Easternregion
Percent renewableenergy use
Primary energy reduction GWP20 reduction
0% 0% 0%
10% 3.53% 2.57%
15% 5.29% 3.85%
20% 7.06% 5.14%
Int J Life Cycle Assess
5 Conclusions
Based on the study results, recommendations are provided tosuggest where improvements can be made within the mushroomproduction system, from resource extraction to facility gate.Mostprocesses within the US mushroom production system are fairlyoptimized for water and waste recycling. Pesticide and sanitizerproduction for the mushroom growing facility are small contrib-utors to total impacts. Energy consumption, comprised of elec-tricity and fuel use, is the most impactful process, and reducingenergy consumption is a lever for reducing emissions and up-stream water consumption. One potential way to reduce energy-related impacts is implementation of alternative on-site energytechnologies, e.g., photovoltaic solar power or biomass power, toreduce dependency on grid-based electricity.
A primary goal of this study was to provide a comprehen-sive LCI of US mushrooms to be used in other LCA studies,such as studies examining meal or diet-level comparisons. Asis common for reference LCIs, results are reported based on afunctional unit of mass. However, a mass basis is not a suffi-cient or satisfactory functional unit for comparative or integra-tive studies. Foods serve many functions, as sources of nutri-tion, or as elements in a single meal or complex diet (both ofwhich are mediated by cultural preferences). Understandingthese functions and creating appropriate comparisons willmake interpretation of these results more useful to consumerand retail audiences, and will provide insights on the dualgoals of improving nutrition and reducing impacts from thefood system. Thus, future work should contextualize themushroom LCA on a nutrition, meal, or diet basis.
Acknowledgements This study was funded by the Mushroom Councilcommodity board of the United States Department of Agriculture (Awardnumber 201602079, PI: Alissa Kendall).
Open Access This article is distributed under the terms of the CreativeCommons At t r ibut ion 4 .0 In te rna t ional License (h t tp : / /creativecommons.org/licenses/by/4.0/), which permits unrestricted use,distribution, and reproduction in any medium, provided you giveappropriate credit to the original author(s) and the source, provide a linkto the Creative Commons license, and indicate if changes were made.
References
Beyer DM (2017) Six steps to mushroom farming. Penn State Extension.Retrieved from https://extension.psu.edu/six-steps-to-mushroom-farming. Accessed 21 April 2017
Cadena E, Colón J, Artola A, Sánchez A, Font X (2009) Environmentalimpact of two aerobic composting technologies using life cycle as-sessment. Int J Life Cycle Assess 14(5):401–410
Cleary J, Roulet NT, Moore TR (2005) Greenhouse gas emissions fromcanadian peat extraction, 1990–2000: a life-cycle analysis. Ambio34(6):456–461
Ecoinvent Center (2016) Ecoinvent version 3 life cycle inventory data-base. Swiss center for life cycle inventories. St Gallen, Switzerland
Fidanza MA, Sanford DL, Beyer DM, Aurentz DJ (2010) Analysis ofFresh Mushroom Compost. HortTechnology 20(2):449–453
Gunady MGA, Biswas W, Solah VA, James AP (2012) Evaluating theglobal warming potential of the fresh produce supply chain forstrawberries, romaine/cos lettuces (Lactuca sativa), and buttonmushrooms (Agaricus bisporus) in Western Australia using life cy-cle assessment (LCA). Journal of Cleaner Production 28:81–87
Hoekstra AY, Mekonnen MM (2012) The water footprint of humanity.Proc Natl Acad Sci 109(9):3232–3237
International Organization for Standardization (2006) ISO 14040:Environmental Management-Life Cycle Assessment-Principlesand Framework
IPCC (1996) Climate change 1995: a report of the intergovernmentalpanel on climate change, Second Assessment Report
IPCC (2007) Climate change 2007: the physical science basis.Contribution of working group I to the fourth assessment report ofthe intergovernmental panel on climate change, Solomon S, Qin D,manning M, Chen Z, marquis M, Averyt KB, Tignor M, miller HL(eds), Cambridge University press, Cambridge, United Kingdomand New York, NY, USA
IPCC (2014) Climate change 2014: synthesis report. Contribution ofworking groups I, II, and III to the fifth assessment report of theintergovernmental panel on climate change. Core writing team,Pachauri RK, Meyer LA (eds), IPCC, Geneva, Switzerland, 151 pp
Leiva FJ, Saenz-Díez JC, Martínez E, Jiménez E, Blanco J (2015)Environmental impact of Agaricus bisporus cultivation process.Eur J Agron 71:141–148
Moore TR, Dalva M (1997) Methane and carbon dioxide exchange po-tentials of peat soils in aerobic and anaerobic laboratory incubations.Soil Biol Biochem 29(8):1157–1164
National Academies of Sciences, Engineering, and Medicine (2016)Pathways to urban sustainability: challenges and opportunities forthe United States. The National Academies Press. Retrieved from,Washington, DC. https://doi.org/10.17226/23551
Park KJ, Choi MH, Hong JH (2002) Control of composting odor usingbiofiltration. Compost Sci Utiliz 10(4):356–362
Peregrina F, Pilar Pérez-Álvarez E, García-Escudero E (2014) Soil mi-crobiological properties and its stratification ratios for soil qualityassessment under different cover crop management systems in asemiarid vineyard. J Plant Nutr Soil Sci 177(4):548–559
Rosenfeld P, GreyM, Sellew P (2004)Measurement of biosolids compostodor emissions from a windrow, static pile, and biofilter. WaterEnviron Res 76(4):310–315
Roy S, Barman S, Chakraborty U, Chakraborty B (2015) Evaluation ofSpent Mushroom Substrate as biofertilizer for growth improvementof Capsicum annuum L. J App Biol Biotech3(3):022–027. https://doi.org/10.7324/JABB.2015.3305
Roy P, Nei D, Orikasa T, Xu Q, Okadome H, Nakamura N, Shiina T(2009) A review of life cycle assessment (LCA) on some food prod-ucts. J Food Eng 90(1):1–10
Royse DJ, Baars J, Tan Q (2016) Current overview of mushroom pro-duction in the world. Edible andMedicinalMushrooms, Technologyand Applications, pp 5–13
Saer A, Lansing S, Davitt NH, Graves RE (2013) Life cycle assessmentof a food waste composting system: environmental impact hotspots.J Clean Prod 52:234–244
Sánchez A, Artola A, Font X, Gea T, Barrena R, Gabriel D, Mondini C(2015) Greenhouse gas from organic waste composting: emissionsand measurement. In: CO2 sequestration, biofuels and depollution.Springer International Publishing, pp 33–70
Thinkstep (2016) Gabi Professional Database. Available at http://www.gabi-software.com/databases/gabi-databases/professional/
United States Department of Agriculture (2016) Basic Report: 11260,Mushrooms, white, raw. In: National Nutrient Database forStandard Reference Release 28
Int J Life Cycle Assess
United States Department of Agriculture (2017) USDA EconomicResearch Service – Yearbook Tables. Retrieved from https://www.ers.usda.gov/data-products/vegetables-and-pulses-data/yearbook-tables/#Supply and Utilization: Fresh Market. Accessed 19June 2017
United States Department of Agriculture, & National AgriculturalStatistics Service (2016) Mushrooms. (ISSN 1949–1530)
United States Department of Agriculture Mushroom Council(2013) Nutritional benefits of mushrooms. Retrieved from
ht tp : / /m.mushroominfo .com/benef i t s / . Accessed 20March 2016
United States Environmental Protection Agency (2010) Available andemerging technologies for reducing greenhouse gas emissions fromindustrial, commercial, and institutional boilers
United States International Trade Commission (2010) Mushrooms:Industry & Trade Summary
Western Electricity Coordinating Council. (2016) 2016 State of theInterconnection
Int J Life Cycle Assess