WEBSITE GB 2010 Presentation April2011
29
www.strabag.com STRABAG SE FY 2010 RESULTS
Transcript of WEBSITE GB 2010 Presentation April2011

www.strabag.com
STRABAG SEFY 2010 RESULTS

2 © STRABAG SE (4/2011)
FULL YEAR
FIGURES
2010
APPENDIX
This presentation has been prepared by STRABAG SE (the "Company") solely for use at investor meetings and is furnished to you solely for your information. This presentation speaks as of April 2011. The facts and information contained herein might be subject to revision in the future. Neither the delivery of this presentation nor any further discussions of the Company with any of the recipients shall, under any circumstances, create any implication that there has been no change in the affairs of the Company since such date. None of the Company or any of its parents or subsidiaries or any of their directors, officers, employees or advisors nor any other person makes any representation or warranty, express or implied as to, and no reliance should be placed on, the accuracy or completeness of the information contained in this presentation. None of the Company or any of its parents or subsidiaries or any of their directors, officers, employees and advisors nor any other person shall have any liability whatsoever for any loss howsoever arising, directly or indirectly, from any use of this presentation. The same applies to information contained in other material made available at the meeting.This document is selective in nature and is intended to provide an introduction to, and overview of, the business of the Company. Where any information and statistics are quoted from any external source, such information or statistics should not be interpreted as having been adopted or endorsed by the Company as being accurate.This presentation contains forward-looking statements relating to the business, financial performance and results of the Company and/or the industry in which the Company operates. These statements generally are identified by words such as "believes," "expects," "predicts," "intends," "projects," "plans," "estimates," "aims," "foresees," "anticipates," "targets," and similar expressions. The forward-looking statements, including but not limited to assumptions, opinions and views of the Company or information from third party sources, contained in this presentation are based on current plans, estimates, assumptions and projections and involve uncertainties and risks. Various factors could cause actual future results, performance or events to differ materially from those described in these statements. The Company does not represent or guarantee that the assumptions underlying such forward-looking statements are free from errors nor do they accept any responsibility for the future accuracy of the opinions expressed in this presentation. No obligation is assumed to update any forward-looking statements.By accepting this presentation you acknowledge that you will be solely responsible for your own assessment of the market and of the market position of the Company and that you will conduct your own analysis and be solely responsible for forming your own view of the potential future performance of the Company's business.
DISCLAIMER

3 © STRABAG SE (4/2011)
FULL YEAR
FIGURES
2010
APPENDIX
STABLE BUSINESS 2010
Output volume (€m)
Output volume 2010 by region
� STRABAG’s strategy fitted the environment
� Output volume quite stable, but long winter depressed Q1
� Revenue at € 12.4 billion only 1% below last year’s level
� Booming construction market in Poland
� Output volume decline in TI segment in Germany and Hungary
� Output volume in BC & CE segment in Germany considerably lower, but higher order intake
� Lack of projects in tunnelling
� Support from new large-scale projects in Northern Europe
� Output volume by region more or less unchanged
Germany
40%
Rest of
Europe
9%
Austria
15%
CEE
30%
Rest of
World
6%
CAGR5%
-2%
10,385 10,746
13,743 13,021
2006 2007 2008 2009 2010
12,777
FULL YEAR
FIGURES
2010
4 © STRABAG SE (4/2011)
FULL YEAR
FIGURES
2010
APPENDIX
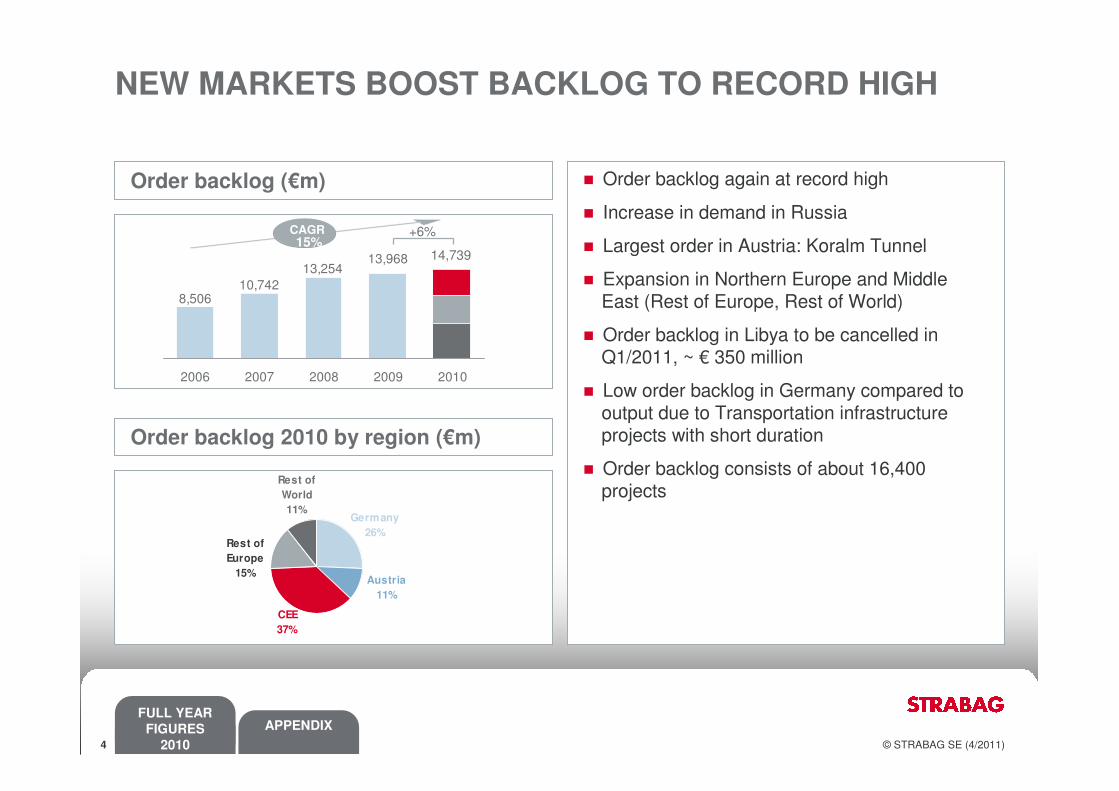
NEW MARKETS BOOST BACKLOG TO RECORD HIGH
Order backlog (€m)
CAGR15%
+6%
13,96813,254
10,7428,506
2006 2007 2008 2009 2010
14,739
� Order backlog again at record high
� Increase in demand in Russia
� Largest order in Austria: Koralm Tunnel
� Expansion in Northern Europe and Middle East (Rest of Europe, Rest of World)
� Order backlog in Libya to be cancelled in Q1/2011, ~ € 350 million
� Low order backlog in Germany compared to output due to Transportation infrastructure projects with short duration
� Order backlog consists of about 16,400 projects
Order backlog 2010 by region (€m)
Germany
26%Rest of
Europe
15%Austria
11%
CEE
37%
Rest of
World
11%
FULL YEAR
FIGURES
2010
5 © STRABAG SE (4/2011)
FULL YEAR
FIGURES
2010
APPENDIX
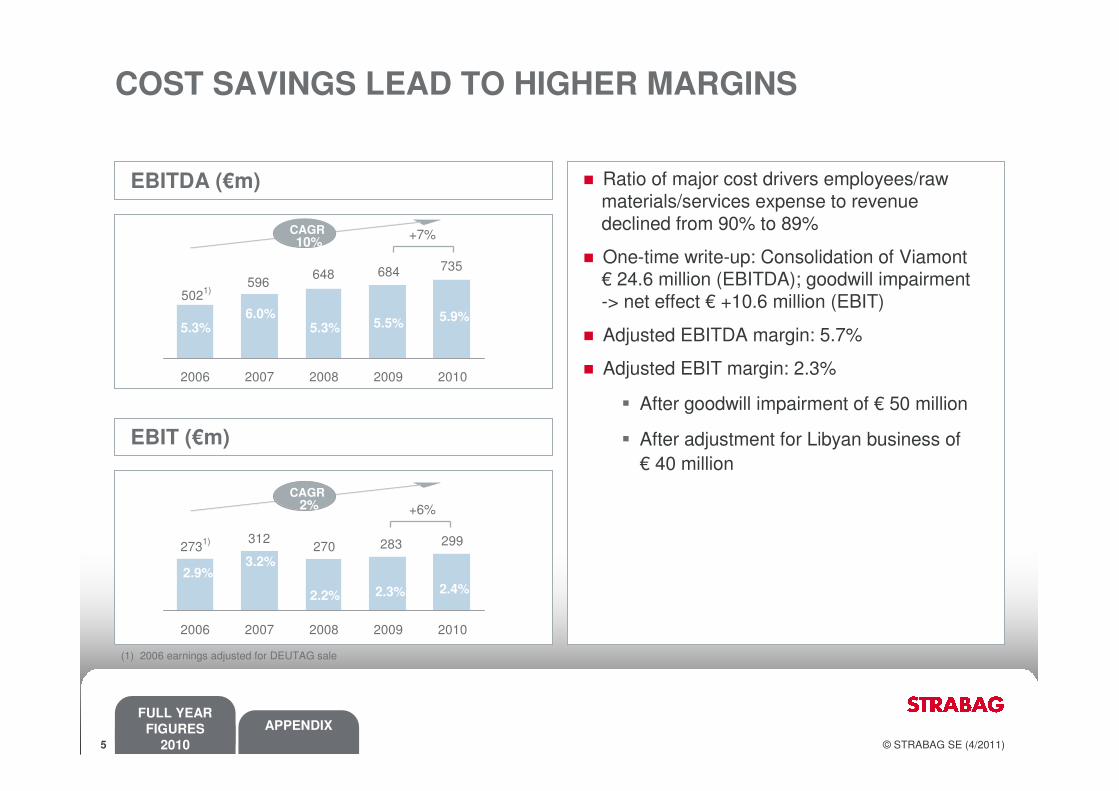
COST SAVINGS LEAD TO HIGHER MARGINS
EBITDA (€m)
CAGR10%
+7%
735684648596
5021)
2006 2007 2008 2009 2010
� Ratio of major cost drivers employees/raw materials/services expense to revenue declined from 90% to 89%
� One-time write-up: Consolidation of Viamont€ 24.6 million (EBITDA); goodwill impairment -> net effect € +10.6 million (EBIT)
� Adjusted EBITDA margin: 5.7%
� Adjusted EBIT margin: 2.3%
� After goodwill impairment of € 50 million
� After adjustment for Libyan business of € 40 million
EBIT (€m)
CAGR2%
299283270312
2731)
2006 2007 2008 2009 2010
+6%
5.3%6.0%
5.3% 5.5%5.9%
2.9%3.2%
2.2% 2.3% 2.4%
(1) 2006 earnings adjusted for DEUTAG sale
FULL YEAR
FIGURES
2010

6 © STRABAG SE (4/2011)
FULL YEAR
FIGURES
2010
APPENDIX
ANALYSTS‘ CONSENSUS EXACTLY MET
Net income after minorities (€m)
CAGR8% +8%
1751611571701281)
2006 2007 2008 2009 2010
� Analysts’ consensus of EPS € 1.53 exactly met
� Interest expense stable: € -20 million
� Tax rate exceptionally high at 32.5%
� Minorities’ share lower because of loss-making international projects undertaken in not wholly-owned subsidiaries
1.4%
1.7%
1.3% 1.3%1.4%
(1) 2006 earnings adjusted for DEUTAG sale
Earnings per share (€)
1.531.421.38
2.051.831)
2006 2007 2008 2009 2010
FULL YEAR
FIGURES
2010
7 © STRABAG SE (4/2011)
FULL YEAR
FIGURES
2010
APPENDIX
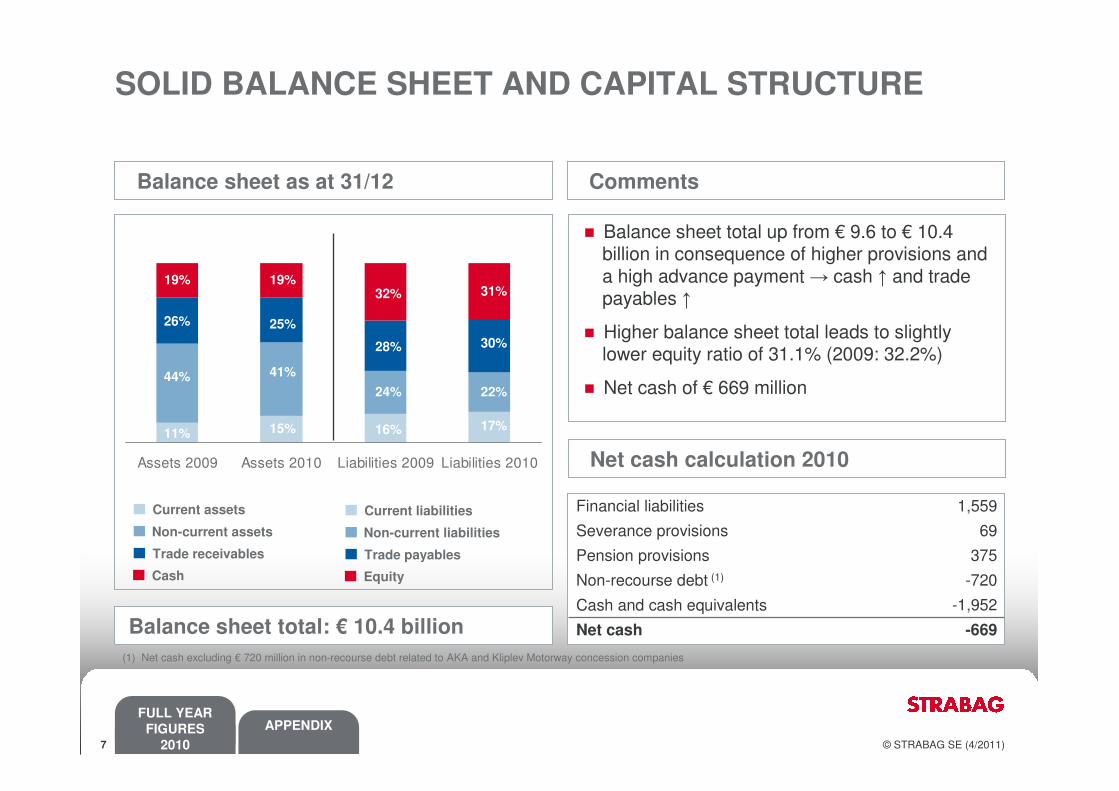
SOLID BALANCE SHEET AND CAPITAL STRUCTURE
Assets 2009 Assets 2010 Liabilities 2009 Liabilities 2010
Balance sheet as at 31/12
� Balance sheet total up from € 9.6 to € 10.4 billion in consequence of higher provisions and a high advance payment → cash ↑ and trade payables ↑
� Higher balance sheet total leads to slightly lower equity ratio of 31.1% (2009: 32.2%)
� Net cash of € 669 million
Balance sheet total: € 10.4 billion
(1) Net cash excluding € 720 million in non-recourse debt related to AKA and Kliplev Motorway concession companies
19%
26%
44%
11%
28%
32%
24%
16%
19%
25%
41%
15%
31%
30%
22%
17%
-669Net cash
-1,952Cash and cash equivalents
-720Non-recourse debt (1)
375Pension provisions
69Severance provisions
1,559Financial liabilities
Net cash calculation 2010
Comments
FULL YEAR
FIGURES
2010
Current assets
Non-current assets
Trade receivables
Cash
Current liabilities
Non-current liabilities
Trade payables
Equity

8 © STRABAG SE (4/2011)
FULL YEAR
FIGURES
2010
APPENDIX
Credit ratingDebt maturities schedule
� S&P confirmed the BBB- rating and stable outlook in December 2010
� access to resources offers a significant competitive advantage
� high order backlog
� solid capital structure
� Investment grade rating since November 2007
� STRABAG SE is one of the few European construction companies with an official rating; aims to preserve this rating
STRONG FINANCIAL BASIS
2011
2012-2015
After 2015
Bonds Bank liabilities
Financial liabilities Other liabilities
€ 620 million
€ 880 million
€ 312 million
� EBIT/net interest: 15.2x
� Cash & surety credit lines (31/12/2010): € 6.2 billion (thereof free cash credit lines of € 0.4 billion)
� Bond issue: € 100 million, 4.25%, 2010-2015
FULL YEAR
FIGURES
2010

9 © STRABAG SE (4/2011)
FULL YEAR
FIGURES
2010
APPENDIX
CommentsCash development (€m)
� CFI includes € 70 million advance payment for Transstroy
� CFF includes proceeds from bond issue of € 100 million, while at the same time the bond issue 2005 of € 75 million was paid back
WORKING CAPITAL REDUCTION LEADS TO HIGHER CASH
Cash
1/1
/2010
CF
O
CF
I
CF
F
Cu
rren
cy
tran
sla
tio
n
Cash
31/1
2/2
010
+1,783
+690
-524 -20
+23 +1,952
CFO: Cash-flow from operating activitiesCFF: Cash-flow from financing activitiesCFI: Cash-flow from investing activities
FULL YEAR
FIGURES
2010

10 © STRABAG SE (4/2011)
FULL YEAR
FIGURES
2010
APPENDIX
CAPEX 2010 (€m)
HIGHER SHARE OF EXPANSION CAPEX
PP&E Acquisitions Financial
assets
554
9 48
� 25% maintenance CAPEX in PP&E, 75% expansion CAPEX in PP&E (last year: 50/50)
� Purchase of PP&E includes ~ € 70 million investment in own cement plant in Hungary
� Gains/losses from sale of non-current assets not deducted from CAPEX
� CAPEX focus on waterway construction, railway construction, and regions Poland and Germany
� 2010 depreciation includes goodwill impairment of € 50 million
CFO vs. CFI (€m) CFI vs. Depreciation (€m)
2008 2009 2010
CFO CFI
2008 2009 2010
CFI Depreciation
690
1,0461,115
437
690524
378 401 436
1,046
437524
FULL YEAR
FIGURES
2010
11 © STRABAG SE (4/2011)
FULL YEAR
FIGURES
2010
APPENDIX
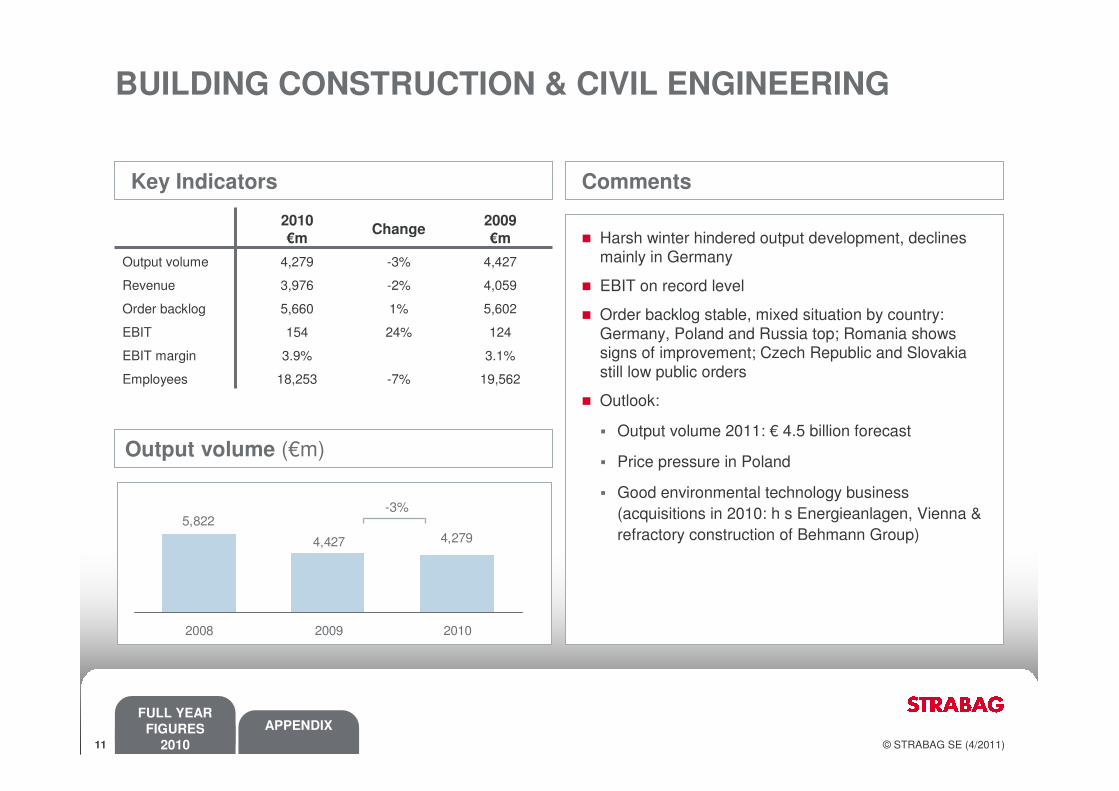
5,822
4,427 4,279
2008 2009 2010
BUILDING CONSTRUCTION & CIVIL ENGINEERING
19,562-7%18,253Employees
3.1%3.9%EBIT margin
12424%154EBIT
5,6021%5,660Order backlog
4,059-2%3,976Revenue
4,427-3%4,279Output volume
2009
€mChange
2010
€m � Harsh winter hindered output development, declines mainly in Germany
� EBIT on record level
� Order backlog stable, mixed situation by country: Germany, Poland and Russia top; Romania shows signs of improvement; Czech Republic and Slovakia still low public orders
� Outlook:
� Output volume 2011: € 4.5 billion forecast
� Price pressure in Poland
� Good environmental technology business (acquisitions in 2010: h s Energieanlagen, Vienna & refractory construction of Behmann Group)
Key Indicators
Output volume (€m)
Comments
-3%
FULL YEAR
FIGURES
2010
12 © STRABAG SE (4/2011)
FULL YEAR
FIGURES
2010
APPENDIX
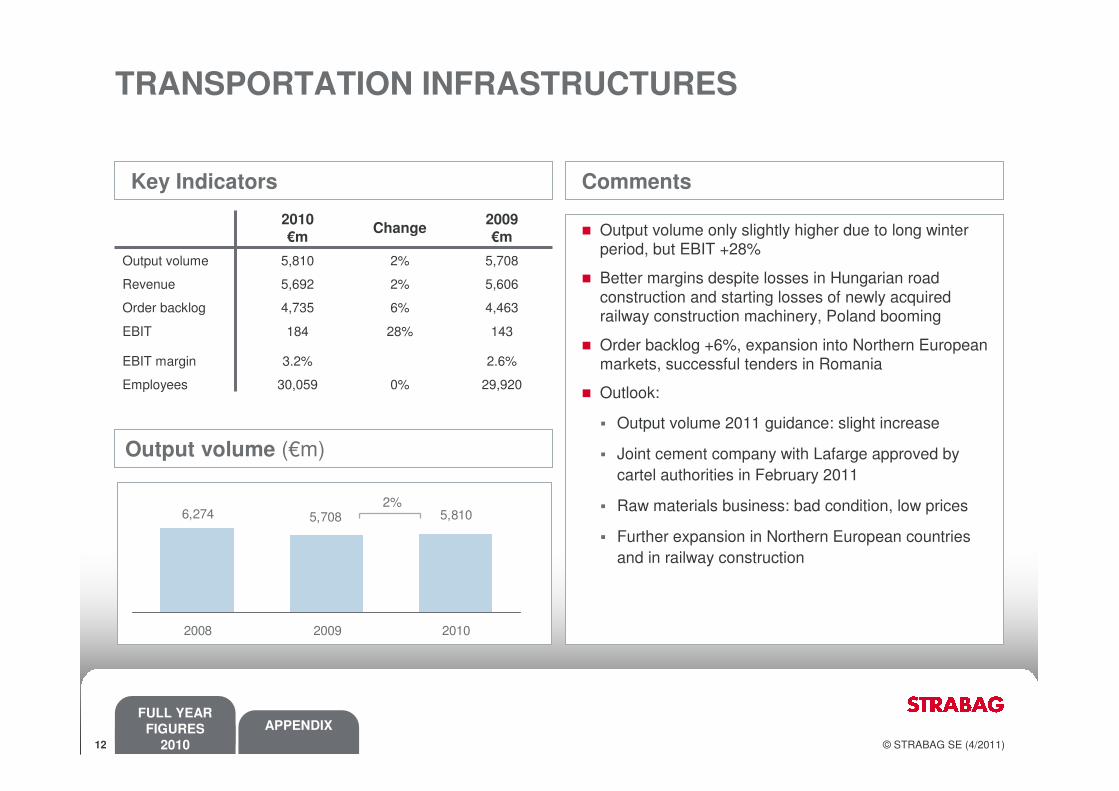
TRANSPORTATION INFRASTRUCTURES
29,9200%30,059Employees
2.6%3.2%EBIT margin
14328%184EBIT
4,4636%4,735Order backlog
5,6062%5,692Revenue
5,7082%5,810Output volume
2009€m
Change2010€m � Output volume only slightly higher due to long winter
period, but EBIT +28%
� Better margins despite losses in Hungarian road construction and starting losses of newly acquired railway construction machinery, Poland booming
� Order backlog +6%, expansion into Northern European markets, successful tenders in Romania
� Outlook:
� Output volume 2011 guidance: slight increase
� Joint cement company with Lafarge approved by cartel authorities in February 2011
� Raw materials business: bad condition, low prices
� Further expansion in Northern European countries and in railway construction
Key Indicators
Output volume (€m)
Comments
6,274 5,708 5,810
2008 2009 2010
2%
FULL YEAR
FIGURES
2010
13 © STRABAG SE (4/2011)
FULL YEAR
FIGURES
2010
APPENDIX
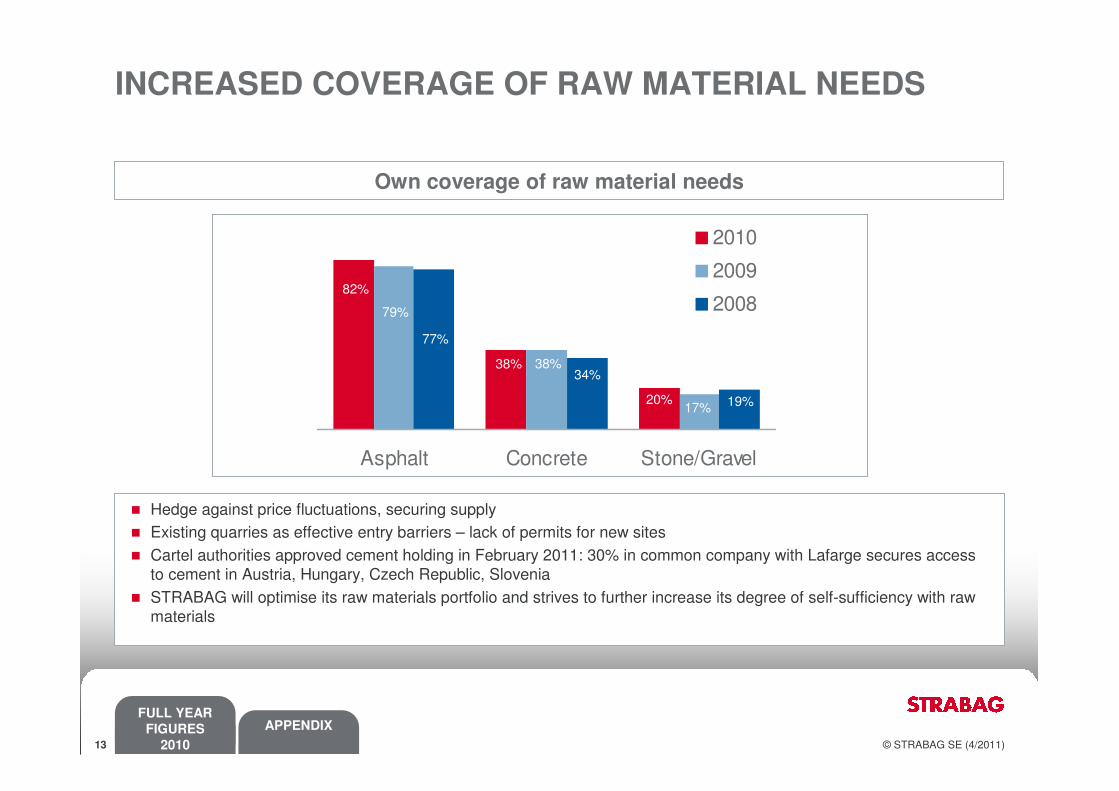
INCREASED COVERAGE OF RAW MATERIAL NEEDS
Own coverage of raw material needs
Asphalt Concrete Stone/Gravel
2010
2009
200879%
38%
17%
77%
34%
19%20%
38%
82%
� Hedge against price fluctuations, securing supply� Existing quarries as effective entry barriers – lack of permits for new sites� Cartel authorities approved cement holding in February 2011: 30% in common company with Lafarge secures access
to cement in Austria, Hungary, Czech Republic, Slovenia� STRABAG will optimise its raw materials portfolio and strives to further increase its degree of self-sufficiency with raw
materials
FULL YEAR
FIGURES
2010

14 © STRABAG SE (4/2011)
FULL YEAR
FIGURES
2010
APPENDIX
Key Indicators
� Output volume fell by 7%, lack of projects and finished large-scale projects in tunnelling in core markets Austria, Germany, Switzerland and Hungary
� EBIT negative due to:
High losses in international projects (e.g. Libya) and tunnelling projects in Hungary and Sweden, which could not be compensated for by good earnings in Poland and in property and facility services
� Order backlog higher due to a number of large orders in PPP, in international markets and due to Koralm Tunnel order in Austria
� Outlook:
� Output volume 2011 expected at € 2.8 billion (+10%)
� Again significantly positive EBIT
Output volume (€m)
Comments
2,5182,716
1,417
FY2008 FY2009 FY2010
20,678-4%19,867Employees
1.2%-0.6%EBIT margin
34n.a.-16EBIT
3,88011%4,318Order backlog
2,850-6%2,672Revenue
2,716-7%2,518Output volume
2009
€mChange
2010
€m
-7%
SPECIAL DIVISIONS & CONCESSIONS
FULL YEAR
FIGURES
2010
15 © STRABAG SE (4/2011)
FULL YEAR
FIGURES
2010
APPENDIX
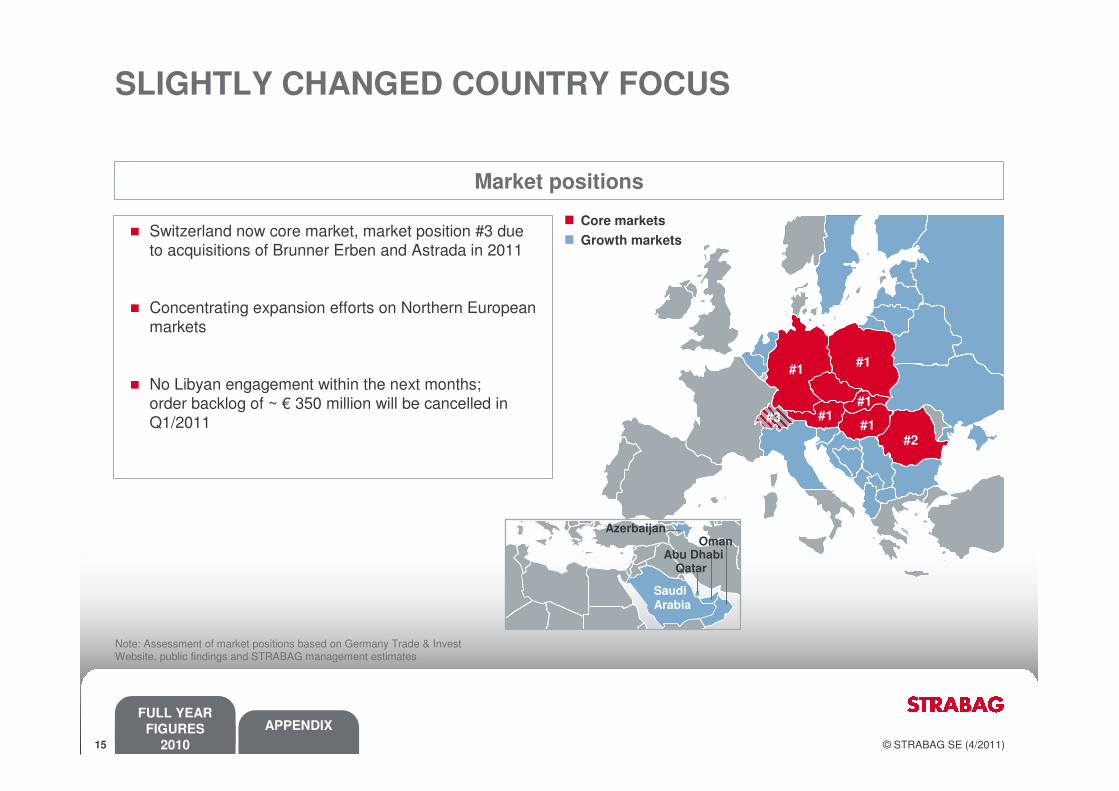
Market positions
Note: Assessment of market positions based on Germany Trade & Invest Website, public findings and STRABAG management estimates
SLIGHTLY CHANGED COUNTRY FOCUS
#1
#1#1
#2
#1
Core markets
Growth markets
SaudiArabia
OmanAbu Dhabi
Qatar
Azerbaijan
#3
#1
� Switzerland now core market, market position #3 due to acquisitions of Brunner Erben and Astrada in 2011
� Concentrating expansion efforts on Northern European markets
� No Libyan engagement within the next months; order backlog of ~ € 350 million will be cancelled in Q1/2011
FULL YEAR
FIGURES
2010

16 © STRABAG SE (4/2011)
FULL YEAR
FIGURES
2010
APPENDIX
INTRODUCING “RANC”
� Lack of infrastructure and huge demand of residential buildings
� Financial resources available
� Russia is the largest construction market in Eastern Europe (~€ 100 billion output volume 2009)
� Annual growth rates forecast to be 3.0% in 2010 and 4.0% in 2011
� Compared to Germany: € 251 billion in 2009 and growth of 3.4% in 2010 and 1.3% 2011
Attractive marketSTRABAG footprint in RANC1)
Sources: Euroconstruct report Russia, Dec 2009, Euroconstruct summary report December 2010, (1) RANC = Russia and neighbouring countries
� Present in Moscow since 1991� Excellent reputation for large sophisticated projects,
STRABAG is positioned as a luxury brand and technology leader
� Order backlog of > € 1.3 billion (Dec. 2010) secures work for at least two years
� 1,740 STRABAG employees in Russia (Dec. 2010)� STRABAG establishes division “RANC” which includes for the
present Russia, Azerbaijan, Ukraine and Lithuania
RANC OUTPUT VOLUME FORECAST 2011: € 450 million
FULL YEAR
FIGURES
2010

17 © STRABAG SE (4/2011)
FULL YEAR
FIGURES
2010
APPENDIX
Infrastructure and Russian neighbouring countries could drive output
� General contractor agreement signed (volume € 350 million) for the construction of the Olympic Village for the 2014 Winter Games in Sochi
� STRABAG made a € 70 million advance payment for a 26% share in the Russian infrastructure construction leader Transstroy (part of Basic Element)
� Due diligence by October 2012
� Public clients
� Entry into Russian neighbouring countries in 2009
� Hotel projects in Azerbaijan
� First projects in Ukraine
� Only private clients
� Cost + fee projects
� Large residential buildings, hotels, industrial construction
STRABAG’s GROWTH STRATEGY IN RANC
Sochi
~ € 200 million
Infrastructure
€ 400 millionBasic output in BC & CE
FULL YEAR
FIGURES
2010

18 © STRABAG SE (4/2011)
FULL YEAR
FIGURES
2010
APPENDIX
� Top 10 free float shareholders represent 5.3%
� Rasperia holds the option to buy an additional 8% STRABAG SE stake from Haselsteiner, Raiffeisen and UNIQA Group
Shareholder Structure
STABLE SHAREHOLDER STRUCTURE AND DIVIDEND
23.0%Free Float
29.5%Haselsteiner Group
15.5%Raiffeisen Group15.0%
UNIQA Group
17.0%Rasperia Trading
Dividend
� Dividend policy: Payout ratio of 30%–50% of net income after minorities
� Stable dividend payments despite challenging economic environment
0.55 0.550.50
0.55
0,000,100,200,300,400,500,60
2007 2008 2009 2010
32
34
36
38
40
42
Dividend per share Payout ratio
37%
40%
35%36%
FULL YEAR
FIGURES
2010
19 © STRABAG SE (4/2011)
FULL YEAR
FIGURES
2010
APPENDIX
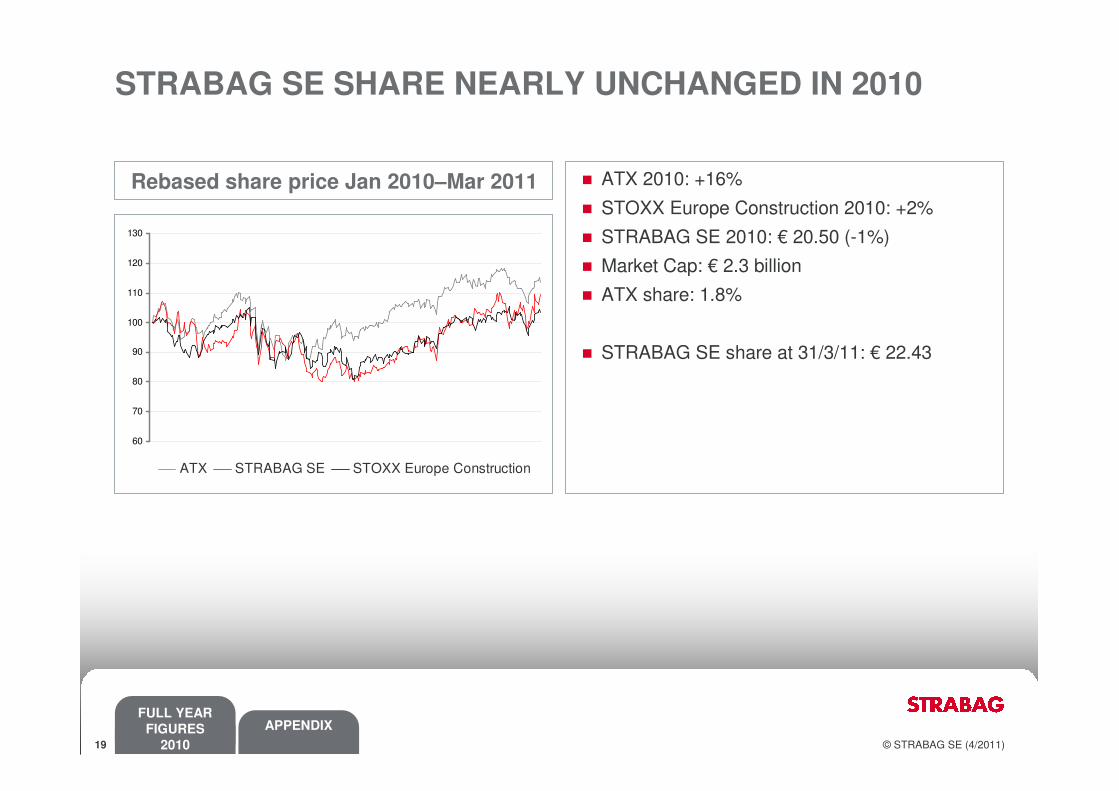
� ATX 2010: +16%
� STOXX Europe Construction 2010: +2%
� STRABAG SE 2010: € 20.50 (-1%)
� Market Cap: € 2.3 billion
� ATX share: 1.8%
� STRABAG SE share at 31/3/11: € 22.43
Rebased share price Jan 2010–Mar 2011
STRABAG SE SHARE NEARLY UNCHANGED IN 2010
60
70
80
90
100
110
120
130
ATX STRABAG SE STOXX Europe Construction
FULL YEAR
FIGURES
2010
20 © STRABAG SE (4/2011)
FULL YEAR
FIGURES
2010
APPENDIX
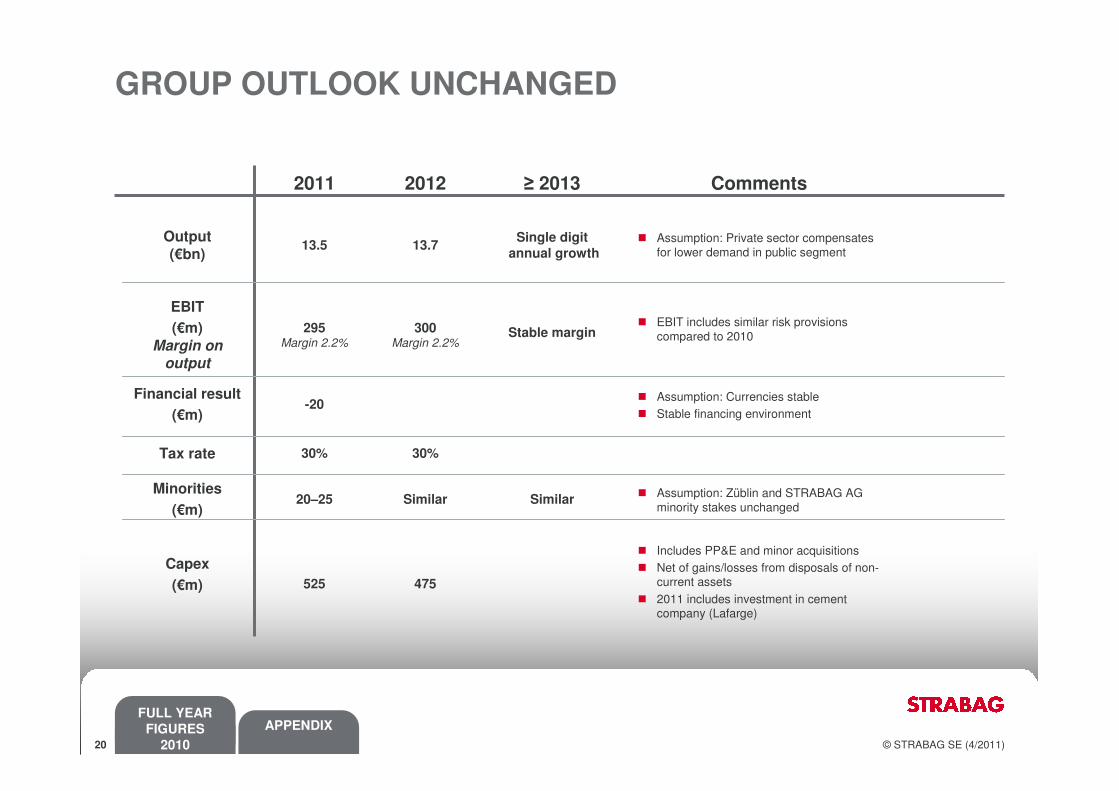
GROUP OUTLOOK UNCHANGED
� Assumption: Currencies stable� Stable financing environment
-20Financial result
(€m)
� Assumption: Züblin and STRABAG AG minority stakes unchanged
SimilarSimilar20–25Minorities
(€m)
30%30%Tax rate
� Includes PP&E and minor acquisitions� Net of gains/losses from disposals of non-
current assets� 2011 includes investment in cement
company (Lafarge)
475525
Capex
(€m)
300Margin 2.2%
13.7
2012
� EBIT includes similar risk provisions compared to 2010Stable margin295
Margin 2.2%
EBIT
(€m)
Margin on
output
� Assumption: Private sector compensates for lower demand in public segment
Single digit
annual growth13.5
Output
(€bn)
Comments≥ 20132011
FULL YEAR
FIGURES
2010

21 © STRABAG SE (4/2011)
FULL YEAR
FIGURES
2010
APPENDIX
APPENDIX

22 © STRABAG SE (4/2011)
FULL YEAR
FIGURES
2010
APPENDIX
KEY FIGURE: OUTPUT VOLUME BY COUNTRY
Output volume 2007 2008 2009 2010 CAGRGermany 3,802 5,096 5,380 5,051 10%Austria 2,114 2,270 1,981 1,907 -3%Poland 714 889 993 1,352 24%Czech Republic 864 975 786 867 0%Hungary 614 842 832 580 -2%Slovakia 371 558 480 427 5%Switzerland 346 429 378 370 2%Middle East 316 490 350 295 -2%Benelux 248 182 221 284 5%Russia 259 476 282 251 -1%Scandinavia 49 188 199 248 71%Americas 111 118 161 246 31%Romania 191 273 161 165 -5%Africa 145 183 168 136 -2%Italy 47 181 108 128 40%Other European Countries 125 157 140 128 1%Asia 114 89 84 126 3%Croatia 160 178 149 92 -17%Serbia 43 46 37 45 2%Slovenia 49 53 67 43 -4%Bulgaria 36 28 35 36 1%Ireland 30 40 28 0 -100%Output volume total 10,746 13,743 13,021 12,777 6%
APPENDIX

23 © STRABAG SE (4/2011)
FULL YEAR
FIGURES
2010
APPENDIX
2010 2009 % CHANGE
Output Volume 12,777.0 13,021.0 (2%)
Revenue 12,381.5 12,551.9 (1%)
Changes in inv./own work capitalised 80.0 81.1 (1%)
Other operating income 275.2 258.2 7%
Materials and services cost (8,218.4) (8,446.9) (3%)
Personnel cost (2,800.9) (2,823.3) (1%)
Other operating expenses (1,030.2) (932.9) 10%
Income from associates 32.4 (12.7) n.m.
Investment income 15.1 8.8 71%
EBITDA 734.7 684.2 7%
Margin (%) 5.9% 5.5%
(€m)
GROUP P&L 2010
% change was calculated with original, not rounded figures � therefore, rounding differences may occur.
APPENDIX
24 © STRABAG SE (4/2011)
FULL YEAR
FIGURES
2010
APPENDIX
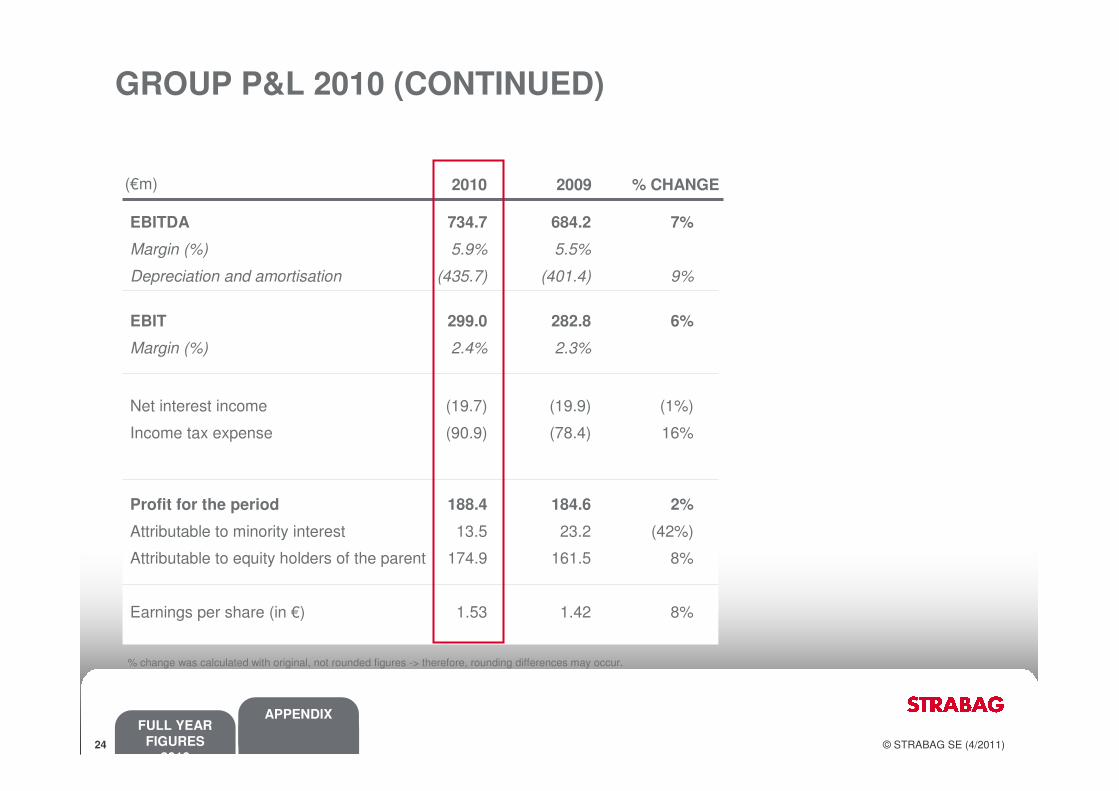
EBITDA 734.7 684.2 7%
Margin (%) 5.9% 5.5%
Depreciation and amortisation (435.7) (401.4) 9%
EBIT 299.0 282.8 6%
Margin (%) 2.4% 2.3%
Net interest income (19.7) (19.9) (1%)
Income tax expense (90.9) (78.4) 16%
Profit for the period 188.4 184.6 2%
Attributable to minority interest 13.5 23.2 (42%)
Attributable to equity holders of the parent 174.9 161.5 8%
Earnings per share (in €) 1.53 1.42 8%
2010 2009 % CHANGE(€m)
GROUP P&L 2010 (CONTINUED)
% change was calculated with original, not rounded figures -> therefore, rounding differences may occur.
APPENDIX

25 © STRABAG SE (4/2011)
FULL YEAR
FIGURES
2010
APPENDIX
Assets(1)
(€m) 2007 2008 2009 2010
Share capital 114 114 114 114Capital reserves 2,311 2,311 2,311 2,311Retained earnings 445 412 525 666Minority interest 226 141 149 141
Equity 3,096 2,979 3,099 3,232
Provisions 626 847 868 928Financial liabilities 485 1,434 1,275 1,318Other non-current liab. 37 41 109 68Deferred taxes 21 74 54 49
Non-current liab. 1,168 2,396 2,305 2,363
Provisions 448 538 580 711Financial liabilities 199 274 235 241Trade payables 2,276 2,765 2,635 3,068Other current liab. 553 813 759 767
Current liabilities 3,476 4,390 4,209 4,786
Intangible assets 240 463 496 536PP&E(2) 1,693 2,188 2,260 2,176Associated companies 139 156 132 88Other financial assets 224 265 241 257Concession receivables 0 973 939 969Other long-term rec. 81 111 100 105Deferred taxes 94 138 134 214
Non-current assets 2,470 4,294 4,300 4,345
Inventories 477 674 656 706Accounts Receivables 2,828 3,305 2,874 3,147Cash and cash equivalents 1,966 1,491 1,783 1,952Assets held for sale - - - 232
Current assets 5,271 5,471 5,313 6,037
BALANCE SHEET 31 DECEMBER 2010
Total assets 7,741 9,765 9,614 10,382
(1) Rounding differences might occur. (2) PP&E + investment property
(€m) 2007 2008 2009 2010
Liabilities & equity 7,741 9,765 9,614 10,382
Liabilities and Equity(1)
APPENDIX

26 © STRABAG SE (4/2011)
FULL YEAR
FIGURES
2010
APPENDIX
WORKING CAPITAL REDUCTION DUE TO LARGE ADVANCE PAYMENT
20%
-100%
-164%
299%
-58%
62%
326%
14%
-24%
∆ %
1,952
23
147
-20
-524
690
169
521
1,783
2010
€m
-97-386-95%CFF
-1,046-43720%CFI
6901,115-38%CFO
1,4911,78310%Cash – end of period
-210100%FX changes
-453292-50%Net change in cash
154502-66%∆ Working Capital
536613-15%Cash-flow from profits
1,9661,49120%Cash – beginning of period
2008
€m
2009
€m∆ %
APPENDIX

27 © STRABAG SE (4/2011)
FULL YEAR
FIGURES
2010
APPENDIX
1. STRABAG 993
2. Polimex-Mostostal 986
3. Grupa Skanska Polska 695
4. Budimex 663
5. Mostostal Warszawa 630
1. STRABAG 1,266
2. Skanska 1,185
3. Eurovia 930
4. Doprastav 302
5. OHS ZS 215
1. Implenia 1,774
2. Marti 700
3. STRABAG 615
4. Walo 510
5. Frutiger 470
1. STRABAG 1,981
2. Porr Group 1,788
3. Alpine Bau 1,602
4. Swietelsky 700
5. Habau 570
1. STRABAG 832
2. Colas-Hungária 434
3. Vegyépszer 256
4. Hidépétö 252
5. Market Épitö 252
MARKET LEADING POSITION IN CENTRAL AND EASTERN EUROPEAN COUNTRIES
Source: www.gtai.de and Annual Reports* Data from www.brainworker.ch and STRABAG estimates; Retrospective market position taking into account companies acquired in early 2011.
Western Europe Eastern Europe
GERMANY HUNGARY CZECH REPUBLIC / SLOVAKIA
AUSTRIA POLAND SWITZERLAND
Revenue 09 (€m) Revenue 09 (€m) Revenue 09 (€m)
Revenue 09 (€m) Revenue 09 (€m) Revenue 09 (€m)*
1. STRABAG 5,380
2. Bilfinger Berger 3,330
3. Hochtief 2,284
4. Vinci/Eurovia Germany 1,821
5. Bauer 1,097
APPENDIX

28 © STRABAG SE (4/2011)
FULL YEAR
FIGURES
2010
APPENDIX
0.9%
Source: Euroconstruct December 2010, company data; Germany Trade & Invest* Retrospective market share taking into account companies acquired in early 2011
MARKET SHARES IN 2010
Total construction market share
Market share in road construction
2.1% 9.4%8.8%2.7%
7.0% 14.5%
9.5%3.9%
20.7%8.4%
1.15%
16.2%8.7%
1.6%* 1.1%
APPENDIX

www.strabag.com