The Price is Right? - jblumenstock · The Price is Right? ... set of consumption items and...
9
The Price is Right? Statistical evaluation of a crowd-sourced market information system in Liberia Joshua E. Blumenstock University of Washington Information School Seattle, WA [email protected] Niall Keleher University of Washington Information School Seattle, WA [email protected] ABSTRACT Many critical policy decisions depend upon reliable and up-to-date information on market prices. Such data are used to construct con- sumer price indices, measure inflation, detect food insecurity, and influence macroeconomic policy. In developing countries, where many of these problems are most acute, reliable market price in- formation can be hard to come by. Here, we evaluate data from Premise, a new technology for measuring price information using crowd-sourced data contributed by local citizens. Our evaluation focuses on Liberia, a country with a history of economic and po- litical instability. Using data from Premise, which recently began data collection in Liberia, we analyze tens of thousands of individ- ual price observations collected at hundreds of different locations in Monrovia. We illustrate how these data can be used to construct composite market price indices, and compare these constructed in- dices and prices for individual products to “ground truth” data from the Central Bank of Liberia and the United Nations World Food Programme. Our results indicate that the crowd-sourced price data correlates well with traditional price indices. However, we find sta- tistically and economically significant deviations from traditional measures that require deeper investigation. We conclude by dis- cussing how indices based on Premise data can be further improved with simple supervised learning methods that use traditional low- frequency data to calibrate and cross-validate the high-frequency Premise-based indices. Categories and Subject Descriptors J.4 [Computer Applications]: Social and Behavioral Sciences; G.3 [Mathematics of Computing]: Probability and Statistics General Terms Human Factors, Measurement, Economics, Algorithms Keywords Consumer price index; premise; crowd-sourcing; ICTD Permission to make digital or hard copies of all or part of this work for personal or classroom use is granted without fee provided that copies are not made or distributed for profit or commercial advantage and that copies bear this notice and the full citation on the first page. Copyrights for components of this work owned by others than the author(s) must be honored. Abstracting with credit is permitted. To copy otherwise, or republish, to post on servers or to redistribute to lists, requires prior specific permission and/or a fee. Request permissions from [email protected]. ACM DEV (2015), December 01–02, 2015, London, United Kingdom. Copyright is held by the owner/author(s). Publication rights licensed to ACM. ACM 978-1-4503-3490-7/15/11 ...$15.00. http://dx.doi.org/10.1145/2830629.2830647 1. INTRODUCTION AND MOTIVATION The Consumer Price Index (CPI) is one of the most important eco- nomic statistics used by policymakers to determine macroeconomic policy and to evaluate the health of an economy [17]. It is the pri- mary barometer for measuring inflation, which in turn impacts both fiscal and monetary policy; it is used to calculate purchasing power and determine exchange rates; it also directly impacts wages and welfare payments in both the private and public sector. The CPI is intended to capture the overall cost of goods and ser- vices paid for by a typical individual at local markets. It requires two primary inputs: the “basket of goods" that is intended to be representative of a typical consumer; and the price for each of the goods in the basket. Prices of goods in the common basket are the focus of this paper. In developed economies, consumer price data are typically obtained from a variety of sources, including supermarkets, service loca- tions, and online retailers [4]. In the United States, for instance, “Bureau of Labor Statistics data collectors visit or call thousands of retail stores, service establishments, rental units, and doctors’ of- fices, all over the United States, to obtain information on the prices of the thousands of items used to track and measure price changes in the CPI." 1 In developing economies, where most transactions are analog and the national statistical offices are more resource- constrained, there are fewer sources of accurate and up-to-date mar- ket price information [6, 15]. The lack of reliable and up-to-date price information is particu- larly problematic in fragile economies, where dependence on sub- sistence agriculture and the lack of insurance and other social safety nets can exacerbate the welfare impacts of weather shocks, political instability, and food insecurity as mediated through price changes. In Liberia and neighboring countries, for instance, food prices have been one of the primary instruments used in assessing the economic impacts of the recent Ebola outbreak [21, 11, 14]. Here, we investigate a new technology for collecting price informa- tion in developing countries, which relies on “crowd-sourced" ob- servations collected by local citizens with mobile phones. We focus on Premise, a technology platform that allows for mobile-equipped citizens to capture and upload price information to a central service. This technology, described in greater detail in Section 3.1, is similar to a small number of related platforms that enable crowd-sourced data collection in developing countries. The mClerk [12] and tx- tEagle [7] platforms are the most directly comparable systems of 1 http://stats.bls.gov/cpi/cpifaq.htm#Question_8, ac- cessed July 2015
-
Upload
nguyentruc -
Category
Documents
-
view
214 -
download
0
Transcript of The Price is Right? - jblumenstock · The Price is Right? ... set of consumption items and...
The Price is Right?
Statistical evaluation of a crowd-sourced market information system in Liberia
Joshua E. BlumenstockUniversity of Washington
Information SchoolSeattle, WA
Niall KeleherUniversity of Washington
Information SchoolSeattle, WA
ABSTRACTMany critical policy decisions depend upon reliable and up-to-dateinformation on market prices. Such data are used to construct con-sumer price indices, measure inflation, detect food insecurity, andinfluence macroeconomic policy. In developing countries, wheremany of these problems are most acute, reliable market price in-formation can be hard to come by. Here, we evaluate data fromPremise, a new technology for measuring price information usingcrowd-sourced data contributed by local citizens. Our evaluationfocuses on Liberia, a country with a history of economic and po-litical instability. Using data from Premise, which recently begandata collection in Liberia, we analyze tens of thousands of individ-ual price observations collected at hundreds of different locationsin Monrovia. We illustrate how these data can be used to constructcomposite market price indices, and compare these constructed in-dices and prices for individual products to “ground truth” data fromthe Central Bank of Liberia and the United Nations World FoodProgramme. Our results indicate that the crowd-sourced price datacorrelates well with traditional price indices. However, we find sta-tistically and economically significant deviations from traditionalmeasures that require deeper investigation. We conclude by dis-cussing how indices based on Premise data can be further improvedwith simple supervised learning methods that use traditional low-frequency data to calibrate and cross-validate the high-frequencyPremise-based indices.
Categories and Subject DescriptorsJ.4 [Computer Applications]: Social and Behavioral Sciences;G.3 [Mathematics of Computing]: Probability and Statistics
General TermsHuman Factors, Measurement, Economics, Algorithms
KeywordsConsumer price index; premise; crowd-sourcing; ICTD
Permission to make digital or hard copies of all or part of this work for personal orclassroom use is granted without fee provided that copies are not made or distributedfor profit or commercial advantage and that copies bear this notice and the full citationon the first page. Copyrights for components of this work owned by others than theauthor(s) must be honored. Abstracting with credit is permitted. To copy otherwise, orrepublish, to post on servers or to redistribute to lists, requires prior specific permissionand/or a fee. Request permissions from [email protected] DEV (2015), December 01–02, 2015, London, United Kingdom.Copyright is held by the owner/author(s). Publication rights licensed to ACM.ACM 978-1-4503-3490-7/15/11 ...$15.00.http://dx.doi.org/10.1145/2830629.2830647
1. INTRODUCTION AND MOTIVATIONThe Consumer Price Index (CPI) is one of the most important eco-nomic statistics used by policymakers to determine macroeconomicpolicy and to evaluate the health of an economy [17]. It is the pri-mary barometer for measuring inflation, which in turn impacts bothfiscal and monetary policy; it is used to calculate purchasing powerand determine exchange rates; it also directly impacts wages andwelfare payments in both the private and public sector.
The CPI is intended to capture the overall cost of goods and ser-vices paid for by a typical individual at local markets. It requirestwo primary inputs: the “basket of goods" that is intended to berepresentative of a typical consumer; and the price for each of thegoods in the basket. Prices of goods in the common basket are thefocus of this paper.
In developed economies, consumer price data are typically obtainedfrom a variety of sources, including supermarkets, service loca-tions, and online retailers [4]. In the United States, for instance,“Bureau of Labor Statistics data collectors visit or call thousandsof retail stores, service establishments, rental units, and doctors’ of-fices, all over the United States, to obtain information on the pricesof the thousands of items used to track and measure price changesin the CPI."1 In developing economies, where most transactionsare analog and the national statistical offices are more resource-constrained, there are fewer sources of accurate and up-to-date mar-ket price information [6, 15].
The lack of reliable and up-to-date price information is particu-larly problematic in fragile economies, where dependence on sub-sistence agriculture and the lack of insurance and other social safetynets can exacerbate the welfare impacts of weather shocks, politicalinstability, and food insecurity as mediated through price changes.In Liberia and neighboring countries, for instance, food prices havebeen one of the primary instruments used in assessing the economicimpacts of the recent Ebola outbreak [21, 11, 14].
Here, we investigate a new technology for collecting price informa-tion in developing countries, which relies on “crowd-sourced" ob-servations collected by local citizens with mobile phones. We focuson Premise, a technology platform that allows for mobile-equippedcitizens to capture and upload price information to a central service.This technology, described in greater detail in Section 3.1, is similarto a small number of related platforms that enable crowd-sourceddata collection in developing countries. The mClerk [12] and tx-tEagle [7] platforms are the most directly comparable systems of
1http://stats.bls.gov/cpi/cpifaq.htm#Question_8, ac-cessed July 2015
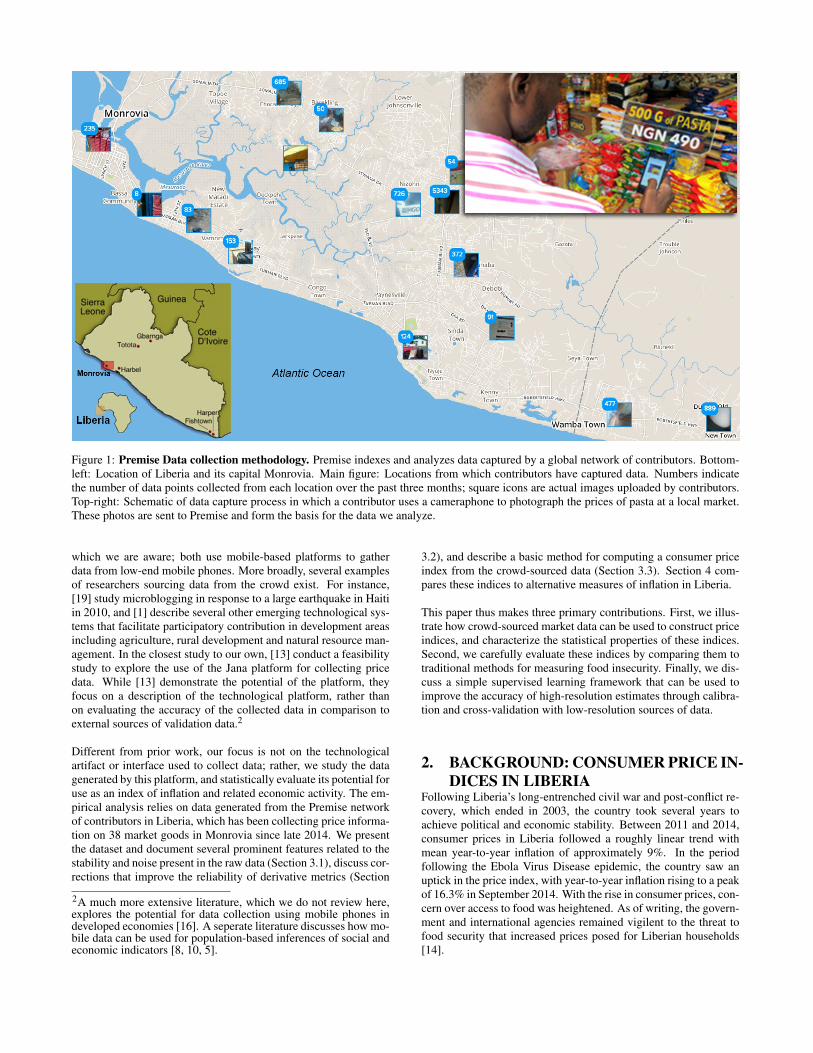
Figure 1: Premise Data collection methodology. Premise indexes and analyzes data captured by a global network of contributors. Bottom-left: Location of Liberia and its capital Monrovia. Main figure: Locations from which contributors have captured data. Numbers indicatethe number of data points collected from each location over the past three months; square icons are actual images uploaded by contributors.Top-right: Schematic of data capture process in which a contributor uses a cameraphone to photograph the prices of pasta at a local market.These photos are sent to Premise and form the basis for the data we analyze.
which we are aware; both use mobile-based platforms to gatherdata from low-end mobile phones. More broadly, several examplesof researchers sourcing data from the crowd exist. For instance,[19] study microblogging in response to a large earthquake in Haitiin 2010, and [1] describe several other emerging technological sys-tems that facilitate participatory contribution in development areasincluding agriculture, rural development and natural resource man-agement. In the closest study to our own, [13] conduct a feasibilitystudy to explore the use of the Jana platform for collecting pricedata. While [13] demonstrate the potential of the platform, theyfocus on a description of the technological platform, rather thanon evaluating the accuracy of the collected data in comparison toexternal sources of validation data.2
Different from prior work, our focus is not on the technologicalartifact or interface used to collect data; rather, we study the datagenerated by this platform, and statistically evaluate its potential foruse as an index of inflation and related economic activity. The em-pirical analysis relies on data generated from the Premise networkof contributors in Liberia, which has been collecting price informa-tion on 38 market goods in Monrovia since late 2014. We presentthe dataset and document several prominent features related to thestability and noise present in the raw data (Section 3.1), discuss cor-rections that improve the reliability of derivative metrics (Section
2A much more extensive literature, which we do not review here,explores the potential for data collection using mobile phones indeveloped economies [16]. A seperate literature discusses how mo-bile data can be used for population-based inferences of social andeconomic indicators [8, 10, 5].
3.2), and describe a basic method for computing a consumer priceindex from the crowd-sourced data (Section 3.3). Section 4 com-pares these indices to alternative measures of inflation in Liberia.
This paper thus makes three primary contributions. First, we illus-trate how crowd-sourced market data can be used to construct priceindices, and characterize the statistical properties of these indices.Second, we carefully evaluate these indices by comparing them totraditional methods for measuring food insecurity. Finally, we dis-cuss a simple supervised learning framework that can be used toimprove the accuracy of high-resolution estimates through calibra-tion and cross-validation with low-resolution sources of data.
2. BACKGROUND: CONSUMER PRICE IN-DICES IN LIBERIA
Following Liberia’s long-entrenched civil war and post-conflict re-covery, which ended in 2003, the country took several years toachieve political and economic stability. Between 2011 and 2014,consumer prices in Liberia followed a roughly linear trend withmean year-to-year inflation of approximately 9%. In the periodfollowing the Ebola Virus Disease epidemic, the country saw anuptick in the price index, with year-to-year inflation rising to a peakof 16.3% in September 2014. With the rise in consumer prices, con-cern over access to food was heightened. As of writing, the govern-ment and international agencies remained vigilent to the threat tofood security that increased prices posed for Liberian households[14].
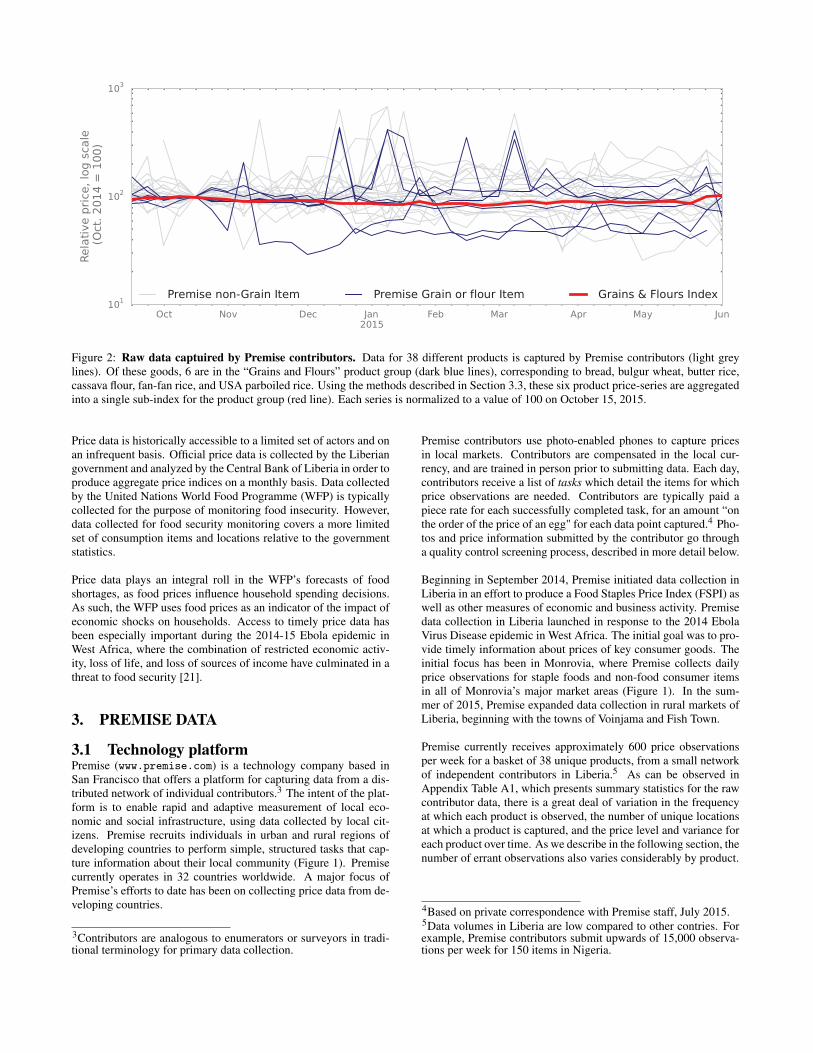
Figure 2: Raw data captuired by Premise contributors. Data for 38 different products is captured by Premise contributors (light greylines). Of these goods, 6 are in the “Grains and Flours” product group (dark blue lines), corresponding to bread, bulgur wheat, butter rice,cassava flour, fan-fan rice, and USA parboiled rice. Using the methods described in Section 3.3, these six product price-series are aggregatedinto a single sub-index for the product group (red line). Each series is normalized to a value of 100 on October 15, 2015.
Price data is historically accessible to a limited set of actors and onan infrequent basis. Official price data is collected by the Liberiangovernment and analyzed by the Central Bank of Liberia in order toproduce aggregate price indices on a monthly basis. Data collectedby the United Nations World Food Programme (WFP) is typicallycollected for the purpose of monitoring food insecurity. However,data collected for food security monitoring covers a more limitedset of consumption items and locations relative to the governmentstatistics.
Price data plays an integral roll in the WFP’s forecasts of foodshortages, as food prices influence household spending decisions.As such, the WFP uses food prices as an indicator of the impact ofeconomic shocks on households. Access to timely price data hasbeen especially important during the 2014-15 Ebola epidemic inWest Africa, where the combination of restricted economic activ-ity, loss of life, and loss of sources of income have culminated in athreat to food security [21].
3. PREMISE DATA
3.1 Technology platformPremise (www.premise.com) is a technology company based inSan Francisco that offers a platform for capturing data from a dis-tributed network of individual contributors.3 The intent of the plat-form is to enable rapid and adaptive measurement of local eco-nomic and social infrastructure, using data collected by local cit-izens. Premise recruits individuals in urban and rural regions ofdeveloping countries to perform simple, structured tasks that cap-ture information about their local community (Figure 1). Premisecurrently operates in 32 countries worldwide. A major focus ofPremise’s efforts to date has been on collecting price data from de-veloping countries.
3Contributors are analogous to enumerators or surveyors in tradi-tional terminology for primary data collection.
Premise contributors use photo-enabled phones to capture pricesin local markets. Contributors are compensated in the local cur-rency, and are trained in person prior to submitting data. Each day,contributors receive a list of tasks which detail the items for whichprice observations are needed. Contributors are typically paid apiece rate for each successfully completed task, for an amount “onthe order of the price of an egg" for each data point captured.4 Pho-tos and price information submitted by the contributor go througha quality control screening process, described in more detail below.
Beginning in September 2014, Premise initiated data collection inLiberia in an effort to produce a Food Staples Price Index (FSPI) aswell as other measures of economic and business activity. Premisedata collection in Liberia launched in response to the 2014 EbolaVirus Disease epidemic in West Africa. The initial goal was to pro-vide timely information about prices of key consumer goods. Theinitial focus has been in Monrovia, where Premise collects dailyprice observations for staple foods and non-food consumer itemsin all of Monrovia’s major market areas (Figure 1). In the sum-mer of 2015, Premise expanded data collection in rural markets ofLiberia, beginning with the towns of Voinjama and Fish Town.
Premise currently receives approximately 600 price observationsper week for a basket of 38 unique products, from a small networkof independent contributors in Liberia.5 As can be observed inAppendix Table A1, which presents summary statistics for the rawcontributor data, there is a great deal of variation in the frequencyat which each product is observed, the number of unique locationsat which a product is captured, and the price level and variance foreach product over time. As we describe in the following section, thenumber of errant observations also varies considerably by product.
4Based on private correspondence with Premise staff, July 2015.5Data volumes in Liberia are low compared to other contries. Forexample, Premise contributors submit upwards of 15,000 observa-tions per week for 150 items in Nigeria.
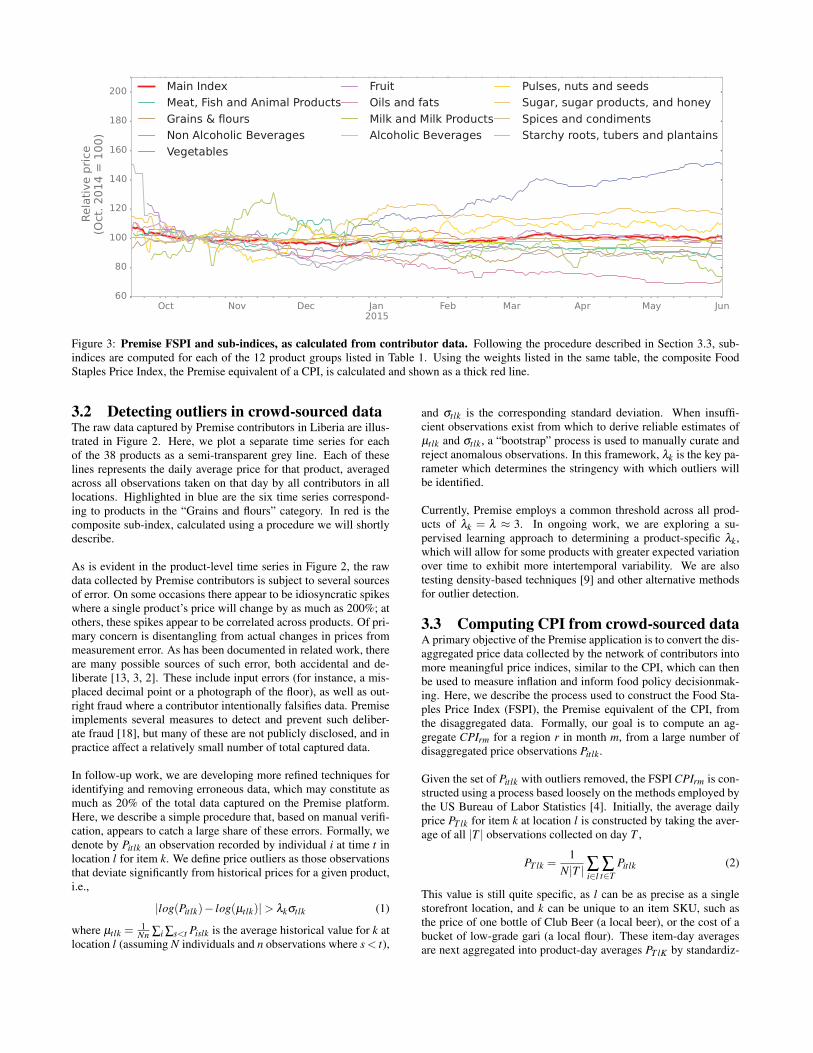
Figure 3: Premise FSPI and sub-indices, as calculated from contributor data. Following the procedure described in Section 3.3, sub-indices are computed for each of the 12 product groups listed in Table 1. Using the weights listed in the same table, the composite FoodStaples Price Index, the Premise equivalent of a CPI, is calculated and shown as a thick red line.
3.2 Detecting outliers in crowd-sourced dataThe raw data captured by Premise contributors in Liberia are illus-trated in Figure 2. Here, we plot a separate time series for eachof the 38 products as a semi-transparent grey line. Each of theselines represents the daily average price for that product, averagedacross all observations taken on that day by all contributors in alllocations. Highlighted in blue are the six time series correspond-ing to products in the “Grains and flours” category. In red is thecomposite sub-index, calculated using a procedure we will shortlydescribe.
As is evident in the product-level time series in Figure 2, the rawdata collected by Premise contributors is subject to several sourcesof error. On some occasions there appear to be idiosyncratic spikeswhere a single product’s price will change by as much as 200%; atothers, these spikes appear to be correlated across products. Of pri-mary concern is disentangling from actual changes in prices frommeasurement error. As has been documented in related work, thereare many possible sources of such error, both accidental and de-liberate [13, 3, 2]. These include input errors (for instance, a mis-placed decimal point or a photograph of the floor), as well as out-right fraud where a contributor intentionally falsifies data. Premiseimplements several measures to detect and prevent such deliber-ate fraud [18], but many of these are not publicly disclosed, and inpractice affect a relatively small number of total captured data.
In follow-up work, we are developing more refined techniques foridentifying and removing erroneous data, which may constitute asmuch as 20% of the total data captured on the Premise platform.Here, we describe a simple procedure that, based on manual verifi-cation, appears to catch a large share of these errors. Formally, wedenote by Pitlk an observation recorded by individual i at time t inlocation l for item k. We define price outliers as those observationsthat deviate significantly from historical prices for a given product,i.e.,
|log(Pitlk)− log(µtlk)|> λkσtlk (1)
where µtlk =1
Nn ∑i ∑s<t Pislk is the average historical value for k atlocation l (assuming N individuals and n observations where s < t),
and σtlk is the corresponding standard deviation. When insuffi-cient observations exist from which to derive reliable estimates ofµtlk and σtlk, a “bootstrap” process is used to manually curate andreject anomalous observations. In this framework, λk is the key pa-rameter which determines the stringency with which outliers willbe identified.
Currently, Premise employs a common threshold across all prod-ucts of λk = λ ≈ 3. In ongoing work, we are exploring a su-pervised learning approach to determining a product-specific λk,which will allow for some products with greater expected variationover time to exhibit more intertemporal variability. We are alsotesting density-based techniques [9] and other alternative methodsfor outlier detection.
3.3 Computing CPI from crowd-sourced dataA primary objective of the Premise application is to convert the dis-aggregated price data collected by the network of contributors intomore meaningful price indices, similar to the CPI, which can thenbe used to measure inflation and inform food policy decisionmak-ing. Here, we describe the process used to construct the Food Sta-ples Price Index (FSPI), the Premise equivalent of the CPI, fromthe disaggregated data. Formally, our goal is to compute an ag-gregate CPIrm for a region r in month m, from a large number ofdisaggregated price observations Pitlk.
Given the set of Pitlk with outliers removed, the FSPI CPIrm is con-structed using a process based loosely on the methods employed bythe US Bureau of Labor Statistics [4]. Initially, the average dailyprice PT lk for item k at location l is constructed by taking the aver-age of all |T | observations collected on day T ,
PT lk =1
N|T | ∑i∈l∑t∈T
Pitlk (2)
This value is still quite specific, as l can be as precise as a singlestorefront location, and k can be unique to an item SKU, such asthe price of one bottle of Club Beer (a local beer), or the cost of abucket of low-grade gari (a local flour). These item-day averagesare next aggregated into product-day averages PT lK by standardiz-
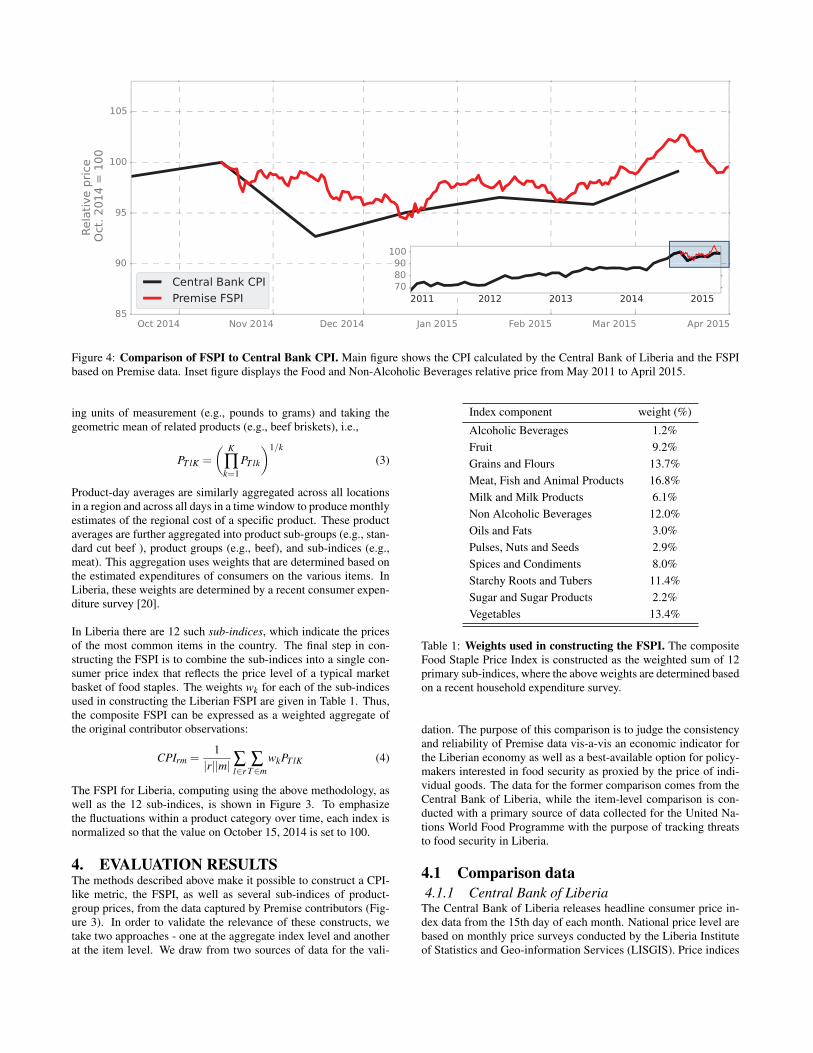
Figure 4: Comparison of FSPI to Central Bank CPI. Main figure shows the CPI calculated by the Central Bank of Liberia and the FSPIbased on Premise data. Inset figure displays the Food and Non-Alcoholic Beverages relative price from May 2011 to April 2015.
ing units of measurement (e.g., pounds to grams) and taking thegeometric mean of related products (e.g., beef briskets), i.e.,
PT lK =
( K
∏k=1
PT lk
)1/k(3)
Product-day averages are similarly aggregated across all locationsin a region and across all days in a time window to produce monthlyestimates of the regional cost of a specific product. These productaverages are further aggregated into product sub-groups (e.g., stan-dard cut beef ), product groups (e.g., beef), and sub-indices (e.g.,meat). This aggregation uses weights that are determined based onthe estimated expenditures of consumers on the various items. InLiberia, these weights are determined by a recent consumer expen-diture survey [20].
In Liberia there are 12 such sub-indices, which indicate the pricesof the most common items in the country. The final step in con-structing the FSPI is to combine the sub-indices into a single con-sumer price index that reflects the price level of a typical marketbasket of food staples. The weights wk for each of the sub-indicesused in constructing the Liberian FSPI are given in Table 1. Thus,the composite FSPI can be expressed as a weighted aggregate ofthe original contributor observations:
CPIrm =1
|r||m| ∑l∈r∑
T∈mwkPT lK (4)
The FSPI for Liberia, computing using the above methodology, aswell as the 12 sub-indices, is shown in Figure 3. To emphasizethe fluctuations within a product category over time, each index isnormalized so that the value on October 15, 2014 is set to 100.
4. EVALUATION RESULTSThe methods described above make it possible to construct a CPI-like metric, the FSPI, as well as several sub-indices of product-group prices, from the data captured by Premise contributors (Fig-ure 3). In order to validate the relevance of these constructs, wetake two approaches - one at the aggregate index level and anotherat the item level. We draw from two sources of data for the vali-
Index component weight (%)
Alcoholic Beverages 1.2%Fruit 9.2%Grains and Flours 13.7%Meat, Fish and Animal Products 16.8%Milk and Milk Products 6.1%Non Alcoholic Beverages 12.0%Oils and Fats 3.0%Pulses, Nuts and Seeds 2.9%Spices and Condiments 8.0%Starchy Roots and Tubers 11.4%Sugar and Sugar Products 2.2%Vegetables 13.4%
Table 1: Weights used in constructing the FSPI. The compositeFood Staple Price Index is constructed as the weighted sum of 12primary sub-indices, where the above weights are determined basedon a recent household expenditure survey.
dation. The purpose of this comparison is to judge the consistencyand reliability of Premise data vis-a-vis an economic indicator forthe Liberian economy as well as a best-available option for policy-makers interested in food security as proxied by the price of indi-vidual goods. The data for the former comparison comes from theCentral Bank of Liberia, while the item-level comparison is con-ducted with a primary source of data collected for the United Na-tions World Food Programme with the purpose of tracking threatsto food security in Liberia.
4.1 Comparison data4.1.1 Central Bank of Liberia
The Central Bank of Liberia releases headline consumer price in-dex data from the 15th day of each month. National price level arebased on monthly price surveys conducted by the Liberia Instituteof Statistics and Geo-information Services (LISGIS). Price indices
Oct Nov Dec Jan2015
Feb Mar Apr May Jun60
70
80
90
100
110
120
130
140Relative price
Oct. 2014 = 100
Rice
Premise
WFP
Premise Index: Grains and flours
Oct Nov Dec Jan2015
Feb Mar Apr May Jun60
70
80
90
100
110
120
130
140Cassava
Premise
WFP
Premise Index: Starchy roots, tubers and plantains
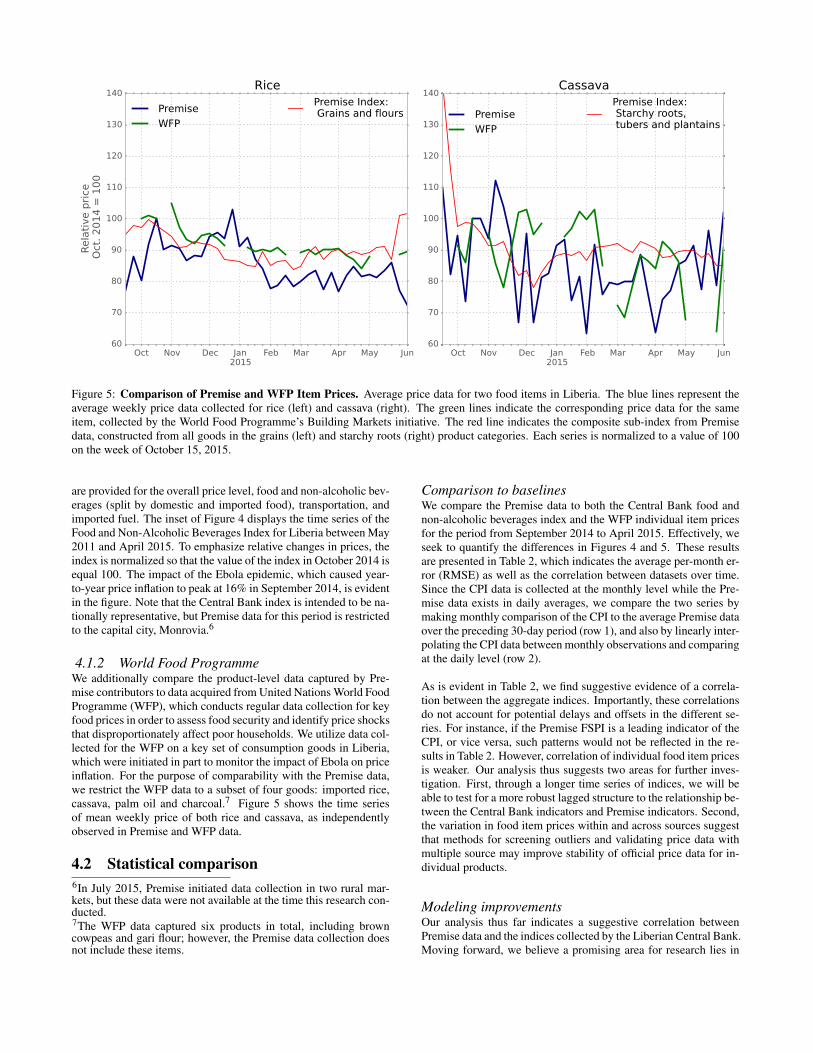
Figure 5: Comparison of Premise and WFP Item Prices. Average price data for two food items in Liberia. The blue lines represent theaverage weekly price data collected for rice (left) and cassava (right). The green lines indicate the corresponding price data for the sameitem, collected by the World Food Programme’s Building Markets initiative. The red line indicates the composite sub-index from Premisedata, constructed from all goods in the grains (left) and starchy roots (right) product categories. Each series is normalized to a value of 100on the week of October 15, 2015.
are provided for the overall price level, food and non-alcoholic bev-erages (split by domestic and imported food), transportation, andimported fuel. The inset of Figure 4 displays the time series of theFood and Non-Alcoholic Beverages Index for Liberia between May2011 and April 2015. To emphasize relative changes in prices, theindex is normalized so that the value of the index in October 2014 isequal 100. The impact of the Ebola epidemic, which caused year-to-year price inflation to peak at 16% in September 2014, is evidentin the figure. Note that the Central Bank index is intended to be na-tionally representative, but Premise data for this period is restrictedto the capital city, Monrovia.6
4.1.2 World Food ProgrammeWe additionally compare the product-level data captured by Pre-mise contributors to data acquired from United Nations World FoodProgramme (WFP), which conducts regular data collection for keyfood prices in order to assess food security and identify price shocksthat disproportionately affect poor households. We utilize data col-lected for the WFP on a key set of consumption goods in Liberia,which were initiated in part to monitor the impact of Ebola on priceinflation. For the purpose of comparability with the Premise data,we restrict the WFP data to a subset of four goods: imported rice,cassava, palm oil and charcoal.7 Figure 5 shows the time seriesof mean weekly price of both rice and cassava, as independentlyobserved in Premise and WFP data.
4.2 Statistical comparison6In July 2015, Premise initiated data collection in two rural mar-kets, but these data were not available at the time this research con-ducted.7The WFP data captured six products in total, including browncowpeas and gari flour; however, the Premise data collection doesnot include these items.
Comparison to baselinesWe compare the Premise data to both the Central Bank food andnon-alcoholic beverages index and the WFP individual item pricesfor the period from September 2014 to April 2015. Effectively, weseek to quantify the differences in Figures 4 and 5. These resultsare presented in Table 2, which indicates the average per-month er-ror (RMSE) as well as the correlation between datasets over time.Since the CPI data is collected at the monthly level while the Pre-mise data exists in daily averages, we compare the two series bymaking monthly comparison of the CPI to the average Premise dataover the preceding 30-day period (row 1), and also by linearly inter-polating the CPI data between monthly observations and comparingat the daily level (row 2).
As is evident in Table 2, we find suggestive evidence of a correla-tion between the aggregate indices. Importantly, these correlationsdo not account for potential delays and offsets in the different se-ries. For instance, if the Premise FSPI is a leading indicator of theCPI, or vice versa, such patterns would not be reflected in the re-sults in Table 2. However, correlation of individual food item pricesis weaker. Our analysis thus suggests two areas for further inves-tigation. First, through a longer time series of indices, we will beable to test for a more robust lagged structure to the relationship be-tween the Central Bank indicators and Premise indicators. Second,the variation in food item prices within and across sources suggestthat methods for screening outliers and validating price data withmultiple source may improve stability of official price data for in-dividual products.
Modeling improvementsOur analysis thus far indicates a suggestive correlation betweenPremise data and the indices collected by the Liberian Central Bank.Moving forward, we believe a promising area for research lies in

−4−2
024
−4−2
024
Oct 2014
Nov 2014
Dec 2014
Jan 2015
Feb 2015
Mar 2015
Apr 2015
May 2015
−4−2
024
Eastern
Central
Western
Figure 6: Geospatially disaggregated time series. Premise data include individual price data for 38 consumer goods from 310 uniquelocations in Monrovia, Liberia. Figure shows normalized prices for grain and flour products in the three geographic locations, with a redline to indicate the 10-day moving average across all observations from each sub-region. Sub-regions are identified using k-means clusteringwith five clusters specified using latitude and longitude of the observations submitted by the Premise contributor.
Corr RMSE RMSE (% of mean)A. Central Bank Food Price Index
FSPI (Monthly Average) 0.64 2.97 3.58%FSPI (Daily vs. Central Bank linear interpolation) 0.73 2.39 2.88%
B. Food Items (WFP, relative prices)Rice 0.54 8.94 9.77%Cassava 0.03 16.27 18.71%Charcoal 0.35 6.29 6.64%
Table 2: Model performance. Measures of model accuracy and error, comparing Premise data to data collected by the Liberian CentralBank and the World Food Programme.
using different sources of “ground truth" data to better calibrate themodel used to construct the FSPI. To take a simple example, onemight imagine using cross-validation to select the optimal param-eters for outlier detection (in our case, the λk described in Section3.2). This is a complicated task, however, as there are known is-sues with existing sources of price as CPI data, so it is importantthat any supervised learning approach not overfit the ground truthdata. However, by calibrating with multiple sources of externaldata, collected through different processes and at different spatialand temporal resolution, we believe it should be possible to buildmore robust and accurate price indices.
5. DISCUSSIONWhile Premise data is correlated with the two traditional price mea-sures we were able to obtain, there are statistical discrepancies thatare not easily resolved.8 While we largely treat the Central Bankof Liberia’s CPI data as “ground truth" and assume that deviationsobserved in the Premise FSPI are errors, it is also conceivable thatthe Premise data might at times be accurate where Central Bankdata is not. Indeed, the two sources of data, while comparable,
8One obvious source of these difference may be the differences insampling frames used in data collection, for instance the fact thatthe Central Bank surveys the entire country’s prices while Premiseis thus far focused in Monrovia; as Premise expands to additionalmarkets it will be possible to test this hypothesis.
have distinct advantages and disadvantages that we discuss brieflybefore concluding. Similarly, the WFP data relies upon the accu-racy of reports from on-the-ground surveyors that are no less proneto errors than Premise contributors. In fact, real-time data qualitycontrols can be put in place through Premise’s technology that areoften lacking or slow to implement through traditional price datacollection methods.
5.1 Advantages of traditional price dataA primary advantage of traditional sources of price information isthat they are familiar to most consumers of price data. Govern-ments and international organizations have well-established mech-anisms for collecting and processing price data, and a standardset of best practices exist for determining sample frames, decid-ing price frequencies, and integrating the resulting measures intomacroeconomic decisionmaking. Centralized administration of theseefforts further ensures that governments and international organi-zations play an integral role in the collection of critical economicdata. Private sector efforts may be more subject to a different opti-mization problem, i.e. profit maximization.
There are also economies of scale in centralized data collection.Governments and international organizations conduct data collec-tion, such as censuses, expenditure surveys and firm surveys, thatare complimentary to price data. For example, expenditure surveys

are integral to updating consumption basket estimates that feed intoconsumer price indices.
5.2 Advantages of Premise CPIRelative to traditional models of price data collection, the Premiseplatform offers several distinct advantages. In particular, Premisedata is highly granular, and can be sourced continuously in timeand space, increasing the ability to track prices in real-time, in sub-regions of the country. In Figure 6, for instance, we show howthe original data, collected from over 300 unique locations, can beaggregated to form sub-regional price indicators. For the figure,we cluster all of these locations geographically (using k-means onthe market geocoordinates), then aggregate all data by cluster. Thethree time-series graphs on the right show the original price datain the grains and flour category, from each of these market clusters(the points on the graphs). The red line indicates the 10-day movingaverage, similar to the sub-index described earlier. While generallycorrelated, there is within-market volatility that is not clearly re-flected in the Monrovia aggregate. Such patterns are not visible inmost traditional sources of price data.
While our focus has been on price data collection, the crowd-sourcingframework can also be used to capture a much wider array of datatypes. Near-term possibilities include street mapping, collecting in-formation on the availbility of public utilies, and mapping financialinclusion. The Premise platform for recruiting and compensatingcontributors makes it possible to quickly scale data collection ef-forts, and to target specific regions with less reliable data.
6. CONCLUSIONSWe describe and evaluate data from Premise, a platform for col-lecting crowd-sourced price information from networks of localcontributors in developing countries. Our focus on the statisticalproperties of the Premise data, and on comparing Premise-basedindices to more traditional measure of price inflation, reveals sev-eral promising areas for future work.
First, further quantitative work would benefit greatly from a longerpanel of price data. While the Premise data contains tens of thou-sands of observations and is collected at extremely high frequency,the authoritative central bank data is collected only monthly. Withonly 9 months of overlapping data, it is difficult to make robuststatistical comparisons.
Second, there is considerable scope for improvement in the tech-niques used to identify erroneous data, caused both by innocent er-ror and intentional fraud. The outlier removal system we describeand implement appears to be reasonably effective, but is rathercoarse and relies heavily on (possibly unjustified) intuition. Givena labeled training set, where the source of erroneous data points isknown, it would be possible to develop more sophisticated methodstailored to specific products, locations, and contributors.
Finally, and perhaps most promising, we believe significant progresscan still be made in developing methods for supervised learningthat use authoritative data to improve the accuracy of estimatesbased on high-frequency data from Premise and related sources.Here, we made the simple point that inflation forecasts appear toimprove when historical CPI data is supplemented with data fromPremise. Analagous approaches could be used to increase the gran-ularity of official CPI estimates (beyond the country-month), or toconstruct monthly Premise estimates that correspond more closelyto official benchmarks. As before, the absence of a long panel of
training data makes these exercises difficult in the immediate term,but as data from Premise’s global network continues to stream in,it will open many opportunities for research that can impact howprices and inflation are measured in developing economies.
7. REFERENCES[1] H. Ashley, J. Corbett, D. Jones, B. Garside, and
G. Rambaldi. Change at hand: Web 2.0 for development.Participatory Learning and Action, 59(1):8–20, 2009.
[2] B. Birnbaum, G. Borriello, A. D. Flaxman, B. DeRenzi, andA. R. Karlin. Using Behavioral Data to Identify InterviewerFabrication in Surveys. In Proceedings of the SIGCHIConference on Human Factors in Computing Systems, CHI’13, pages 2911–2920, New York, NY, USA, 2013. ACM.
[3] B. Birnbaum, B. DeRenzi, A. D. Flaxman, and N. Lesh.Automated quality control for mobile data collection. InProceedings of the 2nd ACM Symposium on Computing forDevelopment, page 1. ACM, 2012.
[4] BLS. The Consumer Price Index. In Bureau of LaborStatistics Handbook of Methods, number 17. Dec. 2008.
[5] J. E. Blumenstock. Calling for Better Measurement:Estimating an Individual’s Wealth and Well-Being fromMobile Phone Transaction Records. In Proc. 20th ACMConference on Knowledge Discovery and Mining (KDD‘14), Workshop on Data Science for Social Good, NY, 2014.
[6] A. Cavallo. Scraped Data and Sticky Prices. SSRN ScholarlyPaper ID 1711999, Social Science Research Network,Rochester, NY, Apr. 2012.
[7] N. Eagle. txteagle: Mobile Crowdsourcing. In N. Aykin,editor, Internationalization, Design and GlobalDevelopment, number 5623 in Lecture Notes in ComputerScience, pages 447–456. Springer Berlin Heidelberg, 2009.
[8] N. Eagle, M. Macy, and R. Claxton. Network Diversity andEconomic Development. Science, 328(5981):1029–1031,May 2010.
[9] M. Ester, H.-P. Kriegel, J. Sander, and X. Xu. Adensity-based algorithm for discovering clusters in largespatial databases with noise. In Proc. 2nd ACM Conferenceon Knowledge Discovery and Mining, volume 96, pages226–231, 1996.
[10] V. Frias-Martinez, C. Soguero-Ruiz, E. Frias-Martinez, andM. Josephidou. Forecasting socioeconomic trends with cellphone records. In Proceedings of the 3rd ACM Symposiumon Computing for Development, page 15. ACM, 2013.
[11] R. Glennerster and T. Suri. Economic Impacts of Ebola:Bulletin Four. IGC Bulletin, May 2015.
[12] A. Gupta, W. Thies, E. Cutrell, and R. Balakrishnan. mClerk:Enabling Mobile Crowdsourcing in Developing Regions. InProceedings of the SIGCHI Conference on Human Factors inComputing Systems, CHI ’12, pages 1843–1852, New York,NY, USA, 2012. ACM.
[13] N. Hamadeh, M. Rissanen, and M. Yamanaka. Crowd-sourced price data collection through mobile phones. In NewTechniques and Technologies for Statistics, 2013.
[14] K. Himelein and J. G. Kastelic. The socio-economic impactsof Ebola in Liberia : results from a high frequency cell phonesurvey. Technical Report 96196, The World Bank, 2015.
[15] M. Jerven. Poor numbers: how we are misled by Africandevelopment statistics and what to do about it. CornellUniversity Press, 2013.

[16] N. Lane, E. Miluzzo, H. Lu, D. Peebles, T. Choudhury, andA. Campbell. A survey of mobile phone sensing. IEEECommunications Magazine, 48(9):140–150, Sept. 2010.
[17] N. Mankiw. Principles of Macroeconomics. CengageLearning, Jan. 2014.
[18] Premise. Premise Data Corporation: Food Staples Indexes,Nov. 2014.
[19] K. Starbird and L. Palen. "Voluntweeters": Self-organizingby Digital Volunteers in Times of Crisis. In Proc. SIGCHI
Conference on Human Factors in Computing Systems, CHI’11, pages 1071–1080, New York, NY, USA, 2011. ACM.
[20] USAID. USAID Liberia Feed the Future Population BasedSurvey. Technical Report AID - OAA -C-11-00169, USAID,July 2013.
[21] World Food Programme. Ebola Response: from crisis torecovery. Technical report, World Food Programme, 2015.
Market good # observations # locations Units Min Max Mean SDBanana 819 201 piece 0.33 25 10.47 3.73Beef Brisket (fresh, raw) 317 102 piece 5 200 42.42 37.30Beer 718 177 cl 0 1833.33 11.56 74.65Bitter Ball 476 130 kg 0 475 74.28 53.98Bitter Kola 823 192 piece 0.91 35 13.96 4.7Boiled Eggs 891 206 piece 1 25 13.24 2.54Bread 1002 202 piece 5 500 72.35 48.49Bulgur Wheat 830 168 kg 0.03 3187.5 49.91 116.3Butter Rice 886 183 kg 0.68 7437.5 85.2 353.04Cassava 749 165 piece 0.11 100 15.12 9.12Cassava Flour 979 203 kg 0 4250 57.45 228.58Cassava Leaf 377 109 piece 8.33 100 18.90 14.07Charcoal 807 193 kg 2.4 1190 17.25 59.93Chloride 842 199 liter 0 2000 152 88.76Fan-fan Rice 839 170 kg 1 4250 68.77 147.18Fuel (Diesel) 569 164 liter 10.57 1733.33 100.95 111.06Instant Coffee 518 154 gram 0.01 10 2.72 2.63Kidney Beans (dry) 805 175 kg 0.18 15937.5 203.45 869.62Live Chicken (medium size) 361 81 piece 0 1300 615.95 244.02Mayonnaise 613 168 ml 0.01 739.34 35.02 96.95Onion 1098 214 piece 0.4 125 21.47 20.59Orange 852 193 piece 2.5 125 16.57 11.29Palm Butter 711 158 kg 3 2500 35.37 149.35Palm Oil 997 198 liter 9.51 1800 110.71 80.40Petrol (gas) 682 175 gallon 0.31 710 252.43 111.52Plantain (Cooking Banana) 900 198 piece 0 250 20.37 11.26Potato Greens 608 141 piece 0.5 35 14.2 4.74Powdered Milk 846 197 gram 0 70 0.86 2.78Salt 918 190 gram 0 4.25 0.09 0.23Sardines (canned) 332 99 gram 0.04 4.25 1.55 1.53Seasoning cube 434 108 gram 0 127.5 0.72 6.11Smoked Fish 592 162 piece 0.52 550 70.24 81.93Sugar 967 198 gram 0 8.75 0.12 0.54Tomato 564 132 piece 0.08 500 22.07 33.62USA Parboiled Rice 981 205 kg 5 6250 92.21 279.91Vegetable Oil 1012 197 liter 1.35 580 130.4 41.09Water (Bag) 1035 217 ml 0 5.71 0.02 0.18
Table A1: Summary statistics of Premise contributor data. Data collection in Liberia began in October, 2014, with products and marketlocations being gradually added since then. Significant variation between products in data quality and quantity.