Tax Evasion: Cheating Rationally or Deciding Emotionally?ftp.iza.org/dp3103.pdf · Tax Evasion:...
40
IZA DP No. 3103 Tax Evasion: Cheating Rationally or Deciding Emotionally? Giorgio Coricelli Mateus Joffily Claude Montmarquette Marie-Claire Villeval DISCUSSION PAPER SERIES Forschungsinstitut zur Zukunft der Arbeit Institute for the Study of Labor October 2007
Transcript of Tax Evasion: Cheating Rationally or Deciding Emotionally?ftp.iza.org/dp3103.pdf · Tax Evasion:...

IZA DP No. 3103
Tax Evasion:Cheating Rationally or Deciding Emotionally?
Giorgio CoricelliMateus JoffilyClaude MontmarquetteMarie-Claire Villeval
DI
SC
US
SI
ON
PA
PE
R S
ER
IE
S
Forschungsinstitutzur Zukunft der ArbeitInstitute for the Studyof Labor
October 2007

Tax Evasion: Cheating Rationally or
Deciding Emotionally?
Giorgio Coricelli CNRS
Mateus Joffily
CNRS
Claude Montmarquette CIRANO, University of Montréal
Marie-Claire Villeval
CNRS-GATE, University of Lyon, and IZA
Discussion Paper No. 3103 October 2007
IZA
P.O. Box 7240 53072 Bonn
Germany
Phone: +49-228-3894-0 Fax: +49-228-3894-180
E-mail: [email protected]
Any opinions expressed here are those of the author(s) and not those of the institute. Research disseminated by IZA may include views on policy, but the institute itself takes no institutional policy positions. The Institute for the Study of Labor (IZA) in Bonn is a local and virtual international research center and a place of communication between science, politics and business. IZA is an independent nonprofit company supported by Deutsche Post World Net. The center is associated with the University of Bonn and offers a stimulating research environment through its research networks, research support, and visitors and doctoral programs. IZA engages in (i) original and internationally competitive research in all fields of labor economics, (ii) development of policy concepts, and (iii) dissemination of research results and concepts to the interested public. IZA Discussion Papers often represent preliminary work and are circulated to encourage discussion. Citation of such a paper should account for its provisional character. A revised version may be available directly from the author.

IZA Discussion Paper No. 3103 October 2007
ABSTRACT
Tax Evasion: Cheating Rationally or Deciding Emotionally?*
The economic models of tax compliance predict that individuals should evade taxes when the expected benefit of cheating is greater than its expected cost. When this condition is fulfilled, the high compliance however observed remains a puzzle. In this paper, we investigate the role of emotions as a possible explanation of tax compliance. Our laboratory experiment shows that emotional arousal, measured by Skin Conductance Responses, increases in the proportion of evaded taxes. The perspective of punishment after an audit, especially when the pictures of the evaders are publicly displayed, also raises emotions. We show that an audit policy that induces shame on the evaders favors compliance. JEL Classification: C91, C92, D87, H26 Keywords: tax evasion, emotions, neuro-economics, physiological measures, shame,
experiments Corresponding author: Marie-Claire Villeval CNRS-GATE 93, Chemin des Mouilles 69130 Ecully France E-mail: [email protected]
* The authors are grateful to participants at the ESA World Meeting in Rome, at the Workshop on Risk Attitude in Montpellier, and at seminars at the University of Aarhus and at the University of Copenhagen, for their comments. We thank R. Zeiliger for programming the experiment. This research was supported by a grant from the Rhône-Alpes Region (CIBLE program).

1. INTRODUCTION
Tax evasion is a substantial phenomenon. According to the analyses of the
National Research Program, the U.S. Department of the Treasury (2006) estimates that
the 2001 Federal tax-underreporting gap represents $345 billions, i.e. about 16.3% of the
tax liability in the United States (Slemrod, 2007). The importance of tax evasion is
comparable in most high-income OECD countries. Understanding the reasons why
individuals evade taxes and how to increase compliance is therefore extremely
challenging.
The standard economics-of-crime model formulated by Allingham and Sandmo (1972)
and Yitzhaki (1974) has inspired many empirical tests (see Alm (1991), Cowell (1990),
Elffers (1991), Andreoni et al. (1998), and Slemrod (2007) for surveys). If they confirm
the basic mechanisms of the deterrence models, these tests however reveal more
compliance than predicted1. This has motivated the exploration of other dimensions of
tax compliance, like tax morale, ethics, and social norms (see Torgler (2002)).2 Civic
norms (Slemrod (1998)), moral appeals (Schwartz and Orleans (1967), Blumenthal et al.
(2001), Torgler (2004)), or expectation of collective blame (Bosco and Mittone (1997))
have been shown to exert contrasted influence on tax compliance without, however, fully
explaining it.
1 Also relaxing the hypothesis of risk neutrality, thus assuming risk aversion, does not help to explain the level of compliance observed in empirical settings (Bayer and Sutter (2004). 2 Another perspective explores the heuristics and biases that lead individuals to overweight small audit probabilities (Alm et al. (1992)). Another one consists of the analysis of equity and the role of voting on the use of taxes in compliance behavior (Pommerehne et al. (1994)). The role of social interactions has been investigated more recently (Myles and Naylor, 1996; Fortin et al. (2007).
2

In this paper, we investigate a new hypothesis by considering that our understanding of
tax compliance can be improved by analyzing the role of emotions. Our expectation is
that both income reporting and audit, possibly followed by sanctions, elicit emotions in
individuals. We assume that emotions do not simply proxy the psychic cost of evading
taxes; moreover, they constitute a driving force of behavior. In other words, the emotions
associated with reporting, audit, and sanctions can influence further compliance. Our
analysis is inspired by the recent developments of neuroeconomics. With emotions being
functional in driving preferences and decisions (Zajonc (1980); Coricelli, Dolan and
Sirigu (2007)), rational decision-making cannot be dissociated from emotions (Damasio
(1994)). Closely related to this paper, Harbaugh et al. (2007) have recently shown that
mandatory taxation for a charitable cause entails neural activity in brain areas of the
ventral striatum that are related to individualistic rewards. This suggests that in some
contexts, tax compliance can produce satisfaction for the taxpayer. We extend this
reflection by considering situations where no charity is involved and where the
individuals can evade taxes.
Different emotions might be related with the act of evading taxes and its consequences.
Underreporting income might generate anticipatory and anticipated emotions
(Loewenstein, Hsee, Weber and Welch (2001)).3 Thus, the evader might experience
intense feelings (i.e., anticipatory emotions) when taking the risky choice of reporting
less than requested. We expect these risk-related anticipatory emotions to increase in the
3 As defined by Lowenstein et al. (2001): “Anticipatory emotions are immediate visceral reactions to risks and uncertainties. Anticipated emotions are typically not experienced in the immediate present but are expected to be experienced in the future…anticipated emotions are a component of the expected consequences of a decision: they are emotions that are expected to occur when outcomes are experienced, rather than emotions that are experienced at the time of decision [i.e., anticipatory emotions]” (pp. 268).
3

level of tax evasion. Moreover, the evader might anticipate how bad he will feel if
audited and punished (i.e., anticipated emotions). We also expect that the intensity of the
emotions related to the detection of cheating differs according to the publicity of this
information. Indeed, different events can generate various emotions according to the
cognitive appraisal theory of emotions (Frijda (1986); Lazarus (1991)).4 For instance,
evaders can feel regret and guilt even when the information is not spread out and their
reputation remains intact in the future. 5 They can feel shame and embarrassment if their
cheating behavior is made public. This is at least what is expected by the authorities that
resort to the public exposure of the offenders.6 Since it is difficult to cope with a
damaged reputation, we expect the “social” emotion of shame to have a larger impact on
future choice behavior than its “private” counterpart (i.e., guilt).7 Thus, shame
avoidance, in addition to guilt avoidance, is likely to increase tax compliance.
To test these hypotheses, we have run a laboratory experiment in which subjects receive
an exogenous income that is taxed at a proportional tax rate, and whose emotional arousal
4 According to the appraisal theory (Frijda (1986)) emotions are concern-activated response patterns that depend on the cognitive evaluation of the context. For instance, a loss is a loss if a person feels it as a loss. The stimuli that elicit emotional responses are the ones that are relevant for the satisfaction of the individual’s concerns (desired states or event). At a low cognitive level (primary appraisal), the intensity of the emotion increases in the importance of the concern and with the simultaneous presence of multiple concerns. At a higher cognitive level (secondary appraisal), the intensity and the nature of the emotions are primarily context-dependent. At this level, emotions are strongly related to the difficulty of the context, and mainly to the evaluation of our capacity to deal with the situation. Emotions are adaptive in that they prepare the organism for change in action tendency. 5 Interestingly, Allingham and Sandmo (1972) explicitly mention that tax evasion may be limited if the individuals fear losing their reputation. 6 While pillories have been historically used in many cultures, the web provides nowadays many examples of such policies. For example, the Chicago police department displays the pictures and home addresses of prostitute patrons arrested by the police; a listing of convicted pedophiles is available in every state in the U.S.A.; the government of Canada displays the names of citizens convicted of fiscal fraud; etc. 7 For instance, appraised uncontrollability (secondary appraisal) of dealing with a public announcement of a cheating behavior intensifies the effects of the already negative emotion of guilt. This is because the social group effect may appraise the situation as more difficult to change. Similar amplification effect (Kahneman and Miller (1986)), when moving from a private to a social context, has been found in a recent paper by Bault et al. (2007). In this paper, the social emotions of envy and gloating are found to be more intense and to have a deeper behavioral effect than their private counterparts (regret and relief).
4

is measured. Each individual has to decide how much income he is willing to report. He
faces a probability to be audited, in which case he must pay a penalty for underreporting.
This audit probability is endogenous and depends on the median of reported incomes in
the group of taxpayers. We compare behavior in two treatments. In contrast with the
Benchmark treatment, in the Picture treatment any individual’s cheating behavior is
publicly revealed through the public display of his picture.
To measure the emotional arousal associated with the decisions and the feedback on
audits, we use Skin Conductance Responses (SCRs) (Bradley et al (2000)). The SCR is a
phasic component of the electrodermal activity (EDA) primarily controlled by the
sympathetic division of the autonomic nervous system (ANS) (Dawson et al, 2000). We
also use affective self-reports to assess the emotional arousal (low-high intensity) and the
hedonic valence (pleasant-unpleasant) dimensions of emotion as a robustness check
(Russell and Mehrabian (1977)).
Beyond the hypotheses under examination, an originality of our approach lies in the fact
that our physiological measures are not only related to individual decisions but also to
social interactions in the Picture treatment. To our knowledge, this is the first economic
experiment that measures SCRs in a group of several interacting subjects.
Our experiment delivers several major findings. Although it is rational to evade taxes in
our environment, the subjects express increased SCRs both when underreporting their
income and when being audited. Indeed, the emotional arousal rises in the intensity of
tax evasion. Emotional arousal is increased by the perspective of monetary sanctions
and, even more by the perspective of additional non-monetary sanctions. As a
5

consequence, being in an environment where the picture of the detected evader is
publicly displayed favors tax compliance. An interpretation is that people try to avoid the
shame associated with detection. Last, the reporting decision time increases in the level
of evasion and in the intensity of emotions. This suggests that the subjects need time to
solve the tension between the rationality of evading and the associated psychic cost.
Interestingly, these results show that, despite the sterility of the environment, it is
possible to capture emotions and the fear of social stigma in the lab.
The reminder of this paper is organized as follows. Section 2 develops the experimental
design and the predictions. Section 3 analyzes the results and Section 4 concludes.
2. THE EXPERIMENT
A. Experimental design
The experiment consists of two treatments. The Benchmark treatment is
characterized as follows. The experimental game involves a group of 8 players who
receive an individual income. The income can take the following values:
. Each income level is randomly assigned to two subjects in each
period, but this is not common information. The players are requested to pay a tax on
their income. The uniform tax rate applied to the reported income is 55%. To satisfy this
request, the players must report their income that will be taxed.
I ∈ 50,100,150,200{ }
8 For the sake of
simplicity and also to produce a stronger test of the social emotions, we do not introduce
any public good dimension. The subjects are told that these paybacks will go into
scientific research funds.
8 The subject reports an income by means of a scrollbar of which maximum graduation corresponds to the subject's actual income. Therefore, a subject cannot report more than his actual income.
6

The players know that their reported income can be audited according to a certain cutoff
audit scheme and that this audit will entail the payment of a fine if the reported income is
less than the actual income. We have reinforced the experimental realism of the design
not only by replicating the structure of income reporting, but also by using non-neutral
terms in the instructions (see Appendix) and by introducing an endogenous audit rule.
The probability of an audit is endogenous in that it depends on the median report in the
group, and this is made common information.9 If the reported income of a player is
among the four highest reported incomes in the group, his audit probability is 35%. If his
reported income is among the four lowest reported incomes in the group, his audit
probability is 65%. If all subjects report the same amount, the audit probability is
uniform and equal to 50%. The reason why low reported income players have a higher
probability of being audited is because reporting low incomes signals to the tax authority,
which knows the distribution of income that the individual might have underreported by a
substantial amount. The tax authority has little to gain in auditing individuals who report
a high income as auditing is costly.10 Therefore, the subjects do not know their
individual audit probability (for an early attempt to study the impact of uncertain audit
probabilities on compliance, see Spicer and Thomas (1982)).
The payoffs are determined as follows. If the player is not audited, his payoff consists of
his net income (i.e. his income minus the tax on his reported income). If the player is
9 In real settings, the probability of an audit depends on the taxpayer's decisions since reports convey information. While empirical analyses are plagued by such an endogeneity problem (Alm (1991)), experiments allow clearing it up by using random audit probabilities. Most experiments however do not try to analyze how tax authorities use information from returns to determine audit and how endogenous probabilities influence decisions. Exceptions are Collins and Plumlee (1991), Alm et al. (2000). 10 We could also have allocated audit probabilities as a function of past detected evasion behavior. This would have increased the realism of the experiment, but it would also have increased the complexity of the game and made the results less comparable with the existing literature.
7

audited and he has underreported his income, he has to pay the tax on his actual income
and a fine is charged. As in the Yitzhaki (1974) deterrence model, the fine is
proportional to the unpaid taxes and it is fixed at 20%, which is a realistic value
(Andreoni et al. (1998)).
The Picture treatment follows the same timing as the Benchmark treatment: the players
receive their income; they report an income; they are informed on whether they have
been audited; then, the payoffs for the period are computed. In contrast with the
Benchmark treatment however, if an audit reveals that a player has underreported his
income, the picture of the contravener is displayed on his own screen and on the screen of
other taxpayers. In a period, only one picture can be displayed on the screen of any
subject; if more than one tax evader has been audited, there is a random display of each
picture on the screen of the non-audited subjects and the honest audited taxpayers.11 The
extent of evasion is not displayed since it could be an additional source of influence on
individual decisions. This treatment helps in identifying whether evading taxes involves
social emotions, such as shame. Indeed, if the compliance rate differs from that in the
Benchmark treatment, this can only be attributable to the flow of information sent to
other subjects about one’s cheating behavior and received about other subjects’ cheating
behavior.
To identify more precisely the treatment effects, we used a within-subject design to
control that the subjects’ characteristics are held constant. The experimental session
consists of 30 periods, divided into six blocks of 5 periods. The Benchmark treatment is
11 Displaying only one picture at a time does not allow the subjects to identify precisely the number of evaders in the session. This also means that a subject who is caught cheating does not know if there were other tax evaders and how many subjects can see his picture.
8

implemented in periods 1 to 5, 11 to 15, 21 to 25, and the Picture treatment is
implemented in the remaining periods. The type of treatment in the current period is
always kept visible at the top of the subjects’ screens.
Each period is segmented into four or five events, depending on the treatment type, as
follows: i. Decision – this event starts when the subject is informed about his income for
the current period and ends when the subject makes his decision (self-paced); ii.
Feedback on audit – the subject is informed on whether an audit has been conducted and
if the audit led to the payment of a fine (fixed duration of 12 s); iii. Picture display
(Picture treatment only) – the picture of an audited contravener is displayed (fixed
duration of 6.5 s); if the audit did not identify any under-reporting, this event is skipped;
iv. Feedback on payoffs – the payoff for the period is displayed (fixed duration of 3 s); v.
Affective self-report – the subject reports his feeling at the end of the period (self-paced).
B. Predictions with selfish and rational agents
The theoretical predictions are the same for both treatments if we assume that
players are rational. We also assume that the players are risk-neutral: the utility function
of the participants is linear in income. We consider a game in the vein of Allingham and
Sandmo (1972) and Yitzhaki (1974). I denotes the subject’s gross income, which
expected value is 0.25(50+100+150+200) = 125. For the symmetry of the game, we can
assume that each player believes that the other players receive the same income with
equal probability. The probability to be audited, assuming that each player uses the same
strategy and reports the same income, is p = 0.5*ALow + 0.5*AHigh. ALow is the audit rate
for those reporting income below the median and AHigh is the audit rate for income
reported above the median.
9

Let t be the tax rate and f be the penalty rate. If an individual decides to report an amount
R of his gross income I, his net expected income, ENI, is:
( ) ( )( ) ( )1I p t I R ft I R t p R ENI⎡ ⎤− − + − + − =⎣ ⎦ (1)
The term between the square brackets is the expected value of the tax t and the fine (f
times the unpaid taxes) associated with this strategy. If an individual chooses to report
his full income, then his net income, NI, is simply:
I − tI = NI (2)
The expected rate of return from reporting no income (R=0 in equation (1)) relatively to
reporting all his income is:
( ) ( )( )1 101
t p fENI with R NINI t
− + += −=
− (3)
With the following parameters, t = 55%, f = 20%, ALow = 65% and AHigh = 35% (therefore
p=50%), this expected rate of return is 45%. This is a strong incentive not to report any
income to the tax authority and full reporting is always a dominated strategy. Indeed, the
return of evasion increases in absolute terms in the level of income; in addition, a subject
may realize that it is easier to hide evasion when one receives a high income if he
believes that other subjects have drawn a lower income.
This game has however no Nash equilibrium in pure strategies because a player has an
incentive to deviate by reporting one unit more than the other players to reduce his own
audit probability from 50% to 35%. The solution of the game is indeed a mixed strategy
equilibrium with a positive compliance rate. Under the assumption of risk neutrality, one
can suspect that this compliance rate is very low, due to the high expected return from
each evaded unit of income even under the high audit probability.
10
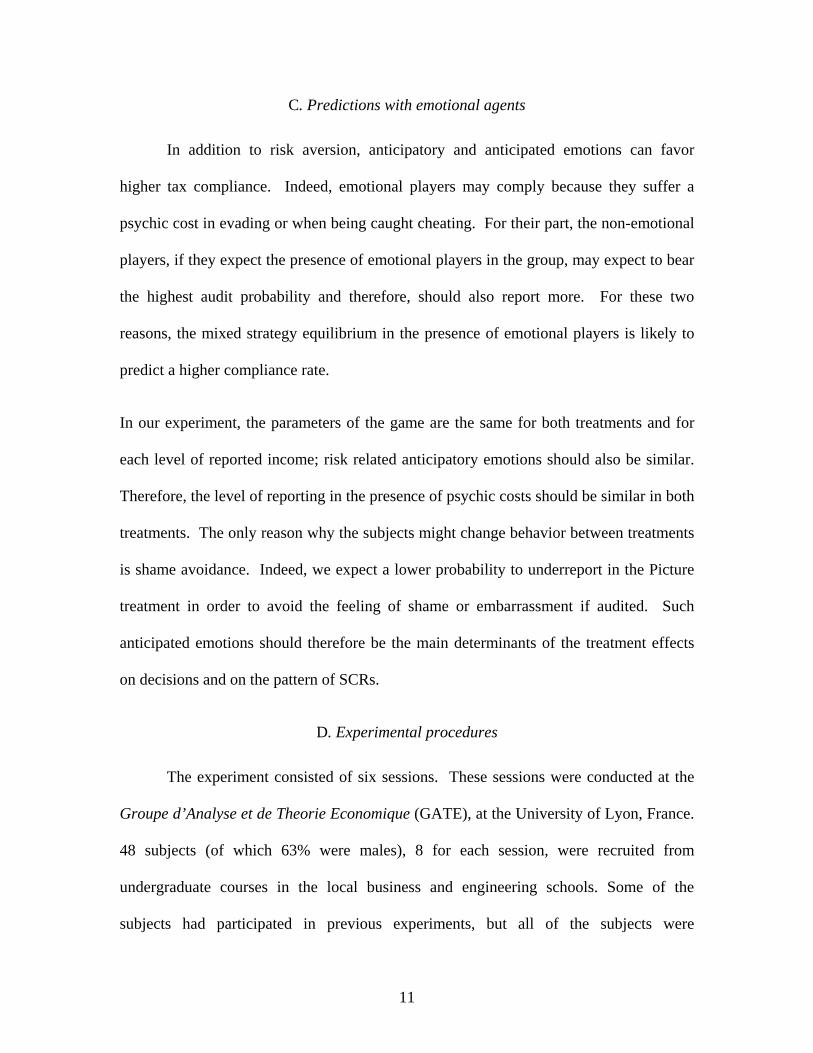
C. Predictions with emotional agents
In addition to risk aversion, anticipatory and anticipated emotions can favor
higher tax compliance. Indeed, emotional players may comply because they suffer a
psychic cost in evading or when being caught cheating. For their part, the non-emotional
players, if they expect the presence of emotional players in the group, may expect to bear
the highest audit probability and therefore, should also report more. For these two
reasons, the mixed strategy equilibrium in the presence of emotional players is likely to
predict a higher compliance rate.
In our experiment, the parameters of the game are the same for both treatments and for
each level of reported income; risk related anticipatory emotions should also be similar.
Therefore, the level of reporting in the presence of psychic costs should be similar in both
treatments. The only reason why the subjects might change behavior between treatments
is shame avoidance. Indeed, we expect a lower probability to underreport in the Picture
treatment in order to avoid the feeling of shame or embarrassment if audited. Such
anticipated emotions should therefore be the main determinants of the treatment effects
on decisions and on the pattern of SCRs.
D. Experimental procedures
The experiment consisted of six sessions. These sessions were conducted at the
Groupe d’Analyse et de Theorie Economique (GATE), at the University of Lyon, France.
48 subjects (of which 63% were males), 8 for each session, were recruited from
undergraduate courses in the local business and engineering schools. Some of the
subjects had participated in previous experiments, but all of the subjects were
11

inexperienced in this particular type of experiment. The experiment was computerized
using the REGATE program developed at GATE (Zeiliger (2000)).
Upon arrival and before entering the laboratory, the subjects drew a tag indicating their
designated computer. Then, we asked them whether they allowed us to take a picture of
their face (all have accepted). It was made explicit that this picture would be used at
some point during the experiment, that they would be informed before the possible use of
the pictures, and that they could quit immediately against the payment of the show-up
fee. The subjects received also the guarantee that their picture would be immediately
destroyed at the end of the session. The volunteers were required to keep a neutral face
when we took their picture. Next, each subject was allowed to seat in front of his
computer. The instructions for the preliminary part of the experiment were then
distributed and read aloud. After the completion of a test of risk attitudes, the
instructions for the other parts were distributed and read aloud. For the sake of realism,
the instructions used tax specific language, but they made no reference to the measure of
emotions.12 We checked the understanding of the rules of the game by means of a
questionnaire. We also answered the subjects’ questions in private.
Eliciting risk preferences. Since there are good reasons to believe that risk attitude
influences the individual compliance decision, we implemented in the preliminary part of
the experiment a parsimonious procedure to elicit each individual’s degree of risk
aversion. This test was taken from Charness and Gneezy (2003). Each subject was
12 Alm (1991) mentions that by using loaded terms, the experimenter loses some control over the subjects' preferences; on the other hand, it helps introducing context, which is important in explaining compliance behavior, and make mental scripts less necessary. Alm, McClelland, and Schulze (1992) compare two experiments using either loaded or neutral wording and find no difference in behavior.
12

endowed with 15 points (his show-up fee of €3) and was presented with a one-shot
decision. He had to decide how much of this endowment to invest in a risky asset and
how much to keep. There is an even chance for the investment to be a success or a
failure. In case it fails, the amount invested is lost; in case of a success, the investment
returns 2.5 times its amount. Each subject had also to choose one of two colors. If this
color is randomly drawn (with a 50% chance), the investment is a success. Since the
lottery gives an expected return of 1.25 point for each point invested, a risk-neutral
subject should invest his full endowment. The lower the amount invested in the risky
asset, the higher the degree of risk aversion. While the subjects chose the amount of their
investment and their color at the beginning of the session, the random draw was made
only at the end of the session in order not to influence behavior in the main game.
The "Physionomics lab". We proceeded to the simultaneous electrophysiological
recording of a group of 8 interactive subjects. Experimental sessions took place in a
noiseless room with stable temperature set to 21o C. Skin conductance activity was
recoded with a BIOPAC MP150W system and two TEL100C telemetry modules
(BIOPAC Systems, EU). Two Ag/AgCl electrodes filled with 0.5% saline in a neutral
base paste were placed on the subject’s distal phalanges of the middle and the index
fingers of the non-dominant hand, after the attachment site had been cleaned with a
neutral soap (Dawson et al (2000)). A constant voltage of 0.5V was applied between the
electrodes. The skin conductance signal was amplified (x2000) and low-pass filtered
(30Hz) before being sampled at 125Hz. Skin conductance activity was continuously
recorded until the end of the session
13

Skin conductance data analysis. Skin conductance signal was low-pass filtered at 0.5Hz
offline, using a 5th order Butterworth low-pass digital filter. SCRs’ onset and peak were
automatically detected, when the first derivative of the filtered signal changed sign, by a
program written in Matlab (The MathWorks Inc., EU). The detection of an accelerative
deflection, during the onset and peak period (SCR’s rise time), indicated a SCR
overlapping. In the case of overlapping, the two SCRs were i) split, if they could be
related to different events (according to criteria described below), or ii) summed together
(see Boucsein (1992), p.136). The whole signal was visually inspected prior to further
analysis and false SCR detections were removed. The SCR amplitude was calculated as
the difference between the signal amplitude at the peak and the onset times. The SCR
amplitude was thresholded at 0.02 µS (Dawson et al (2000)). Skin conductance
responses were analyzed for the decision, the feedback on audit and the feedback on
payoffs events, only.13 Skin conductance responses with onset between 0.7 and 3.7 s,
after the beginning of an audit or payoff, were assumed specific to the event. With
respect to the decision event, given its self-paced duration, specific SCRs were allowed
onset time from 0.7 s after the subject is informed on his income, until the subject’s
decision. In order to minimize SCRs overlapping between events, we imposed a
minimum time interval of 6 seconds between adjacent events.
Affective self-reports. At the end of each period, the subjects had to report their feelings
at the moment of the audit by means of two 7-point Likert-type scales of emotional
arousal (from extremely weak to extremely strong) and hedonic valence (from extremely
negative to extremely positive). These affective self-reports were aimed at a consistency 13 The analysis of the SCRs related to the feedback on payoffs is not reported here because it does not bring more information than the analysis of the SCRs related to decision and audit.
14

check with the physiological measures. The physiological measures provide an
autonomic measure of the subject’s emotion; while the affective self-reports unveil,
backwardly, the subjective emotional experience. An adequate assessment of emotions
requires an integration of behavior, verbal-report and physiology (Bradley and Lang,
2001). A positive correlation between physiological and self-report measures is
expected. They should however be considered complementary rather than redundant
measurement since they do not necessarily convey exactly the same information.
At the end of the session, once the 30 periods were completed, the subjects had to report
on a 7-point Likert-type scale their feelings (from extremely negative to extremely
positive) regarding three types of frauds.14 This attitudinal survey aimed at analyzing the
consistency of reporting behavior in the laboratory with the attitude towards fraud in
various real contexts. Next, the subjects had to click a button to draw the color that
determined whether the investment they made in the preliminary part of the experiment
was a success or not. Then, they completed a demographic questionnaire and they were
allowed to leave the laboratory.
On average, a session lasted 75 minutes including preparation of the subjects for the
physiological recording and including cash payment in private in a separate room. The
subjects were informed from the beginning of the session that a person who is not aware
of the content of the experiment would pay them.15 Payment consisted of the average
earnings in two randomly selected periods out of 30 in order to avoid possible 14 A question focused on tax evasion by a shopkeeper who receives payment in cash. The second question was related to an individual who use public transportation without buying a ticket. The last scenario was related to a driver who does not respect the Highway Code. 15 Indeed, it was important to avoid that some subjects worry that they might not get invited back for more experiments if the experimenter knew that they cheated. Similarly, it was made knowledge that all decisions were anonymous.
15

accumulated wealth effects. The subjects received a show-up fee of 3€. On average, they
earned €19.33.
3. RESULTS
An overview of our experimental results is that we find substantial treatment
effects on the reporting decision, as an environment where evading behavior is made
public reduces the proportion of evaders. The results show that evading taxes raise
emotions and that punishment, especially when it is made public, reinforces emotional
responses and their behavioral consequences. We first provide descriptive statistics on
individuals’ behavior. We then consider the determinants of such behavior, providing
regression analysis.
A. Summary statistics and non-parametric analysis
Table 1 displays some descriptive statistics.
16

Table 1. Summary statistics Benchmark
treatment Picture
Treatment All treatments
Proportion of reported income when income is 50 when income is 100 when income is 150 when income is 200
Proportion of evaders when income is 50 when income is 100 when income is 150 when income is 200
Proportion of punished subjects
Amount of taxes Amount of fines Payoffs
Emotions: SCR–decision in µSiemens Non evaders Evaders
Emotions: SCR – audit in µSiemens Non evaders
Evaders
Decision time in seconds Non evaders
Evaders
Self-reported emotional arousal: from 1 (extremely weak) to 7 (extremely strong) Non evaders Evaders Self-reported hedonic valence: from 1 (extremely negative) to 7 (extremely positive) Non evaders Evaders
60.71 (34.32) 64.27 (44.14) 64.96 (33.00) 58.75 (30.40) 54.86 (26.49)
78.06 (41.42) 51.67 (50.11) 76.67 (42.41) 89.44 (30.81) 94.44 (22.97)
37.92 (48.55)
55.11 (30.22) 7.39 (5.55)
67.08 (39.21)
0.16 (0.27) 0.09 (0 .17) 0.18 (0.29) 0.13 (0.27) 0.05 (0.19) 0.15 (0.28)
12.68 (7.76) 9.73 (5.92)
13.51 (8.02)
3.91 (1.70) 3.15 (1.80) 4.12 (1.61)
3.97 (1.66) 4.32 (1.32) 3.87 (1.74)
67.66 (34.02) 70.41 (43.15) 73.05 (34.73) 68.48 (28.28) 58.69 (25.73)
67.22 (46.97) 37.78 (48.62) 56.11 (49.76) 82.22 (38.34) 92.78 (25.96)
35.56 (47.90)
58.18 (29.64) 7.06 (5.38)
64.31 (36.78)
0.15 (0.25) 0.09 (0 .22) 0.17 (0.26) 0.13 (0.25) 0.04 (0.11) 0.17 (0.29)
10.42 (5.73) 8.92 (5.57) 11.15 (5.66)
3.90 (1.81) 3.08 (1.78) 4.30 (1.69)
3.94 (1.72) 4.24 (1.32) 3.80 (1.87)
64.18 (34.34) 67.34 (43.70) 69.00 (34.07) 63.61 (29.72) 56.77 (26.15)
72.64 (44.60) 44.72 (49.79) 66.39 (47.30) 85.83 (34.92) 93.61 (24.49)
36.74 (48.23)
56.65 (29.96) 7.23 (5.46)
65.70 (38.03)
0.16 (0.26) 0.09 (0.21) 0.18 (0.27) 0.13 (0.26) 0.05 (0.15) 0.16 (0.29)
11.55 (6.91) 9.25 (5.72)
12.42 (7.12)
3.90 (1.75) 3.11 (1.79) 4.20 (1.65)
3.96 (1.69) 4.27 (1.32) 3.84 (1.80)
Number of observations Proportion of males Average amount invested Percentage of negative sentiments regarding
Shopkeepers evading taxes Contraveners with highway code Fare dodgers
720 720 1440 62.50 (48.43) 9.38 (3.58)
54.17 (49.84) 85.42 (35.31) 50.00 (50.02)
Note: The Table indicates average values; standard deviations in parentheses. Regarding the reporting behavior, Table 1 indicates three important elements. First, the
proportion of reported income declines in the level of income. This is confirmed by non-
17

parametric statistics.16 The second result is that the reporting behavior is affected by the
Picture treatment. For each income level, the proportion of reported income is higher in
an environment where underreporting may be made public (but the Mann-Whitney tests
fail concluding on significant differences). Figure 1 illustrates this result.
40
45
50
55
60
65
70
75
50 100 150 200
Income levels
Benchmark TPicture T
Figure 1. Proportion of reported income by treatment and by income level
The proportion of evaders follows a similar pattern as the proportion of reported income,
as illustrated by Figure 2.
0
10
20
30
40
50
60
70
80
90
100
50 100 150 200
Income levels
Benchmark TPicture T
Figure 2. Proportion of evaders by treatment and by income level 16 In all the reported non-parametric tests, a session is considered as one independent observation. According to Wilcoxon signed-rank tests, the average proportion of reported income is significantly lower at the 5% level when we compare individuals who receive an income of 200 with individuals who receive an income of 150 (p = 0.046), 100 (p = 0.028), and 50 (p = 0.046). It is significantly lower at the 10% level, when we compare individuals who receive an income of 150 with individuals who receive an income of 100 (p = 0.075). The average reported proportion is not significantly different when we consider incomes of 50 and 100.
18

Table 1 and Figure 2 show that the proportion of evaders increases with income (all pair-
wise comparisons indicate that the differences are significant at the 5% level)17 and that it
is significantly lower in the Picture treatment (p = 0.078).
t is 37.92% in the Benchmark
treatment. It is slightly lower in the Picture treatment (35.56%), but not significantly so
(Mann-Whitney test, p > 0.10). These proportions should be 50% if all participants had
chosen the evasion strategy, but a t-test concludes that these proportions are significantly
lower than 50% (p < 0.001). Average taxes, fines and payoffs follow, as expected, the
same pattern as the proportion of reported income.
about emotions, as measured by Skin
Conductance Responses. SCR is described by its amplitude and is expressed in
µSiemens. First, the average SCR amplitude is significantly higher when people
underreport than when they comply (Wilcoxon test: p = 0.028). It is twice as high when
related to the reporting decision and three times higher when related to the feedback on
audit. Indeed, we would expect non-evaders to be less emotionally aroused when
receiving the feedback on audit since they do not risk any punishment. This explains that
the average response of all the subjects is higher in the decision phase than in the audit
phase (Wilcoxon test: p = 0.046).
the proportion of reported income. Figures 3a and 3b
break down the SCR measures by proportion of reported income and by treatment.
Third, the average proportion of participants being caugh
Table 1 delivers also three important observations
Second, SCR is inversely related to
17 The Mann-Whitney tests indicate that the proportion of evaders when the income is 200 is significantly higher than when the income is 150 (p = 0.034), 100 (p = 0.028) and 50 (p = 0.028). This proportion when the income is 150 is significantly higher than when the income is 100 (p = 0.046) and 50 (p = 0.028). It is also significantly higher when the income is 100 than when it is 50 (p = 0.034).
19

Figures 3. SCR by proportion of repo
Figures 3a and 3b show that at both repor ng and audit moments, emotional arousal
increases w at for the
subjects reporting between 26% and 75% of their income, the Picture treatment is more
arousing than the other treatment (Mann-Whitney tests: p = 0.037 for the SCR measured
at the time of decision, and p = 0.004 for the SCR measured at the time of audit). In this
treatment, when the subjects report a very low proportion (less than 26%), the SCR is not
higher than when subjects report between 26 and 50% of their income (the difference is
not significant, p > 0.10). This may be due to a selection bias, i.e. a fraction of those
people who almost report nothing in this environment are more likely to have no psychic
cost in evading taxes. This explains why the average SCRs, both at the time of decision
and audit, do not differ much by treatment in Table 1, when we do not control for the
proportion of reported income (Mann-Whitney tests indicate that the differences are not
significant: p > 0.10).
0
0,05
0,1
0,15
0,2
0,25
76-100 51-75 26-50 0-25
Proportion of reported income
Benchmark TPicture T
0
0,05
0,1
0,15
0,2
76-100 51-75 26-50 0-25
Proportion of reported income
0,250,3
Benchmark TPicture T
a) SCR at the time of reporting b) SCR at the time of audit
rted income and by treatment
ti
hen the proportion of reported income decreases. They also reveal th
20

Third, the level of SCR differs over time. Figure 4 displays the evolution over time of
the proportion of reported income and of the SCR amplitudes with respect to reporting
decision and to audit. Periods 1 to 5, 11 to 15, and 21 to 25 correspond to the Benchmark
treatment; the other sequences correspond to the Picture treatment.
Figure 4. Evolution of the proportion of reported income and of the SCR amplitude related to reporting decision and to audit
Figure 4 shows a specific pattern of SCR am litude at the beginning of the experiment.
Both measures indicate periods of the game.
his contributes to level off the differences in average SCR across treatments. Figure 4
also indicates that at the beginning of each sequence of the Picture treatment, SCR is
shifting upwards relatively to the last period of the previous sequence under the
Benchmark treatment. The proportion of reported income also increases when one
switches to the Picture treatment.18 We can also observe that after a peak, the amplitude
p
the highest level of SCR in the first three
T
18 This increase in the first periods of the Picture treatment cannot be attributable to a pure restart effect since we do not observe such a peak when switching to the Benchmark treatment.
21

of SCRs in this treatment is not sustained and that the proportion of reported income
decreases when one switches to the Benchmark treatment.
B. Regression analysis
It appears that there are su iduals’ behavior across
treatme
bstantial differences in the indiv
nts. We now turn to a regression analysis of the determinants of the observed
behavior. A difficulty is that the reporting behavior and the emotional arousal may be
both endogenous. To control for the potential endogeneity bias in the estimations, we use
a two-step procedure. We first estimate the determinants of the proportion of reported
income. The predicted proportion of reported income derived from this first regression is
then introduced as an instrument in the next equations estimating the determinants of the
SCR amplitude at the time of reporting and at the time of audit. Table 2 presents the
results of the random-effects Tobit regression of the proportion of reported income. We
use a Tobit model since in 11.93% of the observations, the subjects report a null income
and in 27.95% of the observations, they report their income in full. The significant
ρ coefficient in the regression confirms the necessity of a panel model to allow for the
bjects’ heterogeneity by including individual random effects.
su
22

Table 2. Determinants of the proportion of reported income Dependent variable:
Proportion of reported income Random-effects Tobit model
Treatments Coefficient Std.-error
Income Picture treatment Time trend Decision Decision time Sanction in the prev
of the fine in the previous period
tion
ersity education
Shopkeepers evading taxes with highway code
0.-1.054
-1 - 1 -1 *
0 3
-0.173*** 11.232***
0.022.13
time 2
ious period Amount Male Risk attitudeBusiness educaMother with univLoan for paying studies Negative opinion on: Contraveners Fare dodgers Constant
112 **
0.137 0.507
0.027** 6.019*
-0.710** -12.659***
.021***15.638***3.963***8.845**
5.191*
31.737*** 11.159*** 70.015***
0.014 3.180 0.346 3.246 0.353 2.778 2.733 3.182
3.009 4.102 2.722 7.679
Number of observations Nb of left censured observations (%) Nb of right censured observations (%) Log Likelihood Wald χ 2
Prob > χ 2 ρ
1392 166 (11.93) 389 (27.95) -4703.217 394.900
0.000 0.421**
Note: *, **, and
*** indicate statistical significance at the 0.10, 0.05, an pectively.
le 2 confirms that the proportion of reported income sely related to the
subject’s income level, its most important finding lies in ct of the treatment
ariable. Indeed, it shows that an environment where a subject’s tax evasion is made
public through the public display of his picture favors tax compliance relative to an
environment where a detected fraud is only punished by monetary sanctions. Such an
impact of the Picture treatment is all the more remarkable as there is no public good
dimension in our tax game. We can indeed expect that redistributing the product of taxes
among the subjects would increase even further the impact of the perspective of non-
monetary sanctions. A candidate explanation is the valence and the intensity of emotions
raised by the perspective of such a non-monetary sanction. Tax compliance is also
d 0. , res01 level
If Tab is inver
the impa
v
23

marginally reinforced by a sanction in the previous period. In contrast, it is negatively
affected by the amount of the associated fine. Individuals may attempt to regain a
previous loss by evading more in the current period (see Tversky and Kahneman (1991)
for a possible explanation in terms of reference dependence).
Interestingly, we also find that the extent of tax evasion is associated, although
nonlinearly, with a longer decision time. This complements the observation from Table 1
that evaders take on average more time to make their decision than non-evaders (12.42
Individual characteristics also influence tax compliance. As usual in the experimental
literature on tax evasion (Slemrod, 2007), we find that males report a lower proportion of
their income than females. Not surprisingly, risk attitude (captured by the amount
seconds and 9.25 seconds, respectively). This could be associated with the higher
cognitive requirement involved by the decision to evade taxes if the subject tries to
elaborate mixed strategies.
invested in the risky asset in the preliminary part of the experiment) is associated with a
lower proportion of reported income.19 A business education prepares the subjects to
evade more, probably because these subjects are more used to calculate the return of a
risky decision. The literature has shown that the level of wealth influences tax
compliance (Slemrod, 2007). This is captured in our regression through the level of
education of the subject’s mother and through the existence of a loan to pursue studies.20
Results show that less wealthy subjects evade more, possibly because the financial 19 The average amount invested in the lottery is about 9 points out of a possible 15 points. It suggests a fairly high average level of risk aversion. Almost 19% of the subjects chose to invest all their points in the lottery and are considered the less risk averse participants.
l informed.
20 Asking direct questions on individual resources does not constitute a better alternative since almost nosubject is working while studying. Asking about the parents’ income is not better because some students are reluctant to report this information or are simply not wel
24

pressure is stronger than for the wealthier subjects. Lastly, the regression shows that the
subjects who consider negatively shopkeepers evading taxes, drivers contriving the
Highway Code and fare dodgers, consistently report a higher proportion of their income
relatively to the other subjects.
After analyzing the determinants of the reporting decision, we next focus on the
determinants of the physiological SCR amplitude, by means of random-effects Tobit
SCR amplitude at the time of decision s Tobit model
models, in connection with tax-paying behavior. Table 3 reports the determinants of the
SCR amplitude when subjects report their income and Table 4 the determinants of the
SCR amplitude when receiving a feedback on audit. In both tables, we include the
predicted value of the proportion of reported income resulting from the previous
regression as an instrument to control for potential endogeneity.
Table 3. Determinants of the SCR amplitude at the time of decision
Dependent variable: Random-effect
Treatments Coefficient Std-error Proportion of reported income Picture treatmeTime tDecision time Decision time 2
-0.011*** 0.0-0.006
0.002 nt
rend
Risk attitude Male Constant
87*** ***
0.019 0.001
0.014*** -0.0001 -0.001 0.024
0.560***
0.004 0.0001 0.005 0.050 0.168
Number of observations red observations (%)
d Nb of left censuLog LikelihooWald χ 2
Prob > χ 2 ρ
1392 509 (36.57)
-477.120 156.390 0.000
0.239**
Note: *, **, and *** indicate statistical significance at the 0.10, 0.05, and l, respectively.
0.01 leve
25

Table sh3 ows that the instrumented reported income affec atively the emotional
y take.
oreover, the Picture treatment has a strong positive and significant effect on emotions:
e 4 has shown that the decline in the SCR amplitude is
clearly visible at the beginning of the game. This phenomenon is typical of stimulus
ts neg
arousal. Subjects who evade more are more aroused, probably due to the risk the
M
the subjects are more emotionally aroused when placed in an environment with both
monetary and non-monetary sanctions relatively to an environment with monetary
sanctions only.
The time trend is negative and significant. Thus, as the game evolves, a lower SCR
amplitude is recorded. Figur
elicited SCRs and is known as SCR habituation.21 In addition, after a while, the subjects
have seen several pictures on their screen and they may realize that it is not uncommon to
underreport. Therefore, we observe a phenomenon of habitation that does not necessarily
mean an emotional disengagement, as shown below. Indeed, emotional disengagement
should motivate people to evade more over time, considering the expected return of
evasion. The proportion of reported income does not however change significantly over
time (see Table 2). Figure 4 even shows a slight increase in the proportion of reported
income in the last 10 periods. A possible interpretation is that the guilt and shame
experienced in the early periods have a lasting effect on reporting behavior. It must be
however acknowledged that the effect of time may be somewhat blurred by the sequence
of treatments over time.
21 As described by Dawson et al. (2000), “habituation is a ubiquitous and adaptive phenomenon whereby subjects become less responsive to familiar and non-significant stimuli”. In fact, SCR is expected to decline in amplitude and eventually disappear after the presentation of 2-8 similar trials, reappearing again after two or three periods of silent interval (Dawson et al. (2000)).
26

Table 2 has shown that the proportion of reported income decreases in the decision time.
Table 3 indicates that, controlling for reported income, more time taken to make a
s a feedback on audit.
decision increases significantly the emotional arousal when deciding. These two joint
results may suggest that the subjects need time to solve a conflict between the expected
payoff of underreporting and the social norm of non-cheating, and this raises stronger
emotions. Using different games, Rubinstein (2007) states that a higher decision time is
correlated with a higher subject’s cognitive activity and less emotional decisions. Our
observations suggest a different interpretation. A tension between rationality and norms
rises more decision time and more anticipated emotions. Last, Table 3 indicates that,
controlling for tax compliance, there is no gender effect in the emotional arousal.
Similarly, risk attitude influences the reporting decision, but not the emotional arousal
conditional on this reporting.
Table 4 displays the results of a random-effects Tobit regression in which the dependent
variable is the SCR amplitude when the subject receive
Table 4. Determinants of the SCR amplitude at the time of audit
Dependent variable: SCR amplitude at the time of audit
Random-effects Tobit model
Treatments Coefficient Std-error Proportion of repTime trend SanctioSanctioRisk attitude
-0.0060.0
0.163*** 0.039
orted income -0.013*** 0.003
n n with own picture displayed
Male Constant
*** 71**
0.001 0.033
0.009 0.014
0.526***
0.008 0.063 0.188
Number of observations Nb of left censured observations (%)
d Log LikelihooWald χ 2
Prob > χ 2
ρ
1392 763 (54.81)
-731.238 100.90 0.000
0.153**
Note: *, **, and *** indicate statistical significance at the 0.10, 0.05, and l, respectively. 0.01 leve
27

The SC aR mplitude consistently indicates that the emotional still increases in the
ing is
regarding audit offer a robustness check for our behavioral analysis based on
physio
larousa
degree of tax evasion when the subjects receive the feedback on audit. A major find
related to the perspective of both monetary and non-monetary sanctions on emotions at
the time of audit. When a subject has been audited and learns that he will be fined, he
shows a higher emotional arousal than a subject who is not audited or is audited but not
sanctioned. There is an additional and highly significant effect of the treatment: when the
evader learns that his own picture is going to be disseminated, his emotional arousal
further increases. Since the display of the picture means that the subject’s decision to
cheat is made public and that the subject may be recognized by the other players at the
end of the session, it is reasonable to assume that these emotions are related to shame,
whereas the emotions felt after an audit announcing a sanction in the Benchmark
treatment are better associated with internally-oriented emotions, such as guilt or regret.
C. A robustness check
The affective self-reports that have been collected at the end of each period
logical measures. Indeed, to some extent self-reports on emotional arousal should
corroborate these measures. In addition, since the SCR measures cannot indicate the
direction of emotions, self-reports can help us in making reasonable suggestions. Table 1
has already shown that the average emotional arousal, measured on a scale from 1
(extremely weak) to 7 (extremely strong), was higher for tax evaders (4.20) than for non-
evaders (3.11). Similarly, evaders report less positive hedonic valence regarding the
audit (3.84) than non-evaders (4.27), on a scale from 1 (extremely negative) to 7
28

(extremely positive). Providing a better-controlled analysis, Table 5 presents random-
effects GLS models of affective self-reports, in which we include the same explanatory
variables as in Tables 3 and 4. The first column estimates the determinants of the self-
reported emotional arousal; the second column aims at explaining the hedonic valence of
these emotions.
Table 5. Determinants of the level of affective self-reports (Random-effects GLS models)
onic valence Emotional arousal Hed
Coefficient Std-error Coefficient Std.-error Proportion of reported income Time trend Sanction Sanction with own picture displayed Risk attitude
-0.109***0.020***0.3
0.009 0.004
97
-0.044*** -0.001
-2.454
7
0.008 0.004
1
Male Constant
42*** 59***
0.00.10.4
0.111** -1.386*** 9.106***
18 0.045 0.340 0.703
*** 4
0.090.110.14
0.006 -0.305* .346***
0 0.019 0.158 0.499
Number of observations 2Wald χ
Prob > χ 2 R2
1392 31.79 .000
0.024
1392 1139.42
0.000 0.434
2 0
Note: *, **, and *** indicate statistical significan 0.10, 0.05, and 0.01 level, The
al arousal variable is coded from 1 (extrem to 7 (extremely high). The valence is ded from 1 (extremely negative) to 7 (e positive).
ce at the respectively. emotionvariable co
ely low) hedonic xtremely
This robustness check supports most of the previous results reported in Table 4. With
respect to the influence of evading taxes and subsequent sanctions, the first column of
Table 5 shows similar results for the affective self-reports than for the physiological
measures at the time of audit.22 In contrast to the SCR analysis however, the intensity of
affective self-reports does not decline over time. This suggests that the phenomenon of
habituation that we observed above plays an important role on modulating the SCR
amplitude although the experienced emotional arousal increases over time. In addition,
22 In addition, the simple correlation coefficient between the SCR amplitude at the time of the audit and the self-reported emotional arousal is significant and equal to 0.54.
29

the second column of Table 5 indicates that, controlling for sanctions, evasion is
associated with more positive emotions at the time of the audit. This could be caused by
relief when an evader is not audited and by the associated perspective of higher payoffs.
Not surprisingly, the subjects report more negative emotions when they are sanctioned,
with no specific effect of the picture dissemination.
If these regressions broadly support our SCR-based analysis and improve our
understanding of the direction of emotions, they also confirm that here, the SCR
4. CONCLUSION
The deterrence models of tax evasion have recently been extended to include moral
considerations. This paper explores a complementary avenue by testing the hypothesis
Our base design uses a tax game in which the players have to report their income and in
which the individual audit probability depends on the position relative to the median of
reported incomes. Skin Conductance Responses provide a physiological measure of the
measures and the self-reported emotions are more complement than substitutes.
Nevertheless, it should be noted that , due to their subjective nature, self-reports may be
biased. For example, males self-report less arousing emotions than females, whereas the
SCR-analysis concludes to the absence of significant difference by gender. Physiological
measures, uncontrolled by the subjects, are potentially more reliable than self-reported
measures.
that evading taxes generates emotions in the evaders. For example, the non-respect of
civic duty may generate guilt when the fraud is detected; and public information on the
cheating behavior of the evader may generate shame and embarrassment.
30

emotional arousal that is uncontrolled by the individuals and thus, less subject to
declarative biases. Our approach is original in three respects. First, we explore a new
hypothesis, i.e. the role of emotions in tax compliance. Second, we are able to
differentiate the impact of monetary vs. non-monetary sanctions on emotions by means of
an additional treatment in which the picture of deterred tax evaders is publicly displayed.
This helps in identifying the role of anticipatory (risk-related) and anticipated emotions.
Third, we have studied physiological measures of emotions for several individuals
interacting in a group.
Our results are striking. The subjects evade less after having been punished and when
they are in an environment when monetary and non-monetary sanctions are present
together. We show that the relationship between punishment and compliance is mediated
There are reasons for caution in extrapolating these results. In particular, students may
not be representative of taxpayers. One can however be relatively confident in the
external validity of these results because if one observes that emotions arise even with
by emotions. Emotions are elicited both at the moment of reporting and when subjects
receive a feedback on their report's audit. Emotional arousal increases in the intensity of
tax evasion and in the perspective of both monetary and non-monetary sanctions. The
strong impact of the public display of the evaders' pictures on the emotional arousal is
interpreted in terms of shame. There is a disutility of being identified as a cheater in a
group although rationality justifies tax evasion and although the subjects learn over time
that there are other evaders in the group.
small monetary stakes in the lab, they should be even greater when a yearly income is at
stake in actual reporting decisions. Keeping these limitations in mind, one can however
31

derive three main implications of these results. First, they suggest that tax compliance
may be guided by the willingness to avoid experiencing negative emotions raised by a
potential detection. Second, the reporting decision is likely to result from the solution of
a tension in the individual's mind between the expected monetary reward of tax evasion
that motivates underreporting, and its expected moral cost that motivates compliance.
Solving this tension is cognitively demanding and this could explain why we find a
positive correlation between the decision time, the emotional arousal and the importance
of evasion. This supports modeling strategies that include the psychic costs of evading in
the taxpayer's utility function in interaction with its expected monetary payoff. A third
implication of our results is a policy perspective. Indeed, income reporting increases
when non-monetary sanctions are at risk, because the evaders who bear such sanctions
experience negative social emotions. Therefore, a policy threatening to denounce
cheaters publicly might contribute to reduce fiscal fraud.
32

REFERENCES
Allingham, M., Sandmo, A. (1972). Income Tax Evasion: A Theoretical Analysis. Journal of Public Economics 1(3-4), 323-338.
Alm, J. (1991). A Perspective on the Experimental Analysis of Taxpayer Reporting. The Accounting Review 66(3), 577-593.
Alm, J., McClelland, G.H., Schulze, W.D. (1992). Why do people pay taxes? Journal of Public Economics 48, 21-48.
Alm, J., Cronshaw, M.B., McKee, M. (1993). Tax compliance with endogenous audit selection rules. Kyklos 1, 27-45.
Alm J., McKee, M. (2006). Audit Certainty, Audit Productivity and Taxpayer Compliance. National Tax Journal 59, 801-16.
Andreoni, J., Erard, B., Feinstein, J. (1998). Tax Compliance. Journal of Economic Literature 36, 818-860.
Bault, N., Coricelli, G., Rustichini, A. (2007). Interdependent utilities: How social ranking affects choice behavior. Mimeo.
Bayer, R.C., Sutter, M. (2004). The excess burden of tax evasion – an experimental detection-concealment contest. Mimeo.
Blumenthal, M., Christian, C., Slemrod, J. (2001). Do Normative Appeals Affect Tax Compliance? Evidence from a Controlled Experiment in Minnesota. National Tax Journal 54(1), 125-138.
Bosco, L., Mittone, L. (1997). Tax evasion and moral constraints: some experimental evidence. Kyklos 50, 297-324.
Boucsein, W. (1992). Electrodermal Activity. Plenum Series in Behavioral Psychology and Medicine, Plenum.
Bradley, M.M. (2000). Emotion and motivation. In J.T. Cacioppo, L.G. Tassinary, G.G. Berntson (Eds). Handbook of Psychophysiology. Cambridge, MA: Cambridge University Press.
Bradley, M.M., Lang, P.J. (2001). Measuring emotion: behavior, feeling and physiology. In R. Lane, L. Nadel (Eds). Cognitive Neuroscience of Emotion. Oxford: Oxford University Press.
Charness, G., Gneezy, U. (2003). Portfolio Choice and Risk Attitudes: An Experiment. Mimeo.
Collins, J.H., Plumlee, R.D. (1991). The taxpayer's labor and reporting decision: The effect of audit schemes. The Accounting Review 66, 559-576.
Coricelli, G., Dolan R.J., Sirigu, A. (2007). Brain, emotion and decision making: the paradigmatic example of regret. TRENDS in Cognitive Sciences 11, 258-265.
Cowell, F. (1990). Cheating the Government: The Economics of Evasion. Cambridge, MA: MIT Press.
Cummings, R.G., Martinez-Vazquez, J., McKee, M., Torgler, B. (2007). Effects of Tax Morale on Tax Compliance: Experimental and Survey Evidence. NCER Working Paper n°12.
33

Damasio, A.R. (1994). Descartes’ Error, New York: Avon.
Dawson, M. E., Schell, A. M., Filion, D. L. (2000). The electrodermal system, in Cacioppo, J. T., Tassinary, L. G., and Berntson, G. (Eds.). Handbook of Psychophysiology, 2nd ed., Cambridge: Cambridge University Press.
Elffers, H. (1991). Income Tax Evasion: Theory and Measurement. Deventer: Kluwer Academic Publishers.
Fortin, B., Lacroix, B., Villeval, M.C. (2007). Tax Evasion and Social Interactions. Journal of Public Economics, Forthcoming.
Frijda, N. (1986). The Emotions. Cambridge: Cambridge University Press. Harbaugh W.T., Mayr, U., Burghart, D.R. (2007). Neural Responses to Taxation and
Voluntary Giving Reveal Motives for Charitable Donations. Science, Forthcoming. Kahneman, D., and Miller, D. (1986). Norm Theory: Comparing reality to its
alternatives. Psychological Review 93, 136-153. Lazarus, R.S. (1991). Emotion and adaptation. New York: Oxford University Press. Lowenstein, G.F., Hsee, C.K., Weber, E.U., Welch, N. (2001). Risk as Feelings.
Psychological Bulletin 127, 267-286. Myles, G.D., Naylor, R.A. (1996). A Model of Tax Evasion with Group Conformity and
Social Customs. European Journal of Political Economy 12(1), 49-66.
Pommerehne, W.W., Hart, A., Frey, B.S. (1994). Tax morale, tax evasion and he choice of policy instruments in different political systems. Public Finance 49, 52-69.
Rubinstein A. (2007). Instinctive and Cognitive Reasoning: A Study of Responses Times. Economic Journal, Forthcoming.
Russell, J.A., Mehrabian, A. (1977). Evidence for a three-factor theory of emotions Journal of Research in Personality 11, 273-294.
Schwartz, R., Orleans, S. (1967). On legal sanctions. University of Chicago Law Review 34, 282-300.
Slemrod, J. (1998). On voluntary compliance, voluntary taxes, and social capital. National Tax Journal LI, 485-492.
Slemrod, J. (2007). Cheating Ourselves: The Economics of Tax Evasion. Journal of Economic Perspectives 21(1), 25-48.
Spicer, M.W., Thomas, J.E. (1982). Audit probabilities and the tax evasion decision: An experimental approach. Journal of Economic Psychology 2, 241-245.
Torgler, B. (2002). Speaking to theorists and searching for facts: Tax morale and tax compliance in experiments. Journal of Economic Surveys 16(5), 657-683.
Torgler, B. (2004). Moral suasion: An alternative tax policy strategy? Evidence from a controlled field experiment in Switzerland. Economics of Governance 5(3), 235-253.
Tversky, A., Kahneman, D., (1991). Loss aversion in riskless choice: A reference dependent model. Quarterly Journal of Economics 106(4), 1039-61.
34

U.S. Department of the Treasury, Internal Revenue Service. (2006). Updated Estimates of the TY 2001 Individual Income Tax Underreporting Gap. Overview. Washington, D.C.: Office of Research, Analysis and Statistics.
Wenzel, M. (2004). An analysis of norm processes in tax compliance. Journal of Economic Psychology 25, 213-228.
Yitzhaki, S. (1974). A note on 'Income Tax Evasion: A Theoretical Analysis.' Journal of Public Economics 3(2), 201-202.
Zajonc, R.B. (1980). Feeling and Thinking: Preferences Need No Inferences. American Psychologist 35, 151-175.
Zeiliger, R. (2000). A Presentation of Regate, Internet Based Software for Experimental Economics, http://www.gate.cnrs.fr/~zeiliger/regate/RegateIntro.ppt, GATE. Lyon: GATE.
35

APPENDIX. Instructions
We thank you for participating in this experiment on decision-making designed by researchers from the University of Montreal, the Institute of Cognitive Sciences and the GATE research institute at the University of Lyon. This experiment consists of several independent parts. During these parts, all transactions are expressed in points, with
100 points = 20 Euro
We will first distribute the rules for the preliminary part; the instructions for the next parts will be distributed later.
Instructions for the preliminary part
Description of the task
You receive a show-up fee of �3, equivalent to 15 points. We ask you to choose the amount of points (between 0 and 15 points, included) that you are willing to invest on a risky asset. You keep the points that are not invested. The investment There is a 50% chance that the investment is a success. If the investment is a success, you earn 2.5 times the amount that you have invested. If the investment is not a success, you lose the amount that you have invested.
1st example: You invest 0 point. You earn: (15 –0) = 15 points
2nd example: You invest 6 points. If the investment is a success, you earn: (15 – 6) + (2.5*6) = 24 points. If the investment is not a success, you earn: (15-6) + 0 = 9 points.
3rd example: You invest 15 points. I f the investment is a success, you earn: (15 – 15) + (2.5*15) = 37 points. If the investment is not a success, you earn: (15-15) + 0 = 0. How is the success of the investment determined? You are required to choose one color, either white or black. At the end of the session, you will have to press a button ÿ random draw Ÿ that will appear on your computer screen. The computer program selects randomly one of the two colors. If the randomly drawn color is the color you have chosen, your investment is a success. If the randomly drawn color is not the color you have chosen, your investment is not a success. To sum up: You choose now the amount you are willing to invest; then, you choose a color. At the end of the session, after the other parts have been completed, you will press the random draw button. The computer program will inform you whether the investment is a success and the amount of your earnings for this part. This earning will be added to your earnings of the previous parts.
If you have any question regarding these instructions, please raise your hand. Somebody will answer your questions in private. You are not allowed to communicate with the other subjects throughout the session.
Instructions for the following parts (Distributed after the preliminary stage has been completed) These instructions explain the next 6 independent parts. Each part consists of 5 independent periods. In each of the 30 periods, you have to make one decision. Your earnings depend on your decisions and of the decisions of the 7 other participants in this session.
At the end of the session, we will draw randomly 2 periods among these parts. We will compute the average of your earnings in points during these two periods and these points will be concerted into Euros. The amount of money that you will earn, added to your payoff in the preliminary part, is confidential. Somebody who is not aware of the content of the experiment will pay you in cash and in private in a separate room.
36

Decision rules for the 5 periods of the first part
At the beginning of each period, you receive an income. Your income can take the value 50, 100, 150, or 200 points. Your income is selected among these values by the computer program.
We ask you to pay a tax on your income. This tax rate is 55%. It is the same for all the participants in this session. The product of the taxes will be used to fund the participants to other experiments.
To answer this demand, you must report an amount that lies between 0 and the income you have received. The 55% tax rate is applied to the amount you have decided to report. After you have made your choice, you must click the OK button on your screen to validate your decision; once you have clicked this button, you cannot change your choice anymore.
The computer program can control your reported income according to a certain audit probability and this audit can entail the payment of a fine.
Your probability of being audited is determined as follows:
• If your reported income is among the 4 lowest reported incomes in the room in the current period , the audit probability is 65%. Therefore, you have 65 chances out of 100 to have your report audited.
• If your reported income is among the 4 highest reported incomes in the room in the current period, the audit probability is 35%. Therefore, you have 35 chances out of 100 to have your report audited.
If all the participants report the same income, an average audit probability, equal to 50%, is applied to each participant.
If an audit is conducted and if it reveals that you have reported an amount lower than your actual income, you have to pay both:
1) the tax on your actual income, i.e. 55% of your actual income 2) and a fine, which is determined as explained below.
Determination of your payoff in each period
At the end of each period, your net payoff is determined as follows. 3 cases may occur.
If your reported income is not audited, the tax rate is applied to the amount you have reported. Your net payoff is determined according to the following formula:
Net payoff = income – tax with tax = 55% of the reported income
If your reported income is audited and if it is equal to your actual income, the tax rate is also applied to your reported income. Your net payoff is determined according to the following formula:
Net payoff = income – tax with tax = 55% of the reported income
If your reported income is audited and if it is lower than your actual income, the tax rate is applied to your actual income. One subtracts from your payoff a fine that is equal to 20% of the tax on the income that you did not report. Your net payoff is determined according to the following formula:
Net payoff = income – tax – fine with tax = 55% of the income
and fine = 20% 55% (non reported income)
Note that the computer program rounds up the decimals when appropriate.
At the end of each period, you are informed on the following elements: - whether your report has been audited or not - the total amount of your tax (including the fine if appropriate) - your net payoff.
You are not informed on the incomes, the reported amounts, and the payoffs of the other participants.
37
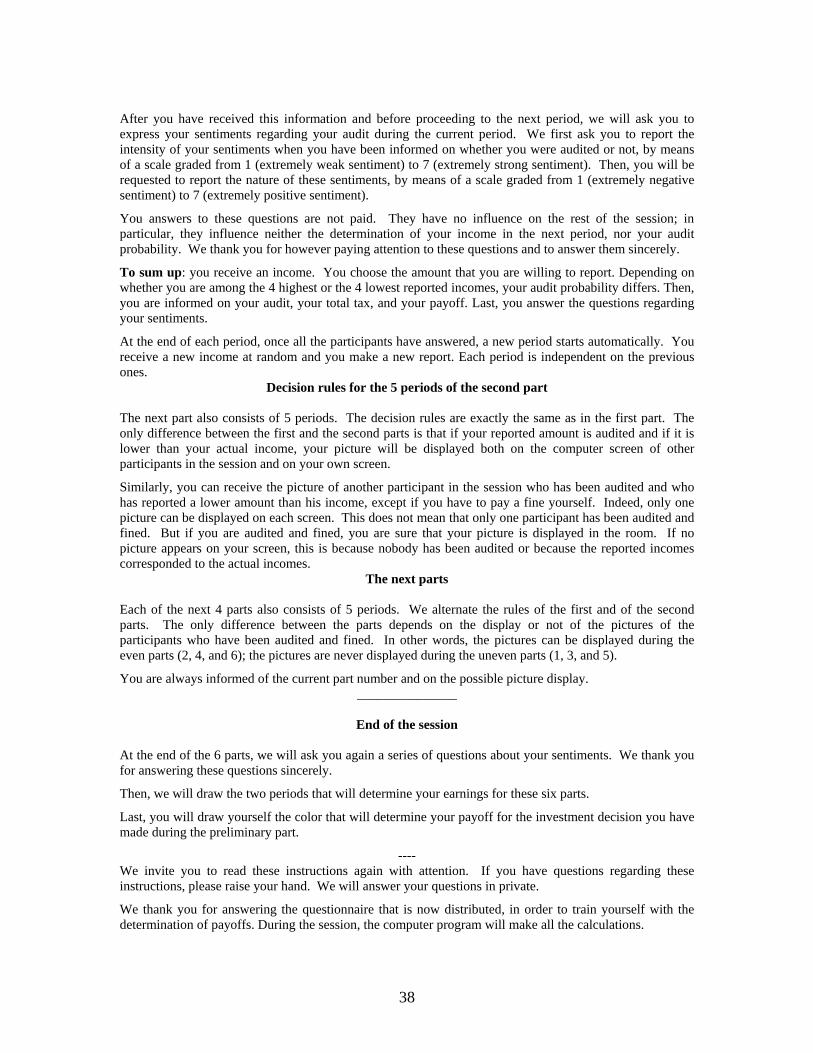
After you have received this information and before proceeding to the next period, we will ask you to express your sentiments regarding your audit during the current period. We first ask you to report the intensity of your sentiments when you have been informed on whether you were audited or not, by means of a scale graded from 1 (extremely weak sentiment) to 7 (extremely strong sentiment). Then, you will be requested to report the nature of these sentiments, by means of a scale graded from 1 (extremely negative sentiment) to 7 (extremely positive sentiment).
You answers to these questions are not paid. They have no influence on the rest of the session; in particular, they influence neither the determination of your income in the next period, nor your audit probability. We thank you for however paying attention to these questions and to answer them sincerely.
To sum up: you receive an income. You choose the amount that you are willing to report. Depending on whether you are among the 4 highest or the 4 lowest reported incomes, your audit probability differs. Then, you are informed on your audit, your total tax, and your payoff. Last, you answer the questions regarding your sentiments.
At the end of each period, once all the participants have answered, a new period starts automatically. You receive a new income at random and you make a new report. Each period is independent on the previous ones.
Decision rules for the 5 periods of the second part The next part also consists of 5 periods. The decision rules are exactly the same as in the first part. The only difference between the first and the second parts is that if your reported amount is audited and if it is lower than your actual income, your picture will be displayed both on the computer screen of other participants in the session and on your own screen.
Similarly, you can receive the picture of another participant in the session who has been audited and who has reported a lower amount than his income, except if you have to pay a fine yourself. Indeed, only one picture can be displayed on each screen. This does not mean that only one participant has been audited and fined. But if you are audited and fined, you are sure that your picture is displayed in the room. If no picture appears on your screen, this is because nobody has been audited or because the reported incomes corresponded to the actual incomes.
The next parts Each of the next 4 parts also consists of 5 periods. We alternate the rules of the first and of the second parts. The only difference between the parts depends on the display or not of the pictures of the participants who have been audited and fined. In other words, the pictures can be displayed during the even parts (2, 4, and 6); the pictures are never displayed during the uneven parts (1, 3, and 5).
You are always informed of the current part number and on the possible picture display. _______________
End of the session
At the end of the 6 parts, we will ask you again a series of questions about your sentiments. We thank you for answering these questions sincerely.
Then, we will draw the two periods that will determine your earnings for these six parts.
Last, you will draw yourself the color that will determine your payoff for the investment decision you have made during the preliminary part.
---- We invite you to read these instructions again with attention. If you have questions regarding these instructions, please raise your hand. We will answer your questions in private.
We thank you for answering the questionnaire that is now distributed, in order to train yourself with the determination of payoffs. During the session, the computer program will make all the calculations.
38