SUBTITLE - The Education Trust · SUBTITLE July 28-29, 2016 Hyatt Regency Chicago Chicago,...
54
ESSA Boot Camp | July 2016 SUBTITLE July 28-29, 2016 Hyatt Regency Chicago Chicago, Illinois
-
Upload
nguyenphuc -
Category
Documents
-
view
215 -
download
0
Transcript of SUBTITLE - The Education Trust · SUBTITLE July 28-29, 2016 Hyatt Regency Chicago Chicago,...

ESSA Boot Camp | July 2016
SUBTITLE
July 28-29, 2016
Hyatt Regency ChicagoChicago, Illinois
ESSA Boot Camp | July 2016
Break Out Session: Indicators of College and
Career Readiness Presenters:
Kati Haycock, EdTrust
Cheryl Oldham, US Chamber
Caitlin Codella, US Chamber
Carrie Hahnel, EdTrust—West
ESSA Boot Camp | July 2016

ESSA Boot Camp | July 2016
These groups worked together to answer some critical questions about possible indicators• What might be important?
• How is it measured?
• What do data/research tell us?
• What are benefits/risks of including this measure in a school rating system
• If a state is headed toward using this measure, what questions should advocates ask? What should they watch out for?

ESSA Boot Camp | July 2016
Indicator-specific factsheets…Summarize what research and data tell us about an indicator, and highlight benefits and considerations related to rating schools on that indicator
Raise questions to ask if your state is considering including the indicator in school ratings

ESSA Boot Camp | July 2016
We also produced two other tools for advocates:
Indicators:
What to include in school ratings
Indicator
“Traffic Light” Table
ESSA Boot Camp | July 2016
Our focus today: Measures of college and
career readinessWe’ll discuss the college-related indicators first,
followed by a discussion of potential career-related indicators.
ESSA Boot Camp | July 2016
On the College side, we’ll look at:
• Courses• Completion of college prep curriculum
• Advanced courses (AP, IB and the like)
• Test-based Measures (like ACT, SAT)
• Percent of students who enter college (and percent who don’t need remediation)
8

ESSA Boot Camp | July 2016
General Theme
• On the course-taking indicators, important to understand there are two parts: participation and success. If states are going to measure one, they have to measure the other.
9

ESSA Boot Camp | July 2016
1. College prep course sequence completion
Definition: A recommended series of classes in high school, typically designed to be more rigorous than the standard course of study. May or may not be aligned with requirements for entry into the state higher ed system.
• For example: • In California: A-G Course completion is a recommended course sequence required to be completed in order to be
considered for admissions to a University of California school• Two years of history/ social science, English, and Mathematics; one year of Laboratory Science and of a language other
than English; four years of other “A-G” courses, including visual and performing arts and college prep-electives
• In Massachusetts: MassCore is a recommended program of studies intended to be more rigorous than the typical MA high school course of study
• Four years of English and Math; three years of history and a lab-based Science; two years of the same foreign language; one year of an arts program; five additional “Core” courses on subjects ranging from business to technology
Why it matters: Research shows that a rigorous course of study is key for success in college. Studies also show that a lot of students are “meandering toward graduation” rather than taking a coherent course of study.
10
ESSA Boot Camp | July 2016
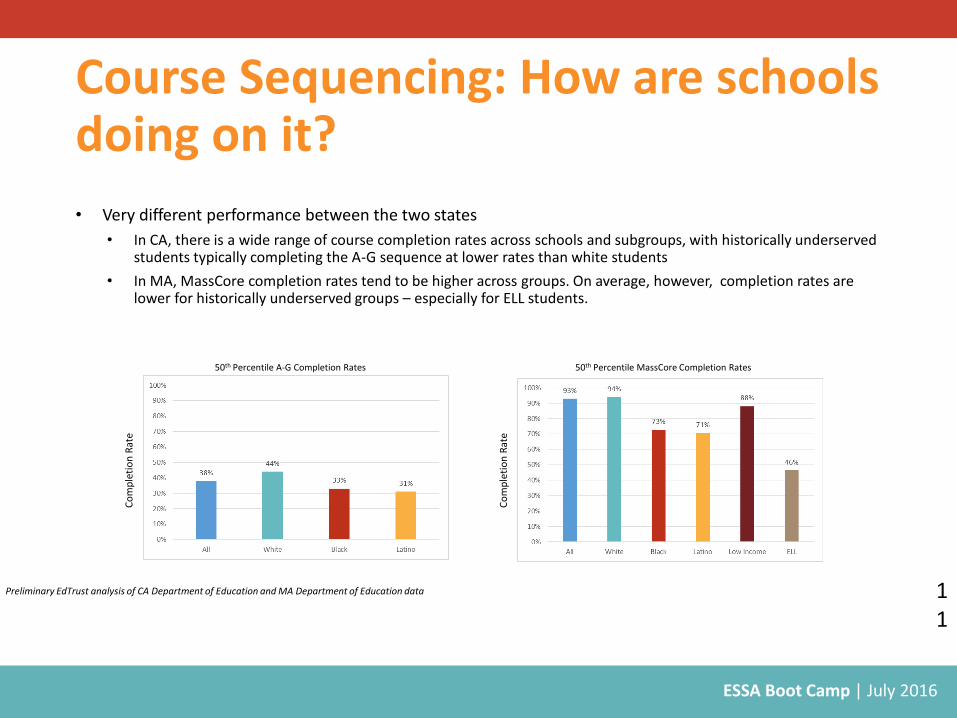
Course Sequencing: How are schools doing on it?
• Very different performance between the two states
• In CA, there is a wide range of course completion rates across schools and subgroups, with historically underserved students typically completing the A-G sequence at lower rates than white students
• In MA, MassCore completion rates tend to be higher across groups. On average, however, completion rates are lower for historically underserved groups – especially for ELL students.
50th Percentile A-G Completion Rates 50th Percentile MassCore Completion Rates
Co
mp
leti
on
Rat
e
Co
mp
leti
on
Rat
e
Preliminary EdTrust analysis of CA Department of Education and MA Department of Education data 11
ESSA Boot Camp | July 2016
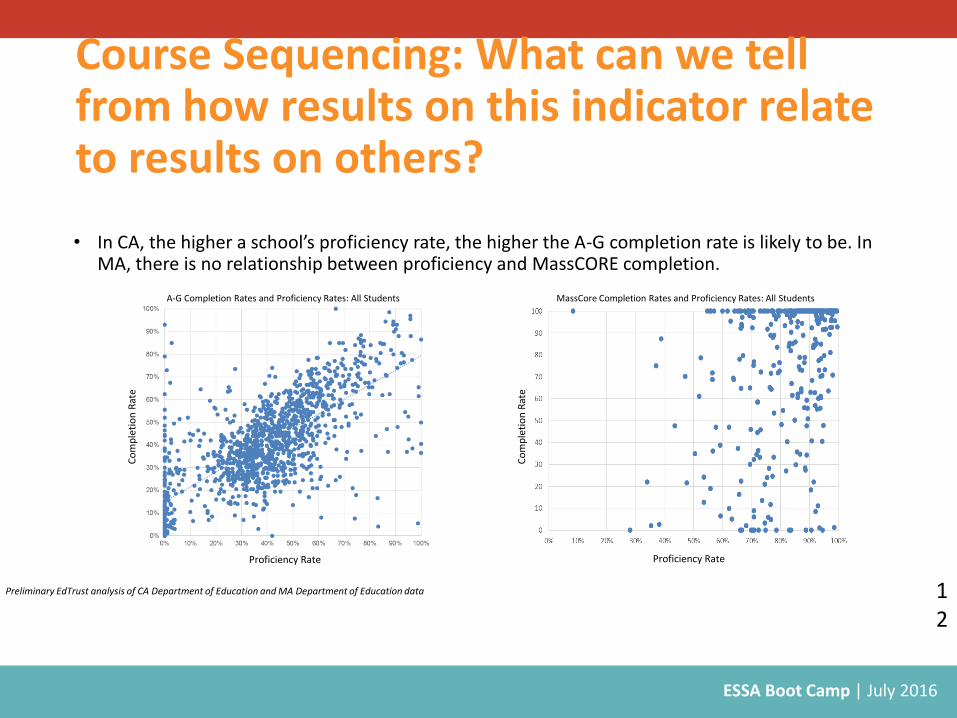
Course Sequencing: What can we tell from how results on this indicator relate to results on others?
• In CA, the higher a school’s proficiency rate, the higher the A-G completion rate is likely to be. In MA, there is no relationship between proficiency and MassCORE completion.
A-G Completion Rates and Proficiency Rates: All Students MassCore Completion Rates and Proficiency Rates: All Students
Proficiency RateProficiency Rate
Co
mp
leti
on
Rat
e
Co
mp
leti
on
Rat
e
Preliminary EdTrust analysis of CA Department of Education and MA Department of Education data 12
ESSA Boot Camp | July 2016
So what do we do with this?
• The data show big differences between the two states. What does that mean?• The way a college-prep curriculum is defined likely
matters.• In CA, there is greater alignment with higher education and
actual course certification by state institutions of higher education.
• This definition should be a key part of deciding whether the indicator can be used for accountability.
13

ESSA Boot Camp | July 2016
Course Sequence Completion: Implications for Accountability• Benefits:
• Sets the expectation that all students should complete a coherent course sequence
• Especially useful if sequence is aligned to the admissions requirements for the state system of higher education
• Is an indicator that may be relevant to students and parents
• Risks:• If not done thoughtfully, the
measure can be weak and not provide much information
• People could mistakenly think they will meet the admission requirements for state systems of higher education if this measure isn’t fully aligned with admissions requirements
• They may be pushback from CTE and arts educators if those courses are not reflected in the sequences
• Including this indicator in accountability could incentivize reduction in rigor for the courses 1
4
ESSA Boot Camp | July 2016
Considerations: If a state is considering this indicator, what are the key questions to ask?
• How is a “college prep curriculum” defined?• Does it align with courses required for college admission?• Is course content defined (especially in math and science)?
• Who gets access to it?• Recommended, required, default?
• How is it measured? • Participation, success or both?• Denominator 9th grade cohort or graduates?
15

ESSA Boot Camp | July 2016
2. Advanced Coursework
Definition: Courses that provide opportunity to earn college credit in high school. Includes, but may not be limited to, AP, IB, dual enrollment.
• This presentation focuses on AP courses, simply because there is a great deal of data available around them.
• The questions that we’ll surface are relevant to other types of advanced courses, too.
Why it matters: Programs like AP/IB are designed to provide high school students with a head start on a college education. But today, access to these classes (and success in them) is far from equal.
16

ESSA Boot Camp | July 2016
Advanced Courses: How are schools doing?
• In FL, we only had participation data for the all students group, which hovered around 30%.
• In MA, participation rates are often lower for historically underserved groups.
• Note: “Participation” was calculated differently for Florida and Massachusetts, so the two should not be compared.
• In MA, the participation rate is the percentage of all students in the school who took one or more AP exam.
• In FL, the participation rate is the percentage of all students in grades 10-12 who took one or more AP exam.50th Percentile AP Participation Rate - FL 50th Percentile AP Participation Rate - MA
Par
tici
pat
ion
Rat
e
Par
tici
pat
ion
Rat
e
Preliminary EdTrust analysis of FL Department of Education and MA Department of Education data 17

ESSA Boot Camp | July 2016
Advanced Courses: How are schools doing on it?
• In FL and MA, schools often have higher scores for their white students than for their students in historically underserved groups
• Note: “Success” was calculated differently for Florida and Massachusetts.
• In FL, success is the percentage of students scoring a 3 or higher on one or more AP exams.
• In MA, success is average score across all test takers and exams in the school.
50th Percentile AP Pass Rate - FL 50th Percentile Average AP Score - MA
Pas
s R
ate
Ave
rage
Sco
re
Preliminary EdTrust analysis of FL Department of Education and MA Department of Education data 18

ESSA Boot Camp | July 2016
Advanced Courses: What can we tell from how results on these indicators relate to results on others?
• In both MA and FL, there are generally positive relationships between participation/success and proficiency rates across groups
• There is an exception here for ELL students in MA, for whom there is a negative relationship between AP success and proficiency
• For participation rates, there is sometimes a fair amount of spread at higher levels of proficiency, meaning schools that look good on proficiency sometimes look bad on AP participation, though this is generally not true the other way around
AP Participation and Proficiency Rates – All Students, MA
Proficiency Rate
AP
Par
tici
pat
ion
Rat
e
Proficiency Rate
AP
Pas
s R
ate
AP Success and Proficiency Rates – All Students, FL
Preliminary EdTrust analysis of FL Department of Education and MA Department of Education data 19

ESSA Boot Camp | July 2016
Advanced Courses: Benefits and Risks• Benefits:
• Including these indicators in accountability may incentivize schools to offer more advanced opportunities.
• Inclusion in accountability may highlights gaps in access to/success in advanced classes
• Advanced course access/success matters to students and parents
• Information provided by these indicators may not be captured by existing indicators – e.g., some high performing schools (based on proficiency) may be doing a better job of this than others.
• Risks:• Because these courses are meant for college
applications, including them might stress college-ready over career-ready
• Is that a negative?
• These courses – and exams that go with them – cost money. If states do not subsidize the tests, then inclusion of the indicator in an accountability system may be unfair to high poverty schools and low-income students.
• Depending on the type of course and indicator used, schools could respond by watering down course content.
• Small schools/schools in rural areas may have a harder time offering advanced courses.
20
ESSA Boot Camp | July 2016
Considerations: Questions to Ask
• How will participation and success be measured?
• Will participation and success be separate indicators, or one combined measure?
• How will courses be approved and valued?
• Another note: Federal dollars to help more low-income students into AP were collapsed into a block grant, which can be used for a variety of purposes. Relevant?
21

ESSA Boot Camp | July 2016
3. Assessment-Based Measures of College Readiness (ACT and SAT)
Why it matters:• Colleges use these tests as part of their admission
requirements. Low scores on these tests can prevent students from getting into the school of their choice.
22
ESSA Boot Camp | July 2016
College-entry exams: How are schools doing on it?
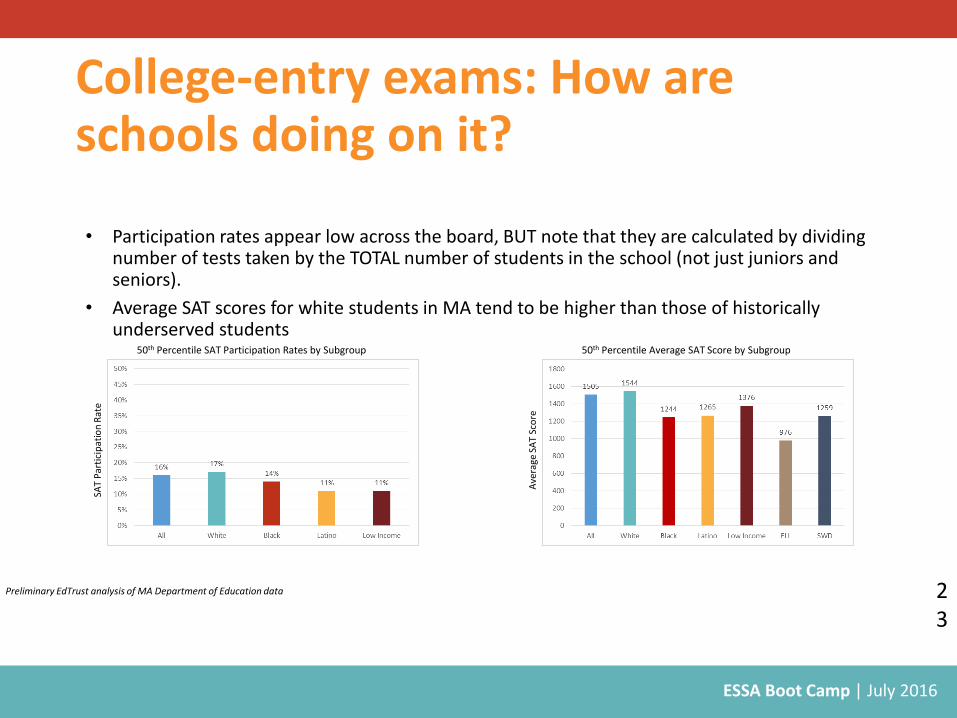
• Participation rates appear low across the board, BUT note that they are calculated by dividing number of tests taken by the TOTAL number of students in the school (not just juniors and seniors).
• Average SAT scores for white students in MA tend to be higher than those of historically underserved students
50th Percentile SAT Participation Rates by Subgroup
SAT
Par
tici
pat
ion
Rat
e
50th Percentile Average SAT Score by Subgroup
Ave
rage
SA
T Sc
ore
Preliminary EdTrust analysis of MA Department of Education data 23
ESSA Boot Camp | July 2016
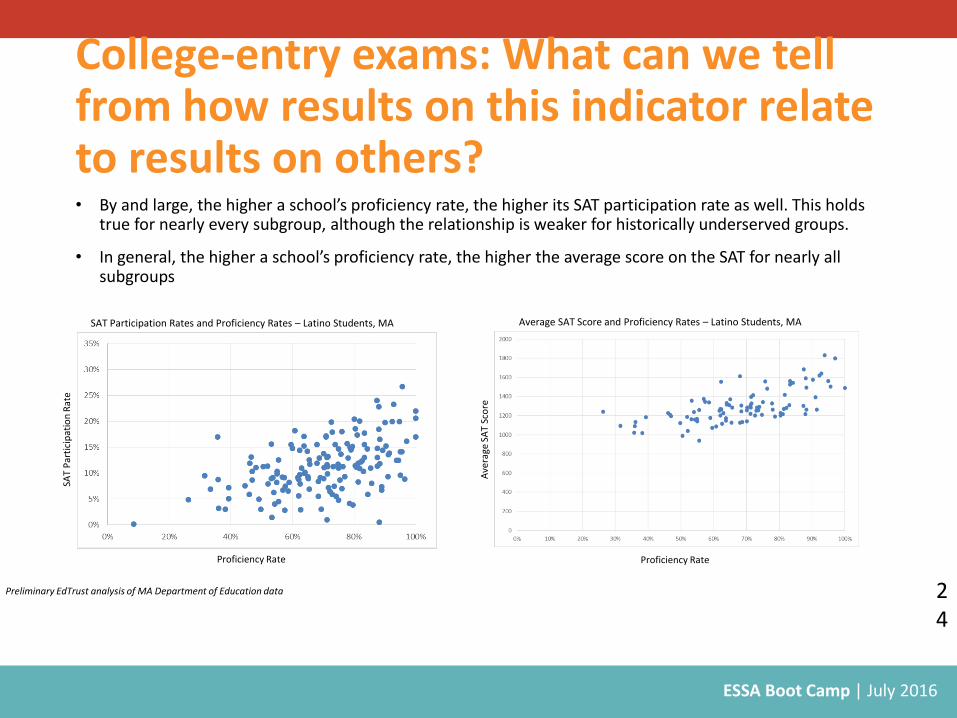
College-entry exams: What can we tell from how results on this indicator relate to results on others?• By and large, the higher a school’s proficiency rate, the higher its SAT participation rate as well. This holds
true for nearly every subgroup, although the relationship is weaker for historically underserved groups.
• In general, the higher a school’s proficiency rate, the higher the average score on the SAT for nearly all subgroups
SAT Participation Rates and Proficiency Rates – Latino Students, MA
Proficiency Rate
SAT
Par
tici
pat
ion
Rat
e
Average SAT Score and Proficiency Rates – Latino Students, MA
Proficiency Rate
Ave
rage
SA
T Sc
ore
Preliminary EdTrust analysis of MA Department of Education data 24

ESSA Boot Camp | July 2016
College-entry exams: Implications for Accountability• Benefits:
• ACT/SAT are tests that “matter” in high school
• Including these indicators in accountability may get schools to put systems in place to make registering for the SAT/ACT easier/more accessible
• Including might incentivize schools to start providing SAT-prep courses
• Downside of this is it could provide an obvious advantage to wealthy schools
• It’s not a state-created performance measure, so it could provide an external check on student outcomes
• Risks:• Because these tests are meant
explicitly for college applications, including them might stress college-ready over career-ready
• Is that a negative?
• There is a cost to taking these tests. Without subsidies, low participation rates may be an indicator of students’ inability to afford them, rather than of something with the school
• The College Board waives the fee entirely for qualifying low income students
• There are serious challenges with SWD getting the accomodations to which they are entitled, especially if the goal is a score they can actually use for admissions purpose.
• The prevalence of SAT/ACT prep in wealthy schools/districts may give those places an extra (and unfair) advantage.
25
ESSA Boot Camp | July 2016
Considerations: Questions to ask
• How will participation and success be measured?
• Will participation and success be separate indicators, or one combined measure?
• How will you ensure that all students have access to these often costly tests?
26

ESSA Boot Camp | July 2016
4. Measures of College Going
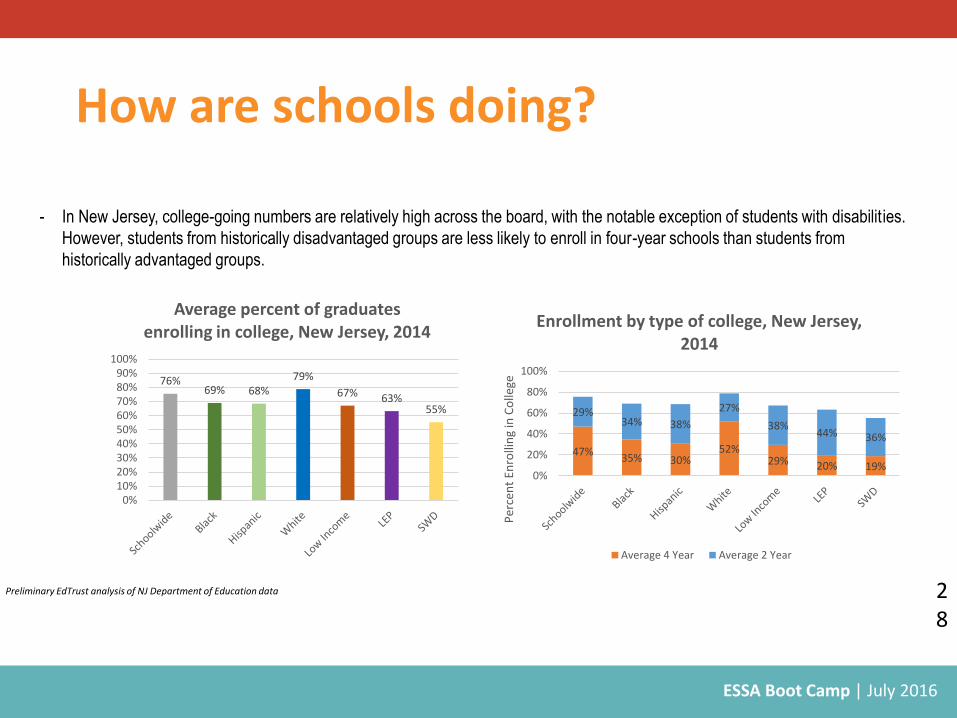
Definition: This indicator is generally defined as the “percent of graduates who enroll in college” – though this definition raises as many questions as it answers.
• We’ll be looking at data from New Jersey, which uses information from the National Student Clearinghouse. NSC data include most students who go to school anywhere in the U.S.
What do we know about it? • Low income students, students of color, ELLs and students with disabilities are less likely to
enroll in college than their peers.
• Enrollment rates have been increasing in recent decades, but the gaps in enrollment rates haven’t changed much.
• Low income students and students of color are more likely to start their college education at a community college or a for-profit institution.
27
ESSA Boot Camp | July 2016
How are schools doing?
76%69% 68%
79%
67% 63%55%
0%10%20%30%40%50%60%70%80%90%
100%
Average percent of graduates enrolling in college, New Jersey, 2014
47%35% 30%
52%29% 20% 19%
29%34% 38%
27%
38%44% 36%
0%
20%
40%
60%
80%
100%
Per
cen
t En
rolli
ng
in C
olle
ge
Enrollment by type of college, New Jersey, 2014
Average 4 Year Average 2 Year
- In New Jersey, college-going numbers are relatively high across the board, with the notable exception of students with disabilities.
However, students from historically disadvantaged groups are less likely to enroll in four-year schools than students from
historically advantaged groups.
Preliminary EdTrust analysis of NJ Department of Education data 28

ESSA Boot Camp | July 2016
How does college enrollment relate to other measures?
0%
20%
40%
60%
80%
100%
0% 20% 40% 60% 80% 100%
Relationship between high school proficiency rates and postsecondary enrollment, white
students, New Jersey
0%
20%
40%
60%
80%
100%
0% 20% 40% 60% 80% 100%
Relationship between high school proficiency rates and postsecondary enrollment, African
American students, New Jersey
- In NJ, there is a strong relationship between high school proficiency rates and postsecondary enrollment. That relationship is
actually stronger for historically disadvantaged groups.
- This is probably because for white students, both proficiency and enrollment rates are generally high.
Percent Proficient
Per
cent
enr
ollin
g in
col
lege
Percent Proficient
Per
cent
enr
ollin
g in
col
lege
Preliminary EdTrust analysis of NJ Department of Education data 29

ESSA Boot Camp | July 2016
Implications for accountability
Benefits
• May incentivize schools to support students through the college enrollment process.
• May incentivize schools to encourage students to consider going to college.
• A meaningful indicator for parents and community members.
• May be useful in differentiating between higher performing schools.
Risks
• Schools may respond by pushing students to enroll in non-selective institutions that won’t necessarily support them to succeed.
• Schools may push students to enroll in college, but pay no attention to their academic preparation.
• Students may wind up in a situation where they are accumulating lots of debt, with no degree.
• Does including this metric without a career counterpart place too much emphasis on college?
30

ESSA Boot Camp | July 2016
Considerations/Questions to Ask
• Does the state have data, and what data are available? • National Student Clearinghouse data are expensive.
• Many states can track college enrollment only within their state – and some only in public institutions.
• Using within-state public-only enrollment figures for accountability could create all sorts of other bad incentives for schools.
• What’s being measured? • Does it matter whether students are enrolling in a 2-year or a 4-year school?
• How do you set goals? • What is the ultimate goal?
• How do you measure success?
31
ESSA Boot Camp | July 2016
What are some potential ways of measuring success in college? • Data challenges become bigger and bigger as we get
into higher ed data, but a couple of possibilities mayinclude:• Remediation rates
• Degree completion rates
32

ESSA Boot Camp | July 2016
Challenges with including college-level measures in accountability
• Data availability/ data quality in general
• Very few high schools have these data for ELs an students with disabilities.
• Especially when it comes to attainment:• Time lag
• Mismatch in responsibility: Colleges themselves play a huge role in helping their students attain a degree. And different colleges often perform very differently with similar students. Is it fair to hold high schools accountable for college degree attainment? 3
3

ESSA Boot Camp | July 2016
What about measures of Career Readiness?
ESSA Boot Camp | July 2016
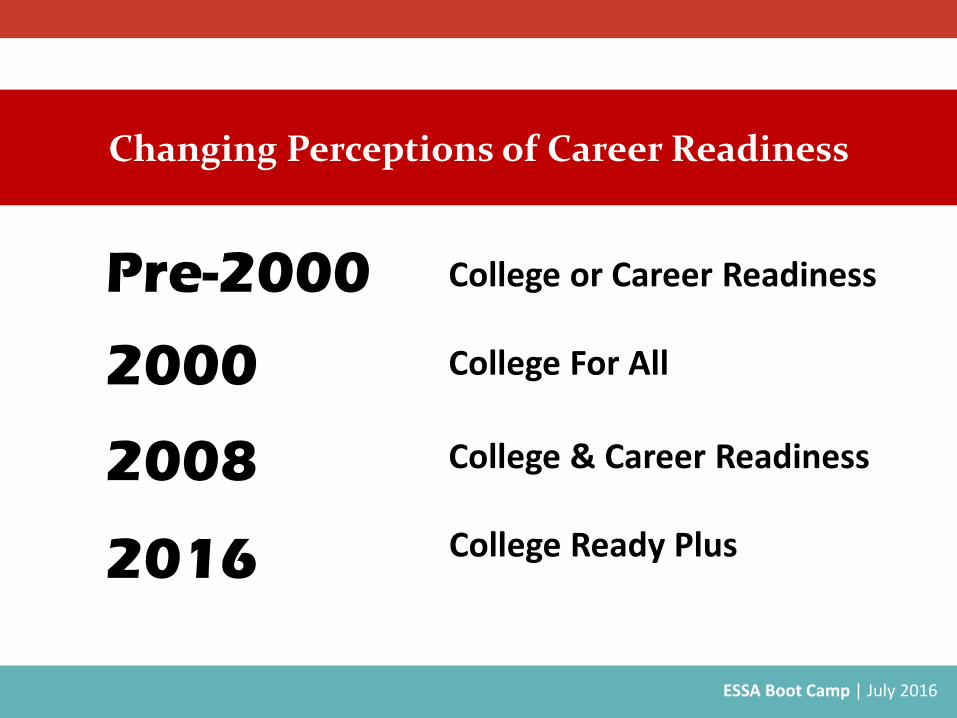
College For All
College & Career Readiness
College Ready Plus
2008
2000
2016
Pre-2000 College or Career Readiness
Changing Perceptions of Career Readiness
ESSA Boot Camp | July 2016
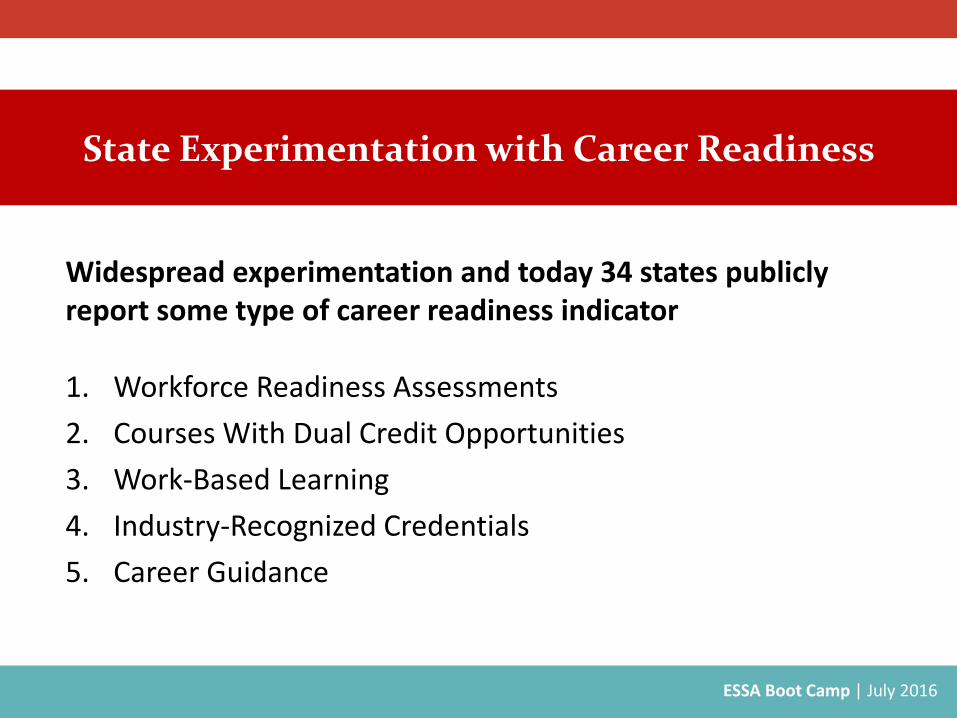
Widespread experimentation and today 34 states publicly report some type of career readiness indicator
1. Workforce Readiness Assessments
2. Courses With Dual Credit Opportunities
3. Work-Based Learning
4. Industry-Recognized Credentials
5. Career Guidance
State Experimentation with Career Readiness

ESSA Boot Camp | July 2016
Each of the approaches face limitations and have yet to overcome major challenges facing career readiness
1. Career education remains stigmatized (“less than college”)
2. Lack of shared accountability across systems
3. Employer leadership and engagement is not systemic
Limitations and Challenges
ESSA Boot Camp | July 2016
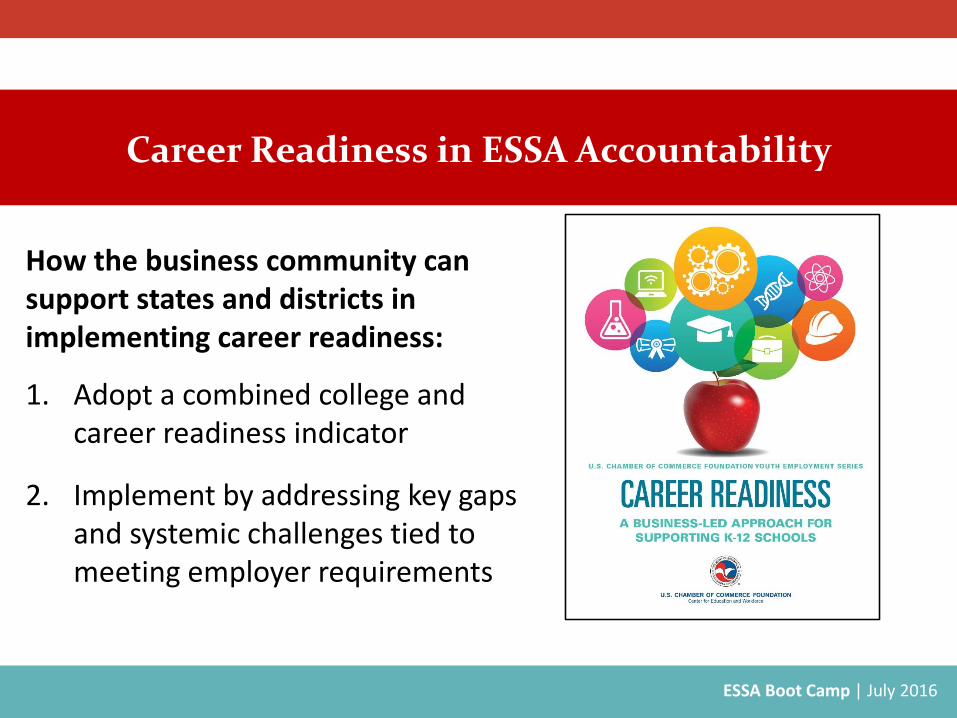
Career Readiness in ESSA Accountability
How the business community can support states and districts in implementing career readiness:
1. Adopt a combined college and career readiness indicator
2. Implement by addressing key gaps and systemic challenges tied to meeting employer requirements

ESSA Boot Camp | July 2016
Workforce Readiness Assessment
Career Readiness
Career Plan
Career Courses
Work-Based Learning
Industry-Recognized Credentialing
Academic Achievement
College Readiness
Advanced Coursework
College Plan
Workforce Readiness Assessment & Acad. Prof.
Postsecondary Readiness
College & Career Plans
Career Courses/Advanced Coursework/Dual Credit
Work-Based Learning
Industry-Recognized Credentialing
A New Framework for Defining Career Readiness
ESSA Boot Camp | July 2016
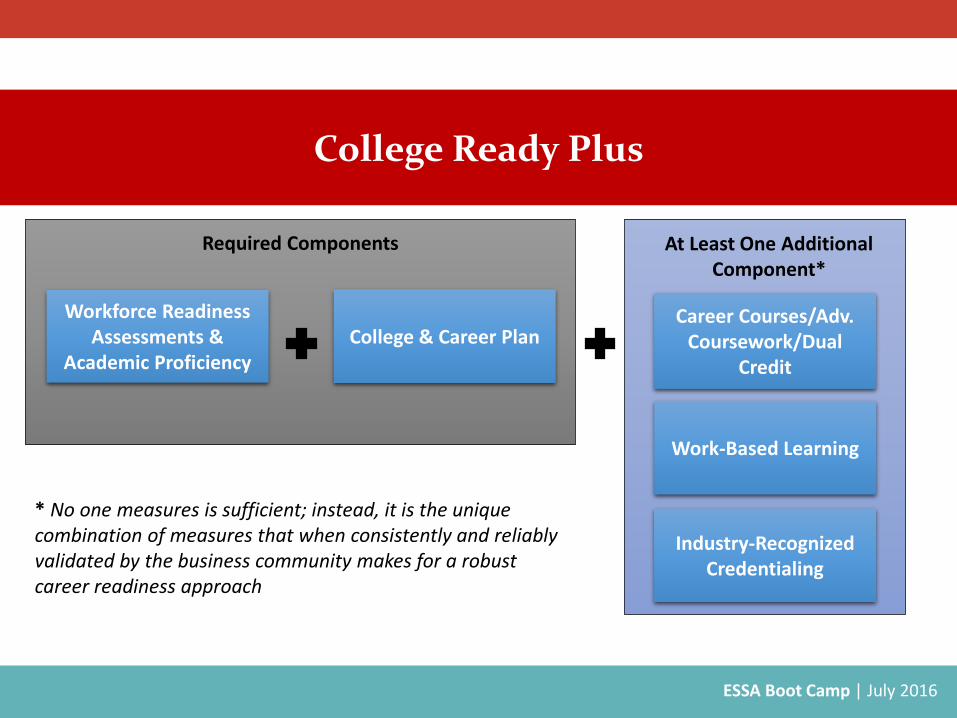
Workforce Readiness Assessments &
Academic ProficiencyCollege & Career Plan
Career Courses/Adv. Coursework/Dual
Credit
Work-Based Learning
Industry-Recognized Credentialing
Required Components At Least One Additional Component*
College Ready Plus
* No one measures is sufficient; instead, it is the unique combination of measures that when consistently and reliably validated by the business community makes for a robust career readiness approach

ESSA Boot Camp | July 2016
Participating in Career Related Assessments
Participating in Career-Related Courses
Participating in Work-Based Learning
Received Career Guidance
Process
Example Measures
Outcome
Score Proficient on Assessments
Career Course Completers
Work-Based Learning Completers
College and Career Plan Completers
College Ready Plus AchievedIndustry Recognized Credentials Awarded
ESSA Boot Camp | July 2016
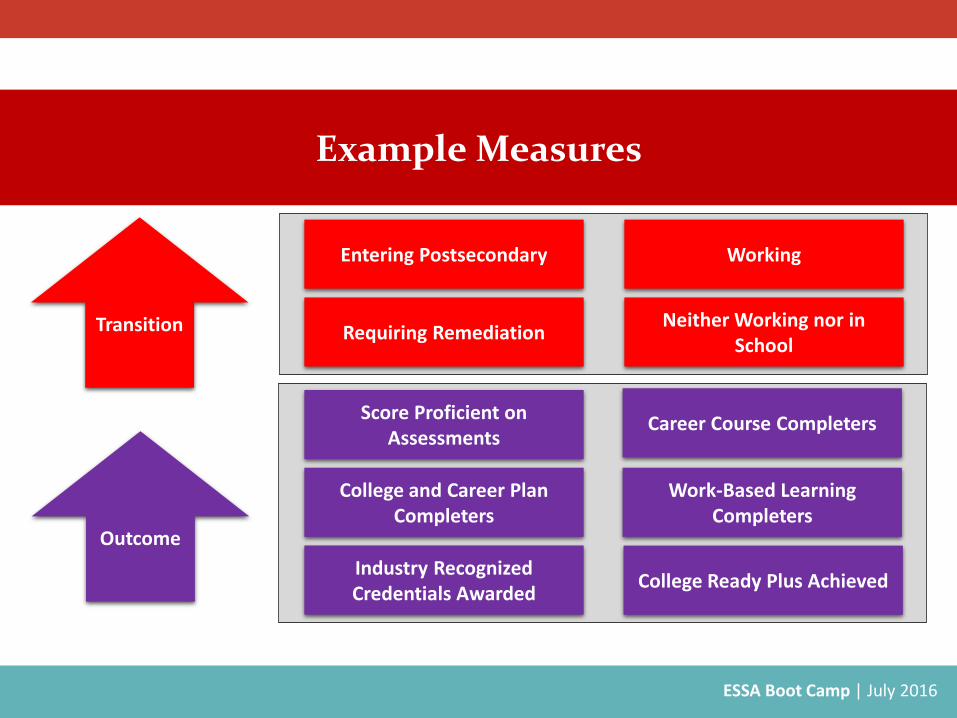
Entering Postsecondary Working
Neither Working nor in School
Requiring RemediationTransition
Example Measures
Outcome
Score Proficient on Assessments
Career Course Completers
Work-Based Learning Completers
College and Career Plan Completers
College Ready Plus AchievedIndustry Recognized Credentials Awarded

ESSA Boot Camp | July 2016
Special Roles for Business in Advancing Career Readiness
Manage employer requirements
Track industry recognized credentials
Endorse districts and schools
Evaluate performanceManage work-based learning
The business community is uniquely positioned to support states and districts with implementing career readiness

ESSA Boot Camp | July 2016
Important Roles for Attention by Both Business Reps and Other Advocates
• Insist on college AND career, rather than college OR career.
• Insist on an end to the practice of shunting low-income, EL, SWD and students of color disproportionately down a watered down “career” track, while students with more advantages are placed in the college track.

ESSA Boot Camp | July 2016
California Case StudyCan we do both—and do them well?

ESSA Boot Camp | July 2016
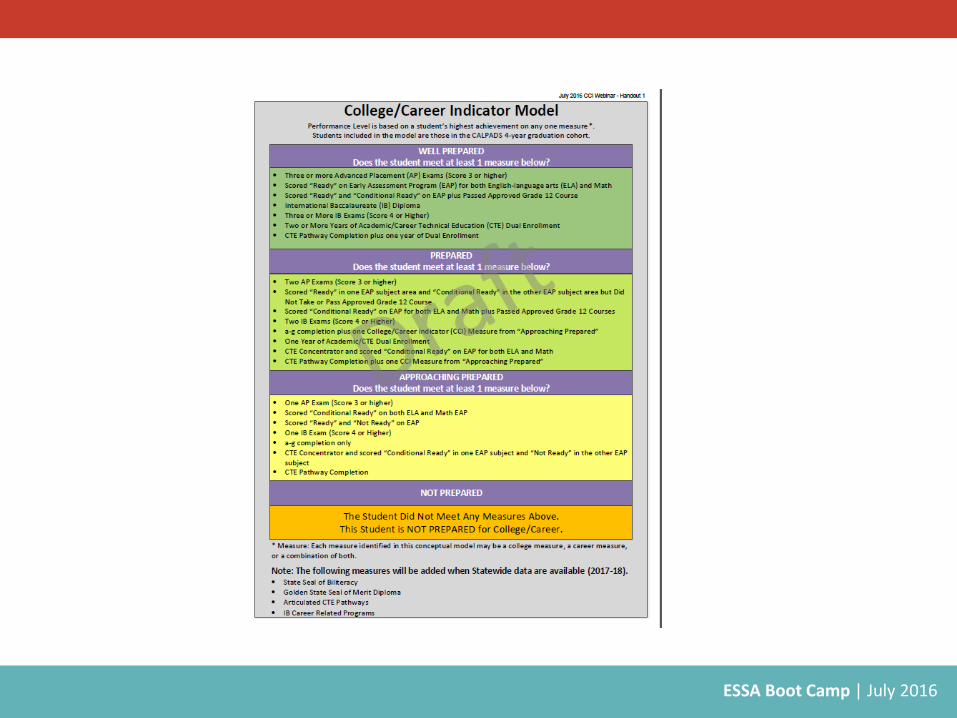
California’s College and Career Index
• Adopted in concept July 2016; details still being worked out
• Identifies benchmarks that students in the 4-year graduation cohort must meet to demonstrate College and Career Readiness
• To be used for district and school accountability; students will not receive individual CCI reports
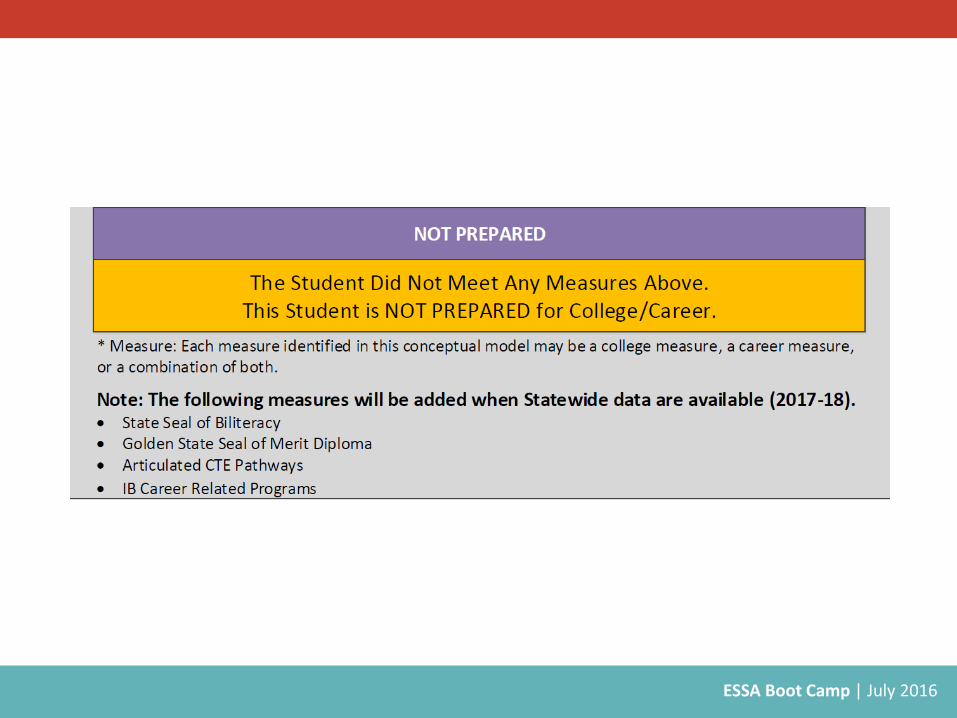
• Four performance levels:1. Well Prepared2. Prepared3. Approaching Prepared4. Not Prepared
ESSA Boot Camp | July 2016
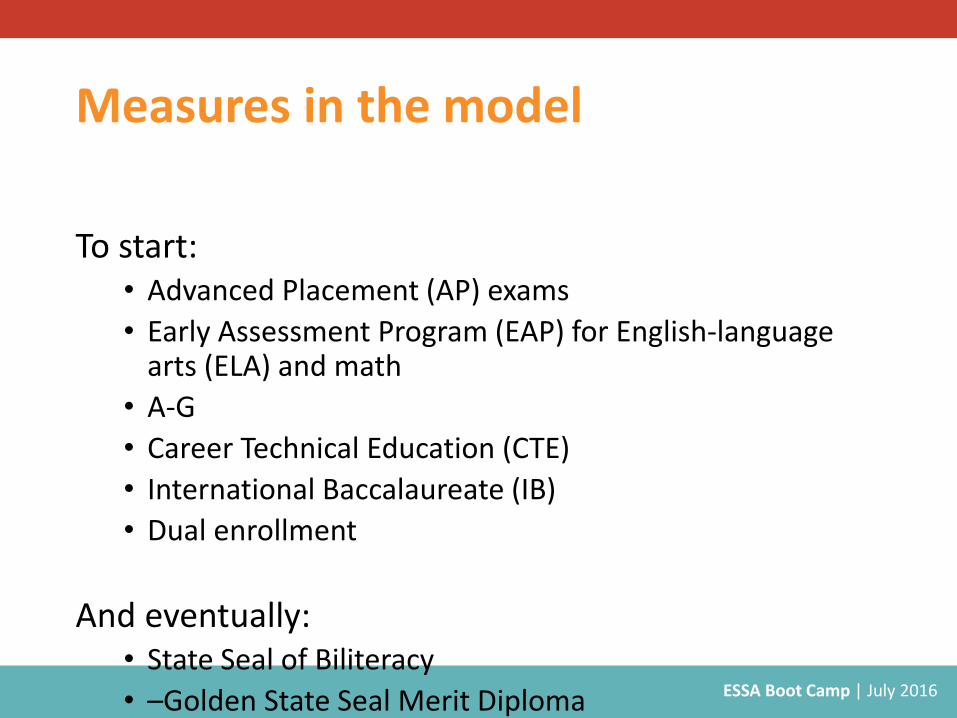
Measures in the model
To start:• Advanced Placement (AP) exams
• Early Assessment Program (EAP) for English-language arts (ELA) and math
• A-G
• Career Technical Education (CTE)
• International Baccalaureate (IB)
• Dual enrollment
And eventually:• State Seal of Biliteracy
• –Golden State Seal Merit Diploma
• –IB Career-related Programme

ESSA Boot Camp | July 2016
What didn’t make the cut and why
Didn’t make the cut Why
Percent of students who enter college, percent who succeed in college
No data system connecting K-12 and PSE
SAT or ACT Strong advocacy from some corners against these measures; feeling that that don’t effectively predict college success, are culturally biased, favor college-ready over career-ready in the model, are unaligned to Common Core, and are untested for use in accountability systems
GPA The data is not readily available. There is still strong advocacy from some corners to include this, arguing it is a strong predictor of college success.
ESSA Boot Camp | July 2016

ESSA Boot Camp | July 2016

ESSA Boot Camp | July 2016

ESSA Boot Camp | July 2016
ESSA Boot Camp | July 2016

ESSA Boot Camp | July 2016
Key issues
• College and career readiness vs. college or career readiness
• How to weight indicators in order to properly balance incentives
• How effectively does the Smarter Balanced assessment measure college and career readiness?
• How to ensure that career pathways are high-quality pathways