Hyatt Regency Chicago Chicago, Illinois - The Education Trust · ESSA Boot Camp | July 2016...
27
ESSA Boot Camp | July 2016 SUBTITLE July 28-29, 2016 Hyatt Regency Chicago Chicago, Illinois
Transcript of Hyatt Regency Chicago Chicago, Illinois - The Education Trust · ESSA Boot Camp | July 2016...

ESSA Boot Camp | July 2016
SUBTITLE
July 28-29, 2016
Hyatt Regency ChicagoChicago, Illinois

ESSA Boot Camp | July 2016
Student Growth: Questions we’ll tackle today
•What do we mean by student growth?
•How is student growth measured?
•What do you need to know – and what questions should you ask – about using growth for accountability?
2

ESSA Boot Camp | July 2016
What is student growth?
• Student growth is a measure of students’ progress from one year to the next. Depending on how it’s measured, student growth can tell us:• How much progress Tony made between the end of 4th grade and the end of
5th grade; or
• How Tony’s progress compares with that of other students that performed similarly to him in 4th grade.
• Some growth measures – but not all – can even tell us if Tony is on track to be ready for college or a meaningful career by the time he graduates high school.

ESSA Boot Camp | July 2016
Growth is not the same as improvement
• “Improvement” looks at changes in assessment results for the whole school, or a particular grade – but not the same students – over time. • For example, improvement can tell us whether proficiency rates of fourth
graders have gone up or down compared with last year’s fourth graders.
• On the other hand, growth measures progress for the same students over time.

ESSA Boot Camp | July 2016
A bit more on Growth vs. Improvement
Growth:
• Tony went from scoring below basic on the state assessment last year, to scoring at the basic level this year.
• 25% of Tony’s classmates went up an achievement level on the state assessment this year.
Improvement:
• Last year, 30% of fourth graders at Apple Elementary met state standards. This year, 35% of fourth graders scored proficient. This means that Apple Elementary’s 4th grade proficiency rate improved by 5 points.

ESSA Boot Camp | July 2016
Growth measures provide important information about how well schools are serving their students.
• Some schools with high proficiency rates have low growth – they’re taking in high achieving kids and making no gains with them.
• And some schools with low proficiency rates have high growth –these schools are making lots of progress with their students, but because kids came in really behind, they are not reaching proficiency just yet.

ESSA Boot Camp | July 2016
But the way growth is measured really matters, because different growth measures
tell us very different things.
ESSA Boot Camp | July 2016
There are two big buckets of growth measures: Comparative (or normative) and criterion based.

ESSA Boot Camp | July 2016
Comparative growth measures
What are they?
• Measures that compare students’ progress with that of other students with similar past performance on state assessments.
• Common examples: Student Growth Percentiles (SGPs) and value added.
What do thy tell us?
• Whether a student – Tony – made more or less progress in 5th grade than other students who performed similarly to him in the past.
• For example, a student growth percentile of 70 tells us that Tony made more progress than 70 percent of students whose prior assessment results were similar to his.

ESSA Boot Camp | July 2016
Comparative growth measures: What they don’t tell us
• Whether Tony is on-track to be ready for college or a meaningful career.• We might know that Tony is making more progress than 70
percent of students with similar past achievement, but we have no idea if that’s good enough to get him to grade level.

ESSA Boot Camp | July 2016
An SGP of 70 could mean substantial progress…
Scal
e Sc
ore
Proficiency bar
4th Grade score, 2013
5th Grade score, 2014
Preliminary – Please let us know before sharing outside your organization
9

ESSA Boot Camp | July 2016
Or it could mean no progress at all. Sc
ale
Sco
re
Proficiency bar
4th Grade score, 2013
5th Grade score, 2014
9

ESSA Boot Camp | July 2016
• Imagine that Tony has a friend named Sarah, who also has an SGP of 70. We don’t know whether Sarah and Tony made the same amount of progress. • Tony could have improved his assessment results by 20 points,
which was more than 70% of students whose past results were similar to his.
• Sarah could have improved her results by 50 points – which was more than 70% of students whose past results were similar to hers.
&
Comparative growth measures: What they don’t tell us, continued

ESSA Boot Camp | July 2016
And just like you can’t compare Tony and Sarah’s student growth percentiles, you can’t compare
student growth percentiles for different groups of students.

ESSA Boot Camp | July 2016
That’s really important because average SGPs often look very similar across groups
49 50 4851
4851
0
10
20
30
40
50
60
70
80
90
100
All Black Hispanic White EconomicallyDisadvantaged
Not EconomicallyDisadvantaged
Median Growth by Subgroup – Math, Colorado High Schools
51 49 49 5148
44
52
0
10
20
30
40
50
60
70
80
90
100
All Black Latino White Low Income Students withDisabilities
ELL
Average of Median Student Growth Percentiles by Student Group - Massachusetts Elementary and
Middle Schools
Source: Preliminary Ed Trust analysis of MA Department of Education and CO Department of Education data
Ave
rage
Med
ian
Gro
wth
Per
cen
tile
Ave
rage
Med
ian
Gro
wth
Per
cen
tile
5

ESSA Boot Camp | July 2016
This does not mean that schools are actually making the same amount of progress for each group.
49 50 4851
4851
0
10
20
30
40
50
60
70
80
90
100
All Black Hispanic White EconomicallyDisadvantaged
Not EconomicallyDisadvantaged
Median Growth by Subgroup – Math, Colorado High Schools
51 49 49 5148
44
52
0
10
20
30
40
50
60
70
80
90
100
All Black Latino White Low Income Students withDisabilities
ELL
Average of Median Student Growth Percentiles by Student Group - Massachusetts Elementary and
Middle Schools
Source: Preliminary Ed Trust analysis of MA Department of Education and CO Department of Education data
Ave
rage
Med
ian
Gro
wth
Per
cen
tile
Ave
rage
Med
ian
Gro
wth
Per
cen
tile
5
&

ESSA Boot Camp | July 2016
Comparative growth measures: Implications for accountability
• Comparative growth measures, like SGPs and value added, can be useful in motivating schools to focus on all students – not just students near the proficiency bar.
• They can be especially useful when identifying low-performing schools: Schools that have low test scores, and are making less progress than other schools are with similar students are clearly in trouble.

ESSA Boot Camp | July 2016
But comparative measures are not useful in…• Trying to measure achievement gaps, or progress toward closing
achievement gaps. • Watch out for statements like: “This school has the same student growth
percentile for its low-income kids and its higher income kids, so it doesn’t have an achievement gap.”
• The same SGP does not mean the same amount of progress. • **And even if it did, we want schools to make more progress for students who
are further behind. **
• Trying to measure how much progress students are making, or if they are academically on-track.• Watch out for state attempts to define “adequate growth” or a year’s worth of
growth as an SGP of 40, or 50 (or any number).

ESSA Boot Camp | July 2016
Other challenges
• Only students with two or more years of test score data can be included (this applies to all growth measures).
• Students who take an alternative assessment may not be included in SGP results.
• A lot of people do not understand what SGPs and value added mean, what they tell us, what they don’t tell us, or how they are calculated.
14

ESSA Boot Camp | July 2016
Criterion referenced growth measures
17

ESSA Boot Camp | July 2016
Criterion referenced growth measures
What are they?
• Criterion referenced measures compare each student’s progress to a set standard.
• States can, for example, choose metrics that note the number of points a student gained from one year to the next, and examine whether that progress is enough to get to or stay at grade level.
• A simpler example is a value table, which gives schools credit for moving students from one achievement level to the next (e.g. from below basic to basic)

ESSA Boot Camp | July 2016
Here’s an example of a value table from Virginia.
• Schools get no points for students who stay at the same level, but get points for students who move up from, for example, a “High below basic” to a “Low basic.”
Source: Virginia Department of Education, 2015, Progress Tables (Value Tables): Another Measure of Student Growth, http://www.doe.virginia.gov/boe/committees_standing/accountability/2015/meeting_materials/jan-21_measure_of_student_growth.pdf 18

ESSA Boot Camp | July 2016
Criterion-referenced measures: Implications for accountability
• It’s easier to understand both how schools get credit, and how to interpret the results.
•Because we know how to interpret the results, it’s possible to make comparisons between groups.
22
ESSA Boot Camp | July 2016
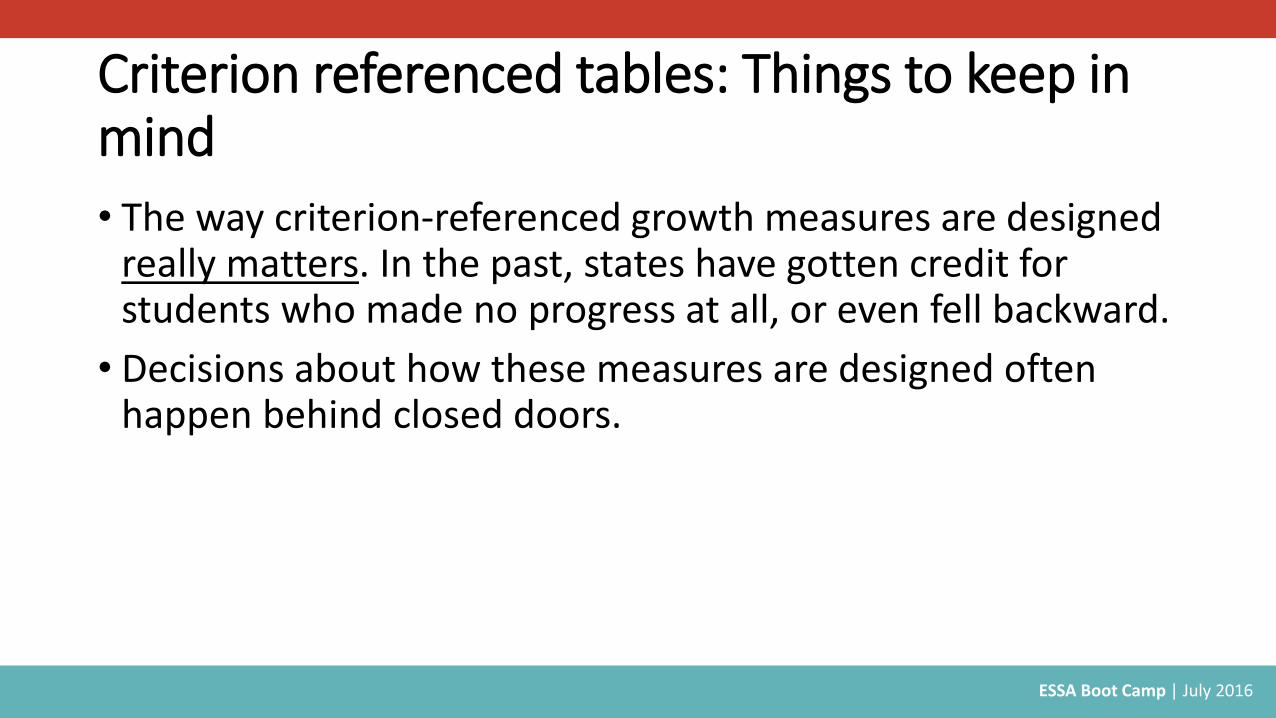
Criterion referenced tables: Things to keep in mind
• The way criterion-referenced growth measures are designed really matters. In the past, states have gotten credit for students who made no progress at all, or even fell backward.
• Decisions about how these measures are designed often happen behind closed doors.

ESSA Boot Camp | July 2016
Criterion-referenced measures: Questions to ask
• How much progress does a student need to be making in order for a school to receive credit?
• Is that progress sufficient to get (or keep) that student to grade level, -- or if your state defines in differently, on a path to college/career readiness – in a reasonable amount of time? How would a parent know?

ESSA Boot Camp | July 2016
In summary…1. The way growth is measured really matters.
2. Criterion-referenced growth measures (like value tables) are easier to interpret/work with.
3. Comparative measures, like SGPs and value added, do not tell us how much growth students are making.• Be wary of using SGPs or value added to measure whether schools are closing
achievement gaps.• Be wary of defining “a year’s worth of growth” or “sufficient growth” using SGPs.
4. SGPs are more useful in identifying low-performing schools than high performing schools.
5. When holding schools accountable for growth, we have to demand that schools make more progress with students who are behind.

ESSA Boot Camp | July 2016
Questions and Discussion