Revised manuscript - Scalable and Durable Polymeric ...pressures and low temperatures. Clathrate...
23
Soft Matter ARTICLE This journal is © The Royal Society of Chemistry 2018 Soft Matter, 2018, xx 1 Please do not adjust margins Please do not adjust margins Received 00th January 20xx, Accepted 00th January 20xx Scalable and Durable Polymeric Icephobic and Hydrate-phobic Coatings Hossein Sojoudi, a Hadi Arabnejad, b Asif Raiyan, a Siamack A. Shirazi, b Gareth H. McKinley,* c and Karen K. Gleason* d Ice formation and accumulation on surfaces can result in severe problems for solar photovoltaic installations, offshore oil platforms, wind turbines and aircraft. In addition, blockage of pipelines by formation and accumulation of clathrate hydrates of natural gases has safety and economical concerns in oil and gas operations, particularly at high pressures and low temperatures such as those found in subsea or arctic environments. Practical adoption of icephobic/hydrate-phobic surfaces requires mechanical robustness and stability under harsh environments. Here, we develop durable and mechanically robust bilayer poly-divinylbenzene (pDVB) / poly- perfluorodecylacrylate (pPFDA) coatings using initiated chemical vapor deposition (iCVD) to reduce the adhesion strength of ice/hydrates to underlying substrates (silicon and steel). Utilizing a highly-cross- linked polymer (pDVB) underneath a very thin veneer of fluorine-rich polymer (pPFDA) we have designed inherently rough bilayer polymer films that can be deposited on rough steel substrates resulting in surfaces which exhibit receding water contact angle (WCA) higher than 150° and WCA hysteresis as low as 4°. Optical profilometer measurements were performed on the films and root mean square (RMS) roughness values of Rq = 178.0 ± 17.5 nm and Rq = 312.7 ± 23.5 nm were obtained on silicon and steel substrates, respectively. When steel surfaces are coated with these smooth hard iCVD bilayer polymer films, the strength of ice adhesion is reduced from 1010 ± 95 kPa to 180 ± 85 kPa. The adhesion strength of the cyclopentane (CyC5) hydrate is also reduced from 220 ± 45 kPa on rough steel substrates to 34 ± 12 kPa on the polymer-coated steel substrates. The durability of these bilayer polymer coated icephobic and hydrate-phobic substrates is confirmed by sand erosion test and examination of multiple ice/hydrate adhesion/de-adhesion cycles. Introduction Formation and accretion of ice on power lines, aluminum alloys used for ground wires, aircraft wings and fuselage, wind turbines, photovoltaic devices, and other infrastructure components, such as bridge cable stays, degrade performance and cause safety concerns. 1-6 To overcome these difficulties, active anti-icing methods such as ice/snow removal by mechanical means, application of heating, and chemical treatments have been developed. 7, 8 Other active anti-icing methods have also been employed where de-icing chemicals not only remove the ice but also remain on the surface temporarily to further delay re-formation of ice. 9 However, the main issues with these active methods are that they require regular maintenance, consume energy for operation, and occasionally have detrimental environmental impacts. 10 To overcome these problems, topographical surface treatment techniques have been developed, resulting in surfaces which passively delay icing and/or reduce ice adhesion strength without external power input. We recently discussed various definitions employed for icephobicity such as the ability of a surface to repel incoming low-temperature water droplet, 11-16 delay ice nucleation time, 13, 17, 18 and lower ice adhesion strength to surfaces 13, 19-22 in an extensive review article 23 . Over the last two decades, there has been a significant progress in research and development of surfaces that are icephobic (to varying extents) according to these definitions. 14, 21, 24-35 Many recent reports have targeted low ice adhesion strength as the primary characteristic used for definition and optimization of icephobic surfaces. 21, 23-26, 31-33 While surfaces with low ice adhesion strength have been developed, a major concern is that they lack mechanical robustness and durability as well as scalability for production at large scale. 23, 31, 34, 36-38 Recently some durable icephobic surfaces have been developed which use bilayer polymer coatings, 39 elastomeric coatings, 30 chemically-bonded 2D polymer, 40 and PTFE coatings 3 . However, most of these newly-developed icephobic surfaces are still being tested on the laboratory scale which is far from conditions they would experience in practical applications. 41 Therefore, there is still an untapped demand to develop durable and scalable icephobic coatings and examine their functionality in harsh environments. Clathrate hydrates are ice-like solid compounds formed by the combination of water and liquid/gas guest molecules at high a. Dept. of Mechanical, Industrial and Manufacturing Engineering, The University of Toledo b. Dept. of Mechanical Engineering, The University of Tulsa c. Dept. of Mechanical Engineering, MIT d. Dept. of Chemical Engineering, MIT *Corresponding author. Email: [email protected]; [email protected] Electronic Supplementary Information (ESI) available: [Figures S1 to S4].
Transcript of Revised manuscript - Scalable and Durable Polymeric ...pressures and low temperatures. Clathrate...
Soft Matter
ARTICLE
This journal is © The Royal Society of Chemistry 2018 Soft Matter, 2018, xx 1
Please do not adjust margins
Please do not adjust margins
Received 00th January 20xx, Accepted 00th January 20xx
Scalable and Durable Polymeric Icephobic and Hydrate-phobic Coatings Hossein Sojoudi,a Hadi Arabnejad,b Asif Raiyan,a Siamack A. Shirazi,b Gareth H. McKinley,*c and Karen K. Gleason*d
Ice formation and accumulation on surfaces can result in severe problems for solar photovoltaic installations, offshore oil platforms, wind turbines and aircraft. In addition, blockage of pipelines by formation and accumulation of clathrate hydrates of natural gases has safety and economical concerns in oil and gas operations, particularly at high pressures and low temperatures such as those found in subsea or arctic environments. Practical adoption of icephobic/hydrate-phobic surfaces requires mechanical robustness and stability under harsh environments. Here, we develop durable and mechanically robust bilayer poly-divinylbenzene (pDVB) / poly- perfluorodecylacrylate (pPFDA) coatings using initiated chemical vapor deposition (iCVD) to reduce the adhesion strength of ice/hydrates to underlying substrates (silicon and steel). Utilizing a highly-cross-linked polymer (pDVB) underneath a very thin veneer of fluorine-rich polymer (pPFDA) we have designed inherently rough bilayer polymer films that can be deposited on rough steel substrates resulting in surfaces which exhibit receding water contact angle (WCA) higher than 150° and WCA hysteresis as low as 4°. Optical profilometer measurements were performed on the films and root mean square (RMS) roughness values of Rq = 178.0 ± 17.5 nm and Rq = 312.7 ± 23.5 nm were obtained on silicon and steel substrates, respectively. When steel surfaces are coated with these smooth hard iCVD bilayer polymer films, the strength of ice adhesion is reduced from 1010 ± 95 kPa to 180 ± 85 kPa. The adhesion strength of the cyclopentane (CyC5) hydrate is also reduced from 220 ± 45 kPa on rough steel substrates to 34 ± 12 kPa on the polymer-coated steel substrates. The durability of these bilayer polymer coated icephobic and hydrate-phobic substrates is confirmed by sand erosion test and examination of multiple ice/hydrate adhesion/de-adhesion cycles.
Introduction Formation and accretion of ice on power lines, aluminum alloys used for ground wires, aircraft wings and fuselage, wind turbines, photovoltaic devices, and other infrastructure components, such as bridge cable stays, degrade performance and cause safety concerns.1-6 To overcome these difficulties, active anti-icing methods such as ice/snow removal by mechanical means, application of heating, and chemical treatments have been developed.7, 8 Other active anti-icing methods have also been employed where de-icing chemicals not only remove the ice but also remain on the surface temporarily to further delay re-formation of ice.9 However, the main issues with these active methods are that they require regular maintenance, consume energy for operation, and occasionally have detrimental environmental impacts.10 To overcome these problems, topographical surface treatment techniques have been developed, resulting in surfaces which
passively delay icing and/or reduce ice adhesion strength without external power input. We recently discussed various definitions employed for icephobicity such as the ability of a surface to repel incoming low-temperature water droplet,11-16 delay ice nucleation time,13, 17, 18 and lower ice adhesion strength to surfaces13, 19-22 in an extensive review article23. Over the last two decades, there has been a significant progress in research and development of surfaces that are icephobic (to varying extents) according to these definitions.14, 21, 24-35 Many recent reports have targeted low ice adhesion strength as the primary characteristic used for definition and optimization of icephobic surfaces.21, 23-26, 31-33 While surfaces with low ice adhesion strength have been developed, a major concern is that they lack mechanical robustness and durability as well as scalability for production at large scale.23, 31, 34, 36-38 Recently some durable icephobic surfaces have been developed which use bilayer polymer coatings,39 elastomeric coatings,30 chemically-bonded 2D polymer,40 and PTFE coatings3. However, most of these newly-developed icephobic surfaces are still being tested on the laboratory scale which is far from conditions they would experience in practical applications.41 Therefore, there is still an untapped demand to develop durable and scalable icephobic coatings and examine their functionality in harsh environments. Clathrate hydrates are ice-like solid compounds formed by the combination of water and liquid/gas guest molecules at high
a. Dept. of Mechanical, Industrial and Manufacturing Engineering, The University of Toledo
b. Dept. of Mechanical Engineering, The University of Tulsa c. Dept. of Mechanical Engineering, MIT d. Dept. of Chemical Engineering, MIT *Corresponding author. Email: [email protected]; [email protected] Electronic Supplementary Information (ESI) available: [Figures S1 to S4].
ARTICLE Soft matter
2 | This journal is © The Royal Society of Chemistry 2018
Please do not adjust margins
Please do not adjust margins
pressures and low temperatures. Clathrate hydrates are crystalline solids consisting of a lattice in which water is the host, and either a gas (e.g., methane, ethane, propane, carbon dioxide) or a liquid (e.g., cyclopentane, tetrahydrofuran) is the guest molecule.42-45 Hydrate formations and accumulation inside pipelines pose economic, operation and safety risks in oil and gas industry.46-49 To remedy issues associated with hydrate deposition, several active methods have been explored such as removing water from the probable hydrate formation sites, maintaining low pressures and high temperatures, applying inhibitors and anti-agglomerants, and adding water miscible alcohols to shift the thermodynamic equilibrium state away from the hydrate formation zone.47, 49-51 Similar to active anti-icing methods, active anti-hydrate approaches have some disadvantages such as being expensive, requiring regular maintenance, and having detrimental environmental consequences.47, 48, 52 Thus, passive methods via surface engineering to prevent blockage of oil and gas pipelines by hydrates have been developed. Smith et al. managed to reduce tetrahydrofuran hydrate adhesion strength more than four-fold by a simple surface treatment.48 The outcome of the current study is the design and development of a bilayer polymer coating that is durable and scalable and reduces adhesion strength of ice and clathrate hydrates, when applied to commercial steel and silicon substrates. For the bilayer coatings, we used a low-cost divinylbenzene monomer which has two vinyl bonds and enables dense crosslinking and therefore results in a hard base layer and then covalently bonded to this a very thin conformal fluorine-containing perfluorodecylacrylate top layer, which has low surface energy and results in strong anti-wetting properties. We also developed a new method to covalently bond and graft this bilayer polymer to the underlying substrate improving its adhesion. More recently, we developed durable and mechanically robust bilayer coatings which exhibited a six-fold reduction of ice adhesion39, and ten-fold reduction in the adhesion strength of both water-miscible THF hydrate42 and water-immiscible cyclopentane hydrate45 deposits. In the current work, further research and development are reported which expand the compositional and structural range of these bilayer coatings. The advantage of this grafting method when compared to our previous linker-free grafting studies is the expected enhanced durability and mechanical robustness of the grafted bilayer samples. For the first time, an experimental sand erosion test using inertial impact of suspended sand particles on linker-grafted bilayer coatings and supported via computational fluid dynamics (CFD) simulations is performed to examine the mechanical robustness of the coatings. We also conducted a comprehensive durability study on the bilayer coatings by measuring contact angles, roughness, atomic concentration and adhesion strengths of the linker-grafted and ungrafted bilayer coatings before and after the sand erosion tests. To complement the previous reports, multiple ice/hydrate adhesion/de-adhesion cycles are conducted to further examine the durability of the linker-grafted bilayer coatings. The resulting data set provides one of the most complete mechanical robustness and durability study conducted on
icephobic/hydrate-phobic surfaces, further demonstrating their potential application in harsh environments.
Experimental section Sample preparation. Silicon and steel substrates are treated with oxygen plasma and subsequently with tricholorovinylsilane vapor. Oxygen plasma cleans the surface, enhances the surface concentration of hydroxyl groups and tricholorovinylsilane vapor produces covalently bound vinyl groups on the treated surfaces during a so-called pre-iCVD treatment. The treated sample is then placed in an iCVD chamber for grafting and film synthesis. The setup, deposition, and grafting method of the bilayer polymer films using the iCVD method is extensively discussed elsewhere.42, 53-55 During iCVD, the molecules of radical initiator (tert-butyl peroxide, TBPO), I2, are thermally activated using filament wires, which are heated at 290° C. The labile peroxide bond of TBPO is decomposed at this temperature and creates free radicals (I˙) which react with the vinyl groups and create alkyl radicals on the surface acting as anchor points for grafting polymer.54 Then, divinylbenzene (DVB) is introduced into the reactor which reacts with the active surface at low temperature (30°C) leading to the grafting and polymerization of monomer to the substrate. The mechanically-robust and densely-crosslinked polymer (pDVB) is deposited on the surface. Poly-(1H, 1H, 2H, 2H-perfluorodecylacrylate) (pPFDA) is formed in the reactor by polymerization of perfluorodecylacrylate to maintain low surface energy and hydrophobicity. The deposition of pPFDA leads to the formation of a thin fluorine-rich polymer that forms a veneer top layer and completes synthesis of the linker grafted bilayer (LG-BL). Ungrafted bilayer pDVB/pPFDA (UG-BL) films on silicon and steel substrates are also developed by the same process without the pre-iCVD silane treatment for comparison. Sample characterization. A scanning electron microscope (SEM) (JEOL 6010LA) was used for obtaining images of the LG-BL and UG-BL coatings deposited on silicon and steel substrates. The polymer-coated substrates were coated with 5 nm of gold (Denton Desk V) and then images were obtained using 15 kV acceleration voltage. The SEM was also used to obtain images of individual sand particles used in erosion tests, which will be discussed later. A non-contacting optical profilometer (Zeta-20, KLA-Tencor Co.) was used to validate the presence of features which enhanced surface roughness on samples. The evaluation area of the optical profilometer was 136 μm × 102 μm. Roughness and dimensional information values were obtained by Zeta 3D software. For repeatability, root mean square roughness (RMS) values were taken from multiple spots and then averaged. Fourier Transform Infrared (FTIR) Spectroscopy was conducted to ensure presence of the pDVB/pPFDA coatings using a Nicolet Nexus 870 ESP spectrometer in normal transmission mode equipped with a MCT (mercury cadmium tellurium detector and KBr beam splitter). Spectra were acquired over the range of 500 to 4000 cm-1 with 4 cm-1
resolution and 256 repeated scans. X-ray photoelectron spectroscopy (XPS) data on the samples was also acquired using
Soft Matter ARTICLE
This journal is © The Royal Society of Chemistry 2018 | 3
Please do not adjust margins
Please do not adjust margins
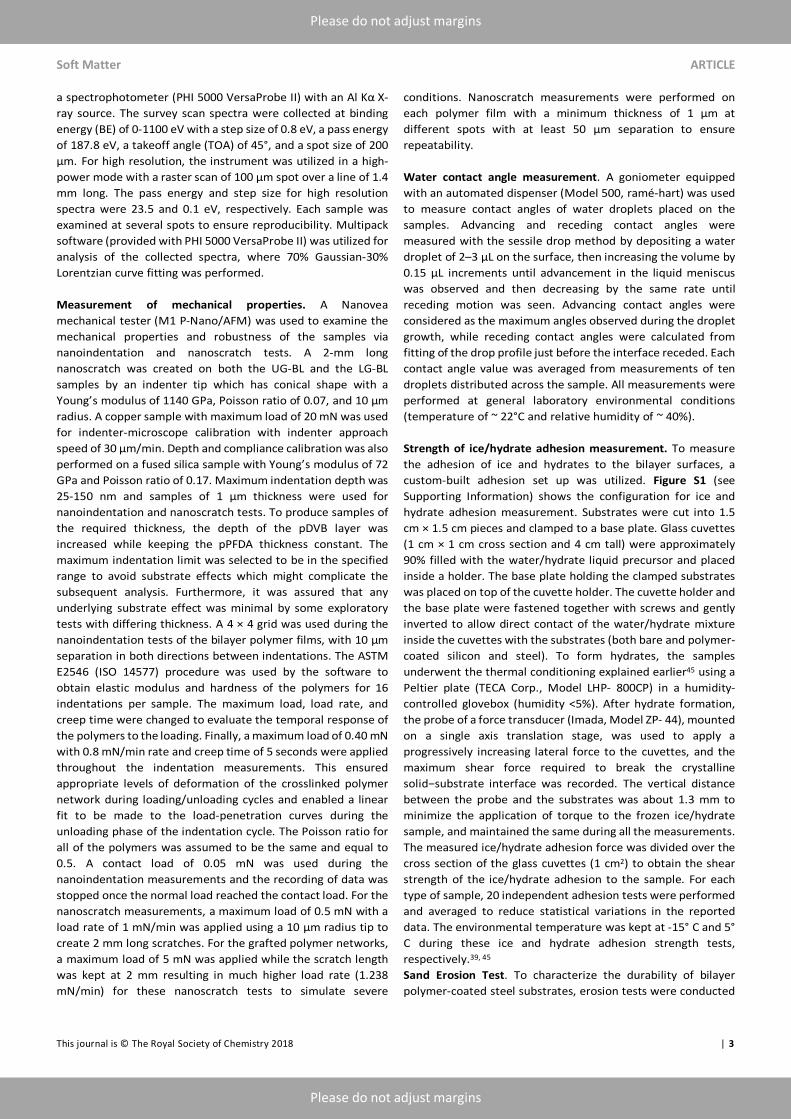
a spectrophotometer (PHI 5000 VersaProbe II) with an Al Kα X-ray source. The survey scan spectra were collected at binding energy (BE) of 0-1100 eV with a step size of 0.8 eV, a pass energy of 187.8 eV, a takeoff angle (TOA) of 45°, and a spot size of 200 μm. For high resolution, the instrument was utilized in a high-power mode with a raster scan of 100 μm spot over a line of 1.4 mm long. The pass energy and step size for high resolution spectra were 23.5 and 0.1 eV, respectively. Each sample was examined at several spots to ensure reproducibility. Multipack software (provided with PHI 5000 VersaProbe II) was utilized for analysis of the collected spectra, where 70% Gaussian-30% Lorentzian curve fitting was performed. Measurement of mechanical properties. A Nanovea mechanical tester (M1 P-Nano/AFM) was used to examine the mechanical properties and robustness of the samples via nanoindentation and nanoscratch tests. A 2-mm long nanoscratch was created on both the UG-BL and the LG-BL samples by an indenter tip which has conical shape with a Young’s modulus of 1140 GPa, Poisson ratio of 0.07, and 10 µm radius. A copper sample with maximum load of 20 mN was used for indenter-microscope calibration with indenter approach speed of 30 μm/min. Depth and compliance calibration was also performed on a fused silica sample with Young’s modulus of 72 GPa and Poisson ratio of 0.17. Maximum indentation depth was 25-150 nm and samples of 1 µm thickness were used for nanoindentation and nanoscratch tests. To produce samples of the required thickness, the depth of the pDVB layer was increased while keeping the pPFDA thickness constant. The maximum indentation limit was selected to be in the specified range to avoid substrate effects which might complicate the subsequent analysis. Furthermore, it was assured that any underlying substrate effect was minimal by some exploratory tests with differing thickness. A 4 × 4 grid was used during the nanoindentation tests of the bilayer polymer films, with 10 μm separation in both directions between indentations. The ASTM E2546 (ISO 14577) procedure was used by the software to obtain elastic modulus and hardness of the polymers for 16 indentations per sample. The maximum load, load rate, and creep time were changed to evaluate the temporal response of the polymers to the loading. Finally, a maximum load of 0.40 mN with 0.8 mN/min rate and creep time of 5 seconds were applied throughout the indentation measurements. This ensured appropriate levels of deformation of the crosslinked polymer network during loading/unloading cycles and enabled a linear fit to be made to the load-penetration curves during the unloading phase of the indentation cycle. The Poisson ratio for all of the polymers was assumed to be the same and equal to 0.5. A contact load of 0.05 mN was used during the nanoindentation measurements and the recording of data was stopped once the normal load reached the contact load. For the nanoscratch measurements, a maximum load of 0.5 mN with a load rate of 1 mN/min was applied using a 10 µm radius tip to create 2 mm long scratches. For the grafted polymer networks, a maximum load of 5 mN was applied while the scratch length was kept at 2 mm resulting in much higher load rate (1.238 mN/min) for these nanoscratch tests to simulate severe
conditions. Nanoscratch measurements were performed on each polymer film with a minimum thickness of 1 µm at different spots with at least 50 µm separation to ensure repeatability. Water contact angle measurement. A goniometer equipped with an automated dispenser (Model 500, ramé-hart) was used to measure contact angles of water droplets placed on the samples. Advancing and receding contact angles were measured with the sessile drop method by depositing a water droplet of 2–3 μL on the surface, then increasing the volume by 0.15 μL increments until advancement in the liquid meniscus was observed and then decreasing by the same rate until receding motion was seen. Advancing contact angles were considered as the maximum angles observed during the droplet growth, while receding contact angles were calculated from fitting of the drop profile just before the interface receded. Each contact angle value was averaged from measurements of ten droplets distributed across the sample. All measurements were performed at general laboratory environmental conditions (temperature of ~ 22°C and relative humidity of ~ 40%). Strength of ice/hydrate adhesion measurement. To measure the adhesion of ice and hydrates to the bilayer surfaces, a custom-built adhesion set up was utilized. Figure S1 (see Supporting Information) shows the configuration for ice and hydrate adhesion measurement. Substrates were cut into 1.5 cm × 1.5 cm pieces and clamped to a base plate. Glass cuvettes (1 cm × 1 cm cross section and 4 cm tall) were approximately 90% filled with the water/hydrate liquid precursor and placed inside a holder. The base plate holding the clamped substrates was placed on top of the cuvette holder. The cuvette holder and the base plate were fastened together with screws and gently inverted to allow direct contact of the water/hydrate mixture inside the cuvettes with the substrates (both bare and polymer-coated silicon and steel). To form hydrates, the samples underwent the thermal conditioning explained earlier45 using a Peltier plate (TECA Corp., Model LHP- 800CP) in a humidity-controlled glovebox (humidity <5%). After hydrate formation, the probe of a force transducer (Imada, Model ZP- 44), mounted on a single axis translation stage, was used to apply a progressively increasing lateral force to the cuvettes, and the maximum shear force required to break the crystalline solid−substrate interface was recorded. The vertical distance between the probe and the substrates was about 1.3 mm to minimize the application of torque to the frozen ice/hydrate sample, and maintained the same during all the measurements. The measured ice/hydrate adhesion force was divided over the cross section of the glass cuvettes (1 cm2) to obtain the shear strength of the ice/hydrate adhesion to the sample. For each type of sample, 20 independent adhesion tests were performed and averaged to reduce statistical variations in the reported data. The environmental temperature was kept at -15° C and 5° C during these ice and hydrate adhesion strength tests, respectively.39, 45 Sand Erosion Test. To characterize the durability of bilayer polymer-coated steel substrates, erosion tests were conducted

ARTICLE Soft matter
4 | This journal is © The Royal Society of Chemistry 2018
Please do not adjust margins
Please do not adjust margins
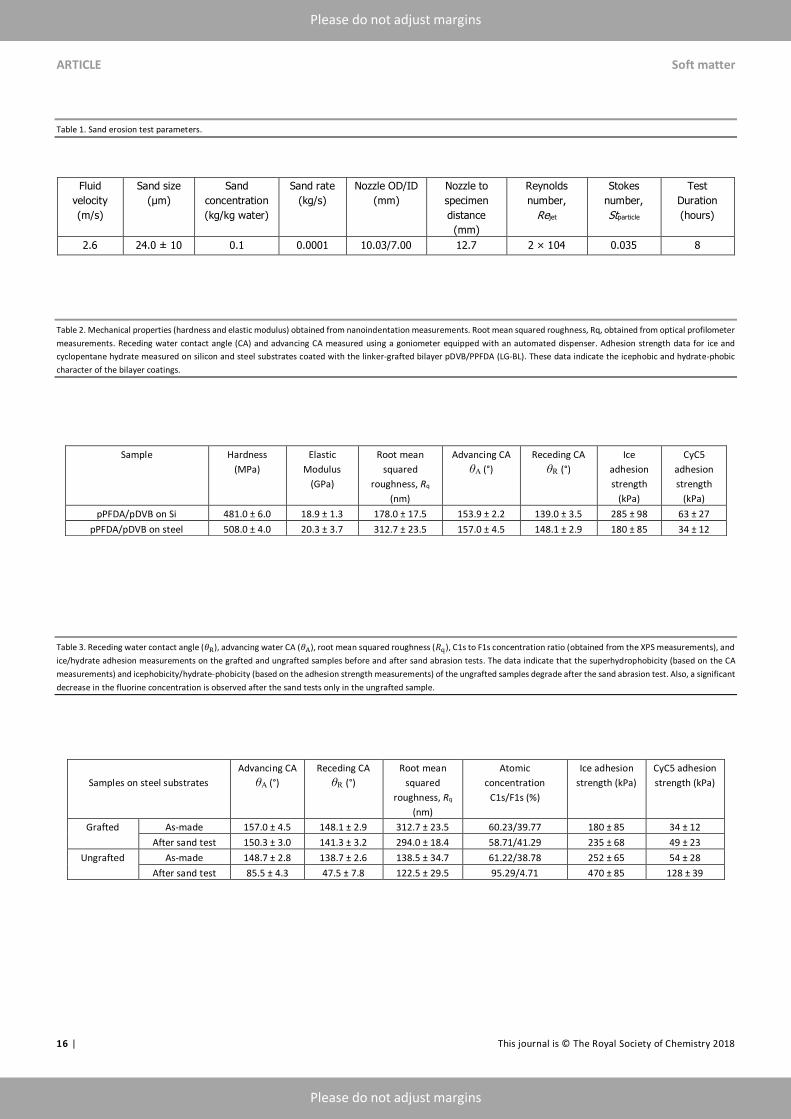
using a submerged jet apparatus56 (Figure 1a). Silica particles are continuously resuspended in the slurry tank by means of a stirrer which promotes homogeneity of the slurry mixture in the tank. As shown in Figure 1a, the slurry mixture is extracted from the bottom of the tank and pumped through a nozzle (nozzle OD/ID = 10.03 mm/7.00 mm) (Table 1) to impact the specimen. Water (with viscosity of 1 centipoise (cP)) was used in these tests, and the average liquid velocity of the submerged jet (within the nozzle) was kept constant at 2.6 m/s. The orientation angle between the nozzle and specimen was 90o and the distance from nozzle to specimen was maintained at 12.7 mm. Particle concentration (0.1 kg/kg water) in the slurry mix flowing through the nozzle was assumed to be consistent with the average particle concentration in the slurry tank as the particles are so small (average size of about 24 µm) that they are readily suspended through constant stirring and transport by the liquid (sand mass flow rate of 0.0001 kg/s). Figure 1b shows an SEM image of the sand particles used in the erosion tests and Figure 1c illustrates the particle size distribution. Flow parameters and testing conditions are summarized in Table 1.
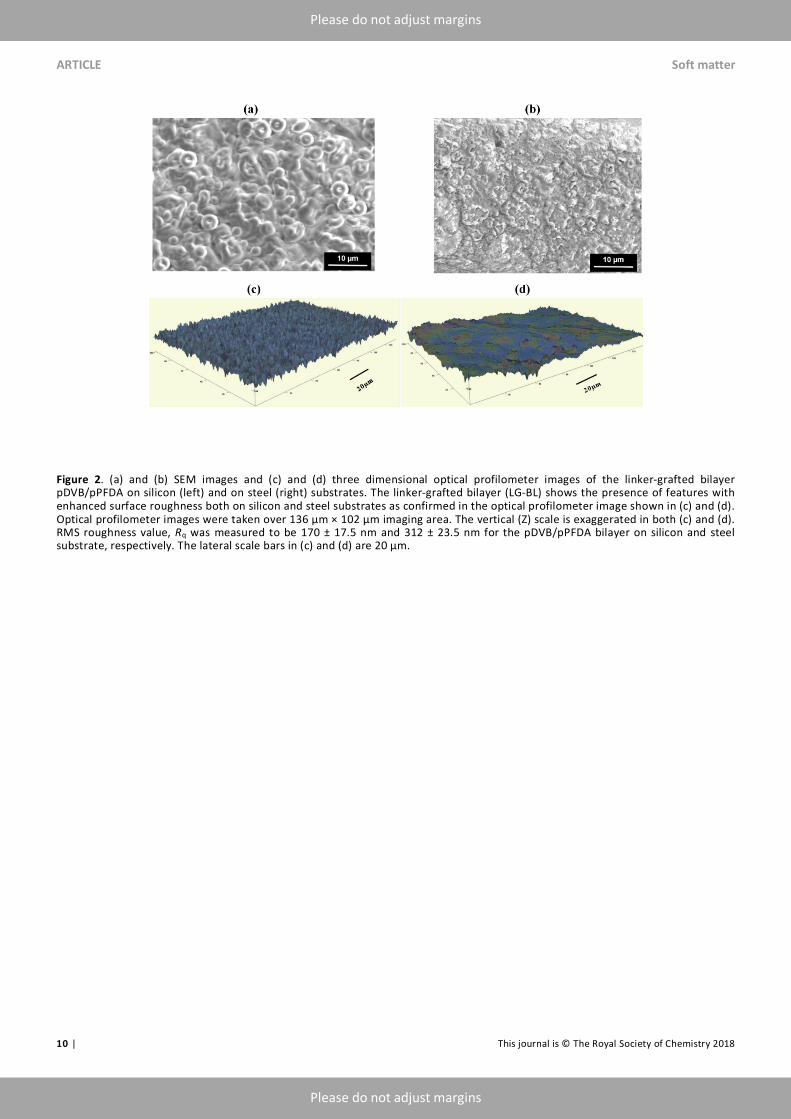
Results and discussion We developed bilayer polymer coatings using initiated chemical vapor deposition (iCVD), which is a solvent-less, conformal, and substrate-independent deposition method.53 In our bilayer design the underlying densely-crosslinked pDVB network provides enhanced mechanical properties while the fluorine-rich textured pPFDA veneer confers low surface energy and strongly hydrophobic characteristics as well. We have previously shown that a very thin surface coating and dense pDVB network prevents reorientation of the surface fluorine groups when exposed to water.57 Therefore, around a 10 nm thickness of pPFDA on crosslinked pDVB (400 nm thickness) was selected to obtain a bilayer film with very low WCA hysteresis, desirable for reduced ice and hydrate adhesion strength.42 The surface morphologies of the samples were examined by scanning electron microscopy (SEM). Figures 2a, 2b show SEM images of the linker-grafted pDVB/pPFDA bilayer (LG-BL) deposited on silicon (left) and steel (right) substrates. Three dimensional optical images were also generated and analyzed using profilometry (Figure 2. c, d). It is observed from these images that the surface roughness of the pDVB/pPFDA coated silicon and steel substrates was enhanced significantly. Root mean squared (RMS) roughness value was measured to be Rq = 178.0 ± 17.5 nm and 312.7 ± 23.5 nm for the pDVB/pPFDA bilayer on silicon and steel substrates, respectively (Table 2). The higher roughness value of the iCVD coating on the steel substrate when compared to the equivalent coating on silicon is due to the inherently rough underlying steel substrate. When immersed in water the spacings between the textural peaks of the roughness can be occupied by air pockets which support the Cassie-Baxter state for sessile droplets and promote high static contact angles. From FTIR spectroscopy, the presence of bands corresponding to carbonyl, carbon−fluorine bonds, and phenyl groups confirms the successful deposition of pDVB and pPFDA on the
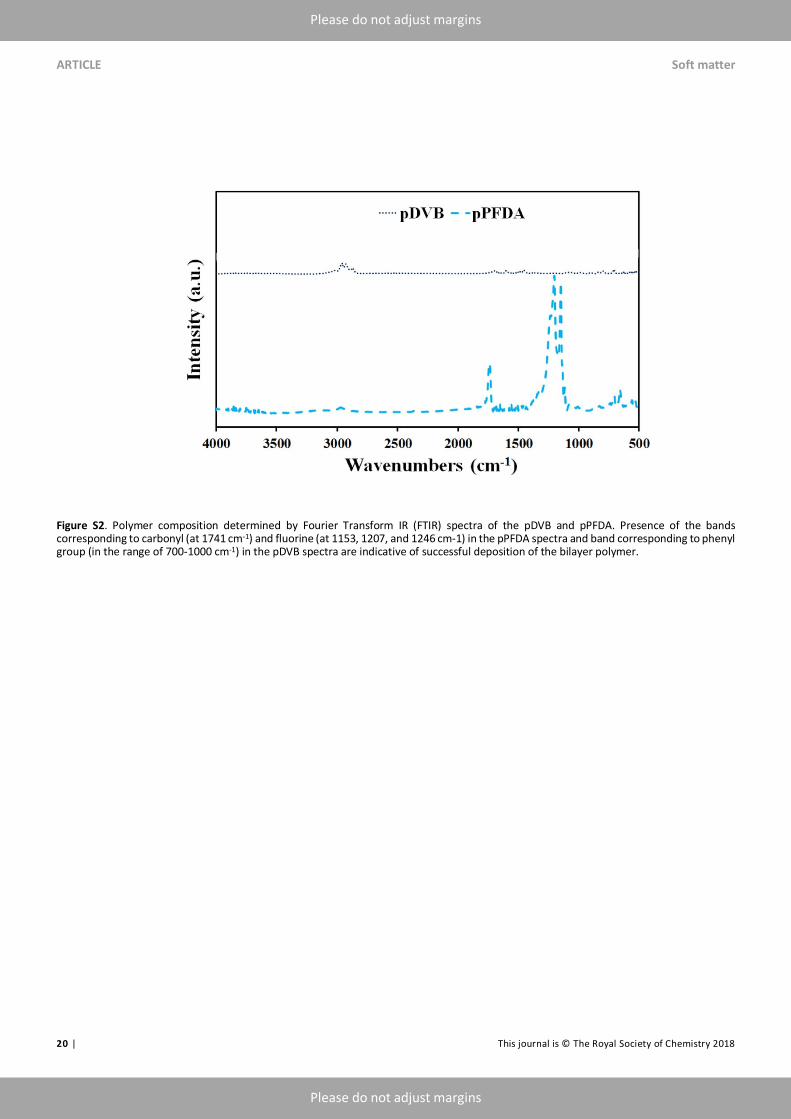
substrates.39 From the intensity vs wavenumbers plot (see Supporting Information, Figure S2) obtained by FTIR, we found sharp bands at 1741 cm-1, and at 1153, 1207 and 1246 cm-1 corresponding to carbonyl and fluorine, respectively in the pPFDA spectra. The pDVB spectra band indicates the phenyl group in the range of 700-1000 cm-1. To qualify the mechanical robustness of the deposited bilayer polymer films nanoindentation and nanoscratch measurements were conducted. Elastic modulus (E) and hardness (H) were obtained from nanoindentation measurements by load-penetration curves using ASTM E2546 standard. The hardness of the bilayer film was determined using the following relation:
𝐻 = $%&'((*+)
(1)
where𝑃./0 is the maximum load and 𝐴(ℎ3) is the projected contact area at the critical indentation height ℎ3 . Hardness values were found to be 481.0 ± 6.0 MPa and 508.0 ± 4.0 MPa for pPFDA/pDVB bilayer on silicon and steel substrates, respectively (Table 2). The Young's modulus of the cross-linked polymer film, E, was determined with the following relation:
456= 478
9
5+478;
9
5; (2)
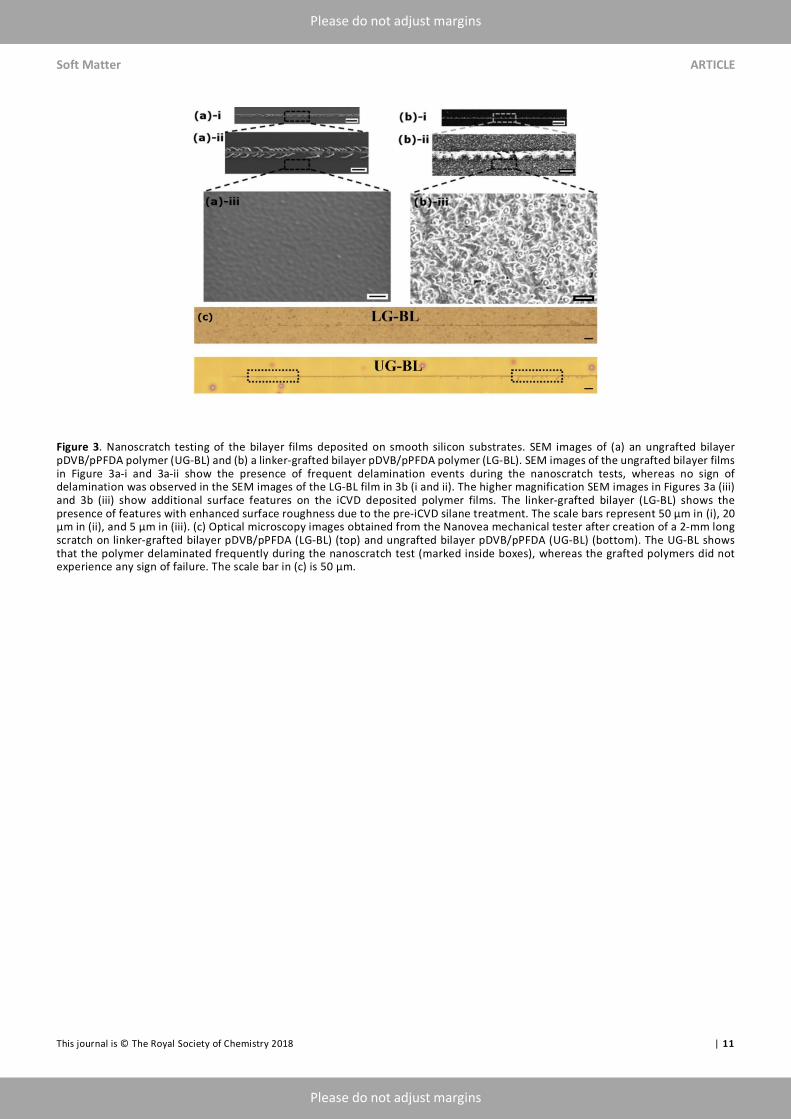
where Ei is the Young's modulus and 𝜐= is the Poisson ratio of the diamond intender and 𝜐 is the Poisson ratio of the polymer film sample. The elastic modulus was calculated to be 18.9 ± 1.3 GPa and 20.3 ± 3.7 GPa for pPFDA/pDVB bilayer on silicon and steel substrates, respectively (Table 2). The high values of E and H indicate the stiff characteristics of these crosslinked polymer networks and excellent capability for resisting deformation by impact of particles. It is to be noted that the densely cross-linked pDVB network, not the thin top pPFDA film, controls the effective elastic modulus and hardness of this bilayer film. This is because the DVB monomer has two vinyl bonds whereas PFDA has only one. Therefore, the pDVB film which is deposited on the substrate has a higher cross-link density and produces a stiffer network, which results in improved mechanical properties. Icephobic/hydrate-phobic surfaces generally find applications in harsh environmental conditions. In typical oil/gas applications the coatings are desired on pipelines and other equipment exposed to flows containing particles which can induce wear, erosion, and/or scratches on the repellent coatings. Therefore, for practical application, prolonged service-life of the deposited bilayer films is essential. The iCVD polymerization process enables grafting of the polymer networks to the substrates through strong covalent bonding whereas traditional polymer coatings are usually deposited by adsorption onto the underlying substrates that can be disrupted under severe operating conditions. Nanoscratch tests were performed to qualitatively examine the adhesion between the polymer films and substrates. We measured the properties of both ungrafted bilayer pDVB/pPFDA polymer (UG-BL) as well as linker-grafted bilayer pDVB/pPFDA polymer (LG-BL) deposited on smooth silicon substrates in order to limit variations arising from underlying substrate roughness variations. Figure 3a (i and
Soft Matter ARTICLE
This journal is © The Royal Society of Chemistry 2018 | 5
Please do not adjust margins
Please do not adjust margins
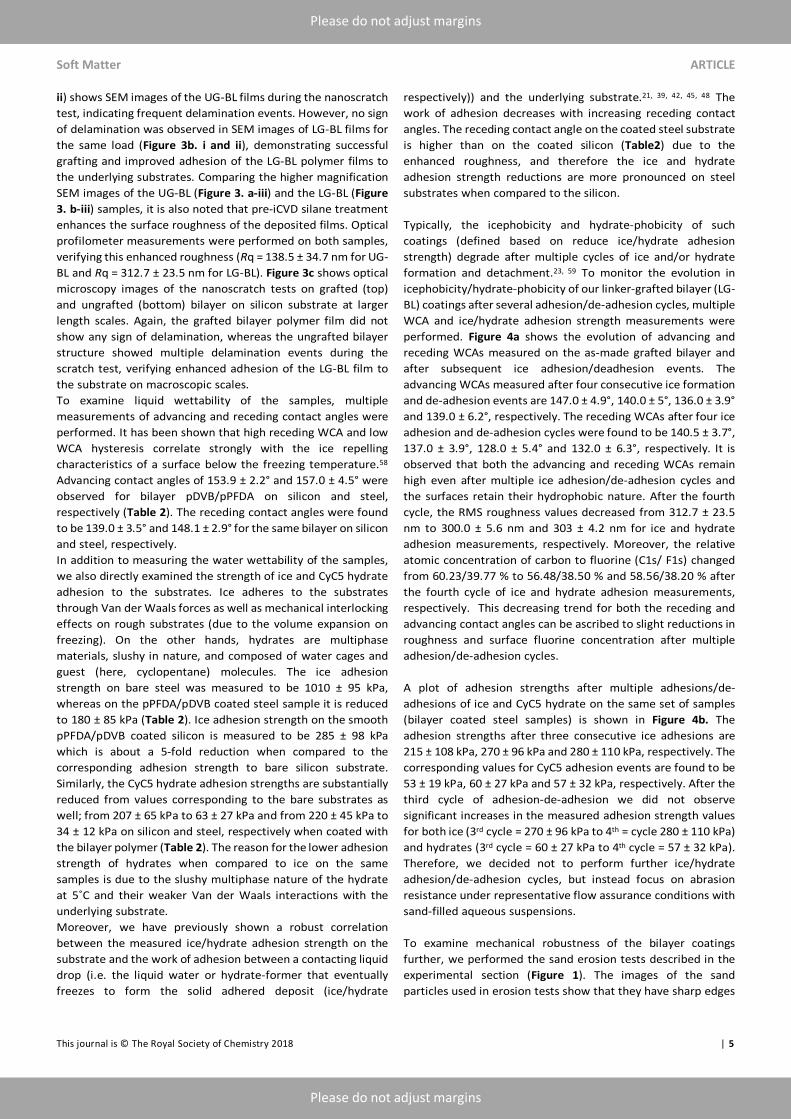
ii) shows SEM images of the UG-BL films during the nanoscratch test, indicating frequent delamination events. However, no sign of delamination was observed in SEM images of LG-BL films for the same load (Figure 3b. i and ii), demonstrating successful grafting and improved adhesion of the LG-BL polymer films to the underlying substrates. Comparing the higher magnification SEM images of the UG-BL (Figure 3. a-iii) and the LG-BL (Figure 3. b-iii) samples, it is also noted that pre-iCVD silane treatment enhances the surface roughness of the deposited films. Optical profilometer measurements were performed on both samples, verifying this enhanced roughness (Rq = 138.5 ± 34.7 nm for UG-BL and Rq = 312.7 ± 23.5 nm for LG-BL). Figure 3c shows optical microscopy images of the nanoscratch tests on grafted (top) and ungrafted (bottom) bilayer on silicon substrate at larger length scales. Again, the grafted bilayer polymer film did not show any sign of delamination, whereas the ungrafted bilayer structure showed multiple delamination events during the scratch test, verifying enhanced adhesion of the LG-BL film to the substrate on macroscopic scales. To examine liquid wettability of the samples, multiple measurements of advancing and receding contact angles were performed. It has been shown that high receding WCA and low WCA hysteresis correlate strongly with the ice repelling characteristics of a surface below the freezing temperature.58 Advancing contact angles of 153.9 ± 2.2° and 157.0 ± 4.5° were observed for bilayer pDVB/pPFDA on silicon and steel, respectively (Table 2). The receding contact angles were found to be 139.0 ± 3.5° and 148.1 ± 2.9° for the same bilayer on silicon and steel, respectively. In addition to measuring the water wettability of the samples, we also directly examined the strength of ice and CyC5 hydrate adhesion to the substrates. Ice adheres to the substrates through Van der Waals forces as well as mechanical interlocking effects on rough substrates (due to the volume expansion on freezing). On the other hands, hydrates are multiphase materials, slushy in nature, and composed of water cages and guest (here, cyclopentane) molecules. The ice adhesion strength on bare steel was measured to be 1010 ± 95 kPa, whereas on the pPFDA/pDVB coated steel sample it is reduced to 180 ± 85 kPa (Table 2). Ice adhesion strength on the smooth pPFDA/pDVB coated silicon is measured to be 285 ± 98 kPa which is about a 5-fold reduction when compared to the corresponding adhesion strength to bare silicon substrate. Similarly, the CyC5 hydrate adhesion strengths are substantially reduced from values corresponding to the bare substrates as well; from 207 ± 65 kPa to 63 ± 27 kPa and from 220 ± 45 kPa to 34 ± 12 kPa on silicon and steel, respectively when coated with the bilayer polymer (Table 2). The reason for the lower adhesion strength of hydrates when compared to ice on the same samples is due to the slushy multiphase nature of the hydrate at 5˚C and their weaker Van der Waals interactions with the underlying substrate. Moreover, we have previously shown a robust correlation between the measured ice/hydrate adhesion strength on the substrate and the work of adhesion between a contacting liquid drop (i.e. the liquid water or hydrate-former that eventually freezes to form the solid adhered deposit (ice/hydrate
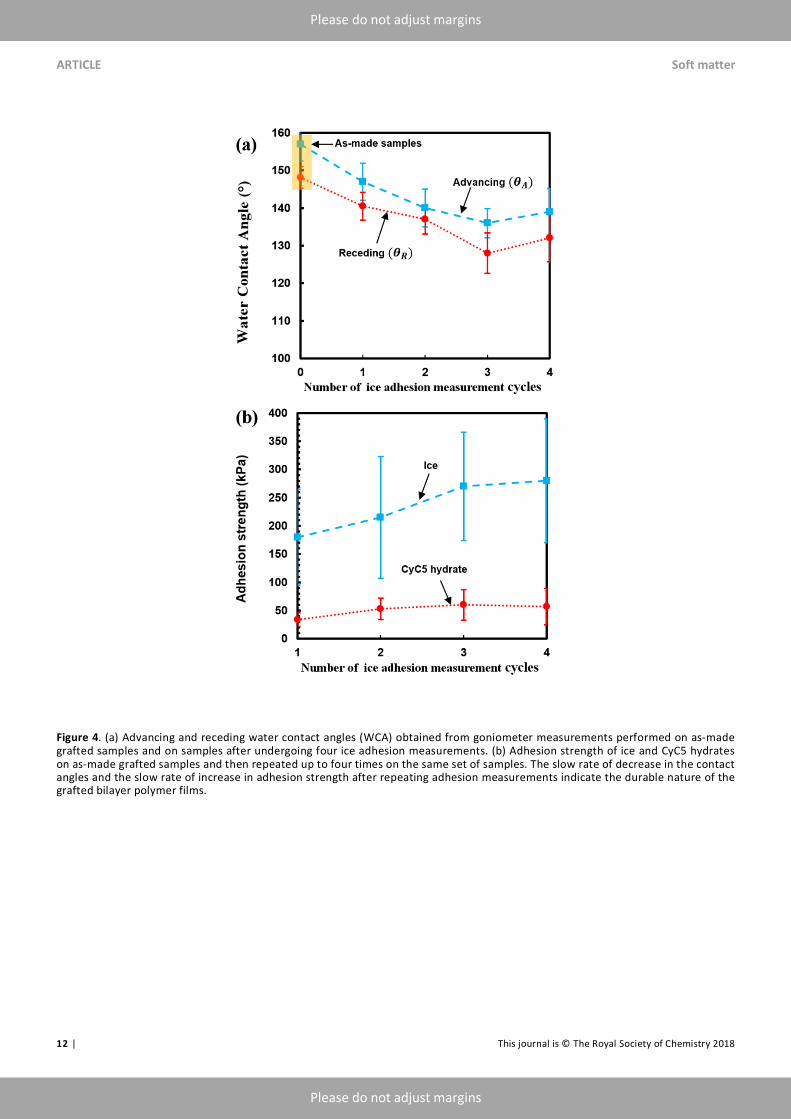
respectively)) and the underlying substrate.21, 39, 42, 45, 48 The work of adhesion decreases with increasing receding contact angles. The receding contact angle on the coated steel substrate is higher than on the coated silicon (Table2) due to the enhanced roughness, and therefore the ice and hydrate adhesion strength reductions are more pronounced on steel substrates when compared to the silicon. Typically, the icephobicity and hydrate-phobicity of such coatings (defined based on reduce ice/hydrate adhesion strength) degrade after multiple cycles of ice and/or hydrate formation and detachment.23, 59 To monitor the evolution in icephobicity/hydrate-phobicity of our linker-grafted bilayer (LG-BL) coatings after several adhesion/de-adhesion cycles, multiple WCA and ice/hydrate adhesion strength measurements were performed. Figure 4a shows the evolution of advancing and receding WCAs measured on the as-made grafted bilayer and after subsequent ice adhesion/deadhesion events. The advancing WCAs measured after four consecutive ice formation and de-adhesion events are 147.0 ± 4.9°, 140.0 ± 5°, 136.0 ± 3.9° and 139.0 ± 6.2°, respectively. The receding WCAs after four ice adhesion and de-adhesion cycles were found to be 140.5 ± 3.7°, 137.0 ± 3.9°, 128.0 ± 5.4° and 132.0 ± 6.3°, respectively. It is observed that both the advancing and receding WCAs remain high even after multiple ice adhesion/de-adhesion cycles and the surfaces retain their hydrophobic nature. After the fourth cycle, the RMS roughness values decreased from 312.7 ± 23.5 nm to 300.0 ± 5.6 nm and 303 ± 4.2 nm for ice and hydrate adhesion measurements, respectively. Moreover, the relative atomic concentration of carbon to fluorine (C1s/ F1s) changed from 60.23/39.77 % to 56.48/38.50 % and 58.56/38.20 % after the fourth cycle of ice and hydrate adhesion measurements, respectively. This decreasing trend for both the receding and advancing contact angles can be ascribed to slight reductions in roughness and surface fluorine concentration after multiple adhesion/de-adhesion cycles. A plot of adhesion strengths after multiple adhesions/de-adhesions of ice and CyC5 hydrate on the same set of samples (bilayer coated steel samples) is shown in Figure 4b. The adhesion strengths after three consecutive ice adhesions are 215 ± 108 kPa, 270 ± 96 kPa and 280 ± 110 kPa, respectively. The corresponding values for CyC5 adhesion events are found to be 53 ± 19 kPa, 60 ± 27 kPa and 57 ± 32 kPa, respectively. After the third cycle of adhesion-de-adhesion we did not observe significant increases in the measured adhesion strength values for both ice (3rd cycle = 270 ± 96 kPa to 4th = cycle 280 ± 110 kPa) and hydrates (3rd cycle = 60 ± 27 kPa to 4th cycle = 57 ± 32 kPa). Therefore, we decided not to perform further ice/hydrate adhesion/de-adhesion cycles, but instead focus on abrasion resistance under representative flow assurance conditions with sand-filled aqueous suspensions. To examine mechanical robustness of the bilayer coatings further, we performed the sand erosion tests described in the experimental section (Figure 1). The images of the sand particles used in erosion tests show that they have sharp edges

ARTICLE Soft matter
6 | This journal is © The Royal Society of Chemistry 2018
Please do not adjust margins
Please do not adjust margins
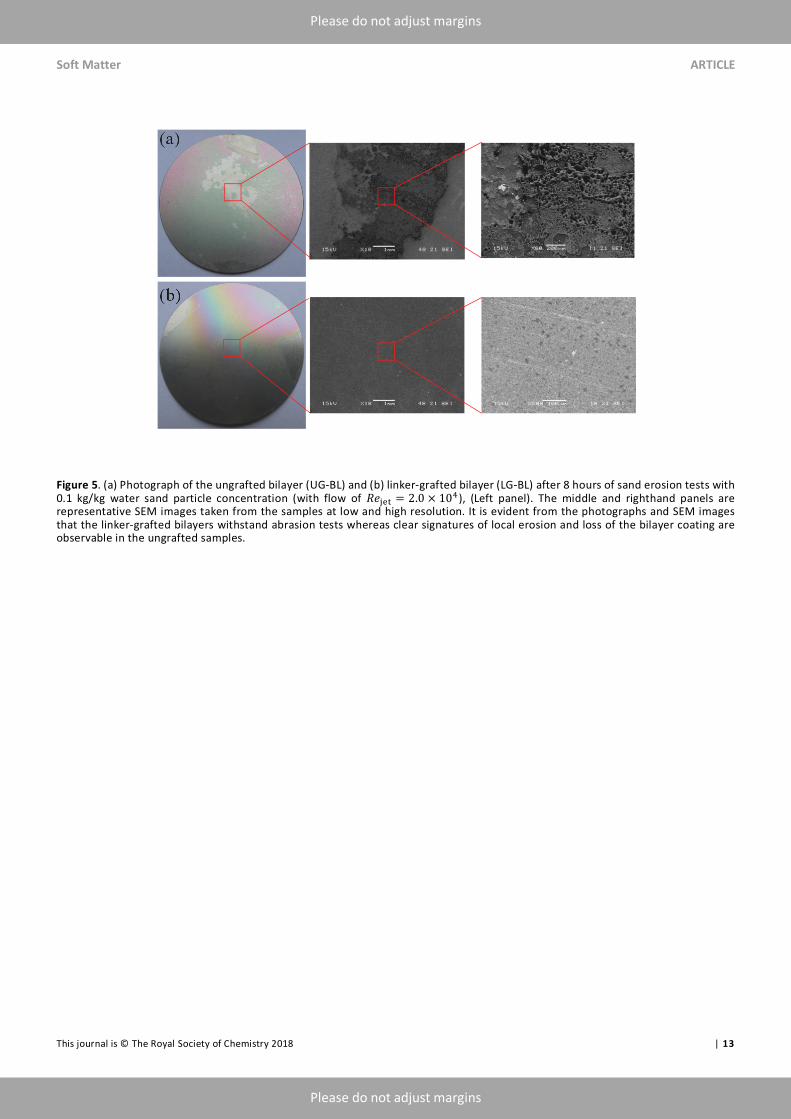
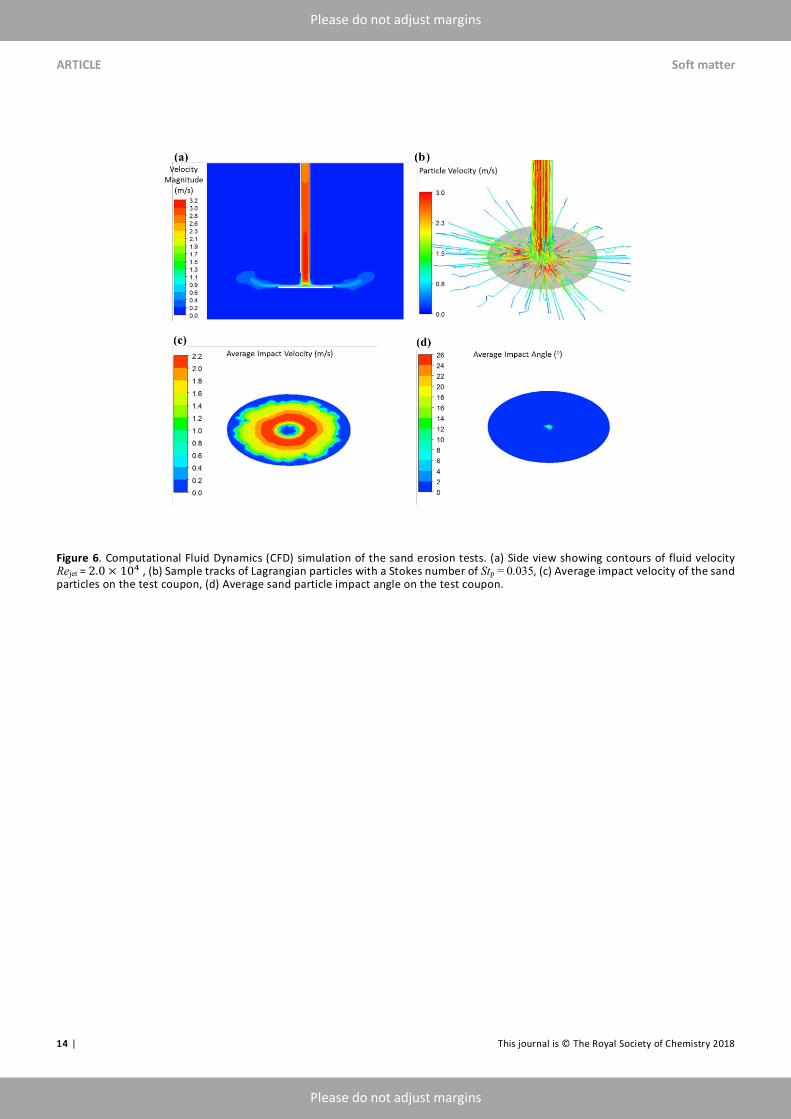
and are very small in size leading to substantial possibility of scratching and erosion. The material loss observed in the erosion tests can be attributed mostly to the abrasive form of erosion considering the angular shape of the silica particles.60 Figure 5 shows photographs (left) and SEM images (middle and right) of ungrafted (UG-BL) and linker-grafted (LG-BL) bilayers on steel substrates which were under sand erosion tests for 8 hours. Abrasive erosion was observed on the ungrafted bilayer (Figure 5a), while there was no sign of abrasion on the grafted bilayer film (Figure 5b) after the erosion test. The low magnification zoomed-out images (left column of Figure 5) show local eroded regions along with non-eroded areas. The SEM images show higher magnification images of the undamaged polymer coating on LG-BL. This indicates durability of the linker-grafted bilayer (LG-BL) coating under continued impact by abrasive particles which will occur during practical application of icephobic and hydrate-phobic surfaces in the oil/gas sector. The particle impact velocity and jet incidence angle are major contributors to erosion rates. In order to estimate the impact parameters of the silica particles that are entrained in the liquid jet, CFD simulations and a Lagrangian particle tracking scheme were employed. ANSYS® Fluent was used to simulate the submerged slurry jet impact using the k-ω turbulence model, and after obtaining the steady-state flow solution, particles were injected at the nozzle inlet and modeled as a discrete phase and traced until they leave the simulation domain. The results of the CFD simulation of fluid velocity (a), particle trajectory velocity (b), average impact velocity of the particles on the specimen (c) and average impact angle of the particles on the specimen (d) are shown in Figure 6. Most of the abrasion damage on the ungrafted bilayer is evident around the center of the impacting jet, but not exactly on the center of the sample (Figure 5a, left panel). The CFD simulation of the sand erosion tests helps rationalize this phenomenon. As shown in Figure 6c, the maximum impact velocity of the sand particles occurs in an annular ring around the center, and the particle velocity in the center of the sample near the stagnation point of the jet is minimal. It is also to be noted that particle impact velocities are not the same as the liquid velocities within the nozzle since significant viscous drag is expected on the particles convected with the submerged jet as they approach a surface. We study Stokes number which is defined by the ratio of the characteristic response time of the fluid to the characteristic response time of the particle to predict the behavior of the sand particles suspended in the water jet. Stokes number was calculated by, Stp = >?
@, where t is relaxation time of the particle, u is the jet
velocity (2.6 m/s), l is the characteristic length scale which is equal to the nozzle diameter (7 mm). Assuming minor slippage between the particle and liquid i.e. in the case of stokes flow, relaxation time is calculated by, t = 𝜌B𝑑D/18µ, where ρp is density of particle (2650 kg/m^3), d is the particle size (24 µm) and µ is the dynamic viscosity of the water (8.9 * 10^-4 Pa.s). The calculated small value of Stokes number of the flow, Stp = 0.035 indicates that the sand particles follow the streamlines of the liquid very closely and most particles are carried away from the stagnation region at the center of impact. Therefore, the impact
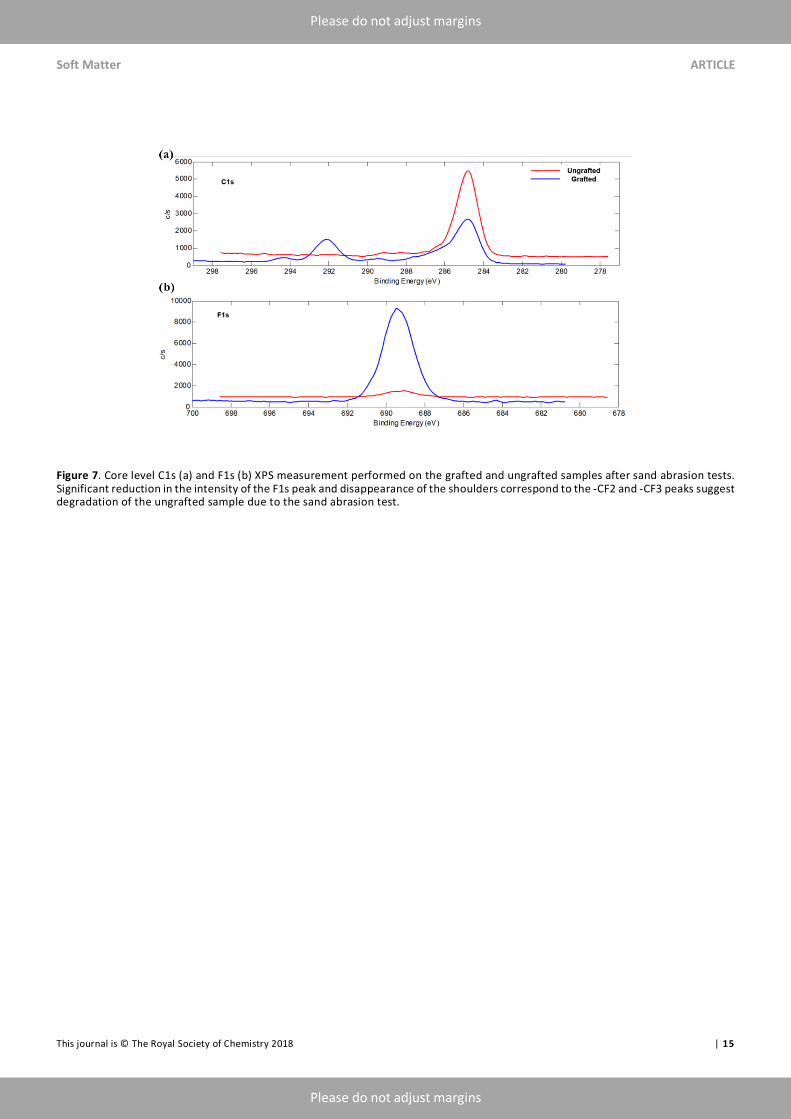
velocity of the particles at the center point is very low (0-0.2 m/s), whereas maximum impact velocity (2.2 m/s) is found in an annular region around the stagnation point. Moreover, the computations show that the average sand particle impact angle is very small everywhere on the samples except directly under the outlet of the nozzle. It is observed from Figure 6 that, except for the stagnation point on the specimen, the impact angles of the particles are less than 2o. At these grazing impact angles, scouring erosion occurs where craters are formed60 like we observed for the ungrafted bilayer films shown in Figure 5a (right panel).Changes in the surface roughness of the linker-grafted bilayer (LG-BL) and ungrafted bilayer (UG-BL) films deposited on steel substrates were examined after 8 hours of sand erosion test. RMS roughness values for the LG-BL were measured to be Rq = 312.7 ± 23.5 nm and Rq = 294.0 ± 18.4 nm for the as-made grafted-bilayer and after sand erosion test, respectively (Table 3). The corresponding RMS values on the UG-BL film were measured to be Rq =138.5 ± 34.7 nm and Rq = 122.5 ± 29.5 nm for as-made and after sand erosion test, respectively. It is to be noted that the reduction of roughness due to abrasive erosion for UG-BL (~11.6 %) was significantly greater than the same for LG-BL (~5.8 %). Changes to the liquid wettability of the grafted bilayer (LG-BL) film deposited on the steel substrate were also examined after the erosion test. Figure S3 (see Supporting Information) shows photographs of a sessile water droplet and a sessile CyC5-in-water emulsion droplet on the grafted bilayer. After the sand erosion test, the advancing contact angle of a water droplet was reduced from θA = 157.0 ± 4.5° to 150.3 ± 3.0° and the receding contact angle was reduced from θR =148.1 ± 2.9° to 141.3 ± 3.2° (Table 3). Both the photographs and the measured contact angle values indicate that the superhydrophobic character of the samples is maintained even after the abrasion test. However, this is not the case for ungrafted bilayer coatings deposited on steel substrates. Before the sand erosion test, the advancing and receding contact angles were found to be 148.7 ± 2.8° and 138.7 ± 2.6° respectively. But after the sand erosion test, liquid repellency degraded drastically for the ungrafted bilayer, reducing to as low as 85.5 ± 4.3° and 47.5 ± 7.8° (Table 3) for advancing and receding contact angles, respectively. To study the surface chemistry after erosion test, quantitative elemental composition analysis of our bilayer coatings was performed using X-ray photoelectron spectroscopy (XPS). Figure 7 shows a high resolution XPS spectra measurement performed on the grafted and ungrafted bilayer after sand erosion tests. The significant reduction in the intensity of the F1s peak and the complete disappearance of the shoulders corresponding to the -CF2 and -CF3 peaks (Figure S4) indicate degradation of the ungrafted sample due to the sand erosion test. In Figure 7b, the high binding energy of 688.4 eV was attributed to F1s in the grafted sample. Atomic concentration of C1s and F1s for grafted and ungrafted bilayer before and after sand test are given in Table 3. For grafted samples on steel substrates, the relative atomic concentration (C1s/ F1s) was obtained as 60.23/39.77 % and 58.71/41.29 % for as-made and after sand test, respectively. For ungrafted samples on the same substrates, atomic concentration (C1s/F1s) was 61.22/38.78
Soft Matter ARTICLE
This journal is © The Royal Society of Chemistry 2018 | 7
Please do not adjust margins
Please do not adjust margins
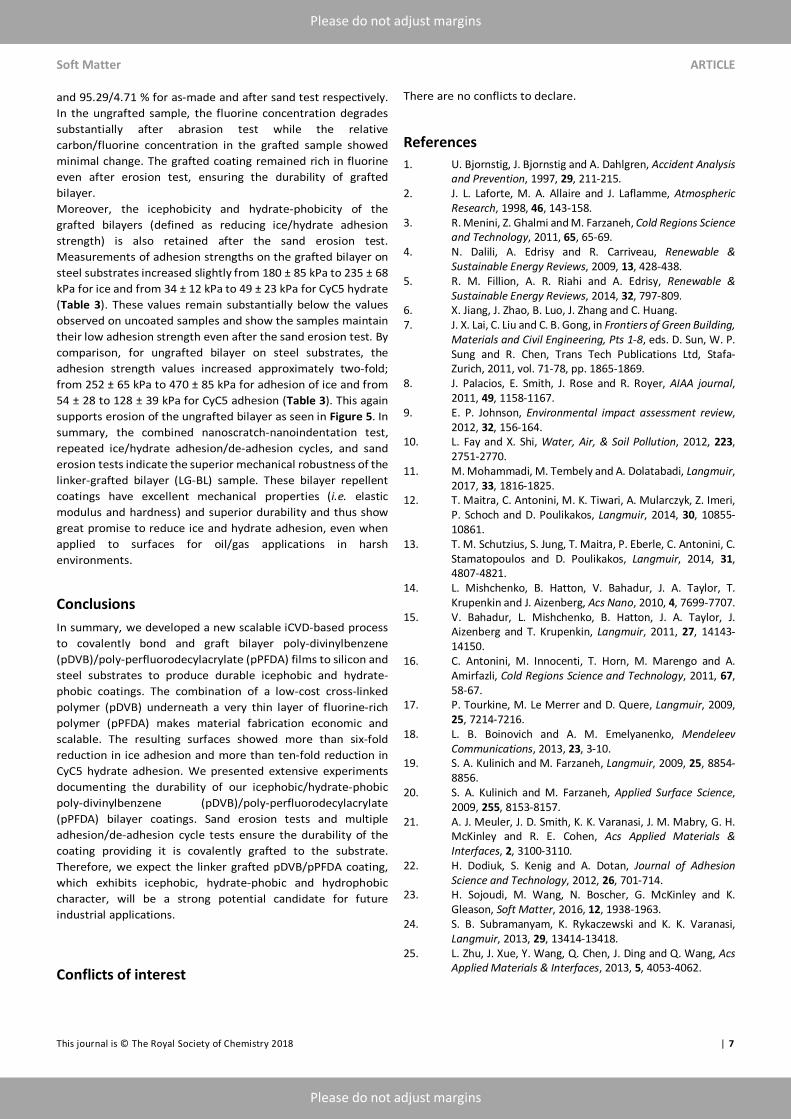
and 95.29/4.71 % for as-made and after sand test respectively. In the ungrafted sample, the fluorine concentration degrades substantially after abrasion test while the relative carbon/fluorine concentration in the grafted sample showed minimal change. The grafted coating remained rich in fluorine even after erosion test, ensuring the durability of grafted bilayer. Moreover, the icephobicity and hydrate-phobicity of the grafted bilayers (defined as reducing ice/hydrate adhesion strength) is also retained after the sand erosion test. Measurements of adhesion strengths on the grafted bilayer on steel substrates increased slightly from 180 ± 85 kPa to 235 ± 68 kPa for ice and from 34 ± 12 kPa to 49 ± 23 kPa for CyC5 hydrate (Table 3). These values remain substantially below the values observed on uncoated samples and show the samples maintain their low adhesion strength even after the sand erosion test. By comparison, for ungrafted bilayer on steel substrates, the adhesion strength values increased approximately two-fold; from 252 ± 65 kPa to 470 ± 85 kPa for adhesion of ice and from 54 ± 28 to 128 ± 39 kPa for CyC5 adhesion (Table 3). This again supports erosion of the ungrafted bilayer as seen in Figure 5. In summary, the combined nanoscratch-nanoindentation test, repeated ice/hydrate adhesion/de-adhesion cycles, and sand erosion tests indicate the superior mechanical robustness of the linker-grafted bilayer (LG-BL) sample. These bilayer repellent coatings have excellent mechanical properties (i.e. elastic modulus and hardness) and superior durability and thus show great promise to reduce ice and hydrate adhesion, even when applied to surfaces for oil/gas applications in harsh environments.
Conclusions In summary, we developed a new scalable iCVD-based process to covalently bond and graft bilayer poly-divinylbenzene (pDVB)/poly-perfluorodecylacrylate (pPFDA) films to silicon and steel substrates to produce durable icephobic and hydrate-phobic coatings. The combination of a low-cost cross-linked polymer (pDVB) underneath a very thin layer of fluorine-rich polymer (pPFDA) makes material fabrication economic and scalable. The resulting surfaces showed more than six-fold reduction in ice adhesion and more than ten-fold reduction in CyC5 hydrate adhesion. We presented extensive experiments documenting the durability of our icephobic/hydrate-phobic poly-divinylbenzene (pDVB)/poly-perfluorodecylacrylate (pPFDA) bilayer coatings. Sand erosion tests and multiple adhesion/de-adhesion cycle tests ensure the durability of the coating providing it is covalently grafted to the substrate. Therefore, we expect the linker grafted pDVB/pPFDA coating, which exhibits icephobic, hydrate-phobic and hydrophobic character, will be a strong potential candidate for future industrial applications.
Conflicts of interest
There are no conflicts to declare.
References 1. U. Bjornstig, J. Bjornstig and A. Dahlgren, Accident Analysis
and Prevention, 1997, 29, 211-215. 2. J. L. Laforte, M. A. Allaire and J. Laflamme, Atmospheric
Research, 1998, 46, 143-158. 3. R. Menini, Z. Ghalmi and M. Farzaneh, Cold Regions Science
and Technology, 2011, 65, 65-69. 4. N. Dalili, A. Edrisy and R. Carriveau, Renewable &
Sustainable Energy Reviews, 2009, 13, 428-438. 5. R. M. Fillion, A. R. Riahi and A. Edrisy, Renewable &
Sustainable Energy Reviews, 2014, 32, 797-809. 6. X. Jiang, J. Zhao, B. Luo, J. Zhang and C. Huang. 7. J. X. Lai, C. Liu and C. B. Gong, in Frontiers of Green Building,
Materials and Civil Engineering, Pts 1-8, eds. D. Sun, W. P. Sung and R. Chen, Trans Tech Publications Ltd, Stafa-Zurich, 2011, vol. 71-78, pp. 1865-1869.
8. J. Palacios, E. Smith, J. Rose and R. Royer, AIAA journal, 2011, 49, 1158-1167.
9. E. P. Johnson, Environmental impact assessment review, 2012, 32, 156-164.
10. L. Fay and X. Shi, Water, Air, & Soil Pollution, 2012, 223, 2751-2770.
11. M. Mohammadi, M. Tembely and A. Dolatabadi, Langmuir, 2017, 33, 1816-1825.
12. T. Maitra, C. Antonini, M. K. Tiwari, A. Mularczyk, Z. Imeri, P. Schoch and D. Poulikakos, Langmuir, 2014, 30, 10855-10861.
13. T. M. Schutzius, S. Jung, T. Maitra, P. Eberle, C. Antonini, C. Stamatopoulos and D. Poulikakos, Langmuir, 2014, 31, 4807-4821.
14. L. Mishchenko, B. Hatton, V. Bahadur, J. A. Taylor, T. Krupenkin and J. Aizenberg, Acs Nano, 2010, 4, 7699-7707.
15. V. Bahadur, L. Mishchenko, B. Hatton, J. A. Taylor, J. Aizenberg and T. Krupenkin, Langmuir, 2011, 27, 14143-14150.
16. C. Antonini, M. Innocenti, T. Horn, M. Marengo and A. Amirfazli, Cold Regions Science and Technology, 2011, 67, 58-67.
17. P. Tourkine, M. Le Merrer and D. Quere, Langmuir, 2009, 25, 7214-7216.
18. L. B. Boinovich and A. M. Emelyanenko, Mendeleev Communications, 2013, 23, 3-10.
19. S. A. Kulinich and M. Farzaneh, Langmuir, 2009, 25, 8854-8856.
20. S. A. Kulinich and M. Farzaneh, Applied Surface Science, 2009, 255, 8153-8157.
21. A. J. Meuler, J. D. Smith, K. K. Varanasi, J. M. Mabry, G. H. McKinley and R. E. Cohen, Acs Applied Materials & Interfaces, 2, 3100-3110.
22. H. Dodiuk, S. Kenig and A. Dotan, Journal of Adhesion Science and Technology, 2012, 26, 701-714.
23. H. Sojoudi, M. Wang, N. Boscher, G. McKinley and K. Gleason, Soft Matter, 2016, 12, 1938-1963.
24. S. B. Subramanyam, K. Rykaczewski and K. K. Varanasi, Langmuir, 2013, 29, 13414-13418.
25. L. Zhu, J. Xue, Y. Wang, Q. Chen, J. Ding and Q. Wang, Acs Applied Materials & Interfaces, 2013, 5, 4053-4062.

ARTICLE Soft matter
8 | This journal is © The Royal Society of Chemistry 2018
Please do not adjust margins
Please do not adjust margins
26. P. Kim, T. S. Wong, J. Alvarenga, M. J. Kreder, W. E. Adorno-Martinez and J. Aizenberg, Acs Nano, 2012, 6, 6569-6577.
27. P. Irajizad, M. Hasnain, N. Farokhnia, S. M. Sajadi and H. Ghasemi, Nature communications, 2016, 7, 13395.
28. Z. He, E. T. Vågenes, C. Delabahan, J. He and Z. Zhang, Scientific Reports, 2017, 7, 42181.
29. J. B. Boreyko, R. R. Hansen, K. R. Murphy, S. Nath, S. T. Retterer and C. P. Collier, Scientific reports, 2016, 6.
30. K. Golovin, S. P. R. Kobaku, D. H. Lee, E. T. DiLoreto, J. M. Mabry and A. Tuteja, Science Advances, 2016, 2, e1501496.
31. K. K. Varanasi, T. Deng, J. D. Smith, M. Hsu and N. Bhate, Applied Physics Letters, 2010, 97.
32. R. Ramachandran, M. Kozhukhova, K. Sobolev and M. Nosonovsky, Entropy, 2016, 18, 132.
33. V. Hejazi, K. Sobolev and M. Nosonovsky, Scientific Reports, 2013, 3.
34. K. Rykaczewski, S. Anand, S. B. Subramanyam and K. K. Varanasi, Langmuir, 2013, 29, 5230-5238.
35. M. Susoff, K. Siegmann, C. Pfaffenroth and M. Hirayama, Applied Surface Science, 2013, 282, 870-879.
36. S. Kulinich, S. Farhadi, K. Nose and X. Du, Langmuir, 2010, 27, 25-29.
37. S. Jung, M. Dorrestijn, D. Raps, A. Das, C. M. Megaridis and D. Poulikakos, Langmuir, 2011, 27, 3059-3066.
38. S. Farhadi, M. Farzaneh and S. A. Kulinich, Applied Surface Science, 2011, 257, 6264-6269.
39. H. Sojoudi, G. H. McKinley and K. K. Gleason, Materials Horizons, 2015, 2, 91-99.
40. L. B. Boinovich, A. M. Emelyanenko, V. K. Ivanov and A. S. Pashinin, Acs Applied Materials & Interfaces, 2013, 5, 2549-2554.
41. C.-H. Xue and J.-Z. Ma, Journal of Materials Chemistry A, 2013, 1, 4146-4161.
42. H. Sojoudi, M. R. Walsh, K. K. Gleason and G. H. McKinley, Advanced Materials Interfaces, 2015, 2, n/a-n/a.
43. Y. A. Dyadin, I. V. Bondaryuk and L. S. Aladko, Journal of Structural Chemistry, 1995, 36, 995-1045.
44. P. Bollavaram, S. Devarakonda, M. S. Selim and E. D. Sloan, in Gas Hydrates: Challenges for the Future, eds. G. D. Holder and P. R. Bishnoi, 2000, vol. 912, pp. 533-543.
45. H. Sojoudi, M. R. Walsh, K. K. Gleason and G. H. McKinley, Langmuir : the ACS journal of surfaces and colloids, 2015, 31, 6186-6196.
46. A. K. Sum, C. A. Koh and E. D. Sloan, Industrial & Engineering Chemistry Research, 2009, 48, 7457-7465.
47. B. C. Gbaruko, J. C. Igwe, P. N. Gbaruko and R. C. Nwokeoma, Journal of Petroleum Science and Engineering, 2007, 56, 192-198.
48. J. D. Smith, A. J. Meuler, H. L. Bralower, R. Venkatesan, S. Subramanian, R. E. Cohen, G. H. McKinley and K. K. Varanasi, Physical Chemistry Chemical Physics, 2012, 14, 6013-6020.
49. E. D. Sloan, Fluid Phase Equilibria, 2005, 228, 67-74. 50. S. Devarakonda, A. Groysman and A. S. Myerson, Journal of
Crystal Growth, 1999, 204, 525-538. 51. A. Mehta, P. Hebert, E. Cadena and J. Weatherman, 2002. 52. P. W. Wilson, D. Lester and A. D. J. Haymet, Chemical
Engineering Science, 2005, 60, 2937-2941. 53. A. M. Coclite, Y. Shi and K. K. Gleason, Advanced Functional
Materials, 2012, 22, 2167-2176. 54. A. M. Coclite, Y. Shi and K. K. Gleason, Advanced Materials,
2012, 24, 4534-4539. 55. K. K. S. Lau and K. K. Gleason, Macromolecules, 2006, 39,
3688-3694. 56. H. Arabnejad, S. Shirazi, B. McLaury, H. Subramani and L.
Rhyne, Wear, 2015, 332, 1098-1103. 57. K. K. Lau and K. K. Gleason, Macromolecules, 2006, 39,
3695-3703. 58. T. Maitra, M. K. Tiwari, C. Antonini, P. Schoch, S. Jung, P.
Eberle and D. Poulikakos, Nano Letters, 2014, 14, 172-182. 59. S. Tarquini, C. Antonini, A. Amirfazli, M. Marengo and J.
Palacios, Cold Regions Science and Technology, 2014, 100, 50-58.
60. H. Arabnejad, A. Mansouri, S. Shirazi and B. McLaury, Wear, 2015, 332, 1044-1050.

Soft Matter
ARTICLE
This journal is © The Royal Society of Chemistry 2018 Soft Matter, 2018, xx 9
Please do not adjust margins
Please do not adjust margins
Figure 1. (a) Schematic of the erosion testing apparatus using a submerged jet of water containing silica. (b) SEM image of the sand particles used in the erosion tests. (c) Size distribution of the sand particles. Sharp edge particles with a mean size of 24 ± 10 µm were used in sand erosion tests.
ARTICLE Soft matter
10 | This journal is © The Royal Society of Chemistry 2018
Please do not adjust margins
Please do not adjust margins
Figure 2. (a) and (b) SEM images and (c) and (d) three dimensional optical profilometer images of the linker-grafted bilayer pDVB/pPFDA on silicon (left) and on steel (right) substrates. The linker-grafted bilayer (LG-BL) shows the presence of features with enhanced surface roughness both on silicon and steel substrates as confirmed in the optical profilometer image shown in (c) and (d). Optical profilometer images were taken over 136 μm × 102 μm imaging area. The vertical (Z) scale is exaggerated in both (c) and (d). RMS roughness value, Rq was measured to be 170 ± 17.5 nm and 312 ± 23.5 nm for the pDVB/pPFDA bilayer on silicon and steel substrate, respectively. The lateral scale bars in (c) and (d) are 20 µm.
Soft Matter ARTICLE
This journal is © The Royal Society of Chemistry 2018 | 11
Please do not adjust margins
Please do not adjust margins
Figure 3. Nanoscratch testing of the bilayer films deposited on smooth silicon substrates. SEM images of (a) an ungrafted bilayer pDVB/pPFDA polymer (UG-BL) and (b) a linker-grafted bilayer pDVB/pPFDA polymer (LG-BL). SEM images of the ungrafted bilayer films in Figure 3a-i and 3a-ii show the presence of frequent delamination events during the nanoscratch tests, whereas no sign of delamination was observed in the SEM images of the LG-BL film in 3b (i and ii). The higher magnification SEM images in Figures 3a (iii) and 3b (iii) show additional surface features on the iCVD deposited polymer films. The linker-grafted bilayer (LG-BL) shows the presence of features with enhanced surface roughness due to the pre-iCVD silane treatment. The scale bars represent 50 µm in (i), 20 µm in (ii), and 5 µm in (iii). (c) Optical microscopy images obtained from the Nanovea mechanical tester after creation of a 2-mm long scratch on linker-grafted bilayer pDVB/pPFDA (LG-BL) (top) and ungrafted bilayer pDVB/pPFDA (UG-BL) (bottom). The UG-BL shows that the polymer delaminated frequently during the nanoscratch test (marked inside boxes), whereas the grafted polymers did not experience any sign of failure. The scale bar in (c) is 50 µm.
ARTICLE Soft matter
12 | This journal is © The Royal Society of Chemistry 2018
Please do not adjust margins
Please do not adjust margins
Figure 4. (a) Advancing and receding water contact angles (WCA) obtained from goniometer measurements performed on as-made grafted samples and on samples after undergoing four ice adhesion measurements. (b) Adhesion strength of ice and CyC5 hydrates on as-made grafted samples and then repeated up to four times on the same set of samples. The slow rate of decrease in the contact angles and the slow rate of increase in adhesion strength after repeating adhesion measurements indicate the durable nature of the grafted bilayer polymer films.
Soft Matter ARTICLE
This journal is © The Royal Society of Chemistry 2018 | 13
Please do not adjust margins
Please do not adjust margins
Figure 5. (a) Photograph of the ungrafted bilayer (UG-BL) and (b) linker-grafted bilayer (LG-BL) after 8 hours of sand erosion tests with 0.1 kg/kg water sand particle concentration (with flow of 𝑅𝑒KLM = 2.0 × 10R), (Left panel). The middle and righthand panels are representative SEM images taken from the samples at low and high resolution. It is evident from the photographs and SEM images that the linker-grafted bilayers withstand abrasion tests whereas clear signatures of local erosion and loss of the bilayer coating are observable in the ungrafted samples.
ARTICLE Soft matter
14 | This journal is © The Royal Society of Chemistry 2018
Please do not adjust margins
Please do not adjust margins
Figure 6. Computational Fluid Dynamics (CFD) simulation of the sand erosion tests. (a) Side view showing contours of fluid velocity Rejet = 2.0 × 10R , (b) Sample tracks of Lagrangian particles with a Stokes number of Stp = 0.035, (c) Average impact velocity of the sand particles on the test coupon, (d) Average sand particle impact angle on the test coupon.
Soft Matter ARTICLE
This journal is © The Royal Society of Chemistry 2018 | 15
Please do not adjust margins
Please do not adjust margins
Figure 7. Core level C1s (a) and F1s (b) XPS measurement performed on the grafted and ungrafted samples after sand abrasion tests. Significant reduction in the intensity of the F1s peak and disappearance of the shoulders correspond to the -CF2 and -CF3 peaks suggest degradation of the ungrafted sample due to the sand abrasion test.
ARTICLE Soft matter
16 | This journal is © The Royal Society of Chemistry 2018
Please do not adjust margins
Please do not adjust margins
Table 1. Sand erosion test parameters.
Fluid velocity (m/s)
Sand size (µm)
Sand concentration (kg/kg water)
Sand rate (kg/s)
Nozzle OD/ID (mm)
Nozzle to specimen distance (mm)
Reynolds number,
Rejet
Stokes number, Stparticle
Test Duration (hours)
2.6 24.0 ± 10 0.1 0.0001 10.03/7.00 12.7 2 × 10⁴ 0.035 8
Table 2. Mechanical properties (hardness and elastic modulus) obtained from nanoindentation measurements. Root mean squared roughness, Rq, obtained from optical profilometer measurements. Receding water contact angle (CA) and advancing CA measured using a goniometer equipped with an automated dispenser. Adhesion strength data for ice and cyclopentane hydrate measured on silicon and steel substrates coated with the linker-grafted bilayer pDVB/PPFDA (LG-BL). These data indicate the icephobic and hydrate-phobic character of the bilayer coatings.
Table 3. Receding water contact angle (𝜃T), advancing water CA (𝜃U), root mean squared roughness (𝑅V), C1s to F1s concentration ratio (obtained from the XPS measurements), and ice/hydrate adhesion measurements on the grafted and ungrafted samples before and after sand abrasion tests. The data indicate that the superhydrophobicity (based on the CA measurements) and icephobicity/hydrate-phobicity (based on the adhesion strength measurements) of the ungrafted samples degrade after the sand abrasion test. Also, a significant decrease in the fluorine concentration is observed after the sand tests only in the ungrafted sample.
Sample Hardness (MPa)
Elastic Modulus
(GPa)
Root mean squared
roughness, Rq (nm)
Advancing CA θA (°)
Receding CA θR (°)
Ice adhesion strength
(kPa)
CyC5 adhesion strength
(kPa) pPFDA/pDVB on Si 481.0 ± 6.0 18.9 ± 1.3 178.0 ± 17.5 153.9 ± 2.2 139.0 ± 3.5 285 ± 98 63 ± 27
pPFDA/pDVB on steel 508.0 ± 4.0 20.3 ± 3.7 312.7 ± 23.5 157.0 ± 4.5 148.1 ± 2.9 180 ± 85 34 ± 12
Samples on steel substrates
Advancing CA θA (°)
Receding CA θR (°)
Root mean squared
roughness, Rq (nm)
Atomic concentration
C1s/F1s (%)
Ice adhesion strength (kPa)
CyC5 adhesion strength (kPa)
Grafted As-made 157.0 ± 4.5 148.1 ± 2.9 312.7 ± 23.5 60.23/39.77 180 ± 85 34 ± 12 After sand test 150.3 ± 3.0 141.3 ± 3.2 294.0 ± 18.4 58.71/41.29 235 ± 68 49 ± 23
Ungrafted As-made 148.7 ± 2.8 138.7 ± 2.6 138.5 ± 34.7 61.22/38.78 252 ± 65 54 ± 28 After sand test 85.5 ± 4.3 47.5 ± 7.8 122.5 ± 29.5 95.29/4.71 470 ± 85 128 ± 39

Soft Matter ARTICLE
This journal is © The Royal Society of Chemistry 2018 | 17
Please do not adjust margins
Please do not adjust margins
ARTICLE Soft matter
18 | This journal is © The Royal Society of Chemistry 2018
Please do not adjust margins
Please do not adjust margins
Supporting Information for
Scalable and Durable Polymeric Icephobic and Hydrate-phobic Coatings
Hossein Sojoudi,a Hadi Arabnejad,b Asif Raiyan,a Siamack A. Shirazi,b Gareth H. McKinley, *c and Karen K. Gleason*d
a. Dept. of Mechanical, Industrial and Manufacturing Engineering, The University of Toledo b. Dept. of Mechanical Engineering, The University of Tulsa c. Dept. of Mechanical Engineering, MIT d. Dept. of Chemical Engineering, MIT
Supporting material includes: Figures S1 to S4
Soft Matter ARTICLE
This journal is © The Royal Society of Chemistry 2018 | 19
Please do not adjust margins
Please do not adjust margins
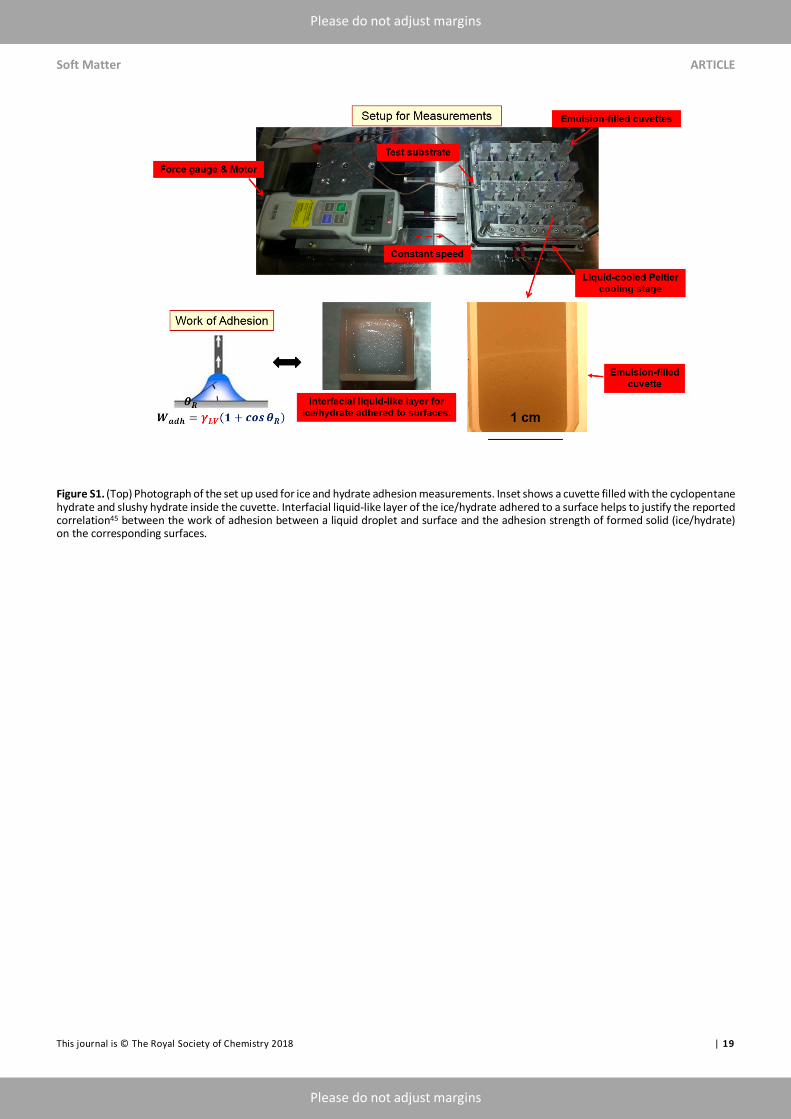
Figure S1. (Top) Photograph of the set up used for ice and hydrate adhesion measurements. Inset shows a cuvette filled with the cyclopentane hydrate and slushy hydrate inside the cuvette. Interfacial liquid-like layer of the ice/hydrate adhered to a surface helps to justify the reported correlation45 between the work of adhesion between a liquid droplet and surface and the adhesion strength of formed solid (ice/hydrate) on the corresponding surfaces.
ARTICLE Soft matter
20 | This journal is © The Royal Society of Chemistry 2018
Please do not adjust margins
Please do not adjust margins
Figure S2. Polymer composition determined by Fourier Transform IR (FTIR) spectra of the pDVB and pPFDA. Presence of the bands corresponding to carbonyl (at 1741 cm-1) and fluorine (at 1153, 1207, and 1246 cm-1) in the pPFDA spectra and band corresponding to phenyl group (in the range of 700-1000 cm-1) in the pDVB spectra are indicative of successful deposition of the bilayer polymer.
Soft Matter ARTICLE
This journal is © The Royal Society of Chemistry 2018 | 21
Please do not adjust margins
Please do not adjust margins
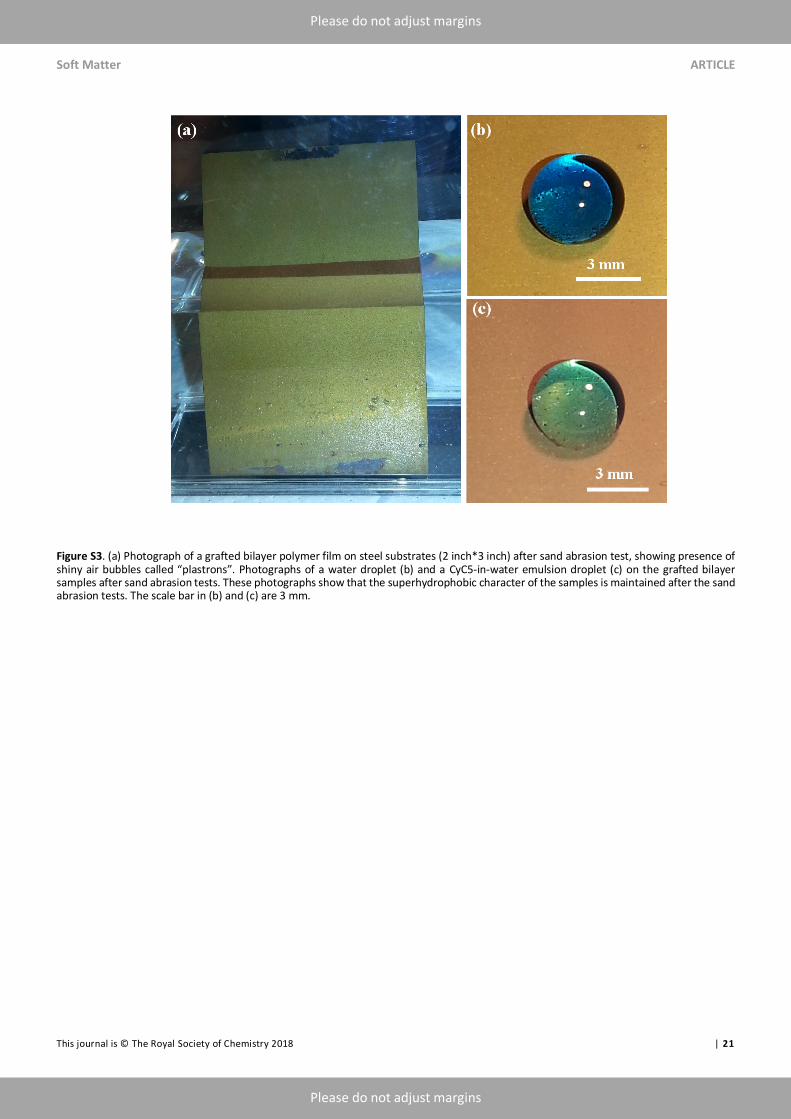
Figure S3. (a) Photograph of a grafted bilayer polymer film on steel substrates (2 inch*3 inch) after sand abrasion test, showing presence of shiny air bubbles called “plastrons”. Photographs of a water droplet (b) and a CyC5-in-water emulsion droplet (c) on the grafted bilayer samples after sand abrasion tests. These photographs show that the superhydrophobic character of the samples is maintained after the sand abrasion tests. The scale bar in (b) and (c) are 3 mm.
ARTICLE Soft matter
22 | This journal is © The Royal Society of Chemistry 2018
Please do not adjust margins
Please do not adjust margins
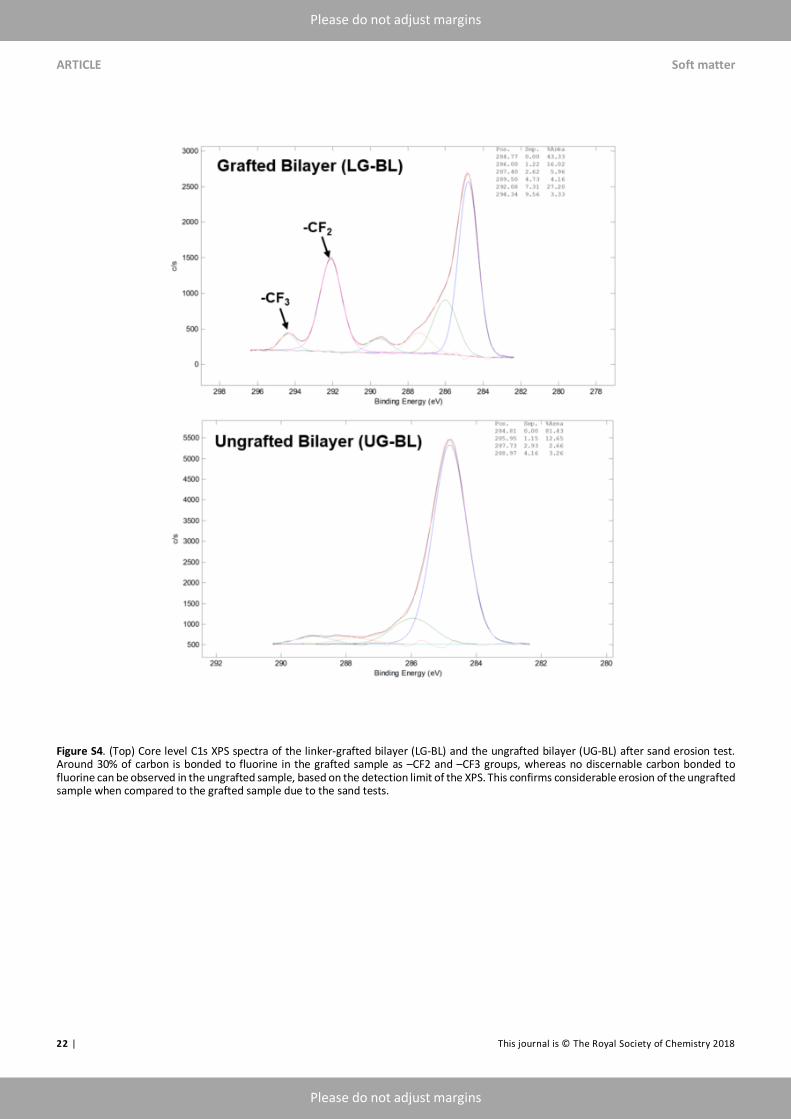
Figure S4. (Top) Core level C1s XPS spectra of the linker-grafted bilayer (LG-BL) and the ungrafted bilayer (UG-BL) after sand erosion test. Around 30% of carbon is bonded to fluorine in the grafted sample as –CF2 and –CF3 groups, whereas no discernable carbon bonded to fluorine can be observed in the ungrafted sample, based on the detection limit of the XPS. This confirms considerable erosion of the ungrafted sample when compared to the grafted sample due to the sand tests.
Soft Matter ARTICLE
This journal is © The Royal Society of Chemistry 2018 | 23
Please do not adjust margins
Please do not adjust margins
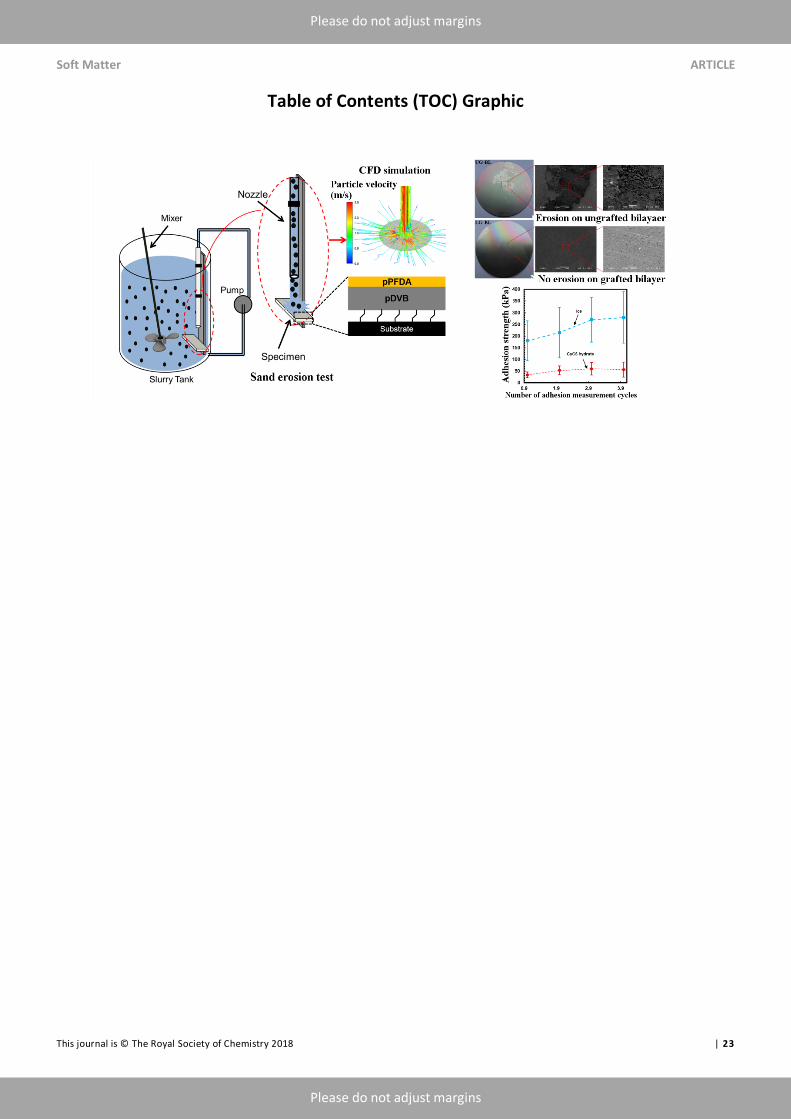
Table of Contents (TOC) Graphic