Equilibrium and morphology studies of clathrate...
104
Equilibrium and morphology studies of clathrate hydrates Juan G. Beltr´ an Department of Chemical Engineering McGill University, Montreal June, 2009 A thesis submitted to McGill University in partial fulfillment of the requirements of the degree of Doctor of Philosophy c Juan G. Beltr´ an 2009
Transcript of Equilibrium and morphology studies of clathrate...
Equilibrium and morphology studies of clathrate
hydrates
Juan G. Beltran
Department of Chemical Engineering
McGill University, Montreal
June, 2009
A thesis submitted to McGill University in partial fulfillment of the requirements of the
degree of Doctor of Philosophy
c©Juan G. Beltran 2009
Abstract
Phase equilibria and morphology of clathrates or gas hydrates were investigated.
Four-phase equilibrium conditions (hydrate-liquidaq-liquid-vapor) and three-phase
equilibrium conditions (hydrate-liquidaq-vapor) were determined for the systems
methane + carbon dioxide + neohexane + water and methane + carbon dioxide
+ water, respectively. It was found that the equilibrium mole fraction of carbon
dioxide in the vapor phase follows opposite trends in both systems, with respect
to equilibrium pressure, at rather constant temperature. Structure H equilibrium
occurred at lower pressures and temperatures than structure I when the equilibrium
vapor phase was methane rich. This phenomenon appeared to be reversed as the
equilibrium vapor phase became richer in carbon dioxide.
A novel reactor was designed in order to acquire high-resolution images of
clathrate phenomena occurring at high pressures. Methane clathrate formation
on water films without previous hydrate formation history was studied and it was
found that hydrates formed in three layers, each with a clearly distinct morphology.
This difference in morphology disappeared as the clathrate aged. Higher driving
forces produced smaller hydrate grains and smoother surfaces than lower driving
forces within the water film. The converse was true for the periphery. Dissociation
started on the perimeter of the hydrate layer and proceeded until numerous gas
bubbles were observed within the film. As hydrate dissociation spread throughout
the film, water receded until it regained its original shape. Moreover, images re-
vealed that an extremely thin hydrate film grew outside of the water boundary. It
was found that this growing, thin film could induce nucleation in neighboring water
droplets.
Finally, the formation and decomposition of methane clathrate in water films
containing silica gel particles were examined. It was observed that the hydrate front
engulfed the particles as it advanced at a relatively constant velocity and that the
growing clathrate could push a methane bubble. Grain boundary healing could

also be seen after the hydrate contacted a silica particle. Dissociation proceeded
through two different mechanisms: the first gradual; the second however, began
catastrophically through a sudden fracture in the clathrate.
Resume
L’equilibre de phases et la morphologie des hydrates de gaz ont ete etudies. Les
conditions d’equilibre a quatre phases (hydrates-liquideaq-liquide-vapeur) et a trois
phases (hydrates-liquideaq-vapeur) ont ete determinees pour les systemes methane
+ dioxyde de carbone + neohexane + eau et methane + dioxyde de carbone +
eau, respectivement. On a constate que la fraction molaire du dioxyde de carbone
dans la phase vapeur suivait des tendances contraires dans les deux systemes, quand
a la pression d’equilibre, pour une temperature relativement constante. Il fut aussi
observe que l’equilibre des hydrates de structure H se produit a plus basses pressions
et temperatures que celui des hydrates de structure I quand la phase vapeur est riche
en methane ; ce phenomene etant contraire quand la phase vapeur devient riche en
dioxyde de carbone a l’equilibre.
Un reacteur a ete concu pour acquerir des images a haute resolution de phenomenes
relatifs a la formation des hydrates a haute pression. La formation des clathrates
de methane sur des pellicules vierges a ete etudiee et il a ete etabli que les hy-
drates se formaient en trois couches, chacune d’elles avec une morphologie unique.
Cette difference de morphologie s’estompait a mesure que le clathrate vieillissait.
Des petits grains et des surfaces lisses ont ete observes dans la pellicule pour de plus
grandes forces d’entraınement, alors qu’a plus basses forces d’entraınement les grains
etaient grands et les surfaces rugueuses ; le contraire s’est produit en peripherie de la
pellicule. La dissociation a commence dans le perimetre de la pellicule d’hydrates et
a progresse jusqu’a l’apparition de nombreuses bulles gazeuses ; a mesure que la dis-
sociation devenait omnipresente, la pellicule d’eau reculait pour retrouver sa forme
originale. Il a aussi ete possible de deceler qu’une pellicule extremement fine, ca-
pable de progresser au-dela de la limite d’une bulle d’eau, peut induire la nucleation
dans des bulles d’eau voisines.
Finalement, la formation ainsi que la decomposition des hydrates de methane dans
des pellicules d’eau contenant des particules de gel de silice ont ete etudiees. Tandis
que le front des hydrates avancait a une velocite relativement constante, on a observe
l’enveloppement des particules, de meme que le deplacement d’une bulle de methane.
La fusion de deux grains d’hydrate a ete aussi constatee apres que le front ait
touche une particule de silice. La dissociation a procede selon deux mecanismes : le
premier graduel ; le deuxieme par contre, a commence de facon catastrophique avec
la fracture soudaine du clathrate.
Acknowledgements
I am obligated toward my wife Clarisse for being my muse and my friend. To my
best man, Phil thanks for many good times at the gym, but above all for your
friendship. I bow down to my parents, Patricia and Marco for having put their
son’s education before their own well-being. To my sister, Ana I am indebted for
she has shown me that coordinate systems are poor representations of this world.
Miguel and Maruja: thank you. I am grateful to David for helping me live Twain’s
quote about schooling and education. My advisor, professor Phillip Servio has my
profound gratitude for his unwavering faith in my endeavors and for getting me all
kinds of expensive toys to find something more about gas hydrates. Thank you
to past and present members of the research group for many fruitful exchanges,
to Hal and especially to my office-mate Seb. Invaluable were the contributions of
the technical staff in the department in the fabrication and setup of equipment.
The help from the administrative staff with all kinds of bureau tasks is gratefully
recognized. Financially, I thank the doctoral studies scholarship from Le fonds
quebecois de la recherche sur la nature et les technologies and the support from the
Eugenie Ulmer Lamothe fund of the department of Chemical Engineering at McGill
University; all the rest came from the boss’s magic chest.

Contents
1 Introduction 1
Contributions of Authors . . . . . . . . . . . . . . . . . . . . . . . . . . . 2
2 Background 4
2.1 Clathrate Hydrates . . . . . . . . . . . . . . . . . . . . . . . . . . . 5
2.2 Phase Equilibrium . . . . . . . . . . . . . . . . . . . . . . . . . . . 8
2.3 Kinetics of Hydrate Formation . . . . . . . . . . . . . . . . . . . . . 11
2.3.1 Nucleation . . . . . . . . . . . . . . . . . . . . . . . . . . . . 11
2.3.2 Growth . . . . . . . . . . . . . . . . . . . . . . . . . . . . . 13
2.4 Morphology . . . . . . . . . . . . . . . . . . . . . . . . . . . . . . . 14
2.4.1 Particles and Restricted Geometries . . . . . . . . . . . . . . 17
3 Equilibrium 21
3.1 Preface . . . . . . . . . . . . . . . . . . . . . . . . . . . . . . . . . . 21
3.2 Abstract . . . . . . . . . . . . . . . . . . . . . . . . . . . . . . . . . 22
3.3 Introduction . . . . . . . . . . . . . . . . . . . . . . . . . . . . . . . 22
3.4 Experimental Apparatus . . . . . . . . . . . . . . . . . . . . . . . . 24
3.5 Experimental Procedure . . . . . . . . . . . . . . . . . . . . . . . . 26
3.6 Results and Discussion . . . . . . . . . . . . . . . . . . . . . . . . . 27
3.7 Conclusion . . . . . . . . . . . . . . . . . . . . . . . . . . . . . . . . 32
3.8 Supporting Information Available . . . . . . . . . . . . . . . . . . . 36
i
CONTENTS ii
4 Films 38
4.1 Preface . . . . . . . . . . . . . . . . . . . . . . . . . . . . . . . . . . 38
4.2 Abstract . . . . . . . . . . . . . . . . . . . . . . . . . . . . . . . . . 39
4.3 Introduction . . . . . . . . . . . . . . . . . . . . . . . . . . . . . . . 39
4.4 Experimental Procedure . . . . . . . . . . . . . . . . . . . . . . . . 43
4.5 Results and Discussion . . . . . . . . . . . . . . . . . . . . . . . . . 45
4.5.1 Nucleation and Growth . . . . . . . . . . . . . . . . . . . . . 45
4.5.2 Aging . . . . . . . . . . . . . . . . . . . . . . . . . . . . . . 51
4.5.3 Reformation . . . . . . . . . . . . . . . . . . . . . . . . . . . 53
4.5.4 The “Bridge Effect” . . . . . . . . . . . . . . . . . . . . . . 54
4.5.5 Dissociation . . . . . . . . . . . . . . . . . . . . . . . . . . . 55
4.6 Conclusion . . . . . . . . . . . . . . . . . . . . . . . . . . . . . . . . 55
5 Silica 60
5.1 Preface . . . . . . . . . . . . . . . . . . . . . . . . . . . . . . . . . . 60
5.2 Abstract . . . . . . . . . . . . . . . . . . . . . . . . . . . . . . . . . 60
5.3 Introduction . . . . . . . . . . . . . . . . . . . . . . . . . . . . . . . 61
5.4 Experimental Apparatus and Procedure . . . . . . . . . . . . . . . 62
5.5 Results and Discussion . . . . . . . . . . . . . . . . . . . . . . . . . 64
5.5.1 Formation . . . . . . . . . . . . . . . . . . . . . . . . . . . . 64
5.5.2 Dissociation . . . . . . . . . . . . . . . . . . . . . . . . . . . 68
5.6 Conclusion . . . . . . . . . . . . . . . . . . . . . . . . . . . . . . . . 71
6 Comprehensive Conclusion 72
6.1 Recommendations for Future Work . . . . . . . . . . . . . . . . . . 74
Original Contributions to Knowledge 76
Other Related Work 78
A Morphology Reactor 79

CONTENTS iii
Bibliography 92
List of Figures
2.1 Clathrate structures building block. . . . . . . . . . . . . . . . . . . 6
2.2 Common gas hydrate structures. . . . . . . . . . . . . . . . . . . . . 7
2.3 Representative partial phase diagram for a binary clathrate-forming
system. . . . . . . . . . . . . . . . . . . . . . . . . . . . . . . . . . . 9
3.1 Phase equilibria apparatus. . . . . . . . . . . . . . . . . . . . . . . . 25
3.2 Hydrate-liquid-vapor equilibrium conditions for the system methane
+ carbon dioxide + water. . . . . . . . . . . . . . . . . . . . . . . . 29
3.3 Hydrate-liquid-liquidaq-vapor equilibrium conditions for the system
methane + carbon dioxide + neohexane + water. . . . . . . . . . . 30
3.4 Equilibrium surface for the system methane + carbon dioxide + neo-
hexane + water. . . . . . . . . . . . . . . . . . . . . . . . . . . . . . 31
3.5 Hydrate-liquid-vapor equilibrium isotherms for the system methane
+ carbon dioxide + water. . . . . . . . . . . . . . . . . . . . . . . . 33
3.6 Hydrate-liquid-liquidaq-vapor equilibrium isotherms for the system
methane + carbon dioxide + neohexane + water. . . . . . . . . . . 34
3.7 Combined equilibrium isotherms for the systems methane + carbon
dioxide + neohexane + water and methane + carbon dioxide + water. 35
3.8 Representative, raw data leading to the determination of one of the
equilibrium points for three-phase hydrate-liquid-vapor equilibrium
of a ternary system. . . . . . . . . . . . . . . . . . . . . . . . . . . . 37
4.1 Simplified schematic of the experimental apparatus. . . . . . . . . . 44
iv
LIST OF FIGURES v
4.2 Hydrate formation and growth sequence on a water film with no
previous hydrate formation history. . . . . . . . . . . . . . . . . . . 47
4.3 Water films completely covered by hydrate at low and high driving
force. . . . . . . . . . . . . . . . . . . . . . . . . . . . . . . . . . . . 48
4.4 Detail of the original water boundary after hydrate formation at low
and high driving force. . . . . . . . . . . . . . . . . . . . . . . . . . 49
4.5 Aging of a hydrate film. . . . . . . . . . . . . . . . . . . . . . . . . 52
4.6 Hydrate reformation on water films. . . . . . . . . . . . . . . . . . . 53
4.7 The bridge effect. . . . . . . . . . . . . . . . . . . . . . . . . . . . . 56
4.8 Enlarged view of the bridge effect . . . . . . . . . . . . . . . . . . . 57
4.9 Dissociation of a layered hydrate film. . . . . . . . . . . . . . . . . . 58
5.1 Simplified schematic of the experimental apparatus. . . . . . . . . . 63
5.2 Advancing hydrate front with and without silica particles. . . . . . 65
5.3 Pushing, engulfing and healing during hydrate growth. . . . . . . . 67
5.4 Gradual dissociation of methane clathrate in contact with silica gel
particles. . . . . . . . . . . . . . . . . . . . . . . . . . . . . . . . . . 69
5.5 Sudden hydrate fracture during dissociation. . . . . . . . . . . . . . 70
List of Tables
3.1 Hydrate-liquid-vapor equilibrium data for the system methane + car-
bon dioxide + water. . . . . . . . . . . . . . . . . . . . . . . . . . . 28
3.2 Hydrate-liquid-liquidaq-vapor equilibrium data for the system methane
+ carbon dioxide + neohexane + water. . . . . . . . . . . . . . . . 28
4.1 Experimental conditions for hydrate formation, water films without
previous hydrate formation history. . . . . . . . . . . . . . . . . . . 45
4.2 Experimental conditions for hydrate reformation, water films. . . . 46
5.1 Experimental conditions for hydrate reformation, silica gel. . . . . . 66
5.2 Experimental conditions for hydrate dissociation, silica gel. . . . . . 70
vi

Chapter 1
Introduction
Clathrate hydrates are crystalline solids composed of a volatile guest trapped in a
host water lattice (Van Der Waals and Platteeuw, 1959). Discovered in the early
part of the nineteenth century (Davy, 1811), clathrate hydrates remained an aca-
demic curiosity until the 1930s when it was corroborated that hydrates plugged
natural gas pipelines (Hammerschmidt, 1934). Renewed interest in clathrates came
with the discovery of naturally occurring hydrates in the 1960s (Makogon, 1965). It
is estimated that natural clathrates store as much as double the amount of energy
of all fossil fuels combined (Suess et al., 1999). In addition, trapping carbon dioxide
as a hydrate in the bottom of the ocean has been proposed as an alternative to
reduce increasing atmospheric carbon dioxide concentration (Harrison et al., 1995).
Moreover, concerns have been raised regarding the role that natural hydrates could
play in global climate change; these compounds constitute a considerable carbon
sink and are thus an important part of the organic carbon cycle (Kvenvolden, 2002).
The possibility of using hydrates for gas storage and transportation has also been
put forward (Chatti et al., 2005).
In summary, gas hydrates have been studied for two centuries, but only until
recently have we realized the enormous implications that clathrates have on our
environment and our secure supply of clean energy. Research in this field is not
only necessary in order to safely pursue hydrates as an energy source or carrier, but
1
CHAPTER 1. INTRODUCTION 2
also to further understand the impact that such a vast resource has on nature and
on our future.
The focus of this work was to provide experimental information relevant to
thermodynamics and morphology of clathrates. Traditionally, the study of hydrate
equilibrium was important in order to avoid undesirable formation in gas and oil
pipelines; however, the need for thermodynamic data has been revived with the
possibility of using hydrates beneficially. On the other hand, morphology studies
are valuable for they increase our understanding of hydrate nucleation, growth and
dissociation mechanisms.
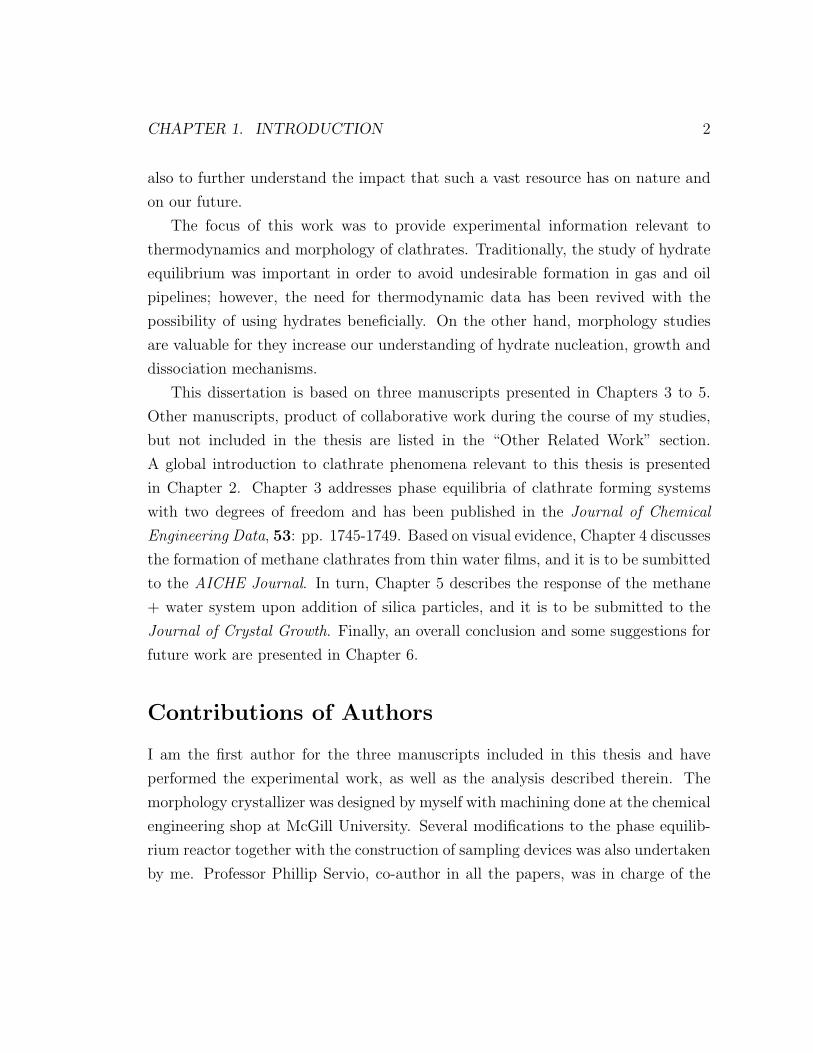
This dissertation is based on three manuscripts presented in Chapters 3 to 5.
Other manuscripts, product of collaborative work during the course of my studies,
but not included in the thesis are listed in the “Other Related Work” section.
A global introduction to clathrate phenomena relevant to this thesis is presented
in Chapter 2. Chapter 3 addresses phase equilibria of clathrate forming systems
with two degrees of freedom and has been published in the Journal of Chemical
Engineering Data, 53: pp. 1745-1749. Based on visual evidence, Chapter 4 discusses
the formation of methane clathrates from thin water films, and it is to be sumbitted
to the AICHE Journal. In turn, Chapter 5 describes the response of the methane
+ water system upon addition of silica particles, and it is to be submitted to the
Journal of Crystal Growth. Finally, an overall conclusion and some suggestions for
future work are presented in Chapter 6.
Contributions of Authors
I am the first author for the three manuscripts included in this thesis and have
performed the experimental work, as well as the analysis described therein. The
morphology crystallizer was designed by myself with machining done at the chemical
engineering shop at McGill University. Several modifications to the phase equilib-
rium reactor together with the construction of sampling devices was also undertaken
by me. Professor Phillip Servio, co-author in all the papers, was in charge of the

CHAPTER 1. INTRODUCTION 3
overall supervision of the project.
Chapter 2
Background
A clathrate (from the Latin clathratus, meaning enclosed or protected by crossbars)
is a substance in which one component, the host molecule, crystallizes with a struc-
ture that contains polyhedral cavities in which atoms or small molecules of a second
component, the guest molecule, can be trapped (Cotton et al., 1995). The clathrate
compounds are divided into two categories: aqueous clathrates or clathrate hy-
drates and non aqueous clathrates (Englezos, 1993). This work is concerned with
the former, commonly known as gas hydrates.
Clathrate hydrates are non-stoichiometric compounds that form when small,
volatile molecules (< 0.9 nm) come in contact with water at appropriate tempera-
tures and pressures (typically T < 300 K and p > 0.6 MPa) (Sloan, 2003). Hydrates
were described early in the nineteenth century (Davy, 1811), yet they remained an
academic curiosity until the observation of clathrates in natural gas pipelines (Ham-
merschmidt, 1934). As a result, intense research has been aimed at understanding
gas hydrates and also at finding ways of preventing their formation.
Interest in clathrate hydrates was further increased with the discovery of in situ
gas hydrates by Makogon (1965). Since then, hydrates are being looked at as a prob-
able energy source for the future, methane being the main component of clathrate
hydrates found in nature. Most of the natural gas hydrates are found in the ocean
bottom; however, there is a considerable amount of hydrates found in permafrost
4
CHAPTER 2. BACKGROUND 5
regions (Sloan, 2003). Conservative estimates suggest that the amount of energy
stored in hydrates is at least twice that of all other fossil fuels combined (Suess
et al., 1999). In addition, trapping carbon dioxide as a hydrate in the bottom of the
oceans, has been proposed as an alternative to reduce increasing atmospheric CO2
concentration (Harrison et al., 1995; Sloan, 2000). Recently, concerns have been
raised regarding the role that natural hydrates could play in global climate change
(Brewer, 2000; Kvenvolden, 2000, 2002). Hydrates constitute a considerable carbon
sink, making them an important part of the global, organic carbon cycle (Kven-
volden, 2002). Sizable releases of methane due to oceanic hydrate destabilization
could exert a significant effect in enhancing global warming (Brewer, 2000). On a
more short term basis, oceanic hydrate destabilization could also pose a submarine
geological hazard, as industry moves to exploit resources in the seabed at greater
and greater depths (Kvenvolden, 2000).
The possibility of using hydrates for gas storage and transportation has also
been considered (Chatti et al., 2005; Wang et al., 2008). Hydrate energy density is
comparable to that of compressed natural gas, but less than that of liquefied natural
gas (Thomas and Dawe, 2003). Clathrate storage and production conditions being
much milder than that of compressed and liquefied natural gas, it has been suggested
that it would be economical to transport stranded gas as a hydrate (Thomas and
Dawe, 2003; Sloan, 2003).
2.1 Clathrate Hydrates
Clathrate hydrates are solid solutions of a volatile solute (guest) in a host lattice.
The empty hydrate lattice is thermodynamically unstable, yet stabilization may
occur through the inclusion of a second component (Van Der Waals and Platteeuw,
1959). The lattice holds together due to hydrogen bonds among water molecules
forming polyhedra (cages). The cavities of these polyhedra can be filled with
molecules that do not interfere with the hydrogen bonding of water, as long as
the guest diameter is of appropriate size (Englezos, 1993). Under suitable pressure
CHAPTER 2. BACKGROUND 6
and temperature conditions, the inclusion of a guest forms a stable gas hydrate
structure (Englezos, 1993). Guest-molecule repulsions cause water cages, to open
and combine to form well defined crystals (Sloan, 2003). All common natural gas
hydrates belong to three crystal structures: cubic structure I, cubic structure II, or
hexagonal structure H (Sloan and Koh, 2008). Structure I predominates in nature,
structure II occurs mostly in man-made environments, and structure H may arise
in either artificial or natural environments (Sloan, 2003).
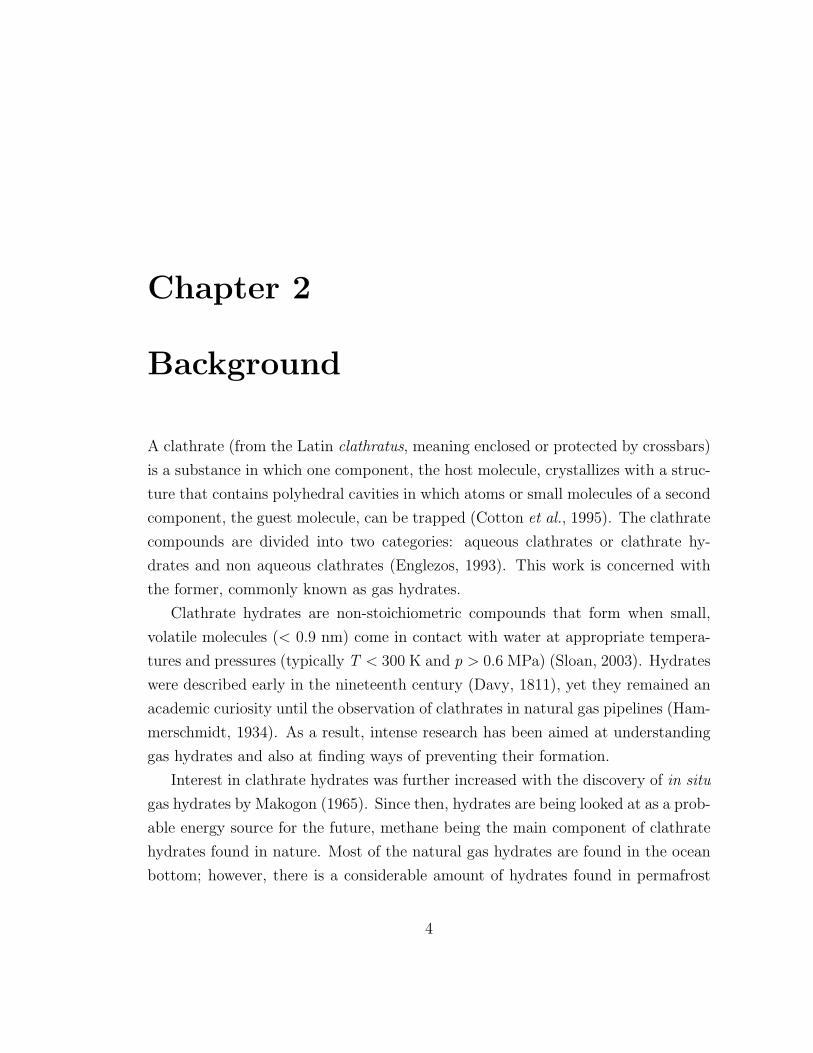
The basic building block for clathrate hydrate crystals is a polyhedron with
twelve pentagonal faces (512) (Figure 2.1). Structure I is formed when 512 cavities
Figure 2.1: The basic building block of the clathrate hydrate crystal structure:a dodecahedron with twelve pentagonal faces and water molecules in each of itsvertices. A methane molecule is shown inside the water cage. (Courtesy of A.Golsztajn. Personal communication, February 2009)
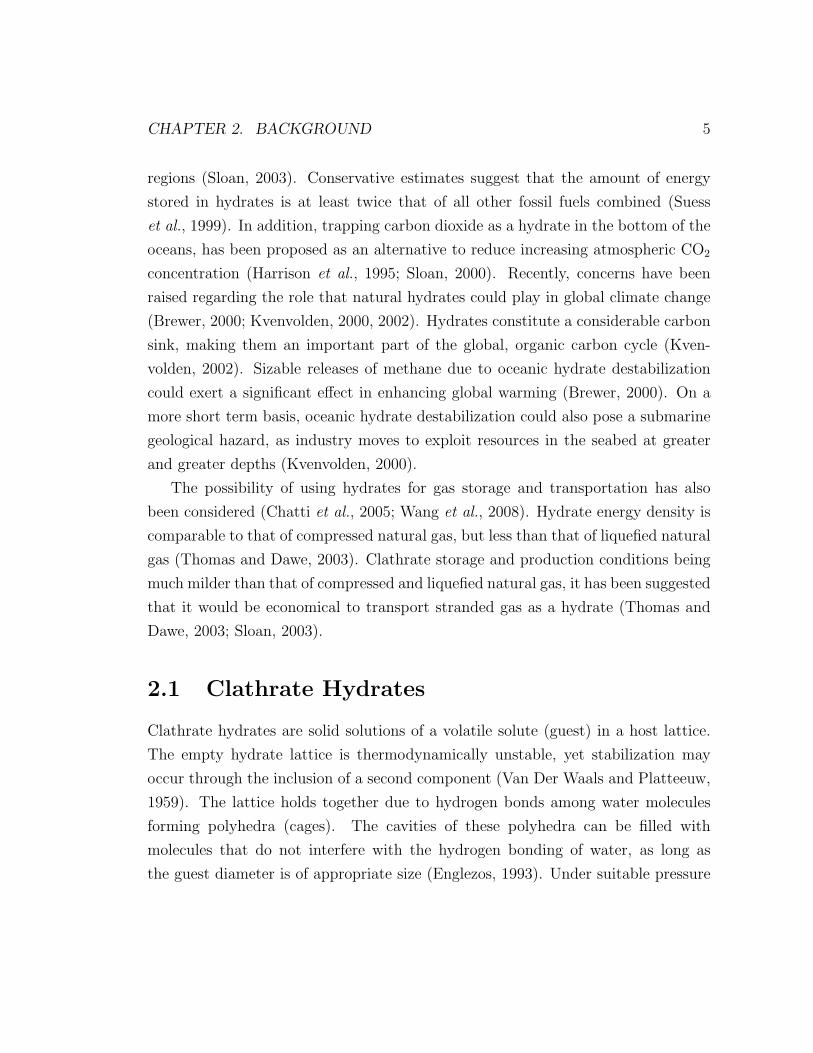
arrange themselves in space by linking through their vertices, a larger second type
of cavity is then formed with twelve pentagonal and two hexagonal faces (51262)
(Englezos, 1993). The resulting unit cell consists of six large 51262 and two small 512
cavities, formed by forty-six water molecules (Sloan, 2003) (Figure 2.2). Molecules
with diameters 0.4 to 0.55 nm can form structure I hydrates. Common structure I
guest molecules are methane, ethane and carbon dioxide (Sloan, 2003).
CHAPTER 2. BACKGROUND 7
methane, ethane,
carbon dioxide
propane,nitrogen,
iso-butane
methane + neohexane,methane +
adamantane
Water Cages
16
+
+
+
guest
small guest+
large guest
6
8
2
1
+
51268
435663
+
+
+
sII
sH
512
51262
51264
512
512
3
2 guest
Structure
sI
Guests (e.g.)
Figure 2.2: The three most common clathrate-hydrate crystalline structures. 51268
represents a water cage made of twelve pentagonal faces and eight hexagonal faces.As an example the structure H unit cell is composed of three 512 cages, two 435663
cages and one 51268 cage.
CHAPTER 2. BACKGROUND 8
Structure II forms when the 512 cavities link through their faces (Sloan and Koh,
2008). The resulting arrangement creates a large cavity with twelve pentagonal and
four hexagonal faces (51264). The large cavity in structure II is bigger than the
large cavity in structure I; the converse is true for the small cavity. The unit cell
contains 136 water molecules forming sixteen 512 cavities and eight 51264 cavities
(Sloan, 2003) (Figure 2.2). Molecules with diameters of less than 0.4 nm or greater
than 0.6 nm form structure II hydrates (Sloan, 2003). Common structure II guest
molecules are propane and iso-butane (Sloan, 2003).
Structure I and structure II hydrates can be stabilized by trapping one type of
guest or by accepting a gas mixture (Sloan and Koh, 2008). In simple hydrates,
single guests are sometimes too large for the smaller cage: while occupying the
larger cage only, large guests leave the smaller cage empty. This is not the case for
smaller molecules, which may fill up both cages (Sloan, 2003).
Contrary to structures I and II, structure H requires two types of guests to
form (Sloan and Koh, 2008). The unit cell is formed by thirty-four water molecules
forming three small 512 cavities, two medium 435663 cavities, and one large 51268
cavity (Figure 2.2). Examples of structure H guests are mixtures of methane and
neohexane or methane and cycloheptane (Sloan, 2003).
2.2 Phase Equilibrium
Guest and host are not chemically bonded in clathrates, but rather interact through
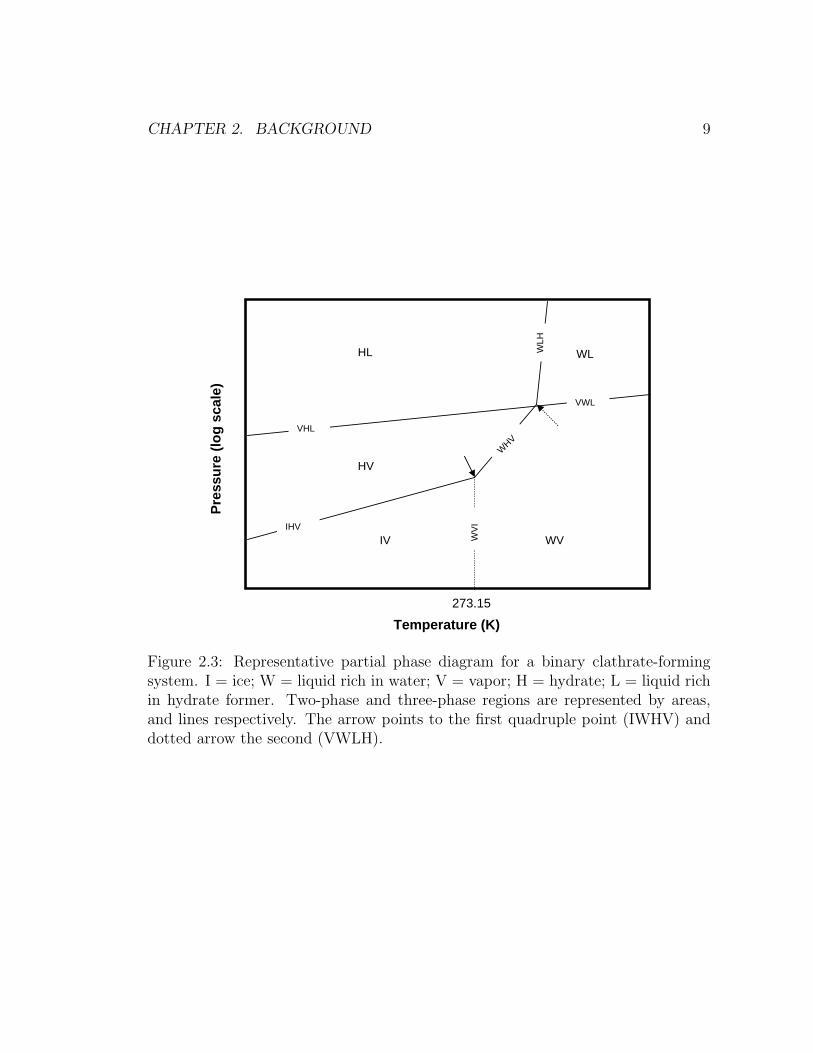
weak van der Waals forces. Temperature and pressure will dictate whether host and
guest will exist as gas, liquid, solid or hydrate (Holder et al., 1988). A representative
partial phase diagram for a sub critical gas is shown in Figure 2.3.
If a reactor containing an aqueous liquid phase and a hydrate forming gas in
excess, is compressed, while the temperature is kept below the upper quadruple
point (dotted arrow in Figure 2.3), the pressure will eventually reach a value where
hydrates will appear. At this point hydrates, liquid water, and gas coexist. Further
compression will result in more hydrates forming until only two phases will remain
CHAPTER 2. BACKGROUND 9
273.15
Temperature (K)
Pres
sure
(log
sca
le)
HL
VHL
HV
IV
WL
WVIHV
WHV
VWL
WV
I
WLH
Figure 2.3: Representative partial phase diagram for a binary clathrate-formingsystem. I = ice; W = liquid rich in water; V = vapor; H = hydrate; L = liquid richin hydrate former. Two-phase and three-phase regions are represented by areas,and lines respectively. The arrow points to the first quadruple point (IWHV) anddotted arrow the second (VWLH).

CHAPTER 2. BACKGROUND 10
(Holder et al., 1988). The same principle applies to temperatures below the ice
point, except ice replaces liquid water (Holder et al., 1988).
It is important to note that pressure-temperature diagrams for gases for which
the vapor-liquid critical point is lower than the first quadruple point (solid arrow
in Figure 2.3) are somewhat different to Figure 2.3. Due to the low critical tem-
peratures, the VHL, VWL, and WLH lines in Figure 2.3 disappear, resulting in no
upper quadruple point. Examples of such gases are nitrogen and methane (Sloan,
1998).
Traditionally, hydrate phase equilibrium data have been gathered using a pres-
surized reactor equipped with windows, thus allowing the visual detection of the
onset of hydrate formation (Holder et al., 1988). Such reactors could be operated in
isothermal, isobaric or isochoric modes (Sloan and Koh, 2008). In addition to visual
methods, on line pressure measurements can be used to detect the onset of hydrate
formation through the significant pressure drop associated with hydrate formation
(Holder et al., 1988). In a typical test the hydrates are formed by increasing the cell
pressure (isothermal) or decreasing the cell temperature (isobaric and isochoric),
beyond the hydrate equilibrium point. The hydrates are then dissociated by reduc-
ing the cell pressure (isothermal) or increasing the cell temperature (isobaric and
isochoric). Continuous or stepwise heating can be used to increase the cell temper-
ature and dissociate gas hydrates so as to measure the clathrate dissociation point
(Tohidi et al., 2000).
The most widely used model for the calculation of hydrate phase equilibrium
was developed by Van Der Waals and Platteeuw (1959). Based on statistical me-
chanics, the van der Waals model calculates the chemical potential of water in the
hydrate phase and equates it to the chemical potential of water in the liquid phase.
The model requires fugacities of the species in question, Langmuir constants for the
hydrate former, and the difference in chemical potential of the empty hydrate lat-
tice and pure liquid water. A robust equation of state such as the Trebble-Bishnoi
equation of state (Trebble and Bishnoi, 1987, 1988b,a) can be used to calculate
fugacities. The Langmuir constants can be calculated as suggested by Parrish and

CHAPTER 2. BACKGROUND 11
Prausnitz (1972) and finally the difference in chemical potential of the empty hy-
drate lattice and pure liquid water can be computed according to the model of
Holder et al. (1988, 1980).
2.3 Kinetics of Hydrate Formation
The formation of gas hydrates is a phase transformation which requires a supersat-
urated environment in order to occur (Englezos et al., 1987a). Hydrate formation
resembles a crystallization process, and as such it can be divided into nucleation
and growth phases (Natarajan et al., 1994; Mullin, 1997). Hydrate nucleation is
the process, during which small hydrate crystals (nuclei) form and disappear in an
attempt to achieve critical size for continued growth (Sloan and Koh, 2008; Mullin,
1997). Hydrate growth, on the other hand, refers to the phase where nuclei grow
as solid hydrate crystals (Natarajan et al., 1994; Mullin, 1997). The beginning of
hydrate growth is usually associated with the appearance of turbidity in the liquid
phase and it is often referred to as the turbidity point (Englezos et al., 1987a).
2.3.1 Nucleation
The nucleation period is characterized by the formation and decomposition of small
aggregates of molecules of the dissolved substance in an aqueous solution. For each
supersaturated solution, there is a critical size cluster (or critical nucleus) that is in
equilibrium with the surrounding medium, and may with the same probability grow
or disintegrate (Natarajan et al., 1994; Mullin, 1997). Clusters that are smaller than
the critical size will most likely decompose, while clusters larger than the critical
size will grow spontaneously. The critical size represents a limit which the growing
clusters must attain before spontaneous growth as solid crystal begins (Natarajan
et al., 1994; Mullin, 1997).
The duration of the nucleation period or induction time (sometimes lag time) is
believed to be stochastic (Sloan and Koh, 2008). There have been several attempts
to identify the factors that affect induction times in addition to temperature and
CHAPTER 2. BACKGROUND 12
pressure. The history of water has been pointed out as having an influence on
nucleation times: hydrates prepared from thawed ice or dissociated hydrates hav-
ing shorter lag times than hydrates prepared from distilled water (Vysniauskas and
Bishnoi, 1983). It has also been found that higher stirring rates reduce the nu-
cleation periods, possibly due to reductions in mass transfer resistances (Englezos
et al., 1987a; Skovborg et al., 1993). Jensen et al. (2008) have suggested that the gas
dissolution rate rather than the induction time of propane hydrate is influenced by a
change in agitation. In addition, Sloan and co-workers (1990; 1991) have postulated
that differences in the guest to cavity size ratio may determine whether a hydrate
former exhibits a nucleation period or not. Finally, hydrate nucleation may also
be affected by surface heterogeneities inside reactors, making it difficult to compare
nucleation data from one laboratory to another one (Natarajan et al., 1994). The
effect of temperature and pressure on hydrate nucleation has been assessed previ-
ously by quantifying the magnitude of the nucleation driving force. In general, high
driving forces imply shorter induction times whereas the contrary is true for low
driving forces (Englezos et al., 1987a; Skovborg et al., 1993).
Several driving forces for nucleation have been defined in the past. Based on
crystallization theory Vysniauskas and Bishnoi (1983) defined the nucleation driv-
ing force as the degree of sub cooling, or the difference between the three-phase
equilibrium temperature at the experimental pressure and the experimental tem-
perature.
Natarajan (Natarajan et al., 1994) noted that the minimum fugacity at which
a gas can form a hydrate corresponds to the three-phase equilibrium fugacity, and
defined the driving force for hydrate nucleation as the difference between the fugacity
of the dissolved gas in the liquid at the systems temperature and pressure, and that
corresponding to the three-phase equilibrium at the experimental temperature.
Skovborg et al. (1993) expressed the nucleation driving force as the difference in
the chemical potential of water in the hydrate phase and that of water in the liquid
phase; both chemical potentials calculated at the system temperature and pressure.
A more general expression for the nucleation driving has been proposed by Sloan
CHAPTER 2. BACKGROUND 13
and co-workers (1995) as the difference in the Gibbs free energy of the forming
hydrate and that of the reacting water and gas. Other general expressions based on
the change in Gibbs free energy include those of Kashchiev and Firoozabadi (2002)
and Anklam and Firoozabadi (2004).
2.3.2 Growth
The hydrate crystal growth period begins once hydrate nuclei reach the critical size.
The growth period is characterized by the incorporation of significant amounts of gas
into the hydrate phase. Gas content in hydrates is at least two orders of magnitude
greater than the gas solubility in water (Sloan and Koh, 2008). Thus, mass and heat
transfer effects become important during hydrate growth, in addition to the factors
that affect nucleation (§2.3.1). An exception to this is water history, which contrary
to its effect on nucleation (§2.3.1), has been reported to not have an influence on
hydrate growth (Vysniauskas and Bishnoi, 1983).
Based on crystallization theory and their own definition of the nucleation driving
force Vysniauskas and Bishnoi (1983) put forward a semi-empirical model for hy-
drate growth. They obtained an expression for the overall rate of gas consumption
dependent on the degree of sub cooling, pressure and several empirical parameters
(Vysniauskas and Bishnoi, 1983).
Englezos et al. (1987a,b) derived a model for hydrate growth founded on homo-
geneous crystallization theory. The model also incorporated mass transfer effects.
The overall driving force for hydrate growth was defined as the difference between
the fugacity of the gas dissolved in the liquid, at the experimental temperature and
pressure, and the fugacity at the three-phase equilibrium pressure at the experi-
mental temperature.
A simplification of the Englezos et al. (1987a,b) model, based on mass trans-
fer limitations and neglecting crystallization kinetics was proposed by Skovborg and
Rasmussen (1994). A new driving force for hydrate growth was defined as the differ-
ence between the gas concentration at the water-gas interface, at the experimental
temperature and pressure, and the gas concentration in the bulk liquid phase at the
CHAPTER 2. BACKGROUND 14
experimental temperature and pressure.
The Englezos model (1987a; 1987b) was recently reformulated using a concen-
tration gradient, based on two-phase equilibria rather than three-phase equilibria
(Hashemi et al., 2007). A further simplification has been put forward by Bergeron
and Servio (2008) where the hydrate-growth driving force was defined as the differ-
ence between the experimentally measured bulk gas concentration in the liquid and
the two-phase hydrate-water equilibrium concentration.
2.4 Morphology
Pioneering morphology work was done by Maini and Bishnoi (1981) and by Mako-
gon and co-workers (1997). Maini and Bishnoi (1981) captured images of hydrate
formation in natural gas bubbles as they ascended through a high-pressure water
tunnel kept at 3◦C and reported that a thin hydrate layer formed over the entire
surface of the gas bubble above 4.8 MPa. Makogon (1997) found that crystal shape
and growth was determined by the hydrate formation conditions. Other early ob-
servational studies include that of Mori and Mori (1989b,a) on refrigerants, that of
Hwang et al. (1990) on methane hydrate formed from ice supported on stainless-
steel discs and that of Long and Sloan (1996) on methane and CO2 hydrate grown
inside a sapphire tube.
Sugaya and Mori (1996) presented one of the first studies on hydrates formed
from bubbles of a fluorocarbon immersed in water; it was found that the surface
morphology of the hydrate layer formed at the interface depends strongly on the
degree of saturation of the water phase with the guest component. Ohmura and
Mori (1999) expanded the study of Sugaya and Mori (1996) to include a different
type of refrigerant; in addition, it was hypothesized that a concentration driving
force could explain the differences in morphology observed at high and low driving
forces. The crystal-growth behavior of structure I, structure II and structure H was
described by Smelik and King (1997); it was proposed that the characteristic crystal
morphology of each structure could be used to identify hydrate types in situ.
CHAPTER 2. BACKGROUND 15
Uchida and co-workers have published a number of articles on the morphology
of CO2 hydrate (1996; 1999; 2000b; 2002). The first focused on determining the
interfacial tension between liquid CO2, water and hydrate, yet illustrations of their
observations were also provided (Uchida and Kawabata, 1996). Later on, still frames
of video recordings of hydrate formation on water droplets suspended in liquid CO2
were presented (Uchida et al., 1999). It was concluded that hydrates formed initially
at the interface between the two fluids and proceeded until complete coverage of
the water bubble; on some occasions secondary nucleation was also observed inside
the water bubble (Uchida et al., 1999). Uchida et al. (2002) measured the lateral
growth rates of CO2 hydrate films on water bubbles to range from 6 to 15 mm/s, and
concluded that sub cooling was the parameter that highly determined the growth
rate of the crystal.
Servio and Englezos (2003) studied the morphology of methane and carbon
dioxide hydrates formed on nearly spherical water droplets. It was found that the
type of hydrate guest did not have an effect on the crystal morphology. Furthermore,
when hydrates were formed at high driving forces water droplets were observed to
become jagged, and numerous needle-like crystals were seen to extend away from the
water surface into the gas phase. This was not the case at low driving force, where
the hydrate surface was observed to be smooth and shiny (Servio and Englezos,
2003). Servio and Englezos (2003) also observed that adjacent water droplets would
nucleate almost simultaneously and hypothesized that this could be attributed to a
bridge formed by minute water droplets between the water bubbles.
A unique study has been put forward by Schicks and Ripmeester (2004) where
micrographs suggesting the formation of structure II methane hydrate were shown.
This observation was corroborated with Raman spectroscopy, and it was concluded
that the thermodynamically unstable, structure II methane hydrate eventually con-
verts to structure I methane hydrate (Schicks and Ripmeester, 2004).
Perhaps the most successful systematic approaches to correlate the observed cla-
thrate morphology with the corresponding driving force have been put forward by
Ohmura and co-workers (1999; 2004; 2005; 2009). Based on hypothesized concen-
CHAPTER 2. BACKGROUND 16
tration differentials between the liquid phase near the newly formed hydrate and the
liquid bulk concentration, they were able to match images to their proposed driving
force (Ohmura and Mori, 1999; Ohmura et al., 2004, 2005). Very recently, the same
group used sub cooling1 as an index for the driving force of the system; through this
index it was then possible to correlate the driving force with the observed hydrate
morphology (Tanaka et al., 2009). As a general trend it was observed that sub cool-
ings ≥ 3 K produced sword-like crystals whereas at smaller sub cooling polygonal
faces appeared, the size of the latter increasing with decreasing sub cooling (Tanaka
et al., 2009).
Ohmura and Mori (1999) worked with liquid droplets of refrigerant R-141b
(CH3CCl2F) in water and distinguished two stages of hydrate-crystal growth, which
were very different from each other. The primary stage was characterized by lateral
growth of a thin, fine-grained polycrystalline layer along the surface of each R-141b
drop; the secondary stage began typically after 10 min and lasted for several hours:
it was characterized by radial growth of plate-like crystals growing from the outer
surface of the hydrate shell formed in the primary stage (Ohmura and Mori, 1999).
The second stage was never observable with pure water (not presaturated) and/or
at a small sub cooling. Ohmura and Mori (1999) also observed that the hydrate
surface formed in non-presaturated water smoothed over time. In subsequent work
Ohmura extended the study done on presaturated water to other hydrate formers
including carbon dioxide (2004) and methane (2005). With carbon dioxide it was
observed that when sub cooling was greater than 3 K, a hydrate film first grew along
the carbon dioxidewater interface; then hydrate crystals with dendritic morphology
grew into the liquid-water phase from that hydrate film (Ohmura et al., 2004). With
sub cooling levels lower than 2 K it was found that dendritic crystals were replaced
by skeletal or polyhedral crystals (Ohmura et al., 2004). Similar conclusions were
presented for the methane-water system (Ohmura et al., 2005).
Using laser interferometry, Ohmura et al. (2000) measured the thickness of a
1Sub cooling is defined as the temperature difference between the experimental temperatureand the guest-rich phase-hydrate-water equilibrium temperature at the experimental pressure.
CHAPTER 2. BACKGROUND 17
R-134a (CH2FCF3) hydrate film and concluded that initially the film could be as
thick as 80 µm. Hirai et al. (2000), Kobayashi et al. (2001) and Freer et al. (2001)
have studied growth of hydrate films. The former (Hirai et al., 2000) and the latter
(Freer et al., 2001) measured velocities of the advancing hydrate film for CO2 and
methane respectively by successively recording images. Hirai et al. (2000) reported
that lateral growth rates could vary from 0.044 mm/s at 284.2 K and 39.2 MPa to
6.5 mm/s at 278.7 K and 39.2 MPa for CO2 hydrate. Freer et al. (2001) determined
methane hydrate growth rates varying from 20 µm/s at 3.55 MPa and 1◦C to 690
µm/s at 9.06 MPa and 1◦C.
Morphology of hydrates prepared from melting ice has been studied with an
optical microscope by Stern et al. (1998), and with magnetic resonance imaging
by Moudrakovski and co-workers (1999; 2004). Stern et al. (1998) concluded that
fine-grained ice can persist to temperatures well above its ordinary melting point
while slowly reacting to form methane hydrate under elevated methane gas pres-
sure. Moudrakovski et al. (2004) saw evidence for inhomogeneous hydrate con-
version throughout their experiments, as well as for secondary nucleation taking
place well away from the hydrate film that covered their samples initially. Using
electron microscopy, Kuhs’s group has analyzed hydrates forming on ice and have
concluded that clathrate surfaces have a sub micron porous structure (Kuhs et al.,
2000; Staykova et al., 2003). Using a similar approach Stern et al. (2004) and Stern
and Kirby (2008) have shown that porous hydrate develops initially and that growth
textures of clathrate made from ice eventually anneal, producing dense clusters of
grains with prominent crystal face development.
2.4.1 Particles and Restricted Geometries
The formation of clathrates in deep ocean water has been studied for methane
hydrate (Brewer et al., 1997) and for CO2 hydrate (Brewer et al., 2008) with the
aid of a remotely operated vehicle. Brewer et al. (1997) observed that in a coarse
sand matrix methane hydrate filled the pore spaces and turned the sand column
into a solidified block that was eventually lifted and ruptured by methane gas. For
CHAPTER 2. BACKGROUND 18
methane hydrate formation in fine grained black mud it was found that gas flow
carved out channels, clathrates then formed on the channel walls and subsequently
filled the channels until forming large, discrete masses. Carbon dioxide behaved
differently: liquid CO2 that was spilled onto the sea floor did not penetrate or
appear to react with the sediment in any way, eventually being washed away by
passing eddies (Brewer et al., 2008).
Tohidi et al. (2001) studied tetrahydrofuran, methane and CO2 hydrate forming
inside an asymmetric porous network etched into glass micro models. Clathrates
were observed to form within the centers of the pore space, rather that on grain
surfaces. A thin film of free water persisted on grain surfaces even at high driving
forces and it was proposed that limited cementation occurred in regions of small
grain size or where a large proportion of the pore space was filled with hydrate. The
idea of using glass micro models was further pursued by Katsuki and co-workers
using a symmetric network of straight microchannels to study both CO2 (Katsuki
et al., 2006) and methane hydrates (Katsuki et al., 2007, 2008) It was found that
higher driving forces induced the formation of dendrites that quickly changed into
particulate crystals. Lower driving forces induced faceted hydrate growth; this
morphology changed very little over time (Katsuki et al., 2006, 2007). Faceted
crystals filled the individual channels and extended onto others; furthermore, the
presence of liquid water layers was not observable (Katsuki et al., 2006, 2007). As
for methane clathrate dissociation, it was found that methane gas produced upon
hydrate decomposition formed “slugs” that completely occupied the pore space
(Katsuki et al., 2008).
Mork et al. (2000) conducted nuclear magnetic resonance imaging studies on
tetrahydrofuran hydrate formed in the presence of sand and found that lumpy vol-
umes of solidified sand and hydrate formed and that in between them a three-
dimensional network of channels made of a highly mobile phase existed. Based
on the way sand particles appeared suspended in the hydrate, Mork et al. (2000)
suggested that it was likely that the growing clathrate was able to push the sand par-
ticles apart upon formation. Nagashima et al. (2008) also worked with tetrahydro-
CHAPTER 2. BACKGROUND 19
furan hydrates using a directional growth apparatus, and observed that clathrates
formed a layered pattern in solutions containing glass beads 2 µm in diameter, but
that the layered pattern was not present in solutions containing glass beads 50 µm
in diameter. The observed layered pattern was attributed to pushing of the glass
beads by the growing hydrate layer (Nagashima et al., 2008).
The formation of hydrates from CO2 and N2 mixtures and water dispersed in
silica gel has been monitored with nuclear resonance micro imaging by Seo et al.
(2005); it was found that the reaction proceeded to almost complete conversion of
water to hydrate in one hour. Kvamme et al. (2007) and Ersland et al. (2008) have
used magnetic resonance imaging as a tool to visualize methane hydrate conversion
into CO2 hydrate in sandstone core plugs and concluded that CO2 transport prob-
ably occurs through aqueous channels that separate the hydrate from the mineral
surface.
Uchida et al. (2000a) were able to characterize macroscopic forms of natural
gas hydrates recovered from the Canadian permafrost using a modified medical
computed tomography scanner. Later on, Jin et al. (2004) improved on the spatial
resolution with a micro focus X-ray computed tomography scanner, and were able to
calculate porosities of artificial samples containing ice, hydrate, free gas and quartz
sand. Also with a modified medical computed tomography scanner, Kneafsey et al.
(2007) monitored methane hydrate behavior while forming in the presence of moist
silica sand 100 to 200 µm grain size, and found that water could migrate throughout
the sample. The formation of a hydrate rind between the sample and the vessel
wall was also observed (Kneafsey et al., 2007). Using synchrotron radiation-based
computer tomography Jones et al. (2007) presented a preliminary study on THF
hydrate formation in oceanic sediment samples, and concluded that there was no
evidence for the existence of free-floating hydrate at the micrometer scale.
Stern et al. (2004) used cryogenic scanning electron microscopy to compare arti-
ficial methane hydrate + quartz aggregates synthesized from melting ice to natural
gas hydrates in nodules recovered from the Mallik drill site in Canada, and found
that there was a striking similarity in phase distribution, grain contacts and tex-
CHAPTER 2. BACKGROUND 20
tures between the natural and the lab-synthesized sample that had been subject to
compaction. Later, the same group studied natural hydrate samples from various
locations around the world and concluded that gas hydrate often occurs as a dense
substrate with typical grain size of 30 to 200 µm. In addition, it was reported that
the hydrate often contains a significant fraction of isolated macropores that can be
5 to 10 µm in diameter and occupy 10 to 30% of the domain (Stern and Kirby,
2008).
Chapter 3
Equilibrium Studies for the
System Methane + Carbon
Dioxide + Neohexane + Water1
3.1 Preface
Phase equilibrium is perhaps the most studied subject pertaining to clathrates. As
a consequence, many of the high-pressure experimental techniques often required
for its study are well known. In addition, without knowledge of the conditions at
which hydrates are stable it would be impossible to undertake the kind of morphol-
ogy studies described in the ensuing chapters. For these reasons, studying phase
equilibrium is frequently used as an initiation to hydrate phenomena. Pure methane
clathrate, which concerns the rest of the chapters of this thesis, would have been
the natural choice; however, this system has been studied extensively in the past.
Thus, a system where a significative contribution to the field could be made was
chosen instead: in particular, the system methane + carbon dioxide + neohexane
1Reproduced in part with permission from Beltran, J.G. and Servio, P. 2008. Equilibriumstudies for the system methane + carbon dioxide + neohexane + water. Journal of ChemicalEngineering Data, 53: pp. 1745-1749. Copyright 2008 American Chemical Society.
21
CHAPTER 3. EQUILIBRIUM 22
+ water. This system was found interesting because important theoretical incon-
sistencies regarding the data analysis from previous investigations were found. The
study described below completed the equilibrium data set for the system in question
and clarified some common misconceptions found in the literature.
3.2 Abstract
Four-phase equilibrium conditions (hydrate-liquid-liquidaq-vapor) were stud-ied for the system methane + carbon dioxide + neohexane + water bythe pressure search method. In addition, three-phase equilibrium conditions(hydrate-liquid-vapor) were determined for the same system in the absenceof neohexane. Experimental conditions were varied in the temperature rangeof (275 to 285) K and the pressure range of (1.3 to 7.5) MPa. Equilibriumtemperature and pressure values were found to agree, within the uncertaintiesherein reported, with existing literature values for both systems. The datawas used to produce experimental contour plots that summarize the equi-librium temperature, pressure, and vapor composition on the same graph.It was observed that the equilibrium mole fraction of carbon dioxide in thevapor phase follows opposite trends in both systems, with respect to equilib-rium pressure, at rather constant temperature. The data also suggest thathexagonal structure H equilibrium occurs at lower pressures and temperaturesthan cubic structure I when the vapor phase is methane rich; however, thisphenomenon appears to be reversed as the equilibrium vapor phase becomesricher in carbon dioxide.
3.3 Introduction
Clathrate hydrates are nonstoichiometric, crystalline compounds that form when
small molecules come in contact with water at appropriate temperatures and pres-
sures. The terms “gas hydrates” and “clathrate hydrates” are now used interchange-
ably to designate this kind of compound (Englezos, 1993). Clathrates of natural gas
were first observed in pipelines in 1934 (Hammerschmidt, 1934) and have since then
been considered a nuisance to the gas and oil industry. Natural-gas hydrates are

CHAPTER 3. EQUILIBRIUM 23
abundantly found in the ocean bottom and to a lesser extent in permafrost regions
(Sloan, 2000). Conservative estimates suggest that the amount of energy stored
in natural hydrates is at least twice that of all other fossil fuels combined (Kven-
volden, 2002). In addition, trapping carbon dioxide as a hydrate in the bottom
of the ocean has been proposed as an alternative to reduce increasing atmospheric
CO2 concentration (Brewer, 2000).
Mixtures of carbon dioxide and methane form cubic structure I (sI) hydrates
(Uchida et al., 2005), but in the presence of a larger molecule, like neohexane, the
hexagonal structure H (sH) is also stable (Servio et al., 1999; Uchida et al., 2006).
Structure H differs from other hydrate structures for it requires at least two guests to
form a stable lattice; in addition, sH will form at lower pressures than its correspond-
ing sI hydrate, at the same temperature. Structure H hydrates were discovered in
1987 by Ripmeester and co-workers (Ripmeester et al., 1987). Since then, the study
of structure H hydrates has gone beyond a laboratory curiosity: naturally occurring
sH hydrates were found by Sassen and Macdonald (1994) and schemes to transport
gas and sequester gas as a solid, in sH form, have been proposed in the past (Khokar
et al., 1998; Susilo et al., 2007). In particular, it has been shown that sH hydrates
from methane and neohexane exhibit fast overall formation kinetics and almost
100% enclathration of methane (Susilo et al., 2007). Servio et al. (1999) have stud-
ied equilibria of methane-carbon dioxide mixtures in the presence and absence of
neohexane and suggested that above a certain temperature structure H equilibrium
moved into a structure I equilibrium regime. This suggestion was later confirmed
by Uchida and co-workers Uchida et al. (2006), who in addition to equilibrium mea-
surements used Raman spectroscopy and X-ray diffraction to confirm the presence
of sH hydrates. Both Servio et al. (1999) and Uchida et al. (2006) showed partial
phase diagrams where equilibrium pressure and temperature of methane + carbon
dioxide gas mixtures in the presence of neohexane were compared to mixtures in
the absence of neohexane. Comparisons were based on initial gas compositions and
not equilibrium, vapor-phase compositions. Servio et al. (1999) used only two gas
mixtures obtaining limited amounts of data, and Uchida et al. (2006) did not re-
CHAPTER 3. EQUILIBRIUM 24
port equilibrium vapor-phase compositions. In contrast, methane + carbon dioxide
mixtures in contact with water have been studied extensively (Unruh and Katz,
1949; Berecz and Balla-Achs, 1983; Adisasmito et al., 1991; Ohgaki et al., 1996;
Dholabhai and Bishnoi, 1994; Seo and Lee, 2001).
In this paper, we report equilibrium pressure, temperature, and vapor-phase
composition for the system methane + carbon dioxide + neohexane + water and
the same in the absence of neohexane. In addition to completing the equilibrium
data set for the system with neohexane, we present experimental contour plots that
allow direct comparison of the equilibria of methane + carbon dioxide hydrates with
methane + carbon dioxide + neohexane hydrates.
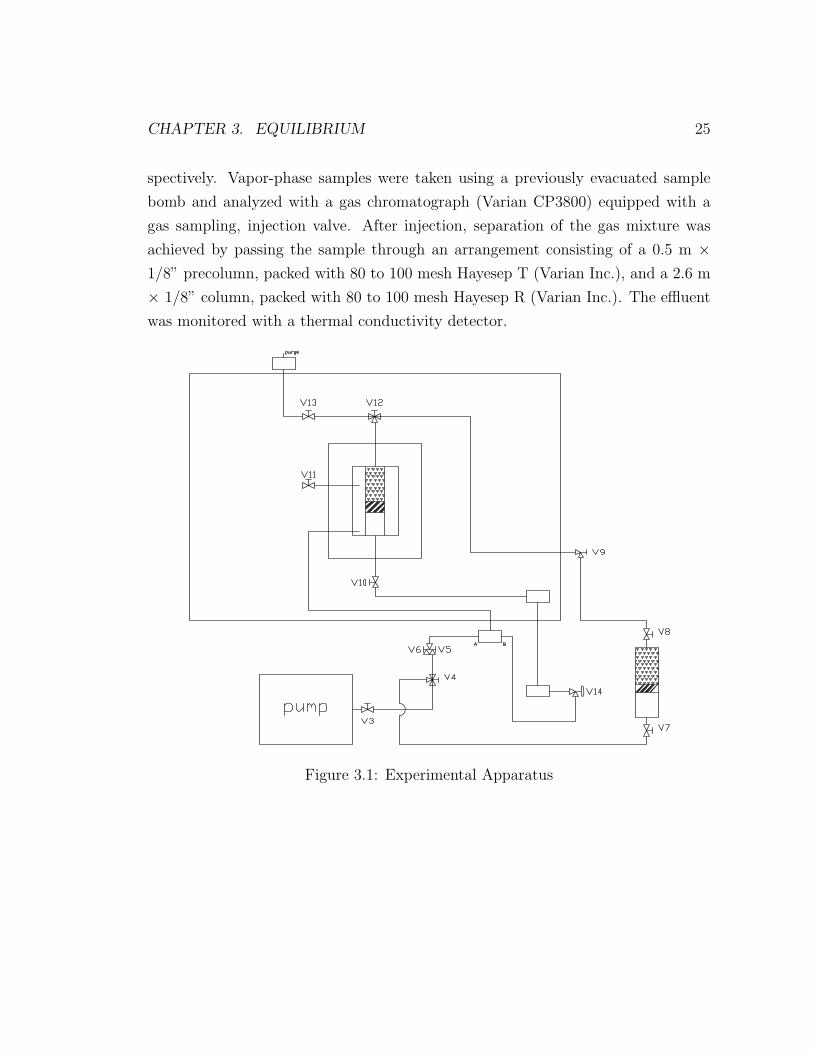
3.4 Experimental Apparatus
Experiments were carried out in a Jefri-DBR phase behavior system (Oilphase-
DBR- Schlumberger) (Figure 3.1). The heart of the system was a high-pressure
PVT cell consisting of a glass cylinder (20 cm in height and total void volume
150 cm3), secured between two full-length sight glass windows, inside a stainless
steel frame. This design allowed for unimpaired visibility of the entire contents
of the cell. Pressure was regulated through an automated, high-pressure, posi-
tive displacement pump (Oilphase-DBR-Schlumberger). Fluid inside the pump was
connected to a floating isolation piston which exerted pressure on the mixture of
interest, and prevented contact with the hydraulic fluid inside the glass cylinder.
The PVT cell was mounted inside a temperature controlled air bath by means of
a bracket, attached to a horizontal shaft. An electric motor powered the shaft,
which oscillated through sixty degrees about its center of gravity at forty cycles
per minute. Temperature and pressure inside the PVT cell were monitored with
a platinum RTD probe, and a pressure transducer (both supplied with the Phase
Behavior system). Using a coverage factor of k = 2 and assuming the correspond-
ing standard uncertainty had a normal distribution, each expanded uncertainty was
estimated to be UT = 0.2 K and UP = 14 kPa, for temperature and pressure, re-
CHAPTER 3. EQUILIBRIUM 25
spectively. Vapor-phase samples were taken using a previously evacuated sample
bomb and analyzed with a gas chromatograph (Varian CP3800) equipped with a
gas sampling, injection valve. After injection, separation of the gas mixture was
achieved by passing the sample through an arrangement consisting of a 0.5 m ×1/8” precolumn, packed with 80 to 100 mesh Hayesep T (Varian Inc.), and a 2.6 m
× 1/8” column, packed with 80 to 100 mesh Hayesep R (Varian Inc.). The effluent
was monitored with a thermal conductivity detector.
pumpV3
V8
V7
V4
V11
V13 V12
V14
V9
V5V6
V10
purge
A B
Figure 3.1: Experimental Apparatus

CHAPTER 3. EQUILIBRIUM 26
3.5 Experimental Procedure
Gas mixtures containing a mole fraction of 80 %, 70 %, 60 %, and 50 % methane,
respectively, the balance being carbon dioxide, were supplied by MEGS Specialty
Gases. The PVT cell was filled with 30 cm3 of distilled water and 15 cm3 of neohex-
ane (2,2-dimethylbutane). These liquids were then brought into contact with the
gaseous mixture under study. For the three-phase equilibrium experiments neohex-
ane was not added. Agitation was commenced once all the necessary chemicals were
loaded into the PVT cell. Temperature control of the bath was then started, and
temperature inside the PVT cell was let to equilibrate over night, while pressure
was kept constant to a value just below the expected equilibrium pressure. Hydrates
were formed by increasing the pressure above the equilibrium point for pure methane
hydrate. When a considerable amount of hydrate crystals was observed in the PVT
cell, pressure was reduced in steps of 30 kPa, allowing for temperature in the cell
to equilibrate between each decrement. Pressure reduction was achieved by retract-
ing the floating isolation piston inside the PVT cell with the help of the positive
displacement pump, and care was taken to ensure the temperature in the cell was
constant within 0.5 K for at least 30 min before proceeding with the next pressure
decrease. The procedure was repeated until visual confirmation of hydrate-phase
disappearance. The equilibrium temperature and pressure values were taken as the
average between the conditions at which the last hydrate crystal was observed and
the conditions at which the last hydrate crystal disappeared. A vapor phase sample
was taken immediately after complete hydrate decomposition and analyzed by gas
chromatography. Using the method described above to determine the equilibrium
point for both the system with neohexane and that without, it was estimated that
the standard uncertainties were as follows: for temperature uT = 0.5 K, for pres-
sure up = 0.03 MPa, and for vapor-phase mole fraction uy1 = 0.02. With a coverage
factor of k = 2 and assuming the corresponding standard uncertainty had a normal
distribution, each expanded uncertainty was estimated to be UT = 1.0 K, UP = 0.06
MPa, and Uy1 = 0.04.
CHAPTER 3. EQUILIBRIUM 27
3.6 Results and Discussion
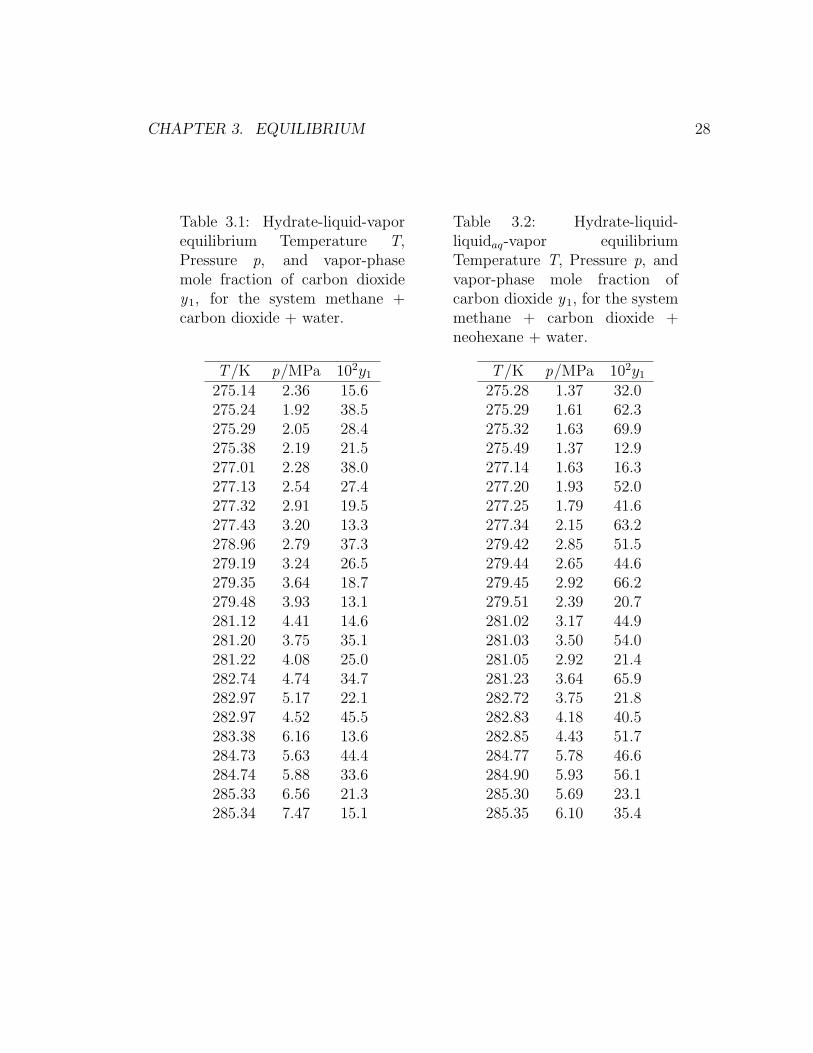
Table 3.1 and Table 3.2 present the complete three-phase and four-phase equilibrium
data for the systems methane + carbon dioxide + water and methane + carbon diox-
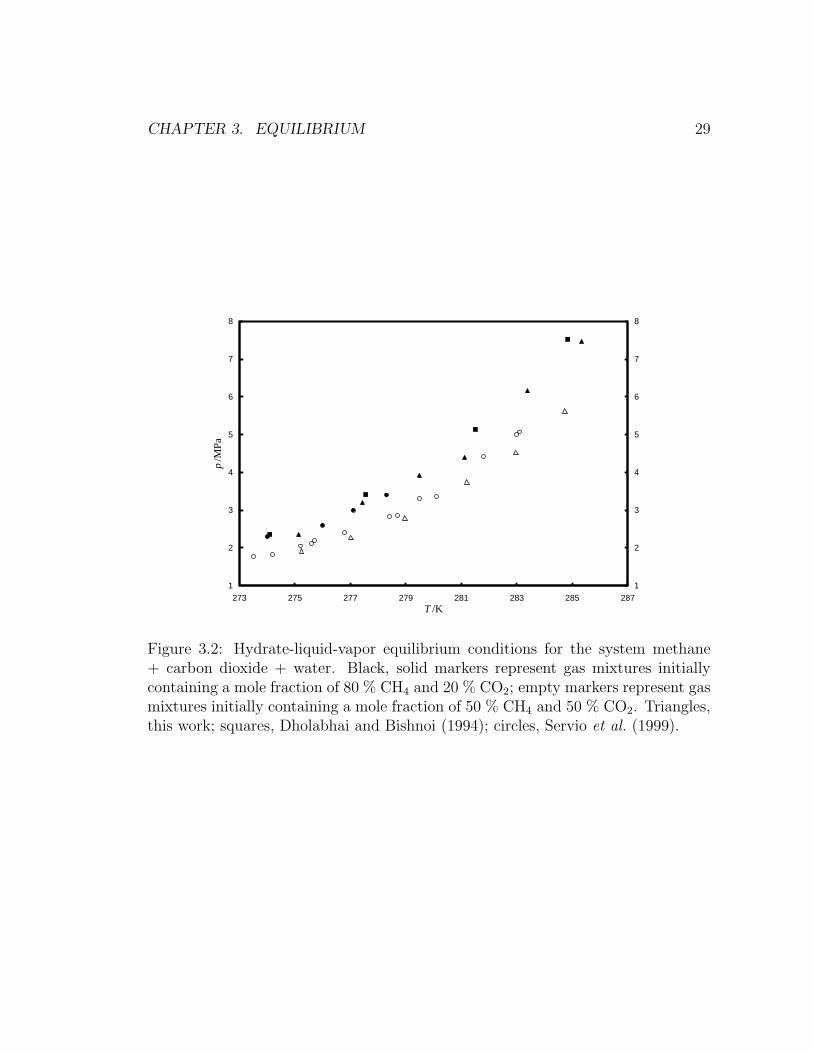
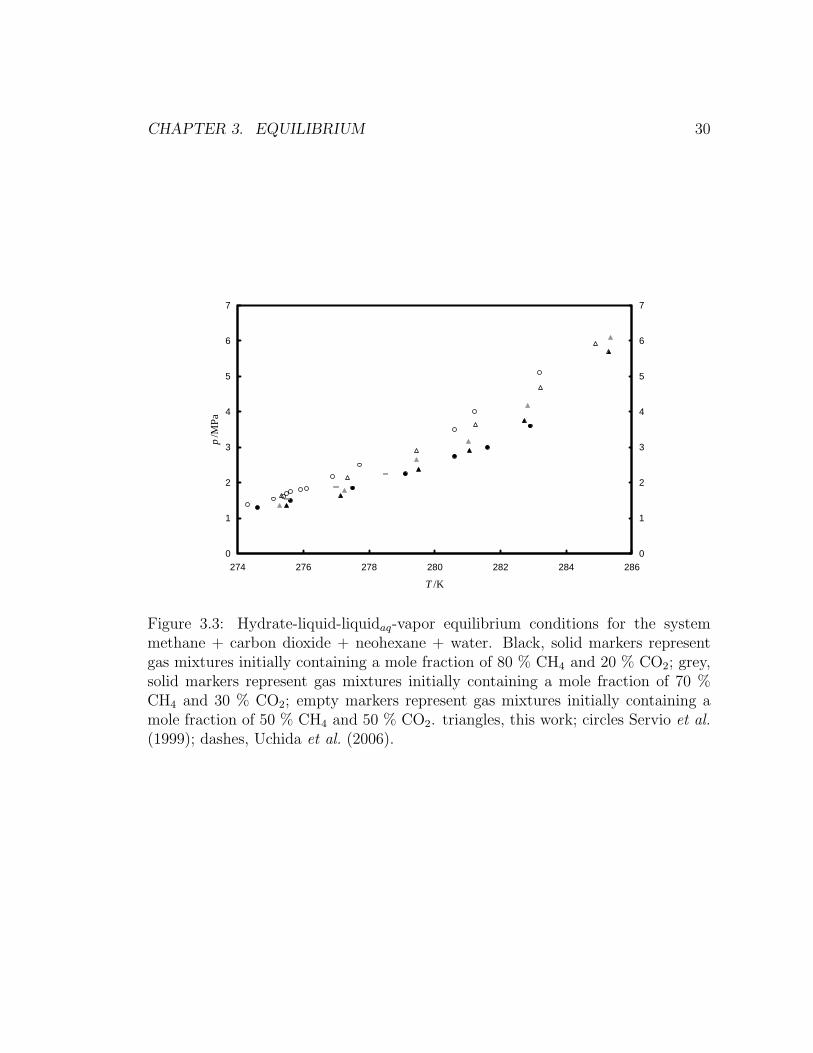
ide + neohexane + water, respectively. Figure 3.2 and Figure 3.3 show three-phase
(hydrate-liquid-vapor) and four phase (hydrate-liquid-liquidaq-vapor) equilibrium
temperature and pressure, respectively, for gas mixtures initially containing a mole
fraction of 80 %, 70 %, and 50 % methane, the balance being carbon dioxide. These
figures are shown to offer a comparison against the data available in the literature
where analysis of the results was made based on the feed vapor-phase composition
and not on the equilibrium vapor-phase composition. To increase readability, data
from mixtures used in this work but not available in the literature are not presented
in Figure 3.2 and Figure 3.3, but rather incorporated into Figure 3.5, Figure 3.6
and Figure 3.7. Equilibrium pressure and temperature values for gas mixtures in
contact with water only (Figure 3.2) and with water and neohexane (Figure 3.3)
agree with previously reported values within our estimated expanded uncertainties.
(Servio et al., 1999; Uchida et al., 2006; Dholabhai and Bishnoi, 1994).
As can be seen from Figure 3.2, equilibrium pressure at constant temperature de-
creases with increasing initial carbon dioxide concentration. This trend is expected
since pure carbon dioxide hydrate forms at lower pressures than pure methane hy-
drate (Sloan and Koh, 2008). Figure 3.3 shows how the presence of neohexane
inverts the trend: mixtures with higher initial carbon dioxide concentration form
hydrates at higher pressures at constant temperature. Uchida et al. (2006) explained
this effect by postulating that sH stability is controlled by methane occupancy of
the 512 cage, and thus increasing carbon dioxide concentrations tend to destabilize
structure H (Uchida et al., 2006).
It is important to reiterate that previous analyses of the phase equilibrium of the
system methane + carbon dioxide + neohexane + water were done based on initial
vapor phase compositions and not equilibrium vapor phase compositions, which is
incorrect. According to the Gibbs phase rule a four-phase, quaternary system at
equilibrium has two degrees of freedom. Thus, by fixing two intensive variables
CHAPTER 3. EQUILIBRIUM 28
Table 3.1: Hydrate-liquid-vaporequilibrium Temperature T,Pressure p, and vapor-phasemole fraction of carbon dioxidey1, for the system methane +carbon dioxide + water.
T /K p/MPa 102y1
275.14 2.36 15.6275.24 1.92 38.5275.29 2.05 28.4275.38 2.19 21.5277.01 2.28 38.0277.13 2.54 27.4277.32 2.91 19.5277.43 3.20 13.3278.96 2.79 37.3279.19 3.24 26.5279.35 3.64 18.7279.48 3.93 13.1281.12 4.41 14.6281.20 3.75 35.1281.22 4.08 25.0282.74 4.74 34.7282.97 5.17 22.1282.97 4.52 45.5283.38 6.16 13.6284.73 5.63 44.4284.74 5.88 33.6285.33 6.56 21.3285.34 7.47 15.1
Table 3.2: Hydrate-liquid-liquidaq-vapor equilibriumTemperature T, Pressure p, andvapor-phase mole fraction ofcarbon dioxide y1, for the systemmethane + carbon dioxide +neohexane + water.
T /K p/MPa 102y1
275.28 1.37 32.0275.29 1.61 62.3275.32 1.63 69.9275.49 1.37 12.9277.14 1.63 16.3277.20 1.93 52.0277.25 1.79 41.6277.34 2.15 63.2279.42 2.85 51.5279.44 2.65 44.6279.45 2.92 66.2279.51 2.39 20.7281.02 3.17 44.9281.03 3.50 54.0281.05 2.92 21.4281.23 3.64 65.9282.72 3.75 21.8282.83 4.18 40.5282.85 4.43 51.7284.77 5.78 46.6284.90 5.93 56.1285.30 5.69 23.1285.35 6.10 35.4
CHAPTER 3. EQUILIBRIUM 29
1
2
3
4
5
6
7
8
273 275 277 279 281 283 285 287T /K
p/M
Pa
1
2
3
4
5
6
7
8
Figure 3.2: Hydrate-liquid-vapor equilibrium conditions for the system methane+ carbon dioxide + water. Black, solid markers represent gas mixtures initiallycontaining a mole fraction of 80 % CH4 and 20 % CO2; empty markers represent gasmixtures initially containing a mole fraction of 50 % CH4 and 50 % CO2. Triangles,this work; squares, Dholabhai and Bishnoi (1994); circles, Servio et al. (1999).
CHAPTER 3. EQUILIBRIUM 30
0
1
2
3
4
5
6
7
274 276 278 280 282 284 286
T /K
p/M
Pa
0
1
2
3
4
5
6
7
Figure 3.3: Hydrate-liquid-liquidaq-vapor equilibrium conditions for the systemmethane + carbon dioxide + neohexane + water. Black, solid markers representgas mixtures initially containing a mole fraction of 80 % CH4 and 20 % CO2; grey,solid markers represent gas mixtures initially containing a mole fraction of 70 %CH4 and 30 % CO2; empty markers represent gas mixtures initially containing amole fraction of 50 % CH4 and 50 % CO2. triangles, this work; circles Servio et al.(1999); dashes, Uchida et al. (2006).
CHAPTER 3. EQUILIBRIUM 31
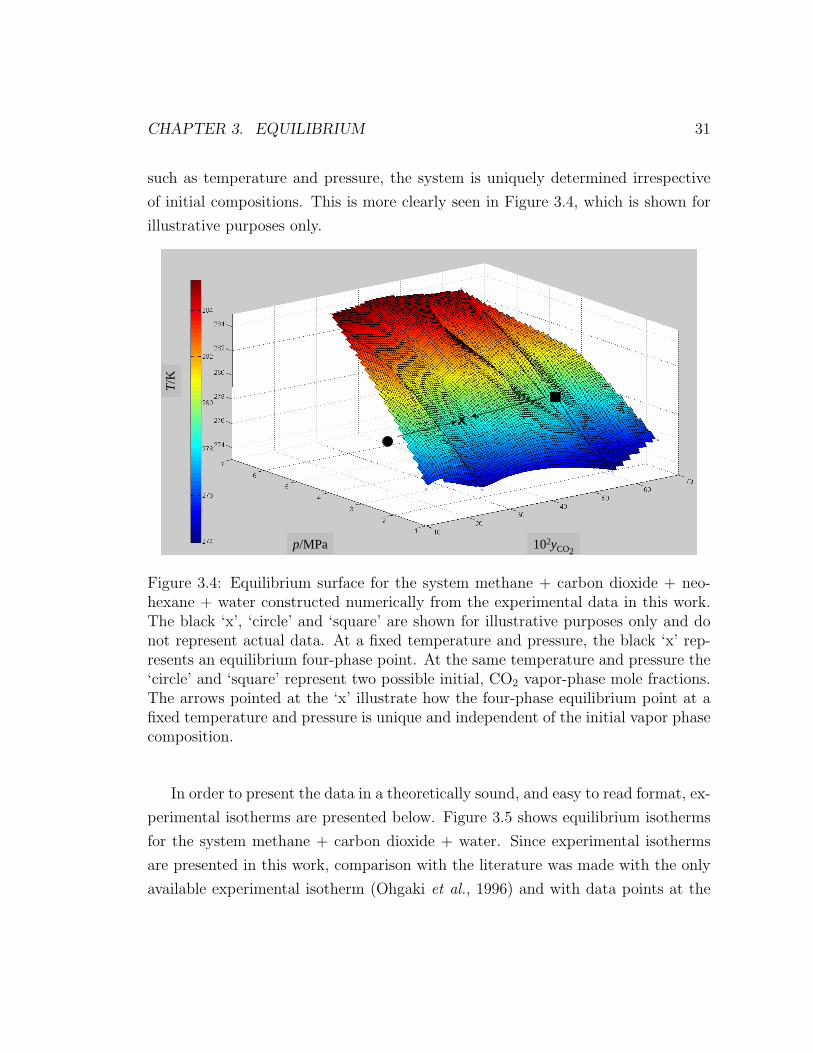
such as temperature and pressure, the system is uniquely determined irrespective
of initial compositions. This is more clearly seen in Figure 3.4, which is shown for
illustrative purposes only.
x
T/K
p/MPa 102yCO2
Figure 3.4: Equilibrium surface for the system methane + carbon dioxide + neo-hexane + water constructed numerically from the experimental data in this work.The black ‘x’, ‘circle’ and ‘square’ are shown for illustrative purposes only and donot represent actual data. At a fixed temperature and pressure, the black ‘x’ rep-resents an equilibrium four-phase point. At the same temperature and pressure the‘circle’ and ‘square’ represent two possible initial, CO2 vapor-phase mole fractions.The arrows pointed at the ‘x’ illustrate how the four-phase equilibrium point at afixed temperature and pressure is unique and independent of the initial vapor phasecomposition.
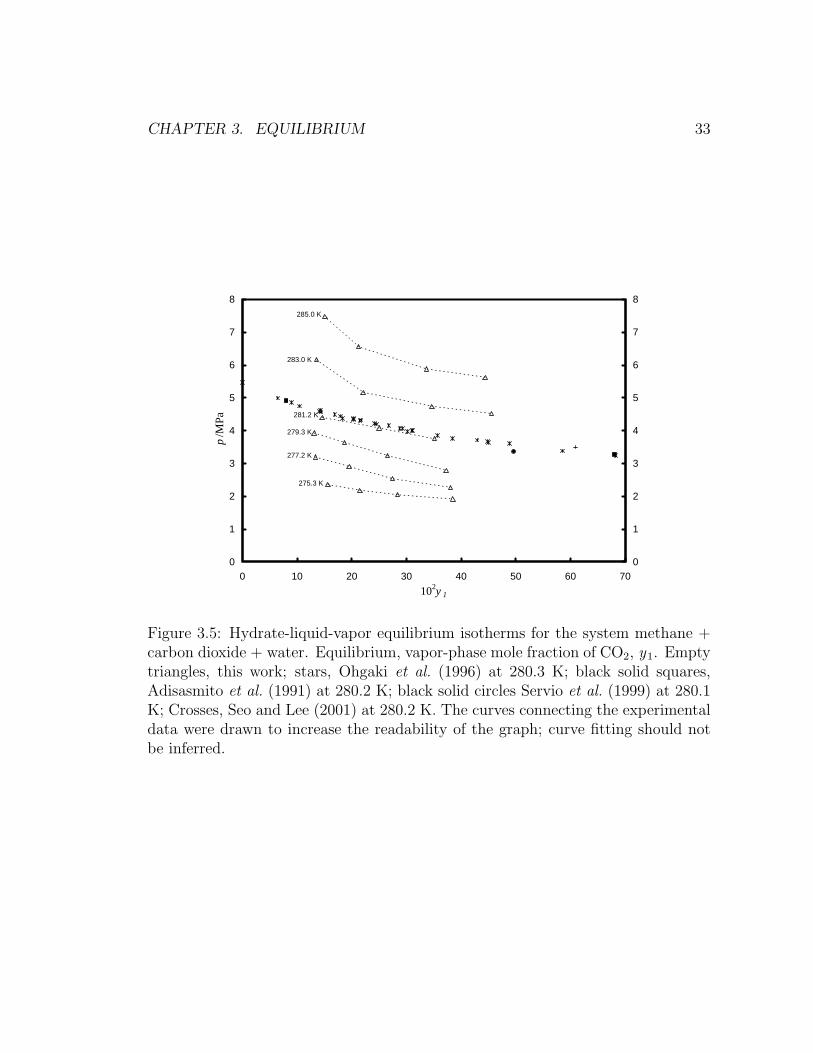
In order to present the data in a theoretically sound, and easy to read format, ex-
perimental isotherms are presented below. Figure 3.5 shows equilibrium isotherms
for the system methane + carbon dioxide + water. Since experimental isotherms
are presented in this work, comparison with the literature was made with the only
available experimental isotherm (Ohgaki et al., 1996) and with data points at the
CHAPTER 3. EQUILIBRIUM 32
same temperature as Ohgaki et al. (1996) from other researchers (Servio et al., 1999;
Adisasmito et al., 1991; Seo and Lee, 2001). The four data sets are in agreement
within the estimated expanded uncertainties from this work. At constant temper-
ature, increasing equilibrium concentrations of carbon dioxide in the vapor phase
occur at lower equilibrium pressures.
Figure 3.6 displays equilibrium isotherms for methane + carbon dioxide mixtures
in the presence of water and neohexane. Comparison with Servio et al. (1999) work
is done at the same temperature as in Figure 3.5. Agreement between both studies
is observed within the estimated expanded uncertainties from this work.
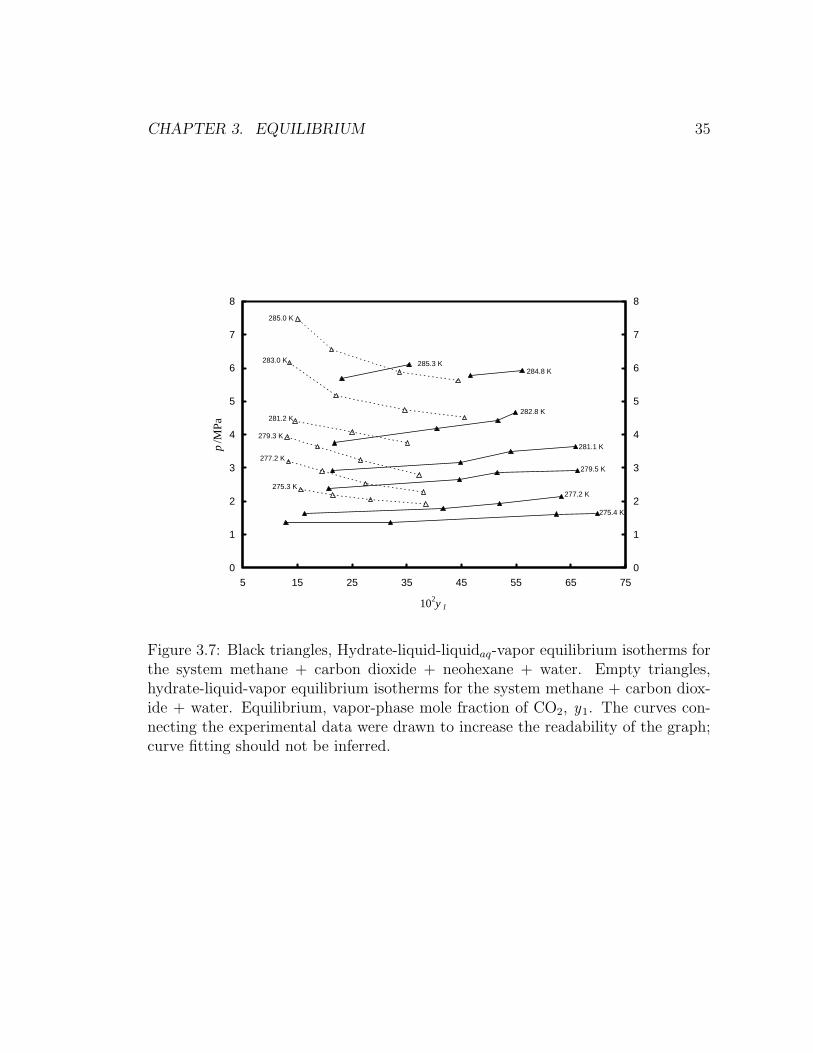
The isotherms in Figure 3.6 show a trend opposite to those in Figure 3.5: at
constant temperature, increasing equilibrium concentrations of carbon dioxide in
the vapor phase occur at higher equilibrium pressures. This is more clearly seen by
superimposing both sets of data (Figure 3.7). From Figure 3.7, it can be inferred
that structure H equilibrium occurs at lower pressures and temperatures than sI
when the vapor phase is methane rich; however, this phenomenon appears to be
reversed as the equilibrium vapor phase becomes richer in carbon dioxide. The
latter might explain why Uchida et al. (2006) observed structure I formation for
a gas mixture initially containing a mole fraction of 70 % methane, the balance
being carbon dioxide, in the presence of water and neohexane, at conditions below
the expected equilibrium pressure and temperature for the same gas mixture in the
presence of water only.
3.7 Conclusion
Four-phase equilibrium conditions (hydrate-liquid-liquidaq-vapor) and three-phase
equilibrium conditions (hydrate-liquid-vapor) were determined for the systems: me-
thane + carbon dioxide + neohexane + water and methane + carbon dioxide +
water, respectively. The data presented here were found to agree with the available
literature data within the uncertainties herein reported. Experimental isotherms
were presented. It was observed that the equilibrium mole fraction of carbon diox-
CHAPTER 3. EQUILIBRIUM 33
0
1
2
3
4
5
6
7
8
0 10 20 30 40 50 60 70102y 1
p/M
Pa
0
1
2
3
4
5
6
7
8
275.3 K
277.2 K
279.3 K
281.2 K
283.0 K
285.0 K
Figure 3.5: Hydrate-liquid-vapor equilibrium isotherms for the system methane +carbon dioxide + water. Equilibrium, vapor-phase mole fraction of CO2, y1. Emptytriangles, this work; stars, Ohgaki et al. (1996) at 280.3 K; black solid squares,Adisasmito et al. (1991) at 280.2 K; black solid circles Servio et al. (1999) at 280.1K; Crosses, Seo and Lee (2001) at 280.2 K. The curves connecting the experimentaldata were drawn to increase the readability of the graph; curve fitting should notbe inferred.

CHAPTER 3. EQUILIBRIUM 34
0
1
2
3
4
5
6
7
10 20 30 40 50 60 70 80
102y 1
p/M
Pa
0
1
2
3
4
5
6
7
275.4 K
277.2 K
279.5 K
281.1 K
282.8 K
284.8 K285.3 K
Figure 3.6: Hydrate-liquid-liquidaq-vapor equilibrium isotherms for the systemmethane + carbon dioxide + neohexane + water. Equilibrium, vapor-phase molefraction of CO2, y1. Triangles, this work; circles, Servio et al. (1999) at 280.6 K.The curves connecting the experimental data were drawn to increase the readabilityof the graph; curve fitting should not be inferred.
CHAPTER 3. EQUILIBRIUM 35
0
1
2
3
4
5
6
7
8
5 15 25 35 45 55 65 75
102y 1
p/M
Pa
0
1
2
3
4
5
6
7
8
275.4 K
277.2 K
279.5 K
281.1 K
282.8 K
284.8 K285.3 K
275.3 K
277.2 K
279.3 K
281.2 K
283.0 K
285.0 K
Figure 3.7: Black triangles, Hydrate-liquid-liquidaq-vapor equilibrium isotherms forthe system methane + carbon dioxide + neohexane + water. Empty triangles,hydrate-liquid-vapor equilibrium isotherms for the system methane + carbon diox-ide + water. Equilibrium, vapor-phase mole fraction of CO2, y1. The curves con-necting the experimental data were drawn to increase the readability of the graph;curve fitting should not be inferred.
CHAPTER 3. EQUILIBRIUM 36
ide in the vapor phase follows opposite trends in both systems, with respect to
equilibrium pressure, at constant temperature. The data also suggest that struc-
ture H equilibrium occurs at lower pressures and temperatures than sI when the
vapor phase is methane rich; however, this phenomenon appears to be reversed as
the equilibrium vapor phase becomes richer in carbon dioxide.
3.8 Supporting Information Available
Representative raw data plot (Figure 3.8), showing temperature and pressure read-
ings leading to the determination of a three-phase or a four-phase equilibrium point.
CHAPTER 3. EQUILIBRIUM 37
283.3
283.4
283.5
283.6
283.7
283.8
283.9
284.0
284.1
284.2
0 100 200 300 400 500 600
t /min
T/K
5.0
6.0
7.0
8.0
9.0
10.0
11.0
12.0
p/M
Pa
increased p to form hydrates
one very smallhydrate flake left in the bulk, aqueousliquid phase
no hydrate flakesvisible in the bulk, aqueous liquid phase
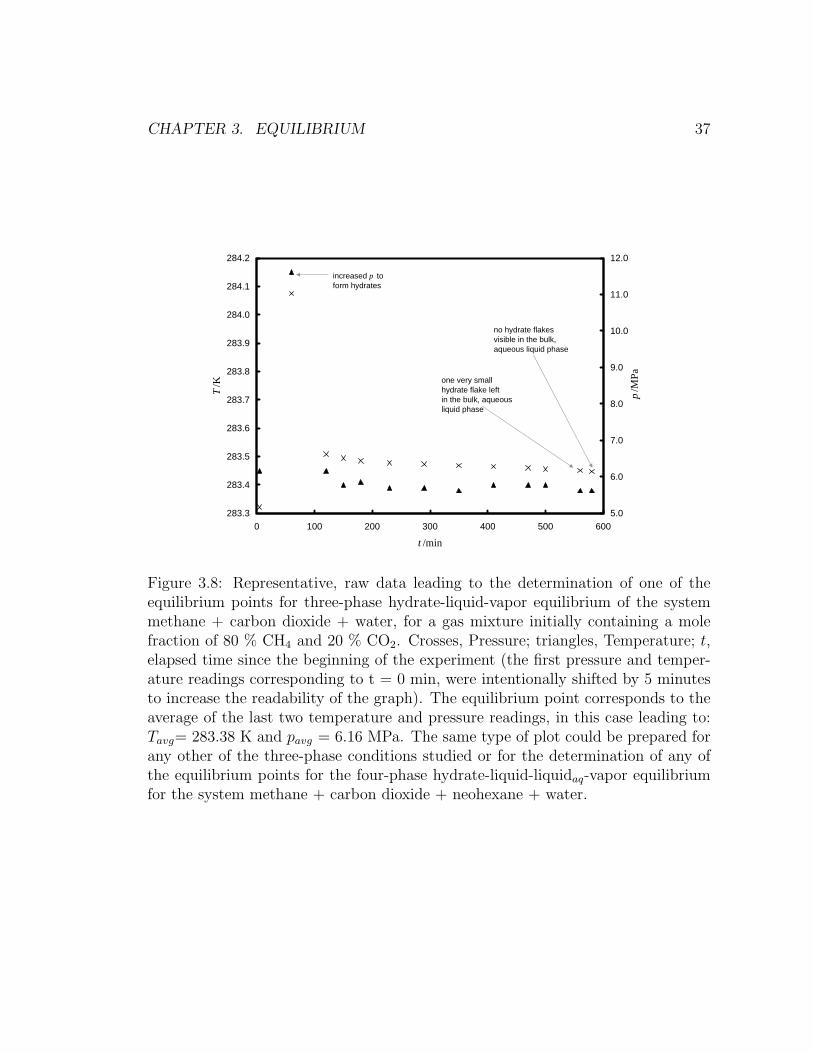
Figure 3.8: Representative, raw data leading to the determination of one of theequilibrium points for three-phase hydrate-liquid-vapor equilibrium of the systemmethane + carbon dioxide + water, for a gas mixture initially containing a molefraction of 80 % CH4 and 20 % CO2. Crosses, Pressure; triangles, Temperature; t,elapsed time since the beginning of the experiment (the first pressure and temper-ature readings corresponding to t = 0 min, were intentionally shifted by 5 minutesto increase the readability of the graph). The equilibrium point corresponds to theaverage of the last two temperature and pressure readings, in this case leading to:Tavg= 283.38 K and pavg = 6.16 MPa. The same type of plot could be prepared forany other of the three-phase conditions studied or for the determination of any ofthe equilibrium points for the four-phase hydrate-liquid-liquidaq-vapor equilibriumfor the system methane + carbon dioxide + neohexane + water.
Chapter 4
Three-Layered Methane Clathrate
and Implications for Hydrate
Propagation1
4.1 Preface
After having acquired experience with clathrate systems and high-pressure equip-
ment (Chapter 3), the design of a custom-made reactor that would allow for direct
observation of hydrate phenomena in water films was undertaken. A technical draw-
ing of the high-pressure crystallizer is presented in Appendix A. Together with the
novel experimental setup, a unique technique was developed in order to observe
methane clathrates as they form on water films. The application of this viewing
technique revealed several features of hydrate morphology that were previously un-
known.
1To be submitted to the AICHE Journal.
38
CHAPTER 4. FILMS 39
4.2 Abstract
Methane clathrate formation on water films without previous hydrate forma-tion history was studied with the aid of high resolution video microscopy.It was found that hydrates form in two layers, each with a clearly distinctmorphology. As the clathrate aged this difference in morphology tended todisappear giving way to a rough surface, uniform throughout the hydratefilm. Higher driving forces produced smaller hydrate grains and smoothersurfaces than lower driving forces within the water film. The converse wastrue for hydrate formed on the periphery. A third hydrate layer growing out-side of the original water boundary was also observed. It was shown for thefirst time that this growing front could create a “bridge” between segregatedwater droplets and thus induce nucleation. Hydrate reformation was alsostudied and it was found that it proceeded in a different manner than that ofa system without previous clathrate formation history. For reformation, nu-cleation occurred within the film and a circular hydrate front(s) with uniformmorphology advanced towards the periphery of the water film. Dissociationstarted at the perimeter of the hydrate layer and proceeded until gas bubbleswere observed within the film; moreover, as hydrate decomposition becameubiquitous water was seen to recede until it regained its original shape.
4.3 Introduction
Clathrate hydrates are non-stoichiometric, crystalline compounds that form when
small molecules come in contact with water at appropriate temperatures and pres-
sures. The terms “gas hydrates” and “clathrate hydrates” are now used interchange-
ably to designate this kind of compounds (Englezos, 1993). Natural-gas hydrates are
abundantly found in the ocean bottom, and to a lesser extent in permafrost regions
(Sloan, 2003). Conservative estimates suggest that the amount of energy stored in
natural hydrates is at least twice that of all other fossil fuels combined (Kvenvolden,
2002). In addition, trapping carbon dioxide as a hydrate in the bottom of the ocean
has been proposed as an alternative to reduce increasing atmospheric CO2 concen-
tration (Brewer, 2000). Hydrates may also play a key role in the global carbon cycle
(Kvenvolden, 2002) and could constitute an alternative mean to transport natural
CHAPTER 4. FILMS 40
gas (Brewer et al., 1997).
Morphology studies increase our understanding of hydrate nucleation, growth
and dissociation mechanisms, thus allowing us to develop appropriate models for
these processes. Pioneering morphology work was done by Makogon and co-workers
(1997) and by Maini and Bishnoi (1981). Other early observational studies include
that of Mori and Mori (1989b,a) on refrigerants, that of Hwang et al. (1990) on
methane hydrate formed from ice supported on stainless-steel discs and that of
Long and Sloan (1996) on methane and CO2 hydrate grown inside a sapphire tube.
Sugaya and Mori (1996) presented one of the first studies on hydrates formed
from bubbles of a fluorocarbon immersed in water; it was found that the surface
morphology of the hydrate layer formed at the interface depends strongly on the
degree of saturation of the water phase with the guest component. Ohmura and
Mori (1999) expanded the study of Sugaya and Mori (1996) to include a different
type of refrigerant; in addition, it was hypothesized that a concentration driving
force could explain the differences in morphology observed at high and low driving
forces. The crystal-growth behavior of structure I, structure II and structure H was
described by Smelik and King (1997); it was proposed that the characteristic crystal
morphology of each structure could be used to identify hydrate types in situ.
Uchida and co-workers have published a number of articles on the morphology of
CO2 hydrate (1996; 1999; 2000b; 2002). The first paper focused on determining the
interfacial tension between liquid CO2, water and hydrate, yet illustrations of their
observations were also provided (Uchida and Kawabata, 1996). Later on, still frames
of video recordings of hydrate formation on water droplets suspended in liquid CO2
were presented (Uchida et al., 1999). It was concluded that hydrates formed initially
at the interface between the two fluids and proceeded until complete coverage of
the water droplet; on some occasions secondary nucleation was also observed inside
the water droplet (Uchida et al., 1999). Uchida et al. (2002) measured the lateral
growth rates of CO2 hydrate films on water bubbles to range from 6 to 15 mm/s, and
concluded that sub cooling was the parameter that highly determined the growth
rate of the crystal.
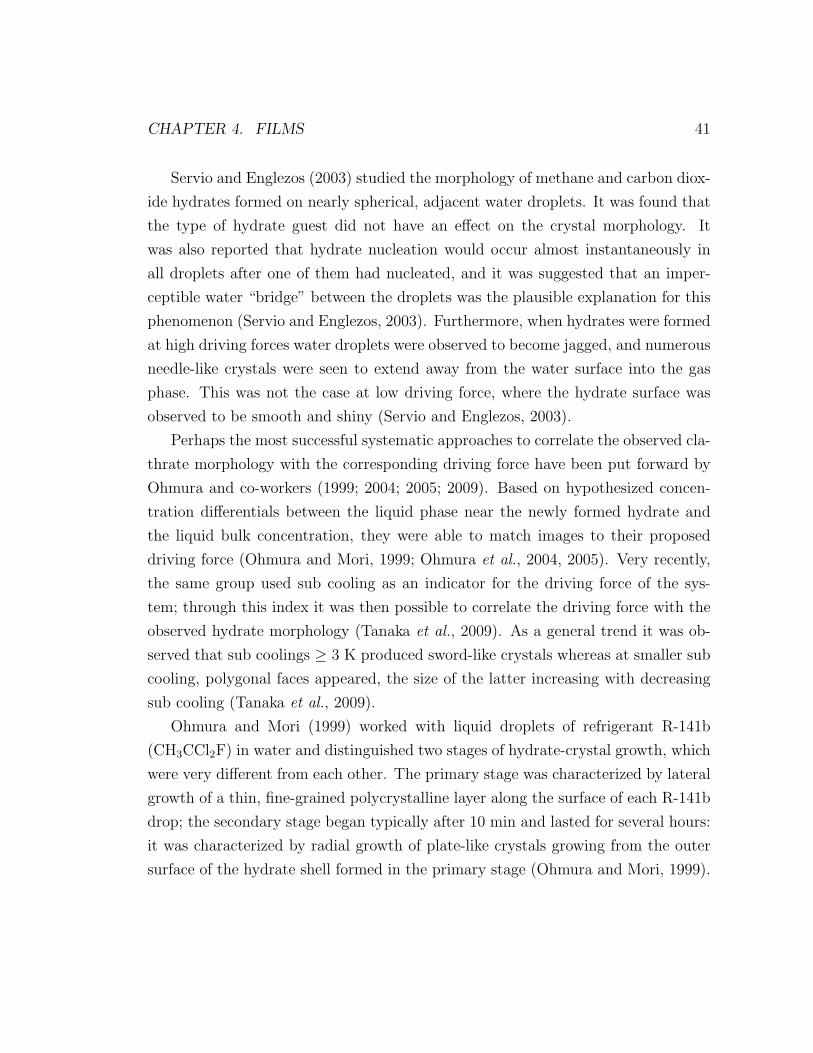
CHAPTER 4. FILMS 41
Servio and Englezos (2003) studied the morphology of methane and carbon diox-
ide hydrates formed on nearly spherical, adjacent water droplets. It was found that
the type of hydrate guest did not have an effect on the crystal morphology. It
was also reported that hydrate nucleation would occur almost instantaneously in
all droplets after one of them had nucleated, and it was suggested that an imper-
ceptible water “bridge” between the droplets was the plausible explanation for this
phenomenon (Servio and Englezos, 2003). Furthermore, when hydrates were formed
at high driving forces water droplets were observed to become jagged, and numerous
needle-like crystals were seen to extend away from the water surface into the gas
phase. This was not the case at low driving force, where the hydrate surface was
observed to be smooth and shiny (Servio and Englezos, 2003).
Perhaps the most successful systematic approaches to correlate the observed cla-
thrate morphology with the corresponding driving force have been put forward by
Ohmura and co-workers (1999; 2004; 2005; 2009). Based on hypothesized concen-
tration differentials between the liquid phase near the newly formed hydrate and
the liquid bulk concentration, they were able to match images to their proposed
driving force (Ohmura and Mori, 1999; Ohmura et al., 2004, 2005). Very recently,
the same group used sub cooling as an indicator for the driving force of the sys-
tem; through this index it was then possible to correlate the driving force with the
observed hydrate morphology (Tanaka et al., 2009). As a general trend it was ob-
served that sub coolings ≥ 3 K produced sword-like crystals whereas at smaller sub
cooling, polygonal faces appeared, the size of the latter increasing with decreasing
sub cooling (Tanaka et al., 2009).
Ohmura and Mori (1999) worked with liquid droplets of refrigerant R-141b
(CH3CCl2F) in water and distinguished two stages of hydrate-crystal growth, which
were very different from each other. The primary stage was characterized by lateral
growth of a thin, fine-grained polycrystalline layer along the surface of each R-141b
drop; the secondary stage began typically after 10 min and lasted for several hours:
it was characterized by radial growth of plate-like crystals growing from the outer
surface of the hydrate shell formed in the primary stage (Ohmura and Mori, 1999).
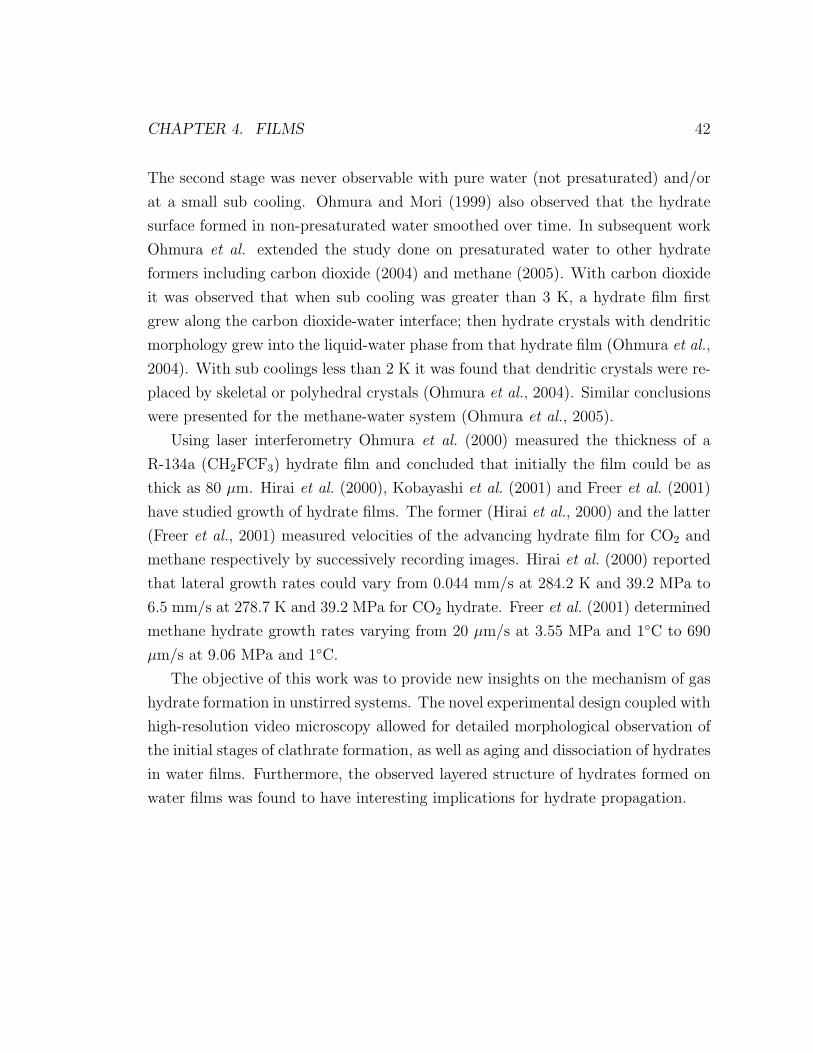
CHAPTER 4. FILMS 42
The second stage was never observable with pure water (not presaturated) and/or
at a small sub cooling. Ohmura and Mori (1999) also observed that the hydrate
surface formed in non-presaturated water smoothed over time. In subsequent work
Ohmura et al. extended the study done on presaturated water to other hydrate
formers including carbon dioxide (2004) and methane (2005). With carbon dioxide
it was observed that when sub cooling was greater than 3 K, a hydrate film first
grew along the carbon dioxide-water interface; then hydrate crystals with dendritic
morphology grew into the liquid-water phase from that hydrate film (Ohmura et al.,
2004). With sub coolings less than 2 K it was found that dendritic crystals were re-
placed by skeletal or polyhedral crystals (Ohmura et al., 2004). Similar conclusions
were presented for the methane-water system (Ohmura et al., 2005).
Using laser interferometry Ohmura et al. (2000) measured the thickness of a
R-134a (CH2FCF3) hydrate film and concluded that initially the film could be as
thick as 80 µm. Hirai et al. (2000), Kobayashi et al. (2001) and Freer et al. (2001)
have studied growth of hydrate films. The former (Hirai et al., 2000) and the latter
(Freer et al., 2001) measured velocities of the advancing hydrate film for CO2 and
methane respectively by successively recording images. Hirai et al. (2000) reported
that lateral growth rates could vary from 0.044 mm/s at 284.2 K and 39.2 MPa to
6.5 mm/s at 278.7 K and 39.2 MPa for CO2 hydrate. Freer et al. (2001) determined
methane hydrate growth rates varying from 20 µm/s at 3.55 MPa and 1◦C to 690
µm/s at 9.06 MPa and 1◦C.
The objective of this work was to provide new insights on the mechanism of gas
hydrate formation in unstirred systems. The novel experimental design coupled with
high-resolution video microscopy allowed for detailed morphological observation of
the initial stages of clathrate formation, as well as aging and dissociation of hydrates
in water films. Furthermore, the observed layered structure of hydrates formed on
water films was found to have interesting implications for hydrate propagation.

CHAPTER 4. FILMS 43
4.4 Experimental Procedure
The experimental design enabled the observation, with the aid of a microscope, of
a nearly planar water film resting on a glass slide, immersed in a methane atmo-
sphere under controlled temperature and pressure. The heart of the setup was a 316
stainless steel cell, fitted with two sapphire windows on the top and bottom (Figure
4.1). The cell had several ports used as follows: to feed gas, to purge gas out of
the cell, to insert a thermocouple, and to communicate pressure to a pressure trans-
ducer. Temperature was measured with a type K mini thermocouple probe (± 1
K), (Omega Engineering, QC Canada). Pressure was monitored with a Rosemount
3051S pressure transducer (Rosemount, MN USA) with an accuracy of ± 0.1 % of
the span. A copper coil, wound around the high pressure cell, and connected to a
Neslab RTE740 refrigerated bath (Fisher Scientific, Canada) was used to circulate
a mixture of ethylene glycol and water (50/50, V/V) to provide the cooling neces-
sary to reach hydrate forming conditions. A Schott KL 2500 (Optikon Corporation,
ON Canada) cold light source fitted with an articulated light pipe illuminated the
interior of the reactor through the bottom window. Images were acquired with a
PCO.2000 (Optikon Corporation, ON Canada) high-resolution video camera fitted
to a configuration of KC Infinity lenses (Optikon Corp, ON Canada) that allowed
an optical magnification of up to 5×. The video camera, the temperature signal,
and the pressure signal were connected to a personal computer in order to acquire
and analyze the data. The high pressure cell, the video camera and the light source
were mounted on an optical table in order to minimize the effect of environmental
vibration.
Before starting an experiment a new, pre-cleaned, microscope glass slide was
cut to fit inside the high pressure cell (Figure 4.1). A drop (35 µL) of distilled,
deionized water was deposited on the glass slide. Methane gas, 99.99 % purity
(MEGS, QC Canada), was then fed to the reactor and the cell content was purged
several times to remove any air inside the reactor. After purging, the pressure in
the reactor was increased well above the hydrate-liquid-vapor equilibrium line for
methane until hydrate nucleation was observed. The experimental conditions for
CHAPTER 4. FILMS 44
video camera
camera lens
glass slide
ports
light pipe
sapphirewindows
Figure 4.1: Simplified schematic of the experimental apparatus.
CHAPTER 4. FILMS 45
Table 4.1: Experimental conditions for hydrate formation on water films withoutprevious hydrate formation history.
Experiment T /K p/MPa Growth beyond water boundary1 274 8.2 Yes2 274 8.2 Yes3 275 3.6 Yes4 275 4.0 Yes
hydrate formation are summarized in tables 4.1 and 4.2. A hydrate formation
experiment was terminated when it became apparent that no liquid water was left
on the microscope slide. At this point, a dissociation experiment was initiated
by slowly decreasing the pressure inside the reactor through the purge port down
to a preset value, and maintained constant thereafter. A dissociation experiment
was terminated after having left the reactor for several hours at a pressure well
below the gas hydrate stability region. An aging experiment consisted in observing
the evolution of formed hydrates while keeping the system well within the hydrate
stability region at constant temperature and pressure.
4.5 Results and Discussion
4.5.1 Nucleation and Growth
Figure 4.2 presents a sequence of still frames of hydrate nucleation and growth
(T = 275 K, p = 3.6 MPa) on a water film with no previous hydrate formation
history. The intact water surface, prior to nucleation, can be seen in figure 4.2a.
Nucleation occurred on the periphery of the water film first; hydrate appeared as
a whiskery structure that grew towards the center of the water film (figure 4.2b).
While clathrate growth proceeded from the edge towards the center, keeping a
whiskered appearance, new nucleation sites became visible as white spots within
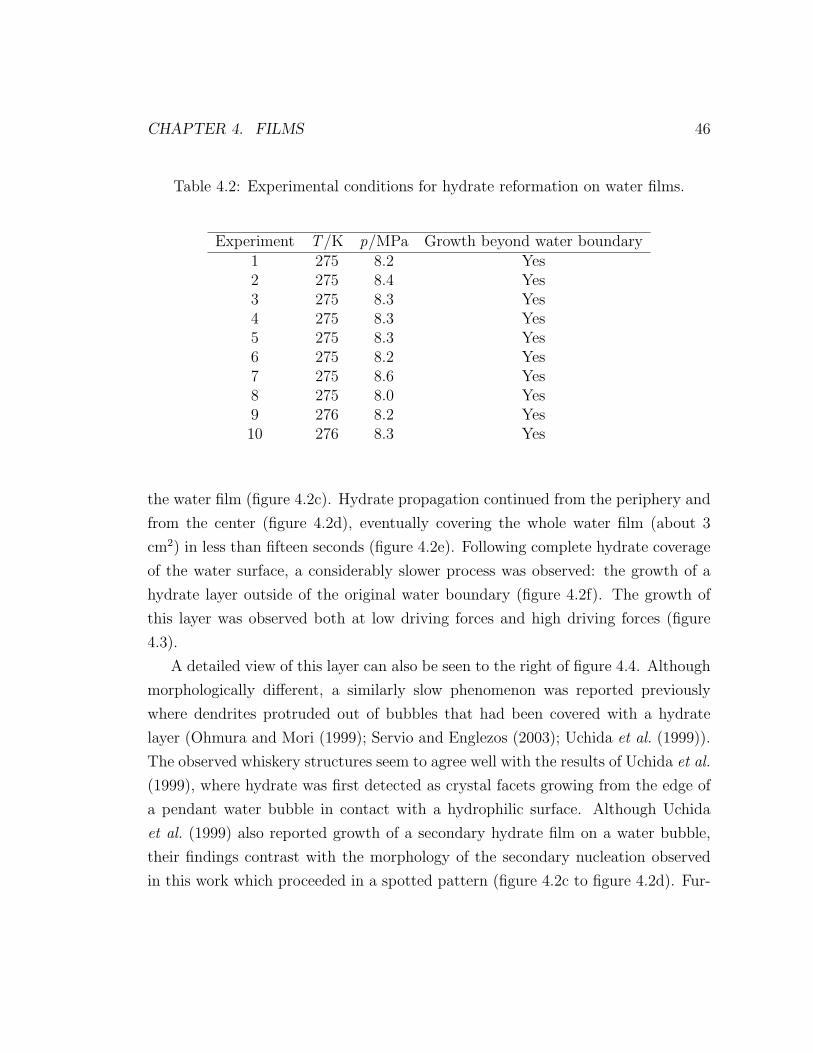
CHAPTER 4. FILMS 46
Table 4.2: Experimental conditions for hydrate reformation on water films.
Experiment T /K p/MPa Growth beyond water boundary1 275 8.2 Yes2 275 8.4 Yes3 275 8.3 Yes4 275 8.3 Yes5 275 8.3 Yes6 275 8.2 Yes7 275 8.6 Yes8 275 8.0 Yes9 276 8.2 Yes10 276 8.3 Yes
the water film (figure 4.2c). Hydrate propagation continued from the periphery and
from the center (figure 4.2d), eventually covering the whole water film (about 3
cm2) in less than fifteen seconds (figure 4.2e). Following complete hydrate coverage
of the water surface, a considerably slower process was observed: the growth of a
hydrate layer outside of the original water boundary (figure 4.2f). The growth of
this layer was observed both at low driving forces and high driving forces (figure
4.3).
A detailed view of this layer can also be seen to the right of figure 4.4. Although
morphologically different, a similarly slow phenomenon was reported previously
where dendrites protruded out of bubbles that had been covered with a hydrate
layer (Ohmura and Mori (1999); Servio and Englezos (2003); Uchida et al. (1999)).
The observed whiskery structures seem to agree well with the results of Uchida et al.
(1999), where hydrate was first detected as crystal facets growing from the edge of
a pendant water bubble in contact with a hydrophilic surface. Although Uchida
et al. (1999) also reported growth of a secondary hydrate film on a water bubble,
their findings contrast with the morphology of the secondary nucleation observed
in this work which proceeded in a spotted pattern (figure 4.2c to figure 4.2d). Fur-
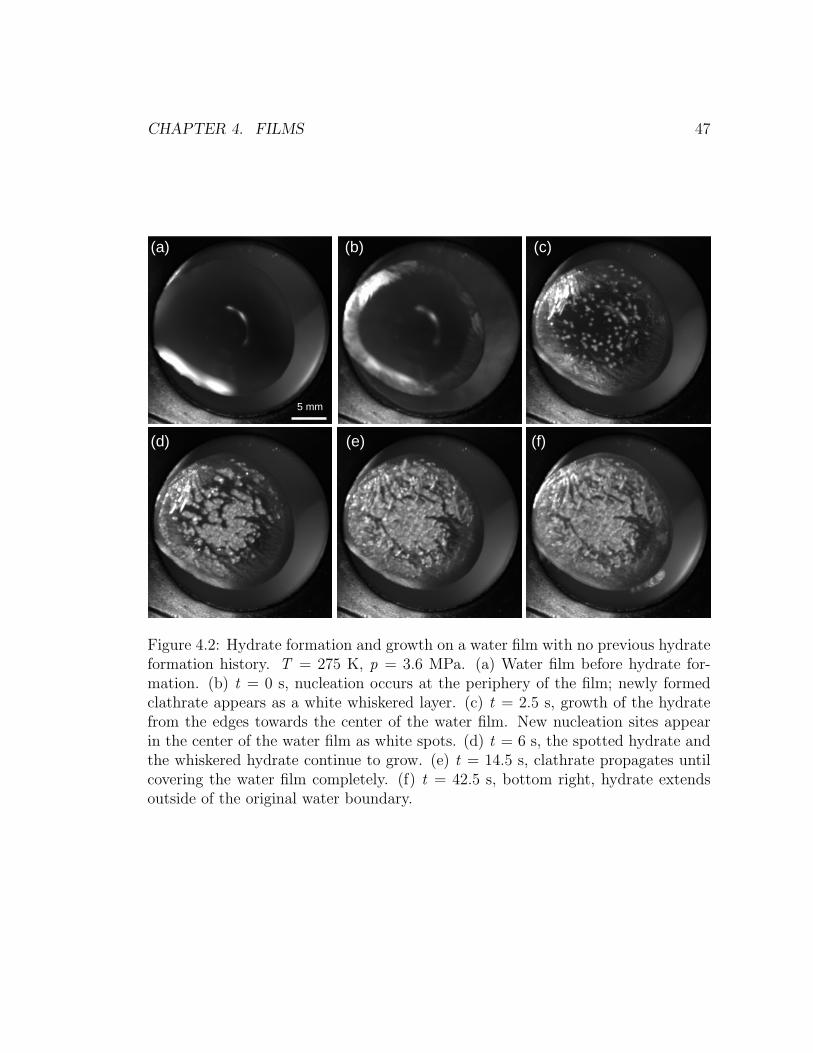
CHAPTER 4. FILMS 47
5 mm
(a) (b) (c)
(d) (e) (f)
Figure 4.2: Hydrate formation and growth on a water film with no previous hydrateformation history. T = 275 K, p = 3.6 MPa. (a) Water film before hydrate for-mation. (b) t = 0 s, nucleation occurs at the periphery of the film; newly formedclathrate appears as a white whiskered layer. (c) t = 2.5 s, growth of the hydratefrom the edges towards the center of the water film. New nucleation sites appearin the center of the water film as white spots. (d) t = 6 s, the spotted hydrate andthe whiskered hydrate continue to grow. (e) t = 14.5 s, clathrate propagates untilcovering the water film completely. (f) t = 42.5 s, bottom right, hydrate extendsoutside of the original water boundary.
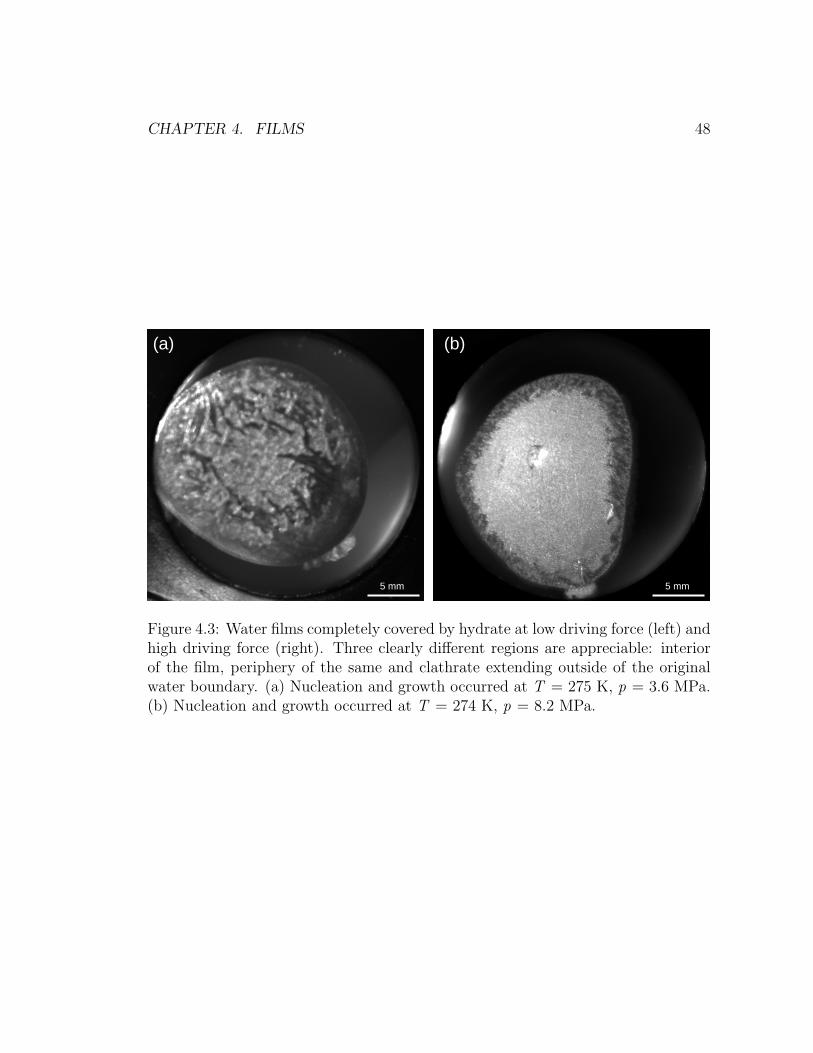
CHAPTER 4. FILMS 48
5 mm
5 mm 5 mm5 mm
(a) (b)
Figure 4.3: Water films completely covered by hydrate at low driving force (left) andhigh driving force (right). Three clearly different regions are appreciable: interiorof the film, periphery of the same and clathrate extending outside of the originalwater boundary. (a) Nucleation and growth occurred at T = 275 K, p = 3.6 MPa.(b) Nucleation and growth occurred at T = 274 K, p = 8.2 MPa.
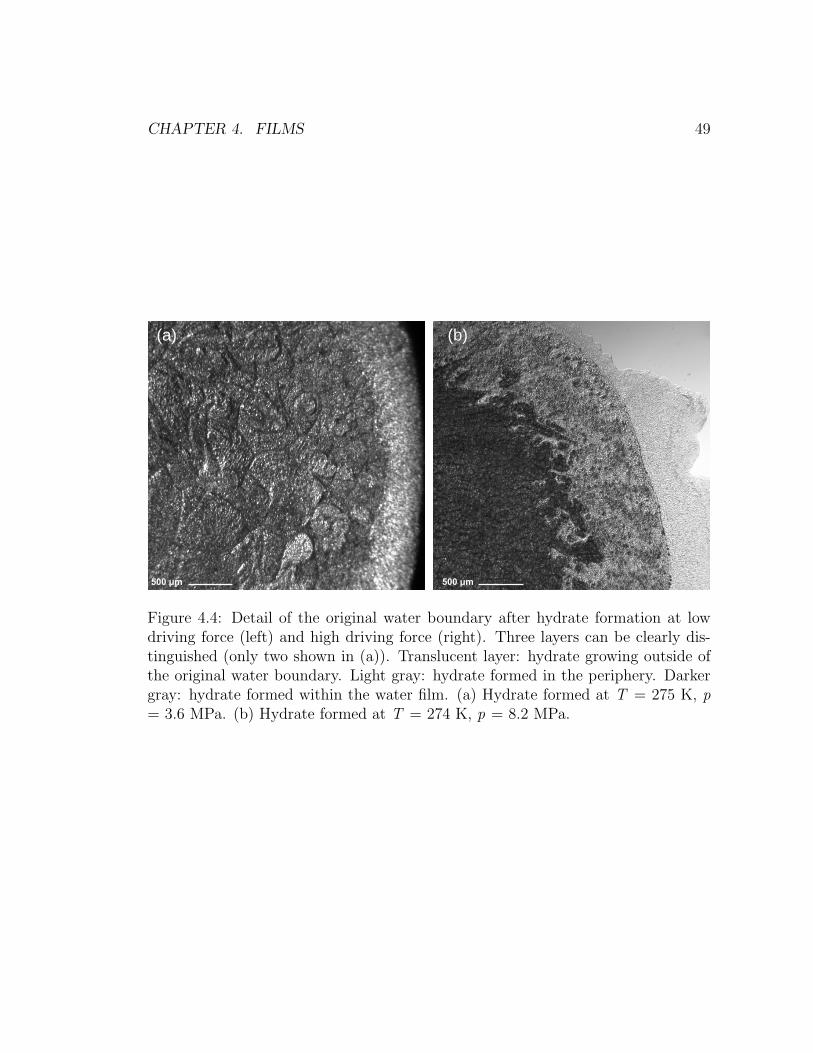
CHAPTER 4. FILMS 49
500 μm 500 μm
(a) (b)
Figure 4.4: Detail of the original water boundary after hydrate formation at lowdriving force (left) and high driving force (right). Three layers can be clearly dis-tinguished (only two shown in (a)). Translucent layer: hydrate growing outside ofthe original water boundary. Light gray: hydrate formed in the periphery. Darkergray: hydrate formed within the water film. (a) Hydrate formed at T = 275 K, p= 3.6 MPa. (b) Hydrate formed at T = 274 K, p = 8.2 MPa.
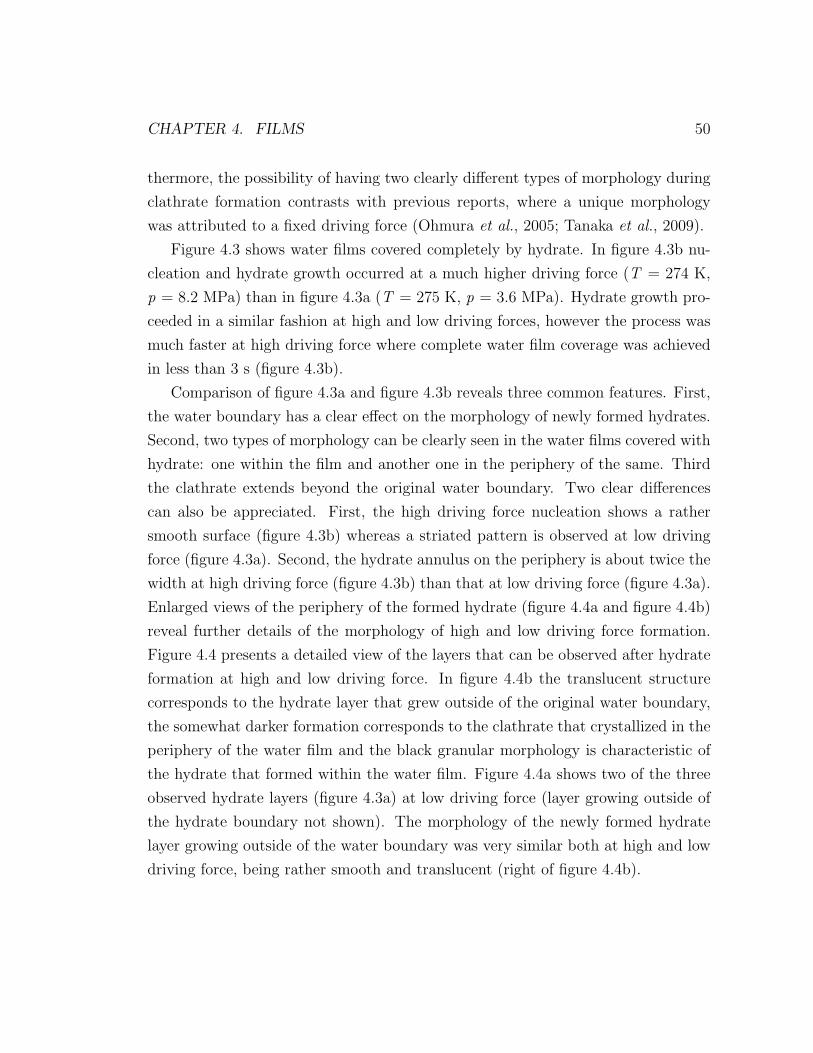
CHAPTER 4. FILMS 50
thermore, the possibility of having two clearly different types of morphology during
clathrate formation contrasts with previous reports, where a unique morphology
was attributed to a fixed driving force (Ohmura et al., 2005; Tanaka et al., 2009).
Figure 4.3 shows water films covered completely by hydrate. In figure 4.3b nu-
cleation and hydrate growth occurred at a much higher driving force (T = 274 K,
p = 8.2 MPa) than in figure 4.3a (T = 275 K, p = 3.6 MPa). Hydrate growth pro-
ceeded in a similar fashion at high and low driving forces, however the process was
much faster at high driving force where complete water film coverage was achieved
in less than 3 s (figure 4.3b).
Comparison of figure 4.3a and figure 4.3b reveals three common features. First,
the water boundary has a clear effect on the morphology of newly formed hydrates.
Second, two types of morphology can be clearly seen in the water films covered with
hydrate: one within the film and another one in the periphery of the same. Third
the clathrate extends beyond the original water boundary. Two clear differences
can also be appreciated. First, the high driving force nucleation shows a rather
smooth surface (figure 4.3b) whereas a striated pattern is observed at low driving
force (figure 4.3a). Second, the hydrate annulus on the periphery is about twice the
width at high driving force (figure 4.3b) than that at low driving force (figure 4.3a).
Enlarged views of the periphery of the formed hydrate (figure 4.4a and figure 4.4b)
reveal further details of the morphology of high and low driving force formation.
Figure 4.4 presents a detailed view of the layers that can be observed after hydrate
formation at high and low driving force. In figure 4.4b the translucent structure
corresponds to the hydrate layer that grew outside of the original water boundary,
the somewhat darker formation corresponds to the clathrate that crystallized in the
periphery of the water film and the black granular morphology is characteristic of
the hydrate that formed within the water film. Figure 4.4a shows two of the three
observed hydrate layers (figure 4.3a) at low driving force (layer growing outside of
the hydrate boundary not shown). The morphology of the newly formed hydrate
layer growing outside of the water boundary was very similar both at high and low
driving force, being rather smooth and translucent (right of figure 4.4b).
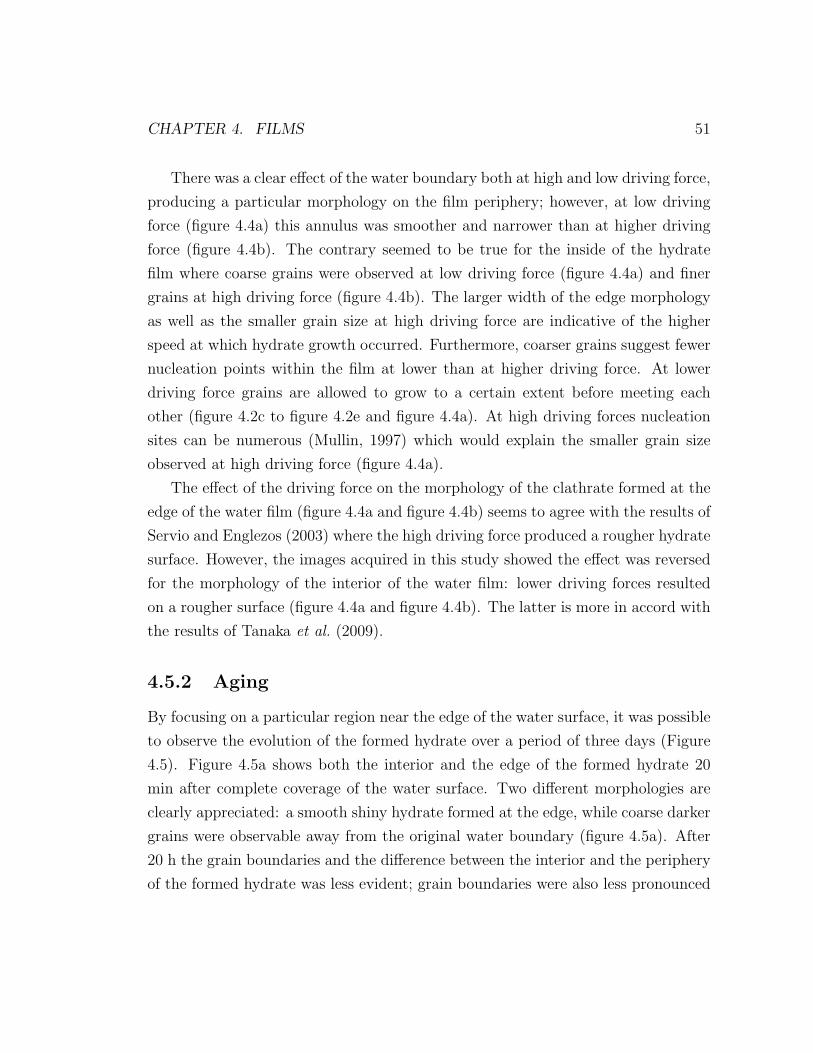
CHAPTER 4. FILMS 51
There was a clear effect of the water boundary both at high and low driving force,
producing a particular morphology on the film periphery; however, at low driving
force (figure 4.4a) this annulus was smoother and narrower than at higher driving
force (figure 4.4b). The contrary seemed to be true for the inside of the hydrate
film where coarse grains were observed at low driving force (figure 4.4a) and finer
grains at high driving force (figure 4.4b). The larger width of the edge morphology
as well as the smaller grain size at high driving force are indicative of the higher
speed at which hydrate growth occurred. Furthermore, coarser grains suggest fewer
nucleation points within the film at lower than at higher driving force. At lower
driving force grains are allowed to grow to a certain extent before meeting each
other (figure 4.2c to figure 4.2e and figure 4.4a). At high driving forces nucleation
sites can be numerous (Mullin, 1997) which would explain the smaller grain size
observed at high driving force (figure 4.4a).
The effect of the driving force on the morphology of the clathrate formed at the
edge of the water film (figure 4.4a and figure 4.4b) seems to agree with the results of
Servio and Englezos (2003) where the high driving force produced a rougher hydrate
surface. However, the images acquired in this study showed the effect was reversed
for the morphology of the interior of the water film: lower driving forces resulted
on a rougher surface (figure 4.4a and figure 4.4b). The latter is more in accord with
the results of Tanaka et al. (2009).
4.5.2 Aging
By focusing on a particular region near the edge of the water surface, it was possible
to observe the evolution of the formed hydrate over a period of three days (Figure
4.5). Figure 4.5a shows both the interior and the edge of the formed hydrate 20
min after complete coverage of the water surface. Two different morphologies are
clearly appreciated: a smooth shiny hydrate formed at the edge, while coarse darker
grains were observable away from the original water boundary (figure 4.5a). After
20 h the grain boundaries and the difference between the interior and the periphery
of the formed hydrate was less evident; grain boundaries were also less pronounced

CHAPTER 4. FILMS 52
(a)
(c) (d)
(b)
500 μm
Figure 4.5: Aging effect on hydrate formed on a water film with no previous hydrateformation. T and p were kept at 275 K and 8.0 MPa. t refers to the elapsed timeafter nucleation was observed. (a) t = 20 min, hydrate that forms near the film edgeappears smooth and shiny; towards the interior grain boundaries are evident. (b) t= 20 h, grain boundaries and the edge effect observed in (b) become less evident.(c) t = 51 h, the edge and interior morphologies become almost indiscernible, slightdepressions appear on the surface. (d) t =76 h, only one morphology shows on thehydrate film, grain boundaries have disappeared and small depressions cover theentire surface.
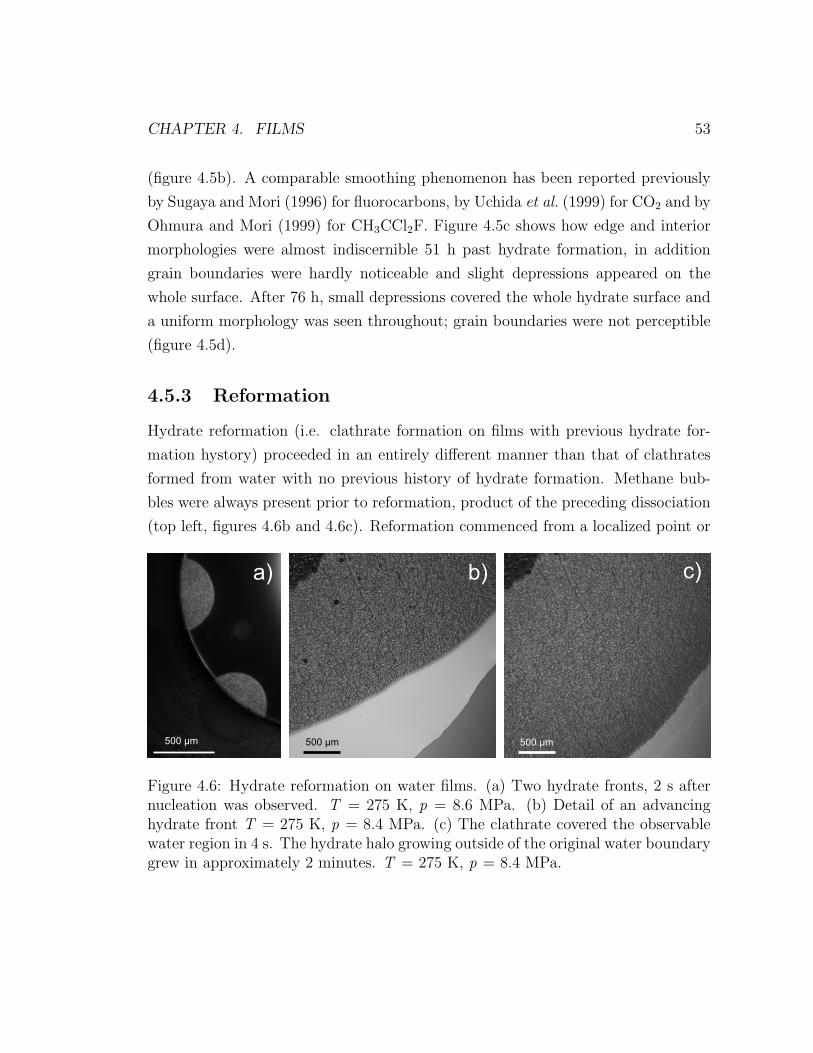
CHAPTER 4. FILMS 53
(figure 4.5b). A comparable smoothing phenomenon has been reported previously
by Sugaya and Mori (1996) for fluorocarbons, by Uchida et al. (1999) for CO2 and by
Ohmura and Mori (1999) for CH3CCl2F. Figure 4.5c shows how edge and interior
morphologies were almost indiscernible 51 h past hydrate formation, in addition
grain boundaries were hardly noticeable and slight depressions appeared on the
whole surface. After 76 h, small depressions covered the whole hydrate surface and
a uniform morphology was seen throughout; grain boundaries were not perceptible
(figure 4.5d).
4.5.3 Reformation
Hydrate reformation (i.e. clathrate formation on films with previous hydrate for-
mation hystory) proceeded in an entirely different manner than that of clathrates
formed from water with no previous history of hydrate formation. Methane bub-
bles were always present prior to reformation, product of the preceding dissociation
(top left, figures 4.6b and 4.6c). Reformation commenced from a localized point or
500 μm500 μm 500 μm
a) b) c)
Figure 4.6: Hydrate reformation on water films. (a) Two hydrate fronts, 2 s afternucleation was observed. T = 275 K, p = 8.6 MPa. (b) Detail of an advancinghydrate front T = 275 K, p = 8.4 MPa. (c) The clathrate covered the observablewater region in 4 s. The hydrate halo growing outside of the original water boundarygrew in approximately 2 minutes. T = 275 K, p = 8.4 MPa.
CHAPTER 4. FILMS 54
points within the water film (Figure 4.6a), and advanced as a circular front(s) until
reaching the edge of the water surface (Figures 4.6b and 4.6c). The type of mor-
phology shown in figure 4.6 seems alike to the one previously shown by Freer et al.
(2001). As was the case with hydrate formation from water films with no previous
hydrate formation history, a translucent hydrate layer grew out of the original water
boundary (bottom right 4.6c), although at a much slower rate than that within the
water surface. Only one type of morphology was evident from reformation exper-
iments inside the original water boundary, in contrast to the results of formation
experiments performed on water with no previous hydrate formation history.
4.5.4 The “Bridge Effect”
As mentioned in the introduction, Servio and Englezos (2003) observed almost si-
multaneous hydrate nucleation in adjacent water droplets, and attributed this phe-
nomenon to an imperceptible water “bridge” that allowed communication across the
polytetrafluoroethylene surface on which their water droplets were placed. Here, the
growth beyond the original water boundary observed for both formation with and
without previous hydrate formation history (Figures 4.3, 4.4b and 4.6c) suggests
that this “bridge effect” is probably due to growth of the clathrate on a foreign
surface free from water (glass in this case). The “bridge effect” was clearly observed
by examining the nucleation and propagation of methane hydrate in segregated
water droplets. Figure 4.7a shows newly formed hydrate (black) on the broadest,
water-covered region that appears in the micrograph’s field of view; an almost im-
perceptible halo (figure 4.7a and figure 4.8a), corresponding to an advancing hydrate
front, surrounds the black hydrate boundary. As the hydrate halo grows outside of
the water boundary, it induces nucleation in a water bubble (figure 4.7b). Clathrate
propagation within a water droplet that has just nucleated can be seen from figure
4.7c to 4.7d. Hydrate halos that grow outside of nucleated water-boundaries induce
nucleation in other water droplets (figure 4.7c, 4.7e, and 4.7f and enlarged view in
figure 4.8b).
Figure 4.7 and Figure 4.8 show a representative example of similar experiments
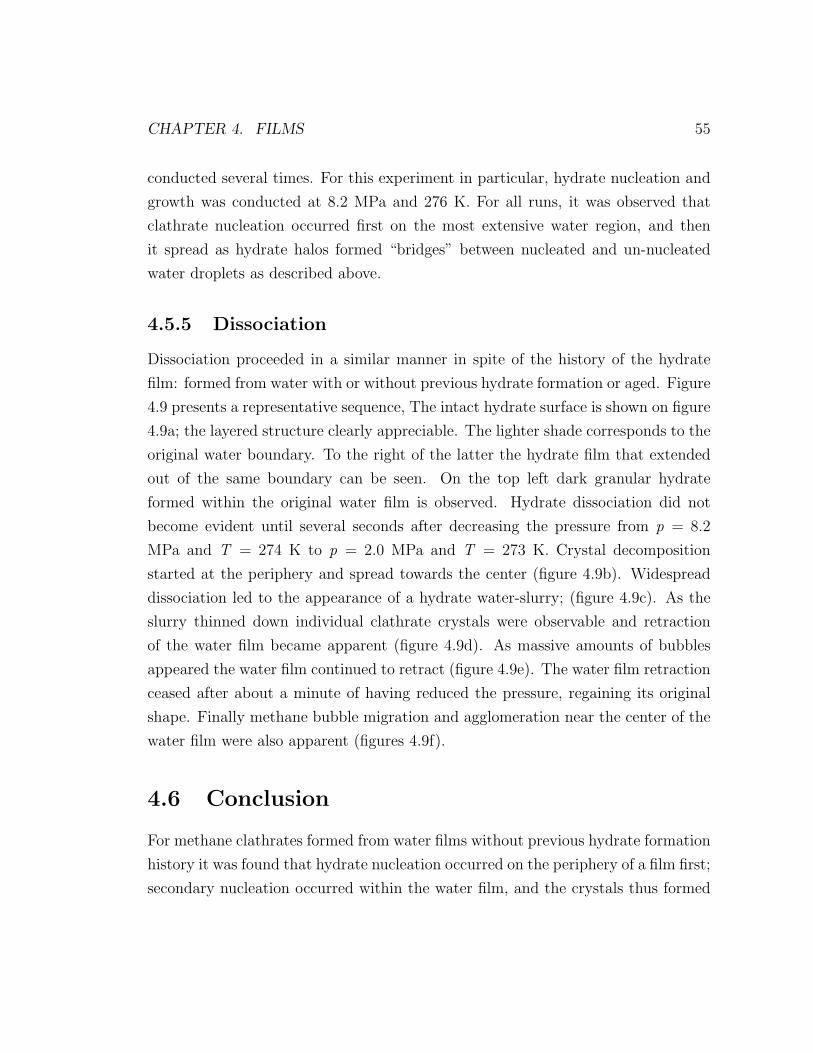
CHAPTER 4. FILMS 55
conducted several times. For this experiment in particular, hydrate nucleation and
growth was conducted at 8.2 MPa and 276 K. For all runs, it was observed that
clathrate nucleation occurred first on the most extensive water region, and then
it spread as hydrate halos formed “bridges” between nucleated and un-nucleated
water droplets as described above.
4.5.5 Dissociation
Dissociation proceeded in a similar manner in spite of the history of the hydrate
film: formed from water with or without previous hydrate formation or aged. Figure
4.9 presents a representative sequence, The intact hydrate surface is shown on figure
4.9a; the layered structure clearly appreciable. The lighter shade corresponds to the
original water boundary. To the right of the latter the hydrate film that extended
out of the same boundary can be seen. On the top left dark granular hydrate
formed within the original water film is observed. Hydrate dissociation did not
become evident until several seconds after decreasing the pressure from p = 8.2
MPa and T = 274 K to p = 2.0 MPa and T = 273 K. Crystal decomposition
started at the periphery and spread towards the center (figure 4.9b). Widespread
dissociation led to the appearance of a hydrate water-slurry; (figure 4.9c). As the
slurry thinned down individual clathrate crystals were observable and retraction
of the water film became apparent (figure 4.9d). As massive amounts of bubbles
appeared the water film continued to retract (figure 4.9e). The water film retraction
ceased after about a minute of having reduced the pressure, regaining its original
shape. Finally methane bubble migration and agglomeration near the center of the
water film were also apparent (figures 4.9f).
4.6 Conclusion
For methane clathrates formed from water films without previous hydrate formation
history it was found that hydrate nucleation occurred on the periphery of a film first;
secondary nucleation occurred within the water film, and the crystals thus formed
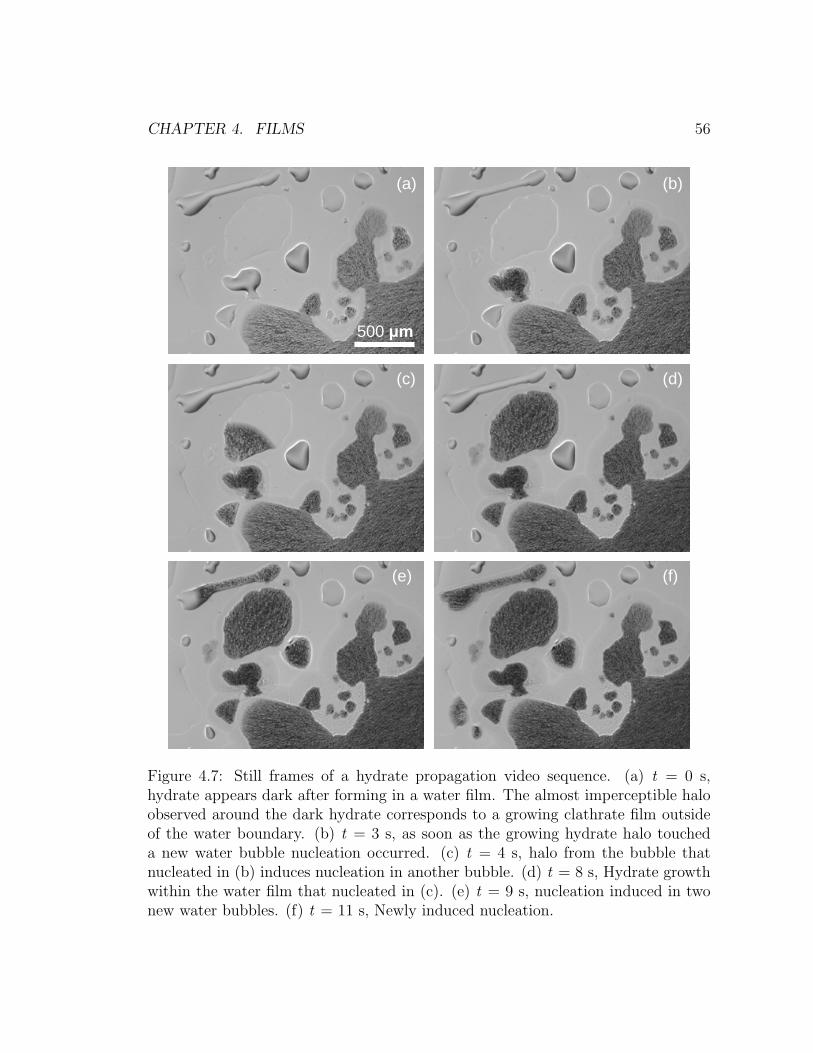
CHAPTER 4. FILMS 56
500 μm
(a) (b)
(c) (d)
(e) (f)
Figure 4.7: Still frames of a hydrate propagation video sequence. (a) t = 0 s,hydrate appears dark after forming in a water film. The almost imperceptible haloobserved around the dark hydrate corresponds to a growing clathrate film outsideof the water boundary. (b) t = 3 s, as soon as the growing hydrate halo toucheda new water bubble nucleation occurred. (c) t = 4 s, halo from the bubble thatnucleated in (b) induces nucleation in another bubble. (d) t = 8 s, Hydrate growthwithin the water film that nucleated in (c). (e) t = 9 s, nucleation induced in twonew water bubbles. (f) t = 11 s, Newly induced nucleation.
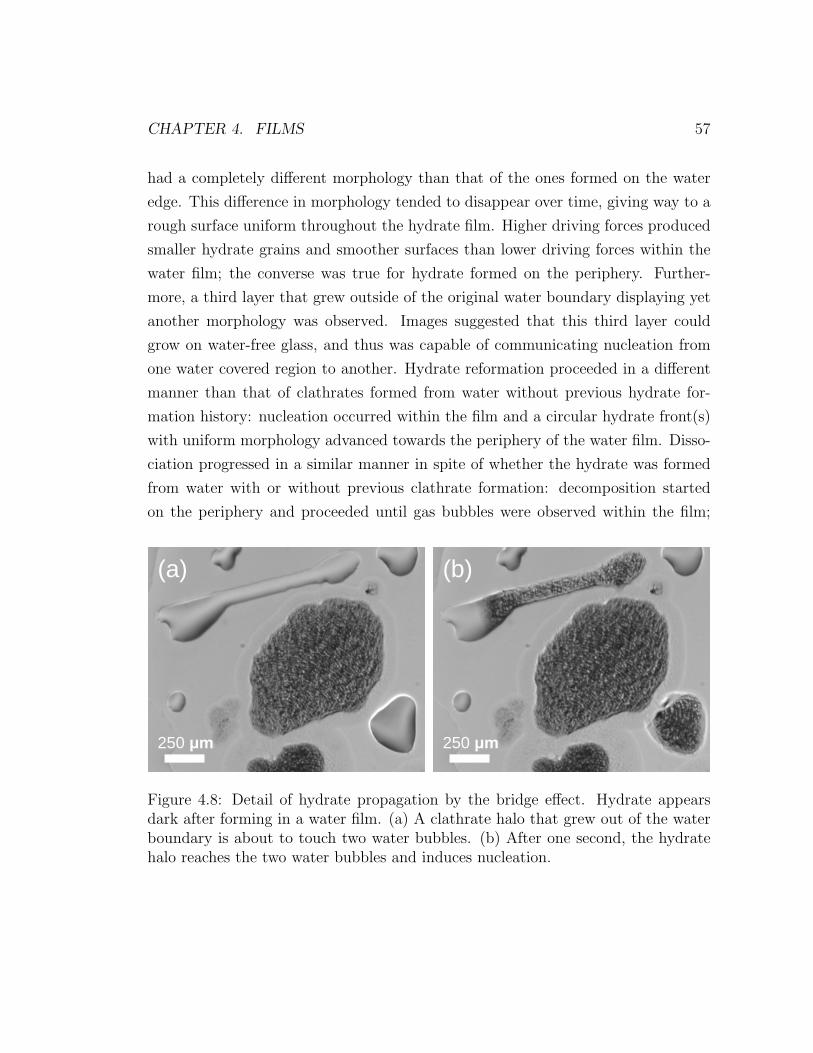
CHAPTER 4. FILMS 57
had a completely different morphology than that of the ones formed on the water
edge. This difference in morphology tended to disappear over time, giving way to a
rough surface uniform throughout the hydrate film. Higher driving forces produced
smaller hydrate grains and smoother surfaces than lower driving forces within the
water film; the converse was true for hydrate formed on the periphery. Further-
more, a third layer that grew outside of the original water boundary displaying yet
another morphology was observed. Images suggested that this third layer could
grow on water-free glass, and thus was capable of communicating nucleation from
one water covered region to another. Hydrate reformation proceeded in a different
manner than that of clathrates formed from water without previous hydrate for-
mation history: nucleation occurred within the film and a circular hydrate front(s)
with uniform morphology advanced towards the periphery of the water film. Disso-
ciation progressed in a similar manner in spite of whether the hydrate was formed
from water with or without previous clathrate formation: decomposition started
on the periphery and proceeded until gas bubbles were observed within the film;
250 μm 250 μm
(b)(a)
Figure 4.8: Detail of hydrate propagation by the bridge effect. Hydrate appearsdark after forming in a water film. (a) A clathrate halo that grew out of the waterboundary is about to touch two water bubbles. (b) After one second, the hydratehalo reaches the two water bubbles and induces nucleation.
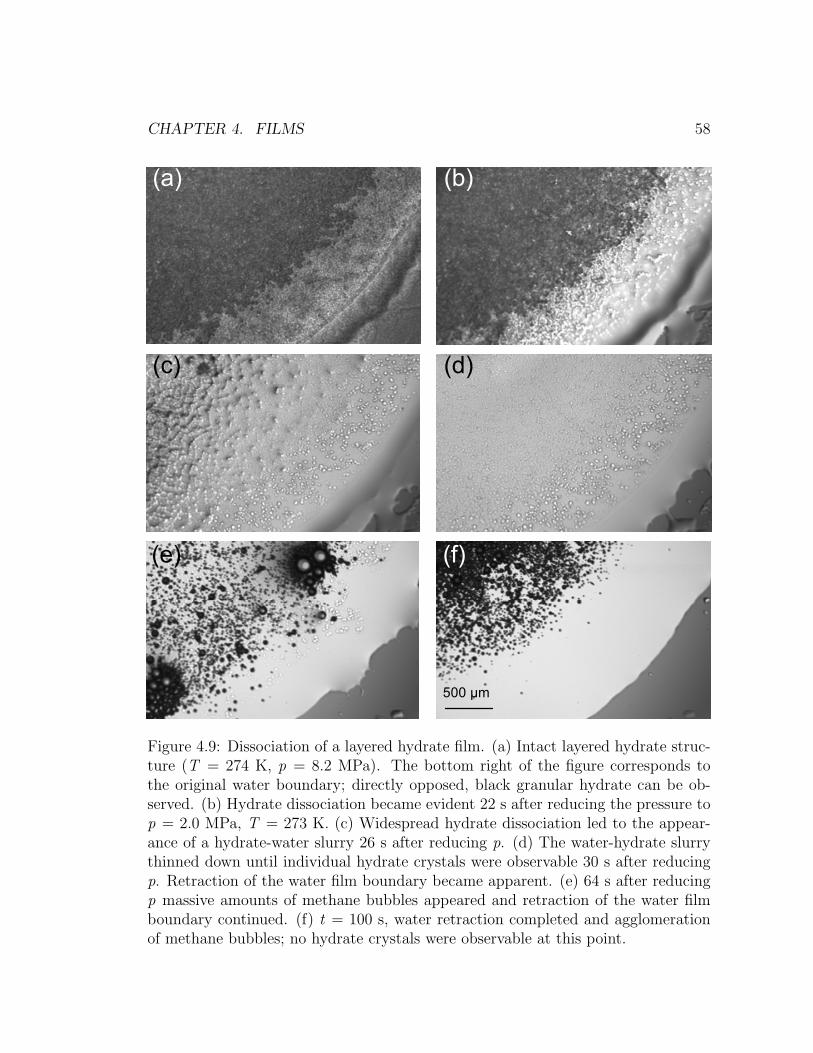
CHAPTER 4. FILMS 58
500 μm
(a) (b)
(c) (d)
(e) (f)
Figure 4.9: Dissociation of a layered hydrate film. (a) Intact layered hydrate struc-ture (T = 274 K, p = 8.2 MPa). The bottom right of the figure corresponds tothe original water boundary; directly opposed, black granular hydrate can be ob-served. (b) Hydrate dissociation became evident 22 s after reducing the pressure top = 2.0 MPa, T = 273 K. (c) Widespread hydrate dissociation led to the appear-ance of a hydrate-water slurry 26 s after reducing p. (d) The water-hydrate slurrythinned down until individual hydrate crystals were observable 30 s after reducingp. Retraction of the water film boundary became apparent. (e) 64 s after reducingp massive amounts of methane bubbles appeared and retraction of the water filmboundary continued. (f) t = 100 s, water retraction completed and agglomerationof methane bubbles; no hydrate crystals were observable at this point.

CHAPTER 4. FILMS 59
moreover, as dissociation became ubiquitous within the film, water receded until the
water film regained its original shape and gas bubbles agglomerated in the center
of the water film.

Chapter 5
Engulfing of Silica Gel Particles
by an Advancing Methane
Clathrate Front1
5.1 Preface
Having studied methane clathrates formed from thin water films (Chapter 4) in-
troducing particles into the system seemed like a reasonable next step considering
hydrates interact with particulate matter in nature (§2.4.1). The results of such
study follow.
5.2 Abstract
The formation and decomposition of methane clathrate in water films con-taining randomly dispersed particles of silica gel were studied. It was observedthat the hydrate front engulfed the silica particles as it advanced at a rela-tively constant velocity of approximately 300 µm/s compared to 700 µm/sfor a silica-free, methane + water system under the same conditions. In ad-
1To be submitted to the Journal of Crystal Growth.
60

CHAPTER 5. SILICA 61
dition, it was found that the growing clathrate could push a methane bubbleand that grain boundary healing could occur after the clathrate contacteda silica particle. Dissociation was found to proceed through two differentmechanisms. In the first, decomposition developed gradually until a hydrate-water slurry was observable, subsequently the slurry thinned down until veryfew crystallites remained visible in the bulk liquid phase. The second typeof dissociation began catastrophically by a sudden fracture in the clathrate.However, the ensuing decomposition occurred as in the first mechanism.
5.3 Introduction
Clathrate hydrates are non-stoichiometric, crystalline compounds that form when
small molecules come in contact with water at appropriate temperatures and pres-
sures. The terms “gas hydrates” and “clathrate hydrates” are now used interchange-
ably to designate this kind of compounds (Englezos, 1993). Natural-gas hydrates
are abundantly found in close interaction with marine sediments, and to a lesser
extent in permafrost regions. Conservative estimates suggest that the amount of
energy stored in natural hydrates is at least twice that of all other fossil fuels com-
bined (Kvenvolden, 2002). In addition, trapping carbon dioxide as a hydrate in
the bottom of the ocean has been proposed as an alternative to reduce increasing
atmospheric CO2 concentration (Brewer, 2000). Our ability to exploit the immense
potential of hydrates, whether it be as an energy source or as way to sequester
CO2, depends greatly on our understanding of clathrates in natural settings, and
an important part of this corpus of knowledge is the behavior of these crystals in
the presence of particles. While the hydrate phenomenon at the hydrate-liquid in-
terface has been investigated extensively, the interaction between such an interface
and foreign particles present in the melt, as a separate phase, has not received as
much attention. Yet observational studies of this kind are of paramount impor-
tance in order to obtain information about mechanisms of hydrate formation and
dissociation.
With the aid of an optical microscope, glass micro models have been used to
study tetrahydrofuran, methane and CO2 hydrate forming inside an asymmetric

CHAPTER 5. SILICA 62
porous network etched into glass micro models (Tohidi et al., 2001). The idea was
further pursued using a symmetric network of straight micro channels to study
both CO2 (Katsuki et al., 2006) and methane hydrates (Katsuki et al., 2007, 2008).
Cryogenic scanning electron microscopy has also been used to compare artificial
methane hydrate + quartz aggregates synthesized from melting ice to natural gas
hydrates (Stern et al., 2004; Stern and Kirby, 2008). Other imaging techniques such
as nuclear magnetic imaging (Mork et al., 2000; Seo et al., 2005; Kvamme et al.,
2007; Ersland et al., 2008) and X-ray computed tomography (Uchida et al., 2000a;
Jin et al., 2004; Kneafsey et al., 2007; Jones et al., 2007) have been utilized as well.
Of particular concern here was whether growing methane hydrate would push
or engulf particles. The importance of this phenomenon in soil mechanics and
permafrost behavior has been recognized for ice (Jackson and Chalmers, 1958; Corte,
1962). Engulfment of a particle is predicted when the free energy for the process
of inclusion is less than zero (Omenyi and Neumann, 1976). When the contrary is
true, rejection or pushing of the particle by the advancing solid front is expected.
However, there is a kinetic limit for this thermodynamic consideration, a critical
velocity above which an advancing front will engulf particles independent of the
thermodynamic prediction (Uhlmann and Chalmers, 1964). Mork et al. (2000)
speculated that growing tetrahydrofuran clathrate could push sand particles apart
upon formation and Nagashima et al. (2008) observed both pushing and engulfing
of particles in contact with THF hydrates.
This papers reports on a first attempt to observe methane hydrate formation
and decomposition while in close interaction with granular material with the aid of
high resolution video microscopy.
5.4 Experimental Apparatus and Procedure
The heart of the setup was a 316 stainless-steel cell, fitted with two sapphire windows
on the top and bottom (Figure 5.1). The cell had several ports used as follows: to
feed gas, to purge gas out of the cell, to insert a thermocouple, and to communicate
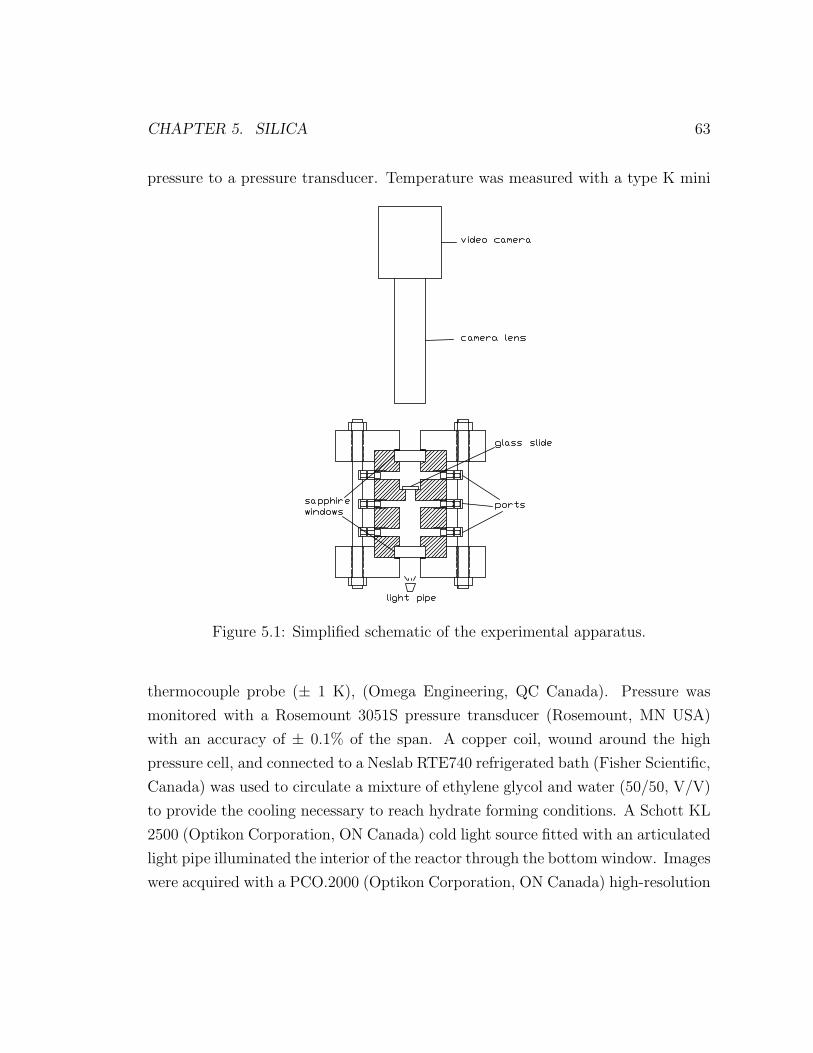
CHAPTER 5. SILICA 63
pressure to a pressure transducer. Temperature was measured with a type K mini
video camera
camera lens
glass slide
ports
light pipe
sapphirewindows
Figure 5.1: Simplified schematic of the experimental apparatus.
thermocouple probe (± 1 K), (Omega Engineering, QC Canada). Pressure was
monitored with a Rosemount 3051S pressure transducer (Rosemount, MN USA)
with an accuracy of ± 0.1% of the span. A copper coil, wound around the high
pressure cell, and connected to a Neslab RTE740 refrigerated bath (Fisher Scientific,
Canada) was used to circulate a mixture of ethylene glycol and water (50/50, V/V)
to provide the cooling necessary to reach hydrate forming conditions. A Schott KL
2500 (Optikon Corporation, ON Canada) cold light source fitted with an articulated
light pipe illuminated the interior of the reactor through the bottom window. Images
were acquired with a PCO.2000 (Optikon Corporation, ON Canada) high-resolution
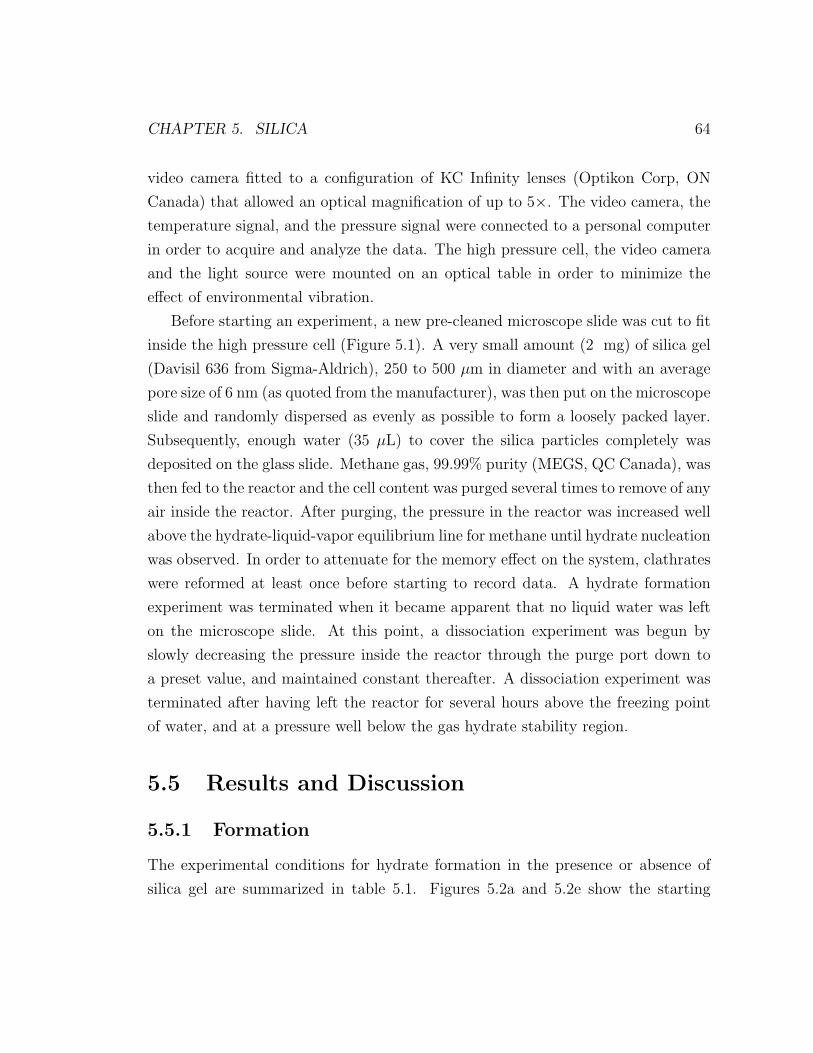
CHAPTER 5. SILICA 64
video camera fitted to a configuration of KC Infinity lenses (Optikon Corp, ON
Canada) that allowed an optical magnification of up to 5×. The video camera, the
temperature signal, and the pressure signal were connected to a personal computer
in order to acquire and analyze the data. The high pressure cell, the video camera
and the light source were mounted on an optical table in order to minimize the
effect of environmental vibration.
Before starting an experiment, a new pre-cleaned microscope slide was cut to fit
inside the high pressure cell (Figure 5.1). A very small amount (2 mg) of silica gel
(Davisil 636 from Sigma-Aldrich), 250 to 500 µm in diameter and with an average
pore size of 6 nm (as quoted from the manufacturer), was then put on the microscope
slide and randomly dispersed as evenly as possible to form a loosely packed layer.
Subsequently, enough water (35 µL) to cover the silica particles completely was
deposited on the glass slide. Methane gas, 99.99% purity (MEGS, QC Canada), was
then fed to the reactor and the cell content was purged several times to remove of any
air inside the reactor. After purging, the pressure in the reactor was increased well
above the hydrate-liquid-vapor equilibrium line for methane until hydrate nucleation
was observed. In order to attenuate for the memory effect on the system, clathrates
were reformed at least once before starting to record data. A hydrate formation
experiment was terminated when it became apparent that no liquid water was left
on the microscope slide. At this point, a dissociation experiment was begun by
slowly decreasing the pressure inside the reactor through the purge port down to
a preset value, and maintained constant thereafter. A dissociation experiment was
terminated after having left the reactor for several hours above the freezing point
of water, and at a pressure well below the gas hydrate stability region.
5.5 Results and Discussion
5.5.1 Formation
The experimental conditions for hydrate formation in the presence or absence of
silica gel are summarized in table 5.1. Figures 5.2a and 5.2e show the starting
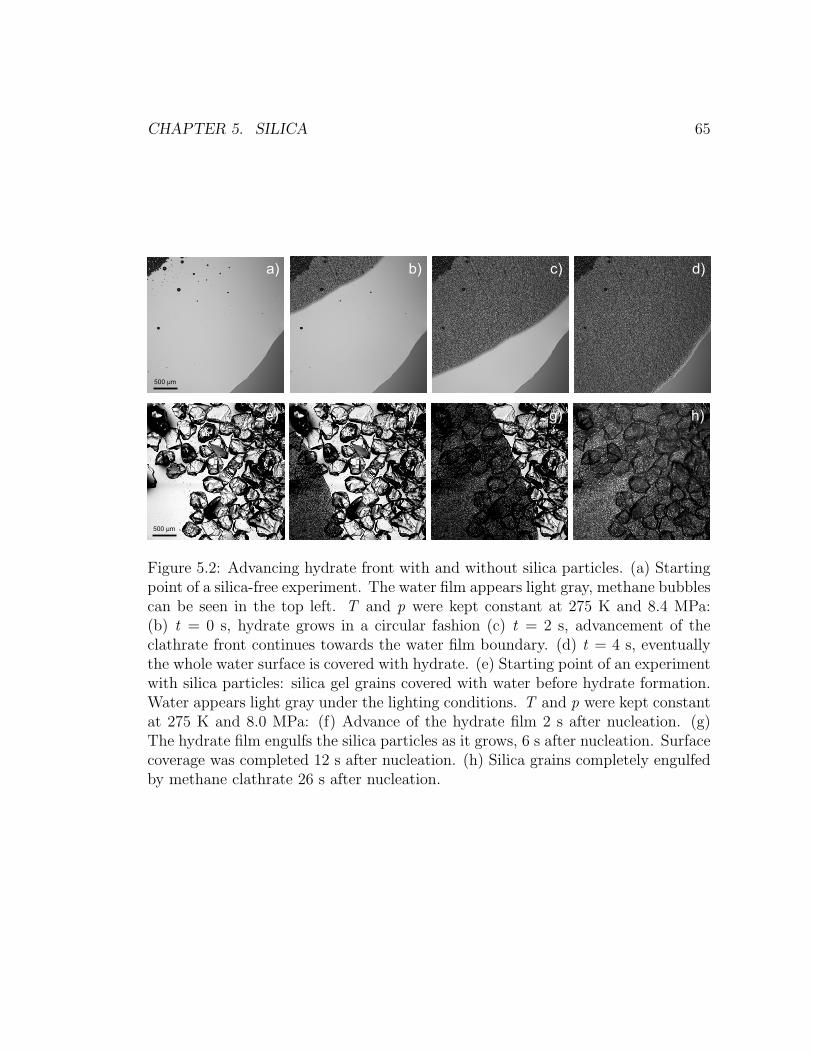
CHAPTER 5. SILICA 65
500 μm
500 μm
a) c) d)
e) f) g) h)
b)
Figure 5.2: Advancing hydrate front with and without silica particles. (a) Startingpoint of a silica-free experiment. The water film appears light gray, methane bubblescan be seen in the top left. T and p were kept constant at 275 K and 8.4 MPa:(b) t = 0 s, hydrate grows in a circular fashion (c) t = 2 s, advancement of theclathrate front continues towards the water film boundary. (d) t = 4 s, eventuallythe whole water surface is covered with hydrate. (e) Starting point of an experimentwith silica particles: silica gel grains covered with water before hydrate formation.Water appears light gray under the lighting conditions. T and p were kept constantat 275 K and 8.0 MPa: (f) Advance of the hydrate film 2 s after nucleation. (g)The hydrate film engulfs the silica particles as it grows, 6 s after nucleation. Surfacecoverage was completed 12 s after nucleation. (h) Silica grains completely engulfedby methane clathrate 26 s after nucleation.
CHAPTER 5. SILICA 66
Table 5.1: Experimental conditions for hydrate reformation in the presence and theabsence of silica gel.
Experiment Silica Present T /K p/MPa1 Yes 275 8.02 Yes 275 8.23 Yes 277 8.04 No 275 8.45 No 275 8.36 No 275 8.3
point of hydrate formation experiments in the absence and presence of silica gel,
respectively. Under the lighting conditions water appears light gray. In both cases
clathrate formation was first evinced by the appearance of a gray translucent film
on the water surface (Figures 5.2b and 5.2f). The hydrate front advanced rapidly on
the water film without silica particles at an estimated, relatively constant velocity
of roughly 700 µm/s (Figure 5.2b to d) whereas the hydrate front in the presence
of silica particles moved at a slower pace of approximately 300 µm/s (Figure 5.2f
to h). The introduction of particles in the methane + water system did not in-
duce morphological changes in the growing clathrate. Both crystal fronts grew in
a circular fashion until complete coverage of the water surface (Figure 5.2), and
particles were engulfed upon contact in the system with silica (Figure 5.2f to h).
In one of the experiments, pushing of a methane bubble (Figure 5.3a), trapping of
the same between the hydrate front and a silica particle (Figure 5.3b) and subse-
quent engulfment by the growing clathrate were observed (Figure 5.3c). There are
three plausible reasons for this. First, pushing becomes more favorable as particle
diameter decreases (Rempel and Worster, 2001). Second, gas bubbles require a
higher velocity for entrapment than solids particles of the same size (Asthana and
Tewari, 1993). Third, the bubble was placed right on the grain boundary which
makes pushing more favorable (Bolling and Cisse, 1971). It is conceivable then

CHAPTER 5. SILICA 67
500 μm
a)
c) d)
b)
Figure 5.3: Pushing, engulfing and healing during hydrate growth. (a) A grainboundary is evident in the growing clathrate (black) 2 s after nucleation. A methanebubble is being pushed at the hydrate front, precisely at the grain boundary. T andp were kept constant at 275 K and 8.2 MPa. (b) 4 s after nucleation the methanebubble can be seen between a silica grain and the advancing clathrate front. (c)Both the methane bubble and the silica grain have been engulfed by the hydrate,6 s after nucleation. (d) The grain boundary is not observable past the point ofcontact of the hydrate front with a silica particle, 16 s after nucleation.
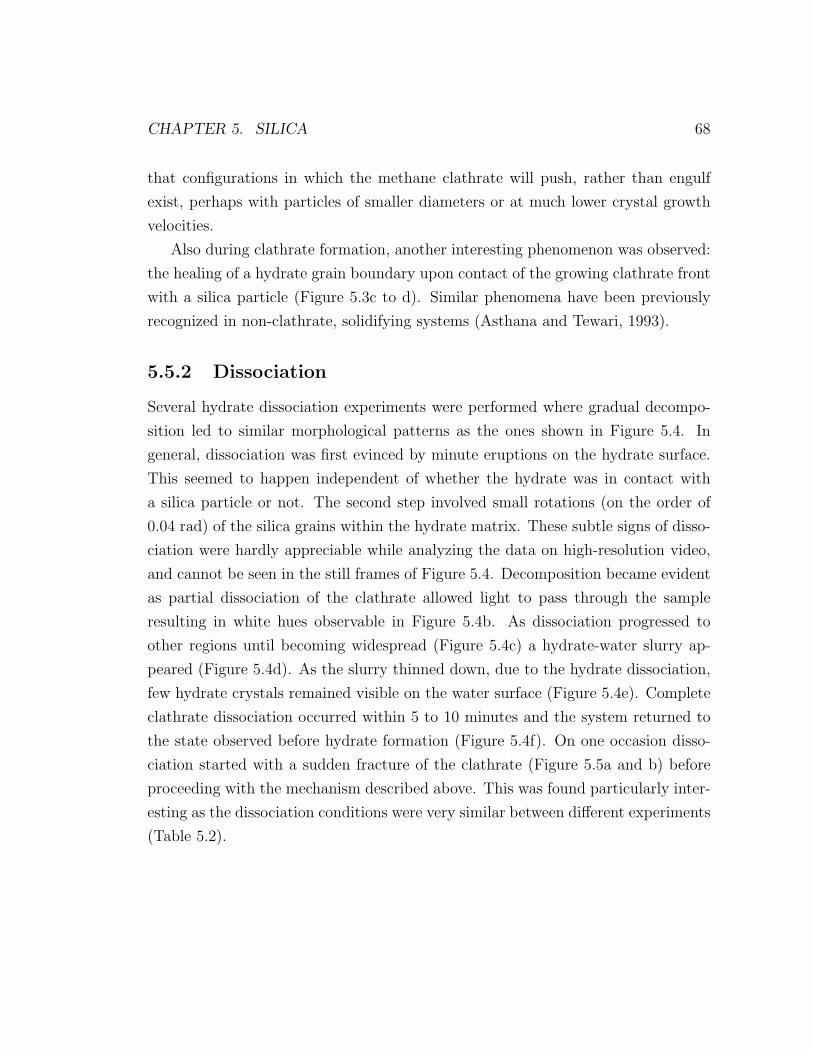
CHAPTER 5. SILICA 68
that configurations in which the methane clathrate will push, rather than engulf
exist, perhaps with particles of smaller diameters or at much lower crystal growth
velocities.
Also during clathrate formation, another interesting phenomenon was observed:
the healing of a hydrate grain boundary upon contact of the growing clathrate front
with a silica particle (Figure 5.3c to d). Similar phenomena have been previously
recognized in non-clathrate, solidifying systems (Asthana and Tewari, 1993).
5.5.2 Dissociation
Several hydrate dissociation experiments were performed where gradual decompo-
sition led to similar morphological patterns as the ones shown in Figure 5.4. In
general, dissociation was first evinced by minute eruptions on the hydrate surface.
This seemed to happen independent of whether the hydrate was in contact with
a silica particle or not. The second step involved small rotations (on the order of
0.04 rad) of the silica grains within the hydrate matrix. These subtle signs of disso-
ciation were hardly appreciable while analyzing the data on high-resolution video,
and cannot be seen in the still frames of Figure 5.4. Decomposition became evident
as partial dissociation of the clathrate allowed light to pass through the sample
resulting in white hues observable in Figure 5.4b. As dissociation progressed to
other regions until becoming widespread (Figure 5.4c) a hydrate-water slurry ap-
peared (Figure 5.4d). As the slurry thinned down, due to the hydrate dissociation,
few hydrate crystals remained visible on the water surface (Figure 5.4e). Complete
clathrate dissociation occurred within 5 to 10 minutes and the system returned to
the state observed before hydrate formation (Figure 5.4f). On one occasion disso-
ciation started with a sudden fracture of the clathrate (Figure 5.5a and b) before
proceeding with the mechanism described above. This was found particularly inter-
esting as the dissociation conditions were very similar between different experiments
(Table 5.2).

CHAPTER 5. SILICA 69
a) b)
c) d)
e) f)
500 μm
Figure 5.4: Gradual dissociation of methane clathrate in contact with silica gelparticles. (a) Intact hydrate 22 s after decreasing the pressure below the hydratestability region. T and p were kept constant at 275 K and 4.0 MPa. (b) Hydratedissociation became evident 42 s after decreasing p. (c) Widespread hydrate disso-ciation 46 s after reducing p. (d) Clathrate decomposition led to the appearance ofa hydrate-water slurry 50 s after reducing p. (e) The water-hydrate slurry thinneddown until few hydrate crystals were observable 1 min after reducing p. Minimal orno methane bubble formation was observed. (f) The system returned to its originalstate 2 min after reducing p.
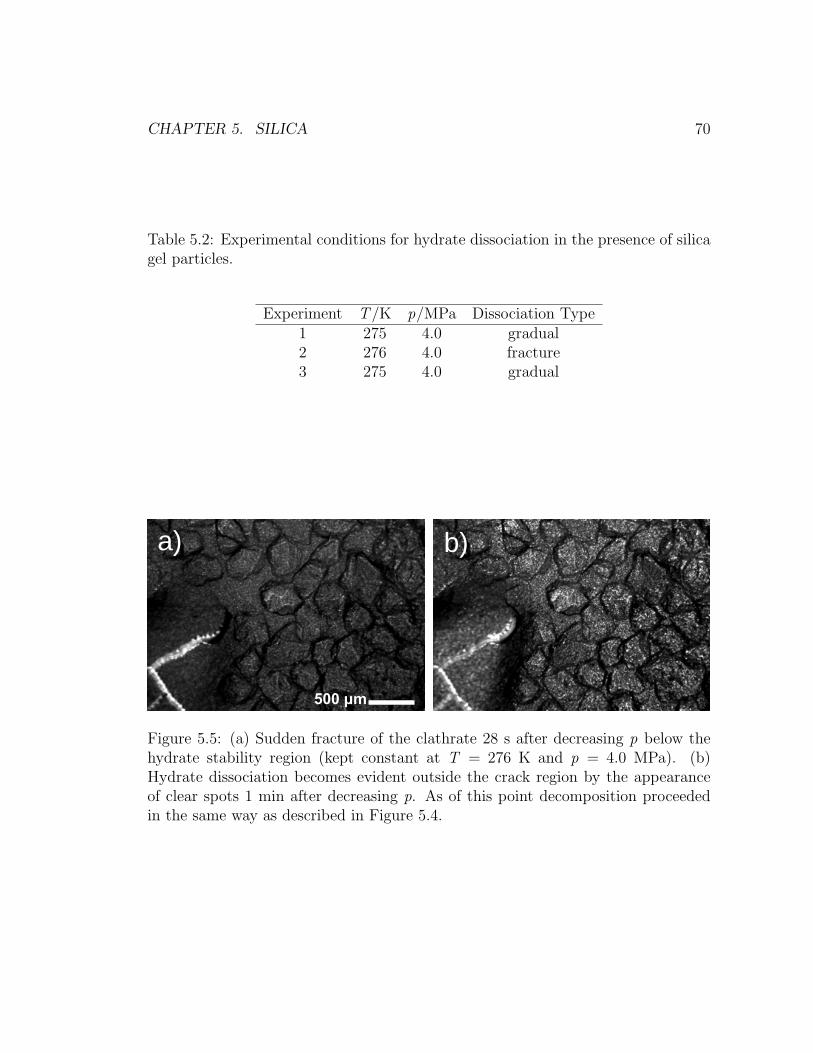
CHAPTER 5. SILICA 70
Table 5.2: Experimental conditions for hydrate dissociation in the presence of silicagel particles.
Experiment T /K p/MPa Dissociation Type1 275 4.0 gradual2 276 4.0 fracture3 275 4.0 gradual
a) b)
500 μm
Figure 5.5: (a) Sudden fracture of the clathrate 28 s after decreasing p below thehydrate stability region (kept constant at T = 276 K and p = 4.0 MPa). (b)Hydrate dissociation becomes evident outside the crack region by the appearanceof clear spots 1 min after decreasing p. As of this point decomposition proceededin the same way as described in Figure 5.4.
CHAPTER 5. SILICA 71
5.6 Conclusion
Methane clathrate formation and decomposition while in contact with silica gel
particles (250 to 500 µm in diameter) were studied with the aid of a novel setup
equipped high resolution video microscopy. It was observed that the hydrate front
engulfed the silica particles as it advanced at a relatively constant velocity of 300
µm/s compared to 700 µm/s for the methane-water system under the same con-
ditions but without the presence of silica gel. Furthermore, it was found that the
growing clathrate could push a methane bubble and it was suggested that this
is indicative of the existence of methane hydrate configurations where pushing of
solid particles by the growing crystal would be possible. In addition, hydrate grain
boundary healing was seen after the clathrate contacted a silica particle. Finally,
clathrate dissociation was found to proceed through two different mechanisms. In
the first, decomposition developed gradually until a hydrate-water slurry was ob-
servable, subsequently the slurry thinned down until very few crystallites remained
visible in the bulk liquid phase. As for the second mechanism, dissociation be-
gan catastrophically by a sudden fracture in the clathrate; however, the ensuing
decomposition occurred as in the first mechanism.

Chapter 6
Comprehensive Conclusion
Phase equilibria and morphology of gas hydrates were the object of study in this
dissertation. Chapter 3 addressed phase equilibria of clathrates while the rest of
the document discussed several aspects of methane hydrate morphology.
Chapter 3 showed a data set that describes the four-phase equilibrium conditions
(hydrate-liquid-liquidaq-vapor) for the system methane + carbon dioxide + neohex-
ane + water. With this data set it was possible to present a theoretically sound
graphical format that allows comparison of structure H and structure I clathrate
equilibrium for systems with two degrees of freedom. The ensuing analysis allowed
for clarification of a common mistake found in hydrate phase-equilibria literature
whereby initial compositions and not the theoretically correct, equilibrium compo-
sitions are used as intensive variables with respect to Gibbs phase rule.
The morphology section started with Chapter 4 where growth of methane clathra-
tes from water films was shown. For methane clathrates formed from water films
without previous hydrate formation history it was found that hydrate nucleation
occurred on the periphery of a film first. Secondary nucleation occurred within the
water film, and crystals thus formed had a completely different morphology than
that of the ones formed on the water edge. This difference in morphology tended to
disappear over time, giving way to a rough surface uniform throughout the hydrate
film. Higher driving forces produced smaller hydrate grains and smoother surfaces
72
CHAPTER 6. COMPREHENSIVE CONCLUSION 73
than lower driving forces within the water film. The converse was true for hy-
drate formed on the periphery. Furthermore, a third layer that grew outside of the
original water boundary displaying yet another morphology was observed. Images
suggested that this third layer could grow on water-free glass, and thus was capable
of communicating nucleation from one water covered region to another. Hydrate
reformation proceeded in a different manner than that of clathrates formed from
water without previous hydrate formation history: nucleation occurred within the
film and a circular hydrate front(s) with uniform morphology advanced towards the
periphery of the water film. Dissociation progressed in a similar manner in spite
of whether the hydrate was formed from water with or without previous clathrate
formation. Decomposition started on the periphery and proceeded until gas bub-
bles were observed within the film. Moreover, as dissociation became ubiquitous
within the film, water receded until the water film regained its original shape and
gas bubbles agglomerated in the center of the water film.
Finally, silica particles were introduced into the methane + water system (Chap-
ter 5) and it was observed that the hydrate front engulfed the silica particles as it
advanced at a relatively constant velocity about half that of the methane-water sys-
tem under the same conditions, but without the presence of silica gel. Furthermore,
it was found that the growing clathrate could push a methane bubble and it was
suggested that this was indicative of the existence of methane hydrate configura-
tions where pushing of solid particles by the growing crystal would be possible. In
addition, hydrate grain-boundary healing was seen after the clathrate contacted a
silica particle. Clathrate dissociation was found to proceed through two different
mechanisms. In the first, decomposition developed gradually until a hydrate-water
slurry was observable, subsequently the slurry thinned down until very few crys-
tallites remained visible in the bulk liquid phase. As for the second mechanism,
dissociation began catastrophically by a sudden fracture in the clathrate; however,
the ensuing decomposition occurred as in the first mechanism.
CHAPTER 6. COMPREHENSIVE CONCLUSION 74
6.1 Recommendations for Future Work
Direct ramifications of the work described herein are presented below:
1. The graphical format and analysis of clathrate equilibrium shown in Chapter 3
is extensible to other systems with two degrees of freedom that might become
of interest to the scientific community. An example may already be found in
the literature (Bruusgaard et al., 2008).
2. The morphology crystallizer has much room for improvement. Perhaps the
most important modification would be to make the methane chamber shorter,
thus a flatter reactor. This is very important for imaging purposes; a closer
focal distance would allow higher magnifications.
3. The high versus low driving force scheme presented in Chapter 4 calls for
systematic work to be done at various levels of driving forces. This would allow
for a generalized classification of morphological features of hydrates formed on
systems without previous formation. Efforts to do this for reformed hydrates
exist in the literature (Ohmura et al., 2004).
4. Studying heat dissipation as hydrates crystallize from water films would be
advantageous before attempting to model the system. The same type of ex-
perimental setup used in this work could be used for that purpose, except an
infrared camera would be required.
5. The “bridge effect” as shown in Chapter 4 opens many research doors. Among
them we find: first, a methodical study, correlating front velocity to driv-
ing forces. Second, a comparison between hydrate “bridging” on hydrophilic
and hydrophobic surfaces. Third, studying the effect of hydrate inhibitors
or promoters on the “bridging” capabilities of a system would give valuable
information regarding the effectiveness of such additives.
6. A first step in direct observation of clathrate interaction with particles at high
pressure was presented in Chapter 5; however, a complete study requires work-
CHAPTER 6. COMPREHENSIVE CONCLUSION 75
ing with different sizes and kinds of particles and introducing a temperature
controlled stage with the aim to manipulate crystal growth velocity. Both of
these approaches with the idea to find the limiting conditions at which pushing
versus engulfing configurations occur.

Original Contributions
The main contributions to knowledge contained in this thesis are summarized below:
1. From Chapter 3, published in the Journal of Chemical Engineering Data, 53:
pp. 1745-1749:
(a) A data set that describes the four-phase equilibrium conditions (hydrate-
liquid-liquidaq-vapor) for the system methane + carbon dioxide + neo-
hexane + water.
(b) A theoretically sound graphical format to compare structure H and struc-
ture I equilibrium for hydrate forming systems with two degrees of free-
dom.
(c) Clarification of a common mistake found in hydrate phase-equilibria lit-
erature whereby initial compositions and not the theoretically correct,
equilibrium compositions are used as intensive variables with respect to
Gibbs phase rule.
2. From Chapter 4, to be submitted to the AICHE Journal :
(a) Finding that clathrates grown in films without previous formation history
form in layers, each with a characteristic morphology that depends on
both the location within the film and the driving force in the system.
(b) Discovering that a hydrate layer can grow on a foreign surface, outside
of a water boundary and communicate nucleation to other regions of the
foreign surface covered with water.
76

CHAPTER 6. COMPREHENSIVE CONCLUSION 77
3. From Chapter 5, to be submitted to the Journal of Crystal Growth:
(a) Observation of the engulfment of particles by an advancing methane
clathrate front occurring at high-pressure.
Other Related Work
Collaboration with other members of Professor Servio’s research group during my
doctoral studies resulted in the following additional manuscripts, not included in
this thesis:
1. Bruusgaard, H.; Beltran, J.G.; and Servio, P. 2008. V-Lw-H equilibrium
data for the system N2 + CO2 + H2O. Journal of Chemical Engineering
Data., 53 pp: 2594–2597.
2. Bergeron, S.; Beltran, J.G.; and Servio, P. Reaction rate constant for methane
clathrate formation. Accepted for publication, June 2009. Fuel.
3. Bergeron, S.; Beltran, J.G.; Macchi, A.; and Servio, P. (under review).
Theoretical pressure dependency of carbon dioxide solubility under hydrate-
liquid water equilibrium. Canadian Journal of Chemical Engineering.
78
Appendix A
Technical Drawing for the
Morphology Reactor
79
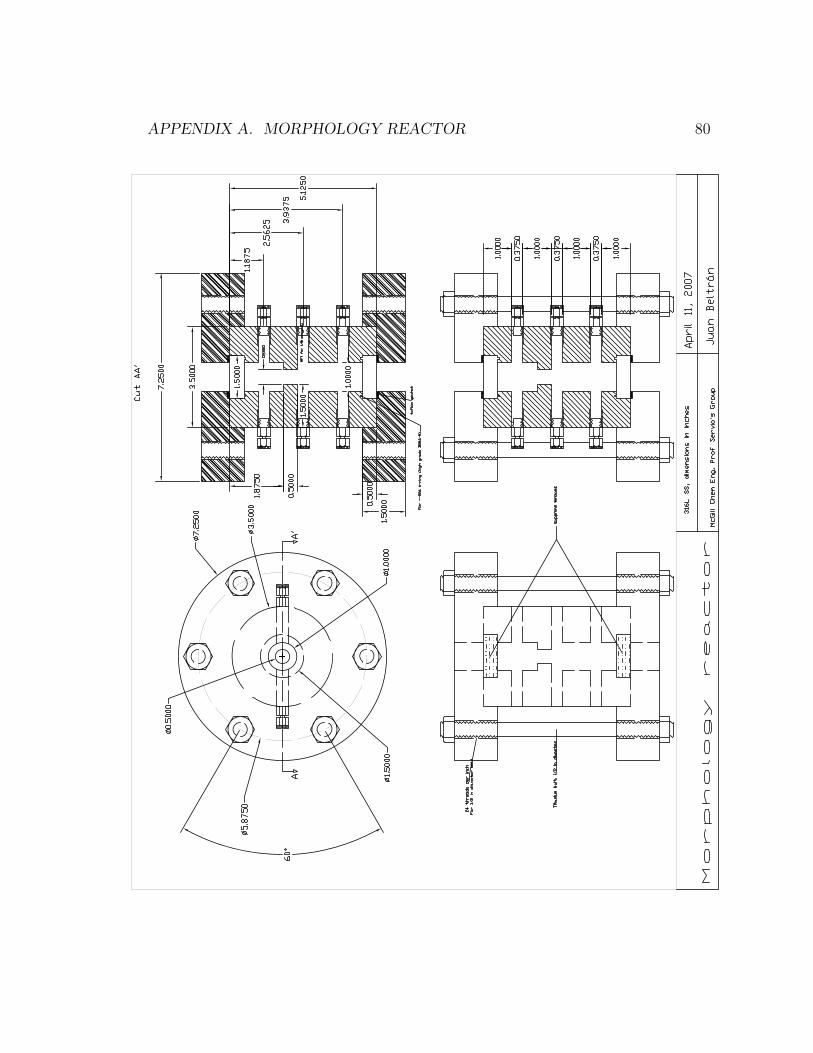
APPENDIX A. MORPHOLOGY REACTOR 80
McG
ill Chem Eng, Prof Serv
io's Group
Apr
il 11, 2007
Juan Beltrán
Morphology reactor
316L SS, d
imens
ions
in
inches
SWAGELOK
SWAGELOK SWAGELOK
SWAGELOK SWAGELOK
SWAGELOK
SWAGELOK
SWAGELOK
SWAGELOK
SWAGELOKSWAGELOK
SWAGELOKSWAGELOK
SWAGELOK
∅7
.2500
∅5
.8750
∅3
.5000
∅1.5000
60°
∅1.0000
∅0
.5000
1.50000.5000
5.1250
7.2500
0.5000
3.5000
1.5000
1.5000
1.0000
NPT for 1/8 swagelok
for --026 o-r
ing (h
igh grade BUNA-N)
teflon gasket
sapph
ire w
indows
Titan
ium bolt
, 1/2
in d
iameter
24 threads per
inch
for 1/2
in d
iameter bolt
AA
'
Cut AA'
1.8750
0.5000
1.1875
3.9375
2.5625
1.0000
0.3750
1.0000
0.3750
1.0000
0.3750
1.0000
Bibliography
Adisasmito, S.; Frank, R.J. and Sloan, E.D., 1991. Hydrates of Carbon Dioxide and
Methane Mixtures. Journal of Chemical Engineering Data, 36: 68–71.
Anklam, M. and Firoozabadi, A., 2004. Driving force and composition for multicom-
ponent gas hydrate nucleation from supersaturated aqueous solutions. Journal of
Chemical Physics, 121: 11867–11875.
Asthana, R. and Tewari, S., 1993. The engulfment of foreign particles by a freezing
interface. Journal of Materials Science, 28: 5414–5425.
Berecz, E. and Balla-Achs, M., 1983. Gas hydrates. In Studies in Inorganic Chem-
istry 4. Elsevier.
Bergeron, S. and Servio, P., 2008. Reaction Rate Constant of CO2 Hydrate For-
mation and Verification of Old Premises Pertaining to Hydrate Growth Kinetics.
AIChE Journal, 54: 2964–2970.
Bolling, G. and Cisse, J., 1971. A theory for the interaction of particles with a
solidifying front. Journal of Crystal Growth, 10: 56–66.
Brewer, P.G., 2000. Gas hydrates and global climate change. Annals of the New
York Academy of Sciences, 912: 195–199.
Brewer, P.G.; Friederich, G.; Peltzer, E.T. and Orr, F.M., 2008. Direct Experiments
on the Ocean Disposal of Fossil Fuel CO2. Science, 284: 943–945.
81
BIBLIOGRAPHY 82
Brewer, P.G.; Orr, F.M.; Friederich, G.; Kvenvolden, K.A.; Orange, D.L.; Mc-
Farlane, J. and Kirkwood, W., 1997. Deep-ocean field test of methane hydrate
formation from a remotely operated vehicle. Geology, 25: 407–410.
Bruusgaard, H.; Beltran, J. and Servio, P., 2008. V-Lw-H equilibrium data for the
system N2 + CO2 + H2O. Journal of Chemical Engineering Data, 53: 2594–2597.
Chatti, I.; Delahaye, A.; Fournaison, L. and Petitet, J.P., 2005. Benefits and draw-
backs of clathrate hydrates: a review of their areas of interest. Energy Conversion
and Management, 46: 1333–1343.
Corte, A., 1962. Vertical Migration of Particles in Front of a Moving Freezing Plane.
Journal of Geophysical Research, 67: 1085–1090.
Cotton, F.; Wilkinson, G. and Gaus, P., 1995. Basic Inorganic Chemistry. Wiley.
Davy, H., 1811. The Bakerian Lecture: On Some of the Combinations of Oxymuri-
atic Gas and Oxygene, and on the Chemical Relations of These Principles, to
Inflammable Bodies. Philossophical Transactions of the Royal Society of London,
101: 1–35.
Dholabhai, P.D. and Bishnoi, P.R., 1994. Hydrate equilibrium conditions in aque-
ous electrolyte solutions: mixtures of methane and carbon dioxide. Journal of
Chemical Engineering Data, 39: 191–194.
Englezos, P., 1993. Clathrate Hydrates. Industrial and Engineering Chemistry
Research, 32: 1251–1274.
Englezos, P.; Kalogerakis, N.; Dholabhai, P.D. and Bishnoi, P.R., 1987a. Kinetics
of formation of methane and ethane gas hydrates. Chemical Engineering Science,
42: 2647–2658.
Englezos, P.; Kalogerakis, N.; Dholabhai, P.D. and Bishnoi, P.R., 1987b. Kinet-
ics of gas hydrate formation from mixtures of methane and ethane. Chemical
Engineering Science, 42: 2659–2666.
BIBLIOGRAPHY 83
Ersland, G.; Husebo, J.; Graue, A.; Baldwin, B.; Howard, J. and Stevens, J., 2008.
Measuring gas hydrate formation and exchange with CO2 in Betheim sandstone
using MRI Tomograhy. Chemical Engineering Journal, Accepted Manuscript:
doi:10.1016/j.cej.2008.12.028.
Freer, E.M.; Selim, M.S. and Sloan, E.D., 2001. Methane hydrate film growth
kinetics. Fluid phase equilibria, 185: 65–75.
Hammerschmidt, E.G., 1934. Formation of gas hydrates in natural gas transmission
lines. Industrial and Engineering Chemistry Fundamentals, 26: 851–855.
Harrison, W.; Wendlandt, R. and Sloan, D., 1995. Geochemical interactions re-
sulting from carbon dioxide disposal on the seafloor. Applied Geochemistry, 10:
461–475.
Hashemi, S.; Macchi, A. and Servio, P., 2007. Gas Hydrate Growth Model in a
Semibatch Stirred Tank Reactor. Industrial and Engineering Chemistry Research,
46: 5907–5912.
Hirai, S.; Tabe, Y.; Kamijo, S. and Okazaki, K., 2000. Lateral Growth Rates of
CO2 Clathrate-hydrate Film. Thermal Science and Engineering, 8: 1–5.
Holder, G.D.; Corbin, G. and Papadopoulos, K.D., 1980. Thermodynamic and
molecular properties of gas hydrates from mixtures containing methane, argon,
and krypton. Industrial and Engineering Chemistry Fundamentals, 19: 282–286.
Holder, G.D.; Zetts, S.P. and Pradhan, N., 1988. Phase behavior in systems con-
taining clathrate hydrates. Reviews in Chemical Engineering, 5: 1–70.
Hwang, M.J.; Wright, D.A.; Kapur, A. and Holder, G.D., 1990. An experimental
study of crystallization and crystal growth of methane hydrates from melting
ice. Journal of Inclusion Phenomena and Molecular Recognition in Chemistry, 8:
103–116.
BIBLIOGRAPHY 84
Jackson, K.A. and Chalmers, B., 1958. Freezing of liquids in porous media with
special reference to frost heave in soils. Journal of Applied Physics, 29: 1178–
1181.
Jensen, L.; Thomsen, K. and von Solms, N., 2008. Propane hydrate nucleation:
experimental investigation and correlation. Chemical Engineering Science, 63:
3069–3080.
Jin, S.; Takeya, S.; Hayashi, J.; Nagao, J.; Kamata, Y.; Ebinuma, T. and Narita, H.,
2004. Structure analyses of artificial methane hydrate sediments by microfocus
X-ray computed tomography. Japanese Journal of Applied Physics, 43: 5673–
5675.
Jones, K.; Kerkar, P.; Mahajan, D.; Lindquist, W. and Feng, H., 2007. Microstruc-
ture of natural hydrate host sediments. Nuclear Instruments and Methods in
Physics Research B, 261: 504–507.
Kashchiev, D. and Firoozabadi, A., 2002. Driving force for crystallization of gas
hydrates. Journal of Crystal Growth, 241: 220–230.
Katsuki, D.; Ohmura, R.; Ebinuma, T. and Narita, H., 2006. Formation, growth and
ageing of clathrate hydrate crystals in a porous medium. Philosophical Magazine,
86: 1753–1761.
Katsuki, D.; Ohmura, R.; Ebinuma, T. and Narita, H., 2007. Methane hydrate
crystal growth in a porous medium filled with methane saturated liquid water.
Philosophical Magazine, 87: 1057–1069.
Katsuki, D.; Ohmura, R.; Ebinuma, T. and Narita, H., 2008. Visual observation of
dissociation of methane hydrate crystals in a glass micro model: production and
transfer of methanew. Journal of Applied Physics, 104: 083514.
Khokar, A.A.; Gudmundsson, J.S. and Sloan, E.D., 1998. Gas storage in structure
H hydrates. Fluid phase equilibria, 150-151: 383–392.
BIBLIOGRAPHY 85
Kneafsey, T.J.; Tomutsa, L.; Moridis, G.J.; Seol, Y.; Freifeld, B.; Taylor, C.E. and
Gupta, A.K., 2007. Methane hydrate formation and dissociation in a partially
saturated core-scale sand sample. Journal of Petroleum Science and Engineering,
56: 108–126.
Kobayashi, I.; Ito, Y. and Mori, Y.H., 2001. Microscopic observations of clathrate-
hydrate films formed at liquid/liquid interfaces. I. Morphology of hydrate films.
Chemical Engineering Science, 56: 4331–4338.
Kuhs, W.F.; Klapproth, A. and Gotthardt, F., 2000. The formation of meso- and
macroporous gas hydrates. Geophysical Research Letters, 27: 2929–2932.
Kvamme, B.; Graue, A.; Buanes, T.; Kuznetsova, T. and Ersland, G., 2007. Storage
of CO2 in natural gas hydrate reservoirs and the effect of hydrate as an extra
sealing in cold aquifers. International Journal of Greenhouse Gas Control, 1:
236–246.
Kvenvolden, K.A., 2000. Gas hydrate and humans. Annals of the New York Academy
of Sciences, 912: 17–22.
Kvenvolden, K.A., 2002. Methane hydrate in the global organic carbon cycle. Terra
Nova, 14: 302–306.
Long, J.P. and Sloan, E.D., 1996. Hydrates in the Ocean and Evidence for the
Location of Hydrate Formation. International Journal of Thermophysics, 17:
1–13.
Maini, B.B. and Bishnoi, P.R., 1981. Experimental Investigation of Hydrate Forma-
tion Behaviour of a Natural Gas Bubble in a Simulated Deep Sea Environment.
Chemical Engineering Science, 36: 183–189.
Makogon, Y.F., 1965. Hydrate formation in the gas-bearing beds under permafrost
conditions. (English Translation). Gazovaia Promyshlennost, 56: 14–15.
BIBLIOGRAPHY 86
Makogon, Y.F. and Dunlap, W.D., 1997. Hydrates of Hydrocarbons. Penwell Pub-
lishing Company.
Mori, Y.H. and Mori, T., 1989a. Characterization of gas hydrate formation in
direct-contact cool storage process. International Journal of Refrigeration, 12:
259–265.
Mori, Y. and Mori, T., 1989b. Formation of Gas Hydrate with CFC Alternative
R-134a. AIChE Journal, 35: 1227–1228.
Mork, M.; Schei, G. and Larsen, R., 2000. NMR Imaging Study of Hydrates in
Sediments. Annals of the New York Academy of Sciences, 912: 897–905.
Moudrakovski, I.L.; McLaurin, G.E.; Ratcliffe, C.I. and Ripmeester, J.A., 2004.
Methane and Carbon Dioxide Hydrate Formation in Water Droplets: Spatially
Resolved Measurements from Magnetic Resonance Microimaging. Journal of
Physical Chemistry B, 108: 17591–17595.
Moudrakovski, I.L.; Ratcliffe, C.I.; McLaurin, G.E.; Simard, B. and Ripmeester,
J.A., 1999. Hydrate Layers on Ice Particle and Superheated Ice: a 1 H NMR
Microimaging Study. Journal of Physical Chemistry A, 103: 4969–4972.
Mullin, J.W., 1997. Crystallization. Butterworth Heinemann.
Nagashima, K.; Suzuki, T.; Nagamoto, M. and Shimizu, T., 2008. Formation of Pe-
riodic Layered Pattern of Tetrahydrofuran Clathrate Hydrates in Porous Media.
Journal of Physical Chemistry B, 112: 9876–9882.
Natarajan, V.; Bishnoi, P.R. and Kalogerakis, N., 1994. Induction phenomena in
gas hydrate nucleation. Chemical Engineering Science, 49: 2075–2087.
Ohgaki, K.; Takano, K.; Sangawa, H.; Matsubara, T. and Nakano, S., 1996.
Methane exploitation by carbon dioxide from gas hydrate phase equilibria for
CO2 -CH4 mixed hydrate system. Journal of Chemical Engineering of Japan, 29:
478–483.

BIBLIOGRAPHY 87
Ohmura, R.; Kashiwazaki, S. and Mori, Y.H., 2000. Measurements of clathrate-
hydrate film thickness using laser interferometry. Journal of Crystal Growth,
218: 372–380.
Ohmura, R.; Matsuda, S.; Uchida, T.; Ebinuma, T. and Narita, H., 2005. Clathrate
Hydrate Crystal Growth in Liquid Water Saturated with a Guest Substance:
Observations in a Methane + Water System. Crystal Growth and Design, 5:
953–957.
Ohmura, R. and Mori, Y.H., 1999. Formation, growth and dissociation of clathrate
hydrate crystals in liquid water in contact with a hydrophobic hydrate-forming
liquid. Journal of Crystal Growth, 196: 164–173.
Ohmura, R.; Shimada, W.; Uchida, T.; Mori, Y.; Takeya, S.; Nagao, J.; Minagawa,
H.; Ebinuma, T. and Narita, H., 2004. Clathrate hydrate crystal growth in
liquid water saturated with a hydrate-forming subtance: variations in crystal
morphology. Philosophical Magazine, 84: 1–16.
Omenyi, S. and Neumann, A., 1976. Thermodynamic aspects of particle engulfment
by solidifying melts. Journal of Applied Physics, 47: 3956–3962.
Parrish, W.R. and Prausnitz, J.M., 1972. Dissociation pressures of gas hydrates
formed by gas mixtures. Industrial and Engineering Chemistry Process Design
and Development, 11: 26–35.
Rempel, A. and Worster, M., 2001. Particle trapping at an advancing solidification
front with interfacial-curvature effects. Journal of Crystal Growth, 223: 420–432.
Ripmeester, J.A.; Tse, J.S.; Ratcliff, C.I. and Powell, B.M., 1987. A new clathrate
hydrate structure. Nature, 325: 135–136.
Sassen, R. and Macdonald, I.R., 1994. Evidence of structure H hydrate, Gulf of
Mexico continental slope. Organic Geochemistry, 22: 1029–1032.
BIBLIOGRAPHY 88
Schicks, J.M. and Ripmeester, J.A., 2004. The Coexistence of Two Different
Methane Hydrate Phases under Moderate Pressure and Temperature Conditions:
Kinetic versus Thermodynamic Products. Angewandte Chemie International Edi-
tion, 43: 3310–3313.
Seo, Y. and Lee, H., 2001. Multiple-Phase Hydrate Equilibria of the Ternary Carbon
Dioxide, Methane, and Water Mixtures. Journal of Physical Chemistry B, 105:
10084–10090.
Seo, Y.T.; Moudrakovski, I.L.; Ripmeester, J.A.; Lee, J.W. and Lee, H., 2005.
Efficient recovery of CO 2 from flue gas by clathrate hydrate formation in porous
silica gels. Environmental Science and Technology, 29: 2315–2319.
Servio, P. and Englezos, P., 2003. Morphology of Methane and Carbon Dioxide
Hydrates Formed from Water Droplets. AIChE Journal, 49: 269–276.
Servio, P.; Lagers, F.; Peters, C. and Englezos, P., 1999. Gas hydrate phase equi-
librium in the system methane-carbon dioxide-neohexane and water. Fluid phase
equilibria, 158-160: 795–800.
Skovborg, P.; Ng, H.J. and Rasmussen, P., 1993. Measurement of induction times
for the formation of methane and ethane gas hydrates. Chemical Engineering
Science, 48: 445–453.
Skovborg, P. and Rasmussen, P., 1994. A mass transport limited model for the
growth of methane and ethane gas hydrates. Chemical Engineering Science, 49:
1131–1143.
Sloan, E.D., 1990. Natural gas hydrate phase equilibria and kinetics: understanding
the state of the art. Revue de l’Institut Francais du Petrole, 45: 245–266.
Sloan, E.D., 1998. Clathrate hydrates of natural gases. Marcel Dekker, Inc., 2nd
edition.
BIBLIOGRAPHY 89
Sloan, E.D., 2000. Clathrate Hydrates: The other common solid water phase.
Industrial and Engineering Chemistry Research, 39: 3123–3129.
Sloan, E.D., 2003. Fundamental principles and applications of natural gas hydrates.
Nature, 426: 354–359.
Sloan, E.D. and Fleyfel, F., 1991. A molecular mechanism for gas hydrate nucleation
from ice. AIChE Journal, 37: 1281–1292.
Sloan, E.D. and Koh, C.A., 2008. Clathrate Hydrates of Natural Gases. Chemical
Industries. CRC Press, 3rd edition.
Smelik, E.A. and King, H.E., 1997. Crystal-growth studies of natural gas clathrate
hydrates using a pressurizes optical cell. American Mineralogist, 82: 88–98.
Staykova, D.K.; Kuhs, W.F.; Salamatin, A.N. and Hansen, T., 2003. Formation of
Porous Gas Hydrates from Ice Powders: Diffraction Experiments and Multistage
Model. Journal of Physical Chemistry B, 107: 10299–10311.
Stern, L.A.; Hogenboom, D.L. and Durham, W.B., 1998. Optical-Cell Evidence
for Superheated Ice under Gas-Hydrate-Forming Conditions. Journal of Physical
Chemistry B, 102: 2627–2632.
Stern, L. and Kirby, S., 2008. Natural Gas hydrates up close: a comparison of grain
characteristics of samples from marine and permafrost environments as revealed
by cryogenic SEM. In Proceedings of the 6th International Conference on Gas
Hydrates.
Stern, L.; Kirby, S.; Circone, S. and Durham, W., 2004. Scanning Electron Mi-
croscopy investigations of laboratory-grown gas clathrate hydrates formed from
melting ice, and comparison to natural hydrates. American Mineralogist, 89:
1162–1175.
Suess, E.; Bohrmann, G.; Greinher, J. and Lausch, E., 1999. Flammable Ice. Sci-
entific American, 281: 76–93.

BIBLIOGRAPHY 90
Sugaya, M. and Mori, Y.H., 1996. Behavior of Clathrate Hydrate Formation at the
Boundary of Liquid Water and a Fluorocarbon in Liquid of Vapor State. Chemical
Engineering Science, 51: 3505–3517.
Susilo, R.; Ripmeester, J.A. and Englezos, P., 2007. Methane Conversion Rate into
Structure H Hydrate Crystals from Ice. AIChE Journal, 53: 2451–2460.
Tanaka, R.; Sakemoto, R. and Ohmura, R., 2009. Crystal Growth of Clathrate
Hydrates Formed at the Interface of Liquid Water and Gaseous Methane, Ethane,
or Propane: Variations in Crystal Morphology. Crystal Growth and Design, DOI:
10.1021/cg9001048.
Thomas, S. and Dawe, R.A., 2003. Review of ways to transport natural gas energy
from countries which do not need the gas for domestic use. Energy, 28: 1461–
1477.
Tohidi, B.; Anderson, R.; Clennel, M.B.; Burgass, R. and Biderkab, A.B., 2001.
Visual observation of gas-hydrate formation and dissociation in synthetic porous
media by means of glass micromodels. Geology, 29: 867–870.
Tohidi, B.; Burgass, R.; Danesh, A.; Ostergaard, K.K. and Todd, A.C., 2000. Im-
proving the accuracy of gas hydrate dissociation point measurements. Annals of
the New York Academy of Sciences, 912: 924–931.
Trebble, M.A. and Bishnoi, P.R., 1987. Development of a new equation of state.
Fluid phase equilibria, 35: 1–18.
Trebble, M.A. and Bishnoi, P.R., 1988a. Extension of the Trebble-Bishnoi equation
of state to fluid mixtures. Fluid phase equilibria, 40: 1–21.
Trebble, M.A. and Bishnoi, P.R., 1988b. Thermodynamic property predictions with
the Trebble-Bishnoi equation of state. Fluid phase equilibria, 39: 111–128.
BIBLIOGRAPHY 91
Uchida, T.; Dallimore, s. and Mikami, J., 2000a. Occurrences of Natural Gas Hy-
drates beneath the Permafrost Zone in Mackenzie Delta. Annals of the New York
Academy of Sciences, 912: 1023–1032.
Uchida, T.; Ebinuma, T.; Kawabata, J. and Narita, H., 1999. Microscopic obser-
vations of formation processes of clathrate-hydrate films at an interface between
water and carbon dioxide. Journal of Crystal Growth, 204: 348–356.
Uchida, T.; Ebinuma, T. and Narita, H., 2000b. Observations of CO2 -hydrate
decomposition and reformation processes. Journal of Crystal Growth, 217: 189–
200.
Uchida, T.; Ikeda, M.; Takeya, S.; Ebinuma, T.; Nagao, J. and Narita, H., 2002.
CO2 hydrate film formation at the boundary between CO2 and water: effects of
temperature, pressure and additives on the formation rate. Journal of Crystal
Growth, 237: 383–387.
Uchida, T.; Ikeda, M.; Takeya, S.; Kamata, Y.; Ohmura, R.; Nagao, J.; Zatsepina,
O.Y. and Buffet, B.A., 2005. Kinetics and Stability of CH4 -CO2 Mixed Gas
Hydrates during Formation and Long-Term Storage. ChemPhysChem, 6: 646–
654.
Uchida, T. and Kawabata, J., 1996. Measurements of Mechanical Properties of The
Liquid CO2 -Water-Hydrate System. Energy, 22: 357–361.
Uchida, T.; Ohmura, R.; Ikeda, M.; Nagao, J.; Nagashima, K.; Takeya, S. and
Hori, A., 2006. Phase equilibrium measurements and crystallographic analyses
on structure-H type gas hydrate formed from the CH4 -CO2 -neohexane-water
system. Journal of Physical Chemistry B, 110: 4583–4588.
Uhlmann, D. and Chalmers, B., 1964. Interaction Between Particles and a Solid-
Liquid Interface. Journal of Applied Physics, 35: 2986–2993.
Unruh, C.H. and Katz, D.L., 1949. Gas hydrates of carbon dioxide-methane mix-
tures. Trans AIME, 186: 83–86.
BIBLIOGRAPHY 92
Van Der Waals, J.H. and Platteeuw, J.C., 1959. Clathrate Solutions. Advances in
chemical physics, 2: 2–57.
Vysniauskas, A. and Bishnoi, P.R., 1983. A kinetic study of methane hydrate
formation. Chemical Engineering Science, 38: 1061–1972.
Wang, W.; Bray, C.; Adams, D. and Cooper, A., 2008. Methane Storage in Dry
Water Gas Hydrates. Journal of the American Chemical Society, 130: 11608–
11609.