Laboratory infrared reflection spectrum of carbon dioxide clathrate ... · Laboratory infrared...
11
Laboratory infrared reflection spectrum of carbon dioxide clathrate hydrates for astrophysical remote sensing applications Adriana Oancea ⇑ , Olivier Grasset, Erwan Le Menn, Olivier Bollengier, Lucile Bezacier, Stéphane Le Mouélic, Gabriel Tobie Laboratoire de Planétologie et Géodynamique de Nantes, UMR-CNRS 6112, Université de Nantes, Nantes, France article info Article history: Received 23 March 2012 Revised 19 September 2012 Accepted 20 September 2012 Available online 3 October 2012 Keywords: Ices, IR spectroscopy Experimental techniques Satellites, Surfaces abstract We present 1–5 lm IR reflectance spectra of CO 2 clathrate hydrates acquired under temperature and pressure conditions representative of the icy moons’ surfaces. The IR reflectance spectrum of the CO 2 clathrate hydrates is similar to the water ice IR reflectance spectrum except for two main absorption bands corresponding to the CO 2 guest molecule at 2.71 and 4.28 lm (3693 and 2334 cm 1 ). The specific configuration of the clathrate hydrate structure is identified through the m 3 absorption band splitting which produces a band at 4.26 lm (2347 cm 1 ) for molecules trapped in small cages and a band at 4.28 lm (2334 cm 1 ) for molecules trapped in large cages. In general, the reflection spectra are similar to spectra obtained in transmission spectroscopy. But, it appears that the aspect of the m 3 absorption band is strongly influenced by physical (roughness, thickness, mixing properties) and optical (n and k) charac- teristics of the sample. A qualitative discussion of the effects of these sample properties on near-IR sig- natures of clathrate hydrates is proposed. Finally, a comparison between the absorption bands of CO 2 clathrate hydrates obtained in this work and CO 2 absorption bands as detected by VIMS on the icy sat- ellites of Saturn is achieved. The experimental near-IR reflection spectra, made in pressure–temperature (P–T) conditions close to those of the icy surfaces, confirm that VIMS data are not consistent with the presence of structure I CO 2 clathrate hydrates on the surface of the icy moons. Ó 2012 Elsevier Inc. All rights reserved. 1. Introduction Carbon dioxide has been identified with the Visible Infrared Mapping Spectrometer (VIMS) onboard the Cassini spacecraft on several Saturn’s icy satellites. Iapetus, Hyperion, Phoebe and Dione spectral maps have a prominent CO 2 band, while on Mimas, Rhea and Tethys the CO 2 signature is weak (Dalton et al., 2010; Cruikshank et al., 2010; Clark et al., 2005; Buratti et al., 2005). CO 2 has also been detected on the three icy Galilean satellites (Europa, Ganymede, Callisto) by the Galileo Near-Infrared Mapping Spectrometer (NIMS) (Hibbitts et al., 2000; Dalton, 2010; Dalton et al., 2010). CO 2 is often correlated with dark terrains. However, it is unclear if CO 2 is trapped in H 2 O ice or in some minerals or com- plex organic compounds (Buratti et al., 2005). Both the origin of CO 2 and the way it is incorporated on surfaces remain controversial. The source of CO 2 may be internal (Choukroun et al., 2012), or CO 2 may be produced by radiolytic processes at the surface (Hansen and McCord, 2008). On Jupiter’s satellites and on the four Saturn’s satellites which display strong CO 2 signatures (Phoebe, Iapetus, Dione and Hyperion) the antisymmetric CO 2 stretching mode is shifted to shorter wavelength with respect to pure CO 2 . This suggests that the molecule is incorporated in the icy crust as a gaseous or as a fluid inclusion. If CO 2 comes from the moon’s interior, it is likely to be stored in the form of clathrate hydrates (Choukroun et al., 2012). It is thought that clathrate hydrates play a significant role in the chemistry of the solar nebula (Mousis et al., 2009, 2010) and in the physical evolution of astrophysical objects (Choukroun et al., 2012). Clathrate hydrates are non-stoichiometric inclusion compounds, with a hydrogen bonded water ice network forming cages in which gas molecules can be trapped (up to 0.15 molar fraction) (Sloan, 1998). These compounds are largely found on Earth in the oceanic seafloor sediments, in the permafrost or in polar ice caps (Kargel and Lunine, 1998). So far, they have not been detected in astrophysical environments, but they are expected to be present in significant amounts in icy moons (e.g. Choukroun et al., 2012), they may also be present in cometary nu- clei (Marboeuf et al., 2010) and Trans-Neptunian Objects (TNOs), and finally are also suspected in the martian environment (Cha- stain and Chevrier, 2007). In a planetary context the most common gases that can form clathrate hydrates are CO 2 , CO, SO 2 , CH 4 ,N 2 or C 2 H 6 (Osegovic and Max, 2005). Although these structures are a powerful way to store CO 2 in icy bodies, their stability and their storage capacity (cage occupancies) under moderate to high 0019-1035/$ - see front matter Ó 2012 Elsevier Inc. All rights reserved. http://dx.doi.org/10.1016/j.icarus.2012.09.020 ⇑ Corresponding author. E-mail address: [email protected] (A. Oancea). Icarus 221 (2012) 900–910 Contents lists available at SciVerse ScienceDirect Icarus journal homepage: www.elsevier.com/locate/icarus
Transcript of Laboratory infrared reflection spectrum of carbon dioxide clathrate ... · Laboratory infrared...
Laboratory infrared reflection spectrum of carbon dioxide clathrate hydratesfor astrophysical remote sensing applications
Adriana Oancea !, Olivier Grasset, Erwan Le Menn, Olivier Bollengier, Lucile Bezacier,Stéphane Le Mouélic, Gabriel TobieLaboratoire de Planétologie et Géodynamique de Nantes, UMR-CNRS 6112, Université de Nantes, Nantes, France
a r t i c l e i n f o
Article history:Received 23 March 2012Revised 19 September 2012Accepted 20 September 2012Available online 3 October 2012
Keywords:Ices, IR spectroscopyExperimental techniquesSatellites, Surfaces
a b s t r a c t
We present 1–5 lm IR reflectance spectra of CO2 clathrate hydrates acquired under temperature andpressure conditions representative of the icy moons’ surfaces. The IR reflectance spectrum of the CO2
clathrate hydrates is similar to the water ice IR reflectance spectrum except for two main absorptionbands corresponding to the CO2 guest molecule at 2.71 and 4.28 lm (3693 and 2334 cm!1). The specificconfiguration of the clathrate hydrate structure is identified through the m3 absorption band splittingwhich produces a band at 4.26 lm (2347 cm!1) for molecules trapped in small cages and a band at4.28 lm (2334 cm!1) for molecules trapped in large cages. In general, the reflection spectra are similarto spectra obtained in transmission spectroscopy. But, it appears that the aspect of the m3 absorption bandis strongly influenced by physical (roughness, thickness, mixing properties) and optical (n and k) charac-teristics of the sample. A qualitative discussion of the effects of these sample properties on near-IR sig-natures of clathrate hydrates is proposed. Finally, a comparison between the absorption bands of CO2
clathrate hydrates obtained in this work and CO2 absorption bands as detected by VIMS on the icy sat-ellites of Saturn is achieved. The experimental near-IR reflection spectra, made in pressure–temperature(P–T) conditions close to those of the icy surfaces, confirm that VIMS data are not consistent with thepresence of structure I CO2 clathrate hydrates on the surface of the icy moons.
! 2012 Elsevier Inc. All rights reserved.
1. Introduction
Carbon dioxide has been identified with the Visible InfraredMapping Spectrometer (VIMS) onboard the Cassini spacecraft onseveral Saturn’s icy satellites. Iapetus, Hyperion, Phoebe and Dionespectral maps have a prominent CO2 band, while on Mimas, Rheaand Tethys the CO2 signature is weak (Dalton et al., 2010;Cruikshank et al., 2010; Clark et al., 2005; Buratti et al., 2005).CO2 has also been detected on the three icy Galilean satellites(Europa, Ganymede, Callisto) by the Galileo Near-Infrared MappingSpectrometer (NIMS) (Hibbitts et al., 2000; Dalton, 2010; Daltonet al., 2010). CO2 is often correlated with dark terrains. However,it is unclear if CO2 is trapped in H2O ice or in someminerals or com-plex organic compounds (Buratti et al., 2005). Both the origin of CO2
and the way it is incorporated on surfaces remain controversial.The source of CO2 may be internal (Choukroun et al., 2012), or
CO2 may be produced by radiolytic processes at the surface(Hansen and McCord, 2008). On Jupiter’s satellites and on the fourSaturn’s satellites which display strong CO2 signatures (Phoebe,Iapetus, Dione and Hyperion) the antisymmetric CO2 stretching
mode is shifted to shorter wavelength with respect to pure CO2.This suggests that the molecule is incorporated in the icy crust asa gaseous or as a fluid inclusion. If CO2 comes from the moon’sinterior, it is likely to be stored in the form of clathrate hydrates(Choukroun et al., 2012). It is thought that clathrate hydrates playa significant role in the chemistry of the solar nebula (Mousis et al.,2009, 2010) and in the physical evolution of astrophysical objects(Choukroun et al., 2012). Clathrate hydrates are non-stoichiometricinclusion compounds, with a hydrogen bonded water ice networkforming cages in which gas molecules can be trapped (up to 0.15molar fraction) (Sloan, 1998). These compounds are largely foundon Earth in the oceanic seafloor sediments, in the permafrost orin polar ice caps (Kargel and Lunine, 1998). So far, they havenot been detected in astrophysical environments, but they areexpected to be present in significant amounts in icy moons (e.g.Choukroun et al., 2012), they may also be present in cometary nu-clei (Marboeuf et al., 2010) and Trans-Neptunian Objects (TNOs),and finally are also suspected in the martian environment (Cha-stain and Chevrier, 2007). In a planetary context the most commongases that can form clathrate hydrates are CO2, CO, SO2, CH4, N2 orC2H6 (Osegovic and Max, 2005). Although these structures are apowerful way to store CO2 in icy bodies, their stability and theirstorage capacity (cage occupancies) under moderate to high
0019-1035/$ - see front matter ! 2012 Elsevier Inc. All rights reserved.http://dx.doi.org/10.1016/j.icarus.2012.09.020
! Corresponding author.E-mail address: [email protected] (A. Oancea).
Icarus 221 (2012) 900–910
Contents lists available at SciVerse ScienceDirect
Icarus
journal homepage: www.elsevier .com/ locate/ icarus
pressures is still poorly understood. Identification of CO2 clathratehydrates on icy moons relies on remote sensing observations, butthe CO2 clathrate hydrates infrared signature is not yet entirelycharacterized. Moreover the remote sensing observations ofclathrate hydrates are particularly difficult because of the strongvibrations modes of the waterice matrix.
The CO2 IR signatures have been extensively studied in purephases, in different ice mixtures (Sandford and Allamandola,1990; Baratta and Palumbo, 1998; Baratta et al., 2000; Oberget al., 2007; Ehrenfreund et al., 1997), and in the clathrate hydrates.CO2 clathrate hydrate physical properties and structure wereinvestigated using different spectroscopic tools like X-ray and neu-tron diffraction (Udachin et al., 2001; Circone et al., 2003), nuclearmagnetic resonance (NMR) (Ratcliffe and Ripmeester, 1986; Seoand Lee, 2004), Raman spectroscopy (Sum et al., 1997), infraredtransmission spectroscopy (Fleyfel and Devlin, 1988, 1991; Dartoisand Schmitt, 2009) or attenuated total reflection spectroscopy(Kumar et al., 2009). Under suitable temperature and pressureconditions the CO2 forms preferentially the structure I clathratehydrate, characterized by a unit cell having 2 small cages and 6large cages. The formation of a structure II having the unit cell with16 small cages and 8 large cages was observed only when the CO2
is mixed with a type II hydrate forming molecule (Seo and Lee,2004; Kumar et al., 2009).
The reflection spectra for CO2 ice or for CO2 clathrate hydrateswere investigated by Kieffer (1970), Hapke et al. (1981), and Smy-the (1975). Kieffer (1970) studied the reflectance spectra of CO2,H2O and CO2AH2O thin films from 12,500 to 3125 cm!1 (0.8–3.2 lm). The major conclusion of his work was that in near andmid IR, water ice strongly absorbs the incident light and it masksthe absorption bands of other compounds trapped in the icematrix. Smythe (1975) encountered the same problem when hestudied reflectance spectra of CO2 and CH4 gas hydrates obtainedby pressurizing gas over the pure water ice. Over the entire wave-number region, 10,000–1600 cm!1 (1–6 lm), the reflectance IRspectral signature for these compounds was found to be very sim-ilar to pure H2O ice reflectance spectra. For CO2 clathrate hydratethe only difference between the pure water ice and the clathratehydrate spectra was an absorption band at "3703 cm!1 (2.7 lm).In the case of methane clathrates no apparent CH4 feature wasfound (Smythe, 1975). The first assignment of the IR m3 vibrationband for the CO2 clathrate hydrate was made by Fleyfel and Devlin(1988, 1991). Using Fourier-Transform Infrared (FT-IR) transmis-sion spectroscopy they analyzed the IR signature of the CO2 clath-rate hydrate when prepared with a cryogenic thin-film vapordeposition technique. This work was recently continued with thestudy of Dartois and Schmitt (2009) that gives the spectroscopicassignments of the combination bands and overtone bands forthe CO2 molecules trapped in the clathrate hydrate structure.
This study presents the first experimental IR reflectance spectraof CO2 clathrate hydrates obtained in conditions that allow directcomparison with planetary surfaces. A special attention has beengiven to the detectability of clathrate hydrates using reflectancespectroscopy, the technique on which planetary observations arebased on. Reflectance strongly depends on the physical character-istics of the sample (in term of shape, thickness or surface proper-ties) and on the two optical constants n and k, the real and theimaginary parts of the refraction index, respectively. The impactof these factors on the reflection spectrum is negligible when theabsorption coefficient of the material is very small (k # 0:1) butcannot be ignored when the icy material is characterized by strongabsorption coefficients (k P 0:1) (Hapke, 1993; Baratta and Pal-umbo, 1998). In the following, the experimental set-up and theclathrate hydrate synthesis procedure is presented. The experi-mental IR reflectance spectrum of the CO2 clathrate hydrate struc-ture I is described in details and compared with the available
literature data. The planetological implications of this work are dis-cussed in the last part of this paper.
2. Experimental methodology
2.1. Experimental set-up
All experiments were performed in primary vacuum ("10!5
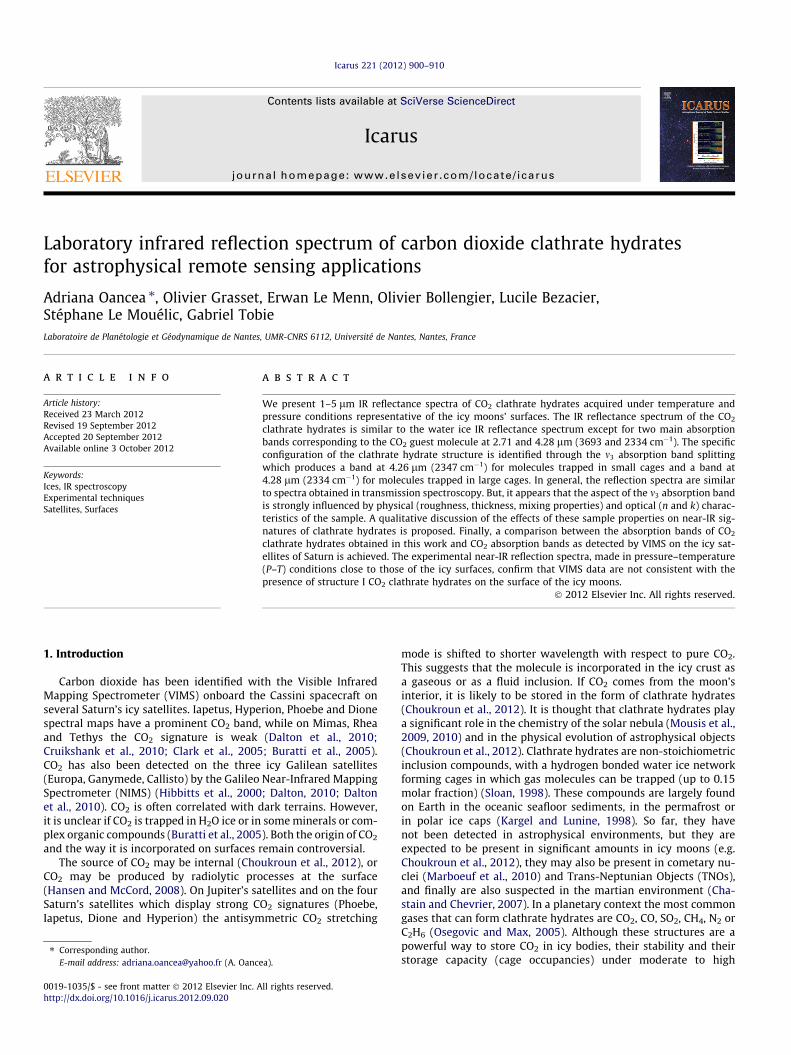
bar) in a low temperature and low pressure experimental set-up(Oxford Instrument) that is shown schematically in Fig. 1a. Thepressure is measured using a Pirani pressure gauge (Thyracont-VSP 521, 1 $ 10!5 – 0.1 bar; relative accuracy 15%) and the primaryvacuum is obtained with a Varian Dry Scroll SH110 pump. Temper-ature is controlled using a liquid nitrogen circulation system. It ismeasured with a Pt100 temperature sensor (accuracy of ±0.1 K).The sample is placed in the cryostat as shown schematically inFig. 1b.
Reflectance Fourier Transform spectra of the water-rich iceswere recorded using a Thermo Fisher Nicolet 5700 ContinuumInfrared Microscope equipped with an infrared objective (15X Refl-achromat), a tungsten filament source, a CaF2 beam splitter and anInSb detector cooled with liquid N2. The spectrometer opticalbench is continually purged with dried air to eliminate watervapor, carbon dioxide, and other airborne contaminants. The spec-tra are recorded in the 10,000–2000 cm!1 (1–5 lm) domain with aresolution of R = 4 (data spacing 1.9 cm!1), using a total of 200scans. Background spectra were acquired in a similar manner usinga copper plate, prior to sample introduction for each experiment.Spectra displayed in this paper have been corrected for the back-ground contribution. All spectra are acquired at normal incidenceusing unpolarized light.
2.2. Clathrate hydrates synthesis procedure
Structure I CO2 clathrate hydrate samples were prepared ascompact polycrystalline films using an high pressure autoclave(Autoclave France 50 ml, 300 bar). First, a film of crystalline ice isformed between two copper surfaces at T = 255 K in a cold roomfrom a few drops of water deposited on the copper plate using amicro-pipette (see inset of Fig. 1a). The ice film thickness is con-strained with tungsten thin wires having diameters of 25 or100 lm. The ice film is introduced into the autoclave and is pres-surized with gaseous carbon dioxide for three days at T = 255 Kand P = 20 bar. During the CO2 gas introduction the temperatureis controlled carefully so that it does not rise above 273 K. A typeK thermocouple introduced in the autoclave enables to controlthe sample temperature during the synthesis. The synthesis ofCO2 clathrate hydrate can be accelerated if a liquid water film isused. In this case the CO2 hydrate film is obtained within 24 h.The tungsten wires permit the estimation of maximum film thick-ness. After clathrate hydrates synthesis, copper plates are set apart(see inset of Fig. 1a) and the clathrate hydrates films are usuallybroken. The sample introduced into the cryostat is composed offilm fragments with a maximum thickness constrained by tungstenwires.
2.3. Samples recovery and loading into the cryostat
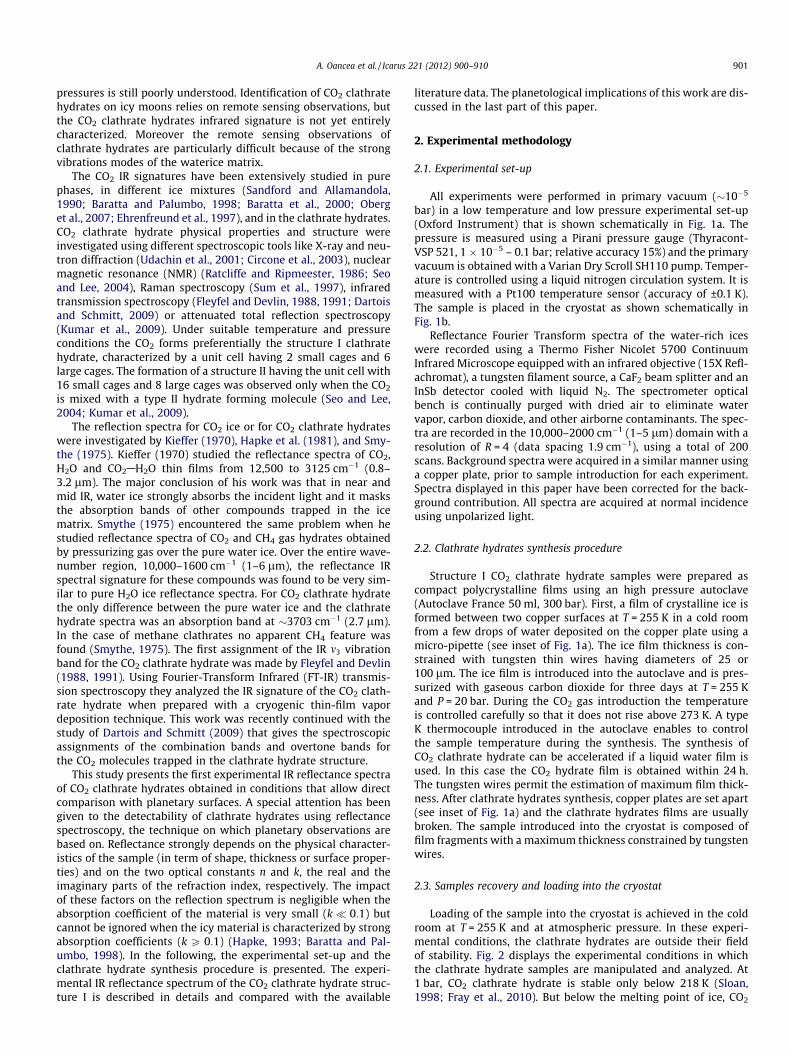
Loading of the sample into the cryostat is achieved in the coldroom at T = 255 K and at atmospheric pressure. In these experi-mental conditions, the clathrate hydrates are outside their fieldof stability. Fig. 2 displays the experimental conditions in whichthe clathrate hydrate samples are manipulated and analyzed. At1 bar, CO2 clathrate hydrate is stable only below 218 K (Sloan,1998; Fray et al., 2010). But below the melting point of ice, CO2
A. Oancea et al. / Icarus 221 (2012) 900–910 901
clathrate hydrates undergo ‘‘the self-preservation phenomena’’that relates to the fact that it protects itself from further decompo-sition without external intervention (Falenty and Kuhs, 2009). Thisphenomenon is commonly observed at 1 bar between 240 and270 K, but it has also been observed under vacuum or at moderatepressure. This anomalous behavior has been reported for othermolecules like CH4, O2, or N2 (Takeya and Ripmeester, 2008). Asit has been shown in laboratory studies, gas hydrates in this meta-stable state may retain a substantial volume of gas for a fewmonths (Stern et al., 2001; Circone et al., 2003). Circone et al.(2003) have made investigations on the dissociation of the CO2
clathrate hydrate at 1 bar. Using temperature ramping experi-ments performed between 240 and 277 K they have shown thatonly 20% max of the total CO2 gas content was released by 270 K,while the remaining 80% of the gas was abruptly released above
270 K. Similarly, during isothermal pressure-release experiments,they showed that at 240 K ("0.4 h) and 268 K ("1.2 h) respec-tively, the samples released less than 10% of their total gas content.Falenty and Kuhs (2009) studied the self-preservation of CO2 clath-rate hydrates on a much boarder P–T field, with T between 200 and270 K and pressures far outside the stability domain (6 mbar). Intheir experiments at 6 mbar (the closest to our experimental con-ditions) the speed of decomposition gradually decreases, for tem-peratures from 240 K toward the melting point of ice. At 6 mbarand 250 K a CO2 clathrate hydrate sample will lose 0.3 weight frac-tion in "5 min, but at T = 200 K a very slow decomposition wasalso observed (hydrate weight fraction = 0.6 after 1 h).
In this work, after synthesis, the clathrate hydrates are atT = 255 K and "18 bar. The loading procedure takes less than5 min and it is as follows. In the cold room the cryostat tempera-ture is set at 125 K. The clathrate hydrates sample is then slowlydepressurized ("25 s) at 1 bar and taken out of the autoclave.The slow depressurization prevent drastic drop of the temperatureand the CO2 ice formation in the autoclave. The copper plates usedfor the film synthesis are screwed together on the cryostat andonly after that the top plate is removed. The cryostat is then closedand is cooled down to 80 K after air pumping. This procedureplaces, within 5 min, the clathrate hydrates samples back to theirstability domain where all spectral analyses will proceed.
For better constraining the loss of CO2 during the loading proce-dure, the clathrate hydrate mass loss was measured on three sam-ples issued from three different clathrate hydrate icy blocks. Thequestion to answer is: how much gas is lost in the 5 min afterthe clathrate hydrate is taken out of the high pressure chamber?A small fraction of clathrate hydrate has been taken from the sam-ples, crushed and then deposited on a Sartorius micro-balance(type 1465, with ±0.001 g precision). The clathrate hydrate masswas then monitored during 5 min, the longest time for the loadingprocedure where the sample is outside of its field of stability at
(a) (b)
Fig. 1. Experimental set-up used for the CO2 clathrate hydrates spectral analysis. (a) The low pressure and low temperature cryostat; the inset on the left corner shows thetwo copper plates used for clathrate hydrates film synthesis. (b) Schematic design of sample arrangement into the cryostat: 1 – cryostat top cover having a sapphire window1 mm thick; 2 – clathrate hydrate sample; 3 – copper substrate; 4 – temperature regulating system.
Fig. 2. Experimental and theoretical dissociation pressures for CO2 clathratehydrates from 5Miller and Smythe (1970), 4Larson (1955), !Schmitt (1986),%Ng and Robinson (1985). The red dotted line represents Peq of CO2 clathratehydrates from Fray et al. (2010) and the self-preservation region is defined fromFalenty and Kuhs (2009), and Circone et al. (2003). Included on the plot are the CO2
and H2O pure phase transitions. The arrows indicate P–T path during thepreparation of the samples: 1? 2 clathrate hydrate synthesis; 2? 3 clathratehydrate depressurization from 18 to 1 bar; 3? 4 sample introduction into thecryostat; 4? 5? 6 sample cooling and air pumping; 6 – IR analysis. The loadingprocedure from 2 to 5 has been optimized so that the sample cannot be more than5 min below the stability field. (For interpretation of the references to color in thisfigure legend, the reader is referred to the web version of this article.)
Table 1The mass loss of the CO2 clathrate hydrates at T = 255 K and under air atmosphericpressure. mi
h – initial sample weight; mfh – sample weight after 5 min; mH2O – liquid
water after decomposition; Dm=m – the sample weight loss by clathrate dissociation;ni and nf initial and final hydration number of the hydrate sample. The samples weresynthesized with a 50 ml high pressure autoclave: samples 1 and 2 from 10 g of waterand 50 bar CO2; sample 3 from 6 g of water and 50 bar CO2.
mih &g' mf
h &g' mH2O &g' Dm=m &%' ni nf
Sample 1 0.368 0.363 0.296 1.36 10.04 10.79Sample 2 0.490 0.486 0.391 0.82 9.65 10.06Sample 3 0.503 0.500 0.393 0.60 8.73 8.97
902 A. Oancea et al. / Icarus 221 (2012) 900–910
room pressure. At the end of the experiment the sample was fullydecomposed by melting and the remaining water was weighed.The mass loss experiments results are reported in Table 1. Duringthese 5 min, the very small weight loss which was observed (0.6–1.36%) is attributed to the clathrate hydrate gas loss by decompo-sition into ice and CO2 gas. Using the liquid H2O weight measuredafter complete dissociation, hydration numbers between 9 and 11were found for the samples.
The results listed in Table 1 demonstrate that the grains ofclathrate hydrates are indeed stable in the 5 min time slot outsidethe stability field. As for the films that are used in this work theloading procedure is simpler and shorter than for grain preparation(i.e. no crushing, etc.). Thus, the loss of the gas from the hydratefilm, after it was taken out of the autoclave, is expected to be even
lower than that for the grains. The film synthesis is favorable tothe formation of an entirely filled clathrate, but a loss of gas duringthe samples depressurization is also expected. From the weightloss of grain samples, we can also estimate the minimum gasconcentration in the clathrate hydrate films. As the synthesisprocedure is similar and the water to gas ratio in the autoclavewas lower, the hydration number for the film samples could notbe higher than 9. Therefore, the films could only be formed byeither a mixture of ice and fully filled clathrate hydrate or by apartially filled clathrate hydrate.
3. Results
3.1. Main characteristics of reflection IR spectra of CO2 clathratehydrates
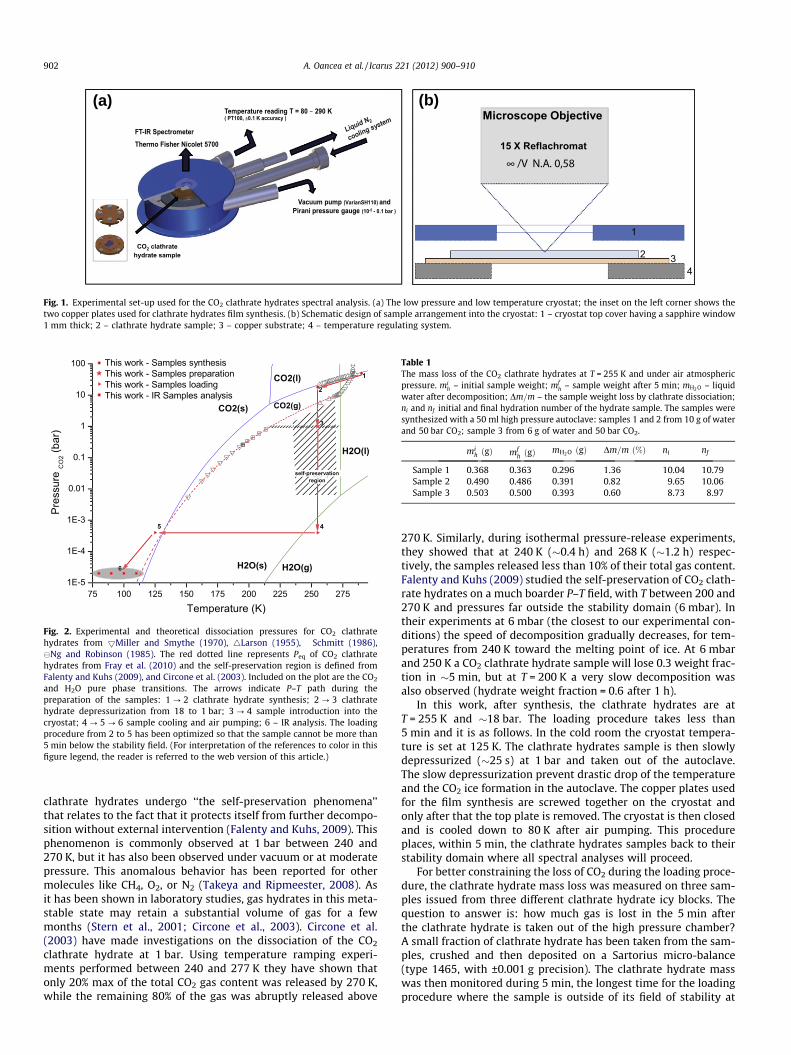
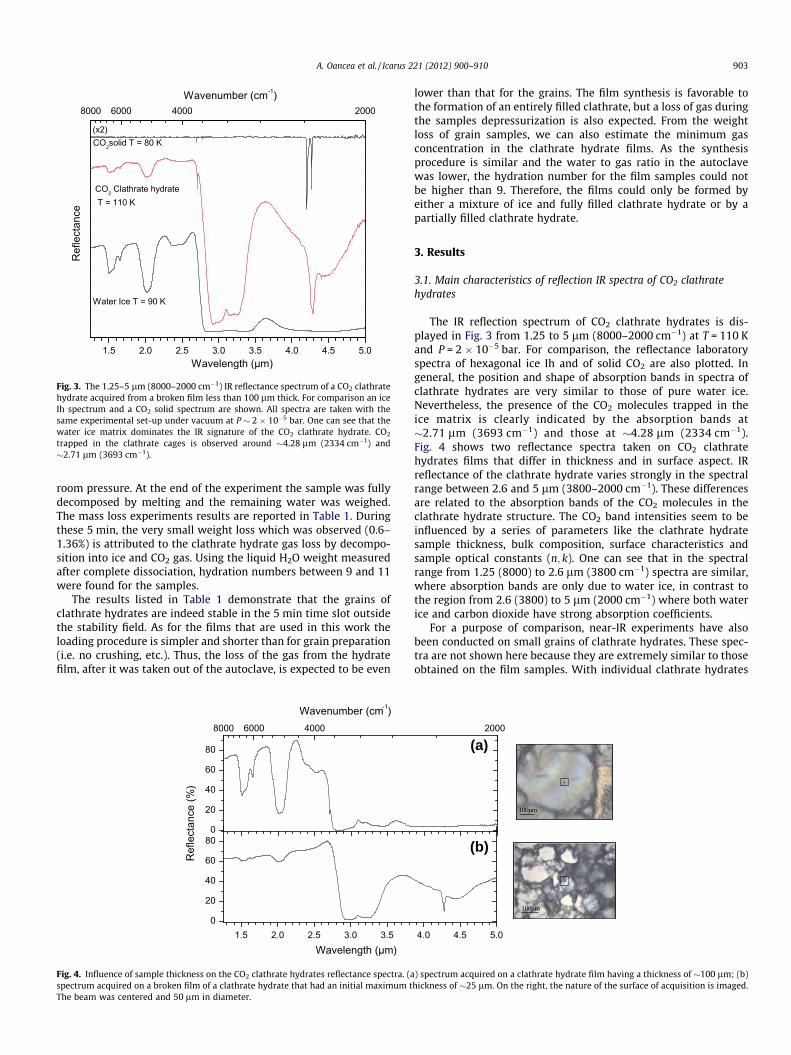
The IR reflection spectrum of CO2 clathrate hydrates is dis-played in Fig. 3 from 1.25 to 5 lm (8000–2000 cm!1) at T = 110 Kand P = 2 $ 10!5 bar. For comparison, the reflectance laboratoryspectra of hexagonal ice Ih and of solid CO2 are also plotted. Ingeneral, the position and shape of absorption bands in spectra ofclathrate hydrates are very similar to those of pure water ice.Nevertheless, the presence of the CO2 molecules trapped in theice matrix is clearly indicated by the absorption bands at"2.71 lm (3693 cm!1) and those at "4.28 lm (2334 cm!1).Fig. 4 shows two reflectance spectra taken on CO2 clathratehydrates films that differ in thickness and in surface aspect. IRreflectance of the clathrate hydrate varies strongly in the spectralrange between 2.6 and 5 lm (3800–2000 cm!1). These differencesare related to the absorption bands of the CO2 molecules in theclathrate hydrate structure. The CO2 band intensities seem to beinfluenced by a series of parameters like the clathrate hydratesample thickness, bulk composition, surface characteristics andsample optical constants (n; k). One can see that in the spectralrange from 1.25 (8000) to 2.6 lm (3800 cm!1) spectra are similar,where absorption bands are only due to water ice, in contrast tothe region from 2.6 (3800) to 5 lm (2000 cm!1) where both waterice and carbon dioxide have strong absorption coefficients.
For a purpose of comparison, near-IR experiments have alsobeen conducted on small grains of clathrate hydrates. These spec-tra are not shown here because they are extremely similar to thoseobtained on the film samples. With individual clathrate hydrates
Fig. 3. The 1.25–5 lm (8000–2000 cm!1) IR reflectance spectrum of a CO2 clathratehydrate acquired from a broken film less than 100 lm thick. For comparison an iceIh spectrum and a CO2 solid spectrum are shown. All spectra are taken with thesame experimental set-up under vacuum at P " 2 $ 10!5 bar. One can see that thewater ice matrix dominates the IR signature of the CO2 clathrate hydrate. CO2
trapped in the clathrate cages is observed around "4.28 lm (2334 cm!1) and"2.71 lm (3693 cm!1).
1.5 2.0 2.5 3.0 3.5 4.0 4.5 5.00
20
40
60
80
Ref
lect
ance
(%)
Wavelength (!m)
0
20
40
60
80
8000 6000 4000 2000
Wavenumber (cm-1)
(a)
(b)
Fig. 4. Influence of sample thickness on the CO2 clathrate hydrates reflectance spectra. (a) spectrum acquired on a clathrate hydrate film having a thickness of "100 lm; (b)spectrum acquired on a broken film of a clathrate hydrate that had an initial maximum thickness of "25 lm. On the right, the nature of the surface of acquisition is imaged.The beam was centered and 50 lm in diameter.
A. Oancea et al. / Icarus 221 (2012) 900–910 903
grains, the same variations of reflectance in the 2.6 (3800) to 5 lm(2000 cm!1) domain are observed from sample to sample. Grainsreflectance spectra are, most of the time, similar to the spectrumin Fig. 4a. Very few grains produced a spectrum similar to theone displayed in Fig. 4b. The possible causes for these differenceswill be discussed in Section 4.2.
In the next sections, the spectrum of CO2 clathrate hydrates isdisplayed and discussed for each spectral region using as a refer-ence a spectrum acquired from a broken film sample less than100 lm thick. Table 2 summarizes the vibration band positionsobserved in this work for the CO2 molecules in different physicalstates, and compares our results with data found in the literature.
3.2. Spectral signature of the antisymmetric vibration mode
Fig. 5 compares the infrared spectrum of the clathratehydrates obtained in this work with solid and gas infrared signa-tures of pure CO2 in the 2500–2200 cm!1 (4–4.5 lm) spectralrange. This spectral region contains the contributions of the fun-damental C@O asymmetric stretching vibration modes m3 for theCO2 and 13CO2 molecules. At T = 290 K and 1 bar pressure, the gasphase presents a double absorption band at 2360 and 2341 cm!1
(4.23 and 4.27 lm, that corresponds to the envelopes of the R andP branch, respectively, of the rotational transitions that occur forthe asymmetric stretching band), while the solid phase is charac-terized by an absorption band at 2343 cm!1 (4.268 lm). The sec-ond band, at "2379 cm!1 (4.203 lm), on the high-frequency sideof the solid CO2 reflection spectrum, is not listed in literature asan absorption band. This feature was already observed in the IRtransmission spectra for the CO2 ice films and its intensity wasfound to depend on the geometric configuration of the experi-ment and of the polarization of the incident light. When trans-mission spectra are taken with normal unpolarized lightincidence, this feature is present as a weak shoulder on thehigh-frequency side of the m3 absorption band (Osberg and Hor-nig, 1952; Baratta and Palumbo, 1998). Instead, when the angleof incident light varies between 0" and 60" and a p-polarized lightis used (the electric vector is parallel to the plane of incidence) astrong feature centered at "2377 cm!1 (4.207 lm) is present inthe transmission spectra (Baratta and Palumbo, 1998; Barattaet al., 2000). According to Osberg and Hornig (1952) and toBaratta and Palumbo (1998), this feature is not due to absorption(k) but to an increased reflectivity in the domain of the absorp-tion band where n < 1.
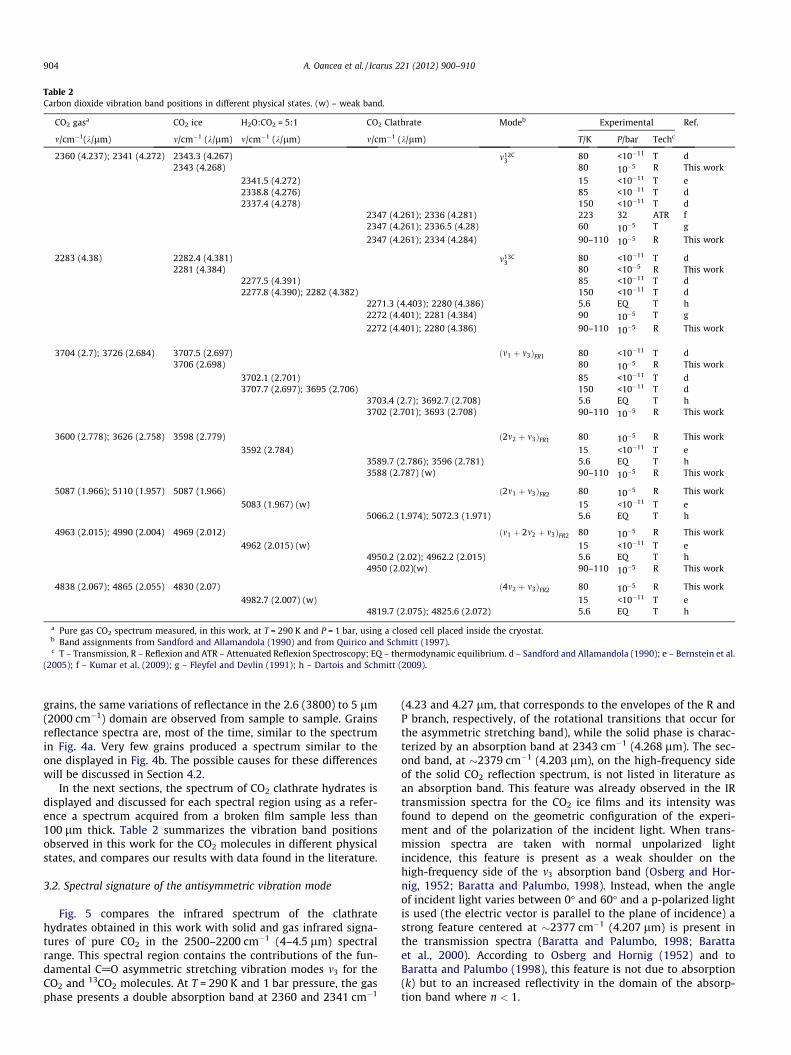
Table 2Carbon dioxide vibration band positions in different physical states. (w) – weak band.
CO2 gasa CO2 ice H2O:CO2 = 5:1 CO2 Clathrate Modeb Experimental Ref.
m/cm!1(k/lm) m/cm!1 (k/lm) m/cm!1 (k/lm) m/cm!1 (k/lm) T/K P/bar Techc
2360 (4.237); 2341 (4.272) 2343.3 (4.267) m12C3 80 <10!11 T d2343 (4.268) 80 10!5 R This work
2341.5 (4.272) 15 <10!11 T e2338.8 (4.276) 85 <10!11 T d2337.4 (4.278) 150 <10!11 T d
2347 (4.261); 2336 (4.281) 223 32 ATR f2347 (4.261); 2336.5 (4.28) 60 10!5 T g2347 (4.261); 2334 (4.284) 90–110 10!5 R This work
2283 (4.38) 2282.4 (4.381) m13C3 80 <10!11 T d2281 (4.384) 80 <10!5 R This work
2277.5 (4.391) 85 <10!11 T d2277.8 (4.390); 2282 (4.382) 150 <10!11 T d
2271.3 (4.403); 2280 (4.386) 5.6 EQ T h2272 (4.401); 2281 (4.384) 90 10!5 T g2272 (4.401); 2280 (4.386) 90–110 10!5 R This work
3704 (2.7); 3726 (2.684) 3707.5 (2.697) &m1 ( m3'FR1 80 <10!11 T d3706 (2.698) 80 10!5 R This work
3702.1 (2.701) 85 <10!11 T d3707.7 (2.697); 3695 (2.706) 150 <10!11 T d
3703.4 (2.7); 3692.7 (2.708) 5.6 EQ T h3702 (2.701); 3693 (2.708) 90–110 10!5 R This work
3600 (2.778); 3626 (2.758) 3598 (2.779) &2m2 ( m3'FR1 80 10!5 R This work3592 (2.784) 15 <10!11 T e
3589.7 (2.786); 3596 (2.781) 5.6 EQ T h3588 (2.787) (w) 90–110 10!5 R This work
5087 (1.966); 5110 (1.957) 5087 (1.966) &2m1 ( m3'FR2 80 10!5 R This work5083 (1.967) (w) 15 <10!11 T e
5066.2 (1.974); 5072.3 (1.971) 5.6 EQ T h
4963 (2.015); 4990 (2.004) 4969 (2.012) &m1 ( 2m2 ( m3'FR2 80 10!5 R This work4962 (2.015) (w) 15 <10!11 T e
4950.2 (2.02); 4962.2 (2.015) 5.6 EQ T h4950 (2.02)(w) 90–110 10!5 R This work
4838 (2.067); 4865 (2.055) 4830 (2.07) &4m2 ( m3'FR2 80 10!5 R This work4982.7 (2.007) (w) 15 <10!11 T e
4819.7 (2.075); 4825.6 (2.072) 5.6 EQ T h
a Pure gas CO2 spectrum measured, in this work, at T = 290 K and P = 1 bar, using a closed cell placed inside the cryostat.b Band assignments from Sandford and Allamandola (1990) and from Quirico and Schmitt (1997).c T – Transmission, R – Reflexion and ATR – Attenuated Reflexion Spectroscopy; EQ – thermodynamic equilibrium. d – Sandford and Allamandola (1990); e – Bernstein et al.
(2005); f – Kumar et al. (2009); g – Fleyfel and Devlin (1991); h – Dartois and Schmitt (2009).
904 A. Oancea et al. / Icarus 221 (2012) 900–910
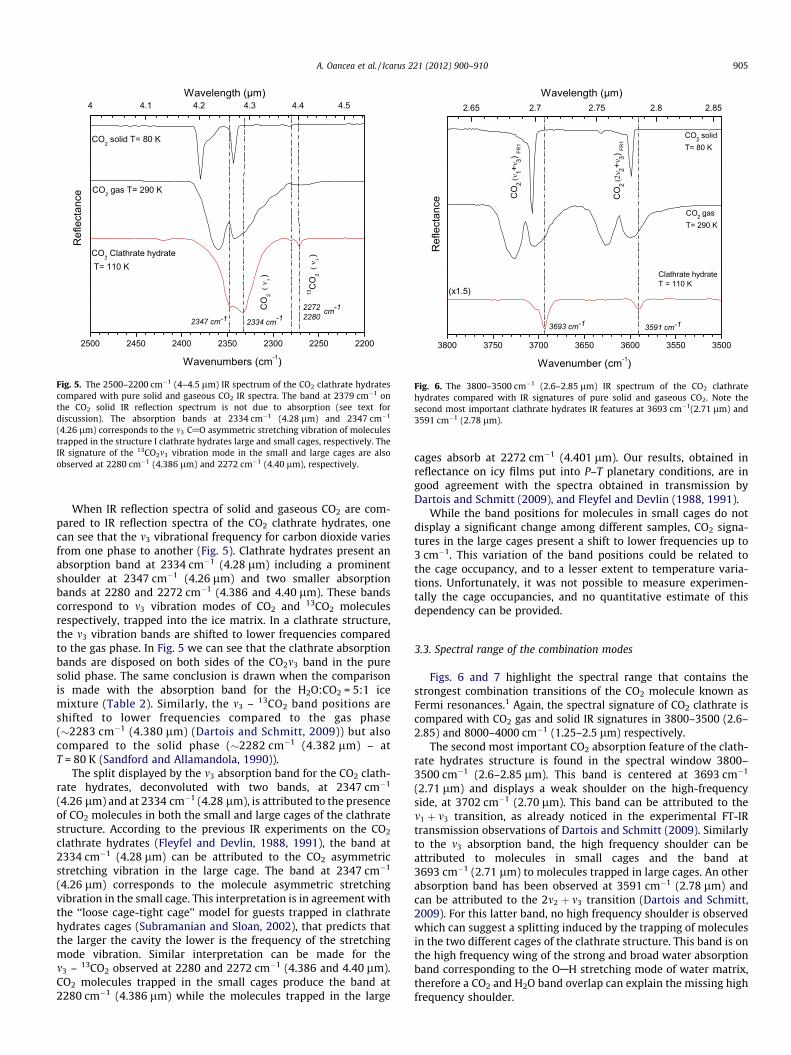
When IR reflection spectra of solid and gaseous CO2 are com-pared to IR reflection spectra of the CO2 clathrate hydrates, onecan see that the m3 vibrational frequency for carbon dioxide variesfrom one phase to another (Fig. 5). Clathrate hydrates present anabsorption band at 2334 cm!1 (4.28 lm) including a prominentshoulder at 2347 cm!1 (4.26 lm) and two smaller absorptionbands at 2280 and 2272 cm!1 (4.386 and 4.40 lm). These bandscorrespond to m3 vibration modes of CO2 and 13CO2 moleculesrespectively, trapped into the ice matrix. In a clathrate structure,the m3 vibration bands are shifted to lower frequencies comparedto the gas phase. In Fig. 5 we can see that the clathrate absorptionbands are disposed on both sides of the CO2m3 band in the puresolid phase. The same conclusion is drawn when the comparisonis made with the absorption band for the H2O:CO2 = 5:1 icemixture (Table 2). Similarly, the m3 – 13CO2 band positions areshifted to lower frequencies compared to the gas phase("2283 cm!1 (4.380 lm) (Dartois and Schmitt, 2009)) but alsocompared to the solid phase ("2282 cm!1 (4.382 lm) – atT = 80 K (Sandford and Allamandola, 1990)).
The split displayed by the m3 absorption band for the CO2 clath-rate hydrates, deconvoluted with two bands, at 2347 cm!1
(4.26 lm) and at 2334 cm!1 (4.28 lm), is attributed to the presenceof CO2 molecules in both the small and large cages of the clathratestructure. According to the previous IR experiments on the CO2
clathrate hydrates (Fleyfel and Devlin, 1988, 1991), the band at2334 cm!1 (4.28 lm) can be attributed to the CO2 asymmetricstretching vibration in the large cage. The band at 2347 cm!1
(4.26 lm) corresponds to the molecule asymmetric stretchingvibration in the small cage. This interpretation is in agreement withthe ‘‘loose cage-tight cage’’ model for guests trapped in clathratehydrates cages (Subramanian and Sloan, 2002), that predicts thatthe larger the cavity the lower is the frequency of the stretchingmode vibration. Similar interpretation can be made for them3 – 13CO2 observed at 2280 and 2272 cm!1 (4.386 and 4.40 lm).CO2 molecules trapped in the small cages produce the band at2280 cm!1 (4.386 lm) while the molecules trapped in the large
cages absorb at 2272 cm!1 (4.401 lm). Our results, obtained inreflectance on icy films put into P–T planetary conditions, are ingood agreement with the spectra obtained in transmission byDartois and Schmitt (2009), and Fleyfel and Devlin (1988, 1991).
While the band positions for molecules in small cages do notdisplay a significant change among different samples, CO2 signa-tures in the large cages present a shift to lower frequencies up to3 cm!1. This variation of the band positions could be related tothe cage occupancy, and to a lesser extent to temperature varia-tions. Unfortunately, it was not possible to measure experimen-tally the cage occupancies, and no quantitative estimate of thisdependency can be provided.
3.3. Spectral range of the combination modes
Figs. 6 and 7 highlight the spectral range that contains thestrongest combination transitions of the CO2 molecule known asFermi resonances.1 Again, the spectral signature of CO2 clathrate iscompared with CO2 gas and solid IR signatures in 3800–3500 (2.6–2.85) and 8000–4000 cm!1 (1.25–2.5 lm) respectively.
The second most important CO2 absorption feature of the clath-rate hydrates structure is found in the spectral window 3800–3500 cm!1 (2.6–2.85 lm). This band is centered at 3693 cm!1
(2.71 lm) and displays a weak shoulder on the high-frequencyside, at 3702 cm!1 (2.70 lm). This band can be attributed to them1 ( m3 transition, as already noticed in the experimental FT-IRtransmission observations of Dartois and Schmitt (2009). Similarlyto the m3 absorption band, the high frequency shoulder can beattributed to molecules in small cages and the band at3693 cm!1 (2.71 lm) to molecules trapped in large cages. An otherabsorption band has been observed at 3591 cm!1 (2.78 lm) andcan be attributed to the 2m2 ( m3 transition (Dartois and Schmitt,2009). For this latter band, no high frequency shoulder is observedwhich can suggest a splitting induced by the trapping of moleculesin the two different cages of the clathrate structure. This band is onthe high frequency wing of the strong and broad water absorptionband corresponding to the OAH stretching mode of water matrix,therefore a CO2 and H2O band overlap can explain the missing highfrequency shoulder.
Fig. 5. The 2500–2200 cm!1 (4–4.5 lm) IR spectrum of the CO2 clathrate hydratescompared with pure solid and gaseous CO2 IR spectra. The band at 2379 cm!1 onthe CO2 solid IR reflection spectrum is not due to absorption (see text fordiscussion). The absorption bands at 2334 cm!1 (4.28 lm) and 2347 cm!1
(4.26 lm) corresponds to the m3 C@O asymmetric stretching vibration of moleculestrapped in the structure I clathrate hydrates large and small cages, respectively. TheIR signature of the 13CO2m3 vibration mode in the small and large cages are alsoobserved at 2280 cm!1 (4.386 lm) and 2272 cm!1 (4.40 lm), respectively.
Fig. 6. The 3800–3500 cm!1 (2.6–2.85 lm) IR spectrum of the CO2 clathratehydrates compared with IR signatures of pure solid and gaseous CO2. Note thesecond most important clathrate hydrates IR features at 3693 cm!1(2.71 lm) and3591 cm!1 (2.78 lm).
A. Oancea et al. / Icarus 221 (2012) 900–910 905
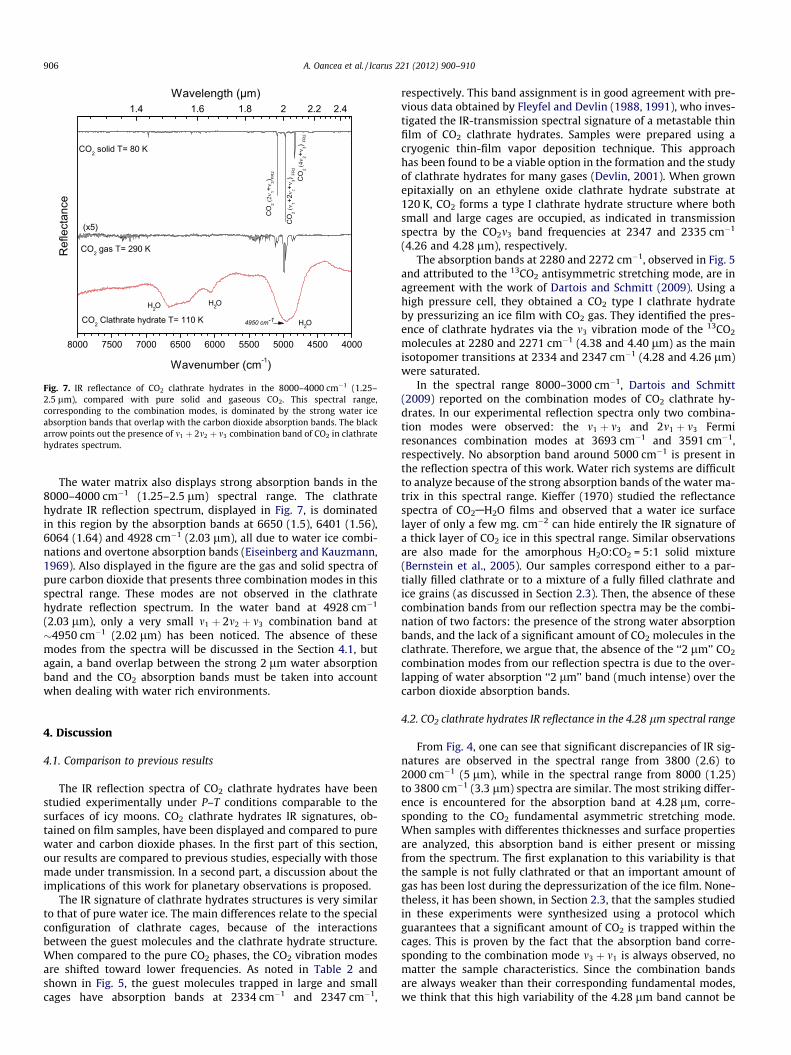
The water matrix also displays strong absorption bands in the8000–4000 cm!1 (1.25–2.5 lm) spectral range. The clathratehydrate IR reflection spectrum, displayed in Fig. 7, is dominatedin this region by the absorption bands at 6650 (1.5), 6401 (1.56),6064 (1.64) and 4928 cm!1 (2.03 lm), all due to water ice combi-nations and overtone absorption bands (Eiseinberg and Kauzmann,1969). Also displayed in the figure are the gas and solid spectra ofpure carbon dioxide that presents three combination modes in thisspectral range. These modes are not observed in the clathratehydrate reflection spectrum. In the water band at 4928 cm!1
(2.03 lm), only a very small m1 ( 2m2 ( m3 combination band at"4950 cm!1 (2.02 lm) has been noticed. The absence of thesemodes from the spectra will be discussed in the Section 4.1, butagain, a band overlap between the strong 2 lm water absorptionband and the CO2 absorption bands must be taken into accountwhen dealing with water rich environments.
4. Discussion
4.1. Comparison to previous results
The IR reflection spectra of CO2 clathrate hydrates have beenstudied experimentally under P–T conditions comparable to thesurfaces of icy moons. CO2 clathrate hydrates IR signatures, ob-tained on film samples, have been displayed and compared to purewater and carbon dioxide phases. In the first part of this section,our results are compared to previous studies, especially with thosemade under transmission. In a second part, a discussion about theimplications of this work for planetary observations is proposed.
The IR signature of clathrate hydrates structures is very similarto that of pure water ice. The main differences relate to the specialconfiguration of clathrate cages, because of the interactionsbetween the guest molecules and the clathrate hydrate structure.When compared to the pure CO2 phases, the CO2 vibration modesare shifted toward lower frequencies. As noted in Table 2 andshown in Fig. 5, the guest molecules trapped in large and smallcages have absorption bands at 2334 cm!1 and 2347 cm!1,
respectively. This band assignment is in good agreement with pre-vious data obtained by Fleyfel and Devlin (1988, 1991), who inves-tigated the IR-transmission spectral signature of a metastable thinfilm of CO2 clathrate hydrates. Samples were prepared using acryogenic thin-film vapor deposition technique. This approachhas been found to be a viable option in the formation and the studyof clathrate hydrates for many gases (Devlin, 2001). When grownepitaxially on an ethylene oxide clathrate hydrate substrate at120 K, CO2 forms a type I clathrate hydrate structure where bothsmall and large cages are occupied, as indicated in transmissionspectra by the CO2m3 band frequencies at 2347 and 2335 cm!1
(4.26 and 4.28 lm), respectively.The absorption bands at 2280 and 2272 cm!1, observed in Fig. 5
and attributed to the 13CO2 antisymmetric stretching mode, are inagreement with the work of Dartois and Schmitt (2009). Using ahigh pressure cell, they obtained a CO2 type I clathrate hydrateby pressurizing an ice film with CO2 gas. They identified the pres-ence of clathrate hydrates via the m3 vibration mode of the 13CO2
molecules at 2280 and 2271 cm!1 (4.38 and 4.40 lm) as the mainisotopomer transitions at 2334 and 2347 cm!1 (4.28 and 4.26 lm)were saturated.
In the spectral range 8000–3000 cm!1, Dartois and Schmitt(2009) reported on the combination modes of CO2 clathrate hy-drates. In our experimental reflection spectra only two combina-tion modes were observed: the m1 ( m3 and 2m1 ( m3 Fermiresonances combination modes at 3693 cm!1 and 3591 cm!1,respectively. No absorption band around 5000 cm!1 is present inthe reflection spectra of this work. Water rich systems are difficultto analyze because of the strong absorption bands of the water ma-trix in this spectral range. Kieffer (1970) studied the reflectancespectra of CO2AH2O films and observed that a water ice surfacelayer of only a few mg. cm!2 can hide entirely the IR signature ofa thick layer of CO2 ice in this spectral range. Similar observationsare also made for the amorphous H2O:CO2 = 5:1 solid mixture(Bernstein et al., 2005). Our samples correspond either to a par-tially filled clathrate or to a mixture of a fully filled clathrate andice grains (as discussed in Section 2.3). Then, the absence of thesecombination bands from our reflection spectra may be the combi-nation of two factors: the presence of the strong water absorptionbands, and the lack of a significant amount of CO2 molecules in theclathrate. Therefore, we argue that, the absence of the ‘‘2 lm’’ CO2
combination modes from our reflection spectra is due to the over-lapping of water absorption ‘‘2 lm’’ band (much intense) over thecarbon dioxide absorption bands.
4.2. CO2 clathrate hydrates IR reflectance in the 4.28 lm spectral range
From Fig. 4, one can see that significant discrepancies of IR sig-natures are observed in the spectral range from 3800 (2.6) to2000 cm!1 (5 lm), while in the spectral range from 8000 (1.25)to 3800 cm!1 (3.3 lm) spectra are similar. The most striking differ-ence is encountered for the absorption band at 4.28 lm, corre-sponding to the CO2 fundamental asymmetric stretching mode.When samples with differentes thicknesses and surface propertiesare analyzed, this absorption band is either present or missingfrom the spectrum. The first explanation to this variability is thatthe sample is not fully clathrated or that an important amount ofgas has been lost during the depressurization of the ice film. None-theless, it has been shown, in Section 2.3, that the samples studiedin these experiments were synthesized using a protocol whichguarantees that a significant amount of CO2 is trapped within thecages. This is proven by the fact that the absorption band corre-sponding to the combination mode m3 ( m1 is always observed, nomatter the sample characteristics. Since the combination bandsare always weaker than their corresponding fundamental modes,we think that this high variability of the 4.28 lm band cannot be
Fig. 7. IR reflectance of CO2 clathrate hydrates in the 8000–4000 cm!1 (1.25–2.5 lm), compared with pure solid and gaseous CO2. This spectral range,corresponding to the combination modes, is dominated by the strong water iceabsorption bands that overlap with the carbon dioxide absorption bands. The blackarrow points out the presence of m1 ( 2m2 ( m3 combination band of CO2 in clathratehydrates spectrum.
906 A. Oancea et al. / Icarus 221 (2012) 900–910
explained only by a compositional variation of our samples, but israther due to optical transfer effects as explained below.
The reflected light from a large grain or film surface is the com-bination of two main processes (Hapke, 1993). First, there is thesurface scattering, that occurs when the light is scattered fromthe outer surface of a sample. Second, there is the internal or vol-ume scattering, that occurs when the light has been refracted intothe interior of the grain and scattered back out. The later process isdue to imperfections such as crystal boundaries, micro-inclusionsor density striations. The volume scattering depends on theabsorption coefficient of the sample and it is proportional to e!ad,where a ) 4pk=k is the absorption coefficient and d is the particlesize (Hapke, 1981; Clark and Roush, 1984; Verbiscer et al., 1998).Two types of surface reflection occur when light interacts with asurface: specular reflection for a smooth surface or diffuse reflec-tance for an irregular surface geometry. The surface scattering atnormal incidence is proportional to the Fresnel reflection coeffi-cient R ) &n!1'2(k2
&n(1'2(k2. Combination of optical and physical sample
characteristics determine which of these processes is predominant(Hapke, 1993).
When k < 0:1, meaning small absorption coefficient, the mainprocess is the volume backscattering (Hapke, 1993) and the reflec-tance spectrum is qualitatively similar to a transmission spectrum.In the case of CO2 clathrates, both water ice and carbon dioxidehave k < 0:1 in the spectral region from 8000 (1.25) to3800 cm!1 (2.6 lm), where no spectral variations were observed(Fig. 4). Furthermore, there is no influence of the surface character-istics on the total reflectance. In this spectral region, the reflectanceis only influenced by the thickness of clathrate hydrates films viadeeper absorption bands when the film thickness increases(Jaumann et al., 2008; Taffin et al., 2012).
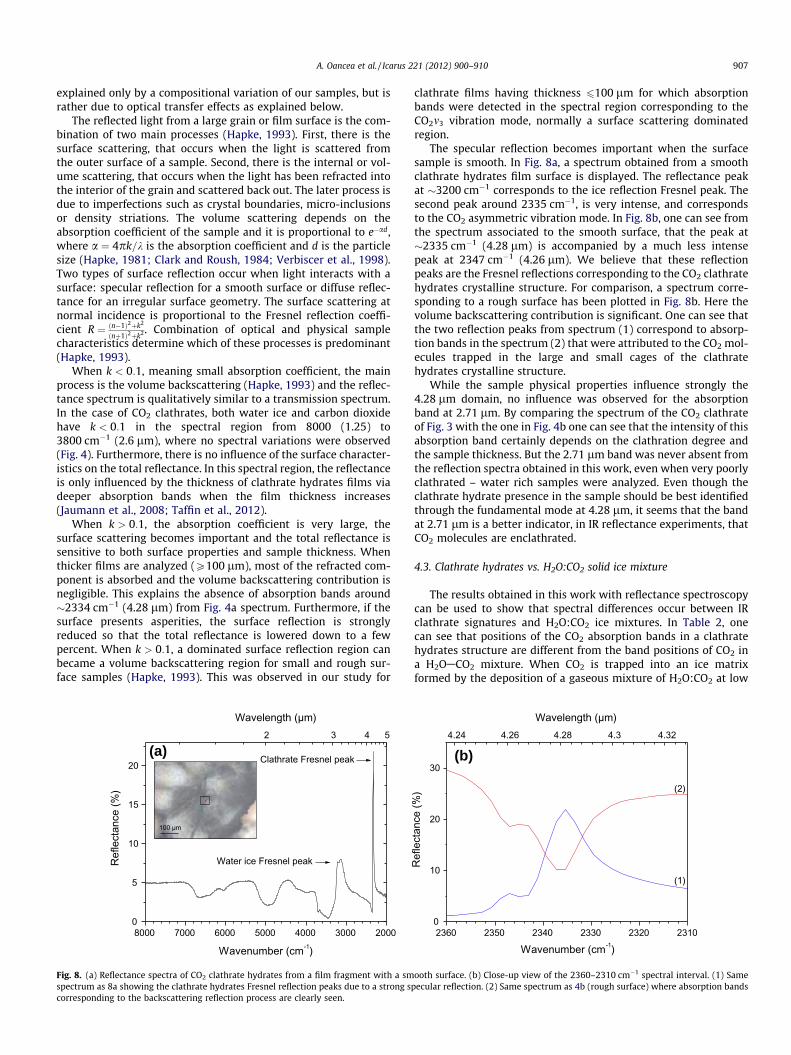
When k > 0:1, the absorption coefficient is very large, thesurface scattering becomes important and the total reflectance issensitive to both surface properties and sample thickness. Whenthicker films are analyzed (P100 lm), most of the refracted com-ponent is absorbed and the volume backscattering contribution isnegligible. This explains the absence of absorption bands around"2334 cm!1 (4.28 lm) from Fig. 4a spectrum. Furthermore, if thesurface presents asperities, the surface reflection is stronglyreduced so that the total reflectance is lowered down to a fewpercent. When k > 0:1, a dominated surface reflection region canbecame a volume backscattering region for small and rough sur-face samples (Hapke, 1993). This was observed in our study for
clathrate films having thickness 6100 lm for which absorptionbands were detected in the spectral region corresponding to theCO2m3 vibration mode, normally a surface scattering dominatedregion.
The specular reflection becomes important when the surfacesample is smooth. In Fig. 8a, a spectrum obtained from a smoothclathrate hydrates film surface is displayed. The reflectance peakat "3200 cm!1 corresponds to the ice reflection Fresnel peak. Thesecond peak around 2335 cm!1, is very intense, and correspondsto the CO2 asymmetric vibration mode. In Fig. 8b, one can see fromthe spectrum associated to the smooth surface, that the peak at"2335 cm!1 (4.28 lm) is accompanied by a much less intensepeak at 2347 cm!1 (4.26 lm). We believe that these reflectionpeaks are the Fresnel reflections corresponding to the CO2 clathratehydrates crystalline structure. For comparison, a spectrum corre-sponding to a rough surface has been plotted in Fig. 8b. Here thevolume backscattering contribution is significant. One can see thatthe two reflection peaks from spectrum (1) correspond to absorp-tion bands in the spectrum (2) that were attributed to the CO2 mol-ecules trapped in the large and small cages of the clathratehydrates crystalline structure.
While the sample physical properties influence strongly the4.28 lm domain, no influence was observed for the absorptionband at 2.71 lm. By comparing the spectrum of the CO2 clathrateof Fig. 3 with the one in Fig. 4b one can see that the intensity of thisabsorption band certainly depends on the clathration degree andthe sample thickness. But the 2.71 lm band was never absent fromthe reflection spectra obtained in this work, even when very poorlyclathrated – water rich samples were analyzed. Even though theclathrate hydrate presence in the sample should be best identifiedthrough the fundamental mode at 4.28 lm, it seems that the bandat 2.71 lm is a better indicator, in IR reflectance experiments, thatCO2 molecules are enclathrated.
4.3. Clathrate hydrates vs. H2O:CO2 solid ice mixture
The results obtained in this work with reflectance spectroscopycan be used to show that spectral differences occur between IRclathrate signatures and H2O:CO2 ice mixtures. In Table 2, onecan see that positions of the CO2 absorption bands in a clathratehydrates structure are different from the band positions of CO2 ina H2OACO2 mixture. When CO2 is trapped into an ice matrixformed by the deposition of a gaseous mixture of H2O:CO2 at low
8000 7000 6000 5000 4000 3000 20000
5
10
15
20 Clathrate Fresnel peak
Ref
lect
ance
(%)
Wavenumber (cm-1)
100 !m
Water ice Fresnel peak
2 3 4 5
Wavelength (!m)
2360 2350 2340 2330 2320 23100
10
20
30
(2)
(1)
Ref
lect
ance
(%)
Wavenumber (cm-1)
4.24 4.26 4.28 4.3 4.32
Wavelength (!m)
(a) (b)
Fig. 8. (a) Reflectance spectra of CO2 clathrate hydrates from a film fragment with a smooth surface. (b) Close-up view of the 2360–2310 cm!1 spectral interval. (1) Samespectrum as 8a showing the clathrate hydrates Fresnel reflection peaks due to a strong specular reflection. (2) Same spectrum as 4b (rough surface) where absorption bandscorresponding to the backscattering reflection process are clearly seen.
A. Oancea et al. / Icarus 221 (2012) 900–910 907

temperatures (10–80 K) it produces relatively broad bands shiftedto lower frequencies than those of pure CO2 under the same condi-tions. For example, for a H2O:CO2 = 5:1 ice mixture the m3 stretch-ing is temperature dependent. It gives a single band which shiftsfrom 2339.8 cm!1 (4.273 lm) at 10 K down to 2338.6 cm!1
(4.276 lm) at 100 K (Sandford and Allamandola, 1990). In additionto the difference between band positions, the m3 band splitting isnot observed for the ice mixtures. Moreover, the CO2 2m3 forbiddenovertone near 4685 cm!1 (2.134 lm) specific to CO2 isolated in anice matrix (H2O, N2, Ar) (Bernstein et al., 2005; Quirico and Schmitt,1997) is not active for the clathrate hydrates.
4.4. From laboratory measurements to natural planetary surfaces
The remote sensing planetary observations obtained throughspace missions provide now valuable information about the com-position and planetary surface texture of the Solar System objects.But in order to interpret these observations, laboratory data (spec-tra and optical constants) about the molecular species suspected tobe present at the surface or in the atmosphere of the icy objects areneeded. First, thin samples spectra are used to determine opticalconstants and also to set up models describing planetary surfaces.Second, thick samples spectra are needed to reproduce the nearinfrared combination modes that can be weaker than their corre-sponding fundamentals (Dalton et al., 2010). These absorptionbands are, most of the time, noticed in planetary observationsbecause the optical paths of light through the planetary regolithsare usually very long (Dalton et al., 2010). In our investigation ofCO2 clathrate hydrates IR signatures, temperature, pressure andsample size were comparable to the surface planetary conditions.The laboratory measurements were performed in the temperaturerange of the surfaces of icy bodies, 80–110 K, and the samples weresufficiently thick (>20 lm) for the near-infrared absorptions to benoticeable. The IR properties of CO2 clathrate hydrates were inves-tigated in the 1–5 lm domain, which corresponds to the spectralrange of the Galileo NIMS and Cassini VIMS imaging spectrometers.
A recent paper, published by Cruikshank et al. (2010), reviewsthe CO2 spectral bands discovered by VIMS on the Saturn satellitesPhoebe, Iapetus, Hyperion and Dione. As shown by Cruikshanket al. (2010), the CO2 spectral band detected on Phoebe is indistin-guishable from that of solid CO2 or that of CO2 molecules trappedin the small cages of a clathrate hydrates structure II. The bandposition from the three other satellites corresponds to CO2 trapped
in a complex material, but no indication exists whether this later iswater or some mineral or complex organic compound.
The Fig. 9a presents the CO2 bands of the four satellites, alongwith the reflectance spectra obtained in the present study for theCO2 clathrate hydrates structure I. This figure reinforces the con-clusion of Cruikshank et al. (2010): the spectral bands detectedby VIMS do not correspond to a clathrate hydrates structure I.The band position for Phoebe could suggest the presence ofclathrate hydrates structure II on the surface but raises anotherquestion: how these clathrate hydrates are produced? Two possi-bilities exist: first, clathrates hydrates form at the moon’s surfaceby slow co-deposition of gaseous mixtures of H2OACO2 or second,clathrate hydrates formed into the planet interior have beenreleased to the surface. The CO2 molecule is a clathrate type Iforming molecule. The low pressure deposition technique, success-fully formed type II structure only when a pre-organized structureII was used as a substrate (Fleyfel and Devlin, 1991). Under highpressure conditions, the formation of a structure II has never beenobserved. The only case where a transient CO2 structure II wasobserved, is at moderate pressures during the early stages of clath-rate hydrates formation from ice exposed to CO2 gas (Staykovaet al., 2003) or in multiple guests systems (N2ACO2) (Chazallonet al., 2011). We believe that comparison of VIMS data to lab data,and especially the new evidences provided in reflectance in thiswork, together with the apparent difficulty to form structure IIwith CO2, are arguments against the existence at planetary scalesof CO2 clathrate hydrates on the surface of the moons.
As shown in our spectra, the CO2 clathrate hydrates present animportant absorption band at 2.71 lm. The 4.26 lm has beenextensively used, contrarily to the 2.71 lm domain. In this workwe have shown that the reflectance spectra of CO2 clathrate arestrongly influenced by the surface properties but also by sampleoptical properties. These influences are important in the 4.26 lmregion, but not in the 2.71 lm domain, since this band was alwaysobserved during our experiments, independently of the sampleproperties. This domain is not easy to investigate due to the pres-ence of the strongly ‘‘3 lm’’ absorbing water ice band. In Fig. 9b there-sampling at VIMS resolution of the lab spectrum of the CO2 in2.7 lm spectral range is presented. VIMS have in this spectralrange channels at 2.66, 2.68, 2.69, 2.71 and 2.73 lm. The narrowlaboratory band became only a small inflection in the re-sampledspectra at VIMS resolution. In fact, this combination band isbetween two VIMS channels and only the right wing of the band
a
bc
d
4.15 4.20 4.25 4.30 4.350.0
0.2
0.4
0.6
0.8
1.0
1.2
Nor
mal
ized
Ref
lect
ance
Wavelength ( m) Wavelength ( m)2.5 2.6 2.7 2.8 2.9 3.0 3.1
Ref
lect
ance
Laboratory spectrum CO2 Clathrate at VIMS
resolution
(a) (b)
Fig. 9. (a) The CO2 band on four of Saturn’s satellites compared to the CO2 band in type I clathrate hydrates (this study) re-sampled at VIMS resolution. (a) Phoebe, (b)Hyperion, (c) Dione, (d) Iapetus from Cruikshank et al. (2010). Blue dashed line spectrum – 25 lm thick clathrate film; red dotted line spectrum – 100 lm thick clathrate film;(b) The laboratory spectrum (bottom) of type I CO2 clathrate hydrates in the 2.7 lm spectral range re-sampled at VIMS resolution (top spectrum). (For interpretation of thereferences to color in this figure legend, the reader is referred to the web version of this article.)
908 A. Oancea et al. / Icarus 221 (2012) 900–910
is actually re-sampled, leading to the conclusion that a less intenseband will not appear in the VIMS spectra. The discriminationbetween CO2 gas, solid and clathrate seems to be possible only ifa sufficient amount of molecules are present. However the discrim-ination between CO2 clathrate and CO2 into an icy mixture withwater ice is not possible at this resolution. The combination bandaround 2.78 lm that occurs for the CO2 in gas, ice, icy mixturesand clathrates is dependent on the amount of the carbon dioxidemolecules in the samples. This band is even more difficult to detectin ices dominated by water since it occurs on the high frequencyside of the strong OAH stretching mode. In this case, a band over-lap occurs between water and carbon dioxide.
5. Conclusions
In this study, we have analyzed experimentally the IR reflec-tance spectra of the CO2 clathrate hydrates under P–T conditionscomparable to the surfaces of the icy moons. Film samples havebeen obtained experimentally and their spectral characteristicshave been determined in the infrared domain from 1 to 5 lm. Ithas been shown that CO2 clathrate hydrates IR reflection signaturehas the fingerprint of the water ice structure and it is stronglyinfluenced by the optical radiative transfer. However unique spec-tral features, related to the absorption bands of CO2 guest mole-cules in clathrate hydrates cages, have also been identified. Inthis work three main absorption bands have been described at2.71, 4.26, 4.28 lm (3693, 2347, 2334 cm!1) as corresponding toCO2 trapped in the clathrate structure.
The 4.26 and 4.28 lm (2347, 2334 cm!1) bands correspond tothe same absorption mode (asymmetric stretching vibration) butfor molecules trapped in small and large cages, respectively. Theseabsorption bands are influenced by optical and physical character-istics of the sample. The large cage band position seems to be influ-enced by the amount of CO2 into clathrate cages but it was out ofthe scope of this experimental work to quantify this effect.
The band at 2.71 lm (3693 cm!1) was found to be the mostprominent combination band of carbon dioxide trapped in clath-rate cages. By contrast to the asymmetric absorption mode, thestrength of this band was not influenced by any optical parameter.This absorption band was always observed during our experimentsand did not depend on sample properties.
Comparison between the absorption bands of CO2 clathrate,pure CO2 and CO2AH2O ice mixtures showed that spectral discrim-ination can be achieved easily, especially in the domain of the fun-damental absorption modes. The carbon dioxide in CO2AH2O icemixtures is distinguished from pure phases by the presence ofthe forbidden CO2 2m3 overtone (2.134 lm) along with the otherband positions spectral shift. Besides the band positions, clathratehydrates are distinguished from pure phases and ice mixtures bythe m3 absorption band splitting induced by the special configura-tion of clathrate cages.
A comparison between the absorption bands of CO2 clathratehydrates obtained in the 4.28 lm region and the CO2 absorptionbands detected by VIMS on the icy satellites of Saturn has been dis-cussed. This experimental work confirms that VIMS data are notconsistent with the presence of structure I CO2 clathrate hydrateson the surface of the icy moons. Possibility of having metastablestructure II still remains unsolved, but the natural condition atthe icy satellites surfaces and the difficulty to form this latter struc-ture are arguments against its existence at planetary surfaces.Finally, the clathrate hydrates structure is also characterized bythe 2.71 lm absorption band. This specific spectral domain, hasnot been extensively investigated so far for planetary purposes,because most of the time this range is dominated by the strongdecrease of the 3 lm water absorption. Moreover, the 2.71 lm
band occurs between two VIMS channels, which complicates theidentification of the CO2 clathrate hydrates on Saturn’s icy moons.High spatial resolution data obtained by VIMS may allow a betterinvestigation of subtle features in this spectral range, by possiblyinvestigating purer exposures of CO2 clathrate hydrate. On theother hand, systems with a higher spectral resolution might beable to detect a potential signature, if any.
CO2 clathrates might also be present on the polar caps of Mars.However, their detection using orbital remote sensing observationsmight be complicated by the signatures of the CO2 which is presentin the atmosphere, and by the CO2 ice on the cap itself. Finally, ourexperimental results might also prove to be useful to analyze datafrom other forthcoming missions toward icy bodies such as the Ro-setta spacecraft, which will reach the Churyumov–Gerasimenkocomet in 2014, New-Horizon which will reach the system of Plutoin 2015, or the JUICE mission planned to reach the system of Jupi-ter in 2030.
Acknowledgments
The research leading to these results has received funding fromthe European Research Council under the European Community’sSeventh Framework Programme (FP7/2007–2013 Grant Agree-ment No. 259285) and from the University of Nantes. We alsothank the PRES-UNAM and the Centre National d’Etudes Spatiales(CNES agency) for their support.
References
Baratta, G.A., Palumbo, M.E., 1998. Infrared optical constants of CO and CO2 thin icyfilms. Astron. Astrophys. 357, 1045–1050.
Baratta, G.A., Palumbo, M.E., Strazzulla, G., 2000. Laboratory and astronomical IRspectra: An experimental clue for their comparison. Astron. Astrophys. 357,1045–1050.
Bernstein, M.P., Cruikshank, D.P., Sandford, S.A., 2005. Near-infrared laboratoryspectra of solid H2O/CO2 and CH3OH/CO2 ice mixtures. Icarus 179, 527–534.
Buratti, B.J. et al., 2005. Cassini visual and infrared mapping spectrometerobservations of Iapetus: Detection of CO2. Astrophys. J. 622, L149–L152.
Chastain, B.K., Chevrier, V., 2007. Methane clathrate hydrates as a potential sourcefor martian atmospheric methane. Planet. Space Sci. 55, 1246–1256.
Chazallon, B., 2011. CO2 capture by gas hydrate crystallization: Investigation ofequilibrium and compositional properties of CO2AN2 hydrates by micro-Ramanspectroscopy. In: Furukawa, Y. et al. (Eds.), Physics and Chemistry of Ice.Hokkaido University Press, Sapporo, pp. 173–181.
Choukroun, M., Kieffer, S.W., Lu, X., Tobie, G., 2012. Clathrate hydrates: Implicationsfor exchange processes in the outer Solar System. In: Gudipati, M.S., Castillo-Rogez, J. (Eds.), The Science of Solar System Ices. Astrophysics and Space ScienceLibrary.
Circone, S. et al., 2003. CO2 hydrate: Synthesis, composition, structure, dissociationbehavior, and a comparison to structure I CH4 hydrate. J. Phys. Chem. B 107,5529–5539.
Clark, R.N. et al., 2005. Compositional maps of Saturn’s moon Phoebe from imagingspectroscopy. Nature 435, 66–69.
Clark, R.N., Roush, T.L., 1984. Reflectance spectroscopy: Quantitative analysistechniques for remote sensing applications. J. Geophys. Res. 89, 6329–6340.
Cruikshank, D.P., Meyer, A.W., Brown, R.H., Clark, R.N., Jaumann, R., Stephan, K.,Hibbitts, C.A., Sandford, S.A., Mastrapa, R.M.E., FilaCchione, G., et al., 2010.Carbon dioxide on the Satellites of Saturn: Results from the Cassini VIMSinvestigation and revisions to the VIMS wavelength scale. Icarus 206, 561–572.
Dalton, J.B., 2010. Spectroscopy of icy moons. Space Sci. Rev. 153, 219–247.Dalton, J.B. et al., 2010. Chemical composition of icy satellite surfaces. Space Sci.
Rev. 153, 113–154.Dartois, E., Schmitt, B., 2009. Carbon dioxide clathrate hydrate FT-IR spectrum. Near
infrared combination modes for astrophysical remote detection. Astron.Astrophys. 504, 869–873.
Devlin, J.P., 2001. Structure, spectra and mobility of low pressure ices: Ice I,amorphous solid water, and clathrate hydrate at T < 150 K. J. Geophys. Res. 106,33333–33349.
Ehrenfreund, P., Boogert, A.C.A., Gerakines, P.A., Tielens, A.G.G.M., van Dishoeck, E.F.,1997. Infrared spectroscopy of interstellar apolar ice analogs. Astron. Astrophys.328, 649–669.
Eiseinberg, D., Kauzmann, W., 1969. The Structure and Properties of Water. OxfordUniversity Press.
Falenty, A., Kuhs, K.F., 2009. Self-preservation of CO2 gas hydrates surfacemicrostructure and ice perfection. J. Phys. Chem. B 113, 15975–15988.
Fleyfel, F., Devlin, J.P., 1988. FT-IR spectra of 90 K films of simple, mixed and doubleclathrate hydrates of trimethylene oxide, methyl chloride, carbon dioxide,
A. Oancea et al. / Icarus 221 (2012) 900–910 909
tetrahydrofuran and ethylene oxide containing decoupled D2O. J. Phys. Chem.92, 631–635.
Fleyfel, F., Devlin, J.P., 1991. Carbon dioxide clathrate hydrate epitaxial growth:Spectroscopic evidence for formation of the simple type II CO2 hydrate. J. Phys.Chem. 95, 3811–3815.
Fray, N., Marboeuf, U., Brissaud, O., Schmitt, B., 2010. Equilibrium data of methane,carbon dioxide, and xenon clathrate hydrates below the freezing point of water.Applications to astrophysical environments. J. Chem. Eng. Data 55, 5101–5108.
Hansen, G.B., McCord, T.B., 2008. Widespread CO2 and other non-ice compounds onthe anti-Jovian and trailing sides of Europa from Galileo/NIMS observations. J.Geophys. Res. 35, L01202.
Hapke, B., 1981. Bidirectional reflectance spectroscopy: 1. Theory. J. Geophys. Res.86, 3039–3054.
Hapke, B., 1993. Theory of Reflectance and Emittance Spectroscopy. CambridgeUniversity Press.
Hapke, B., Wells, E., Wagner, J., Partlow, W., 1981. Far-UV, visible, and near-IRreflectance spectra of frosts of H2O, CO2, NH3 and SO2. Icarus. 47, 361–376.
Hibbitts, C.A., McCord, T.B., Hansen, G.B., 2000. Distributions of CO2 and SO2 on thesurface of Callisto. J. Geophys. Res. 105, 22541–22557.
Jaumann, R., Stephan, K., Hansen, G.B., Clark, R.N., Buratti, B.J., Brown, R.H., Baines,K.H., Newman, S.F., Bellucci, G., Filacchione, G., et al., 2008. Distribution of icyparticles across Enceladus’surface as derived from Cassini-VIMS measurements.Icarus 193, 407–419.
Kargel, J.S., Lunine, J.I., 1998. Clathrate hydrate on Earth and in the Solar System. In:Schmitt, B. et al. (Eds.), Solar System Ices. Kluwer Academic Publishers, pp. 97–117.
Kieffer, H., 1970. Spectral reflectance of H2O – CO2 frosts. J. Geophys. Res. 75, 501–509.
Kumar, R., Lang, S., Englezos, P., Ripmeester, J.A., 2009. Application of the ATR-IRspectroscopic technique to the characterization of hydrates formed by CO2, CO2/H2 and CO2/H2/C3H8. J. Phys. Chem. A 113, 6308–6313.
Larson, S., 1955. Phase studies of the two component carbon dioxide-water system,involving the carbon dioxide hydrates. Ph.D. thesis. University of Illinois(quoted in Sloan (1989)).
Marboeuf, U., Mousis, O., Petit, J.M., Schmitt, B., 2010. Clathrate hydrates formationin short-period comets. Astrophys. J. 708, 812–816.
Miller, S.L., Smythe, W.D., 1970. Carbon dioxide clathrate in the martian Ice Cap.Science 170, 531–533.
Mousis, O. et al., 2009. Clathration of volatiles in the solar nebula and implicationsfor the origin of Titan’s atmosphere. Astrophys. J. 691, 1780–1786.
Mousis, O., Lunine, J.I., Picaud, S., Cordier, D., 2010. Volatile inventories in clathratehydrates formed in the primordial nebula. Faraday Discuss. 147, 509–525.
Ng, H.J., Robinson, D.B., 1985. Hydrate formation in systems containing methane,ethane, propane, carbon dioxide or hydrogene sulfide in the presence ofmethanol. Fluid Phase Equilib. 21, 145–155 (quoted in Sloan (1998)).
Oberg, K.I. et al., 2007. Effects of CO2 on H2O band profiles and band strengths inmixed H2O:CO2 ices mixture. Astron. Astrophys. 462, 1187–1198.
Osberg, W.E., Hornig, D.F., 1952. The vibrational spectra of molecules and complexions in crystals. VI. Carbon dioxide. J. Chem. Phys. 20, 1345–1347.
Osegovic, J.P., Max, M.D., 2005. Compound clathrate hydrate on Titan’s surface. J.Geophys. Res. 110, E08004.
Quirico, E., Schmitt, B., 1997. Near-infrared spectroscopy of simple hydrocarbonsand carbon oxides diluted in solid N2 and as pure ices: Implications for Tritonand Pluto. Icarus 127, 354–378.
Ratcliffe, C.I., Ripmeester, J.A., 1986. 1H and 13C NMR studies on carbon dioxidehydrate. J. Phys. Chem. 90, 1259–1263.
Sandford, S.A., Allamandola, L.J., 1990. The physical and infrared spectral propertiesof CO2 in astrophysical ice analogs. Astrophys. J. 355, 357–372.
Schmitt, B., 1986. La surface de la glace: Structure, dynamique et interactions –Implications astrophysiques. Ph.D. thesis. University of Grenoble, Grenoble,France (quoted in Fray et al. (2010)).
Seo, Y.T., Lee, H., 2004. Structure and guest distribution of the mixed carbon dioxideand nitrogen hydrates as revealed by X-ray diffraction and 13C NMRspectroscopy. J. Phys. Chem. B 108, 530–534.
Sloan, E.D., 1998. Clathrate Hydrates of Natural Gases, second ed. Marcel Dekker,New York.
Smythe, W., 1975. Spectra of hydrate frosts: Their application to the outer SolarSystem. Icarus 24, 421–427.
Staykova, D.K., Kuhs, W.F., Salamatin, A.N., Hansen, T., 2003. Formation of porousgas hydrates from ice powders: Diffraction experiments and multistage model.J. Phys. Chem. B 107, 10299–10311.
Stern, L.A., Circone, S., Kirby, S.H., Durham, W.B., 2001. Anomalous preservation ofpure methane hydrate at 1 atm. J. Phys. Chem. B 105, 1756–1762.
Subramanian, S., Sloan, E.D., 2002. Trends in vibrational frequencies of guesttrapped in clathrate hydrate cages. J. Phys. Chem. B 106, 4348–4355.
Sum, A.K., Burruss, R.C., Sloan, E.D., 1997. Measurement of clathrate hydrates viaRaman spectroscopy. J. Phys. Chem. B 101, 7371–7377.
Taffin, C., Grasset, O., Le Menn, E., Bollengier, O., Giraud, M., Le Mouélic, S., 2012.Temperature and grain size dependence of near-IR spectral signature ofcrystalline water ice: From lab experiments to Enceladus’ south pole. Planet.Space Sci. 61, 124–134.
Takeya, S., Ripmeester, J.A., 2008. Dissociation behaviour of clathrate hydrates to iceand dependence on guest molecules. Angew. Chem. 120, 1296–1299.
Udachin, K.A., Ratcliffe, C.I., Ripmeester, J.A., 2001. Structure, composition andtemperature expansion of CO2 hydrate from single crystal X-ray diffractionmeasurements. J. Phys. Chem. B 105, 4200–4204.
Verbiscer, A., Helfenstein, P., 1998. Reflectance spectroscopy of icy surfaces. In:Schmitt, B. et al. (Eds.), Solar System Ices. Kluwer Academic Publishers, pp. 157–197.
910 A. Oancea et al. / Icarus 221 (2012) 900–910