Thermodynamic studies on Semi-Clathrate Hydrates of TBAB ...

Annu. Rev. Earth Planet. Sci. 2000. 28:477–507Copyright q 2000 by Annual Reviews. All rights reserved
0084–6597/00/0515–0367$14.00 477
CLATHRATE HYDRATES
Bruce A. BuffettDepartment of Earth and Ocean Sciences, University of British Columbia, Vancouver,Canada; V6T 1Z4
Key Words gas hydrates, methane source, carbon cycle, climate change, glacialcycles
Abstract Substantial volumes of methane gas are trapped below the seafloorand in permafrost by an ice-like solid called clathrate hydrate. Global estimates ofthe methane in clathrate hydrate may exceed 1016 kg, which represents one of thelargest sources of hydrocarbon on Earth. Speculations about large releases of methanefrom clathrate hydrate have raised serious but unresolved questions about its possiblerole in climate change. Progress in our understanding of clathrate hydrate has beenmade through integrated geophysical and geochemical surveys of known clathrateoccurrences. Details from these surveys have motivated new investigations of thephysical, chemical, and biological processes that contribute to growth and breakdownof clathrate hydrate in natural settings. In this article, I give an overview of recentadvances and future challenges.
INTRODUCTION
Conditions encountered in many regions of the solar system permit mixtures ofwater and various gases to crystallize into an icy solid known as clathrate hydrate(Miller 1961). The crystalline structure and physical properties of clathratehydrate are similar in many ways to those of ice. As in ice, the crystal structurein clathrate hydrate is composed of hydrogen-bounded water molecules, but theiropen arrangement accommodates small gas molecules in nearly spherical cavities(Jeffrey & McMullan 1967). Weak interactions between individual gas moleculesand the surrounding cage of water molecules help to stabilize the structure. Infact, a significant fraction of the cavities must be occupied with gas molecules toensure stability.
Interest in clathrate hydrate arises from its capacity to store large volumes ofgas. Clathrates probably formed in the solar nebula, trapping volatile gases intoicy solids (Lunine & Stevenson 1985). Methane and other gases are subsequentlyadded to planets and satellites by accretion of icy planetesimals or by infallingcometary material (Zahnle et al 1992). Although the existence of clathrates incomets is still debated (Klinger 1991), there are strong indications that clathrates
Ann
u. R
ev. E
arth
Pla
net.
Sci.
2000
.28:
477-
507.
Dow
nloa
ded
from
arj
ourn
als.
annu
alre
view
s.or
gby
Sta
te U
nive
rsity
of
New
Yor
k -
Ston
y B
rook
on
03/1
9/09
. For
per
sona
l use
onl
y.

478 BUFFETT
90˚
90˚
120˚
120˚
150˚
150˚
180˚
180˚
150˚
150˚
120˚
120˚
90˚
90˚
60˚
60˚
30˚
30˚
0˚
0˚
30˚
30˚
60˚
60˚
90˚ 90˚
60˚ 60˚
30˚ 30˚
0˚ 0˚
30˚ 30˚
60˚ 60˚
90˚ 90˚
Figure 1 Map showing the locations of known or inferred gas hydrate. The circles indi-cate sites in marine sediments, and the triangles denote permafrost sites. Adapted fromKvenvolden et al (1993).
play an important role in the atmospheres and interiors of satellites such as Titan(Lunine & Stevenson 1987).
Clathrates are also known to occur at or near the present-day surfaces of Marsand Earth. Clathrates of carbon dioxide are stable in the Martian ice caps (Miller& Symthe 1970), where they sequester carbon dioxide and water vapor from theatmosphere. Geological evidence of past flooding on Mars is sometimes linkedto a catastrophe breakdown of the clathrate hydrate and an associated release ofgreenhouse gases (Milton 1974, Baker et al 1991). Clathrates on Earth are foundin seafloor sediments along deep continental margins and in permafrost regions(see Figure 1). The gas component is mainly methane, although small amountsof heavier hydrocarbons, carbon dioxide, and hydrogen sulfide have also beenrecovered (Brooks et al 1986, Kastner et al 1998).
The amount of methane trapped in clathrate hydrate on Earth is uncertain, buteven conservative estimates are substantial. Kvenvolden (1988a) estimates that 22 1016 kg of carbon are trapped in oceanic sediments in the form of methanehydrate. Smaller contributions are expected in permafrost regions (MacDonald1990a). If these estimates are reliable, then clathrates represent the largest sourceof hydrocarbon on Earth. Such vast supplies of methane motivate interest inclathrate hydrate as an energy resource. The proximity of large volumes of themethane gas to the surface also raises questions about the role of clathrate hydratein past and present-day climate change (Kvenvolden 1988b, MacDonald 1990b).Release of methane gas into the atmosphere following the breakdown (dissocia-tion) of clathrate hydrate alters the radiative energy balance in the atmospherebecause methane is a strong greenhouse gas (Lashof & Ahuja 1990). Increases
Ann
u. R
ev. E
arth
Pla
net.
Sci.
2000
.28:
477-
507.
Dow
nloa
ded
from
arj
ourn
als.
annu
alre
view
s.or
gby
Sta
te U
nive
rsity
of
New
Yor
k -
Ston
y B
rook
on
03/1
9/09
. For
per
sona
l use
onl
y.

CLATHRATE HYDRATES 479
in atmospheric temperature may drive further dissociation of clathrate, whichprovides a positive feedback for global warming.
Clathrate hydrate may also play a role in past climate change. Nisbet (1990)suggests that dissociation of clathrates contributed to the rapid increase in atmo-spheric methane at the end of the last glaciation, which accelerated the retreat ofthe continental ice sheets. Alternatively, Paull et al (1991) suggest that clathratesare responsible for limiting the extent of glaciation. Because water is removedfrom the oceans during the growth of the ice sheets, pressure at the seafloor islowered and clathrates are expected to become unstable. Many of these specu-lations await further quantitative testing, but the implications are far-reaching.The goal of this review is to assess our current understanding of clathrate hydratesin natural environments and to identify the challenges that remain in assessingtheir role in climate change and other geological processes.
Before we proceed to more detailed discussions of clathrate hydrate in thegeological context, it is useful to make a few remarks regarding terminology.Clathrate hydrate is distinguished from several other types of hydrate by the natureof the interaction between gas and water molecules. In clathrate hydrate the gasand water interact through weak van der Waals forces. Other types of hydrateexist where the gas combines chemically with water molecules in fixed propor-tions (ammonia hydrate being one example). We exclude these types of hydratesfrom consideration in this review and follow customary practice by referring toclathrate hydrate as gas hydrate. For the purposes of this review, the terms clath-rate hydrate, gas hydrate, or simply hydrate are used interchangeably.
CRYSTAL STRUCTURE AND STABILITY
Thermodynamic conditions for the stability of clathrate hydrate are stronglydependent on the size and shape of the gas component. The gas molecules mustbe small enough to fit into the cavities of the lattice but large enough to lendstability to the structure. Early crystallographic studies of the clathrate structure(Pauling & Marsh 1952) initiated the development of a statistical thermodynamicmodel by van der Waals & Platteuw (1959). This model remains in use today forphase equilibria calculations, although more recent advances have refined someof the original approximations (Rodger 1990, Sparks & Tester 1992, Hwang etal 1993, Tanaka & Kiyohara 1993).
Clathrate hydrate can possess many different crystal structures (Belosludov etal 1991), but only three structures are known to occur in natural environments.Structure I and Structure II each have two cavity sizes (small and large), whereasthe recently discovered Structure H has three different types of cavities (Rip-meester et al 1987). Structure I is the most common form of clathrate in naturalsettings where methane is the main hydrate-forming gas. Structures II and H havebeen reported when the gas mixture includes larger molecules (Brooks et al 1986,Sassen & MacDonald 1994).
Ann
u. R
ev. E
arth
Pla
net.
Sci.
2000
.28:
477-
507.
Dow
nloa
ded
from
arj
ourn
als.
annu
alre
view
s.or
gby
Sta
te U
nive
rsity
of
New
Yor
k -
Ston
y B
rook
on
03/1
9/09
. For
per
sona
l use
onl
y.

480 BUFFETT
TABLE 1 Structure of hydrate crystals
Property Structure I Structure II
Cavity Small Large Small Large
Description 512 51262 512 51264
Cavities/unit cell 2 6 16 8
Average cavity radius (nm) 3.95 4.33 3.91 4.73
Water molecules/unit cell 46 136
Source: Sloan 1998
Figure 2 The shape of the small (left) and large (right) cavities in Structure I hydrate.
The shape of the small and large cavities of Structure I are illustrated in Figure2. The small cavity is composed of 20 water molecules arranged to form 12pentagonal faces. The resulting polyhedra is known as a dodecahedron, althougha more convenient nomenclature is 512 (Jeffrey & McMullan 1967). The largecavity contains 24 water molecules, which form 12 pentagonal and 2 hexagonalfaces (e.g. 51262). In Structure I the small cavities are located at the center andthe four corners of the unit cell to form a body-centered cubic structure. Sixadditional water molecules inside the unit cell (for a total of 46) link the smallcavities to form the large cavities. Each unit cell contains 2 small and 6 largecavities. Structure II is also constructed from 512 cavities, though a differentarrangement of the small cavities creates large cavities of type 51264 and intro-duces a small distortion into the small 512 cavities (Sloan 1998). Table 1 sum-marizes the key structural features of Structures I and II. Additional informationon Structure H is given by Ripmeester et al (1994).
Clathrate structures are determined mainly by the size of the gas molecules.Methane gas is small enough to enter the small and large cavities of both StructureI and II, but Structure I is preferred because methane contributes more to thestability of Structure I. Because the two structures differ most in the size andnumber of their large cavities (see Table 1), the preferred structure results froma more favorable fit of the methane molecule into the large cavity of Structure I.
Ann
u. R
ev. E
arth
Pla
net.
Sci.
2000
.28:
477-
507.
Dow
nloa
ded
from
arj
ourn
als.
annu
alre
view
s.or
gby
Sta
te U
nive
rsity
of
New
Yor
k -
Ston
y B
rook
on
03/1
9/09
. For
per
sona
l use
onl
y.

CLATHRATE HYDRATES 481
However, mixtures of methane and larger gas molecules can promote the for-mation of Structure II. For example, propane is too large to fit into either cavityof Structure I, but it fits comfortably into the large cavity of Structure II. Evensmall quantities of propane can enhance the stability of Structure II over StructureI, lowering the formation pressure relative to that of pure methane clathrate.Reductions in the formation pressure are also observed when methane is mixedwith other gases, including ethane, carbon dioxide, and hydrogen sulfide (Sloan1998).
The stability of clathrate hydrate is typically predicted using the statisticalthermodynamic model of van der Waals & Platteuw (1959). Clathrates are viewedas a solid solution of gas molecules in a metastable lattice of water molecules.Each gas molecule is confined to a single cage, where it interacts with the sur-rounding water molecules through weak van der Waals (dispersive) forces. Theseinteractions lower the free energy of the water molecules, making the clathratestructure stable when a sufficient number of cavities are filled with gas. (Wedenote the occupied fraction of small and large cavities by hs and hl, respectively.)The change in the free energy of the water molecules per mole (e.g. chemicalhDlw
potential) is expressed by van der Waals & Platteuw (1959) in the form
hDl 4 RT[m ln(1 1 h ) ` m ln(1 1 h )], (1)w s s l l
where ms and ml are the number of cavities per water molecule in the clathratelattice, R is the gas constant, and T is the temperature. For Structure I, ms 41/23 and ml 4 3/23 (see Table 1).
According to Equation 1, the reduction in the free energy of the water mole-cules depends only on the occupancy of the small and large cavities; there is noexplicit dependence on the type of gas molecules occupying the cavities. Differ-ences resulting from the size and shape of the gas molecules enter the thermo-dynamic model through their influence on hs and hl. For a single gas component,the occupancy is given by
C f C fs lh 4 ; h 4 , (2)s l1 ` C f 1 ` C fs l
where Cs and Cl are constants that depend on the interaction between the gas andwater molecules in the small and large cavities, and f is the fugacity of the gas.Extensions to the theory for mixtures of gases are straightforward (Sloan 1998).
The occupancies in Equation 2 are expressed in a form that is identical toLangmuir’s expression for the adsorption of gas onto a surface. In Langmuir’stheory, Cs and Cl are called Langmuir constants, and f reduces to the partialpressure for an ideal gas. This analogy with Langmuir’s theory provides a usefulconceptual model for describing the stability of clathrate hydrate. High gas pres-sure (corresponding to high f) increases the occupancy and lowers the free energyof the water molecules in the clathrate structure. A second contribution to the freeenergy of the water molecules, , represents the excess free energy needed tobDlw
Ann
u. R
ev. E
arth
Pla
net.
Sci.
2000
.28:
477-
507.
Dow
nloa
ded
from
arj
ourn
als.
annu
alre
view
s.or
gby
Sta
te U
nive
rsity
of
New
Yor
k -
Ston
y B
rook
on
03/1
9/09
. For
per
sona
l use
onl
y.

482 BUFFETT
Figure 3 Phase diagram for a methane-water mixture as a function of pressure andtemperature. Pressure is plotted as an equiv-alent depth assuming a hydrostatic gradientof 104 Pa m11. Temperature T3(P) boundsthe region where hydrate is stable and Tm isthe melting temperature of pure water.
Temperature (K)
Dep
th (
m)
0
500
1000
1500
2000270 280 290
liquid +vapor
liquid +hydrate
vapor +hydrate
ice + vapor
T (P)3
Tm
assemble the clathrate lattice from either liquid water or ice, depending on tem-perature. Clathrate becomes stable when the energy reduction resulting fromhDlw
occupation overcomes the energy excess associated with reorganizing waterbDlw
molecules into the clathrate lattice. Estimates of and cannot be uniquelyb hDl Dlw w
obtained from experiments because it is not possible to construct an empty clath-rate lattice. In practice, is obtained by fitting experimental measurements ofbDlw
clathrate formation temperatures and pressures for a number of different gases.The resulting estimates of are assumed to be independent of the gas com-bDlw
ponent, with the assumption that the gas molecules do not distort the clathratelattice. Although this assumption is reasonable for small molecules such as meth-ane, corrections have been proposed for some larger gases (Hwang et al 1993).Corrections must also be applied to account for the influences of pressure andtemperature on (see Holder et al 1988 for a review).bDlw
Phase Equilibria
Establishing the stability conditions for clathrate hydrate is essential for under-standing their role in geological processes. An important condition for stabilityis defined by requiring the clathrate phase to coexist with both the liquid andvapor phases in a three-phase equilibrium. This particular equilibrium state occursat temperature T3(P), which is solely a function of pressure P. Estimates of T3(P)for methane gas and pure water are shown in Figure 3, based on the phase equi-librium calculations of Sloan (1998). Pressure is expressed as an equivalent depth,assuming a hydrostatic pressure gradient of 104 Pa m11. Methane hydrate is stablewhen the temperature is less than or equal to T3(P). When T , T3(P), the clathratephase coexists with either the liquid or vapor phases, depending on the relativeabundance of water and gas. In the seafloor we expect water to be in greaterabundance, so the relevant two-phase equilibrium occurs between clathrate and
Ann
u. R
ev. E
arth
Pla
net.
Sci.
2000
.28:
477-
507.
Dow
nloa
ded
from
arj
ourn
als.
annu
alre
view
s.or
gby
Sta
te U
nive
rsity
of
New
Yor
k -
Ston
y B
rook
on
03/1
9/09
. For
per
sona
l use
onl
y.

CLATHRATE HYDRATES 483
0.0 0.001 0.002 0.003273
278
283
288
293
298
Tem
pera
ture
(K
)
T (P)3
0.004
Gas Concentration (mole fraction)
P = 20 MPa
liquid
liquid +hydrate
liquid +vapor
Figure 4 Phase diagram for amethane-water mixture as a func-tion of temperature and gas con-centration. The solid linerepresents the solubility of gas inequilibrium with either vapor orhydrate.
liquid solution. In permafrost regions, where temperatures fall below 08C, clath-rate coexists with the vapor phase. Ice cannot coexist with clathrate in two-phaseequilibrium because the concentration of gas in ice is too low. Gas moleculesmay occupy defects in the ice crystal, but the low gas concentration implies alow fugacity, f, which is too small to stabilize clathrate. Ice should convert intoclathrate in the presence of methane gas, but the low diffusivity of gas in ice(Stern et al 1996) may permit ice to persist under nonequilibrium conditions.
Although the conditions for three-phase equilibrium have been studied exten-sively and are relatively well known (Englezos et al 1990, Sloan 1998), compar-atively few studies have addressed the conditions for equilibrium betweenclathrate and liquid solution. Calculations by Miller (1974) and Handa (1990)predict a modest decrease in the concentration of dissolved gas as pressureincreases at constant temperature. In effect, gas is squeezed from the liquid solu-tion, increasing the relative abundance of the clathrate phase. More recently, Zat-sepina & Buffett (1997) have emphasized the role of temperature when clathratecoexists with liquid solution. Their results show how the composition of the liquidsolution changes as a function of temperature (see Figure 4). The solid line inFigure 4 represents the solubility of methane in pure water. We observe thatwarming a mixture of methane and water above T3(P) lowers the solubility; theopposite behavior occurs at temperatures below T3(P) when hydrate is present.The reduction in solubility with cooling below T3(P) has two important conse-quences. First, cooling causes growth of the clathrate phase because gas in excessof the solubility is transferred out of the liquid phase. Second, the temperature atwhich clathrate becomes stable depends on both pressure and concentration ofdissolved gas. Indeed, two degrees of freedom are predicted by Gibbs’ phase rulein a two-component mixture containing only two phases. For a given pressure,the maximum temperature for hydrate stability [e.g. T3(P)] coincides with the
Ann
u. R
ev. E
arth
Pla
net.
Sci.
2000
.28:
477-
507.
Dow
nloa
ded
from
arj
ourn
als.
annu
alre
view
s.or
gby
Sta
te U
nive
rsity
of
New
Yor
k -
Ston
y B
rook
on
03/1
9/09
. For
per
sona
l use
onl
y.

484 BUFFETT
largest concentration of dissolved gas in Figure 4. At lower gas concentrationsthe temperature for stability decreases.
Other factors that influence the stability of clathrate hydrate in natural envi-ronments include the effects of dissolved salts and sediment properties. Dissolvedsalts lower T3(P) by 1–28C for a plausible range of salinities in the seafloorsediments (Englezos & Bishnoi 1988, Dickens & Quinby-Hunt 1997). From athermodynamic point of view, the main effect of salt on the three-phase equilib-rium is to lower the free energy of the water molecules in the liquid, which inhibitsthe formation of clathrate. Salt also causes an increase in the free energy of gasmolecules in solution, but this has little influence on the stability of clathrate; gasis simply driven from solution into the vapor phase. When the vapor phase isabsent, the effect of salt on the phase equilibrium is more subtle. Salt continuesto lower the free energy of the water molecules in solution, but the increase inthe free energy of the dissolved gas molecules tends to drive gas into the clathratephase. The net effect is a 4–5% reduction in the solubility of methane gas whenhydrate is present (Zatsepina & Buffett 1998). Less gas is required in solution tostabilize the clathrate phase, which means that salt actually promotes the forma-tion of clathrate from liquid water in the absence of gas bubbles. Because clathrateexcludes salts during crystallization, we might expect the resulting increases insalinity to provide a positive feedback for further crystallization from solution.However, depletion of gas from solution as a result of clathrate formation is amuch stronger negative feedback, which maintains the stability of the system inresponse to small changes in thermodynamic conditions.
Sediment properties may also contribute to the stability of clathrate hydrate,especially when pore volumes in the sediments are very small. Geometric restric-tions imposed by the sediments on the size of crystal nucleii make very smallcrystals energetically unfavorable. The surface energy of nucleii in restricted vol-umes lowers the temperature required to promote crystallization compared withbulk conditions (Handa et al 1992). Sediments may also lower the free energy ofliquid water in the pore because of interactions with the pore wall. Water mole-cules nearest the wall can remain bound to the surface and do not freeze duringcooling, whereas water molecules farther from the wall experience a more modestreduction in free energy.
Reductions in the freezing temperature of pure water in small pores are welldocumented (Rennie & Clifford 1977). Analogous effects were observed byHanda & Stupin (1992) in the formation of methane hydrate. In their study, meth-ane hydrate was formed in silica gel with a typical pore radius of 7 2 1019 m.The measured formation temperature was approximately 68C below bulk predic-tions. The measurements of Handa & Stupin were shown to be in good agreementwith theoretical predictions, using the solid solution model of van der Waals &Platteuw (1959), when the free energy of the pore water was inferred from thefreezing depression of pure water in the same medium (Handa et al 1992). Thissuggests that relatively simple experiments on the freezing temperature of purewater in sediments can be used to estimate shifts in the formation temperature of
Ann
u. R
ev. E
arth
Pla
net.
Sci.
2000
.28:
477-
507.
Dow
nloa
ded
from
arj
ourn
als.
annu
alre
view
s.or
gby
Sta
te U
nive
rsity
of
New
Yor
k -
Ston
y B
rook
on
03/1
9/09
. For
per
sona
l use
onl
y.

CLATHRATE HYDRATES 485
T (P)3T
Dep
th
Temperature T
seafloor
T (P)3 T
Dep
th
Temperature T
surface
base of hydrate stabilitybase of hydrate stability
base ofpermafrost
(a) (b)
Figure 5 A schematic profile of temperature T in (a) continental permafrost and (b)marine sediments. Hydrate stability in the sediments (shaded region) is limited to depthswhere T , T3(P).
clathrate hydrate. In natural sediments, the depression of T3(P) compared withbulk equilibrium predictions is expected to be small because the typical radii ofpores in fine-grain clays are roughly 1017 m, which is large compared with thepore sizes used in the study of Handa & Stupin (1992). Clennell et al (1999)estimate that changes in T3(P) should not exceed a few tenths of a degree, basedon sediment samples collected at clathrate occurrences on the Blake Ridge.
Application to Geological Environment
Clathrate stability near the Earth’s surface is established by applying phase equi-librium predictions to geological conditions. Low temperatures in permafrostregions cause ice to form in the shallow sediments where the pressure is too lowto stabilize hydrate (see Figure 5a). At greater depths, ice is converted into hydratein the presence of methane gas. According to equilibrium predictions, ice shouldvanish below 200 m, but nonequilibrium conditions may persist because of theslow diffusion of gas into ice. The base of the clathrate stability zone extends tothe depth where temperature reaches T3(P). Below this depth we expect liquidwater and bubbles of methane gas.
In marine sediments along deep continental margins, the temperature at theseafloor is a few degrees above 08C, but the pressure of the overlying water issufficient to stabilize methane hydrates (see Figure 5b). The depth of the hydratestability zone is limited by the increase in temperature below the seafloor. If theabundance of gas is sufficient, then the base of the stability zone is defined by
Ann
u. R
ev. E
arth
Pla
net.
Sci.
2000
.28:
477-
507.
Dow
nloa
ded
from
arj
ourn
als.
annu
alre
view
s.or
gby
Sta
te U
nive
rsity
of
New
Yor
k -
Ston
y B
rook
on
03/1
9/09
. For
per
sona
l use
onl
y.

486 BUFFETT
Figure 6 Solubility of methane in sea-water as a function of depth below theseafloor. Pressure in the sedimentsincreases hydrostatically through theseafloor below a water depth of 2 km.Temperature at the seafloor is 28C andthe temperature gradient is 0.058C m11.
0.0 0.001 0.002 0.003 0.004700
500
300
100
Dep
th b
elow
sea
floor
(m
)
Gas Concentration X (mole fraction)
liquid
liquid +vapor
liquid +hydrate
liquid
base of hydrate stability zone
200
400
600
0
the intersection of the temperature profile with the temperature for three-phaseequilibrium. In the shallower sediments, clathrate coexists with seawater in a two-phase equilibrium, whereas at greater depths we expect to find seawater in equi-librium with gas bubbles.
When the solubility calculations of Zatsepina & Buffett (1998) are applied toseafloor conditions, we obtain estimates of the dissolved gas concentrations nec-essary for hydrate stability (see Figure 6). Below the stability zone, the solubilityof gas is nearly constant because the changes in pressure and temperature havecounteracting effects. Inside the stability zone, however, the solubility is largelycontrolled by temperature. As a result, the solubility decreases sharply toward theseafloor. If the concentration of dissolved gas falls below the solubility, thenhydrate dissociates to reestablish the equilibrium concentration. On the otherhand, hydrate crystallizes when the gas concentration exceeds the solubility inorder to restore the dissolved concentration to equilibrium.
Thermodynamic predictions provide powerful constraints on the structure ofhydrate occurrences in the seafloor. For example, the base of the stability zonecoincides with the temperature for three-phase equilibrium only when gas bubblesare present in the underlying sediments. In the absence of gas bubbles we expectthe concentration of dissolved gas to be less than the local solubility at the depthcoinciding with T3(P). Consequently, hydrate is not stable at this depth, and thebase of the stability zone shifts toward the seafloor until the actual gas concen-tration equals the local solubility (Xu & Ruppel 1999). Indeed, hydrate shouldbe absent from any region inside the stability zone where the concentration ofdissolved gas is persistently less than the local solubility. Conversely, the con-centration of gas in the pore fluid should equal the local solubility where gashydrate is present.
Ann
u. R
ev. E
arth
Pla
net.
Sci.
2000
.28:
477-
507.
Dow
nloa
ded
from
arj
ourn
als.
annu
alre
view
s.or
gby
Sta
te U
nive
rsity
of
New
Yor
k -
Ston
y B
rook
on
03/1
9/09
. For
per
sona
l use
onl
y.

CLATHRATE HYDRATES 487
Thermodynamic considerations may also explain why gas bubbles in the sed-iments appear to accumulate at the base of the hydrate stability zone. Gas in thevapor phase is thermodynamically unstable inside the stability zone, so the occur-rence of gas bubbles should terminate abruptly at the depth for three-phase equi-librium without requiring a permeability barrier. As sedimentation buries gashydrate to greater depths, the temperature eventually exceeds T3(P) and thehydrates dissociate (Kvenvolden & Barnard 1983). Gas bubbles appear below thestability zone because the concentration of gas in the pore water prior to disso-ciation is fixed by the local solubility. Subsequent addition of gas resulting fromhydrate dissociation inevitably exceeds the solubility and produces gas bubbles.Nucleation of gas bubbles from solution requires a modest supersaturation of gasin the pore fluid, which can influence the depth at which gas bubbles first appear.Theoretical calculations show that gas hydrate can persist metastably in the super-saturated fluid at temperatures above T3(P) prior to the formation of gas bubbles.Once the gas bubbles appear, however, the dissolved gas concentration returns toequilibrium levels, and any remaining hydrate rapidly dissociates. Experimentsin natural porous media indicate that the overheating of hydrate can exceed severaldegrees (Buffett & Zatsepina 1999).
OBSERVATIONS FROM NATURAL OCCURRENCES
Evidence of gas hydrate in the seafloor and in polar environments is compiledfrom a variety of sources. In some instances, samples of hydrate have been recov-ered by deep sea drilling or sediment coring (Kvenvolden et al 1993). More often,the presence of hydrate is inferred indirectly from geophysical and geochemicalobservations. The most detailed information is obtained from borehole measure-ments collected at sites of deep sea drilling. Geophysical measurements of seismicvelocity, electrical resistivity, and porosity provide information about the physicalcharacteristics of hydrate occurrences. Geochemical analysis of the pore fluidsand exsolved gases constrains the abundance of hydrate or the conditions underwhich the hydrate formed.
Information from borehole measurements is necessarily confined to the imme-diate vicinity of the drilling site. More regional inferences about areal distributionor lateral variations of hydrate abundance are usually obtained by seismic meth-ods. Although several alternative approaches have been proposed (e.g. Willoughby& Edwards 1997, Edwards 1997), these methods have not seen widespread use. Inthis section we summarize the observations that are available to study hydrateoccurrences, along with the conclusions that may be drawn from these observations.
Geophysical Observations
Most occurrences of gas hydrate in marine sediments are associated with a seismicreflection that parallels the reflection from the seafloor. This bottom-simulatingreflector (BSR) is observed near the predicted base of the hydrate stability zone,
Ann
u. R
ev. E
arth
Pla
net.
Sci.
2000
.28:
477-
507.
Dow
nloa
ded
from
arj
ourn
als.
annu
alre
view
s.or
gby
Sta
te U
nive
rsity
of
New
Yor
k -
Ston
y B
rook
on
03/1
9/09
. For
per
sona
l use
onl
y.

488 BUFFETT
although small discrepancies have been reported (Ruppel 1997). Reflection ampli-tudes from many BSRs imply an abrupt and significant change in seismic velocity.Estimates of the velocity change are obtained by comparing reflection amplitudesfrom the BSR with those from the seafloor. Vertical reflection coefficients of 10–15% have been reported at many locations where strong BSRs are observed(Shipley et al 1979, Miller et al 1991, Hyndman & Spence 1992, Wood et al1994).
The polarity of the BSR reflection is opposite to that from the seafloor, whichmeans that the BSR marks an interface between high-velocity sediments insidethe stability zone and low-velocity sediments immediately below the stabilityzone. High velocities in the overlying layer are generally attributed to the presenceof hydrate in the pore volume (Stoll et al 1971). Increases in velocity occurbecause the pore fluid is replaced with a higher velocity icy solid. Furtherincreases may result if hydrate cements and strengthens the sediment matrix(Dvorkin et al 1991). Low velocities in the underlying sediments are usuallyattributed to the presence of gas bubbles; even small amounts of gas bubbles candramatically reduce P-wave velocities (Murphy 1984).
Debate has arisen over the relative importance of hydrate and gas bubbles inexplaining the BSR reflection. The study of Hyndman & Spence (1992) on theCascadia margin attributed most of the velocity contrast at the BSR to the pres-ence of gas hydrate in the overlying sediments. They required 30% of the porevolume to be filled with hydrate to account for the amplitude of the BSR reflec-tion. In the same study area, Singh et al (1993) argued for gas bubbles in theunderlying sediments as the main cause of the BSR reflection. Their best fit tothe observed seismic waveforms was obtained with a small volume of gas bubbles(a few percent of the pore volume) in a 30-m-thick layer below the BSR.
More detailed information about the seismic structure of hydrate occurrencesis available from recent sites of the Ocean Drilling Program (ODP). Verticalseismic profiling (VSP) employs seismic sources at the sea surface and receiversat a series of locations in the borehole. Narrow spacings between receiver loca-tions (typically a few meters) permit detailed estimates of the seismic velocity asa function of depth. MacKay et al (1994) reported VSP data from ODP Leg 146on the Cascadia margin near the site of the earlier seismic surveys. The VSP datarevealed anomalously fast velocities above the BSR and an abrupt drop in velocitybelow the BSR (see Figure 7a). The low velocity below the BSR indicated a thinlayer of gas bubbles, but the anomalously fast velocities in the overlying layersuggest that both hydrate and gas bubbles contribute to the amplitude of the BSRreflection (Yuan et al 1996, 1999).
Quantitative interpretation of the seismic data requires (a) estimates of thesediment velocity in the absence of hydrate and (b) a relationship for the effectsof hydrate on seismic velocity. Yuan et al (1996) addressed the question of esti-mating the velocity of unhydrated sediments using multichannel seismic (MSC)data. Trends in the seismic velocities below the BSR were used to extrapolate thevelocity of unhydrated sediment into the stability zone. The result was signifi-cantly lower than the observed velocity in the stability region. The task of infer-
Ann
u. R
ev. E
arth
Pla
net.
Sci.
2000
.28:
477-
507.
Dow
nloa
ded
from
arj
ourn
als.
annu
alre
view
s.or
gby
Sta
te U
nive
rsity
of
New
Yor
k -
Ston
y B
rook
on
03/1
9/09
. For
per
sona
l use
onl
y.

CLATHRATE HYDRATES 489
Figure 7 (a) Estimates of seismic velocity in the shallow sediments at or near Site 889,ODP Leg 146. The circles indicates estimates from multichannel seismic (MCS) data.Results from vertical seismic profiling (VSP) are indicated by the irregular solid line, andthe two thin dashed lines are acoustic logs at Sites 889A and 889B. The smooth trend isthe estimate of velocity in unhydrated sediments. (b) Hydrate volumes inferred from theseismic velocity estimates. Adapted from Yuan et al (1996).
ring the amount of hydrate in the sediments based on the anomalous seismicvelocity is more difficult. Several simple approaches have been adopted by vari-ous investigators (Hyndman & Spence 1992, Lee et al 1996). Although the reli-ability of these methods is not firmly established, the similarity of estimatesobtained using these different approaches is encouraging (Hobro et al 1998).Estimates of the hydrate distribution from the study of Yuan et al (1996), shownin Figure 7b, use the porosity-reduction method described by Hyndman & Spence(1992).
Hydrate occurrences on passive continental margins share some similaritieswith those on active margins, but a number of differences are also apparent. VSPdata from ODP Leg 164 on the Blake Ridge revealed a thick layer of gas bubblesextending more than 200 m below the BSR at sites 995 and 997 (Holbrook et al1996). Small increases in the seismic velocity above the BSR suggest that 5–7%of the pore volume is filled with hydrate. Such low volume fractions suggest thatthe BSR is produced mostly by the top of the gas layer. No discernable variationsin the abundance of hydrate were evident through the stability zone because ofthe low volume fraction. However, in situ measurements of methane quantitiesprovide some indication of the hydrate distribution (Dickens et al 1997b). The
Ann
u. R
ev. E
arth
Pla
net.
Sci.
2000
.28:
477-
507.
Dow
nloa
ded
from
arj
ourn
als.
annu
alre
view
s.or
gby
Sta
te U
nive
rsity
of
New
Yor
k -
Ston
y B
rook
on
03/1
9/09
. For
per
sona
l use
onl
y.

490 BUFFETT
recovered quantities of methane greatly exceed the solubility through most of thehydrate stability zone and are maximum near the base. Assuming that any gas inexcess of the solubility is stored in hydrate, Dickens et al (1997b) estimate thatas much as 9% of the pore space in the stability zone is filled with methanehydrate. Gas quantities recovered from below the stability zone suggest that bub-bles of methane gas occupy 12% of the pore volume. Indeed, the gas trapped inbubbles below the BSR may exceed the gas stored in the overlying hydrate.
Regional variations in the prominence of the BSR are reported in most studyareas. Large abundances of hydrate often correlate with strong BSR amplitudes(Hobro et al 1998), although this correspondence does not hold everywhere. Forexample, evidence of gas hydrate was reported on Blake Ridge in a location wherethere was no indication of a BSR (Holbrook et al 1996). Variations in the BSRamplitude also appear to correlate with seafloor topography in many locations,where the strongest reflectors occur under topographic highs (Shipley et al 1979,Minshull et al 1994). In other cases the lateral variations are connected withtectonic features (Rowe & Gettrust 1993, Pecher et al 1998). Rowe & Gettrust(1993) reported vertical offsets in the BSR on the Blake Ridge that were clearlyassociated with faults. Because the BSR is expected to adjust to local thermo-dynamic conditions, the persistence of these offsets suggests that faulting hasaltered the temperature field, possibly by altering fluid circulation.
Organic Geochemistry
The molecular composition and isotopic signature of the gases recovered fromhydrate samples or from hydrate-bearing sediment cores are consistent with gasesgenerated by biological processes. In most locations the hydrocarbon gas is nearlypure methane, and the isotopic composition of the carbon (d13C) is usually lighterthan 160‰ relative to the Peedee Belemnite standard (Claypool & Kvenvolden1983). By comparison, thermal conversion of organic matter into hydrocarbongases at temperatures in excess of 808C produces larger quantities of ethane andpropane, and the isotopic composition of the carbon is relatively heavy. Differ-ences in the composition of the gas supply should be reflected in the compositionof the hydrate. Although it is possible that methane gas is preferentially incor-porated into the hydrate during crystallization (Thiery et al 1998), these effectsare not likely to explain the abundance of methane gas (relative to ethane andpropane) in most natural hydrates. In fact, occasional reports of hydrate samplescontaining gas mixtures with less than 60% methane (Ginsburg et al 1992) suggestthat fractionation does not erase evidence of thermogenic gases when the sourceis clearly thermal. Thus the vast majority of clathrate hydrate near the Earth’ssurface is probably the result of biogenic conversion of organic matter into meth-ane gas at shallow depths below the seafloor.
Biological generation of methane gas occurs through a series of reactions. Atypical reaction sequence produces one mole of methane from one mole of organiccarbon. The amount of organic carbon in sediments is conventionally expressed
Ann
u. R
ev. E
arth
Pla
net.
Sci.
2000
.28:
477-
507.
Dow
nloa
ded
from
arj
ourn
als.
annu
alre
view
s.or
gby
Sta
te U
nive
rsity
of
New
Yor
k -
Ston
y B
rook
on
03/1
9/09
. For
per
sona
l use
onl
y.

CLATHRATE HYDRATES 491
as a mass fraction of organic carbon in dry sediments. Sediments on the BlakeRidge contain about 1–1.5% organic carbon (Kvenvolden & Barnard 1983). Notall of this organic carbon is available to microorganisms. Some studies suggestthat only one half of the organic carbon is converted to methane (Paull et al 1994),although lower efficiencies have also been reported (Claypool & Kvenvolden1983). Paull et al (1994) estimate that 1% organic carbon yields 260 moles ofCH4 from 1 m3 of sediment (assuming a porosity of 0.4 and an efficiency of50%). If this amount of gas were dissolved in the pore fluid, it would yield aconcentration of 0.6 M (or 0.01 mole fraction). Compared to the solubility shownin Figure 6, we observe that the available gas exceeds the solubility, but only bya factor of 3–4. Lower efficiencies reduce the available gas, and further lossesoccur through diffusion of gas toward the seafloor (see Figure 6). Even if the gasconcentration exceeds the solubility by a factor of 3, this supply of gas is insuf-ficient to fill more than a few percent of the pore volume with hydrate. To accu-mulate large volumes of hydrate, we require an influx of methane or organicmatter into the stability region (Ginsburg & Soloviev 1997). A more quantitativediscussion of the methane supply is deferred until the section on hydrateformation.
Inorganic Geochemistry
Pore fluids are routinely extracted from sediment cores during deep sea drilling.Measurements of chemical components and isotopic tracers provide a wealth ofinformation about hydrate occurrences. The most commonly reported observationis the chlorinity of the pore fluid. Anomalously low measurements of chlorinitywere first reported by Hesse & Harrison (1981), who attributed these observationsto hydrate dissociation during the recovery of the sediments. Because the clathratestructure excludes salts during crystallization, the pore fluid becomes anomalouslysalty. However, the effects of diffusion and fluid flow can gradually restore thechlorinity concentrations to values more characteristic of seawater (approximately544 mM). When hydrate dissociates in the sediments during recovery, the fresh-ening is proportional to the in situ abundance of hydrate.
Estimates of the hydrate abundances depend on the initial chlorinity concen-tration in the pore fluid prior to hydrate dissociation. Most studies adopt an aver-age seawater chlorinity as a reasonable initial concentration throughout thesediments. However, deviations from seawater chlorinities can arise in severalways. Persistent formation of hydrate in the sediments can maintain anomalouslyhigh chlorinities in the stability zone, whereas low chlorinities occur below thestability zone if sedimentation causes dissociation of hydrate at the base of thestability zone (see next section). Factors unrelated to gas hydrate may also beimportant for interpreting chlorinity measurements. Migration of low chlorinitywater from continents or from a deeper source owing to dewatering of clay min-erals (Kastner et al 1995) can influence the observed chlorinities.
Ann
u. R
ev. E
arth
Pla
net.
Sci.
2000
.28:
477-
507.
Dow
nloa
ded
from
arj
ourn
als.
annu
alre
view
s.or
gby
Sta
te U
nive
rsity
of
New
Yor
k -
Ston
y B
rook
on
03/1
9/09
. For
per
sona
l use
onl
y.

492 BUFFETT
Chlorinity (mM) Hydrate (% of pore volume)
Dep
th b
elow
sea
floor
(m
)
(a) (b)
Figure 8 (a) Measurements of pore fluid chlorinity at Sites 889/890 from ODP Leg 146.(b) Estimates of the hydrate volume inferred from the measured freshening compared withseawater chlorinity (544 mM).
Profiles of chlorinity measurements from hydrate occurrences around the worldare remarkably similar. One example from ODP Leg 146 on the Cascadia marginis shown in Figure 8a. Estimates of the inferred hydrate abundance are indicatedin Figure 8b, assuming an initial chlorinity concentration of 544 mM. The fractionof the pore volume filled with hydrate increases from 0% at the seafloor to nearly40% at the BSR. Lower hydrate volumes were inferred from seismic data at thesame site, which may indicate an additional source of freshening besides hydratedissociation (Kastner et al 1995). On the other hand, the differences are probablyconsistent with the uncertainties in the estimates. A similar level of agreementbetween geophysical and geochemical estimates of hydrate volume has beenobtained at other sites (e.g. Brown et al 1996), but this is not always the case.Chlorinity measurements from ODP Leg 164 on the Blake Ridge suggest thathydrate occupies as much as 20% of the pore volume, whereas 5–7% volumefractions are estimated from VSP data by Holbrook et al (1996), and a 9% volumefraction is inferred by Dickens et al (1997b) from in situ quantities of methanegas. Paull et al (1998) questioned whether all of the freshening at sites on theBlake Ridge was due to hydrate. They fit low-degree polynomials to the observedchlorinity profiles, assuming that the average trends were due to an unknownsource of relatively fresh water. Deviations from these smooth trends were attrib-
Ann
u. R
ev. E
arth
Pla
net.
Sci.
2000
.28:
477-
507.
Dow
nloa
ded
from
arj
ourn
als.
annu
alre
view
s.or
gby
Sta
te U
nive
rsity
of
New
Yor
k -
Ston
y B
rook
on
03/1
9/09
. For
per
sona
l use
onl
y.

CLATHRATE HYDRATES 493
uted to the presence of hydrate. This procedure had the desired effect of recon-ciling the estimates of hydrate abundance with other inferences, but it raisedquestions about the interpretation of chlorinity measurements if most of the signalis unrelated to the presence of hydrate.
Two issues are important for interpreting the chlorinity measurements. First,the characteristic profile of chlorinity in Figure 8a is characteristic of regionswhere other indications of gas hydrate are evident (e.g. BSRs). Second, fresheningbelow the BSR is inevitable when sedimentation or climate change causes hydrateto dissociate at the base of the stability zone. The typical timescale for chemicaldiffusion in the top few hundred meters of marine sediments is roughly 106 years,so dissociation of hydrate near the BSR should leave observable signatures in thechlorinity profiles. We show in the next section that the smooth trend observedon the Blake Ridge is probably a consequence of sedimentation.
Several other geochemical indicators are suitable for detecting gas hydrate orconstraining the formation environment. Measurements of the isotopic compo-sition of oxygen in water (d18O relative to Standard Mean Ocean Water) provideanother means of estimating the hydrate abundance. Fractionation of oxygen iso-topes during hydrate formation increases d18O by 2.9% in the hydrated water andmakes the pore water isotopically light (Kastner et al 1998). Mixing pore waterwith seawater or deeper fluids tends to restore the values of d18O to zero. Sub-sequent dissociation of hydrate in the sediment cores during recovery yields posi-tive d18O values that may be interpreted as a measure of the hydrate volume,analogous to the use of chlorinity measurements. At drill sites in Guatemala(Hesse & Harrison 1981) and Peru (Kvenvolden & Kastner 1990) the profiles ofd18O increase with depth, indicating a gradual increase in hydrate abundancebelow the seafloor. However, at sites on the Cascadia margin (Kastner et al 1995)and the Chile Triple Junction region (Brown et al 1996), the d18O profiles decreasewith depth, presumably because of diagenetic reactions in the sediments.
More recent studies of Paull et al (1998) and Kastner et al (1998) haveexploited systematic variations of 87Sr/86Sr in seawater over the past few millionyears to quantify the extent of mixing in the pore fluid. Known variations of87Sr/86Sr in seawater establish a timescale that may be used to estimate the averageage of pore water in the sediments (Farrell et al 1995). Departures from the ageof the host sediments indicate mixing in the pore fluid. The ages inferred for thepore fluids on the Blake Ridge are in good agreement with the age of host sedi-ments below the BSR, whereas more modern isotopic signatures were recordedinside the stability region (Paull et al 1998). Gradients in the strontium concen-tration inside the stability region imply downward diffusion of strontium into thesediments, and may explain the more modern isotopic signatures. This suggeststhat diffusion is sufficient to carry strontium into the sediments and argues againsta significant upward transport of fluid from below. On the other hand, Egeberg& Dickens (1999) argue for an upward vertical flow of 0.2 mm year11 based onprofiles of Br1 and I1 concentrations in the pore fluids.
Ann
u. R
ev. E
arth
Pla
net.
Sci.
2000
.28:
477-
507.
Dow
nloa
ded
from
arj
ourn
als.
annu
alre
view
s.or
gby
Sta
te U
nive
rsity
of
New
Yor
k -
Ston
y B
rook
on
03/1
9/09
. For
per
sona
l use
onl
y.

494 BUFFETT
Further constraints on fluid transport are derived from profiles of sulfate con-centration in the top 10 or 20 m of sediments. Depletion of sulfate is caused bysulfate-reducing microorganisms and/or by anaerobic oxidation of methane. Thelatter case prevails when methane from below is brought into contact with sulfatenear the seafloor. The reaction
21 1 1SO ` CH → HS ` HCO ` H O4 4 3 2
consumes one mole of sulfate for each for each mole of methane. Concentrationsof both and CH4 vanish at the reaction front in the shallow sediments, which21SO4
causes concentration gradients in the surrounding sediments. Diffusion bringssulfate and methane into the reaction front at equal rates. Borowski et al (1996)argues for anaerobic oxidation of methane as the principal cause of sulfate deple-tion on the Blake Ridge. Measurements of gradients in the sulfate concentrationestablish the diffusive flux of sulfate into the floor and provide a proxy for themethane flux from below. The inferred methane flux varies considerably acrossthe study area, but peak values were 1.8 2 1013 mmol cm12 year11, correspond-ing to a methane gradient of 2 mM m11. We show in the next section that suchsteep gradients in the methane concentration are not easily maintained withoutfluid flow from below. Variability of the methane flux suggests that fluid flow isnot uniform across the area of study.
FORMATION IN THE SEAFLOOR
The amount of methane gas sequestered in marine gas hydrate often exceeds thegas that is available from direct biogenic conversion of organic material. Accu-mulations of hydrate in excess of a few percent of the pore volume require eitheran influx of methane or new organic material. Indeed, the total supply of methanemust be sufficient to overcome persistent losses of methane due to diffusion alongthe concentration gradient imposed by thermodynamic equilibrium (see Figure6). Without a continual supply of methane, losses of gas hydrate become signifi-cant over 106 years (Zatsepina & Buffett 1998).
Differences between active and passive margins have motivated two differentmodels for hydrate accumulation. The model proposed by Hyndman & Davis(1992) for active margins relies on fluid expulsion from the accretionary prism(Carson & Screaton 1998). Large volumes of hydrate accumulate by focusingdissolved methane into the stability region from an extensive source region acrossthe prism. As methane-bearing fluid migrates into the stability region, the dropin solubility toward the seafloor causes methane to exsolve from solution andcrystallize into gas hydrate. The rate at which hydrate forms depends on thetransport of methane into the stability zone and on the decrease in solubility.Quantitative predictions for the distribution of hydrate and its rate of accumulationhave been obtained by assuming a pervasive fluid flow through a uniform porousmedium (Rempel & Buffett 1997, 1998; Xu & Ruppel 1999). Results from the
Ann
u. R
ev. E
arth
Pla
net.
Sci.
2000
.28:
477-
507.
Dow
nloa
ded
from
arj
ourn
als.
annu
alre
view
s.or
gby
Sta
te U
nive
rsity
of
New
Yor
k -
Ston
y B
rook
on
03/1
9/09
. For
per
sona
l use
onl
y.

CLATHRATE HYDRATES 495
-1fluid velocity = 1 mm yr
0.0 0.5 1.0 1.5 2.0 2.5
Dep
th b
elow
sea
floor
(m
)
Hydrate volume fraction (%)
0
200
40
80
120
160t = 100 kyr t = 200 kyr
(a)
Dep
th b
elow
sea
floor
(m
)
0
40
80
120
160
2000.0 0.2 0.4 0.6 0.8 1.0
oGas concentration X / X
solubility (b)
Figure 9 (a) Accumulation of the hydrate predicted using a vertical fluid velocity of 1mm year11. The hydrate volume is expressed as a percentage of the pore volume, assuminga porosity of 0.5. (b) The profile of dissolved gas concentration X in the stability zone,normalized by the solubility X0 immediately below the stability zone. We assume that gasbubbles immediately below the hydrate stability zone maintain the concentration of dis-solved gas at X0 at a depth of 200 mbsf.
calculation of Rempel & Buffett (1998) are shown in Figure 9. The calculateddistribution of hydrate is similar to that inferred from borehole measurements onCascadia margin (see Figure 7b). For a nominal velocity of 1 mm year11, weexpect roughly 1% of the pore volume to fill with hydrate in 105 years. At thisrate of accumulation, hydrate volumes of 20–30% on the Cascadia margin coulddevelop over several million years.
Dissolved concentrations of methane gas are constrained by the local solubilityanywhere hydrate or gas bubbles are present. In Figure 9 we assume that the gasconcentration at the base of the hydrate stability zone is maintained by gas bub-bles. Otherwise, the base of the hydrate zone can shift to a shallower position inthe sediments (Zatsepina & Buffett 1997, Xu & Ruppel 1999). Hydrate does notextend to the seafloor because the gas concentration is less than the solubility inthe shallowest sediments. A steep gradient in the methane concentration developsas the concentration adjusts to the low value imposed at the seafloor. The gradientin the methane concentration near the seafloor is controlled by a competitionbetween fluid transport and diffusion of dissolve gas. Larger fluid velocities yieldsteeper methane gradients at the seafloor. The methane gradient achieved in Figure9 using a velocity of 1 mm year11 is more than sufficient to explain the largestsulfate gradients observed by Borowski et al (1996) on the Blake Ridge. In fact,estimates of the methane fluxes inferred from profiles of sulfate concentrationscan provide valuable information about the vertical fluid flow. This informationhas not been widely exploited in previous studies.
Ann
u. R
ev. E
arth
Pla
net.
Sci.
2000
.28:
477-
507.
Dow
nloa
ded
from
arj
ourn
als.
annu
alre
view
s.or
gby
Sta
te U
nive
rsity
of
New
Yor
k -
Ston
y B
rook
on
03/1
9/09
. For
per
sona
l use
onl
y.

496 BUFFETT
An alternative model has been proposed to explain hydrate occurrences onpassive margins (Kvenvolden & Barnard 1983). In this model, methane is gen-erated in the stability zone by biogenic conversion of organic material. Sedimen-tation brings a supply of new organic material, which is continually converted tomethane to sustain the gas concentration above the local solubility. Dissolvedorganic matter may also be transported into the stability region by fluid flow ordiffusion (Egeberg & Barth 1998). Evidence for in situ generation of methane onpassive margins is inferred from profiles of the isotopic composition of carbonin recovered CH4 and CO2 gases (Galimov & Kvenvolden 1983). Both CH4 andCO2 become isotopically heavier with depth as 12C is preferentially consumed bymicroorganisms. Similarities in the d13C values in CH4 and CO2 suggest that bothgases are derived from a common source of organic material. Indeed, reductionof CO2 is a principal pathway for methanogenesis. Methane may also be recycledinto the stability zone through the combined effects of fluid flow and diffusionas it is released from hydrate below the stability zone.
Quantitative predictions for the accumulation of hydrate on passive marginshave previously been given by Rempel & Buffett (1998). These calculationsassumed a spatially uniform source of methane in the sediments and allowed formethane release at the base of the stability zone as hydrate was buried by steadysedimentation. The results shown in Figure 10 add several important refinements.First, the effects of sediment compaction and fluid expulsion are included byadapting the model of Hutchison (1985). Second, the rate of biogenic productionof methane is proportional to the available organic material in the sediments.Methane production decreases with depth as the organic material is depleted.Finally, the gas in excess of the solubility below the hydrate stability zone istransferred into gas bubbles, which are held immobile in the sediments by theeffects of surface tension. Figure 10 shows the evolution of hydrate volume,chlorinity, and dissolved gas concentration over a simulation of several millionyears. The profiles of chlorinity are normalized by the seawater concentration,while the gas concentration is normalized by the gas solubility immediately belowthe stability zone. Numerical values for the sedimentation rate (22 cm ky11) andorganic content at the surface (1.5%) are chosen to be representative of the BlakeRidge. Additional details of the numerical calculations are given by Davie &Buffett (submitted manuscript, 1999).
At the earliest stage of the simulation (0.6 Ma), the gas concentration is lessthan the local solubility at all depths (the solubility is indicated by a dashed linein Figure 10). Hydrate is absent from the sediments, and the chlorinity equals thevalue for seawater. Once the gas concentration exceeds the local solubility,hydrate begins to form and the chlorinity increases in the surrounding pore fluid.After 2.5 Ma, hydrate has formed throughout most of the stability zone. Onlysediments at the very top and bottom of the stability zone lack hydrate becausethe gas concentration in these regions is less than the local solubility. At latertimes, sedimentation buries hydrate to greater depth and eventually causes dis-sociation at the base of the stability zone. Dissociation of hydrate releases fresh
Ann
u. R
ev. E
arth
Pla
net.
Sci.
2000
.28:
477-
507.
Dow
nloa
ded
from
arj
ourn
als.
annu
alre
view
s.or
gby
Sta
te U
nive
rsity
of
New
Yor
k -
Ston
y B
rook
on
03/1
9/09
. For
per
sona
l use
onl
y.
CLATHRATE HYDRATES 497
Chlorinity(normalized conc.)
Gas concentration(normalized conc.)
Time(Ma)
1 0 10
200
400
600
800
dept
h be
low
sea
floor
(m
)0 1 2
0
200
400
600
800de
pth
belo
w s
eaflo
or (
m)
0 0.5 10
200
400
600
800
dept
h be
low
sea
floor
(m
)
0.6
0 0.02 0.040
200
400
600
800
dept
h be
low
sea
floor
(m
)
0.99 1 1.01 1.020
200
400
600
800
dept
h be
low
sea
floor
(m
)
0 0.5 10
200
400
600
800
dept
h be
low
sea
floor
(m
)
2.5
0 0.1 0.20
200
400
600
800
dept
h be
low
sea
floor
(m
)
0.95 1 1.050
200
400
600
800
dept
h be
low
sea
floor
(m
)
0 0.5 1 1.50
200
400
600
800
dept
h be
low
sea
floor
(m
)
6.3
Hydrate volume
(fraction of pore)
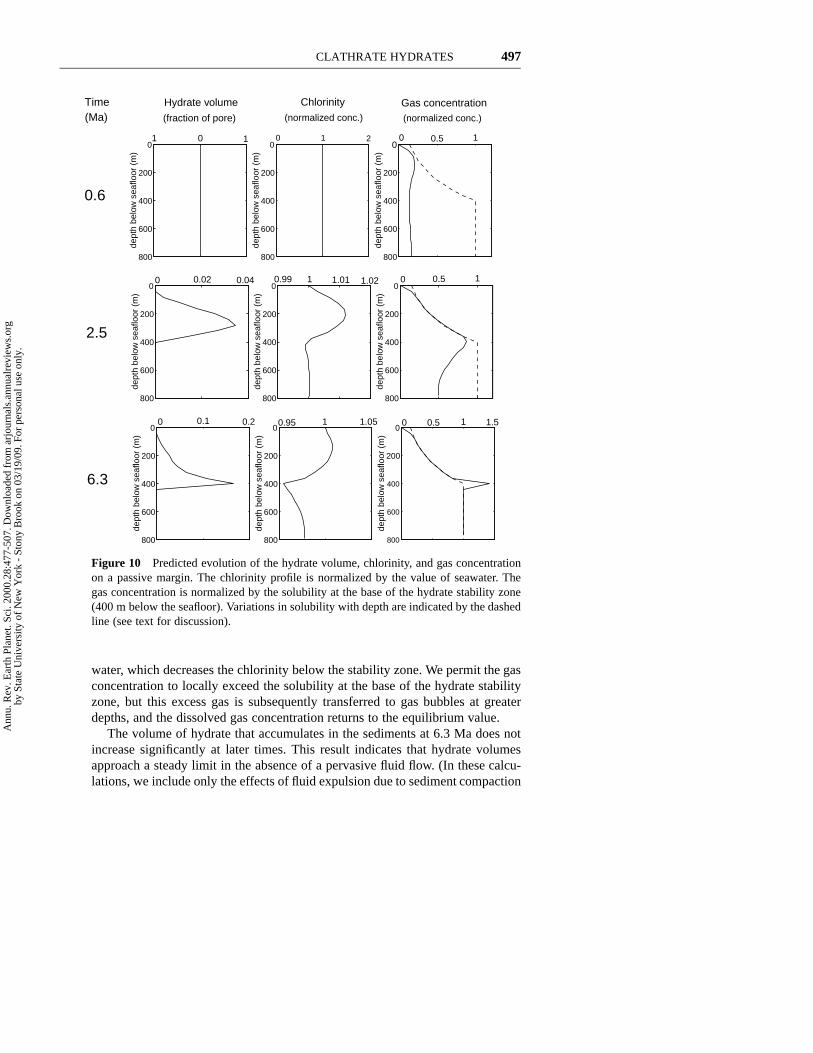
Figure 10 Predicted evolution of the hydrate volume, chlorinity, and gas concentrationon a passive margin. The chlorinity profile is normalized by the value of seawater. Thegas concentration is normalized by the solubility at the base of the hydrate stability zone(400 m below the seafloor). Variations in solubility with depth are indicated by the dashedline (see text for discussion).
water, which decreases the chlorinity below the stability zone. We permit the gasconcentration to locally exceed the solubility at the base of the hydrate stabilityzone, but this excess gas is subsequently transferred to gas bubbles at greaterdepths, and the dissolved gas concentration returns to the equilibrium value.
The volume of hydrate that accumulates in the sediments at 6.3 Ma does notincrease significantly at later times. This result indicates that hydrate volumesapproach a steady limit in the absence of a pervasive fluid flow. (In these calcu-lations, we include only the effects of fluid expulsion due to sediment compaction
Ann
u. R
ev. E
arth
Pla
net.
Sci.
2000
.28:
477-
507.
Dow
nloa
ded
from
arj
ourn
als.
annu
alre
view
s.or
gby
Sta
te U
nive
rsity
of
New
Yor
k -
Ston
y B
rook
on
03/1
9/09
. For
per
sona
l use
onl
y.

498 BUFFETT
and make no allowances for other sources of fluid from greater depths. If addi-tional sources of fluid are sufficient to produce upward flow relative to the sea-floor, then we find that the predicted hydrate volume increases continually withtime.) Hydrate concentrations are maximum at the base of the stability zone anddecrease gradually toward the seafloor. The average hydrate volume over theentire 400-m-deep stability zone is about 6%. Gas bubbles appear below thestability zone when the gas concentration exceeds the solubility, but they typicallyoccupy only a small fraction of the pore volume. Immediately below the stabilityzone, the volume fraction of bubbles is slightly less than 10%, assuming an idealgas and a pressure equivalent to a water depth of 2700 m. The gas volumedecreases steadily to approximately 2% at a depth of 800 m (e.g. 400 m belowthe base of the stability zone). This gradual decrease in gas volume may explainwhy seismic reflections are not usually observed from the base of this gas layer(Holbrook et al 1996). Simulations using other choices of sedimentation rate andorganic content indicate that the volume of gas is particularly sensitive to theinput parameters. Much smaller volumes of free gas are predicted with a sedi-mentation rate of 10 cm ky11 and an organic content of 1%, whereas the hydratevolume is relatively unchanged. However, more substantial decreases in eitherthe sedimentation rate or organic content dramatically reduce hydrate accumu-lation. This information is important for estimating global abundances of marinehydrates (see next section).
Profiles of chlorinity in Figure 10 reveal significant departures from the valuefor seawater. Freshening below the stability zone is particularly evident in laterstages of the simulation when hydrate begins to dissociate at the base of thestability zone. This deviation from seawater chlorinity influences the interpreta-tion of chlorinity measurements. Given our estimates of in situ chlorinity andhydrate volume from the simulation, we can predict how the chlorinity woulddecrease if the estimated hydrate volume dissociated. Predictions are moderatelydependent on the details of our model for methane production by microorganisms.We have assumed for simplicity that methane production is proportional to theavailable organic carbon and that the efficiency of this conversion is 50%. Thismodel for methane production is highly idealized, but it does have the desiredeffect of decreasing the production of methane with depth as the most reactivecarbon is utilized first. We must also define a characteristic timescale over whichthe conversion occurs. Adopting a short timescale confines most of the methaneproduction to the shallow sediments, whereas longer timescales spread the pro-duction of methane to greater depths. For the simulations in Figure 10 we adopteda timescale of 0.3 Ma, which confines the methane production to the top fewhundred meters of sediments. Predicted pore fluid chlorinities after hydrate dis-sociation are shown in Figure 11. Measured chlorinities from Site 997 of ODPLeg 164 (Blake Ridge) are shown for comparison. Our prediction reproduces themeasured freshening below the stability zone and the gradual decrease in chlor-inity through the top 200 m of sediments. The lowest chlorinities are predictedat the base of the stability zone and are comparable in magnitude to the lowest
Ann
u. R
ev. E
arth
Pla
net.
Sci.
2000
.28:
477-
507.
Dow
nloa
ded
from
arj
ourn
als.
annu
alre
view
s.or
gby
Sta
te U
nive
rsity
of
New
Yor
k -
Ston
y B
rook
on
03/1
9/09
. For
per
sona
l use
onl
y.

CLATHRATE HYDRATES 499
Figure 11 Chlorinity predicted in pore fluid afterallowing estimated hydrate volume to dissociate.Measured chlorinity at Sites 997A/997B fromODP Leg 164 (Blake Ridge) is shown forcomparison.
chlorinities measured at Site 997. Thus the measured chlorinity can be attributedto gas hydrate without appealing to other sources of freshening. It is encouragingthat this simple model can also explain the average hydrate abundance (Holbrooket al 1996) and the volume of free gas (Dickens et al 1997b) observed on theBlake Ridge.
The preceding predictions for hydrate volume suggest that the hydrate is dis-seminated through the sediments. Support for this prediction is derived from thechlorinity measurements and well logs (including electrical resistance and acous-tic travel time), although exceptions are commonly reported (Collett 1993). Insome cases, hydrate may completely fill the pore volume or even displace sedi-ments to form massive sheets or nodules of pure hydrate. Clennell et al (1999)has explored the role of pore-scale processes in producing massive hydrates. Inaddition, preferential flow along fractures or through more permeable sedimentarylayers may produce greater variability in the distribution of hydrate.
ROLE IN CLIMATE CHANGE
Speculations about the role of gas hydrate in climate change are motivated by thestrong influence of methane on the radiative properties of the atmosphere. Becausemethane is known to be an effective greenhouse gas (Lashof & Ahuja 1990),questions have arisen about the consequences of large releases of methane.Although present-day rates of methane release from gas hydrate are thought tobe small compared with other sources (Cicerone & Oremland 1988), catastrophicscenarios have been proposed where hydrates release huge volumes of methaneinto the atmosphere (Kvenvolden 1988b; MacDonald 1990b; Nisbet 1990, 1992;
Ann
u. R
ev. E
arth
Pla
net.
Sci.
2000
.28:
477-
507.
Dow
nloa
ded
from
arj
ourn
als.
annu
alre
view
s.or
gby
Sta
te U
nive
rsity
of
New
Yor
k -
Ston
y B
rook
on
03/1
9/09
. For
per
sona
l use
onl
y.

500 BUFFETT
Paull et al 1991). Clear evidence of a link between gas hydrates and climatechange remains elusive (Dickens et al 1997a), but current estimates of the meth-ane trapped in gas hydrate along deep continental margins and in permafrostregions are large enough to warrant serious consideration.
Estimates of the hydrate volume in marine sediments (Kvenvolden 1988a,MacDonald 1990a, Gornitz & Fung 1994) correspond to a carbon reservoir oforder 1016 kg. As a representative example, the estimate of Kvenvolden (1988a)assumed that hydrate is confined to a 107-km area where the organic content inthe sediments exceeds 1% and the water depth is large enough to ensure stability.The vertical extent of the stability zone was taken to be 500 m. By assuming arepresentative hydrate volume of 10% and a sediment porosity of 0.5, Kvenvolden(1988a) estimated 2 2 1016 kg of carbon in marine gas hydrates. Comparableestimates are obtained using the numerical predictions from the previous section,where an average hydrate volume of 6% was obtained in an area with a highsedimentation rate. More typical sedimentation rates yield much less free gas andsomewhat smaller hydrate volumes (nominally 5%). For the same areal extentand depth of the hydrate occurrences, we might predict 1016 kg of methane carbon.On the other hand, hydrate accumulations along active margins could be signifi-cantly larger (Hyndman & Davis 1992). Despite these uncertainties, 1016 kg ofmethane carbon appears to be a reasonable order of magnitude estimate, and thisvalue is roughly 3,000 times larger than the amount of methane carbon in thepresent-day atmosphere (Kvenvolden 1988b).
Scenarios for massive release of methane from gas hydrates rely on their prox-imity to the surface. Changes in atmospheric conditions are expected to affect thestability of hydrate in the seafloor and in permafrost regions. Whether hydratesdissociate on a global scale in response to climate change is not presently known.To address this question, we need to understand how gas hydrate responds tochanges in climate and how the gas escapes into the atmosphere.
Increases in present-day temperature are most dramatic in the Arctic (Chapman& Walsh 1993). Dissociation of gas hydrate in permafrost begins once the tem-perature increase in the atmosphere penetrates the top 200 meters of sedimentand ice. Warming may also cause a rise in sea level, which brings relatively warmseawater over much colder regions of coastal permafrost (Kvenvolden 1988b). Ineither case, the timescale for thermal diffusion through the top 200 m of sedimentsis of order 103 years, so a substantial delay between warming and the onset ofdissociation is expected. Further delays in hydrate dissociation are expectedbecause latent heat is absorbed as the overlying layer of ice is melted.
Predicting the response of marine gas hydrate is more difficult. Temperaturein the deep ocean rises slowly in response to atmospheric warming because ofthe large heat capacity of the oceans. A gradual increase in bottom-water tem-perature should dissociate the marine hydrate, but this effect is partially offset bythe increase in pressure due to rising sea level. Deep-water sites are probablymost sensitive to temperature because T3(P) is less dependent on P when thepressure is high (see Figure 3). Consequently, the temperature of the deep ocean
Ann
u. R
ev. E
arth
Pla
net.
Sci.
2000
.28:
477-
507.
Dow
nloa
ded
from
arj
ourn
als.
annu
alre
view
s.or
gby
Sta
te U
nive
rsity
of
New
Yor
k -
Ston
y B
rook
on
03/1
9/09
. For
per
sona
l use
onl
y.

CLATHRATE HYDRATES 501
is generally a more important factor in determining hydrate stability. Dissociationreleases methane gas at the base of the stability zone, though much of this gasmay simply migrate back into the stability zone and recrystallize into hydrate.With relatively little methane escaping from the ocean floor, there should be littleinfluence on global climate. The areas of the ocean floor most vulnerable tomethane release are probably situated below shallower water where the stabilityzone is thin. Warming can eliminate the stability zone entirely, preventing meth-ane from recrystallizing into hydrate. However, methane that escapes into thewater column may be oxidized before it reaches the atmosphere (Kvenvolden1999). Using assumptions favorable for methane release into the atmosphere,Harvey & Huang (1995) estimate that the rate of methane released from marinegas hydrate is small compared with other present-day sources of greenhousegases.
A more effective mechanism for releasing methane into the atmosphereinvolves slumping on continental margins. A possible connection between gashydrates and sediment failure was first noted by McIver (1982). Similar obser-vations have since been made in many locations (Carpenter 1981, Kayen & Lee1991, Maslin et al 1998). Kayen & Lee (1991) noted that the volume changeassociated with hydrate dissociation can elevate pore pressures at the base of thestability zone. Increases in pore pressure should reduce the strength of the sedi-ments and may lead to failure if the pressure disturbance is sufficiently large.Relaxation of this excess pressure is accommodated by flow of the pore fluidaway from the region of excess pressure. Consequently, the increase in pressureis limited by the rate of pressure relaxation compared with the rate of hydratedissociation. Numerical calculations of Kayen & Lee (1991) show that the relax-ation time is most sensitive to the permeability of the sediments. For permeabil-ities of order 10117 m2 or more, the relaxation time is less than 102 years.Relatively slow changes in pressure and temperature in the seafloor over periodsof 104 years should cause only small increases in pore pressure. On the otherhand, persistence of hydrate below the stability zone in a metastable state mayenhance the vigor of decomposition when it eventually occurs; the resulting pres-sure disturbance could be increased substantially under these circumstances (Buf-fett & Zatsepina 1999). Alternatively, gas hydrate may inhibit the consolidationof sediments with depth. When hydrates dissociate below the stability zone, thesediments may lose strength and become vulnerable to sliding. Low volumes ofhydrates in many locations would seem to provide argument against a significantinfluence on consolidation, unless hydrate cements the sediments. The mechanicalproperties of hydrated sediments is currently an active area of research.
Given the global distribution of gas hydrate, it is inevitable that submarineslides occasionally liberate gas hydrate from the sediments. The buoyancy ofhydrate in seawater ensures that the crystals rise through the water column andrelease methane into the atmosphere. Whether systematic occurrences of sedimentfailure are connected with the response of gas hydrates to climate change isunknown. Paull et al (1996) has argued for increased slumping during the last
Ann
u. R
ev. E
arth
Pla
net.
Sci.
2000
.28:
477-
507.
Dow
nloa
ded
from
arj
ourn
als.
annu
alre
view
s.or
gby
Sta
te U
nive
rsity
of
New
Yor
k -
Ston
y B
rook
on
03/1
9/09
. For
per
sona
l use
onl
y.

502 BUFFETT
glacial maximum when sea levels were near a minimum. More recently, Rothwellet al (1998) have reported on a large slide dating from the late Pleistoscene in thewestern Mediterranean Sea, which they attributed to dissociation of gas hydrate.Hydrates may dissociate in response to a drop in sea level (because of the reduc-tion in pressure in the seafloor), but we cannot neglect the influence of tempera-ture. A decrease in the seafloor temperature of only several tenths of a degree issufficient to offset the effects of a 100-m drop in sea level. Consequently, theinterplay between temperature and pressure changes must be evaluated verycarefully.
Records of atmospheric methane recovered from ice cores in Antarctica andGreenland (Stauffer et al 1998, Chappellaz et al 1990) provide valuable obser-vations for testing the possible role of gas hydrates in past climate. A gradualreduction in methane concentration is observed during the glacial period, followedby a rapid increase in methane at the onset of warming. The limited time reso-lution of the methane and temperature records (the latter inferred from d18O)makes it difficult to assess whether methane leads or lags the temperature record.Conventional explanations of the methane variations are linked to changes inmethane production in wetlands, but significant contributions from gas hydratecannot be ruled out. In order to test the hypothesis that methane release fromsubmarine slides contributes to the methane record, we require a statisticaldescription of changes in the rate of slumping in response to changes in sea level.Both the amplitude and the timing of the methane release could then be testedagainst the observed record. If this mechanism is viable, then it could imply thatgas hydrates limit the extent of glaciation by releasing large volumes of methaneduring periods of low sea level (Paull et al 1991).
Speculations about methane release from gas hydrates are not confined tomarine occurrences. Nisbet (1990) has suggested that rapid warming at the endof the last glacial period was driven by decomposition of gas hydrates in perma-frost regions. According to this suggestion, hydrates dissociate in response toincreases in temperature or decreases in pressure as the overlying ice sheets beginto melt. Release of methane into the atmosphere is thought to provide a positivefeedback for more rapid warming, thus accelerating the release of methane. Apotential difficulty with this mechanism is the time delay between the initiationof warming and the onset of hydrate dissociation. Records of atmospheric meth-ane do not permit a time delay of order 103 years between warming and the onsetof methane release. In fact, the ice-core record suggests that atmospheric methaneresponds very quickly to changes in temperature. A transition to colder tempera-tures during the Younger Dryas event between 10 and 11 thousand years ago (in14C years) is reflected in a nearly simultaneous reduction in atmospheric methane.Subsequent increases in global temperature at the end of the Younger Dryas arealso evident in the methane record. Therefore, the timing of the methane releaseis an important constraint on the underlying mechanism. In the next few years,we can expect to see significant advances in our understanding of gas hydrate asa component of the Earth system. Future studies will decide whether gas hydrateis the dark horse of global climate change.
Ann
u. R
ev. E
arth
Pla
net.
Sci.
2000
.28:
477-
507.
Dow
nloa
ded
from
arj
ourn
als.
annu
alre
view
s.or
gby
Sta
te U
nive
rsity
of
New
Yor
k -
Ston
y B
rook
on
03/1
9/09
. For
per
sona
l use
onl
y.

CLATHRATE HYDRATES 503
ACKNOWLEDGMENTS
I thank Miriam Kastner and Garrison Sposito for helpful comments and sugges-tions. Roy Hyndman kindly provided figures from his work with collaborators atthe Geological Survey of Canada and the University of Victoria. This work issupported by an NSERC Collaborative Project Grant.
Visit the Annual Reviews home page at www.AnnualReviews.org.
LITERATURE CITED
Baker VR, Strom RG, Gulick VC, Kargel JS,Komatsu G, Kale VS. 1991. Ancientoceans, ice sheets and the hydrologicalcycle on Mars. Nature 352:589–94
Belosludov VR, Lavrentiev MY, Dyadin YA.1991 Theory of clathrates. J. Inclus.Phenom. Mol. 10:399–422
Borowski W, Paull CK, Ussler W III. 1996.Marine pore water sulfate profiles indicatemethane flux from underlying gas hydrates.Geology 24:655–58
Brooks J, Cox H, Bryant W, Kennicutt M II,Mann R, McDonald T. 1986. Associationof gas hydrates and oil seepage in the Gulfof Mexico. Org. Geochem. 10:221–34
Brown, KM, Bangs NL, Froehlich PN, Kven-volden KA. 1996. The nature, distributionand origin of gas hydrate in the Chile TripleJunction region. Earth Planet. Sci. Lett.139:471–83
Buffett BA, Zatsepina OY. 1999. Metastabilityof gas hydrates. Geophys. Res. Lett.26:2981–84
Carpenter G. 1981. Coincident sedimentslump/clathrate complexes on the U.S.Atlantic continental slope. Geomar. Lett.1:29–32
Carson B, Screaton EJ. 1998. Fluid flow inaccretionary prisms: evidence for focused,time-variable discharge. Rev. Geophys.36:329–51
Chapman WL, Walsh JE. 1993. Recent varia-tions of sea ice and air temperature in highlatitudes. Bull. Am. Met. Soc. 74:33–47
Chappellaz J, Barnola JM, Raynaud D, Korot-kevich YS, Lorius C. 1990. Ice-core record
of atmospheric methane over the past160,000 years. Nature 345:127–31
Cicerone R, Oremland R. 1988. Biogeochem-ical aspects of atmospheric methane.Global Biogeochem. Cycles 2:299–327
Claypool G, Kvenvolden KA. 1983. Methaneand other hydrocarbon gases in marine sed-iments. Annu. Rev. Earth Planet. Sci.11:299–327
Clennell MB, Hovland M, Booth JS, Henry P,Winters WJ. 1999. Formation of natural gashydrates in marine sediments. Part 1: con-ceptual model of gas hydrate growth con-ditioned by host sediment properties. J.Geophys. Res. 104:22985–3003
Collett TS. 1993. Natural gas hydrates of thePrudhoe Bay and Kuparuk River area,North Slope, Alaska. AAPG Bull. 77:793–812
Dickens GR, Castillo MM, Walker JCG.1997a. A blast of gas in the latest Paleo-cene: simulating first-order effects of mas-sive dissociation of oceanic methanehydrate. Geology 25:259–62
Dickens GR, Paull CK, Wallace P, ODP Leg164 Scientific Party. 1997b. Direct mea-surement of in situ methane quantities in alarge gas-hydrate reservoir. Nature385:426–28
Dickens GR, Quinby-Hunt MS. 1997. Methanehydrate stability in pore water: a simpletheoretical approach for geophysical appli-cations. J. Geophys. Res. 102:773–83
Dvorkin J, Mavko G, Nur A. 1991. The effectof cementation on the elastic properties ofgranular material. Mech. Mater. 12:207–17
Ann
u. R
ev. E
arth
Pla
net.
Sci.
2000
.28:
477-
507.
Dow
nloa
ded
from
arj
ourn
als.
annu
alre
view
s.or
gby
Sta
te U
nive
rsity
of
New
Yor
k -
Ston
y B
rook
on
03/1
9/09
. For
per
sona
l use
onl
y.
504 BUFFETT
Edwards RN. 1997. On the resource evaluationof marine gas hydrate deposits using sea-floor transient electric dipole-dipole meth-ods. Geophysics 62:63–74
Egeberg PK, Barth T. 1998. Contribution ofdissolved organic species to the carbonenergy budget of hydrate-bearing deep-seasediments (Ocean Drilling Program Site997 Blake Ridge). Chem. Geol. 149:25–35
Egeberg PK, Dickens GR. 1999. Thermody-namic and pore water halogen constraintson gas hydrate distribution at ODP Site 997(Blake Ridge). Chem. Geol. 153:53–79
Englezos P, Bishnoi PR. 1988. Prediction ofgas hydrate formation conditions in aque-ous electrolyte solutions. AIChE J.34:1718–21
Englezos P, Kalogerakis N, Bishnoi PR. 1990.Formation and decomposition of gashydrate of natural gas components. J.Inclus. Phenom. Mol. 8:89–101
Farrell JW, Clemens SC, Gromet LP. 1995.Improved chronostratigraphic referencecurve of late neogene seawater 87Sr/86Sr.Geology 23:403–6
Galimov E, Kvenvolden KA. 1983. Concentra-tions and carbon isotopic compositions ofCH4 and CO2 in gas from sediments of theBlake Outer Ridge, Deep Seas DrillingProject Leg 76. In Initial Reports of theDeep Sea Drilling Project, ed. R Sheridan,F Gradstein, 76:403–7. Washington: U.S.Government Printing Office.
Ginsburg GD, Guseynov RA, Dadashev AA,et al. 1992. Gas hydrates of the southernCaspian. Int. Geol. Rev. 34:765–82
Ginsburg GD, Soloviev V. 1997. Methanemigration within the submarine gas hydratestability zone under deep-water conditions.Mar. Geol. 137:49–57
Gornitz V, Fung I. 1994. Potential distributionof methane hydrates in the world’s oceans.Global Biogeochem. Cycles 8:335–47
Handa YP. 1990. Effect of hydrostatic pressureand salinity on the stability of gas hydrates.J. Phys. Chem. 94:2652–57
Handa YP, Stupin D. 1992. Thermodynamicproperties and dissociation characteristics
of methane and propane hydrates in 70-Angstrom-radius silica-gel pores. J. Phys.Chem. 96:8599–603
Handa YP, Zakrzewski M, Fairbridge C. 1992.Effect of restricted geometries on the struc-ture and thermodynamic properties of ice.J. Chem. Phys. 96:8594–99
Harvey LDD, Huang Z. 1995. Evaluation ofthe potential impact of methane clathratedestabilization on future global warming. J.Geophys. Res. 100:2905–26
Hesse R, Harrison W. 1981. Gas hydrates(clathrates) causing pore-water fresheningand oxygen isotope fractionation in deep-water sedimentary sections of terrigenouscontinental margins. Earth Planet. Sci. Lett.55:453–62
Hobro J, Minshull TA, Singh SC. 1998. Tomo-graphic seismic studies of the methanehydrate stability zone in the Cascadia mar-gin, In Gas Hydrates:Relevance to WorldMargin Stability and Climate Change, ed.JP Henriet, J Mienert, 137:133–40. Lon-don: Geological Society. 338 pp.
Holbrook WS, Hoskins H, Wood WT, StephanRA, Lizarralde D, Leg 164 Scientific Party.1996. Methane hydrate and free gas on theBlake Ridge from vertical seismic profiling.Science 273:1840–43
Holder GD, Zetts SP, Pradhan N. 1988. Phasebehavior in systems containing clathratehydrates. Rev. Chem. Eng. 5:1–70
Hutchison I. 1985. The effect of sedimentationand compaction on oceanic heat flow. Geo-phys. J. R. Astr. Soc. 82:439–59
Hwang MJ, Holder GD, Zele SR. 1993. Latticedistortion by guest molecules in gas-hydrates. Fluid Phase Equil. 83:437–44
Hyndman RD, Davis EE. 1992. A mechanismfor the formation of methane hydrate andseafloor bottom-simulating reflectors byvertical fluid expulsion. J. Geophys. Res.97:7025–41
Hyndman RD, Spence G. 1992. A seismicstudy of methane hydrate bottom simulat-ing reflectors. J. Geophys. Res. 97:6683–98
Jeffrey GA, McMullan RK. 1967. The clath-rate hydrates. Prog. Inorg. Chem. 8:43–108
Ann
u. R
ev. E
arth
Pla
net.
Sci.
2000
.28:
477-
507.
Dow
nloa
ded
from
arj
ourn
als.
annu
alre
view
s.or
gby
Sta
te U
nive
rsity
of
New
Yor
k -
Ston
y B
rook
on
03/1
9/09
. For
per
sona
l use
onl
y.

CLATHRATE HYDRATES 505
Kastner M, Kvenvolden KA, Lorenson TD.1998. Chemistry, isotopic composition andorigin of a methane-hydrogen sulfidehydrate at the Cascadia subduction zone.Earth Planet. Sci. Lett. 156:173–83
Kastner M, Kvenvolden KA, Whiticar M,Camerlenghi A, Lorenson T. 1995. Relationbetween pore fluid chemistry and gashydrates associated with bottom-simulatingreflectors at the Cascadia margin, Sites 889and 992. In Proc. Ocean Drill. Prog., Sci-entific Results, 146:175–87. College Sta-tion, TX: Ocean Drilling Program.
Kayen R, Lee H. 1991. Pleistocene slope insta-bility of gas hydrate-laden sediment on theBeaufort Sea margin. Mar. Geotech.10:125–41
Klinger J. 1991. Physical properties of frozenvolatiles and their relevance to the study ofcomet nuclei. In Comets in the Post-HalleyEra, ed. RL Newburn Jr. et al, pp. 227–47.Dordrecht: Kluwer
Kvenvolden KA. 1988a. Methane hydrate—amajor reservoir of carbon in the shallowgeosphere? Chem. Geol. 71:41–51
Kvenvolden KA. 1988b. Methane hydrates andglobal climate change. Global Biogeochem.Cycles 2:221–29
Kvenvolden KA. 1993. Gas hydrates—geolog-ical perspective and global change. Rev.Geophys. 31:173–87
Kvenvolden KA. 1999. Potential effects of gashydrate on human welfare. Proc. Natl.Acad. Sci. USA 96:3420–26
Kvenvolden KA, Barnard L. 1983. Gashydrates of the Blake Outer Ridge, DeepSea Drilling Project Site 553, Leg 76. InInitial Reports of the Deep Seas DrillingProject, ed. R Sheridan, F Gradstein,75:353–66. Washington: U.S. GovernmentPrinting Office.
Kvenvolden KA, Ginsburg G, Solovyev V.1993. Worldwide distribution of subaquaticgas hydrates. Geo-Marine Lett. 13:32–40
Kvenvolden KA, Kastner M. 1990. Gashydrates of the Peruvian outer continentalmargin. In Proc. Ocean Drill. Prog. Sci.Results, ed. E Suess, R von Huene,
112:517–26. College Station, TX: OceanDrilling Program.
Lashof DA, Ahuja DR. 1990. Relative contri-butions of greenhouse gas emissions toglobal warming. Nature 344:529–31
Lee MW, Hutchinson DR, Collett TS, DillonWP. 1996. Seismic velocities for hydrate-bearing sediments using weighted equation.J. Geophys. Res. 101:20347–58
Lunine JI, Stevenson DJ. 1985. Thermody-namics of clathrate hydrate at low and highpressure with application to the outer solarsystem. Astrophys. J. Suppl. Ser. 58:493–531
Lunine JI, Stevenson DJ. 1987. Clathrate andammonia hydrates at high pressure: appli-cation to the origin of methane on Titan.Icarus 70:61–77
MacDonald GJ. 1990a. The future of methaneas an energy resource. Annu. Rev. Energy15:53–83
MacDonald GJ. 1990b. Role of methane clath-rates in past and future climates. Clim.Change 16:247–81
MacKay ME, Jarrard RD, Westbrook GK,Hyndman RD. 1994. Origin of bottom-sim-ulating reflectors: geophysical evidencefrom the Cascadia accretionary prism.Geology 22:459–62
Maslin M, Mikkelsen N, Vilela C, Haq B.1998. Sea-level and gas-hydrate controlledcatastrophic sediment failures of the Ama-zon fan. Geology 26:1107–10
McIver RD. 1983. Role of naturally occurringgas hydrates in sediment transport. AAPGBull. 66:789–92
Miller JJ, Lee MW, von Huene R. 1991. Ananalysis of a seismic reflection from thebase of a gas hydrate zone. AAPG Bull.75:910–24
Miller SL. 1961. The occurrence of gas hydratein the solar system. Proc. Natl. Acad. Sci.USA 47:1798–808
Miller SL. 1974. The nature and occurrence ofclathrate hydrates. In Natural Gas inMarine Sediments, ed. IR Kaplan, pp. 151–77. New York: Plenum
Ann
u. R
ev. E
arth
Pla
net.
Sci.
2000
.28:
477-
507.
Dow
nloa
ded
from
arj
ourn
als.
annu
alre
view
s.or
gby
Sta
te U
nive
rsity
of
New
Yor
k -
Ston
y B
rook
on
03/1
9/09
. For
per
sona
l use
onl
y.
506 BUFFETT
Miller SL, Smythe WD. 1970. Carbon dioxideclathrate in the Martian ice cap. Science170:531–33
Milton DJ. 1974. Carbon dioxide hydrates andfloods on Mars. Science 183:654–56
Minshull TA, Singh SC, Westbrook GK. 1994.Seismic velocity structure of a gas hydratereflector offshore western Columbia fromfull waveform inversion. J. Geophys. Res.99:4715–34
Murphy WF. 1984. Acoustic measurements ofpartial gas saturation in tight sandstones. J.Geophys. Res. 89:1549–59
Nisbet EG. 1990. The end of the ice age. Can.J. Earth Sci. 27:148–57
Nisbet EG. 1992. Sources of atmospheric CH4
in early postglacial time. J. Geophys. Res.97:12849–67
Pauling L, Marsh RE. 1952. The structure ofchlorine hydrate. Proc. Natl. Acad. Sci.USA 38:112–18
Paull CK, Borowski WS, Rodriguez NM, ODPLeg 164 Scientific Party. 1998. Marine gashydrate inventory: preliminary results ofODP Leg 164 and implications for gasventing and slumping associated with theBlake Ridge gas hydrate field. In GasHydrates: Relevance to World Margin Sta-bility and Climate Change, JP Henriet, JMienert, 137:133–40. London: GeologicalSociety. 338 pp.
Paull CK, Buelow W, Ussler W, Borowski WS.1996. Increased continental-margin slump-ing frequency during sea-level lowstandsabove gas hydrate-bearing sediments. Geol-ogy 24:143–46
Paull CK, Ussler W III, Borowski WS. 1994.Source of methane to form marine gashydrates, In Natural Gas Hydrates, ed. EDSloan, J Happel Jr, MA Hnatow, pp. 161–76. New York: NY Acad. Sci.
Paull CK, Ussler W III, Dillon W. 1991. Is theextent of glaciation limited by marine gas-hydrates? Geophys. Res. Lett. 18:432–34
Pecher IA, Ranero CR, von Huene R, MinshullTA, Singh SC. 1998. The nature and distri-bution of bottom simulating reflectors at the
Costa Rican convergent margin. Geophys.J. Int. 133:219–29
Rempel AW, Buffett BA. 1997. Formation andaccumulation of gas hydrate in porousmedia. J. Geophys. Res. 102:10151–64
Rempel AW, Buffett BA. 1998. Mathematicalmodels of gas hydrate accumulation. In GasHydrates: Relevance to World Margin Sta-bility and Climate Change, JP Henriet, JMienert, 137:63–74. London: GeologicalSociety. 338 pp.
Rennie GK, Clifford J. 1977. Melting of ice inporous solids. J. Chem. Soc. Faraday Trans.I. 73:680–89
Ripmeester JA, Ratcliffe CI, Klug DD, Tse JS.1994. Molecular perspectives on structureand dynamics in clathrate hydrates. In Nat-ural Gas Hydrates, ed. ED Sloan, J HappelJr, MA Hnatow, pp. 161–76, New York: NYAcad. Sci.
Ripmeester JA, Tse JS, Ratcliffe CI, PowellBM. 1987. A new clathrate hydrate struc-ture. Nature 325:135–36
Rodger PM. 1990. The stability of gashydrates. J. Phys. Chem. 94:6080–89
Rothwell RG, Thomson J, Kahler G. 1998.Low-sea-level emplacement of a very largeLate Pleistocene megaturbidite in the west-ern Mediterranean Sea. Nature 392:377–80
Rowe MM, Gettrust JF. 1993. Faulted structureof the bottom simulating reflector on theBlake Ridge, western North-Atlantic. Geol-ogy 21:833–36
Ruppel C. 1997. Anomalously cold tempera-ture observed at the base of the gas hydratestability zone on the US Atlantic passivemargin. Geology 25:699–702
Sassen R, MacDonald IR. 1994. Evidence forStructure H hydrate, Gulf of Mexico con-tinental slope. Org. Geochem. 22:1029–32
Shipley TH, Houston M, Buffler R, et al. 1979.Seismic reflection evidence for the wide-spread occurrence of possible gas-hydratehorizons on continental slopes and rises.AAPG Bull. 63:2204–13
Singh SC, Minshull TA, Spence GD. 1993.Velocity structure of a gas hydrate reflector.Science 260:204–7
Ann
u. R
ev. E
arth
Pla
net.
Sci.
2000
.28:
477-
507.
Dow
nloa
ded
from
arj
ourn
als.
annu
alre
view
s.or
gby
Sta
te U
nive
rsity
of
New
Yor
k -
Ston
y B
rook
on
03/1
9/09
. For
per
sona
l use
onl
y.

CLATHRATE HYDRATES 507
Sloan ED. 1998. Clathrate Hydrates of NaturalGas. 2nd ed. New York: Dekker. 641 pp.
Sparks KA, Tester JW. 1992. Intermolecularpotential energy of water clathrates: theinadequacy of the nearest neighbourapproximation. J. Phys. Chem. 96:11022–29
Stauffer B, Lochbronner E, Oeschger H,Schwander J. 1988. Methane concentrationin the glacial atmosphere was only half thatof the preindustrial Holocene. Nature332:812–14
Stern LA, Kirby SH, Durham WB. 1996. Pecu-liarities of methane clathrate hydrate for-mation and subcooling, including possiblesuperheating of ice. Science 273:1843–48
Stoll R, Ewing J, Bryan G. 1971. Anomalouswave velocity in sediments containing gashydrates. J. Geophys. Res. 76:2090–94
Tanaka H, Kiyohara K. 1993. Thermodynamicstability of clathrate hydrates—Part I. J.Chem. Phys. 98:4098–109
Thiery R, Bakker R, Monnin C, ODP Leg 164Scientific Party. 1998. Geochemistry of gashydrates and associated fluids in the sedi-ments of a passive continental margin. InGas Hydrates: Relevance to World MarginStability and Climate Change, ed. JP Hen-riet, J Mienert, 137:161–65. London: Geo-logical Society. 338 pp.
van der Waals JH, Platteeuw JC. 1959. Clath-rate solutions. Adv. Chem. Phys. 2:1–57
Willoughby EC, Edwards RN. 1997. On theresource evaluation of marine gas-hydrate
deposits using seafloor compliance meth-ods. Geophys. J. Int. 131:751–66
Wood WT, Stoffa PL, Shipley TH. 1994. Quan-titative detection of methane hydratethrough high-resolution seismic velocityanalysis. J. Geophys. Res. 99:9681–95
Xu XY, Ruppel C. 1999. Predicting the occur-rence, distribution, and evolution of meth-ane gas hydrate in porous marinesediments. J. Geophys. Res. 104:5081–95
Yuan T, Hyndman RD, Spence GD, DesmonsB. 1996. Seismic velocity increase anddeep-sea gas hydrate concentration above abottom-simulating reflector on the northernCascadia continental slope. J. Geophys.Res. 101:13655–71
Yuan T, Spence GD, Hyndman RD, MinshullTA, Singh SC. 1999. Seismic velocity stud-ies of a gas hydrate bottom-simulatingreflector on the northern Cascadia continen-tal margin: amplitude modeling and fullwaveform inversion. J. Geophys. Res.104:1179–92
Zahnle K, Pollack JB, Grinspoon D, Dones L.1992. Impact-generated atmospheres overTitan, Ganymede and Callisto. Icarus 95:1–23
Zatsepina OY, Buffett BA. 1997. Phase equi-librium of gas hydrate: implications for theformation of hydrate in the deep seafloor.Geophys. Res. Lett. 24:1567–70
Zatsepina OY, Buffett BA. 1998. Thermody-namic conditions for the stability of gashydrate in the seafloor. J. Geophys. Res.103:24127–39
Ann
u. R
ev. E
arth
Pla
net.
Sci.
2000
.28:
477-
507.
Dow
nloa
ded
from
arj
ourn
als.
annu
alre
view
s.or
gby
Sta
te U
nive
rsity
of
New
Yor
k -
Ston
y B
rook
on
03/1
9/09
. For
per
sona
l use
onl
y.

Ann
u. R
ev. E
arth
Pla
net.
Sci.
2000
.28:
477-
507.
Dow
nloa
ded
from
arj
ourn
als.
annu
alre
view
s.or
gby
Sta
te U
nive
rsity
of
New
Yor
k -
Ston
y B
rook
on
03/1
9/09
. For
per
sona
l use
onl
y.

Annual Review of Earth and Planetary Science Volume 28, 2000
CONTENTSPalynology after Y2K--Understanding the Source Area of Pollen in Sediments, M. B. Davis 1
Dinosaur Reproduction and Parenting, John R. Horner19
Evolution and Structure of the Lachlan Fold Belt (Orogen) of Eastern Australia, David A. Foster, David R. Gray 47
Remote Sensing of Active Volcanoes, Peter Francis, David Rothery 81Dynamics of Volcanic Systems in Iceland: Example of Tectonism and Volcanism at Juxtaposed Hot Spot and Mid-Ocean Ridge Systems, Agust Gudmundsson 107
Understanding Oblique Impacts from Experiments, Observations, and Modeling, E. Pierazzo, H. J. Melosh 141
Synthetic Aperture Radar Interferometry to Measure Earth''s Surface Topography and Its Deformation, Roland Bürgmann, Paul A. Rosen, Eric J. Fielding 169Geologic Evolution of the Himalayan-Tibetan Orogen, An Yin, T. Mark Harrison 211
MARS 2000, Arden L. Albee 281
Vredefort, Sudbury, Chicxulub: Three of a Kind, Richard Grieve, Ann Therriault 305Climate Reconstruction from Subsurface Temperatures, Henry N. Pollack, Shaopeng Huang 339
Asteroid Fragmentation and Evolution of Asteroids, Eileen V. Ryan 367Seismic Imaging of Mantle Plumes, Henri-Claude Nataf 391
New Perspectives on Orbitally Forced Stratigraphy, Linda A. Hinnov 419
Clathrate Hydrates, Bruce A. Buffett 477Heterogeneity of the Lowermost Mantle, Edward J. Garnero 509Spreading Volcanoes, Andrea Borgia, Paul T. Delaney, Roger P. Denlinger 539Scaling, Universality, and Geomorphology, Peter Sheridan Dodds, Daniel H. Rothman 571Chemical Weathering, Atmospheric CO2, and Climate, Lee R. Kump, Susan L. Brantley, Michael A. Arthur 611Self-Ordering and Complexity in Epizonal Mineral Deposits, Richard W. Henley, Byron R. Berger 669
Ann
u. R
ev. E
arth
Pla
net.
Sci.
2000
.28:
477-
507.
Dow
nloa
ded
from
arj
ourn
als.
annu
alre
view
s.or
gby
Sta
te U
nive
rsity
of
New
Yor
k -
Ston
y B
rook
on
03/1
9/09
. For
per
sona
l use
onl
y.