Alcoholic Fuels - | University Of...
281
Transcript of Alcoholic Fuels - | University Of...

Alcoholic Fuels
Shelley MinteerSaint Louis University
Missouri
CRC is an imprint of the Taylor & Francis Group,an informa business
Boca Raton London New York
DK9448_half-series-title 3/9/06 9:21 AM Page i
© 2006 by Taylor & Francis Group, LLC
Published in 2006 byCRC PressTaylor & Francis Group 6000 Broken Sound Parkway NW, Suite 300Boca Raton, FL 33487-2742
© 2006 by Taylor & Francis Group, LLCCRC Press is an imprint of Taylor & Francis Group
No claim to original U.S. Government worksPrinted in the United States of America on acid-free paper10 9 8 7 6 5 4 3 2 1
International Standard Book Number-10: 0-8493-3944-8 (Hardcover) International Standard Book Number-13: 978-0-8493-3944-8 (Hardcover) Library of Congress Card Number 2005056058
This book contains information obtained from authentic and highly regarded sources. Reprinted material isquoted with permission, and sources are indicated. A wide variety of references are listed. Reasonable effortshave been made to publish reliable data and information, but the author and the publisher cannot assumeresponsibility for the validity of all materials or for the consequences of their use.
No part of this book may be reprinted, reproduced, transmitted, or utilized in any form by any electronic,mechanical, or other means, now known or hereafter invented, including photocopying, microfilming, andrecording, or in any information storage or retrieval system, without written permission from the publishers.
For permission to photocopy or use material electronically from this work, please access www.copyright.com(http://www.copyright.com/) or contact the Copyright Clearance Center, Inc. (CCC) 222 Rosewood Drive,Danvers, MA 01923, 978-750-8400. CCC is a not-for-profit organization that provides licenses and registrationfor a variety of users. For organizations that have been granted a photocopy license by the CCC, a separatesystem of payment has been arranged.
Trademark Notice: Product or corporate names may be trademarks or registered trademarks, and are used onlyfor identification and explanation without intent to infringe.
Library of Congress Cataloging-in-Publication Data
Alcoholic fuels / edited by Shelley Minteer.p. cm.
ISBN 0-8493-3944-8 (alk. paper)1. Alcohol as fuel. I. Minteer, Shelley D. II. Title.
TP358.A4445 2006662’.6692--dc22 2005056058
Visit the Taylor & Francis Web site at http://www.taylorandfrancis.com
and the CRC Press Web site at http://www.crcpress.com
Taylor & Francis Group is the Academic Division of Informa plc.
DK9448_Discl.fm Page 1 Wednesday, January 25, 2006 3:53 PM
© 2006 by Taylor & Francis Group, LLC
CHEMICAL INDUSTRIES
A Series of Reference Books and Textbooks
Consulting Editor
HEINZ HEINEMANNBerkeley, California
1. Fluid Catalytic Cracking with Zeolite Catalysts, Paul B. Venutoand E. Thomas Habib, Jr.
2. Ethylene: Keystone to the Petrochemical Industry,Ludwig Kniel, Olaf Winter, and Karl Stork
3. The Chemistry and Technology of Petroleum,James G. Speight
4. The Desulfurization of Heavy Oils and Residua,James G. Speight
5. Catalysis of Organic Reactions, edited by William R. Moser6. Acetylene-Based Chemicals from Coal and Other Natural
Resources, Robert J. Tedeschi7. Chemically Resistant Masonry, Walter Lee Sheppard, Jr.8. Compressors and Expanders: Selection and Application
for the Process Industry, Heinz P. Bloch, Joseph A. Cameron,Frank M. Danowski, Jr., Ralph James, Jr., Judson S. Swearingen, and Marilyn E. Weightman
9. Metering Pumps: Selection and Application, James P. Poynton10. Hydrocarbons from Methanol, Clarence D. Chang11. Form Flotation: Theory and Applications, Ann N. Clarke
and David J. Wilson12. The Chemistry and Technology of Coal, James G. Speight13. Pneumatic and Hydraulic Conveying of Solids, O. A. Williams14. Catalyst Manufacture: Laboratory and Commercial
Preparations, Alvin B. Stiles
DK9448_half-series-title 3/9/06 9:21 AM Page B
© 2006 by Taylor & Francis Group, LLC
15. Characterization of Heterogeneous Catalysts, edited byFrancis Delannay
16. BASIC Programs for Chemical Engineering Design,James H. Weber
17. Catalyst Poisoning, L. Louis Hegedus and Robert W. McCabe18. Catalysis of Organic Reactions, edited by John R. Kosak19. Adsorption Technology: A Step-by-Step Approach to Process
Evaluation and Application, edited by Frank L. Slejko20. Deactivation and Poisoning of Catalysts, edited by
Jacques Oudar and Henry Wise21. Catalysis and Surface Science: Developments in Chemicals
from Methanol, Hydrotreating of Hydrocarbons, CatalystPreparation, Monomers and Polymers, Photocatalysis and Photovoltaics, edited by Heinz Heinemann and Gabor A. Somorjai
22. Catalysis of Organic Reactions, edited by Robert L. Augustine23. Modern Control Techniques for the Processing Industries,
T. H. Tsai, J. W. Lane, and C. S. Lin24. Temperature-Programmed Reduction for Solid Materials
Characterization, Alan Jones and Brian McNichol25. Catalytic Cracking: Catalysts, Chemistry, and Kinetics,
Bohdan W. Wojciechowski and Avelino Corma26. Chemical Reaction and Reactor Engineering, edited by
J. J. Carberry and A. Varma27. Filtration: Principles and Practices: Second Edition,
edited by Michael J. Matteson and Clyde Orr28. Corrosion Mechanisms, edited by Florian Mansfeld29. Catalysis and Surface Properties of Liquid Metals and Alloys,
Yoshisada Ogino30. Catalyst Deactivation, edited by Eugene E. Petersen
and Alexis T. Bell31. Hydrogen Effects in Catalysis: Fundamentals and Practical
Applications, edited by Zoltán Paál and P. G. Menon32. Flow Management for Engineers and Scientists,
Nicholas P. Cheremisinoff and Paul N. Cheremisinoff33. Catalysis of Organic Reactions, edited by Paul N. Rylander,
Harold Greenfield, and Robert L. Augustine34. Powder and Bulk Solids Handling Processes: Instrumentation
and Control, Koichi Iinoya, Hiroaki Masuda, and Kinnosuke Watanabe
35. Reverse Osmosis Technology: Applications for High-Purity-Water Production, edited by Bipin S. Parekh
36. Shape Selective Catalysis in Industrial Applications,N. Y. Chen, William E. Garwood, and Frank G. Dwyer
37. Alpha Olefins Applications Handbook, edited by George R. Lappin and Joseph L. Sauer
DK9448_half-series-title 3/9/06 9:21 AM Page C
© 2006 by Taylor & Francis Group, LLC
38. Process Modeling and Control in Chemical Industries,edited by Kaddour Najim
39. Clathrate Hydrates of Natural Gases, E. Dendy Sloan, Jr.40. Catalysis of Organic Reactions, edited by Dale W. Blackburn41. Fuel Science and Technology Handbook, edited by
James G. Speight42. Octane-Enhancing Zeolitic FCC Catalysts, Julius Scherzer43. Oxygen in Catalysis, Adam Bielanski and Jerzy Haber44. The Chemistry and Technology of Petroleum: Second Edition,
Revised and Expanded, James G. Speight45. Industrial Drying Equipment: Selection and Application,
C. M. van’t Land46. Novel Production Methods for Ethylene, Light Hydrocarbons,
and Aromatics, edited by Lyle F. Albright, Billy L. Crynes, and Siegfried Nowak
47. Catalysis of Organic Reactions, edited by William E. Pascoe48. Synthetic Lubricants and High-Performance Functional Fluids,
edited by Ronald L. Shubkin49. Acetic Acid and Its Derivatives, edited by Victor H. Agreda
and Joseph R. Zoeller50. Properties and Applications of Perovskite-Type Oxides,
edited by L. G. Tejuca and J. L. G. Fierro51. Computer-Aided Design of Catalysts, edited by
E. Robert Becker and Carmo J. Pereira52. Models for Thermodynamic and Phase Equilibria Calculations,
edited by Stanley I. Sandler53. Catalysis of Organic Reactions, edited by John R. Kosak
and Thomas A. Johnson54. Composition and Analysis of Heavy Petroleum Fractions,
Klaus H. Altgelt and Mieczyslaw M. Boduszynski55. NMR Techniques in Catalysis, edited by Alexis T. Bell
and Alexander Pines56. Upgrading Petroleum Residues and Heavy Oils,
Murray R. Gray57. Methanol Production and Use, edited by Wu-Hsun Cheng
and Harold H. Kung58. Catalytic Hydroprocessing of Petroleum and Distillates,
edited by Michael C. Oballah and Stuart S. Shih59. The Chemistry and Technology of Coal: Second Edition,
Revised and Expanded, James G. Speight60. Lubricant Base Oil and Wax Processing, Avilino Sequeira, Jr.61. Catalytic Naphtha Reforming: Science and Technology,
edited by George J. Antos, Abdullah M. Aitani, and José M. Parera
62. Catalysis of Organic Reactions, edited by Mike G. Scaros and Michael L. Prunier
DK9448_half-series-title 3/9/06 9:21 AM Page D
© 2006 by Taylor & Francis Group, LLC

63. Catalyst Manufacture, Alvin B. Stiles and Theodore A. Koch64. Handbook of Grignard Reagents, edited by Gary S. Silverman
and Philip E. Rakita65. Shape Selective Catalysis in Industrial Applications:
Second Edition, Revised and Expanded, N. Y. Chen, William E. Garwood, and Francis G. Dwyer
66. Hydrocracking Science and Technology, Julius Scherzer and A. J. Gruia
67. Hydrotreating Technology for Pollution Control: Catalysts,Catalysis, and Processes, edited by Mario L. Occelli and Russell Chianelli
68. Catalysis of Organic Reactions, edited by Russell E. Malz, Jr.69. Synthesis of Porous Materials: Zeolites, Clays,
and Nanostructures, edited by Mario L. Occelli and Henri Kessler
70. Methane and Its Derivatives, Sunggyu Lee71. Structured Catalysts and Reactors, edited by Andrzej Cybulski
and Jacob A. Moulijn72. Industrial Gases in Petrochemical Processing,
Harold Gunardson73. Clathrate Hydrates of Natural Gases: Second Edition,
Revised and Expanded, E. Dendy Sloan, Jr.74. Fluid Cracking Catalysts, edited by Mario L. Occelli
and Paul O’Connor75. Catalysis of Organic Reactions, edited by Frank E. Herkes76. The Chemistry and Technology of Petroleum: Third Edition,
Revised and Expanded, James G. Speight77. Synthetic Lubricants and High-Performance Functional Fluids:
Second Edition, Revised and Expanded, Leslie R. Rudnick and Ronald L. Shubkin
78. The Desulfurization of Heavy Oils and Residua,Second Edition, Revised and Expanded, James G. Speight
79. Reaction Kinetics and Reactor Design: Second Edition,Revised and Expanded, John B. Butt
80. Regulatory Chemicals Handbook, Jennifer M. Spero, Bella Devito, and Louis Theodore
81. Applied Parameter Estimation for Chemical Engineers, Peter Englezos and Nicolas Kalogerakis
82. Catalysis of Organic Reactions, edited by Michael E. Ford83. The Chemical Process Industries Infrastructure: Function
and Economics, James R. Couper, O. Thomas Beasley, and W. Roy Penney
84. Transport Phenomena Fundamentals, Joel L. Plawsky85. Petroleum Refining Processes, James G. Speight
and Baki Özüm
DK9448_half-series-title 3/9/06 9:21 AM Page E
© 2006 by Taylor & Francis Group, LLC

86. Health, Safety, and Accident Management in the ChemicalProcess Industries, Ann Marie Flynn and Louis Theodore
87. Plantwide Dynamic Simulators in Chemical Processing and Control, William L. Luyben
88. Chemical Reactor Design, Peter Harriott89. Catalysis of Organic Reactions, edited by Dennis G. Morrell90. Lubricant Additives: Chemistry and Applications, edited by
Leslie R. Rudnick91. Handbook of Fluidization and Fluid-Particle Systems,
edited by Wen-Ching Yang92. Conservation Equations and Modeling of Chemical
and Biochemical Processes, Said S. E. H. Elnashaie and Parag Garhyan
93. Batch Fermentation: Modeling, Monitoring, and Control, Ali Çinar, Gülnur Birol, Satish J. Parulekar, and Cenk Ündey
94. Industrial Solvents Handbook, Second Edition, Nicholas P. Cheremisinoff
95. Petroleum and Gas Field Processing, H. K. Abdel-Aal,Mohamed Aggour, and M. Fahim
96. Chemical Process Engineering: Design and Economics, Harry Silla
97. Process Engineering Economics, James R. Couper98. Re-Engineering the Chemical Processing Plant: Process
Intensification, edited by Andrzej Stankiewicz and Jacob A. Moulijn
99. Thermodynamic Cycles: Computer-Aided Design and Optimization, Chih Wu
100. Catalytic Naphtha Reforming: Second Edition, Revised and Expanded, edited by George T. Antos and Abdullah M. Aitani
101. Handbook of MTBE and Other Gasoline Oxygenates, edited by S. Halim Hamid and Mohammad Ashraf Ali
102. Industrial Chemical Cresols and Downstream Derivatives,Asim Kumar Mukhopadhyay
103. Polymer Processing Instabilities: Control and Understanding,edited by Savvas Hatzikiriakos and Kalman B . Migler
104. Catalysis of Organic Reactions, John Sowa105. Gasification Technologies: A Primer for Engineers
and Scientists, edited by John Rezaiyan and Nicholas P. Cheremisinoff
106. Batch Processes, edited by Ekaterini Korovessi and Andreas A. Linninger
107. Introduction to Process Control, Jose A. Romagnoli and Ahmet Palazoglu
108. Metal Oxides: Chemistry and Applications, edited by J. L. G. Fierro
DK9448_half-series-title 3/9/06 9:21 AM Page F
© 2006 by Taylor & Francis Group, LLC

109. Molecular Modeling in Heavy Hydrocarbon Conversions,Michael T. Klein, Ralph J. Bertolacini, Linda J. Broadbelt,Ankush Kumar and Gang Hou
110. Structured Catalysts and Reactors, Second Edition, edited byAndrzej Cybulski and Jacob A. Moulijn
111. Synthetics, Mineral Oils, and Bio-Based Lubricants: Chemistry and Technology, edited by Leslie R. Rudnick
112. Alcoholic Fuels, edited by Shelley Minteer
DK9448_half-series-title 3/9/06 9:21 AM Page G
© 2006 by Taylor & Francis Group, LLC

Preface
In the 1880s, Henry Ford developed a prototype automobile (the quadracycle)that could be operated with ethanol as fuel. Historians say that Ford alwaysbelieved that the Model T and his future cars would use alcohol as fuel becauseit was a renewable energy source and would boost the agricultural economy.Over a century later, research has finally brought us to the point at which usingalcohol-based fuels for transportation applications is a reality. Over the last twodecades, research on alcoholic fuels as alternative and renewable energy sourceshas exponentially increased. Some of these alcoholic fuels (e.g., methanol andethanol) have been introduced into the market as alcohol-gasoline blends forcombustion engines, but research has also focused on employing these alcoholsas fuels for alternative energy platforms, such as fuel cells. This book will providea comprehensive text to discuss both the production of alcoholic fuels fromvarious sources and the variety of applications of these fuels, from combustionengines to fuel cells to miniature power plants (generators) for farms.
Currently, there is no text on alcoholic fuels. The books on the market thatcome close are
Biomass Renewable Energy, Fuels, and Chemicals
(1998) and
Renewable Energy: Sources for Fuels and Electricity
(1992). Neither of thesetexts focuses on alcoholic fuels. Both books focus on the production of allrenewable energy sources and have sections on the production of alcoholic fuels,but they do not include the necessary information to see the history and futureof alcoholic fuels from both production and application viewpoints. This book iscomprised of edited chapters from experts and innovators in the field of alcoholfuels. The book is broken down into three sections. The first section focuses onthe production of methanol, ethanol, and butanol from various biomasses includ-ing corn, wood, and landfill waste. The second section focuses on blended fuels.These are the fuels that mix alcohols with existing petroleum products, such asgasoline and diesel. The final section focuses on applications of alcoholic fuels.This includes different types of fuel cells, reformers, and generators. The bookconcludes with a chapter on the future of alcohol-based fuels. The book isintended for anyone wanting a comprehensive understanding of alcohol fuels.Each chapter has sufficient detail and provides scientific references sufficient forresearchers to get a detailed perspective on both the production of alcoholic fuelsand the applications of alcoholic fuels, but the chapters themselves are compre-hensive in order to provide the reader with an understanding of the history of thetechnology and how each application plays an important role in removing ourdependency on oil and environmentally toxic power sources, such as batteries.The book is intended to be a supplementary text for graduate courses on alter-native energy, power sources, or fuel cells. There are books on each of these
DK9448_C000.fm Page xi Monday, April 17, 2006 7:47 AM
© 2006 by Taylor & Francis Group, LLC

subjects, but no book that ties them together. To really understand alcohol-basedfuel cells, you need a thorough understanding of how the alcohol is producedand purified. On the other hand, a scientist whose focus is on improving theproduction of ethanol needs to have a thorough understanding of how the alcoholis being used.
DK9448_C000.fm Page xii Monday, April 17, 2006 7:47 AM
© 2006 by Taylor & Francis Group, LLC

Editor
Shelley Minteer
received her Ph.D. in chemistry in 2000 from the University ofIowa. She has been on the faculty of the Department of Chemistry at Saint LouisUniversity since 2000 and was promoted to the rank of associate professor in2005. She also holds a second appointment in the Department of BiomedicalEngineering. Since arriving at Saint Louis University, Dr. Minteer’s research hasfocused on the development of efficient alternative energy sources, specificallyalcohol/oxygen biofuel cells.
DK9448_C000.fm Page xiii Monday, April 17, 2006 7:47 AM
© 2006 by Taylor & Francis Group, LLC

Contributors
Nick L. Akers
Akermin, IncorporatedSt. Louis, Missouri
Hans P. Blaschek
Biotechnology & Bioengineering Group
Department of Food Science & Human Nutrition
University of IllinoisUrbana, Illinois
Rodney J. Bothast
National Corn-to-Ethanol Research Center
Southern Illinois University-Edwardsville
Edwardsville, Illinois
Hachull Chung
Department of ChemistryUniversity of IowaIowa City, Iowa
Michael A. Cotta
Fermentation Biotechnology Research Unit
National Center for Agricultural Utilization Research,Agricultural Research Service
U.S. Department of AgriculturePeoria, Illinois
Gregory W. Davis, Ph.D. P.E.
Advanced Engine Research Laboratory and Department of Mechanical Engineering
Kettering UniversityFlint, Michigan
Pilar Ramírez de la Piscina
Inorganic Chemistry DepartmentUniversitat de BarcelonaBarcelona, Spain
Bruce S. Dien
Fermentation Biotechnology Research Unit
National Center for Agricultural Utilization Research, Agricultural Research Service
U.S. Department of AgriculturePeoria, Illinois
Fatih Dogan
Department of Materials Science and Engineering
University of Missouri-RollaRolla, Missouri
Drew C. Dunwoody
Department of ChemistryUniversity of IowaIowa City, Iowa
DK9448_C000.fm Page xv Monday, April 17, 2006 7:47 AM
© 2006 by Taylor & Francis Group, LLC
Thaddeus C. Ezeji
Biotechnology & Bioengineering Group
Department of Food Science & Human Nutrition
University of IllinoisUrbana, Illinois
André P.C. Faaij
Utrecht University/Copernicus Institute of Sustainable Development and Innovation
Utrecht, The Netherlands
Robert Haber
One Accord Food Pantry, Inc.Troy, New York
Dr. Carlo N. Hamelinck
EcofysUtrecht, The Netherlands
Luke Haverhals
Department of ChemistryUniversity of IowaIowa City, Iowa
Narcís Homs
Inorganic Chemistry DepartmentUniversitat de BarcelonaBarcelona, Spain
Hans-Joachim G. Jung, Ph.D.
U.S. Department of AgricultureAgricultural Research Service-
Plant Science ResearchDepartment of Agronomy/Plant
GeneticsUniversity of MinnesotaSt. Paul, Minnesota
Patrick Karcher
Biotechnology & Bioengineering Group
Department of Food Science & Human Nutrition
University of IllinoisUrbana, Illinois
JoAnn F. S. Lamb
U.S. Department of AgricultureAgricultural Research Service-
Plant Science ResearchDepartment of Agronomy/Plant
GeneticsUniversity of MinnesotaSt. Paul, Minnesota
Johna Leddy
Department of ChemistryUniversity of IowaIowa City, Iowa
Nancy N. Nichols
Fermentation Biotechnology Research Unit
National Center for Agricultural Utilization Research, Agricultural Research Service
U.S. Department of AgriculturePeoria, Illinois
Nasib Qureshi
U.S. Department of AgricultureNational Center for Agricultural
Utilization Research,Fermentation/Biotechnology
Peoria, Illinois
Deborah A. Samac
U.S. Department of AgricultureAgricultural Research Service-
Plant Science ResearchDepartment of Plant PathologyUniversity of MinnesotaSt. Paul, Minnesota
DK9448_C000.fm Page xvi Monday, April 17, 2006 7:47 AM
© 2006 by Taylor & Francis Group, LLC

Sabina Topcagic
Department of ChemistrySaint Louis UniversitySt. Louis, Missouri
Becky L. Treu
Department of ChemistrySaint Louis UniversitySt. Louis, Missouri
William H. Wisbrock, President
Biofuels of Missouri, Inc.St. Louis, Missouri
DK9448_C000.fm Page xvii Monday, April 17, 2006 7:47 AM
© 2006 by Taylor & Francis Group, LLC
Table of Contents
Chapter 1
Alcoholic Fuels: An Overview .............................................................................1
Shelley D. Minteer
SECTION I
Production of Alcohol Fuels
Chapter 2
Production of Methanol from Biomass ................................................................7
Carlo N. Hamelinck and André P.C. Faaij
Chapter 3
Landfill Gas to Methanol....................................................................................51
William H. Wisbrock
Chapter 4
The Corn Ethanol Industry .................................................................................59
Nancy N. Nichols, Bruce S. Dien, Rodney J. Bothast, and Michael A. Cotta
Chapter 5
Development of Alfalfa (
Medicago sativa
L.) as a Feedstock for Production of Ethanol and Other Bioproducts ...................................................79
Deborah A. Samac, Hans-Joachim G. Jung, and JoAnn F.S. Lamb
Chapter 6
Production of Butanol from Corn.......................................................................99
Thaddeus C. Ezeji, Nasib Qureshi, Patrick Karcher, and Hans P. Blaschek
DK9448_C000.fm Page xix Monday, April 17, 2006 7:47 AM
© 2006 by Taylor & Francis Group, LLC
SECTION II
Blended Fuels
Chapter 7
Ethanol Blends: E10 and E-Diesel ...................................................................125
Shelley D. Minteer
Chapter 8
Using E85 in Vehicles.......................................................................................137
Gregory W. Davis, Ph.D., P.E.
SECTION III
Applications of Alcoholic Fuels
Chapter 9
Current Status of Direct Methanol Fuel-Cell Technology...............................155
Drew C. Dunwoody, Hachull Chung, Luke Haverhals, and Johna Leddy
Chapter 10
Direct Ethanol Fuel Cells .................................................................................191
Shelley D. Minteer
Chapter 11
Solid-Oxide Fuel Cells Operating with Direct-Alcohol and Hydrocarbon Fuels ............................................................................................203
Fatih Dogan
Chapter 12
Alcohol-Based Biofuel Cells ............................................................................215
Sabina Topcagic, Becky L. Treu, and Shelley D. Minteer
Chapter 13
Ethanol Reformation to Hydrogen ...................................................................233
Pilar Ramírez de la Piscina and Narcís Homs
Chapter 14
Ethanol from Bakery Waste: The Great Provider for Aquaponics? ................249
Robert Haber
DK9448_C000.fm Page xx Monday, April 17, 2006 7:47 AM
© 2006 by Taylor & Francis Group, LLC

Chapter 15
Conclusion.........................................................................................................265
Nick L. Akers
DK9448_C000.fm Page xxi Monday, April 17, 2006 7:47 AM
© 2006 by Taylor & Francis Group, LLC

1
1
Alcoholic Fuels: An Overview
Shelley D. Minteer
Saint Louis University, Missouri
CONTENTS
Introduction ...........................................................................................................1Methanol................................................................................................................2Ethanol ..................................................................................................................3Butanol ..................................................................................................................3Propanol ................................................................................................................4Conclusions ...........................................................................................................4References .............................................................................................................4
Abstract
Alcohol-based fuels have been used as replacements for gasoline incombustion engines and for fuel cells. The four alcohols that are typically usedas fuels are methanol, ethanol, propanol, and butanol. Ethanol is the most widelyused fuel due to its lower toxicity properties and wide abundance, but this chapterintroduces the reader to all four types of fuels and compares them.
INTRODUCTION
Alcohol-based fuels have been important energy sources since the 1800s. As earlyas 1894, France and Germany were using ethanol in internal combustion engines.Henry Ford was quoted in 1925 as saying that ethanol was the fuel of the future[1]. He was not the only supporter of ethanol in the early 20th century. AlexanderGraham Bell was a promoter of ethanol, because the decreased emission toburning ethanol [2]. Thomas Edison also backed the idea of industrial uses forfarm products and supported Henry Ford’s campaign for ethanol [3]. Over theyears and across the world, alcohol-based fuels have seen short-term increasesin use depending on the current strategic or economic situation at that time inthe country of interest. For instance, the United States saw a resurgence in ethanolfuel during the oil crisis of the 1970s [4]. Alcohols have been used as fuels inthree main ways: as a fuel for a combustion engine (replacing gasoline), as afuel additive to achieve octane boosting (or antiknock) effects similar to the
DK9448_C001.fm Page 1 Friday, March 3, 2006 10:43 AM
© 2006 by Taylor & Francis Group, LLC

2
Alcoholic Fuels
petroleum-based additives and metallic additives like tetraethyllead, and as a fuelfor direct conversion of chemical energy into electrical energy in a fuel cell.
Alcohols are of the oxygenate family. They are hydrocarbons with hydroxylfunctional groups. The oxygen of the hydroxyl group contributes to combustion.The four most simplistic alcoholic fuels are methanol, ethanol, propanol, andbutanol. More complex alcohols can be used as fuels; however, they have notshown to be commercially viable. Alcohol fuels are currently used both in com-bustion engines and fuel cells, but the chemistry occurring in both systems is thesame. In theory, alcohol fuels in engines and fuel cells are oxidized to form carbondioxide and water. In reality, incomplete oxidation is an issue and causes manytoxic by-products including carbon monoxide, aldehydes, carboxylates, and evenketones. The generic reaction for complete alcohol oxidation in either a combus-tion engines or a fuel cell is
It is important to note this reaction occurs in a single chamber in a combustionengine to convert chemical energy to mechanical energy and heat, while in a fuelcell, this reaction occurs in two separate chambers (an anode chamber where thealcohol is oxidized to carbon dioxide and a cathode chamber where oxygen isreduced to water.)
METHANOL
Methanol (also called methyl alcohol) is the simplest of alcohols. Its chemicalstructure is CH
3
OH. It is produced most frequently from wood and wood by-products, which is why it is frequently called wood alcohol. It is a colorless liquidthat is quite toxic. The LD
50
for oral consumption by a rate is 5628 mg/kg. TheLD
50
for absorption by the skin of a rabbit is 20 g/kg. The Occupational Safetyand Health Administration (OSHA) approved exposure limit is 200 ppm for 10hours. Methanol has a melting point of –98°C and a boiling point of 65°C. It hasa density of 0.791 g/ml and is completely soluble in water, which is one of thehazards of methanol. It easily combines with water to form a solution withminimal smell that still has all of the toxicity issues of methanol. Acute methanolintoxication in humans leads to severe muscle pain and visual degeneration thatcan lead to blindness. This has been a major issue when considering methanolas a fuel. Dry methanol is also very corrosive to some metal alloys, so care isrequired to ensure that engines and fuel cells have components that are notcorroded by methanol. Today, most research on methanol as a fuel is centeredon direct methanol fuel cells (DMFCs) for portable power applications (replace-ments for rechargeable batteries), but extensive early research has been done onmethanol–gasoline blends for combustion engines.
C H Ox
O xCO x H Ox x2 2 2 2 2
32
1+ + → + +( ) ( )
DK9448_C001.fm Page 2 Friday, March 3, 2006 10:43 AM
© 2006 by Taylor & Francis Group, LLC

Alcoholic Fuels: An Overview
3
ETHANOL
Ethanol (also known as ethyl alcohol) is the most common of alcohols. It is theform of alcohol that is in alcoholic beverages and is easily produced from corn,sugar, or fruits through fermentation of carbohydrates. Its chemical structure isCH
3
CH
2
OH. It is less toxic than methanol. The LD
50
for oral consumption by arat is 7060 mg/kg [5]. The LD
50
for inhalation by a rat is 20,000 ppm for 10hours [6]. The NIOSH recommended exposure limit is 1000 ppm for 10 hours[7]. Ethanol is available in a pure form and a denatured form. Denatured ethanolcontains a small concentration of poisonous substance (frequently methanol) toprevent people from drinking it. Ethanol is a colorless liquid with a melting pointof –144°C and a boiling point of 78°C. It is less dense than water with a densityof 0.789 g/ml and soluble at all concentrations in water. Ethanol is frequentlyused to form blended gasoline fuels in concentrations between 10–85%. Morerecently, it has been investigated as a fuel for direct ethanol fuel cells (DEFC)and biofuel cells. Ethanol was deemed the “fuel of the future” by Henry Fordand has continued to be the most popular alcoholic fuel for several reasons: (1)it is produced from renewable agricultural products (corn, sugar, molasses, etc.)rather than nonrenewable petroleum products, (2) it is less toxic than the otheralcohol fuels, and (3) the incomplete oxidation by-products of ethanol oxidation(acetic acid (vinegar) and acetaldehyde) are less toxic than the incomplete oxi-dation by-products of other alcohol oxidation.
BUTANOL
Butanol is the most complex of the alcohol-based fuels. It is a four-carbon alcoholwith a structure of CH
3
CH
2
CH
2
CH
2
OH. Butanol is more toxic than either meth-anol or ethanol. The LD
50
for oral consumption of butanol by a rat is 790 mg/kg.The LD
50
for skin adsorption of butanol by a rabbit is 3400 mg/kg. The boilingpoint of butanol is 118°C and the melting point is –89°C. The density of butanolis 0.81 g/mL, so it is more dense than the other two alcohols, but less dense thanwater. Butanol is commonly used as a solvent, but is also a candidate for use asa fuel. Butanol can be made from either petroleum or fermentation of agriculturalproducts. Originally, butanol was manufactured from agricultural products in afermentation process referred to as ABE, because it produced Acetone-Butanoland Ethanol. Currently, most butanol is produced from petroleum, which causesbutanol to cost more than ethanol, even though it has some favorable physicalproperties compared to ethanol. It has a higher energy content than ethanol. Thevapor pressure of butanol is 0.33 psi, which is almost an order of magnitude lessthan ethanol (2.0 psi) and less than both methanol (4.6 psi) and gasoline (4.5psi). This decrease in vapor pressure means that there are less problems withevaporation of butanol than the other fuels, which makes it safer and moreenvironmentally friendly than the other fuels. Butanol has been proposed as areplacement for ethanol in blended fuels, but it is currently more costly thanethanol. Butanol has also been proposed for use in a direct butanol fuel cell, but
DK9448_C001.fm Page 3 Friday, March 3, 2006 10:43 AM
© 2006 by Taylor & Francis Group, LLC

4
Alcoholic Fuels
the efficiency of the fuel cell is poor because incomplete oxidation products easilypassivate the platinum catalyst in a traditional fuel cell.
PROPANOL
Although propanols are three carbon alcohols with the general formula C
3
H
8
O,they are rarely used as fuels. Isopropanol (also called rubbing alcohol) is fre-quently used as a disinfectant and considered to be a better disinfectant thanethanol, but it is rarely used as a fuel. It is a colorless liquid like the other alcoholsand is flammable. It has a pungent odor that is noticeable at concentrations aslow as 3 ppm. Isopropanol is also used as an industrial solvent and as a gasolineadditive for dealing with problems of water or ice in fuel lines. It has a freezingpoint of –89°C and a boiling point of 83°C. Isopropanol is typically producedfrom propene from decomposed petroleum, but can also be produced from fer-mentation of sugars. Isopropanol is commonly used for chemical synthesis or asa solvent, so almost 2M tons are produced worldwide.
CONCLUSIONS
In today’s fuel market, methanol and ethanol are the only commercially viablefuels. Both methanol and ethanol have been blended with gasoline, but ethanolis the current choice for gasoline blends. Methanol has found its place in themarket as an additive for biodiesel and as a fuel for direct methanol fuel cells,which are being studied as an alternative for rechargeable batteries in smallelectronic devices. Currently, butanol is too expensive to compete with ethanolin the blended fuel market, but researchers are working on methods to decreasecost and efficiency of production to allow for butanol blends, because the vaporpressure difference has environmental advantages. Governmental initiativesshould ensure an increased use of alcohol-based fuels in automobiles and otherenergy conversion devices.
REFERENCES
1. Ford Predicts Fuel From Vegetation,
The New York Times
, Sept. 20, 1925, p. 24.2.
National Geographic
, 31, 131, 1917.3. Borth, C.,
Chemists and Their Work
, Bobbs-Merrill, New York, 1928.4. Kovarik, B., Henry Ford, Charles F. Kettering and the Fuel of the Future,
Automot.Hist. Rev.
, 32, 7–27, 1998.5.
Toxicology and Applied Pharmacology
, Academic Press, Inc., 16, 718, 1970.6.
Raw Material Data Handbook, Vol. 1: Organic Solvents
, Nat. Assoc. Print. InkRes. Inst., 1, 44, 1974.
7.
National Institute for Occupational Safety and Health, U.S. Dept. of Health,Education, and Welfare, Reports and Memoranda
, DHHS, 92–100, 1992.
DK9448_C001.fm Page 4 Friday, March 3, 2006 10:43 AM
© 2006 by Taylor & Francis Group, LLC
Section I
Production of Alcohol Fuels
DK9448_S001.fm Page 5 Friday, January 27, 2006 11:49 AM
© 2006 by Taylor & Francis Group, LLC

7
2
Production of Methanol from Biomass*
Carlo N. Hamelinck
(currently working with Ecofys b.v. Utrecht,The Netherlands)
André P.C. Faaij
(Utrecht University, Copernicus Institute of Sustainable Development and Innovation, Utrecht, The Netherlands)
CONTENTS
Introduction ...........................................................................................................8Technology ............................................................................................................9
Overview ...................................................................................................9Pretreatment ..............................................................................................9Gasification..............................................................................................10
IGT Gasifier...................................................................................10BCL Gasifier..................................................................................12Oxygen Supply ..............................................................................13
Gas Cleaning and Contaminant Limits ..................................................13Raw Gas versus System Requirements.........................................13Tar Removal...................................................................................15Wet Gas Cleaning..........................................................................17Dry/Hot Gas Cleaning...................................................................19
Gas Conditioning ....................................................................................20Reforming ......................................................................................20Water Gas Shift .............................................................................22CO
2
Removal .................................................................................23Methanol Synthesis .................................................................................25
Fixed-Bed Technology ..................................................................26Liquid-Phase Methanol Production...............................................27
Options for Synergy............................................................................................28Electricity Cogeneration by Combined Cycle........................................28
* This chapter is broadly based on Hamelinck, C.N. and Faaij, A.P.C., Future prospects for productionof methanol and hydrogen from biomass,
Journal of Power Sources
, 111, 1, 1–22, 2002.
DK9448_C002.fm Page 7 Monday, April 17, 2006 8:00 AM
© 2006 by Taylor & Francis Group, LLC

8
Alcoholic Fuels
Natural Gas Cofiring/Cofeeding .............................................................29Black Liquor Gasification.......................................................................29Other Biofuels via Gasification ..............................................................30
Hydrogen .......................................................................................30Fischer-Tropsch (FT) Diesel .........................................................30Methanol to Diesel ........................................................................31Methanol to Gasoline ....................................................................31Dimethyl Ether (DME)..................................................................31
Techno-Economic Performance ..........................................................................32Selection of Concepts .............................................................................32Modeling Mass and Energy Balances ....................................................33Costing Method.......................................................................................36Results .....................................................................................................37
Conclusions .........................................................................................................44References ...........................................................................................................45
INTRODUCTION
Methanol (CH
3
OH), also known as methyl alcohol or wood alcohol, is the sim-plest alcohol. It can be used as a fuel, either as a blend with gasoline in internalcombustion engines* or in fuel cell vehicles.** Also, methanol has a versatilefunction in the chemical industry as the starting material for many chemicals.
Methanol is produced naturally in the anaerobic metabolism of many varietiesof bacteria and in some vegetation. Pure methanol was first isolated in 1661 byRobert Boyle by distillation of boxwood. In 1834, the French chemists Dumasand Peligot determined its elemental composition. In 1922, BASF developed aprocess to convert synthesis gas (a mixture of carbon monoxide and hydrogen)into methanol. This process used a zinc oxide/chromium oxide catalyst andrequired extremely vigorous conditions: pressures ranging from 300–1000 bar,and temperatures of about 400°C. Modern methanol production has been mademore efficient through the use of catalysts capable of operating at lower pressures.Also the synthesis gas is at present mostly produced from natural gas rather thanfrom coal.
In 2005, the global methanol production capacity was about 40 Mtonne/year,the actual production or demand was about 32 Mtonne (Methanol Institute 2005).Since the early 1980s, larger plants using new efficient low-pressure technologiesare replacing less efficient small facilities. In 1984, more than three quarters of
* In Europe methanol may be blended in regular gasoline up to 5% by volume without notice to theconsumer. Higher blends are possible like M85 (85% methanol with 15% gasoline) but would requireadaptations in cars or specially developed cars. Moreover, blends higher than 5% require adaptationsin the distribution of fuels to gas stations and at the gas stations themselves. Pure methanol issometimes used as racing fuel, such as in the Indianapolis 500.** Methanol can be the source for hydrogen via on board reforming. Direct methanol fuel cells areunder development that can directly process methanol (van den Hoed 2004).
DK9448_C002.fm Page 8 Monday, April 17, 2006 8:00 AM
© 2006 by Taylor & Francis Group, LLC

Production of Methanol from Biomass
9
world methanol capacity was located in the traditional markets of North America,Europe, and Japan, with less than 10 percent located in “distant-from–market”developing regions such as Saudi Arabia. But from that time most new methanolplants have been erected in developing regions while higher cost facilities in moredeveloped regions were being shut down. The current standard capacities ofconventional plants range between 2000 and 3000 tonnes of methanol per day.However, the newest plants tend to be much larger, with single trains of 5000tonnes/day in Point Lisas, Trinidad (start-up in 2004), 5000 tonnes/day in Dayyer,Iran (start-up in 2006), and 5000 tonnes/day in Labuan, Malaysia (start construc-tion in 2006).
Methanol produced from biomass and employed in the automotive sector canaddress several of the problems associated with the current use of mineral oilderived fuels, such as energy security and greenhouse gas emissions.
This chapter discusses the technology for the production of methanol frombiomass. For a selection of concepts, efficiencies and production costs have beencalculated.
TECHNOLOGY
O
VERVIEW
Methanol is produced by a catalytic reaction of carbon monoxide (CO), carbondioxide (CO
2
), and hydrogen (H
2
). These gases, together called
synthesis gas
,are generally produced from natural gas. One can also produce synthesis gasfrom other organic substances, such as biomass. A train of processes to convertbiomass to required gas specifications precedes the methanol reactor. Theseprocesses include pretreatment, gasification, gas cleaning, gas conditioning, andmethanol synthesis, as are depicted in Figure 2.1 and discussed in Sections2.2–2.6.
P
RETREATMENT
Chipping or comminution is generally the first step in biomass preparation. Thefuel size necessary for fluidized bed gasification is between 0 and 50 mm (Pieriket al. 1995). Total energy requirements for chipping woody biomass are approx-imately 100 kJ
e
/kg of wet biomass (Katofsky 1993) down to 240 kW
e
for 25–50tonne/h to 3
×
3 cm in a hammermill, which gives 17–35 kJ
e
/kg wet biomass(Pierik et al. 1995).
The fuel should be dried to 10–15% depending on the type of gasifier. Thisconsumes roughly 10% of the energy content of the feedstock. Drying can be
FIGURE 2.1
Key components in the conversion of biomass to methanol.
Biomass MethanolShuttlereactor
Gas cleaningsection
Pretreatmentsection ReformerGas lifter Methanol
reactor
DK9448_C002.fm Page 9 Monday, April 17, 2006 8:00 AM
© 2006 by Taylor & Francis Group, LLC
10
Alcoholic Fuels
done by means of hot flue gas (in a rotary drum dryer) or steam (direct/indirect),a choice that among others depends on other steam demands within the processand the extent of electricity coproduction. Flue gas drying gives a higher flexibilitytoward gasification of a large variety of fuels. In the case of electricity generationfrom biomass, the integration in the total system is simpler than that of steamdrying, resulting in lower total investment costs. The net electrical system effi-ciency can be somewhat higher (van Ree et al. 1995). On the other hand, fluegas drying holds the risk of spontaneous combustion and corrosion (Consonni etal. 1994). For methanol production, steam is required throughout the entireprocess, thus requiring an elaborate steam cycle anyway. It is not
a priori
clearwhether flue gas or steam drying is a better option in methanol production. Aflue gas dryer for drying from 50% moisture content to 15% or 10% would havea specific energy use of 2.4–3.0 MJ/ton water evaporated (twe) and a specificelectricity consumption of 40–100 kWh
e
/twe (Pierik et al. 1995). A steam dryerconsumes 12 bar, 200°C (process) steam; the specific heat consumption is 2.8MJ/twe. Electricity use is 40 kWh
e
/twe (Pierik et al. 1995).
G
ASIFICATION
Through gasification solid biomass is converted into synthesis gas. The funda-mentals have extensively been described by, among others, Katofsky (1993).Basically, biomass is converted to a mixture of CO, CO
2
, H
2
O, H
2
, and lighthydrocarbons, the mutual ratios depending on the type of biomass, the gasifiertype, temperature and pressure, and the use of air, oxygen, and steam.
Many gasification methods are available for synthesis gas production. Basedon throughput, cost, complexity, and efficiency issues, only circulated fluidizedbed gasifiers are suitable for large-scale synthesis gas production. Direct gasifi-cation with air results in nitrogen dilution, which in turn strongly increasesdownstream equipment size. This eliminates the TPS (Termiska Processer AB)and Enviropower gasifiers, which are both direct air blown. The MTCI (Manu-facturing and Technology Conversion International, affiliate of Thermochem,Inc.) gasifier is indirectly fired, but produces a very wet gas and the net carbonconversion is low. Two gasifiers are selected for the present analysis: the IGT(Institute of Gas Technology) pressurized direct oxygen fired gasifier and theBCL (Battelle Columbus) atmospheric indirectly fired gasifier. The IGT gasifiercan also be operated in a
maximum hydrogen
mode by increasing the steam input.Both gasifiers produce medium calorific gas, undiluted by atmospheric nitrogen,and represent a very broad range for the H
2
:CO ratio of the raw synthesis gas.
IGT Gasifier
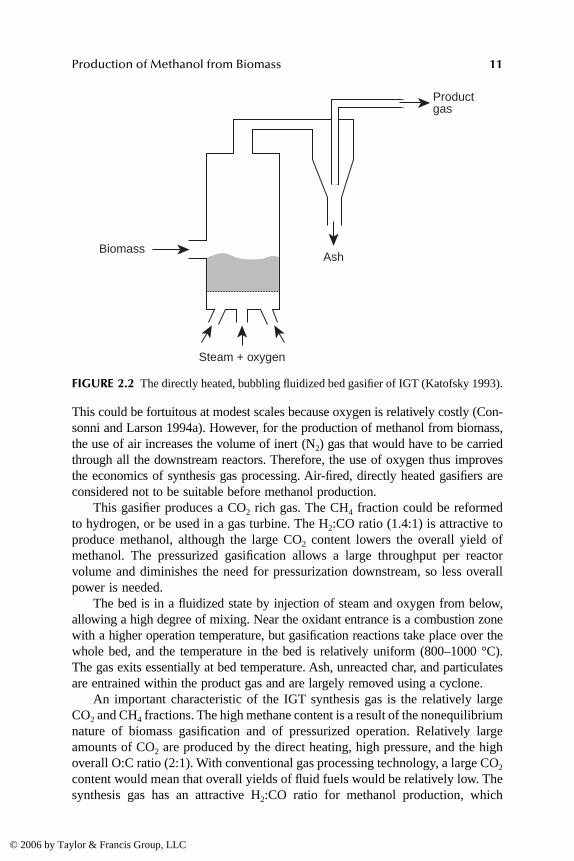
The IGT gasifier (Figure 2.2) is directly heated, which implies that some char and/orbiomass are burned to provide the necessary heat for gasification. Direct heating isalso the basic principle applied in pressurised reactors for gasifying coal. The higherreactivity of biomass compared to coal permits the use of air instead of pure oxygen.
DK9448_C002.fm Page 10 Monday, April 17, 2006 8:00 AM
© 2006 by Taylor & Francis Group, LLC
Production of Methanol from Biomass
11
This could be fortuitous at modest scales because oxygen is relatively costly (Con-sonni and Larson 1994a). However, for the production of methanol from biomass,the use of air increases the volume of inert (N
2
) gas that would have to be carriedthrough all the downstream reactors. Therefore, the use of oxygen thus improvesthe economics of synthesis gas processing. Air-fired, directly heated gasifiers areconsidered not to be suitable before methanol production.
This gasifier produces a CO
2
rich gas. The CH
4
fraction could be reformedto hydrogen, or be used in a gas turbine. The H
2
:CO ratio (1.4:1) is attractive toproduce methanol, although the large CO
2
content lowers the overall yield ofmethanol. The pressurized gasification allows a large throughput per reactorvolume and diminishes the need for pressurization downstream, so less overallpower is needed.
The bed is in a fluidized state by injection of steam and oxygen from below,allowing a high degree of mixing. Near the oxidant entrance is a combustion zonewith a higher operation temperature, but gasification reactions take place over thewhole bed, and the temperature in the bed is relatively uniform (800–1000 °C).The gas exits essentially at bed temperature. Ash, unreacted char, and particulatesare entrained within the product gas and are largely removed using a cyclone.
An important characteristic of the IGT synthesis gas is the relatively largeCO
2
and CH
4
fractions. The high methane content is a result of the nonequilibriumnature of biomass gasification and of pressurized operation. Relatively largeamounts of CO
2
are produced by the direct heating, high pressure, and the highoverall O:C ratio (2:1). With conventional gas processing technology, a large CO
2
content would mean that overall yields of fluid fuels would be relatively low. Thesynthesis gas has an attractive H
2
:CO ratio for methanol production, which
FIGURE 2.2
The directly heated, bubbling fluidized bed gasifier of IGT (Katofsky 1993).
BiomassAsh
Steam + oxygen
Productgas
DK9448_C002.fm Page 11 Monday, April 17, 2006 8:00 AM
© 2006 by Taylor & Francis Group, LLC
12
Alcoholic Fuels
reduces the need for a shift reactor. Since gasification takes place under pressure,less downstream compression is needed.
When operated with higher steam input the IGT gasifier produces a productgas with a higher hydrogen content. This
maximum hydrogen
mode is especiallyuseful if hydrogen would be the desired product, but the H
2
:CO ratio is also betterfor methanol production. However, the gasifier efficiency is lower and much moresteam is needed.
BCL Gasifier
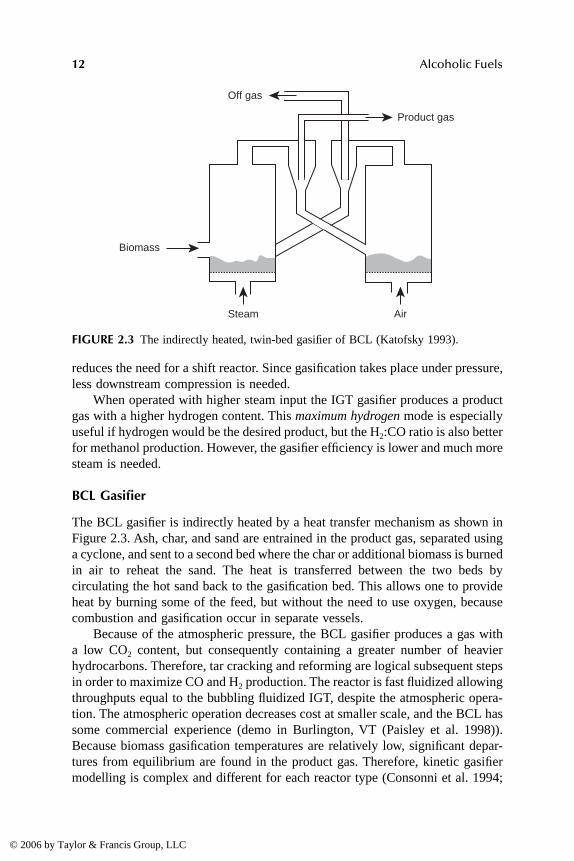
The BCL gasifier is indirectly heated by a heat transfer mechanism as shown inFigure 2.3. Ash, char, and sand are entrained in the product gas, separated usinga cyclone, and sent to a second bed where the char or additional biomass is burnedin air to reheat the sand. The heat is transferred between the two beds bycirculating the hot sand back to the gasification bed. This allows one to provideheat by burning some of the feed, but without the need to use oxygen, becausecombustion and gasification occur in separate vessels.
Because of the atmospheric pressure, the BCL gasifier produces a gas witha low CO
2
content, but consequently containing a greater number of heavierhydrocarbons. Therefore, tar cracking and reforming are logical subsequent stepsin order to maximize CO and H
2
production. The reactor is fast fluidized allowingthroughputs equal to the bubbling fluidized IGT, despite the atmospheric opera-tion. The atmospheric operation decreases cost at smaller scale, and the BCL hassome commercial experience (demo in Burlington, VT (Paisley et al. 1998)).Because biomass gasification temperatures are relatively low, significant depar-tures from equilibrium are found in the product gas. Therefore, kinetic gasifiermodelling is complex and different for each reactor type (Consonni et al. 1994;
FIGURE 2.3
The indirectly heated, twin-bed gasifier of BCL (Katofsky 1993).
Biomass
Steam Air
Product gas
Off gas
DK9448_C002.fm Page 12 Monday, April 17, 2006 8:00 AM
© 2006 by Taylor & Francis Group, LLC

Production of Methanol from Biomass
13
Li et al. 2001). The main performance characteristics of both gasifiers are givenin Table 2.1.
Oxygen Supply
Gasifiers demand oxygen, provided as air, pure oxygen, or combination of thetwo. The use of pure oxygen reduces the volume flows through the IGT gasifierand through downstream equipment, which reduces investment costs. Also theAutothermal Reformer (see below) is, for the same reason, preferably fired byoxygen. As the production of oxygen is expensive, there will likely be an eco-nomical optimum in oxygen purity. Oxygen-enriched air could be a compromisebetween a cheaper oxygen supply and a reduced downstream equipment size.
Cryogenic air separation is commonly applied when large amounts of O
2
(over 1000 Nm
3
/h) are required. Since air is freely available, the costs for oxygenproduction are directly related to the costs for air compression and refrigeration,the main unit operations in an air separation plant. As a consequence, the oxygenprice is mainly determined by the energy costs and plant investment costs (vanDijk et al. 1995; van Ree 1992).
The conventional air separation unit is both capital and energy intensive. Apotential for cost reduction is the development of air separation units based onconductive ionic transfer membranes (ITM) that operate on the partial pressuredifferential of oxygen to passively produce pure oxygen. Research and develop-ment of the ITM are in the demonstration phase (DeLallo et al. 2000). Alternativeoptions are membrane air separation, sorption technologies, and water decompo-sition, but these are less suitable for large-scale application (van Ree 1992).
G
AS
C
LEANING
AND
C
ONTAMINANT
L
IMITS
Raw Gas versus System Requirements
The raw synthesis gas produced by gasification contains impurities. The mosttypical impurities are organic impurities like condensable tars, BTX (benzene,toluene, and xylenes), inorganic impurities (NH
3
, HCN, H
2
S, COS, and HCl),volatile metals, dust, and soot (Tijmensen 2000; van Ree et al. 1995). Thesecontaminants can lower catalyst activity in reformer, shift, and methanol reactor,and cause corrosion in compressors, heat exchangers and the (optional) gasturbine.
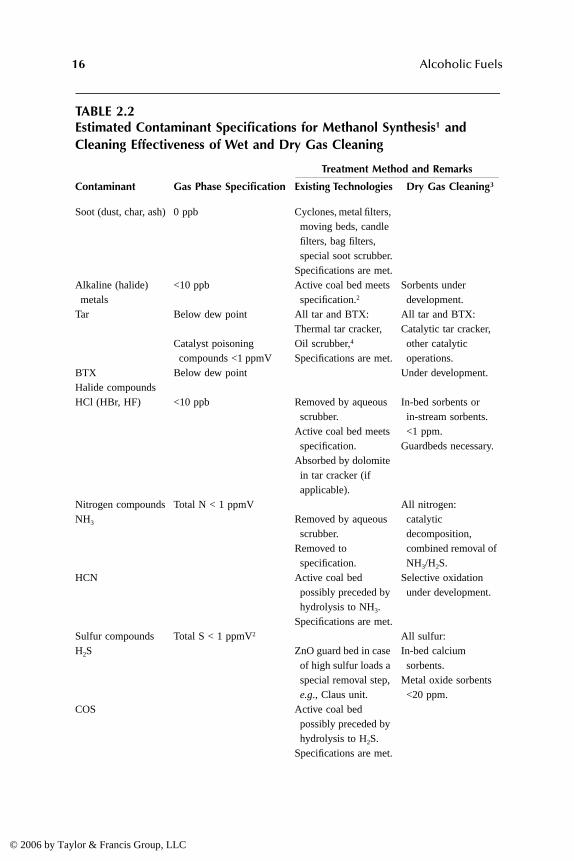
The estimated maximal acceptable contaminant concentrations are summa-rized in Table 2.2
together with the effectiveness of wet and dry gas cleaning, asdescribed below.
The gas can be cleaned using available conventional technology, by applyinggas cooling, low-temperature filtration, and water scrubbing at 100–250°C. Alter-natively, hot gas cleaning can be considered, using ceramic filters and reagentsat 350–800°C. These technologies have been described thoroughly by severalauthors (Consonni et al. 1994; Kurkela 1996; Tijmensen 2000; van Dijk et al.1995; van Ree et al. 1995). The considered pressure range is no problem for
DK9448_C002.fm Page 13 Monday, April 17, 2006 8:00 AM
© 2006 by Taylor & Francis Group, LLC

14
Alcoholic Fuels
TABLE 2.1Characteristics of Gasifiers
IGT
6
Bubbling FluidizedBed
IGT max H
27
Bubbling FluidizedBed
BCL
8
Indirectly HeatedFast Fluidized Bed
Biomass input dry basis
1
(tonne/hr)
80 80 80
Initial moisture content (%) 30 30 30Dry moisture content (%) 15 15 10HHV
dry
biomass (GJ/tonne) 19.28 19.28 19.46LHV
wet
biomass
2)
(GJ/tonne) 11.94 11.94 12.07
Steam demand drier
3
(tonne/hr)
26.2 26.2 tonne/hr 33.0 tonne/hr
Thermal biomass input (MW)
HHV 428.4 / LHV 379.0
HHV 428.4 / LHV 379.0
HHV 432.4 / LHV 383.2
Steam (kg/kg dry feed) 0.3 0.8 0.019Steam
4
(tonne/hr) 24 64 1.52Oxygen (kg/kg dry feed) 0.3 0.38 0Air (kg/kg dry feed) 0 0 2.06
Product temperature (°C) 982 920 863Exit pressure (bar) 34.5 25 1.2Gas yield (kmol/dry tonne) 82.0 121
5
45.8Wet gas output kmol/hour 6560 9680 3664Composition: mole fraction on wet basis (on dry basis)
H
2
O 0.318 (–) 0.48 (–) 0.199 (–)H
2
0.208 (0.305) 0.24 (0.462) 0.167 (0.208)CO 0.15 (0.22) 0.115 (0.221) 0.371 (0.463)CO
2
0.239 (0.35) 0.16 (0.308) 0.089 (0.111)CH
4
0.0819 (0.12) 0.005 (0.009) 0.126 (0.157)C
2
H
4
0.0031 (0.005) 0 0.042 (0.052)C
2
H
6
0 0 0.006 (0.0074)O
2
0 0 0N
2
0 0 01 (1) 1 (1) 1 (1)
LHV
wet
synthesis gas (MJ/Nm
3
)6.70 3.90 12.7
Thermal flow (MW) HHV 352 /LHV 296
HHV 309 / LHV 231
HHV 348 / LHV 316
DK9448_C002.fm Page 14 Monday, April 17, 2006 8:00 AM
© 2006 by Taylor & Francis Group, LLC
Production of Methanol from Biomass
15
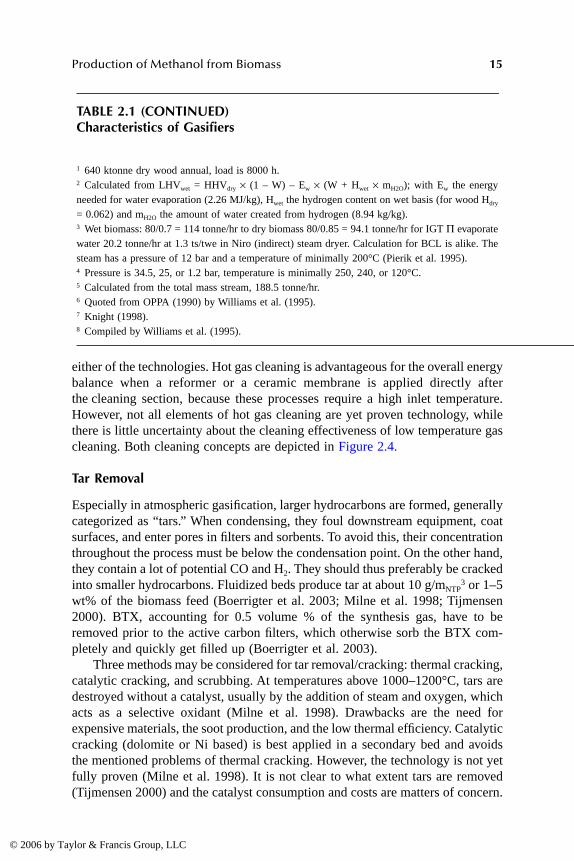
either of the technologies. Hot gas cleaning is advantageous for the overall energybalance when a reformer or a ceramic membrane is applied directly afterthe cleaning section, because these processes require a high inlet temperature.However, not all elements of hot gas cleaning are yet proven technology, whilethere is little uncertainty about the cleaning effectiveness of low temperature gascleaning. Both cleaning concepts are depicted in Figure 2.4.
Tar Removal
Especially in atmospheric gasification, larger hydrocarbons are formed, generallycategorized as “tars.” When condensing, they foul downstream equipment, coatsurfaces, and enter pores in filters and sorbents. To avoid this, their concentrationthroughout the process must be below the condensation point. On the other hand,they contain a lot of potential CO and H
2
. They should thus preferably be crackedinto smaller hydrocarbons. Fluidized beds produce tar at about 10 g/m
NTP3
or 1–5wt% of the biomass feed (Boerrigter et al. 2003; Milne et al. 1998; Tijmensen2000). BTX, accounting for 0.5 volume % of the synthesis gas, have to beremoved prior to the active carbon filters, which otherwise sorb the BTX com-pletely and quickly get filled up (Boerrigter et al. 2003).
Three methods may be considered for tar removal/cracking: thermal cracking,catalytic cracking, and scrubbing. At temperatures above 1000–1200°C, tars aredestroyed without a catalyst, usually by the addition of steam and oxygen, whichacts as a selective oxidant (Milne et al. 1998). Drawbacks are the need forexpensive materials, the soot production, and the low thermal efficiency. Catalyticcracking (dolomite or Ni based) is best applied in a secondary bed and avoidsthe mentioned problems of thermal cracking. However, the technology is not yetfully proven (Milne et al. 1998). It is not clear to what extent tars are removed(Tijmensen 2000) and the catalyst consumption and costs are matters of concern.
TABLE 2.1 (CONTINUED)Characteristics of Gasifiers
1
640 ktonne dry wood annual, load is 8000 h.
2
Calculated from LHV
wet
= HHV
dry
×
(1 – W) – E
w
×
(W + H
wet
×
m
H2O
); with E
w
the energyneeded for water evaporation (2.26 MJ/kg), H
wet
the hydrogen content on wet basis (for wood H
dry
= 0.062) and m
H2O
the amount of water created from hydrogen (8.94 kg/kg).
3
Wet biomass: 80/0.7 = 114 tonne/hr to dry biomass 80/0.85 = 94.1 tonne/hr for IGT
Π
evaporatewater 20.2 tonne/hr at 1.3 ts/twe in Niro (indirect) steam dryer. Calculation for BCL is alike. Thesteam has a pressure of 12 bar and a temperature of minimally 200°C (Pierik et al. 1995).
4
Pressure is 34.5, 25, or 1.2 bar, temperature is minimally 250, 240, or 120°C.
5
Calculated from the total mass stream, 188.5 tonne/hr.
6
Quoted from OPPA (1990) by Williams et al. (1995).
7
Knight (1998).
8
Compiled by Williams et al. (1995).
DK9448_C002.fm Page 15 Monday, April 17, 2006 8:00 AM
© 2006 by Taylor & Francis Group, LLC
16
Alcoholic Fuels
TABLE 2.2Estimated Contaminant Specifications for Methanol Synthesis
1
and Cleaning Effectiveness of Wet and Dry Gas Cleaning
Treatment Method and Remarks
Contaminant Gas Phase Specification Existing Technologies Dry Gas Cleaning
3
Soot (dust, char, ash) 0 ppb Cyclones, metal filters, moving beds, candle filters, bag filters, special soot scrubber.
Specifications are met.Alkaline (halide) metals
<10 ppb Active coal bed meets specification.
2
Sorbents under development.
Tar Below dew point
Catalyst poisoning compounds <1 ppmV
All tar and BTX:Thermal tar cracker,Oil scrubber,
4
Specifications are met.
All tar and BTX:Catalytic tar cracker, other catalytic operations.
Under development.BTX Below dew pointHalide compoundsHCl (HBr, HF) <10 ppb Removed by aqueous
scrubber.Active coal bed meets specification.
Absorbed by dolomite in tar cracker (if applicable).
In-bed sorbents or in-stream sorbents.<1 ppm.
Guardbeds necessary.
Nitrogen compounds Total N < 1 ppmV All nitrogen:catalytic decomposition, combined removal of NH
3
/H
2
S.Selective oxidation under development.
NH
3
Removed by aqueous scrubber.
Removed to specification.
HCN Active coal bed possibly preceded by hydrolysis to NH
3
.
Specifications are met.Sulfur compounds Total S < 1 ppmV
2
All sulfur:In-bed calcium sorbents.
Metal oxide sorbents<20 ppm.
H
2
S ZnO guard bed in case of high sulfur loads a special removal step,
e.g
., Claus unit.COS Active coal bed
possibly preceded by hydrolysis to H
2
S.Specifications are met.
DK9448_C002.fm Page 16 Monday, April 17, 2006 8:00 AM
© 2006 by Taylor & Francis Group, LLC

Production of Methanol from Biomass
17
Per kg dry wood (15% moisture), 0.0268 kg dolomite. Part of the H
2
S and HClpresent adsorb on dolomite (van Ree et al. 1995). The tar crackers can beintegrated with the gasifier.
Tars can also be removed at low temperature by advanced scrubbing with anoil-based medium (Bergman et al. 2003; Boerrigter et al. 2003). The tar issubsequently stripped from the oil and reburned in the gasifier. At atmosphericpressures BTX are only partially removed, about 6 bar BTX are fully removed.The gas enters the scrubber at about 400°C, which allows high-temperature heatexchange before the scrubber.
Wet Gas Cleaning
When the tars and BTX are removed, the other impurities can be removed bystandard wet gas cleaning technologies or advanced dry gas cleaning technologies.
Wet low-temperature synthesis gas cleaning is the preferred method for theshort term (van Ree et al. 1995). This method will have some energy penalty andrequires additional waste water treatment, but in the short term it is more certainto be effective than hot dry gas cleaning.
A cyclone separator removes most of the solid impurities, down to sizes ofapproximately 5 µm (Katofsky 1993). New generation bag filters made from glassand synthetic fibers have an upper temperature limit of 260°C (Perry et al. 1987).At this temperature particulates and alkali, which condense on particulates, cansuccessfully be removed (Alderliesten 1990; Consonni et al. 1994; Tijmensen2000; van Ree et al. 1995). Before entering the bag filter, the synthesis gas iscooled to just above the water dew point.
After the filter unit, the synthesis gas is scrubbed down to 40°C below thewater dew point, by means of water. Residual particulates, vapor phase chemicalspecies (unreacted tars, organic gas condensates, trace elements), reduced halogen
TABLE 2.2 (CONTINUED)Estimated Contaminant Specifications for Methanol Synthesis1 and Cleaning Effectiveness of Wet and Dry Gas Cleaning
1 Most numbers are quoted from Fischer-Tropsch synthesis over a cobalt catalyst (Bechtel 1996;Boerrigter et al. 2003; Tijmensen 2000). Gas turbine specifications are met when FT specificationsare.2 Cleaning requirements for MeOH synthesis are 0.1 (van Dijk et al. 1995) to 0.25 ppm H2S(Katofsky 1993). Total sulfur <1 ppmV (Boerrigter et al. 2003). For Fischer-Tropsch synthesisrequirements are even more severe: 10 ppb (Tijmensen 2000).3 Hot gas cleaning was practiced in the Värnamo Demonstration plant, Sweden (Kwant 2001). Alldata on dry gas cleaning here is based on the extensive research into high-temperature gas cleaningby Mitchell (Mitchell 1997; Mitchell 1998).4 Bergman et al. (Bergman et al. 2003).
DK9448_C002.fm Page 17 Monday, April 17, 2006 8:00 AM
© 2006 by Taylor & Francis Group, LLC

18A
lcoh
olic Fu
els
FIGURE 2.4 Three possible gas cleaning trains. Top: tar cracking and conventional wet gas cleaning; middle: tar scrubbing and conventional wetgas cleaning; and bottom: tar cracking and dry gas cleaning.
Hydrolyst
Gasifier850°C
Methanolreactor
Gasifier850°C
Tar cracker1300°C
Gas cooling100°C
Residualcontaminantswet cleaning
Residualcontaminantswet cleaning
Residualcontaminantsdry cleaning
Cyclones
Gasifier850°C
Tar cracker1300°C
Cyclones Candle Filters
Cyclones
Tar + oil
Dustremoval
Conditioning Guardbeds
Methanolreactor
Conditioning Guardbeds
Methanolreactor
Conditioning Guardbeds
Active carbon+ ZnO guard beds
baseabsorption
RemovesNH3
RemovesHCI, HCN
RemovesH2S, and COS
Removes tracesHCN, H2S, NH3, COS
acidabsorption
HP steam
Gas cooling400°C
HP steam
Gas cooling400°C
HP steam
Aqueousscubbing
Removes NH3, HCI,metal, part HCN, HS
Oil scrubber100°C
Gas cooling20°C
sulphurabsorption
DK
9448_C002.fm
Page 18 Monday, A
pril 17, 2006 8:00 AM
© 2006 by Taylor & Francis Group, LLC

Production of Methanol from Biomass 19
gases and reduced nitrogen compounds are removed to a large extent. The scrub-ber can consist of a caustic part where the bulk of H2S is removed using a NaOHsolution (van Ree et al. 1995) and an acid part for ammonia/cyanide removal.Alkali removal in a scrubber is essentially complete (Consonni et al. 1994).
With less than 30 ppm H2S in the biomass derived synthesis gas, a ZnO bedmay be sufficient to lower the sulfur concentration below 0.1 ppm. ZnO beds canbe operated between 50 and 400°C, the high-end temperature favors efficientutilization. At low temperatures and pressures, less sulfur is absorbed; therefore,multiple beds will be used in series. The ZnO bed serves one year and is notregenerated (Katofsky 1993; van Dijk et al. 1995). Bulk removal of sulfur is thusnot required, but if CO2 removal is demanded as well (see page 23), a solventabsorption process like Rectisol or Sulfinol could be placed downstream, whichalso removes sulfur. H2S and COS are reduced to less than 0.1 ppm and all orpart of the CO2 is separated (Hydrocarbon Processing 1998).
Dry/Hot Gas Cleaning
In dry/hot gas cleaning, residual contaminations are removed by chemical absor-bents at elevated temperature. In the methanol process, hot gas cleaning has fewenergy advantages as the methanol reactor operates at 200–300°C, especiallywhen preceding additional compression is required (efficient compressionrequires a cold inlet gas). However, dry/hot gas cleaning may have lower oper-ational costs than wet gas cleaning (Mitchell 1998). Within ten years hot gascleaning may become commercially available for BIG/CC applications (Mitchell1998). However, requirements for methanol production, especially for catalystoperation, are expected to be more severe (Tijmensen 2000). It is not entirelyclear to what extent hot gas cleaning will be suitable in the production of meth-anol.
Tars and oils are not expected to be removed during the hot gas cleaningsince they do not condense at high temperatures. Therefore, they must be removedprior to the rest of the gas cleaning, as discussed above.
For particle removal at temperatures above 400°C, sliding granular bed filtersare used instead of cyclones. Final dust cleaning is done using ceramic candlefilters (Klein Teeselink et al. 1990; Williams 1998) or sintered-metal barriersoperating at temperatures up to 720°C; collection efficiencies greater that 99.8%for 2–7 µm particles have been reported (Katofsky 1993). Still better ceramicfilters for simultaneous SOx, NOx, and particulate removal are under development(White et al. 1992).
Processes for alkali removal in the 750–900°C range are under developmentand expected to be commercialized within a few years. Lead and zinc are notremoved at this temperature (Alderliesten 1990). High-temperature alkali removalby passing the gas stream through a fixed bed of sorbent or other material thatpreferentially adsorbs alkali via physical adsorption or chemisorption was dis-cussed by Turn et al. (1998). Below 600°C alkali metals condense onto particu-lates and can more easily be removed with filters (Katofsky 1993).
DK9448_C002.fm Page 19 Monday, April 17, 2006 8:00 AM
© 2006 by Taylor & Francis Group, LLC
20 Alcoholic Fuels
Nickel-based catalysts have proved to be very efficient in decomposing tar,ammonia, and methane in biomass gasification gas mixtures at about 900°C.However, sulfur can poison these catalysts (Hepola et al. 1997; Tijmensen 2000).It is unclear if the nitrogenous component HCN is removed. It will probably formNOx in a gas turbine (Verschoor et al. 1991).
Halogens are removed by sodium and calcium-based powdered absorbents.These are injected in the gas stream and removed in the dedusting stage (Ver-schoor et al. 1991).
Hot gas desulfurization is done by chemical absorption to zinc titanate oriron oxide-on-silica. The process works optimally at about 600°C or 350°C,respectively. During regeneration of the sorbents, SO2 is liberated and has to beprocessed to H2SO4 or elemental sulfur (Jansen 1990; Jothimurugesan et al. 1996).ZnO beds operate best close to 400°C (van Dijk et al. 1995).
Early compression would reduce the size of gas cleaning equipment. How-ever, sulfur and chloride compounds condense when compressed and they maycorrode the compressor. Therefore, intermediate compression to 6 bar takes placeonly after bulk removal and 60 bar compression just before the guardbed.
GAS CONDITIONING
Reforming
The synthesis gas can contain a considerable amount of methane and other lighthydrocarbons, representing a significant part of the heating value of the gas.Steam reforming (SMR) converts these compounds to CO and H2 driven by steamaddition over a catalyst (usually nickel) at high temperatures (Katofsky 1993).Autothermal reforming (ATR) combines partial oxidation in the first part of thereactor with steam reforming in the second part, thereby optimally integratingthe heat flows. It has been suggested that ATR, due to a simpler concept, couldbecome cheaper than SMR (Katofsky 1993), although others suggest much higherprices (Oonk et al. 1997). There is dispute on whether the SMR can deal withthe high CO and C+ content of the biomass synthesis gas. While Katofsky writesthat no additional steam is needed to prevent coking or carbon deposition in SMR,Tijmensen (2000) poses that this problem does occur in SMR and that ATR isthe only technology able to prevent coking.
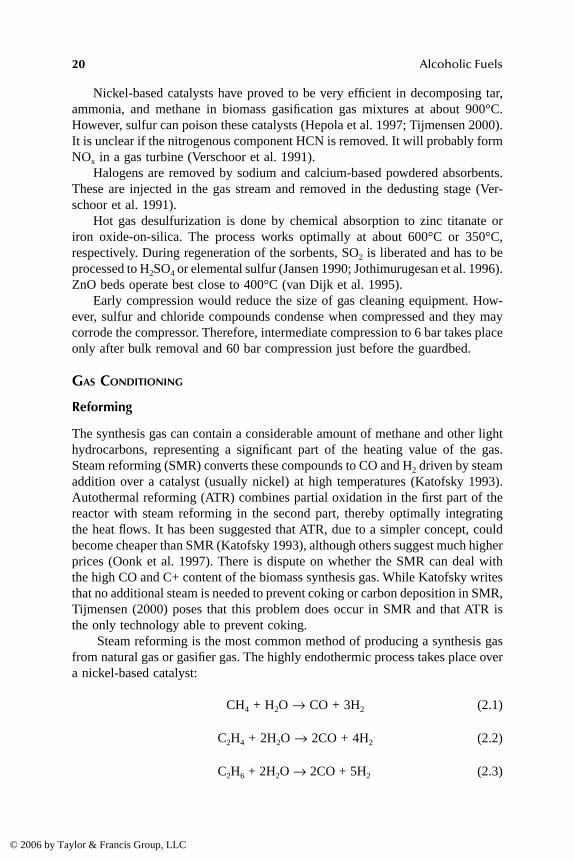
Steam reforming is the most common method of producing a synthesis gasfrom natural gas or gasifier gas. The highly endothermic process takes place overa nickel-based catalyst:
CH4 + H2O → CO + 3H2 (2.1)
C2H4 + 2H2O → 2CO + 4H2 (2.2)
C2H6 + 2H2O → 2CO + 5H2 (2.3)
DK9448_C002.fm Page 20 Monday, April 17, 2006 8:00 AM
© 2006 by Taylor & Francis Group, LLC

Production of Methanol from Biomass 21
Concurently, the water gas shift reaction (see below) takes place and bringsthe reformer product to chemical equilibrium (Katofsky 1993).
Reforming is favored at lower pressures, but elevated pressures benefit eco-nomically (smaller equipment). Reformers typically operate at 1–3.5 MPa. Typ-ical reformer temperature is between 830°C and 1000°C. High temperatures donot lead to a better product mix for methanol production (Katofsky 1993). Theinlet stream is heated by the outlet stream up to near the reformer temperatureto match reformer heat demand and supply. In this case less synthesis gas has tobe burned compared to a colder gas input, this eventually favors a higher methanolproduction. Although less steam can be raised from the heat at the reformer outlet,the overall efficiency is higher.
SMR uses steam as the conversion reactant and to prevent carbon formationduring operation. Tube damage or even rupture can occur when the steam-to-carbon ratio drops below acceptable limits. The specific type of reforming catalystused, the operating temperature, and the operating pressure are factors that deter-mine the proper steam-to-carbon ratio for a safe, reliable operation. Typical steamto hydrocarbon-carbon ratios range from 2.1 for natural gas feeds with CO2
recycle, to 3:1 for natural gas feeds without CO2 recycle, propane, naphtha, andbutane feeds (King et al. 2000). Usually full conversion of higher hydrocarbonsin the feedstock takes place in an adiabatic prereformer. This makes it possibleto operate the tubular reformer at a steam-to-carbon ratio of 2.5. When higherhydrocarbons are still present, the steam-to-carbon ratio should be higher: 3:5.In older plants, where there is only one steam reformer, the steam-to-carbon ratiowas typically 5.5. A higher steam:carbon ratio favors a higher H2CO ratio andthus higher methanol production. However, more steam must be raised and heatedto the reaction temperature, thus decreasing the process efficiency. Neither isadditional steam necessary to prevent coking (Katofsky 1993).
Preheating the hydrocarbon feedstock with hot flue gas in the SMR convectionsection, before steam addition, should be avoided. Dry feed gas must not beheated above its cracking temperature. Otherwise, carbon may be formed, therebydecreasing catalyst activities, increasing pressure drop, and limiting plantthroughput. In the absence of steam, cracking of natural gas occurs at temperaturesabove 450°C, while the flue gas exiting SMRs is typically above 1000°C (Kinget al. 2000).
Nickel catalysts are affected by sulfur at concentrations as low as 0.25 ppm.An alternative would be to use catalysts that are resistant to sulfur, such assulphided cobalt/molybdate. However, since other catalysts downstream of thereformer are also sensitive to sulfur, it makes the most sense to remove any sulfurbefore conditioning the synthesis gas (Katofsky 1993). The lifetime of catalystsranges from 3 years (van Dijk et al. 1995) to 7 years (King et al. 2000). Thereasons for change out are typically catalyst activity loss and increasing pressuredrop over the tubes.
Autothermal reforming (ATR) combines steam reforming with partial oxida-tion. In ATR, only part of the feed is oxidized, enough to supply the necessaryheat to steam reform the remaining feedstock. The reformer produces a synthesis
DK9448_C002.fm Page 21 Monday, April 17, 2006 8:00 AM
© 2006 by Taylor & Francis Group, LLC
22 Alcoholic Fuels
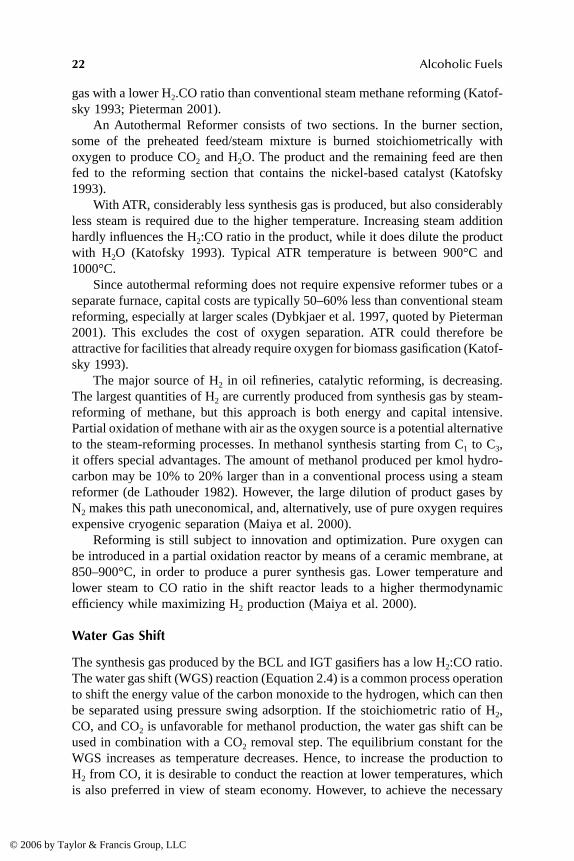
gas with a lower H2.CO ratio than conventional steam methane reforming (Katof-sky 1993; Pieterman 2001).
An Autothermal Reformer consists of two sections. In the burner section,some of the preheated feed/steam mixture is burned stoichiometrically withoxygen to produce CO2 and H2O. The product and the remaining feed are thenfed to the reforming section that contains the nickel-based catalyst (Katofsky1993).
With ATR, considerably less synthesis gas is produced, but also considerablyless steam is required due to the higher temperature. Increasing steam additionhardly influences the H2:CO ratio in the product, while it does dilute the productwith H2O (Katofsky 1993). Typical ATR temperature is between 900°C and1000°C.
Since autothermal reforming does not require expensive reformer tubes or aseparate furnace, capital costs are typically 50–60% less than conventional steamreforming, especially at larger scales (Dybkjaer et al. 1997, quoted by Pieterman2001). This excludes the cost of oxygen separation. ATR could therefore beattractive for facilities that already require oxygen for biomass gasification (Katof-sky 1993).
The major source of H2 in oil refineries, catalytic reforming, is decreasing.The largest quantities of H2 are currently produced from synthesis gas by steam-reforming of methane, but this approach is both energy and capital intensive.Partial oxidation of methane with air as the oxygen source is a potential alternativeto the steam-reforming processes. In methanol synthesis starting from C1 to C3,it offers special advantages. The amount of methanol produced per kmol hydro-carbon may be 10% to 20% larger than in a conventional process using a steamreformer (de Lathouder 1982). However, the large dilution of product gases byN2 makes this path uneconomical, and, alternatively, use of pure oxygen requiresexpensive cryogenic separation (Maiya et al. 2000).
Reforming is still subject to innovation and optimization. Pure oxygen canbe introduced in a partial oxidation reactor by means of a ceramic membrane, at850–900°C, in order to produce a purer synthesis gas. Lower temperature andlower steam to CO ratio in the shift reactor leads to a higher thermodynamicefficiency while maximizing H2 production (Maiya et al. 2000).
Water Gas Shift
The synthesis gas produced by the BCL and IGT gasifiers has a low H2:CO ratio.The water gas shift (WGS) reaction (Equation 2.4) is a common process operationto shift the energy value of the carbon monoxide to the hydrogen, which can thenbe separated using pressure swing adsorption. If the stoichiometric ratio of H2,CO, and CO2 is unfavorable for methanol production, the water gas shift can beused in combination with a CO2 removal step. The equilibrium constant for theWGS increases as temperature decreases. Hence, to increase the production toH2 from CO, it is desirable to conduct the reaction at lower temperatures, whichis also preferred in view of steam economy. However, to achieve the necessary
DK9448_C002.fm Page 22 Monday, April 17, 2006 8:00 AM
© 2006 by Taylor & Francis Group, LLC
Production of Methanol from Biomass 23
reaction kinetics, higher temperatures are required (Armor 1998; Maiya et al.2000).
CO + H2O ↔ CO2 + H2 (2.4)
The water gas shift reaction is exothermic and proceeds nearly to completionat low temperatures. Modern catalysts are active at temperatures as low as 200°C(Katofsky 1993) or 400°C (Maiya et al. 2000). Due to high-catalyst selectivity,all gases except those involved in the water–gas shift reaction are inert. Thereaction is independent of pressure.
Conventionally, the shift is realized in a successive high temperature (360°C)and low temperature (190°C) reactor. Nowadays, the shift section is often sim-plified by installing only one CO-shift converter operating at medium temperature(210°C) (Haldor Topsoe 1991). For methanol synthesis, the gas can be shiftedpartially to a suitable H2:CO ratio; therefore, “less than one” reactor is applied.The temperature may be higher because the reaction needs not to be completeand this way less process heat is lost.
Theoretically the steam:carbon monoxide ratio could be 2:1. On a lab scalegood results are achieved with this ratio (Maiya et al. 2000). In practice extrasteam is added to prevent coking (Tijmensen 2000).
CO2 Removal
The synthesis gas from the gasifier contains a considerable amount of CO2. Afterreforming or shifting, this amount increases. To get the ratio (H2–CO2)/(CO +CO2) to the value desired for methanol synthesis, part of the carbon dioxide couldbe removed. For this purpose, different physical and chemical processes areavailable. Chemical absorption using amines is the most conventional and com-mercially best-proven option. Physical absorption, using Selexol, has been devel-oped since the seventies and is an economically more attractive technology forgas streams containing higher concentrations of CO2. As a result of technologicaldevelopment, the choice for one technology or another could change in time, e.g.,membrane technology, or still better amine combinations, could play an importantrole in future.
Chemical absorption using amines is especially suitable when CO2 partialpressures are low, around 0.1 bar. It is a technology that makes use of chemicalequilibria, shifting with temperature rise or decline. Basically, CO2 binds chem-ically to the absorbent at lower temperatures and is later stripped off by hot steam.Commonly used absorbents are alkanolamines applied as solutions in water.Alkanolamines can be divided into three classes: primary, secondary, and tertiaryamines. Most literature is focused on primary amines, especially monoethanola-mine (MEA), which is considered the most effective in recovering CO2 (Farlaet al. 1995; Wilson et al. 1992), although it might well be that other agents arealso suitable as absorbents (Hendriks 1994). The Union Carbide “Flue Guard”process and the Fluor Daniel Econamine FG process (formerly known as the
DK9448_C002.fm Page 23 Monday, April 17, 2006 8:00 AM
© 2006 by Taylor & Francis Group, LLC

24 Alcoholic Fuels
Dow Chemical Gas/Spec FT-1 process) use MEA, combined with inhibitors toreduce amine degradation and corrosion. The cost of amine-based capture aredetermined by the cost of the installation, the annual use of amines, the steamrequired for scrubbing and the electric power. There is influence of scale and astrong dependence on the CO2 concentration (Hendriks 1994). The investmentcosts are inversely proportional to the CO2 concentration in the feed gas whenthese range from 4% to 8%. MEA is partly entrained in the gas phase; this resultsin chemical consumption of 0.5–2 kg per tonne CO2 recovered (Farla et al. 1995;Suda et al. 1992). The presence of SO2 leads to an increased solvent consumption(Hendriks 1994).
When the CO2 content makes up an appreciable fraction of the total gasstream, the cost of removing it by heat regenerable reactive solvents may be outof proportion compared to the value of the CO2. To overcome the economicdisadvantages of heat-regenerable processes, physical absorption processes havebeen developed that are based on the use of essentially anhydrous organic sol-vents, which dissolve the acid gases and can be stripped by reducing the acid–gaspartial pressure without the application of heat. Physical absorption requires ahigh partial pressure of CO2 in the feed gas to be purified, 9.5 bar is given as anexample by Hendriks (1994). Most physical absorption processes found in theliterature are Selexol, which is licensed by Union Carbide, and Lurgi’s Rectisol(Hendriks 1994; Hydrocarbon Processing 1998; Riesenfeld et al. 1974). Theseprocesses are commercially available and frequently used in the chemical indus-try. In a countercurrent flow absorption column, the gas comes into contact withthe solvent, a 95% solution of the dimethyl ether of polyethylene glycol in water.The CO2 rich solvent passes a recycle flash drum to recover co-absorbed CO andH2. The CO2 is recovered by reducing the pressure through expanders. Thisrecovery is accomplished in serially connected drums. The CO2 is released partlyat atmospheric pressure. After the desorption stages, the Selexol still contains25–35% of the originally dissolved CO2. This CO2 is routed back to the absorberand is recovered in a later cycle. The CO2 recovery rate from the gas stream willbe approximately 98% to 99% when all losses are taken into account. Half ofthe CO2 is released at 1 bar and half at elevated pressure: 4 bar. Minor gasimpurities such as carbonyl sulfide, carbon disulfide and mercaptans are removedto a large extent, together with the acid gases. Also hydrocarbons above butaneare largely removed. Complete acid–gas removal, i.e., to ppm level, is possiblewith physical absorption only, but is often achieved in combination with a chem-ical absorption process. Selexol can also remove H2S, if this were not done inthe gas-cleaning step.
It has been suggested by De Lathouder (1982) to scrub CO2 using crudemethanol from the synthesis reactor that has not yet been expanded. The pressureneeded for the CO2 absorption into the methanol is similar to the methanolpressure directly after synthesis. This way only a limited amount of CO2 isremoved, and the required CO2 partial pressure is high, but the desired R can bereached if conditions are well chosen. The advantage of this method is that noseparate regeneration step is required and that it is not necessary to apply extra
DK9448_C002.fm Page 24 Monday, April 17, 2006 8:00 AM
© 2006 by Taylor & Francis Group, LLC
Production of Methanol from Biomass 25
cooling of the gas stream before the scrubbing operation. The CO2 loaded crudemethanol can be expanded to about atmospheric pressure, so that the carbondioxide is again released, after which the methanol is purified as would normallybe the case.
Physical adsorption systems are based on the ability of porous materials (e.g.,zeolites) to selectively adsorb specific molecules at high pressure and low tem-perature and desorb them at low pressure and high temperature. These processesare already commercially applied in hydrogen production, besides a highly purehydrogen stream a pure carbon dioxide stream is coproduced. Physical adsorptiontechnologies are not yet suitable for the separation of CO2 only, due to the highenergy consumption (Ishibashi et al. 1998; Katofsky 1993).
METHANOL SYNTHESIS
Methanol is produced by the hydrogenation of carbon oxides over a suitable(copper oxide, zinc oxide, or chromium oxide-based) catalyst:
CO + 2H2 ↔ CH3OH (2.5)
CO2 + 3H2 ↔ CH3OH + H2O (2.6)
The first reaction is the primary methanol synthesis reaction, a small amountof CO2 in the feed (2–10%) acts as a promoter of this primary reaction and helpsmaintain catalyst activity. The stoichiometry of both reactions is satisfied whenR in the following relation is 2.03 minimally (Katofsky 1993). H2 builds up inthe recycle loop; this leads to an actual R value of the combined synthesis feed(makeup plus recycle feed) of 3 to 4 typically.
(2.7)
The reactions are exothermic and give a net decrease in molar volume.Therefore, the equilibrium is favored by high pressure and low temperature.During production, heat is released and has to be removed to keep optimumcatalyst life and reaction rate. 0.3% of the produced methanol reacts further toform side products such as dimethyl ether, formaldehyde, or higher alcohols (vanDijk et al. 1995).
The catalyst deactivates primarily because of loss of active copper due tophysical blockage of the active sites by large by-product molecules; poisoningby halogens or sulfur in the synthesis gas, which irreversibly form inactive coppersalts; and sintering of the copper crystallites into larger crystals, which then havea lower surface area-to-volume ratio.
Conventionally, methanol is produced in two-phase systems, the reactantsand products forming the gas phase and the catalyst forming the solid phase. The
R =+
H COCO CO
2 2
2
–
DK9448_C002.fm Page 25 Monday, April 17, 2006 8:00 AM
© 2006 by Taylor & Francis Group, LLC
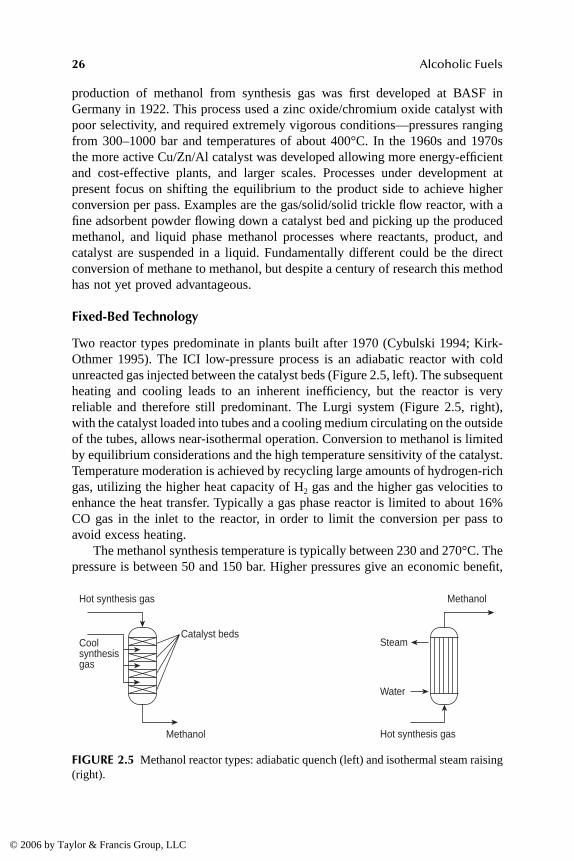
26 Alcoholic Fuels
production of methanol from synthesis gas was first developed at BASF inGermany in 1922. This process used a zinc oxide/chromium oxide catalyst withpoor selectivity, and required extremely vigorous conditions—pressures rangingfrom 300–1000 bar and temperatures of about 400°C. In the 1960s and 1970sthe more active Cu/Zn/Al catalyst was developed allowing more energy-efficientand cost-effective plants, and larger scales. Processes under development atpresent focus on shifting the equilibrium to the product side to achieve higherconversion per pass. Examples are the gas/solid/solid trickle flow reactor, with afine adsorbent powder flowing down a catalyst bed and picking up the producedmethanol, and liquid phase methanol processes where reactants, product, andcatalyst are suspended in a liquid. Fundamentally different could be the directconversion of methane to methanol, but despite a century of research this methodhas not yet proved advantageous.
Fixed-Bed Technology
Two reactor types predominate in plants built after 1970 (Cybulski 1994; Kirk-Othmer 1995). The ICI low-pressure process is an adiabatic reactor with coldunreacted gas injected between the catalyst beds (Figure 2.5, left). The subsequentheating and cooling leads to an inherent inefficiency, but the reactor is veryreliable and therefore still predominant. The Lurgi system (Figure 2.5, right),with the catalyst loaded into tubes and a cooling medium circulating on the outsideof the tubes, allows near-isothermal operation. Conversion to methanol is limitedby equilibrium considerations and the high temperature sensitivity of the catalyst.Temperature moderation is achieved by recycling large amounts of hydrogen-richgas, utilizing the higher heat capacity of H2 gas and the higher gas velocities toenhance the heat transfer. Typically a gas phase reactor is limited to about 16%CO gas in the inlet to the reactor, in order to limit the conversion per pass toavoid excess heating.
The methanol synthesis temperature is typically between 230 and 270°C. Thepressure is between 50 and 150 bar. Higher pressures give an economic benefit,
FIGURE 2.5 Methanol reactor types: adiabatic quench (left) and isothermal steam raising(right).
Hot synthesis gas
Hot synthesis gas
Methanol
Coolsynthesisgas
Catalyst beds
Methanol
Water
Steam
DK9448_C002.fm Page 26 Monday, April 17, 2006 8:00 AM
© 2006 by Taylor & Francis Group, LLC

Production of Methanol from Biomass 27
since the equilibrium then favors methanol. Only a part of the CO in the feedgas is converted to methanol in one pass through the reactor, due to the lowtemperature at which the catalyst operates. The unreacted gas is recycled at aratio typically between 2.3 and 6.
The copper catalyst is poisoned by both sulfur and chlorine, but the presenceof free zinc oxides does help prevent poisoning.
Liquid-Phase Methanol Production
In liquid-phase processes (Cybulski 1994; USDOE 1999), the heat transferbetween the solid catalyst and the liquid phase is highly efficient, and thereforethe process temperature is very uniform and steady. A gas phase delivers reactantsto the finely divided catalyst and removes the products swiftly. This allows highconversions to be obtained without loss of catalyst activity. The higher conversionper pass (compared to fixed-bed technology) eliminates the need for a recycleloop, which implies less auxiliary equipment, fewer energy requirements, smallervolumetric flow through the reactor (Katofsky 1993). An additional advantage isthe ability to withdraw a spent catalyst and add a fresh catalyst without interrupt-ing the process.
Different reactor types are possible for liquid-phase methanol production,such as fluidized beds and monolithic reactors. Air Products and Chemicals, Inc.invented a slurry bubble column reactor in the late 1970s, which was furtherdeveloped and demonstrated in the 1980s and 1990s. From 1997 to 2003, a 300-tonne/day demonstration facility at Eastman Chemical Company in Kingsport,TN produced about 400 million liters methanol from coal via gasification (Hey-dorn et al. 2003).
In the slurry bubble column reactor (Figure 2.6), reactants from the gasbubbles dissolve in the liquid and diffuse to the catalyst surface, where they react.Products then diffuse through the liquid back to the gas phase. Heat is removedby generating steam in an internal tubular heat exchanger.
FIGURE 2.6 Liquid phase methanol synthesis with three phases: slurry, gas, and solid.
Synthesis gas
Gas bubbles
Slurry with catalyst
Methanol+ unreacted gas
H2CH3OH
CO
DK9448_C002.fm Page 27 Monday, April 17, 2006 8:00 AM
© 2006 by Taylor & Francis Group, LLC

28 Alcoholic Fuels
Commercial Cu/Zn/Al catalysts developed for the two-phase process are usedfor the three-phase process. The powdered catalyst particles typically measure 1to 10 µm and are densely suspended in a thermostable oil, chemically resistantto components of the reaction mixture at process conditions, usually paraffin.Catalyst deactivation due to exposure to trace contaminants is a point of concern(Cybulski 1994).
Conversion per pass depends on reaction conditions, catalyst, solvent, andspace velocity. Experimental results show 15–40% conversion for CO rich gasesand 40–70% CO for balanced and H2 rich gases. Computation models predictfuture CO conversions of over 90%, up to 97% respectively (Cybulski 1994;Hagihara et al. 1995). Researchers at the Brookhaven National Laboratory havedeveloped a low temperature (active as low as 100°C) liquid phase catalyst thatcan convert 90% of the CO in one pass (Katofsky 1993). With steam additionthe reaction mixture becomes balanced through the water gas shift reaction.USDOE claims that the initial hydrogen to carbon monoxide ratio is allowed tovary from 0.4 to 5.6 without a negative effect on performance (USDOE 1999).
The investment costs for the liquid-phase methanol process are expected tobe 5–23% less than for a gas-phase process of the same methanol capacity.Operating costs are 2–3% lower; this is mainly due to a four times lower electricityconsumption (USDOE 1999).
OPTIONS FOR SYNERGY
ELECTRICITY COGENERATION BY COMBINED CYCLE
Unconverted synthesis gas that remains after the methanol production section canstill contain a significant amount of chemical energy. These gas streams may becombusted in a gas turbine, although they generally have a much lower heatingvalue (4–10 MJ/m3
NTP) than natural gas or distillate fuel (35–40 MJ/m3NTP) for
which most gas turbine combustors have been designed. When considering com-mercially available gas turbines for low calorific gas firing, the following itemsdeserve special attention (Consonni et al. 1994; Rodrigues de Souza et al. 2000;van Ree et al. 1995): the combustion stability, the pressure loss through the fuelinjection system, and the limits to the increasing mass flow through the turbine.
Different industrial and aeroderivative gas turbines have been operated suc-cessfully with low LHV gas, but on the condition that the hydrogen concentrationin the gas is high enough to stabilize the flame. Up to 20% H2 is required at 2.9MJ/m3
NTP. Hydrogen has a high flame-propagation speed and thus decreases therisk of extinguishing the flame (Consonni et al. 1994).
Injecting a larger fuel volume into the combustor through a nozzle originallydesigned for a fuel with much higher energy density can lead to pressure losses,and thus to a decreased overall cycle efficiency. Minor modifications are sufficientfor most existing turbines. In the longer term, new turbines optimised for lowheating value gas might include a complete nozzle combustor redesign (Consonniet al. 1994).
DK9448_C002.fm Page 28 Monday, April 17, 2006 8:00 AM
© 2006 by Taylor & Francis Group, LLC

Production of Methanol from Biomass 29
The larger fuel flow rate also implies an increase in mass flow through theturbine expander, relative to natural gas firing. This can be accommodated partlyby increasing the turbine inlet pressure, but this is limited by the compressorpower available. At a certain moment, the compressor cannot match this increasedpressure any more and goes into stall: the compressor blocks. To prevent stall,decreasing the combustion temperature is necessary; this is called derating. Thiswill lower the efficiency of the turbine, though (Consonni et al. 1994; van Reeet al. 1995). Higher turbine capacity would normally give a higher efficiency, butas the derating penalty is also stronger, the efficiency gain is small (Rodriguesde Souza et al. 2000).
Due to the setup of the engine the compressor delivers a specific amount ofair. However, to burn one m3
NTP of fuel gas less compressed air is needed com-pared to firing natural gas. The surplus air can be bled from the compressor atdifferent pressures and used elsewhere in the plant, e.g., for oxygen production(van Ree et al. 1995). If not, efficiency losses occur.
All the possible problems mentioned for the currently available gas turbinescan be overcome when designing future gas turbines. Ongoing developments ingas turbine technology increase efficiency and lower the costs per installed kWover time (van Ree et al. 1995). Cooled interstages at the compressor will lowercompressor work and produce heat, which can be used elsewhere in the system.Also gas turbine and steam turbine could be put on one axis, which saves outone generator and gives a somewhat higher efficiency.
Turbines set limits to the gas quality. The gas cleaning system needs to matchparticles and alkali requirements of the gas turbines. When these standards areexceeded, wearing becomes more severe and lifetime and efficiency will drop(van Ree et al. 1995). However, the synthesis gas that passed various catalystsprior to the gas turbine has to meet stricter demands. It is therefore expected thatcontaminants are not a real problem in gas turbines running on flue gas frommethanol production.
NATURAL GAS COFIRING/COFEEDING
If the caloric value of the unconverted synthesis gas is too low for (direct)combustion in a gas turbine, this could be compensated for by cofiring naturalgas. Besides raising the heating value of the gas, the application of natural gascan also increase the scale, thermal efficiency, and economics of the gas turbines.
Natural gas can also be applied as cofeeding in the entire process. Or, viceversa, the large scale of existing methanol production units could be utilized byplugging in a biomass gasifier and gas make-up section. The product can beconsidered partially of biomass origin.
BLACK LIQUOR GASIFICATION
Pulp and paper mills produce huge amounts of black liquor as a residue. Theyare the most important source of biomass energy in countries such as Sweden
DK9448_C002.fm Page 29 Monday, April 17, 2006 8:00 AM
© 2006 by Taylor & Francis Group, LLC
30 Alcoholic Fuels
and Finland, representing a potential energy source of 250–500 MW per mill. Asmodern kraft pulp mills have a surplus of energy, they could become key suppliersof renewable fuels in the future energy system, if the primary energy in the blackliquor could be converted to an energy carrier of high value.
Ekbom et al. (2003) have evaluated the production of methanol and DME(see below) from black liquor gasification (BLGMF process). This scheme couldbe realized against reasonable costs, if heat recovery boilers, which economiclife has ended, are replaced by BLGMF. Using black liquor as a raw material formethanol/DME production would have the following advantages:
1. Biomass logistics are extremely simplified as the raw material for fuelmaking is handled within the ordinary operations of the pulp and paperplant.
2. The process is easily pressurized, which enhances fuel productionefficiency.
3. The produced syngas has a low methane content, which optimizes fuelyield.
4. Pulp mill economics becomes less sensitive to pulp prices as the eco-nomics are diversified with another product.
5. Gasification capital cost is shared between recovery of inorganic chem-icals, steam production, and synthesis gas production.
OTHER BIOFUELS VIA GASIFICATION
Gasification, gas cleaning, and make-up are important parts of the process tomake methanol from biomass. These parts are also key to the production ofhydrogen and Fischer-Tropsch liquids from biomass. Development of methanolfrom biomass thus offers synergy with development of hydrogen and Fischer-Tropsch liquids. Methanol can also be an intermediate in the production of otherrenewable fuels such as synthetic diesel, gasoline, and dimethyl ether.
Hydrogen
The production of hydrogen from synthesis gas is somewhat simpler and cheaperthan the production of methanol. The gasification step should aim at maximizingthe hydrogen yield, which can be further increased by reforming any methaneleft and a water-gas-shift reaction. Hydrogen separation takes place by pressureswing adsorption or (in future) membranes.
Hydrogen is already produced at large scale in the chemical and oil industry.It is often seen as the future fuel for the transportation sector and households.
Fischer-Tropsch (FT) Diesel
A broad range of hydrocarbons, ranging from methane to waxes of high molecularweight can be produced from synthesis gas using an iron or cobalt catalyst. Theseare called Fischer-Tropsch (FT) liquids or Gas-to-Liquids (GTL). By cracking
DK9448_C002.fm Page 30 Monday, April 17, 2006 8:00 AM
© 2006 by Taylor & Francis Group, LLC

Production of Methanol from Biomass 31
the longer hydrocarbons and refining, a diesel is produced that can be blendedinto standard diesel. FT diesel has very low levels of sulfur and aromatic com-pounds compared to ordinary diesel and, when processed in an internal combus-tion engine, emit less NOx and particulates than diesel fuels.
The FT process was first developed at commercial scale for the productionof synthetic oil in Germany during the Second World War and was furtherdeveloped by Sasol in South Africa. Sasol remains today the only producer ofFT products from low grade coals. The rising oil price, availability of largeamounts of “stranded gas,” and decreasing investment costs have increased theinterest in FT liquids. Qatar seems to be the driver of FT development, withplanned projects totaling to 800,000 bbl/day or about 114 ktonne/day (Bensaïd2004).
In 1999 when the world had a considerable surplus of methanol productioncapacity, several companies proposed to retrofit methanol plants to produce alter-native products, e.g., Fischer-Tropsch liquids or hydrogen (Brown 1999; Yakob-son 1999). The demonstration unit of Choren in Freiberg Germany, has producedboth FT liquids and methanol.
Methanol to Diesel
Lurgi claims to develop a cheaper way to make ultra-clean diesel fuel fromsynthesis gas via methanol. The process first converts methanol into propyleneth-esis; this is followed by olefin oligomerization (conversion to distillates), thenproduct separation-plus-hydrogenation. The intermediate methanol-to-propylenestep so far is only proven at demonstration scale.
The process would yield mostly kerosene and diesel, along with a small yieldof gasoline and light ends. The near-zero sulphur/polyaromatics diesel fuel result-ing from this process would differ from more conventional Fischer-Tropsch dieselonly in cetane numbe (>52 via “Methanol-to-Synfuel” versus >70 cetane for FTdiesel). The incidental gasoline stream not only would be near-zero sulfur, butalso have commercial octane ratings (92 RON, 80 MON) and maximally 11%aromatics (Peckham 2003).
Methanol to Gasoline
In the 1970s, Mobil developed and commercialized a methanol to gasoline (MTG)process. A plant was built in Montunui, New Zealand in 1985 and sold toMethanex. It produced gasoline until 1997 when the plant was permanently idled.If the gasoline is to be sold without additional blending, then further treating isnecessary to reduce the amount of benzenes.
Dimethyl Ether (DME)
Dimethyl ether (CH3OCH3) is generally produced by dehydration of methanol.At large scale, the methanol production and dehydration processes are combinedin one reactor, such that the dimethyl ether is produced directly from synthesis
DK9448_C002.fm Page 31 Monday, April 17, 2006 8:00 AM
© 2006 by Taylor & Francis Group, LLC
32 Alcoholic Fuels
gas slightly more efficiently than methanol. The previously mentioned slurrybubble column reactor of Eastman Chemical Company in Kingsport, TN, hasbeen demonstrated to be able to produce DME as well. The LPDME™ Processuses a physical mixture of a commercial methanol catalyst and a commercialdehydration catalyst in a single slurry reactor (Heydorn et al. 2003).
Like methanol, DME has promising features as a fuel candidate for both autoand diesel engines. With small adaptations to engine and fuel system, DME canbe used in blends with diesel (10–20%), leading to higher fuel efficiency andlower emissions. In auto engines, DME can be used with LPG (any %) and neat.Since DME is as easily reformed as methanol, it has a big potential as fuel offuel cell vehicles (van Walwijk et al. 1996). DME can be easily pressurized andhandled as a liquid (Ekbom et al. 2003).
TECHNO-ECONOMIC PERFORMANCE
Following the train of components of Figure 2.1 and given the potential optionsfor gasification, gas cleaning and conditioning, synthesis and separation, manyroutes to produce methanol from biomass can be imagined. The authors havepreviously analyzed the techno-economic performance of methanol from woodthrough 6 concepts, which will be recapitulated here. At the end of the section,results will be placed into broader perspective with other literature and with fossilgasoline and diesel.
SELECTION OF CONCEPTS
Some concepts chosen resemble conventional production of methanol from nat-ural gas, making use of wet gas cleaning, steam reforming, shift, and a solid-bedmethanol reactor. Similar concepts have previously been analyzed by Katofsky(1993). Advanced components could offer direct or indirect energy benefits (liquidphase-methanol synthesis, hot gas cleaning), or economic benefits (autothermalreforming). Available process units are logically combined so the supplied gascomposition of a unit matches the demands of the subsequent unit, and heat leapsare restricted if possible. The following considerations play a role in selectingconcepts:
1. The IGT direct oxygen fired pressurized gasifier, in the normal andmaximized H2 option, and the Battelle indirect atmospheric gasifierare considered for synthesis gas production because they deliver amedium calorific nitrogen undiluted gas stream and cover a broad rangeof gas compositions.
2. Hot gas cleaning is only sensible if followed by hot process units likereforming or (intermediate temperature) shifting. Hot gas cleaning isnot applied after atmospheric gasification since the subsequent pres-surization of the synthesis gas necessitates cooling anyway.
DK9448_C002.fm Page 32 Monday, April 17, 2006 8:00 AM
© 2006 by Taylor & Francis Group, LLC

Production of Methanol from Biomass 33
3. For reforming fuel gas produced via an IGT gasifier, an autothermalreformer is chosen, because of higher efficiency and lower costs. Thehigh hydrogen yield possible with steam reforming is less importanthere since the H2:CO ratio of the gas is already high. The BCL gasifier,however, is followed by steam reforming to yield more hydrogen.
4. Preceding liquid-phase methanol synthesis, shifting the synthesis gascomposition is not necessary since the reaction is flexible toward thegas composition. When steam is added, a shift reaction takes place inthe reactor itself. Before gas-phase methanol production the composi-tion is partially shifted and because the reactor is sensitive to CO2
excess, part of the CO2 is removed.5. After the methanol passes through once, the gas still contains a large
part of the energy and is expected to suit gas turbine specifications.The same holds for unreformed BCL and IGT gases, which containenergy in the form of C2+ fractions. When the heating value of the gasstream does not allow stable combustion in a gas turbine, it is fired ina boiler to raise process steam. The chemical energy of IGT+ gas isentirely in hydrogen and carbon monoxide. After once through meth-anol production, the gas still contains enough chemical energy forcombustion in a gas turbine.
6. Heat supply and demand within plants are to be matched to optimizethe overall plant efficiency.
7. Oxygen is used as oxidant for the IGT gasifier and the autothermalreformer. The use of air would enlarge downstream equipment size bya factor 4. Alternatively, oxygen-enriched air could be used. This wouldprobably give an optimum between small equipment and low air sep-aration investment costs.
These considerations led to a selection of 6 conversion concepts (see Table2.3). The six concepts selected potentially have low-cost and/or high-energyefficiency. The concepts are composed making use of both existing commerciallyavailable technologies, as well as (promising) new technologies.
MODELING MASS AND ENERGY BALANCES
The selected systems were modeled in Aspen Plus, a widely used process simu-lation program. In this flowsheeting program, chemical reactors, pumps, turbines,heat exchanging apparatuses, etc. are virtually connected by pipes. Every com-ponent can be specified in detail: reactions taking place, efficiencies, dimensionsof heating surfaces, and so on. For given inputs, product streams can be calculated,or one can evaluate the influence of apparatus adjustments on electrical output.The plant efficiency can be optimized by matching the heat supply and demand.The resulting dimensions of streams and units and the energy balances cansubsequently be used for economic analyses.
DK9448_C002.fm Page 33 Monday, April 17, 2006 8:00 AM
© 2006 by Taylor & Francis Group, LLC

34 Alcoholic Fuels
The pretreatment and gasification sections are not modelled, their energy useand conversion efficiencies are included in the energy balances, though. The modelsstart with the synthesis gas composition from the gasifiers as given in Table 2.1
The heat supply and demand within the plant is carefully matched and aimedat maximizing the production of superheated steam for the steam turbine. Theintention was to keep the integration simple by placing few heat exchangers pergas/water/steam stream. Of course, concepts with more process units demandingmore temperature altering are more complex than concepts consisting of fewunits. First, an inventory of heat supply and demand was made. Streams matchingin temperature range and heat demand/supply were combined: e.g., heating beforethe reformer by using the cooling after the reformer. When the heat demand ismet, steam can be raised for power generation. Depending on the amount andratio of high and low heat, process steam is raised in heat exchangers or drawnfrom the steam turbine: if there is enough energy in the plant to raise steam of300°C, but barely superheating capacity, then process steam of 300°C is raiseddirectly in the plant. If there is more superheating than steam-raising capacity,then process steam is drawn from the steam cycle. Steam for gasification anddrying is almost always drawn from the steam cycle, unless a perfect match ispossible with a heat-supplying stream. The steam entering the steam turbine isset at 86 bar and 510°C.
Table 2.4 summarizes the outcomes of the flowsheet models. In some conceptsstill significant variations can be made. In concept 4, the reformer needs gas forfiring. The reformer can either be entirely fired by purge gas (thus restricting therecycle volume) or by part of the gasifier gas. The first option gives a somewhathigher methanol production and overall plant efficiency. In concept 5, one canchoose between a larger recycle and more steam production in the boiler. Arecycle of five times the feed volume, instead of four, gives a much higher
TABLE 2.3Selected Methanol Production Concepts
GasifierGas
Cleaning Reforming ShiftMethanolReactor
PowerGeneration
1 IGTmaxH2 Wet – – Liquid phase Combined cycle
2 IGT Hot (550°C) ATR – Liquid phase, with steam addition
Combined cycle
3 IGT Wet – – Liquid phase, with steam addition
Combined cycle
4 BCL Wet SMR – Liquid phase, with steam addition and recycle
Steam cycle
5 IGT Hot (550°C) ATR Partial Solid bed, with recycle Steam cycle6 BCL Wet SMR Partial Solid bed, with recycle Steam cycle
DK9448_C002.fm Page 34 Monday, April 17, 2006 8:00 AM
© 2006 by Taylor & Francis Group, LLC

Production of Methanol from Biomass 35
methanol production and plant efficiency. Per concept, only the most efficientvariation is reported in Table 2.4.
Based on experiences with low calorific combustion elsewhere (Consonni etal. 1994; van Ree et al. 1995), the gas flows in the configurations presented hereare expected to give stable combustion in a gas turbine. Table 2.4 only includesthe advanced turbines. Advanced turbine configurations, with set high compressorand turbine efficiencies and no dimension restrictions, give gas turbine efficienciesof 41–52% and 1–2% point higher overall plant efficiency than conventionalconfigurations. Based on the overall plant efficiency, the methanol concepts liein a close range of 50–57%. Liquid-phase methanol production preceded by
TABLE 2.4 Results of the Aspen Plus Performance Calculations for 430-MWth Input HHV Systems (equivalent to 380 MWth LHV for biomass with 30% moisture) of the Methanol Production Concepts Considered
HHV Output (MW)
Fuel Net Electricity1 Efficiency2
1 IGT – Max H2, Scrubber, Liquid-Phase Methanol Reactor, Combined Cycle
161 53 50%
2 IGT, Hot Gas Cleaning, Autothermal Reformer, Liquid-Phase Methanol Reactor with Steam Addition, Combined Cycle
173 62 55%
3 IGT, Scrubber, Liquid Phase Methanol Reactor with Steam Addition, Combined Cycle
113 105 51%
4 BCL, Scrubber, Steam Reformer, Liquid-Phase Methanol Reactor with Steam Addition and Recycle, Steam Cycle
246 0 57%
5 IGT, Hot Gas Cleaning, Autothermal Reformer, Partial Shift, Conventional Methanol Reactor with Recycle, Steam Turbine
221 15 55%
6 BCL, Scrubber, Steam Reforming, Partial Shift, Conventional Methanol Reactor with Recycle, Steam Turbine
255 –17 55%
1 Net electrical output is gross output minus internal use. Gross electricity is produced by gas turbineand/or steam turbine. The internal electricity use stems from pumps, compressors, oxygen separator,etc. 2 The overall energy efficiency is expressed as the net overall fuel + electricity efficiency on anHHV basis. This definition gives a distorted view, since the quality of energy in fuel and electricityis considered equal, while in reality it is not. Alternatively, one could calculate a fuel only efficiency,assuming that the electricity part could be produced from biomass at, e.g., 45% HHV in an advancedBIG/CC (Faaij et al. 1998), this definition would compensate for the inequality of electricity andfuel in the most justified way, but the referenced electric efficiency is of decisive importance. Anotherqualification for the performance of the system could use exergy: the amount of work that could bedelivered by the material streams.
DK9448_C002.fm Page 35 Monday, April 17, 2006 8:00 AM
© 2006 by Taylor & Francis Group, LLC

36 Alcoholic Fuels
reforming (concepts 2 and 4) results in somewhat higher overall efficiencies.After the pressurized IGT gasifier hot gas cleaning leads to higher efficienciesthan wet gas cleaning, although not better than concepts with wet gas cleaningafter a BCL gasifier.
Several units may be realized with higher efficiencies than considered here.For example, new catalysts and carrier liquids could improve liquid-phase meth-anol single-pass efficiency up to 95% (Hagihara et al. 1995). The electricalefficiency of gas turbines will increase by 2-3% points when going to larger scale(Gas Turbine World 1997).
COSTING METHOD
An economic evaluation has been carried out for the concepts considered. Plantsizes of 80, 400, 1000, and 2000 MWth HHV are evaluated, 400 MWth being thebase scale. The scale of the conversion system is expected to be an importantfactor in the overall economic performance. This issue has been studied forBIG/CC systems (Faaij et al. 1998; Larson et al. 1997), showing that the econ-omies of scale of such units can offset the increased costs of biomass transportup to capacities of several hundreds of MWth. The same reasoning holds for themethanol production concepts described here. It should, however, be realized thatproduction facilities of 1000–2000 MWth require very large volumes of feedstock:200–400 dry tonne/hour or 1.6–3.2 dry Mtonne per year. Biomass availabilitywill be a limitation for most locations for such large-scale production facilities,especially in the shorter term. In the longer term (2010–2030), if biomass pro-duction systems become more commonplace, this can change. Very large scalebiomass conversion is not without precedent: various large-scale sugar/ethanolplants in Brazil have a biomass throughput of 1–3 Mtonne of sugarcane per year,while the production season covers less than half a year. Also, large paper andpulp complexes have comparable capacities. The base scale chosen is comparableto the size order studied by Williams et al. (1995) and Katofsky (1993), 370–385MWth.
The methanol production costs are calculated by dividing the total annualcosts of a system by the produced amount of methanol. The total annual costsconsist of:
1. Annual investments.2. Operating and maintenance.3. Biomass feedstock.4. Electricity supply/demand (fixed power price).
The total annual investment is calculated by a factored estimation (Peters etal. 1980), based on knowledge of major items of equipment as found in theliterature or given by experts. The uncertainty range of such estimates is up to±30%. The installed investment costs for the separate units are added up. Theunit investments depend on the size of the components (which follow from the
DK9448_C002.fm Page 36 Monday, April 17, 2006 8:00 AM
© 2006 by Taylor & Francis Group, LLC

Production of Methanol from Biomass 37
Aspen Plus modelling), by scaling from known scales in literature (see Table2.5), using Equation 2.8:
(2.8)
with R = scaling factor.Various system components have a maximum size, above which multiple
units will be placed in parallel. Hence the influence of economies of scale on thetotal system costs decreases. This aspect is dealt with by assuming that the baseinvestment costs of multiple units are proportional to the cost of the maximumsize: the base investment cost per size becomes constant. The maximum size ofthe IGT gasifier is subject to discussion, as the pressurised gasifier would logicallyhave a larger potential throughput than the atmospheric BCL.
The total investment costs include auxiliary equipment and installation labour,engineering and contingencies. If only equipment costs, excluding installation, areavailable, those costs are increased by applying an overall installation factor of1.86. This value is based on 33% added investment to hardware costs (instrumen-tation and control 5%, buildings 1.5%, grid connections 5%, site preparation 0.5%,civil works 10%, electronics 7%, and piping 4%) and 40% added installation coststo investment (engineering 5%, building interest 10%, project contingency 10%,fees/overheads/profits 10%, and start-up costs 5%) (Faaij et al. 1998).
The annual investment takes into account the technical and economic lifetimeof the installation. The interest rate is 10%.
Operational costs (maintenance, labour, consumables, residual streams dis-posal) are taken as a single overall percentage (4%) of the total installed invest-ment (Faaij et al. 1998; Larson et al. 1998). Differences between conversionconcepts are not anticipated.
It was assumed that enough biomass will be available at 2 US$/GJ (HHV).This is a reasonable price for Latin and North American conditions. Costs ofcultivated energy crops in the Netherlands amount approximately 4 US$/GJ andthinnings 3 US$/GJ (Faaij 1997), and biomass imported from Sweden on a largescale is expected to cost 7 US$/GJ (1998). On the other hand biomass grown onBrazilian plantations could be delivered to local conversion facilities at 1.6–1.7US$/GJ (Hall et al. 1992; Williams et al. 1995). It has been shown elsewherethat international transport of biomass and bioenergy is feasible against modestcosts.
Electricity supplied to or demanded from the grid costs 0.03 US$/kWh. Theannual load is 8000 hours.
RESULTS
Results of the economic analysis are given in Figure 2.7. The 400 MWthconversion facilities deliver methanol at 8.6–12 US$/GJ. Considering the 30%
Cost
Cost
Size
Sizeb
a
b
a
R
=
DK9448_C002.fm Page 37 Monday, April 17, 2006 8:00 AM
© 2006 by Taylor & Francis Group, LLC

38 Alcoholic Fuels
TABLE 2.5 Costs of System Components in MUS$2001
1
Unit
BaseInvestmentCost (fob)
ScaleFactor Base Scale
OverallInstallation
Factor22
MaximumSize23
Pretreatment2
Conveyers3 0.35 0.8 33.5 wet tonne/hour 1.86 (v) 110Grinding3 0.41 0.6 33.5 wet tonne/hour 1.86 (v) 110Storage3 1.0 0.65 33.5 wet tonne/hour 1.86 (v) 110Dryer3 7.6 0.8 33.5 wet tonne/hour 1.86 (v) 110Iron removal3 0.37 0.7 33.5 wet tonne/hour 1.86 (v) 110Feeding system3,4 0.41 1 33.5 wet tonne/hour 1.86 (v) 110
Gasification SystemBCL5 16.3 0.65 68.8 dry tonne/hour 1.69 83IGT6 38.1 0.7 68.8 dry tonne/hour 1.69 75Oxygen plant (installed)7
44.2 0.85 41.7 tonne O2/hour 1 –
Gas cleaningTar cracker3 3.1 0.7 34.2 m3 gas/s 1.86 (v) 52Cyclones3 2.6 0.7 34.2 m3 gas/s 1.86 (v) 180High-temperature heat exchanger8
6.99 0.6 39.2 kg steam/s 1.84 (v) –
Baghouse filter3 1.6 0.65 12.1 m3 gas/s 1.86 (v) 64Condensing scrubber3 2.6 0.7 12.1 m3 gas/s 1.86 (v) 64Hot gas cleaning9 30 1.0 74.1 m3 gas/s 1.72 (v) –
Synthesis Gas Processing
Compressor10 11.1 0.85 13.2 MWe 1.72 (v) –Steam reformer11 9.4 0.6 1390 kmol total/hour 2.3 (v) –Autothermal reformer12 4.7 0.6 1390 kmol total/hour 2.3 (v) –Shift reactor (installed)13
36.9 0.85 15.6 Mmol CO+H2/hour 1 –
Selexol CO2 removal (installed)14
54.1 0.7 9909 kmol CO2/hour 1 –
Methanol ProductionGas-phase methanol15 7 0.6 87.5 tonne MeOH/hour 2.1 (v) –Liquid-phase methanol16
3.5 0.72 87.5 tonne MeOH/hour 2.1 (v) –
Refining17 15.1 0.7 87.5 tonne MeOH/hour 2.1 (v)Power isle18
Gas turbine + HRSG3,19 18.9 0.7 26.3 MWe 1.86 (v) –
DK9448_C002.fm Page 38 Monday, April 17, 2006 8:00 AM
© 2006 by Taylor & Francis Group, LLC
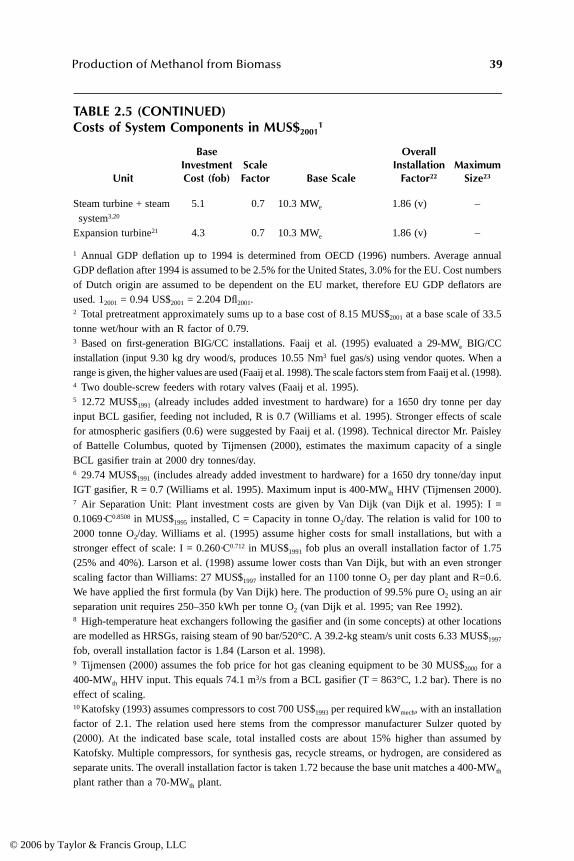
Production of Methanol from Biomass 39
TABLE 2.5 (CONTINUED)Costs of System Components in MUS$2001
1
Unit
BaseInvestmentCost (fob)
ScaleFactor Base Scale
OverallInstallation
Factor22
MaximumSize23
Steam turbine + steam system3,20
5.1 0.7 10.3 MWe 1.86 (v) –
Expansion turbine21 4.3 0.7 10.3 MWe 1.86 (v) –
1 Annual GDP deflation up to 1994 is determined from OECD (1996) numbers. Average annualGDP deflation after 1994 is assumed to be 2.5% for the United States, 3.0% for the EU. Cost numbersof Dutch origin are assumed to be dependent on the EU market, therefore EU GDP deflators areused. 12001 = 0.94 US$2001 = 2.204 Dfl2001.2 Total pretreatment approximately sums up to a base cost of 8.15 MUS$2001 at a base scale of 33.5tonne wet/hour with an R factor of 0.79.3 Based on first-generation BIG/CC installations. Faaij et al. (1995) evaluated a 29-MWe BIG/CCinstallation (input 9.30 kg dry wood/s, produces 10.55 Nm3 fuel gas/s) using vendor quotes. When arange is given, the higher values are used (Faaij et al. 1998). The scale factors stem from Faaij et al. (1998).4 Two double-screw feeders with rotary valves (Faaij et al. 1995).5 12.72 MUS$1991 (already includes added investment to hardware) for a 1650 dry tonne per dayinput BCL gasifier, feeding not included, R is 0.7 (Williams et al. 1995). Stronger effects of scalefor atmospheric gasifiers (0.6) were suggested by Faaij et al. (1998). Technical director Mr. Paisleyof Battelle Columbus, quoted by Tijmensen (2000), estimates the maximum capacity of a singleBCL gasifier train at 2000 dry tonnes/day.6 29.74 MUS$1991 (includes already added investment to hardware) for a 1650 dry tonne/day inputIGT gasifier, R = 0.7 (Williams et al. 1995). Maximum input is 400-MWth HHV (Tijmensen 2000).7 Air Separation Unit: Plant investment costs are given by Van Dijk (van Dijk et al. 1995): I =0.1069·C0.8508 in MUS$1995 installed, C = Capacity in tonne O2/day. The relation is valid for 100 to2000 tonne O2/day. Williams et al. (1995) assume higher costs for small installations, but with astronger effect of scale: I = 0.260·C0.712 in MUS$1991 fob plus an overall installation factor of 1.75(25% and 40%). Larson et al. (1998) assume lower costs than Van Dijk, but with an even strongerscaling factor than Williams: 27 MUS$1997 installed for an 1100 tonne O2 per day plant and R=0.6.We have applied the first formula (by Van Dijk) here. The production of 99.5% pure O2 using an airseparation unit requires 250–350 kWh per tonne O2 (van Dijk et al. 1995; van Ree 1992).8 High-temperature heat exchangers following the gasifier and (in some concepts) at other locationsare modelled as HRSGs, raising steam of 90 bar/520°C. A 39.2-kg steam/s unit costs 6.33 MUS$1997
fob, overall installation factor is 1.84 (Larson et al. 1998).9 Tijmensen (2000) assumes the fob price for hot gas cleaning equipment to be 30 MUS$2000 for a400-MWth HHV input. This equals 74.1 m3/s from a BCL gasifier (T = 863°C, 1.2 bar). There is noeffect of scaling.10 Katofsky (1993) assumes compressors to cost 700 US$1993 per required kWmech, with an installationfactor of 2.1. The relation used here stems from the compressor manufacturer Sulzer quoted by(2000). At the indicated base scale, total installed costs are about 15% higher than assumed byKatofsky. Multiple compressors, for synthesis gas, recycle streams, or hydrogen, are considered asseparate units. The overall installation factor is taken 1.72 because the base unit matches a 400-MWth
plant rather than a 70-MWth plant.
DK9448_C002.fm Page 39 Monday, April 17, 2006 8:00 AM
© 2006 by Taylor & Francis Group, LLC
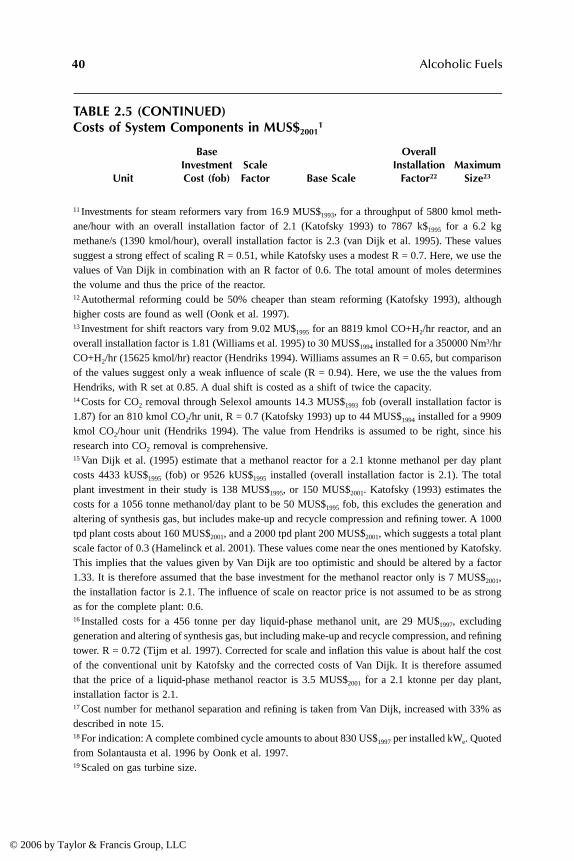
40 Alcoholic Fuels
TABLE 2.5 (CONTINUED)Costs of System Components in MUS$2001
1
Unit
BaseInvestmentCost (fob)
ScaleFactor Base Scale
OverallInstallation
Factor22
MaximumSize23
11 Investments for steam reformers vary from 16.9 MUS$1993, for a throughput of 5800 kmol meth-ane/hour with an overall installation factor of 2.1 (Katofsky 1993) to 7867 k$1995 for a 6.2 kgmethane/s (1390 kmol/hour), overall installation factor is 2.3 (van Dijk et al. 1995). These valuessuggest a strong effect of scaling R = 0.51, while Katofsky uses a modest R = 0.7. Here, we use thevalues of Van Dijk in combination with an R factor of 0.6. The total amount of moles determinesthe volume and thus the price of the reactor.12 Autothermal reforming could be 50% cheaper than steam reforming (Katofsky 1993), althoughhigher costs are found as well (Oonk et al. 1997).13 Investment for shift reactors vary from 9.02 MU$1995 for an 8819 kmol CO+H2/hr reactor, and anoverall installation factor is 1.81 (Williams et al. 1995) to 30 MUS$1994 installed for a 350000 Nm3/hrCO+H2/hr (15625 kmol/hr) reactor (Hendriks 1994). Williams assumes an R = 0.65, but comparisonof the values suggest only a weak influence of scale (R = 0.94). Here, we use the the values fromHendriks, with R set at 0.85. A dual shift is costed as a shift of twice the capacity.14 Costs for CO2 removal through Selexol amounts 14.3 MUS$1993 fob (overall installation factor is1.87) for an 810 kmol CO2/hr unit, R = 0.7 (Katofsky 1993) up to 44 MUS$1994 installed for a 9909kmol CO2/hour unit (Hendriks 1994). The value from Hendriks is assumed to be right, since hisresearch into CO2 removal is comprehensive.15 Van Dijk et al. (1995) estimate that a methanol reactor for a 2.1 ktonne methanol per day plantcosts 4433 kUS$1995 (fob) or 9526 kUS$1995 installed (overall installation factor is 2.1). The totalplant investment in their study is 138 MUS$1995, or 150 MUS$2001. Katofsky (1993) estimates thecosts for a 1056 tonne methanol/day plant to be 50 MUS$1995 fob, this excludes the generation andaltering of synthesis gas, but includes make-up and recycle compression and refining tower. A 1000tpd plant costs about 160 MUS$2001, and a 2000 tpd plant 200 MUS$2001, which suggests a total plantscale factor of 0.3 (Hamelinck et al. 2001). These values come near the ones mentioned by Katofsky.This implies that the values given by Van Dijk are too optimistic and should be altered by a factor1.33. It is therefore assumed that the base investment for the methanol reactor only is 7 MUS$2001,the installation factor is 2.1. The influence of scale on reactor price is not assumed to be as strongas for the complete plant: 0.6.16 Installed costs for a 456 tonne per day liquid-phase methanol unit, are 29 MU$1997, excludinggeneration and altering of synthesis gas, but including make-up and recycle compression, and refiningtower. R = 0.72 (Tijm et al. 1997). Corrected for scale and inflation this value is about half the costof the conventional unit by Katofsky and the corrected costs of Van Dijk. It is therefore assumedthat the price of a liquid-phase methanol reactor is 3.5 MUS$2001 for a 2.1 ktonne per day plant,installation factor is 2.1.17 Cost number for methanol separation and refining is taken from Van Dijk, increased with 33% asdescribed in note 15.18 For indication: A complete combined cycle amounts to about 830 US$1997 per installed kWe. Quotedfrom Solantausta et al. 1996 by Oonk et al. 1997.19 Scaled on gas turbine size.
DK9448_C002.fm Page 40 Monday, April 17, 2006 8:00 AM
© 2006 by Taylor & Francis Group, LLC
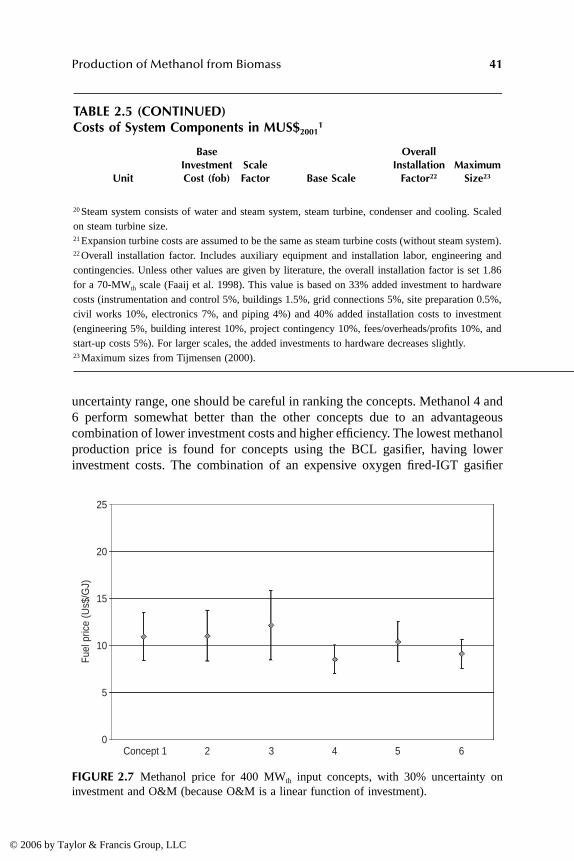
Production of Methanol from Biomass 41
uncertainty range, one should be careful in ranking the concepts. Methanol 4 and6 perform somewhat better than the other concepts due to an advantageouscombination of lower investment costs and higher efficiency. The lowest methanolproduction price is found for concepts using the BCL gasifier, having lowerinvestment costs. The combination of an expensive oxygen fired-IGT gasifier
TABLE 2.5 (CONTINUED)Costs of System Components in MUS$2001
1
Unit
BaseInvestmentCost (fob)
ScaleFactor Base Scale
OverallInstallation
Factor22
MaximumSize23
20 Steam system consists of water and steam system, steam turbine, condenser and cooling. Scaledon steam turbine size.21 Expansion turbine costs are assumed to be the same as steam turbine costs (without steam system).22 Overall installation factor. Includes auxiliary equipment and installation labor, engineering andcontingencies. Unless other values are given by literature, the overall installation factor is set 1.86for a 70-MWth scale (Faaij et al. 1998). This value is based on 33% added investment to hardwarecosts (instrumentation and control 5%, buildings 1.5%, grid connections 5%, site preparation 0.5%,civil works 10%, electronics 7%, and piping 4%) and 40% added installation costs to investment(engineering 5%, building interest 10%, project contingency 10%, fees/overheads/profits 10%, andstart-up costs 5%). For larger scales, the added investments to hardware decreases slightly.23 Maximum sizes from Tijmensen (2000).
FIGURE 2.7 Methanol price for 400 MWth input concepts, with 30% uncertainty oninvestment and O&M (because O&M is a linear function of investment).
Concept 1
Fuel
pric
e (U
s$/G
J)
2
25
20
15
10
5
03 4 5 6
DK9448_C002.fm Page 41 Monday, April 17, 2006 8:00 AM
© 2006 by Taylor & Francis Group, LLC

42 Alcoholic Fuels
with a combined cycle seems generally unfavorable, since the efficiency gain issmall compared to the high investment.
Investment redemption accounts for 42–76% of the annual costs and is influ-enced by the unit investment costs, the interest rate and the plant scale. The build-up of the total investment for all concepts is depicted in Figure 2.8. It can beseen that the costs for the gasification system (including oxygen production),synthesis gas processing and power generation generally make up the larger partof the investment. For autothermal reforming higher investment costs (Oonk etal. 1997) would increase the methanol price from considered concepts by about1.5 US$/GJ. Developments in gasification and reforming technology are impor-tant to decrease the investments. On the longer term, capital costs may reducedue to technological learning: a combination of lower specific component costsand overall learning. A third plant built may be 15% cheaper leading to an 8–15%product cost reduction.
The interest rate has a large influence on the methanol production costs. Ata rate of 5% methanol production costs decrease with about 20% to 7.2–9.0US$/GJ. At a high-interest rate (15%), methanol production costs become 9.9–14US$/GJ. Going to 1000 and 2000 MWth scales, the methanol production costsreach cost levels as low as 7.1–9.5 US$/GJ.
Feedstock costs account for 36–62% of the final product costs for the men-tioned technologies. If a biomass price of 1.7 US$/GJ could be realized (a realisticprice for, e.g., Brazil), methanol production costs would become 8.0–11 US$/GJfor 400 MWth concepts. On the other hand, when biomass costs increase to 3US$/GJ (short term Western Europe), the production cost of methanol willincrease to 10–16 US$/GJ.
FIGURE 2.8 Breakdown of investment costs for 400 MWth concepts.
Concept 1
Inve
stm
ent (
MU
S$)
2
300
250
200
150
100
50
03 4 5 6
Total Pretreatment
Gasification system
Gas Cleaning
Syngas Processing
Methanol Production
Power Generation
DK9448_C002.fm Page 42 Monday, April 17, 2006 8:00 AM
© 2006 by Taylor & Francis Group, LLC

Production of Methanol from Biomass 43
If the electricity can be sold as green power, including a carbon neutralpremium, the fuel production costs for power coproducing concepts drops, wherethe green premium essentially pays a large part of the fuel production costs.A power price of 0.08 US$/GJ would decrease methanol costs to –0.6–9.5US$/GJ. Of course the decrease is the strongest for concepts producing moreelectricity. A green electricity scenario, however, may be a typical western Euro-pean scenario. As such it is unlikely that it can be realized concurrent with biomassavailable at 1.7 US$/GJ.
In the long term, different cost reductions are possible concurrently (Tij-mensen 2000). Biomass could be widely available at 1.7 US$/GJ, capital costsfor a third plant built are 15% lower, and the large (2000 MWth) plants profitfrom economies of scale. These reductions are depicted in Figure 2.9: methanolconcepts produce between 6.1–7.4 US$/GJ. The influence of capital redemptionon the annual costs has strongly reduced and the fuel costs of the differentconcepts lie closer together.
Previous analyses on short-term methanol production by Katofsky (1993) andWilliams et al. (372 MWHHV, 3.4 US$/GJHHV feedstock, 0.07 US$/kWhe (Williams1995; Williams et al. 1995)) yielded similar energy efficiencies (54–61% byHHV), but significantly higher methanol production costs: 14–17 US$/GJHHV. Thelargest difference is in the higher capital costs: higher TCI and higher annuitygive 25–50% higher annual capital costs. The ADL/GAVE study (Arthur D. Little1999) reports 13 US$/GJ methanol (feed 2 US$/GJ, 433 MW input) largely usinginput parameters from Katofsky. Komiyama et al. (2001) instead give much lowercosts than presented here: 5 US$/GJHHV for methanol at 530 MWHHV biomass
FIGURE 2.9 Optimistic view scenario. Different cost reductions are foreseeable: (1)biomass costs 1.7 US$/GJ instead of 2 US$/GJ, (2) technological learning reduces capitalinvestment by 15% and (3) application of large scale (2000 MWth) reduces unit investmentcosts.
Concept 1
Fu
el p
rice
(U
S$/
GJ)
2
25
20
15
10
5
03 4 5 6
Base caseUltimate case
12
3
DK9448_C002.fm Page 43 Monday, April 17, 2006 8:00 AM
© 2006 by Taylor & Francis Group, LLC
44 Alcoholic Fuels
input. However, in that study, process efficiencies and biomass cost are not givenand a significant amount of energy is added as LPG.
In these long-term scenarios, methanol produced from biomass costs consid-erably less than methanol at the current market, which is priced about 10 US$/GJ(Methanex 2001). For application as automotive fuel, comparison with gasolineand diesel is relevant. Their production costs vary strongly depending on crudeoil prices, but for an indication: 2003 gasoline market prices were about 7 US$/GJat oil prices of 25–30 US$/bbl (BP 2004). DOE/EIA projects the world oil pricein 2013 to amount between 17 and 34 US$, crude oil prices may decline as newdeepwater oil fields are brought into production in the Gulf of Mexico and WestAfrica, new oil sands production is initiated in Canada, and OPEC and Russiaexpand production capacity (DOE/EIA 2005). In 2004 the average oil price wassome 35 US$/bbl and currently even higher prices of about 50 US$/bbl are paid.
CONCLUSIONS
Methanol can be produced from wood via gasification. Technically, all necessaryreactors exist and the feasibility of the process has been proven in practice. Manyconfigurations are possible, of which several have been discussed in this chapter.The configurations incorporated improved or new technologies for gas processingand synthesis and were selected on potential low cost or high-energy efficiency.Some configurations explicitly coproduced power to exploit the high efficienciesof once-through conversion. The overall HHV energy efficiencies remain around55%. Accounting for the lower energy quality of fuel compared to electricity,once-through concepts perform better than the concepts aiming at fuel onlyproduction. Also hot gas cleaning generally shows a better performance. Someof the technologies considered in this chapter are not yet fully proven/commer-cially available. Several units may be realized with higher efficiencies than con-sidered here. For example, new catalysts and carrier liquids could improve liquid-phase methanol single-pass efficiency. At larger scales, conversion and powersystems (especially the combined cycle) may have higher efficiencies, but thishas not been researched in depth.
The methanol production costs are calculated by dividing the total annualcosts of a system by the produced amount of methanol. Unit sizes, resulting fromthe plant modelling, are used to calculate the total installed capital of methanolplants; larger units benefit from cost advantages. Assuming biomass is availableat 2 US$/GJ, a 400 MWth input system can produce methanol at 9–12 US$/GJ,slightly above the current production from natural gas prices. The outcomes forthe various system types are rather comparable, although concepts focussing onoptimized fuel production with little or no electricity coproduction perform some-what better.
The methanol production cost consists of about 50% of capital redemption,of which the bulk is in the gasification and oxygen system, synthesis gas proc-essing and power generation units. Further work should give more insight intoinvestment costs for these units and their dependence to scale. The maximum
DK9448_C002.fm Page 44 Monday, April 17, 2006 8:00 AM
© 2006 by Taylor & Francis Group, LLC
Production of Methanol from Biomass 45
possible scale of particularly the pressurized gasifier gives rise to discussion. Theoperation and maintenance costs are taken as a percentage of the total investment,but may depend on plant complexity as well. Long-term (2020) cost reductionsmainly reside in slightly lower biomass costs, technological learning, andapplication of large scales (2000 MWth). This could bring the methanol productioncosts to about 7 US$/GJ, which is in the range of gasoline/diesel.
Methanol from biomass could become a major alternative for the transportsector in a world constrained by greenhouse gas emission limits and high oilprices.
REFERENCES
Agterberg, A. Bio-energy trade: Possibilities and constraints on short and longer term,Utrecht University, Department of Science, Technology and Society, The Nether-lands, 1998.
Alderliesten, P.T., System study on high temperature gas cleaning, Part 2.3: Alkalimetalsand other trace elements (in Dutch: Systeemtstudie hoge-temperatuur gasreinig-ing—deelstudie 2.3: Alkalimetalen en overige spore-elementen), Energy ResearchCenter of the Netherlands ECN, Petten, 1990.
Armor, J.N., Applications of catalytic inorganic membrane reactors to refinery products,Journal of Membrane Science, 147, 217–233, 1998.
Little, A.D., Analysis and integral evaluation of potential CO2-neutral fuel chains, GAVEreports 9908 - 9910 (Management Summary, Sheetpresentation and Appendices),Netherlands Agency for Energy and the Environment Novem, Utrecht, 1999.
Bechtel, Baseline design/economics for advanced Fischer-Tropsch technology, Topicalreport VI Natural gas Fischer-Tropsch case, Volume II Plant design and Aspenprocess simulation model, Bechtel, Pittsburgh, 1996.
Bensaïd, B., Panorama 2005: Alternative Motor Fuels Today and Tomorrow, InstituteFrancais du Petrol—IFP, Rueil-Malmaison France, 2004.
Bergman, P.C.A., van Paasen, S.V.B. and Boerrigter, H., The novel “OLGA” technologyfor complete tar removal from biomass producer gas, In Pyrolysis and Gasificationof Biomass and Waste, Bridgwater, A.V., Ed., CPL Press, Newbury, U.K., 2003pp. 347–356.
Boerrigter, H., den Uil, H. and Calis, H., Green diesel from biomass via Fischer-Tropschsynthesis: New insights in gas cleaning and process design, In Pyrolysis andGasification of Biomass and Waste, Bridgwater, A.V., Ed., CPL Press, Newbury,U.K., 2003, pp. 385-394.
BP, 2004 Statistical Review of World Energy, BP, London, U.K., 2004, www.bp.com.Brown, F.C., Alternative uses for methanol plants, Jacobs Engineering Ltd., London, 1999,
http://www.jacobsconsultancy.com/pdfs/petech.pdf.Consonni, S. and Larson, E., Biomass-gasifier/aeroderivative gas turbine combined cycles,
Part A: Technologies and performance modeling, Part B: Performance calculationsand economic assessment, In The American Society of Mechanical Engineers’ 8thCongress on Gas Turbines in Cogeneration and Utility, Industrial and IndependentPower Generation, ASME/IGTI, Portland, OR, 1994.
DK9448_C002.fm Page 45 Monday, April 17, 2006 8:00 AM
© 2006 by Taylor & Francis Group, LLC
46 Alcoholic Fuels
Cybulski, A., Liquid Phase Methanol Synthesis: Catalysts, Mechanism, Kinetics, ChemicalEquilibria, Vapor-Liquid Equilibria, and Modeling—A Review, CatalyticReview—Science Engineering, 36 (4), 557–615, 1994.
de Lathouder, H.C., Process for the preparation of methanol, European patent specificationEP0111376, 1982.
DeLallo, M.R., Rutkowski, M. and Temchin, J., Decarbonized fuel production facility—a technical strategy for coal in the next century, Article 00844, Parsons PowerGroup, Inc., Reading, PA, 2000.
DOE/EIA, Annual Energy Outlook 2005, U.S. Department of Energy, Energy InformationAdministration, Washington, DC, 2005.
Dybkjaer, I. and Hansen, J.B., Large-scale production of alterantive synthetic fuels fromnatural gas, Studies in Surface Science and Catalysis, 107, 99–116, 1997.
Ekbom, T., Lindblom, M., Berglin, N. and Ahlvik, P., Technical and Commercial FeasibilityStudy of Black Liquor Gasification with Methanol/DME Production as MotorFuels for Automotive Uses—BLGMF, EU Altener Contract 4.1030/Z/01-087/2001,Nykomb Synergetics AB, Stockholm, 2003.
Faaij, A., Meuleman, B. and van Ree, R., Long term perspectives of biomass integratedgasification with combined cycle technology, Netherlands Agency for Energy andthe Environment Novem, Utrecht, 1998.
Faaij, A., Ree, R.V. and Oudhuis, A., Gasification of biomass wastes and residues forelectricity production: Technical, economic and environmental aspects of theBIG/CC option for the Netherlands, Utrecht University, Department of Science,Technology and Society, The Netherlands, 1995.
Faaij, A.P.C., Energy from biomass and waste, Ph.D. thesis, Utrecht University, Depart-ment of Science, Technology and Society, The Netherlands, 1997.
Farla, J.C.M., Hendriks, C.A. and Blok, K., Carbon dioxide recovery from industrialprocesses, Climatic Change, 29, 439–461, 1995.
Gas Turbine World, Gas Turbine World 1997 Handbook; Pequot Publishing, Fairfield,Canada, 1997.
Hagihara, K., Mabuse, H., Watanabe, T., Kawai, M. and Saito, M., Effective liquid-phasemethanol synthesis utilizing liquid-liquid separation, Energy Conversion and Man-agement, 36 (6–9), 581–584, 1995.
Haldor Topsoe, Hydrogen Production by Steam Reforming of Hydrogen Feedstocks,Haldor Topsoe, 1991.
Hall, D.O., Rosillo-Calle, F., Williams, R.H. and Woods, J., Biomass for energy: supplyprospects, In Renewable Energy Sources for Fuels and Electricity, Johansson,T.B., Kelly, H., Reddy, A.K.N. and Williams, R.H., Eds., Island Press, Washington,DC, 1992, pp. 593–651.
Hamelinck, C.N. and Faaij, A.P.C., Future prospects for production of methanol andhydrogen from biomass; Utrecht University, Copernicus Institute, Science Tech-nology and Society, The Netherlands, 2001.
Hendriks, C., Carbon dioxide removal from coal-fired power plants, Ph.D. thesis, Depart-ment of Science, Technology and Society, Utrecht University, The Netherlands,1994.
Hepola, J. and Simell, P., Sulphur poisoning of nickel-based hog gas cleaning catalysts insynthetic gasification gas, II. Chemisorption of hydrogen sulphide, Applied Catal-ysis B: Environmental, 14, 305–321, 1997.
DK9448_C002.fm Page 46 Monday, April 17, 2006 8:00 AM
© 2006 by Taylor & Francis Group, LLC
Production of Methanol from Biomass 47
Heydorn, E.C., Diamond, B.W. and Lilly, R.D., Commercial-scale demonstration of theliquid phase methanol (LPMEOHTM) process, Air Products and Chemicals, Inc.and Eastman Chemical Company, Allentown, PA, 2003.
Hydrocarbon Processing, Gas Processes ’98, 1998.Ishibashi, M., Otake, K. and Kanamori, S., Study on CO2 removal technology from flue
gas of thermal power plant by physical adsorption method, In Fourth InternationalConference on Greenhouse Gas Control Technologies, Interlaken, 1998.
Jansen, D., System study on high temperature gas cleaning, Part 2.1: H2S/COS removal(in Dutch: Systeemstudie hoge-temperatuur gasreiniging - deelstudie 2.1:H2S/COS-verwijdering), Energy Research Center of the Netherlands ECN, Petten,1990.
Jothimurugesan, K., Adeyiga, A.A. and Gangwal, S.K., Advanced hot-gas desulfurizationsorbents, In Advanced Coal-Fired Power Systems Review Meeting, Morgantown,WV, 1996
Katofsky, R.E., The production of fluid fuels from biomass, Princeton University, Centerfor Energy and Environmental Studies, NJ, 1993.
Kirk-Othmer, Encyclopedia of Chemical Technology, 4th ed., 1995.Klein Teeselink, H. and Alderliesten, P.T., System study on high temperature gas cleaning,
Part 2.4: removal of particles (in Dutch: Systeemtstudie hoge-temperatuur gas-reiniging - deelstudie 2.4: stofverwijdering), Stork Ketels, B.V., Hengelo, 1990.
Knight, R. Personal communications on the pressurized renugas gasifier for differentconditions, Institute of Gas Technology, Chicago, 1998.
Komiyama, H., Mitsumori, T., Yamaji, K. and Yamada, K., Assessment of energy systemsby using biomass plantation, Fuel, 80, 707–715, 2001.
Kurkela, E., Formation and removal of biomass-derived contaminants in fluidized-bedgasification processes, VTT Offsetpaino, Espoo, Finland, 1996.
Kwant, K.W., Status of gasification in countries participating in the IEA Bioenergy gas-ification activity, Netherlands Agency for Energy and the Environment, Novem,Utrecht, 2001.
Larson, E., Consonni, S. and Kreutz, T., Preliminary economics of black liquor gasifier/gasturbine cogeneration at pulp and paper mills, In The 43rd ASME Gas Turbine andAeroengine Congress, Exposition and Users Symposium, Stockholm, 1998.
Larson, E.D. and Marrison, C.I., Economic scales for first-generation biomass-gasifier/gasturbine combined cycles fueled from energy plantations, Journal of Engineeringfor Gas Turbines and Power, 119, 285–290, 1997.
Li, X., Grace, J.R., Watkinson, A.P., Lim, C.J. and Ergüdenler, A., Equilibrium modelingof gasification: a free energy minimization approach and its application to acirculating fluidized bed coal gasifier, Fuel, 80 (2), 195–207, 2001.
Maiya, P.S., Anderson, T.J., Mieville, R.L., Dusek, J.T., Picciolo, J.J. and Balachandran,U., Maximizing H2 production by combined partial oxidation of CH4 and watergas shift reaction, Applied Catalysis A: General, 196, 65–72, 2000.
Methanex, http://www.methanex.com, 2001.Methanol Institute, Factsheet: World methanol supply/demand, Methanol Institute, Arling-
ton, VA, 2005.Milne, T.A., Abatzoglou, N. and Evans, R.J., Biomass gasifier ‘tars’: their nature, formation
and conversion, National Renewable Energy Laboratory, report NREL/TP-570-25357, 1998.
Mitchell, S.C., Hot gas particulate filtration, International Energy Agency IEA CoalResearch, London, 1997.
DK9448_C002.fm Page 47 Monday, April 17, 2006 8:00 AM
© 2006 by Taylor & Francis Group, LLC

48 Alcoholic Fuels
Mitchell, S.C., Hot gas cleanup of sulphur, nitrogen, minor and trace elements, Interna-tional Energy Agency IEA Coal Research, London, 1998.
OECD, National accounts—Main aggregates, Edition 1997, Paris, 1996.Oonk, H., Vis, J., Worrell, E., Faaij, A. and Bode, J.-W., The MethaHydro-process—
preliminary design and cost evaluation, TNO, The Hague, 1997.OPPA, Assesment of costs and benefits fo flexible and alternative fuel use in the US
transportaion sector, Technical Report 5: Costs of methanol production frombiomass, U.S. Department of Energy, Washington, DC, 1990.
Paisley, M.A., Farris, M.C., Black, J., Irving, J.M. and Overend, R.P., Commercial dem-onstration of the Battelle/FERCO Biomass gasification process: startup and initialoperating experience, In Fourth Biomass Conference of the Americas, Overend,R.P., Chornet, E., Eds., Elsevier Science, Oxford, Oakland, CA, 1998, pp.1061–1066.
Peckham, J., Lurgi: cheaper gtl diesel route through methanol, Gas-to-Liquids News, 6(11), http://www.worldfuels.com., 2003.
Perry, R.H., Green, D.W. and Maloney, J.O., Perry’s Chemical Engineers’ Handbook,Sixth Edition, McGraw-Hill Book Co., Singapore, 1987.
Peters, M.S. and Timmerhaus, K.D., Plant Design and Economics for Chemical Engineers,Third Edition, McGraw-Hill Book Co., New York, 1980.
Pierik, J.T.G. and Curvers, A.P.W.M., Logistics and pretreatment of biomass fuels forgasification and combustion, Energy Research Center of the Netherlands ECN,Petten, 1995.
Pieterman, M. The historical development of innovative and energy-efficient synthesis gasproduction technologies (M.S. thesis), Utrecht University, Department of Science,Technology and Society, The Netherlands, 2001.
Riesenfeld, F.C. and Kohl, A.L., Gas Purification; Gulf Publishing Company, Houston,1974.
Rodrigues de Souza, M., Walter, A. and Faaij, A., An analysis of scale effects on co-firedBIG-CC system (biomass + natural gas) in the state of São Paulo/Brazil, In 1stWorld Conference on Biomass for Energy and Industry, Kyritsis, S., Beenackers,A.A.C.M., Helm, P., Grassi, A. and Chiaramonti, D., Eds., James & James,London, Sevilla, 2000, pp. 813–816.
Solantausta, Y., Bridgewater, T. and Beckman, D., Electricity production by advancedbiomass power systems, Technical Research Centre of Finland (VTT), Espoo,Finland, 1996.
Suda, T., Fujii, M., Yoshida, K., Iijima, M., Seto, T. and Mitsuoka, S., Development offlue gas carbon dioxide recovery technology, In First International Conferenceon Carbon Dioxide Removal, Blok, K., Turkenburg, W.C., Hendriks, C.A. andSteinberg, M., Eds., Pergamon Press, Amsterdam, 1992.
Tijm, P.J.A., Brown, W.R., Heydorn, E.C. and Moore, R.B., Advances in Liquid PhaseTechnology—Presentation at American Chemical Society Meeting, April 13–17,San Francisco, 1997.
Tijmensen, M.J.A., The production of Fischer Tropsch liquids and power through biomassgasification (M.S. thesis), Utrecht University, Department of Science, Technologyand Society, The Netherlands, 2000.
Turn, S.Q., Kinoshita, C.M., Ishimura, D.M., Zhou, J., Hiraki, T.T. and Masutani, S.M.,A review of sorbent materials for fixed bed alkali getter systems in biomass gasfiercombined cycle power generation applications, Journal of the Institute of Energy,71, 163–177, 1998.
DK9448_C002.fm Page 48 Monday, April 17, 2006 8:00 AM
© 2006 by Taylor & Francis Group, LLC

Production of Methanol from Biomass 49
U.S. Department of Energy, Commercial-scale demonstration of the liquid phase methanol(LPMEOH TM) process—Clean Coal Technology Topical Report #11; U.S.Department of Energy, 1999.
van den Hoed, R., Driving fuel cell vehicles—How established industries react to radicaltechnologies (Ph.D. thesis), Delft University of Technology, The Netherlands,2004.
van Dijk, K.M., van Dijk, R., van Eekhout, V.J.L., van Hulst, H., Schipper, W. and Stam,J.H., Methanol from natural gas—conceptual design & comparison of processes,Delft University of Technology, The Netherlands, 1995.
van Ree, R., Air separation technologies—An inventory of technologies for ‘pure’ oxygenproduction for pulverised coal combustion in a CO2(g)/O2(g)-atmosphere (inDutch); Energy Research Center of the Netherlands ECN, Petten, 1992.
van Ree, R., Oudhuis, A., Faaij, A. and Curvers, A., Modelling of a biomass integratedgasifier/combined cycle (BIG/CC) system with the flowsheet simulation pro-gramme ASPEN+, Energy Research Center of the Netherlands ECN and UtrechtUniversity, Department of Science, Technology and Society, Petten, 1995.
van Walwijk, M., Bückmann, M., Troelstra, W.P. and Achten, P.A.J., Automotive fuelssurvey—Part 2 Distribution and use, IEA/AFIS operated by Innas bv, Breda, theNetherlands, 1996.
Verschoor, M.J.E. and Melman, A.G., System study high temperature gas cleaning at IGCCsystems, NOVEM / TNO Environment Energy and Process innovation MEP, 1991.
White, L.R., Tompkins, T.L., Hsieh, K.C. and Johnson, D.D., Ceramic filters for hot gascleanup, In International Gas Turbine and Aeroengine Congress and Exposition,Cologne, Germany, 1992, p. 8.
Williams, R.H., Larson, E.D., Katofsky, R.E., J. Chen methanol and hydrogen frombiomassa for transportation. Energy for Sustainable Development, I (5), 18–34,1995.
Williams, R.H., Cost-competitive electricity from coal with near-zero pollutant and CO2emissions—review draft, Princeton University, Center for Energy and Environ-mental Studies, NJ, 1998.
Williams, R.H., Larson, E.D., Katofsky, R.E. and Chen, J. Methanol and hydrogen frombiomass for transportation, with comparisons to methanol and hydrogen fromnatural gas and coal, PU/CEES Report 292, Princeton University, Center forEnergy and Environmental Studies, NJ, 1995.
Wilson, M.A., Wrubleski, R.M. and Yarborough, L., Recovery of CO2 from power plantflue gases using amines, In First International Conference on Carbon DioxideRemoval, Blok, K., Turkenburg, W.C., Hendriks, C.A. and Steinberg, M., Eds.,Pergamon Press, Amsterdam, 1992, pp. 325–331.
Yakobson, D.L., Fischer-Tropsch Technology: New Project Opportunities (Rentech, Inc.),In Gas-To-Liquids Processing 99 Meeting, Intertech Corporation, Portland, ME,1999.
DK9448_C002.fm Page 49 Monday, April 17, 2006 8:00 AM
© 2006 by Taylor & Francis Group, LLC
51
3
Landfill Gas to Methanol
William H. Wisbrock
President, Biofuels of Missouri, Inc., St. Louis
CONTENTS
Landfills and Landfill Gas ..................................................................................51Methanol, Present, and Future............................................................................53Landfill Gas to Methanol....................................................................................54Renewable Methanol...........................................................................................56New Uses for Domestic Methanol .....................................................................57
Abstract
An explanation of how market forces, governmental mandates, and taxincentives have placed the use of landfill gas as an alternative energy source intoa growing industry in the United States. Also included is a description of theopportunities and challenges that face this emerging domestic energy industry,along with a description of the Acrion Technology CO
2
Wash process that cleanslandfill gas, so that it can be utilized for the manufacture of methanol.
LANDFILLS AND LANDFILL GAS
Landfills are physical facilities used for the disposal of residual solid wastes inthe surface soils of the earth. Historically, landfills have been the most economicaland environmentally acceptable method for the disposal of solid wastes, both inthe United States and throughout the world. Even with the implementation ofwaste reduction, recycling, and transformation technologies, nearly all of theresidual solid waste in the United States today is deposited in landfills. Further-more, landfills are not going to disappear, rather they will continue to be animportant component of solid waste management strategy far into the twenty-first century.
Landfills produce a large amount of gas. Anaerobic decomposition of thebiodegradable portion of the municipal solid waste produces methane and carbondioxide in roughly equal amounts. These two principal components, together withatmospheric nitrogen and oxygen and trace organic compounds, comprise landfillgas, LFG. According to the Environmental Protection Agency (EPA) Landfill
DK9448_C003.fm Page 51 Tuesday, March 28, 2006 2:44 PM
© 2006 by Taylor & Francis Group, LLC

52
Alcoholic Fuels
Methanol Outreach Program (LMOP) statistics, each pound of organic wastebiodegrades into 10 to 12 standard cubic feet of gas during its landfill residenceof approximately 25 years. Modest size landfills produce one to five millionstandard cubic feet of landfill gas daily. By way of example, one of the largestlandfills in the United States, Fresh Kills, Staten Island, NY, produces more than30 million cubic feet of landfill gas daily. Landfill gas generation increases whilethe landfill is active and decays three to five percent annually beginning severalyears after the landfill is closed. Significant landfill gas is generated for up to 25years after closure of the landfill.
The 1986 Clean Air Act (CAA) requires that landfills containing over 2.5million tons of municipal solid waste be required to collect and flare the landfillgas in order to prevent methane migration and control the odor associated withthe landfill. This requirement helps prevent methane migration, which contributesto local smog and global climate change. Methane will try and escape into theatmosphere from the landfill either through fissures in the lining of the landfillor through the surface cover. Landfills are the largest human-related source ofmethane in the United States, accounting for about 34% of all methane emissions.The amount of methane created depends on the quantity and moisture content ofthe waste and the design and management and environmental practices of thelandfill.
In order to comply with the CAA, LFG is extracted from the landfill by anengineered system of liners, pipes, wells, wellhead monitors, and a vacuumsystem to move the collected gas to a metering device and then to the constanttemperature flare. Significant amounts of landfill gas that are now flared couldbe utilized for economically viable projects. The EPA estimates that there arebetween 800 and 1000 domestic landfills that are currently flaring landfill gasthat could be converted to energy and energy-related projects, thereby reducingdependence on fossil energy. Methane vented or flared from existing U.S. landfillswas estimated by the LMOP in 2001 to equal about 5% of domestic natural gasconsumption or about 1% of domestic total energy needs.
Landfill gas is similar to low-quality natural gas in that it requires the removalof the volatile organic contaminants and the CO
2
to realize substantial commercialvalue. Landfill gas contaminants challenge separation technology because thepotential contaminants can number in the hundreds of chemical compounds andvarious toxic species such as vinyl chloride and hydrogen sulfide. Additionally,no two landfills have the same contaminants and these contaminants are constantlychanging over the gas production life of the landfill as the decomposition occurs.
The conventional uses of landfill gas to energy include electricity generationusing internal combustion engines, turbines, micro turbines and fuel cells; directuse, which would include boiler, dryer, kiln, greenhouse, wastewater treatment;cogeneration, also known as combined heat, and power that enjoys the efficiencyof capturing the thermal energy in addition to electricity generation; and alterna-tive fuels that include pipeline quality gas, compressed natural gas, liquefiednatural gas, methanol, and hydrogen.
DK9448_C003.fm Page 52 Tuesday, March 28, 2006 2:44 PM
© 2006 by Taylor & Francis Group, LLC
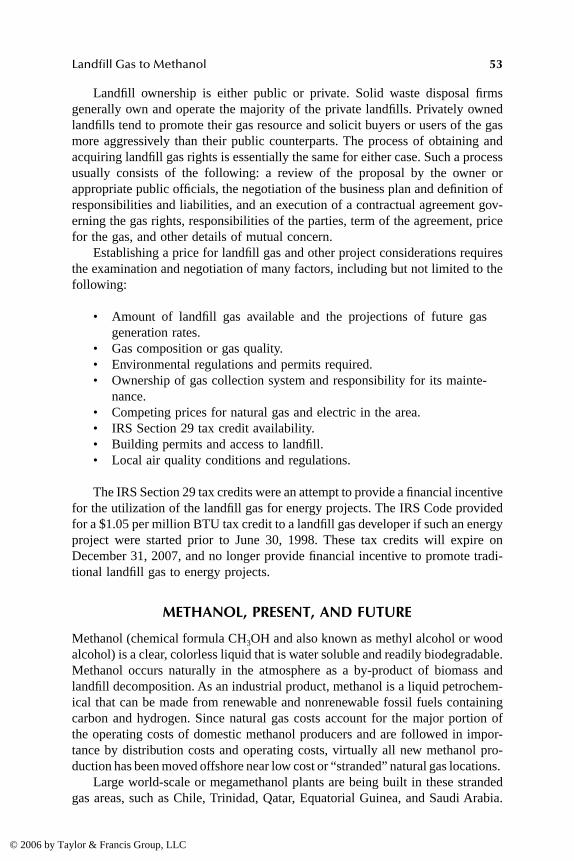
Landfill Gas to Methanol
53
Landfill ownership is either public or private. Solid waste disposal firmsgenerally own and operate the majority of the private landfills. Privately ownedlandfills tend to promote their gas resource and solicit buyers or users of the gasmore aggressively than their public counterparts. The process of obtaining andacquiring landfill gas rights is essentially the same for either case. Such a processusually consists of the following: a review of the proposal by the owner orappropriate public officials, the negotiation of the business plan and definition ofresponsibilities and liabilities, and an execution of a contractual agreement gov-erning the gas rights, responsibilities of the parties, term of the agreement, pricefor the gas, and other details of mutual concern.
Establishing a price for landfill gas and other project considerations requiresthe examination and negotiation of many factors, including but not limited to thefollowing:
• Amount of landfill gas available and the projections of future gasgeneration rates.
• Gas composition or gas quality.• Environmental regulations and permits required.• Ownership of gas collection system and responsibility for its mainte-
nance.• Competing prices for natural gas and electric in the area.• IRS Section 29 tax credit availability.• Building permits and access to landfill.• Local air quality conditions and regulations.
The IRS Section 29 tax credits were an attempt to provide a financial incentivefor the utilization of the landfill gas for energy projects. The IRS Code providedfor a $1.05 per million BTU tax credit to a landfill gas developer if such an energyproject were started prior to June 30, 1998. These tax credits will expire onDecember 31, 2007, and no longer provide financial incentive to promote tradi-tional landfill gas to energy projects.
METHANOL, PRESENT, AND FUTURE
Methanol (chemical formula CH
3
OH and also known as methyl alcohol or woodalcohol) is a clear, colorless liquid that is water soluble and readily biodegradable.Methanol occurs naturally in the atmosphere as a by-product of biomass andlandfill decomposition. As an industrial product, methanol is a liquid petrochem-ical that can be made from renewable and nonrenewable fossil fuels containingcarbon and hydrogen. Since natural gas costs account for the major portion ofthe operating costs of domestic methanol producers and are followed in impor-tance by distribution costs and operating costs, virtually all new methanol pro-duction has been moved offshore near low cost or “stranded” natural gas locations.
Large world-scale or megamethanol plants are being built in these strandedgas areas, such as Chile, Trinidad, Qatar, Equatorial Guinea, and Saudi Arabia.
DK9448_C003.fm Page 53 Tuesday, March 28, 2006 2:44 PM
© 2006 by Taylor & Francis Group, LLC

54
Alcoholic Fuels
Each plant can produce 300 million gallons annually of methanol and costs morethan $350 million to construct. The construction of these megaplants has rein-forced the characterization of methanol as a “typical” commodity as cycles ofoversupply resulting in lower prices and idled capacity are followed by periodsof shortage and rapidly rising prices as demand catches up and exceeds supplyuntil increased prices justify new plant investment.
Prior to the 1980s, methanol was produced and consumed locally in NorthAmerica primarily as an intermediate feedstock for derivatives such as formal-dehyde, acetic acid, and plastics recycling in packaging. Limited internationaltrade was seen mostly through U.S. exports. U.S. natural gas feedstock, at thattime, was reasonably competitive. Today methanol is a global commodity andthe United States has gone from the position of largest producer in the world, tothe largest net importer in less than a decade.
The American Methanol Institute, the trade organization for the methanolindustry, has changed its name to the Methanol Institute and predicts that therewill be no U.S.-produced methanol within five years due primarily to high andvolatile natural gas prices. With the controversy surrounding methyl-tertiary-butyl-ether (MTBE), significant demand for methanol has disappeared from thedomestic market. While it was widely predicted that methanol prices over thepast several years would be extremely weak, the recovery of the internationaleconomy and demand from China and India have virtually made up for the rapiddecline for the demand of methanol for MTBE.
MTBE was developed in the early 1990s as an oxygenate to improve morecomplete combustion of gasoline. This was done at the behest of the EPA.However, leaking underground storage tanks at automobile service stations causedground water contamination and MTBE was found to be a possible carcinogen.As a result, California, New York, and several other states have banned MTBE.It has largely been replaced by ethanol as an oxygenate for gasoline.
LANDFILL GAS TO METHANOL
Most existing and proposed landfill gas recovery projects simply combust raw orminimally treated landfill gas to generate heat or electricity. No competitivetechnology for landfill gas recovery has yet to capture any significant marketshare of the available landfill gas resources. Landfill gas to methanol is technicallythe most challenging issue since contaminant removal to parts per billion isrequired to manufacture methanol and made possible only by the CO
2
Wash™technology developed and patented by Acrion Technology, Inc. of Cleveland, OH.The CO
2
Wash™ process is shown in Figure 3.1.CO
2
Wash™ removes the contaminants from landfill gas using liquid carbondioxide condensed directly from the landfill gas. A stream of contaminant-freemethane and carbon dioxide is produced, along with a condensed stream ofcontaminants in carbon dioxide. This intermediate stream of clean methane andcarbon dioxide can be used as fuel gas or as feedstock to make methanol. Thissecond process is shown in Figure 3.2. In the alternative, this intermediate stream
DK9448_C003.fm Page 54 Tuesday, March 28, 2006 2:44 PM
© 2006 by Taylor & Francis Group, LLC
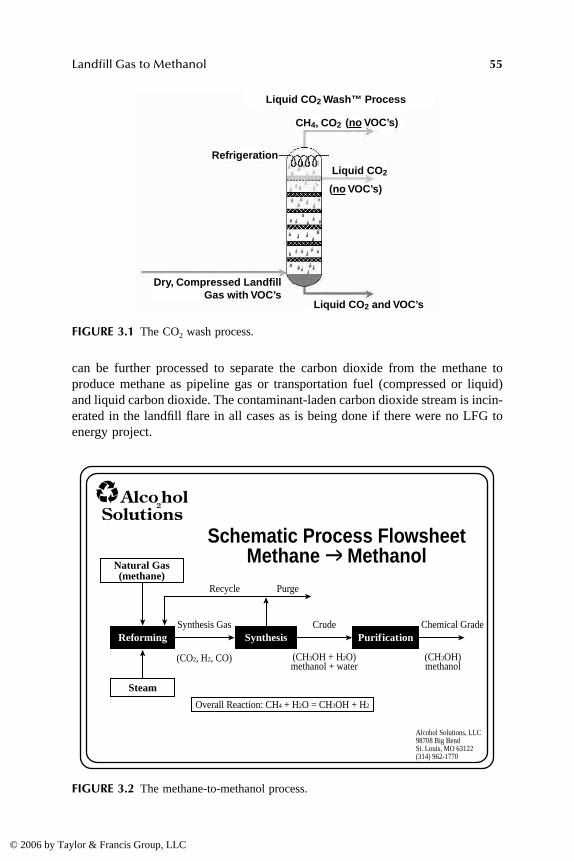
Landfill Gas to Methanol
55
can be further processed to separate the carbon dioxide from the methane toproduce methane as pipeline gas or transportation fuel (compressed or liquid)and liquid carbon dioxide. The contaminant-laden carbon dioxide stream is incin-erated in the landfill flare in all cases as is being done if there were no LFG toenergy project.
FIGURE 3.1
The CO
2
wash process.
FIGURE 3.2
The methane-to-methanol process.
Refrigeration
Dry, Compressed LandfillGas with VOC’s
Liquid CO2
Liquid CO2 and VOC’s
Liquid CO2 Wash™ Process
CH4, CO2
(no VOC’s)
(no VOC’s)
Alco2hol
Solutions
Natural Gas(methane)
Reforming
Steam
Overall Reaction: CH4 + H2O = CH3OH + H2
Synthesis PurificationSynthesis Gas Crude Chemical Grade
Recycle Purge
(CO2, H2, CO) (CH3OH + H2O)methanol + water
(CH3OH)methanol
Alcohol Solutions, LLC98708 Big BendSt. Louis, MO 63122(314) 962-1770
Schematic Process FlowsheetMethane → Methanol
DK9448_C003.fm Page 55 Tuesday, March 28, 2006 2:44 PM
© 2006 by Taylor & Francis Group, LLC

56
Alcoholic Fuels
Landfill gas is pretreated to remove water and hydrogen sulfides and thencompressed to about 400 psi. Dry, compressed landfill gas is introduced to aconventional packed tower where the contaminants are removed. Pure liquidcarbon dioxide condenses from the treated landfill gas at the top of the column.A small portion of the liquid carbon dioxide is sent down the column (descendingdrops) where, in intimate contact with rising landfill gas, it absorbs (or washes)contaminants from the landfill gas. The larger portion of this condensed liquidis available as liquid carbon dioxide product at the top of the column. Cleanlandfill gas feedstock for methanol synthesis is at the top of the column, with acomposition of 75% methane, 25% carbon dioxide.
In 1998, Acrion completed successful field tests of the CO
2
Wash at the AlTuri Landfill in Goshen, NY, under a grant from the U.S. Department of Energy(DOE). In the fall of 2001, a demonstration CO
2
Wash™ skid, also funded by aU.S. DOE grant, was operated successfully at the New Jersey EcoComplex,Burlington County, NJ. Continuity and quality of products were established inan extended 100+-hour run producing over 3500 lbs of liquid carbon dioxide(>0.9999 purity). Atlantic Analytical Laboratory and the EPA approved the facil-ity for landfill gas testing and confirmed the product gas streams purity. MackTruck has verified technology veracity in 2003–2004 trials and is proceeding withadditional liquid natural gas production programs.
This CO
2
Wash™ process experience, combined with the extensive experi-ence that HydroChem, a subsidiary of Linde, AG, has had in building modularhydrogen/methanol plants, has reduced significantly the investment and businessconcerns associated with landfill gas to methanol projects.
RENEWABLE METHANOL
Utilizing landfill gas to manufacture methanol has many significant advantagesover the current suppliers of methanol.
• A known price for the raw material and the known price of the plantallows the producer to control the production costs of methanol overthe productive life of the landfill, typically the remaining years thatthe landfill will be open and then 25 years after it is closed.
• The ability to determine production costs enables the manufacturer tooffer long-term, price-stable contracts to customers who have tradi-tionally experienced wide fluctuations in the price of methanol.
• The proximity of the production site to the methanol customers resultsin considerably lower transportation costs and more dependable deliv-ery.
• Being classified as a renewable resource, the manufacturer of methanolfrom landfill gas enjoys a “green” reputation in the United States. Anumber of Fortune 500 companies have a corporate policy to purchasea certain percentage of their raw material needs from renewablesources.
DK9448_C003.fm Page 56 Tuesday, March 28, 2006 2:44 PM
© 2006 by Taylor & Francis Group, LLC
Landfill Gas to Methanol
57
• “Green methanol” will allow the manufacturer to take advantage ofvarious tax credits and incentives passed by the United States Congressto promote renewable products and fuels. One example is the 60-cents-per-gallon “alcohol fuel credit” that applies to methanol used in trans-portation fuels.
• The utilization of landfill gas in the manufacture of methanol resultsin the sequestering of methane and carbon dioxide, this process iscredited with reducing greenhouse gas emissions.
The emerging markets for renewable methanol are becoming more definedand mature as demand is being driven by environmental statutory requirementsand U.S. government mandates regarding the reduction of global warming gasesand ending U.S. reliance upon foreign oil and energy. To that end, landfill gas tomethanol offers a compelling opportunity to develop a significantly large domesticindustry to support the growing demand for domestic renewable fuels and energy.
NEW USES FOR DOMESTIC METHANOL
• Methanol fuel cells: transportation, stationary, and portable power.• Production of biodiesel.• Sewerage treatment denitrification.• Fuel for standby turbine electric generators.• Pulp and paper bleaching replacing chlorine.• Stock-car racing fuel.• Replacement for diesel fuel for stationary diesel engines.• Converting methanol to hydrogen. Eliminating storage and trans-
portation.• Fuel additives for diesel fuel. Preventing gelling and fuel line freeze.• Intermediate for production of dimethyl ether, acetic acid, and form-
aldehyde.• Environmental cleanup of perchlorate at military installations.
All referenced data in this chapter comes from the U.S. Environmental Pro-tection Agency (http://www.epa.gov).
DK9448_C003.fm Page 57 Tuesday, March 28, 2006 2:44 PM
© 2006 by Taylor & Francis Group, LLC
59
4
The Corn Ethanol Industry
Nancy N. Nichols,
1
Bruce S. Dien,
1
Rodney J. Bothast,
2
and Michael A. Cotta
1
1
Fermentation Biotechnology Research Unit, National Center for Agricultural Utilization Research, Agricultural Research Service, U.S. Department of Agriculture,* Peoria, Illinois
2
National Corn-to-Ethanol Research Center, Southern Illinois University-Edwardsville, Edwardsville, Illinois
CONTENTS
Introduction .........................................................................................................60Corn Ethanol and the Energy Balance ...................................................61Economics of Corn Ethanol....................................................................61
Theory behind Conversion of Corn to Ethanol..................................................62Structure and Composition of the Corn Kernel .....................................62Conversion of Starch to Glucose ............................................................63Fermentation of Glucose to Ethanol.......................................................63
Processes for Converting Corn to Ethanol .........................................................66Wet-Milling and Dry-Grind Corn Processes for Ethanol Fermentation............................................................................................66Dry-Grind Ethanol Production................................................................67
Starch Conversion..........................................................................67Fermentation ..................................................................................68Distillation and Dehydration .........................................................68Stillage Processing and Feed Products .........................................68
Ethanol Production by Wet Milling........................................................69Steeping .........................................................................................69Oil, Fiber, and Gluten Separation .................................................69
* Mention of trade names or commercial products in this chapter is solely for the purpose of providingspecific information and does not imply recommendation or endorsement by the U.S. Department ofAgriculture.
DK9448_C004.fm Page 59 Monday, April 17, 2006 8:06 AM
© 2006 by Taylor & Francis Group, LLC

60
Alcoholic Fuels
Starch Conversion..........................................................................70Coproducts from Wet Milling .......................................................70
Future Directions in the Corn Ethanol Industry.................................................70Alternative Feedstocks ............................................................................71
Corn Fiber......................................................................................71Corn Stover and Alternative Starches ...........................................71Other Types of Biomass ................................................................71
New Products from Wet-Milled Corn Starch .........................................72Modifying the Corn Dry-Grind Process.................................................73
Quick Fiber and Quick Germ Processes.......................................73Very-High-Gravity Fermentations.................................................73New Processing Technology to Decrease Energy Use.................73
Alternate Uses for DDGS.......................................................................74Zein Protein from Corn Dry Grinding or Wet Milling ..........................74Hybrid and Strain Development .............................................................75
Conclusions .........................................................................................................75References ...........................................................................................................75
INTRODUCTION
Ethanol production is a growing industry in the United States, where corn is thefeedstock used to produce approximately 90% of fuel ethanol. Approximately1.26 billion bushels of corn, equal to 11% of the total U.S. corn crop, wereprocessed to ethanol in 2004 according to the Renewable Fuels Association.Globally, the only crop used to produce more ethanol is sugar cane. Approxi-mately 61% of world ethanol production is from sugar crops, with the remainderbeing made primarily from corn [1]. The success of corn as a feedstock for ethanolproduction can be directly tied to the huge and sustained improvements in yieldsrealized in the United States; corn yields per acre quadrupled in the fifty yearsfrom 1954 to 2004. According to the U.S. Department of Agriculture-NationalAgricultural Statistics Service, the average U.S. corn grain yield in 2004 was160.4 bushels per acre and the average price was $1.95 per bushel.
Use of corn to make fuel ethanol dates back to the earliest days of automobiles[2]. The Model T was originally designed to run on ethanol, although use ofethanol for fuel ceased with the development of the petroleum industry. Theethanol industry was briefly revived during World War II and during the oil crisisin the 1970s. The current renaissance of the ethanol industry dates to the 1980s,when the U.S. Environmental Protection Agency mandated adding fuel oxygen-ates to gasoline to reduce automotive emissions. Ethanol has been used as anoxygenate primarily in the Midwestern United States whereas MTBE, which isderived from petroleum, has been used on both coasts. However, MTBE is nowrecognized as a hazard to water supplies, and its use is being phased out by allstates. The opening of coastal markets to ethanol has led to tremendous growthin the domestic ethanol industry, which is expected to produce five billion gallons
DK9448_C004.fm Page 60 Monday, April 17, 2006 8:06 AM
© 2006 by Taylor & Francis Group, LLC
The Corn Ethanol Industry
61
of ethanol per year by 2012. Whether this target of five or more billion gallonswill be achieved because of oxygenate requirements, or be directly mandated aspart of a National Energy Bill—which will allow gasoline refiners to trade ethanolcredits—is unclear. What appears certain is that the corn ethanol industry canlook forward to continued and steady growth. Growth is ensured by the increas-ingly appreciated advantages of corn ethanol: reduced oil imports, reduced auto-motive-associated net CO
2
emissions, and a stabilized corn market.
C
ORN
E
THANOL
AND
THE
E
NERGY
B
ALANCE
Ethanol was promoted at the end of the twentieth century for its environmentalbenefits as an oxygenate in reducing organic carbon emissions. Now, however,the advantages associated with reduced CO
2
emissions and oil imports are increas-ingly cited. A prime concern in justifying the use of bioethanol is calculating thebenefit of using it for fuel, from an energy savings basis. Most energy analyseshave shown that ethanol contains more energy than the fossil fuels used to produceit [3–5]. The average energy output/input ratio is 1.57 and 1.77 for the wet-millingand dry-grind ethanol processes, respectively [6]. These values are life-cycleestimates, meaning that they include all energy inputs and outputs from growingthe corn to transporting the ethanol to market. In other words, on average approx-imately 67% more energy captured from the sun (by photosynthesis) is retainedin ethanol than the fossil fuel energy used to grow and harvest the corn andconvert it to ethanol. By comparison, the energy obtained from gasoline is 20%lower than the fossil inputs for production [5].
Advances in agronomics, fertilizer production and application, and the etha-nol production process have significantly decreased energy requirements, reduc-ing by half the energy currently required for ethanol production compared to thatrequired in the late 1970s. As the ethanol industry matures, the net energy gainsare likely to increase further. A recent example is the cold-starch hydrolysisprocess, discussed later in this chapter, which uses less energy for ethanol pro-duction. Another key consideration regarding the use of fuel ethanol is how wellit acts as a replacement for imported liquid transportation fuel. Much of the energythat goes into making ethanol is in the form of coal and natural gas used tooperate fertilizer and ethanol plants. Therefore, it has been estimated that morethan six gallons of ethanol are produced for each gallon of petroleum used [7].
E
CONOMICS
OF
C
ORN
E
THANOL
Advocates of the corn ethanol industry note that agricultural business and ruraleconomies benefit from ethanol production. Rural economies gain new jobs andan expanded tax base. The local impact of a dry grind facility producing 40million gallons of ethanol per year is an estimated $56 million spent annuallyfor feedstock (corn), labor, and utilities, and also $1.2 million in state and localtax revenues [8]. Farmers benefit from the establishment of a guaranteed marketfor a set number of bushels, with an increased value of $0.25–$0.50 per bushel
DK9448_C004.fm Page 61 Monday, April 17, 2006 8:06 AM
© 2006 by Taylor & Francis Group, LLC

62
Alcoholic Fuels
in the national corn price plus an additional $0.05–$0.10 per bushel in the localityof ethanol plants. A strengthened domestic market for corn also prevents theUnited States from flooding the global corn market.
Federal and state tax support for ethanol production has driven growth of theethanol industry. Federal ethanol tax incentives for ethanol-blended fuels aredirected at gasoline marketers in one of two ways. The excise tax exemptionreduces the federal excise tax, paid at the terminal by refiners and marketers, by5.1 cents per gallon of 10% ethanol-blended fuel. Or, gasoline refiners can claiman income tax credit of 5.1 cents per gallon of gasoline blended with 10% ethanol.At the state level, tax incentives generally are directed to benefit small ethanolproducers, which are typically farmer-owned cooperatives [9]. In some cases,states directly support new ethanol facilities with cash payments to help defrayconstruction costs. State incentives for users range from cents-per-gallon taxexemptions for ethanol blends to rebates for purchase of alternative fuel vehiclesand grants to fuel stations selling alternative fuels. Several states mandate use ofethanol blends or flexible fuel vehicles for state-owned fleets. Minnesota andHawaii have renewable fuel standards requiring use of E10 blends in cars, andMinnesota’s E20 law offers two options for increasing ethanol use to 20 percentof the gasoline sold in the state by 2013. Montana’s E10 law states that most ofthe gasoline sold in the state must include 10% ethanol when annual productionof ethanol in the state reaches 40 million gallons. A few other state legislaturesare considering similar measures.
THEORY BEHIND CONVERSION OF CORN TO ETHANOL
S
TRUCTURE
AND
C
OMPOSITION
OF
THE
C
ORN
K
ERNEL
Corn kernels contain, by weight, approximately 70% starch, 9% protein, 4% fatand oil, and 9% fiber on a dry basis [10]. Most corn grown for ethanol productionis #2 yellow dent corn, so named because of the indentation in the top of thedried kernel. Energy is stored in the seed in the form of starch and oil, which aresegregated to the endosperm and germ, respectively (Figure 4.1). Different pro-teins are contained in the endosperm, germ, and tip cap. The gluten proteinfraction is found in the endosperm, bonded to the starch. The seed contents areprotected by a waxy coat and fibrous outer layer (the pericarp). Fiber is alsopresent in the germ and tip cap.
Ethanol yield potential varies among corn hybrids [11, 12], and also dependson agronomic practices and environmental factors. Corn hybrids are being devel-oped and marketed specifically for enhanced ethanol production, and seed cornis labeled for sale with high extractable starch (for wet milling) or high ferment-able starch content (for dry grind ethanol processing). Total starch content andtotal extractable starch content do not necessarily correlate with ethanol yieldsobtained in dry grind processing of the whole kernel; instead, high-performingvarieties have been identified by empirical testing. Grain from high ethanol-
DK9448_C004.fm Page 62 Monday, April 17, 2006 8:06 AM
© 2006 by Taylor & Francis Group, LLC
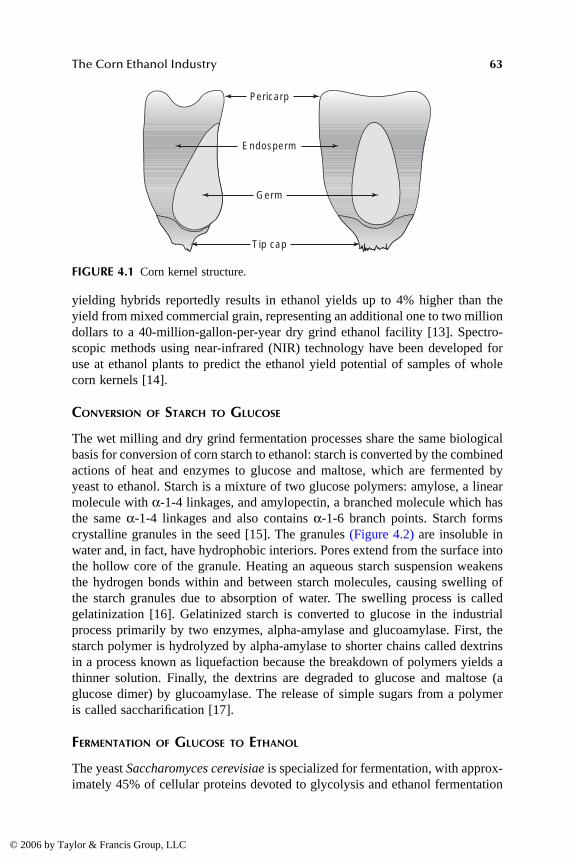
The Corn Ethanol Industry
63
yielding hybrids reportedly results in ethanol yields up to 4% higher than theyield from mixed commercial grain, representing an additional one to two milliondollars to a 40-million-gallon-per-year dry grind ethanol facility [13]. Spectro-scopic methods using near-infrared (NIR) technology have been developed foruse at ethanol plants to predict the ethanol yield potential of samples of wholecorn kernels [14].
C
ONVERSION
OF
S
TARCH
TO
G
LUCOSE
The wet milling and dry grind fermentation processes share the same biologicalbasis for conversion of corn starch to ethanol: starch is converted by the combinedactions of heat and enzymes to glucose and maltose, which are fermented byyeast to ethanol. Starch is a mixture of two glucose polymers: amylose, a linearmolecule with
α
-1-4 linkages, and amylopectin, a branched molecule which hasthe same
α
-1-4 linkages and also contains
α
-1-6 branch points. Starch formscrystalline granules in the seed [15]. The granules (Figure 4.2) are insoluble inwater and, in fact, have hydrophobic interiors. Pores extend from the surface intothe hollow core of the granule. Heating an aqueous starch suspension weakensthe hydrogen bonds within and between starch molecules, causing swelling ofthe starch granules due to absorption of water. The swelling process is calledgelatinization [16]. Gelatinized starch is converted to glucose in the industrialprocess primarily by two enzymes, alpha-amylase and glucoamylase. First, thestarch polymer is hydrolyzed by alpha-amylase to shorter chains called dextrinsin a process known as liquefaction because the breakdown of polymers yields athinner solution. Finally, the dextrins are degraded to glucose and maltose (aglucose dimer) by glucoamylase. The release of simple sugars from a polymeris called saccharification [17].
F
ERMENTATION
OF
G
LUCOSE
TO
E
THANOL
The yeast
Saccharomyces cerevisiae
is specialized for fermentation, with approx-imately 45% of cellular proteins devoted to glycolysis and ethanol fermentation
FIGURE 4.1
Corn kernel structure.
Pericarp
Endosperm
Germ
Tip cap
DK9448_C004.fm Page 63 Monday, April 17, 2006 8:06 AM
© 2006 by Taylor & Francis Group, LLC

64
Alcoholic Fuels
[18]. Glucose and maltose are fermented to ethanol by
S. cerevisiae
via the samefermentation pathway (Figure 4.3) [19] used to make beverage alcohol. In glyc-olysis, glucose is converted through a series of reactions to pyruvate, and energyis extracted in the form of four ATP molecules. Then, pyruvate is converted toethanol in a two-step reaction; pyruvate is decarboxylated to form the morereactive acetaldehyde, which is reduced to ethanol. The second part of the fer-mentation pathway reoxidizes NADH to NAD
+
and thus serves to recover thereducing equivalents that were consumed in the conversion of glucose to pyruvate.
For each glucose fermented, two ethanol and two CO
2
molecules are produced(Table 4.1, Figure 4.3). The theoretical mass yield is only 0.51 g of ethanol perg of fermented glucose. The actual yield is closer to 90–95% of 0.51 g becausesome glucose is converted to cell mass and side-products such as glycerol, citricacid cycle intermediates, and higher alcohols. Contaminating microorganisms canalso lower the yield by converting glucose to other fermentation products such
FIGURE 4.2
Starch granules. Granules of standard corn starch are typically 5 to 20 µmin diameter. Scanning electron micrograph courtesy of Victoria L. Finkenstadt.
FIGURE 4.3
Fermentation of glucose to ethanol by
Saccharomyces cerevisiae
.
glucoseC6H12O6
2 pyruvic acidCH3COCOOH
2 acetaldehydeCH3CHO
2 ethanolCH3CH2OH
2 NADH + 2 H+
pyruvatedecarboxylase
alcoholdehydrogenase
glycolysisenzymes
2 ATP2 NADH + 2 H+
2 ADP + Pi2 NAD+ 2 NAD+2 CO2
DK9448_C004.fm Page 64 Monday, April 17, 2006 8:06 AM
© 2006 by Taylor & Francis Group, LLC

The Corn Ethanol Industry
65
as acetic, lactic, and succinic acids. Because ethanol is used as a fuel, it is alsoappropriate to consider ethanol yield on an energy basis. The thermodynamicyield can be calculated by comparing the heats of combustion for the productsand reactants (Table 4.1). By this measure, converting glucose to ethanol has anamazing theoretical yield of 98–99%, which means that the yeast actually gainslittle energy benefit from fermenting glucose to ethanol. In other words, ethanolfermentation is an excellent process for generating fuel, because most of theenergy from glucose is retained in the fermentation product.
Yeast are ideally suited for use in the fuel ethanol industry. Fermentationsrun 360 days a year, in tanks containing thousands of gallons of beer, with nopH adjustments and only approximate temperature control (reactors are cooledwith well water). As a consequence of the absence of pH control and the pro-duction of CO
2
, the pH drops steadily during the fermentation and ends up below4.0. Furthermore, the yeast withstand extreme environmental stresses includinghigh osmolality (beginning solids of 25–30% or higher) and high ethanol con-centrations (final concentrations of 12–18% vol.), as well as organic acids pro-duced by contaminating bacteria. The constant contamination of the fermentationis a consequence of the need to run the process in an “open system”— non-aseptically — because the fermentation volumes are quite large and the sellingprofit margin for ethanol is very low. Fortunately, most bacterial contaminantsdo not grow below pH 4, and the ability of yeast to do so provides a naturalmethod of suppressing the growth of these contaminants.
Environmental stresses are additive and often synergistic in nature, whichmeans that a combination of many minor stresses, from the perspective of theyeast, equals a single large stress. For example, yeast have reduced tolerance toethanol at higher temperatures and reduced tolerance to organic acids at lowerpH. Despite all of these challenges,
S. cerevisiae
produces ethanol at rates inexcess of 3 g l
–1
h
–1
and at yields close to 95% of the theoretical maximum. Effortsin the yeast research field are directed at developing strains that produce lessglycerol, grow at slightly elevated temperatures (38°C), and withstand even higherethanol concentrations.
TABLE 4.1Energy Yield of Fermenting Glucose to Ethanol
Mass (g)
∆
H°
c
(kJ/mol)
a
–1 glucose 180 2807+2 ethanol 2(46) 2(1369)+2 CO
2
2(44) 0Sum 0 –69Yield (ethanol/glucose) 0.51 g/g 0.975 kJ/kJ
a
Heat of combustion data from Roels [48].
DK9448_C004.fm Page 65 Monday, April 17, 2006 8:06 AM
© 2006 by Taylor & Francis Group, LLC

66
Alcoholic Fuels
PROCESSES FOR CONVERTING CORN TO ETHANOL
W
ET
-M
ILLING
AND
D
RY
-G
RIND
C
ORN
P
ROCESSES
FOR
E
THANOL
F
ERMENTATION
Corn is prepared for ethanol fermentation by either wet milling [20] or drygrinding [16] (Figure 4.4). One quarter of the ethanol produced in the UnitedStates comes from large-capacity wet-milling plants, which produce ethanol alongwith a variety of valuable coproducts such as pharmaceuticals, nutriceuticals,organic acids, and solvents. Dry-grind facilities, which account for the remainderof domestic ethanol production, are designed specifically for production of eth-anol and animal feed coproducts. Due to the relatively lower capital cost of dry-grind plants and the spread of ethanol plants out of the heart of the U.S. cornbelt,new plants under development and construction are dry-grind facilities.
FIGURE 4.4
Wet-milling and dry-grind ethanol production processes. Courtesy ofNational Corn-to-Ethanol Research Center.
Corn
Enzyme
Enzyme
Yeast
Corn
Enzyme
EnzymeYeast
Mill
Liquify Liquify
Steep
Saccharifyand Ferment
(SSF)
Distill Distill
Ferment
Saccharify
Dehydrate Dehydrate
Dry DrySolids Solids
CO2
CO2
Oil
DistillersDry
Grains
CornGlutenFeed
CornGlutenMeal
GlutenSeparation
Degerm /Defiber Fibers
ETHANOL ETHANOL
DRY GRIND WET MILL
DK9448_C004.fm Page 66 Monday, April 17, 2006 8:06 AM
© 2006 by Taylor & Francis Group, LLC

The Corn Ethanol Industry
67
Although both the dry-grind and wet-mill processes produce ethanol, theyare very different processes. In dry grinding, dry corn is ground whole andfermented straight through to ethanol. The only coproduct, distillers dry grainswith solubles (DDGS), is sold as animal feed. DDGS, which consists of the driedresidual materials from the fermentation, contains the nonfermentable parts ofthe corn and the yeast produced during the fermentation. CO
2
can also be collectedand sold to soft-drink producers, but represents a low-profit and limited market.
In wet milling, by contrast, corn kernels are fractionated into each of theirmajor individual components: starch, gluten, germ, and fiber. This imparts twovery important advantages compared to dry grinding. First, the parts of the corncan each be marketed separately. So, the germ is used to produce corn oil, thegluten is sold as a high-protein feed to the poultry industry, and the fiber iscombined with liquid streams, dried, and sold as a low-protein animal feed.Second, the wet mill produces a pure starch steam, which allows for the starchto be made into numerous different products. In addition to being fermented toethanol, the starch can be modified for use in textiles, paper, adhesives, or food.Maltodextrins and high-fructose corn syrup, the major sweetener used by the U.S.food industry, are made enzymatically from starch. The starch can also be con-verted enzymatically to a fairly pure glucose stream and then fermented to anynumber of products. A partial list includes amino acids, vitamins, artificial sweet-eners, citric acid, and lactic acid, in addition to ethanol. If ethanol is produced,the yeast can be spray-dried and marketed as distillers yeast, a high-protein, low-fiber product suitable for feeding animals and fishes. Although no wet mill makesall of these products, it is not unusual for large facilities to have multiple starchproduct streams.
Dry-grind plants do not have the capability to ferment corn starch to theseproducts in part because the additional products are nonvolatile and, therefore,cannot be simply separated by distillation from all of the other material in thefermentation. In summary, a wet mill that converts all its starch to ethanol producesat least two or three additional high-value products compared to a dry-grindfacility. Of course, these additional products are realized only with much highercapital expenses. As discussed later in this chapter, there are several efforts under-way to develop less capital-intensive processes for either totally or partial frac-tionating corn that would be suitable for implementation at dry-grind facilities.
D
RY
-G
RIND
E
THANOL
P
RODUCTION
Starch Conversion
Corn is received at the plant and separated from the chaff, and the kernels aremilled to a coarse flour. Particle sizing is a compromise between grinding fineenough to provide increased surface area (to make starch granules available forswelling and hydrolysis), yet large enough to allow separation of residual solidsfrom the liquid. The corn meal is mixed with water, and the resulting mash isadjusted to pH 6 and then mixed with alpha-amylase. The mash is heated above
DK9448_C004.fm Page 67 Monday, April 17, 2006 8:06 AM
© 2006 by Taylor & Francis Group, LLC
68
Alcoholic Fuels
110°C in a jet cooker using direct steam. A jet cooker is in essence a pipe witha narrowing and a steam inlet directly upstream. The narrowing is carefullyengineered to provide maximum mixing of the starch slurry with steam, and alsoto cause shearing, which aids in thinning the starch. Upon exiting the jet cooker,the corn slurry enters a holding column where the mixture is kept at 110°C for15 minutes. From the holding column, the slurry enters a flash tank at atmosphericpressure and 80–90°C. Additional alpha-amylase is added and the mash is lique-fied for approximately 30 minutes. The jet cooking and liquefaction steps breakapart the starch granules and reduce the size of the polymers. The shorter mole-cules, termed dextrins, contain approximately five to ten glucose molecules [21].Subsequently, the liquefied mash is cooled to 32°C and the pH is lowered to4.5–5.0 using phosphoric acid and recycled backset from the bottom of the ethanoldistillation column.
Fermentation
Dry yeast is hydrated or conditioned and then added to the mash along withglucoamylase, to initiate simultaneous saccharification and fermentation (SSF).Glucoamylase cleaves the dextrins at
α
-1,4-glucosidic linkages, releasing glucoseand maltose for yeast fermentation. The SSF process reduces the extent of micro-bial contamination because glucose is consumed by yeast as it is formed. TheSSF process also reduces osmotic stress, because the yeast cells are exposed toa relatively lower sugar concentration. The dry-grind ethanol fermentation processlasts for 48 to 72 h and yields approximately 2.7 gallons of ethanol per bushelof corn.
Distillation and Dehydration
At the end of fermentation, the beer contains 10% or more ethanol by volume.Separation of ethanol from the whole fermentation mixture begins with distilla-tion on a beer column [22]. Further removal of water is accomplished in subse-quent distillation steps using a rectifier and/or stripper. Conventional distilla-tion/rectification methods yield 95% pure ethanol, at which concentration ofethanol and water form an azeotrope. The remaining 5% water is removed bymolecular sieves, which rely on size exclusion to separate the smaller ethanolmolecules from water [23]. Finally, anhydrous (100% or 200 proof) ethanol isdenatured, typically with 5% gasoline or with higher-chain alcohols formed inthe fermentation, to exempt the ethanol from beverage alcohol taxes.
Stillage Processing and Feed Products
The slurry remaining after distillation of ethanol, known as stillage, is concen-trated by centrifugation. The solids cake is referred to as corn distillers grains.Up to one third of the liquid fraction, known as thin stillage, is recycled (backset)into the mash. The remaining liquid is concentrated by evaporation and mixedwith the corn distillers grains. The mixture is either sold as wet distillers grains
DK9448_C004.fm Page 68 Monday, April 17, 2006 8:06 AM
© 2006 by Taylor & Francis Group, LLC

The Corn Ethanol Industry
69
or dried to generate DDGS. The moisture content and correspondingly short shelf-life of wet distillers grains limit use of this feed product to the immediate vicinityof ethanol plants, though the shelf-life can be lengthened by adding organic acidsas preservatives.
E
THANOL
P
RODUCTION
BY
W
ET
M
ILLING
In contrast to the dry-grind process (where the whole corn kernel is ground andenters the fermenter) in wet milling, the kernel is first fractionated into separatecomponents and only the starch enters the fermenter. Corn wet milling plants areoften referred to as biorefineries, comparable to petroleum refineries, because wetmilling fractionates corn into its components and then processes the componentsinto more valuable products [20]. Wet milling separates the kernel into germ (oil),gluten (protein), fiber, and starch fractions, yielding corn oil, animal feed, and avariety of products derived from starch.
Steeping
The wet-milling process starts with steeping, which enables isolation of thedifferent kernel fractions [20]. Corn is screened to remove foreign material, andsoaked in dilute (0.12–0.20%) sulfurous acid at 52°C for (typically) 30–36 h.
Lactobacillus
and related bacteria growing in the steep water produce lactic acidand other metabolites that further acidify the medium. Steeping occurs in a seriesof large stainless steel tanks, with steep water recirculated countercurrently fromtanks holding “older” corn that is nearing the end of the steeping process to“newer” corn that is beginning the steep. The effect of recycling the steep liquidis the progression of the corn up a SO
2
concentration gradient. The combinedaction of sulfurous acid and lactic acid, and probably also direct effects ofmicrobes growing in the steep, prepare the kernels for processing into fractions.Steeping softens and swells the kernels, disrupts disulfide bonds between theprotein and starch in the endosperm, and releases the starch granules into solution.
Oil, Fiber, and Gluten Separation
After steeping, the germ (which contains most of the corn oil) is dislodged fromthe kernel by gentle disruption using a germ mill. The germ fraction is separatedin hydroclones based upon its low density (high oil content) and then washed toremove loose starch and gluten. The germ is pressed and dried, and the oil iseither extracted on-site or sold to a corn oil refiner. If the oil is extracted on-site,the residual material is blended into corn gluten feed. The slurry exiting thehydroclones is screened to separate fiber from protein (gluten) and starch. Fiberis repeatedly washed and the destarched fiber is incorporated with steepwatersolids and the bottoms of the distillation column into corn gluten feed. Gluten isseparated from starch by centrifugation and dried to produce corn gluten meal.Corn steep liquor, the liquid remaining after removal of kernel components, canalso be sold separately as either a feed or fermentation ingredient.
DK9448_C004.fm Page 69 Monday, April 17, 2006 8:06 AM
© 2006 by Taylor & Francis Group, LLC

70
Alcoholic Fuels
Starch Conversion
Starch is washed to remove residual protein and is converted to a glucosesyrup. First, the starch is jet-cooked and held for liquefaction at 90°C withalpha-amylase. In contrast to the dry-grind process, all of the alpha-amylaseis added prior to jet cooking. Then glucoamylase and pullulanase, a
α
-1
→
6debranching enzyme, are added to convert dextrin polymers to sugars. Additionof pullulanase ensures good conversion of dextrins to glucose by decreasingformation of isomaltose, a glucose dimer. Isomaltose is present at starchpolymer branching points and can also be formed by “reversion” of glucoseto isomaltose in a reaction catalyzed by glucoamylase. After saccharification,glucose is fermented to ethanol by an industrial strain of
S. cerevisiae
. In wetmills, the fermentation is often run using a series of fermenters in a semi-continuous process. Approximately 2.5 gallons of ethanol are produced froma bushel of corn in the wet-milling process.
Coproducts from Wet Milling
As stated previously, wet-milling operations have the capacity and flexibility tomake more products than a dry-grind ethanol facility, because the individual partsof the kernel are fractionated. Products resulting directly from wet milling arecorn oil for cooking, CO2, which may be captured and sold for carbonation ofbeverages, and corn gluten meal and corn gluten feed, which are sold as animalfeeds. Additional products may be obtained from starch, by siphoning part of thesugar stream into alternate products. The product mix from a wet mill can bechanged (within limits) in response to market conditions, and has grown to includeproducts that were formerly synthesized by chemical processes. Alternative fer-mentation products include organic acids, amino acids, sugar alcohols,polysaccharides, pharmaceuticals, nutraceuticals, fibers, biodegradable films, sol-vents, pigments, enzymes, polyols, and vitamins [24]. The simple sugars derivedfrom starch can also be converted enzymatically to sweeteners including highfructose corn syrup, which is the primary food use of corn in the United States.
FUTURE DIRECTIONS IN THE CORN ETHANOL INDUSTRY
There are a number of trends shaping the industry’s future. Wet millers willcontinue to develop value-added products for the starch stream and alternativeuses for corn fiber. The dry-grind industry is looking at fractionating the cornprior to fermentation to realize better value from the corn, and at basic processmodifications for lowering energy use [25, 26]. As is the case for corn fiberderived from wet milling, the dry-grind industry is also seeking alternate usesfor its lowest value product, DDGS.
DK9448_C004.fm Page 70 Monday, April 17, 2006 8:06 AM
© 2006 by Taylor & Francis Group, LLC

The Corn Ethanol Industry 71
ALTERNATIVE FEEDSTOCKS
Corn Fiber
Wet mills have been investigating converting their least valuable residue fromcorn processing (hulls and deoiled germ, known as corn fibers) into ethanol. Cornfiber is an attractive target for value-added research, because its value could beincreased by converting it to ethanol instead of adding it to animal feed. The fiberis generated as a by-product at wet-milling facilities, and so there is no addedcost for collection and transport of the material. Corn fiber contains 11–23%residual starch from wet milling and 12–18% cellulose (w/w, dry basis); theglucose in both polymers could be fermented to ethanol by traditional yeast. Inaddition, corn fiber contains 18–28% xylan and 11–19% arabinan. However,industrial yeast strains currently used for fermenting corn starch do not fermentarabinose and xylose, and the few naturally occurring yeast that do fermentpentoses produce low ethanol yields. Consequently, genetically engineered micro-organisms will be required for efficient conversion of pentose sugars to ethanol[27, 28]. A method to ferment the fiber to ethanol would increase ethanol yieldfrom corn by 10%, while also generating feed coproducts with higher proteincontent [29]. Fermentation of corn fiber is being evaluated by Aventine RenewableEnergy (Pekin, IL) to establish the process economics and robustness [30].
Corn Stover and Alternative Starches
When corn is harvested in the field, only the grain is collected for transport andsale. However, the rest of the corn plant — stalks, cobs, etc. referred to as stover— also contains carbohydrates (58% wt/wt) that could potentially serve as afermentation substrate [31]. For each pound of harvested corn grain, 1.0-1.5pounds of stover are produced, and some estimate that about half of this couldbe harvested without negatively affecting soil quality. However, a number ofconstraints limit utilization of this type of feedstock, and currently there are nocommercial plants that convert corn fiber or stover to ethanol. Instead, growth inproduction of ethanol outside the U.S. corn belt may be driven in the near termby use of alternate starch feedstocks. The Renewable Fuels Association reportsthat 12% of the U.S. domestic sorghum crop was fermented to ethanol in 2004.Starch from wheat, barley, rye, and cassava, and sucrose from sugar cane andsugar beets, are also fermented to ethanol around the world. Other crops such ashulless barley, field peas, and even cattails have been explored as fermentationfeedstocks. In addition, ethanol fermentation can be used as an alternative towaste disposal for residues such as whey and potato processing solids in somelocalities.
Other Types of Biomass
Displacement of petroleum by fuel ethanol is approaching 3% of the liquidtransportation fuel used in the United States. Expanding ethanol to replace more
DK9448_C004.fm Page 71 Monday, April 17, 2006 8:06 AM
© 2006 by Taylor & Francis Group, LLC
72 Alcoholic Fuels
than 10% of fuel needs will require development of additional and lower-costfeedstocks. Only lignocellulosic biomass is available in sufficient quantities toaugment starch as an ethanol feedstock source. As discussed previously, cornfiber and corn stover are potential sources of lignocellulosic biomass for fermen-tation. Other possible feedstocks are agricultural residues such as wheat and ricestraws and sugar cane bagasse, energy crops including switch grass and softwoodtrees, and waste materials such as pulp and paper sludge and recycled officepaper. The capacity to process and ferment even one of these categories of biomasswould significantly increase production of ethanol; however, practical aspects ofcollection and storage must be addressed for many of these resources.
Several technological constraints limit fermentation of biomass feedstocks.Lignocellulosic biomass can be pretreated and enzymatically hydrolyzed to yielda mixture of sugars including glucose, galactose, arabinose, and xylose [32].However, hydrolytic enzymes are inefficient and expensive. More-effective pre-treatment methods, as well as active and cost-effective enzymes, are needed foran economical process. As mentioned previously, microbes that efficiently fer-ment multiple sugars to ethanol must be developed in order to convert biomassto ethanol. Fermenting microbes also must tolerate the inhibitory compoundsgenerated during biomass hydrolysis, or alternatively, cost-effective methods forinhibitor abatement must be in place. A study comparing dry-grind productionof ethanol from corn and ethanol produced from corn stalks concluded thatproducing ethanol from corn stover would cost $1.45 per gallon compared to$0.96 from corn starch [33]. Despite these obstacles, one company, Iogen Corp.(Ottawa) has begun to produce ethanol from biomass.
NEW PRODUCTS FROM WET-MILLED CORN STARCH
Corn wet mills have a long history of converting starch to a wide variety ofproducts in addition to or instead of ethanol. As described above in the discussionof wet milling, starch products from wet milling also have many applicationsbeyond the food and beverage industries in pharmaceutical, cosmetic, paper, andpackaging industries. Recently, corn wet millers have begun to adopt processesfor converting starch into biodegradable polymers. Such products represent afundamental shift from other nonethanol products, because they directly competewith petroleum-based products and have the potential for virtually unlimitedgrowth. A number of corn processors in the United States have a biopolymereither on the market or under development. Cargill Dow produces PLA (polylac-tide) polymer fiber under the trade name NatureWorks, for use in packaging,films, and resins. ADM and Metabolix have formed an alliance to scale-up andcommercialize PHA (polyhydroxyalkanoate) polymers, for marketing as renew-able alternatives to traditional petrochemical plastics used in making moldedgoods, films, and coated papers. A joint venture between DuPont and Tate andLyle was formed to produce 1,3-propanediol (Bio-PDO™) from corn starch asan alternative to petrochemically-derived PDO. Sorona®, a family of polymersmade from PDO, is used in fibers and fabrics, films, and resins.
DK9448_C004.fm Page 72 Monday, April 17, 2006 8:06 AM
© 2006 by Taylor & Francis Group, LLC

The Corn Ethanol Industry 73
MODIFYING THE CORN DRY-GRIND PROCESS
Quick Fiber and Quick Germ Processes
As mentioned earlier in the discussion of dry-grind technology, the dry-grindprocess is being adapted to capture some of the advantages of the wet-millingsystem. The Quick Germ [34] and Quick Fiber [35] fractionation methodsincrease processing efficiency as well as the value of feed coproducts. Thesemethods add technology to the beginning of the dry-grind process, removing thegerm and fiber fractions of the corn kernel prior to starch processing. First, thecorn is soaked in water for 3–12 hours to hydrate the germ, which is recoveredby density separation. Next, the specific gravity of the mash is adjusted andpericarp fiber is recovered using hydrocyclones. The starch is then fermented inthe traditional dry-grind process, and the germ and fiber can be processed sepa-rately into other value-added products: corn oil (from germ) and corn fiber oiland corn fiber gum (from corn fiber). Corn fiber oil, which is distinct fromtraditional corn germ oil, is potentially a valuable coproduct because it containsphytosterols known to have cholesterol-lowering properties. Another process,known as enzymatic milling or the E-mill process, refers to the addition ofproteases and amylases prior to germ separation [36]. E-milling allows recoveryof the gluten, while avoiding a full steeping process and the health and environ-mental concerns associated with sulfite.
Because the germ and fiber do not enter the fermenter, the fermentationresiduals have lower fiber content and correspondingly higher protein content,resulting in a higher-value feed product. On the process side, these modifiedmilling technologies increase the effective capacity of fermentation tanks, becauseremoval of the germ and fiber frees reactor volume for additional starch. Bringingthese modified processes to the dry-grind plant would therefore increase thefacility’s ethanol production by 8 to 27% [37].
Very-High-Gravity Fermentations
A laboratory process to ferment highly concentrated mash, with greater than 30%solids, has been developed [38]. Very-high-gravity (VHG) fermentations produce21 to 23% ethanol under optimal fermentation conditions. The VHG processrequires a mash with high sugar concentration and low viscosity, which can beachieved by adding enzymes (e.g., proteases, glucanases, and amylases) or bydouble mashing, in which the solids are removed from an initial mash, and theliquids are used to prepare the second (VHG) extract. VHG fermentations useless water than conventional fermentations. Energy costs also decrease becausethere is less volume to cool for fermentation and then distill.
New Processing Technology to Decrease Energy Use
“Cold saccharification” technology allows enzymatic release of glucose fromstarch without liquefaction (e.g., jet-cooking) with steam. Laboratory-scale
DK9448_C004.fm Page 73 Monday, April 17, 2006 8:06 AM
© 2006 by Taylor & Francis Group, LLC

74 Alcoholic Fuels
alcohol fermentation of ground rice without cooking was reported in 1963 [39]and an industrial-scale fermentation was reported in 1982 [40]. Use of very highsolid concentrations improved productivity and yielded high concentrations ofethanol. In 2004, commercial technologies for direct conversion of raw starch toethanol were developed for use in modern dry-grind ethanol fermentation facil-ities [41, 42]. A key to cold-process technology is the development of robust andefficient conversion enzymes [43]. The benefits of a no-cook process includereduced energy, water, and waste costs, reduced capital and related maintenanceexpenses, improved conversion efficiency resulting in increased ethanol yield,and increased protein content and quality of feed coproducts. Possible drawbacksto the technology include the cost and amount of enzyme required for the processand an increased chance for microbial contamination and corresponding loss ofyield, because heating to partially pasteurize the mash does not occur. Heatingthat occurs in the standard dry-grind ethanol process also aids release of starchthat is bound to fiber or protein, and inactivates some toxins that may be presentin the grain. The no-cook method must manage these issues by means of alternatetechnologies [44]. Widespread adoption of cold-hydrolysis technology stands togreatly impact the productivity and profitability of the ethanol industry.
ALTERNATE USES FOR DDGS
With regard to feed coproducts, there is a need to diversify the markets for DDGS.Research aimed at modifying the amino acid composition, protein composition,and phosphorous content of DDGS should result in higher quality, consistentcomposition of feed ingredients and encourage expanded use of DDGS in poultryand swine rations. Nonfeed uses for DDGS have also been developed, promptedby the increased availability of DDGS resulting from increased ethanol produc-tion. Deicers, cat litter, and lightweight “ag-fiber” shipping containers can beproduced from DDGS. DDGS could also be used to produce biogas, which couldbe recovered and used on-site to fuel the plant [26]. A plant fueled in this waywould be less dependent on feed selling prices and power and natural gas purchaseprices.
ZEIN PROTEIN FROM CORN DRY GRINDING OR WET MILLING
Zein is a biodegradable resin that has value for food and cosmetic uses, however,currently available methods for recovering and purifying zein protein from cornare too expensive to compete with petroleum-based films and plastics. The COPE(corn oil and protein extraction) process is being developed to inexpensivelyextract zein protein from either milled corn or DDGS, for use in the plastic andfilm-packaging industries [45]. Achieving cost-effective methods for extractionof zein and synthesis of zein-based biodegradable polymers could add value toDDGS and the nonstarch fraction of corn.
DK9448_C004.fm Page 74 Monday, April 17, 2006 8:06 AM
© 2006 by Taylor & Francis Group, LLC
The Corn Ethanol Industry 75
HYBRID AND STRAIN DEVELOPMENT
“Self-processing” hybrid corn kernels are being developed. This type of hybridaccumulates starch-hydrolyzing enzymes in the endosperm of transgenic cornkernels [46]. Work has also been carried out to construct fermenting yeast strainswith built-in amylolytic activity [47]. Using these strategies, genes for enzymeswith known properties and specificities could be used to engineer customizedgrains and/or yeast. Self-processing grains or starch-degrading and fermentingyeast would thus have built-in enzymatic activities designed to meet specificprocessing requirements. Other genetically modified corn hybrids are being devel-oped to generate alternate starches and complex carbohydrates. Starch from thesehybrids would have improved gelling properties, viscosity, flavor, stability, adhe-sion, film formation, or properties that enhance the efficiency of starch processing.
CONCLUSIONS
Use of ethanol, a renewable transportation fuel, is expected to expand significantlybecause of concerns regarding the environment and energy security. The U.S.ethanol industry will continue to utilize corn as its primary source of fermentablesugar. New feedstocks, technologies, and products moving from the laboratoryto the marketplace will increase the productivity and viability of the fuel ethanolindustry.
REFERENCES
1. Berg, C., World Fuel Ethanol Anaylsis and Outlook, F.O. Licht, Kent, U.K., 2004.2. Kovarik, B., Henry Ford, Charles F. Kettering and the fuel of the future, Automot.
Hist. Rev., 32, 7–27, 1998. 3. Shapouri, H., Duffield, J.A. and Graboski, M.S., Estimating the net energy balance
of corn ethanol, Agric. Econ. Rep. 721. U.S. Department of Agriculture, Wash-ington, DC, 1995.
4. Kim, S. and Dale, B.E., Allocation procedure in ethanol production system fromcorn grain. I. System expansion, Int. J. Life Cycle Assessment, 7, 237–243, 2002.
5. Wang, M., Saricks, C. and Santini, D., Effects of fuel ethanol use on fuel-cycleenergy and greenhouse gas emissions. ANL/ESD-38, U.S. Department of EnergyArgonne National Laboratory Center for Transportion Research, 1999.
6. Shapouri, H. and McAloon, A., The 2001 net energy balance of corn-ethanol, InCorn Utilization and Technology Conference Proceedings, Tumbleson, M., Ed.,Nat. Corn Growers Assoc., Indianapolis, 2004.
7. Shapouri, H., Duffield, J. A. and Wang, M. The energy balance of corn ethanol:an update, Agric. Econ. Rep. 813, 2002.
8. Urbanchuk, J.M. and Kapell, J., Ethanol and the Local Community, AUS Con-sultants, SJH & Company, Moorestown, NJ, Boston, 2002.
9. Kotrba, R., State legislation roundup and review, Ethanol Prod. Mag., 11, 34–41,52–55, 2005.
DK9448_C004.fm Page 75 Monday, April 17, 2006 8:06 AM
© 2006 by Taylor & Francis Group, LLC
76 Alcoholic Fuels
10. Watson, S. A., Description, development, structure, and composition of the cornkernel, In Corn: Chemistry and Technology, 2nd Ed., White, P.J. and Johnson,L.A., Eds. American Association of Cereal Chemists, St. Paul, MN, 2003, 69–106.
11. Haefele, D.; Owens, F., O’Bryan, K. and Sevenich, D., Optimization of cornhybrids for fuel ethanol production., In Proceedings of the ASTA 59th AnnualCorn and Sorghum Research Conference, CD-ROM, Amer. Seed Trade Assoc.,Alexandria, VA, 2004.
12. Dien, B.S., Bothast, R.J., Iten, L.B., Barrios, L. and Eckhoff, S.R., Fate of Btprotein and influence of corn hybrid on ethanol production., Cereal Chem., 79,582–585, 2002.
13. Bothast, R.J., New technologies in biofuel production., Agric. Outlook Forum,2005.
14. Anonymous, New Pioneer, NCGA technology available, Ethanol Prod. Mag., 10,10, 2004.
15. Boyer, C.D. and Shannon, J.C., Carbohydrates of the kernel., In Corn Chemistryand Technology, 2nd Ed., White, P.J. and Johnson, L.A., Eds., American Associ-ation of Cereal Chemists, St. Paul, MN, 2003, pp. 289–311.
16. Kelsall, D.R. and Lyons, T.P., Grain dry milling and cooking procedures: Extract-ing sugars in preparation for fermentation, In The Alcohol Textbook, 4th Ed.,Jacques, K.A., Lyons, T.P. and Kelsall, D.R., Eds., Nottingham University Press,Nottingham, U.K., 2003, pp. 9–21.
17. Power, R.F., Enzymatic conversion of starch to fermentable sugars., In The AlcoholTextbook, 4th Ed., Jacques, K.A., Lyons, T.P. and Kelsall, D.R., Eds. NottinghamUniversity Press, Nottingham, U.K., 2003, pp. 23–32.
18. Futcher, B., Latter, G.I., Monardo, P., McLaughlin, C.S. and Garrels, J.I., Asampling of the yeast proteome, Molec. Cell. Biol. 19, 7357–7368, 1999.
19. Russell, I., Understanding yeast fundamentals, In The Alcohol Textboo, 4th Ed.,Jacques, K.A., Lyons, T.P., and Kelsall, D.R., Eds., Nottingham University Press,Nottingham, U.K., 2003, pp. 85–119.
20. Johnson, L.A. and May, J.B., Wet milling: The basis for corn biorefineries, InCorn: Chemistry and Technology, 2nd Ed., White, P.J. and Johnson, L.A., Eds.,American Association of Cereal Chemists, St. Paul, MN, 2003, pp. 449–494.
21. Kennedy, J.F., Knill, C.J. and Taylor, D.W., Maltodextrins, In Handbook of StarchHydrolysis Products and Their Derivatives, Kearsley, M.W. and Dziedzic, S.Z.,Eds., Blackie Academic & Professional: Glasgow, 1995, pp. 65–82.
22. Madson, P.W., Ethanol distillation: the fundamentals, In The Alcohol Textbook,4th Ed., Jacques, K.A., Lyons, T.P. and Kelsall, D.R., Eds., University of Notting-ham Press, Nottingham, U.K., 2003, pp. 319–336.
23. Bibb Swain, R.L., Development and operation of the molecular sieve: an industrystandard, In The Alcohol Textbook, 4th Ed., Jacques, K.A., Lyons, T.P. and Kelsall,D.R., Eds., University of Nottingham Press: Nottingham, U.K., 2003, pp. 337–341.
24. Leathers, T.D., Upgrading fuel ethanol coproducts, SIM News 48, 210–217, 1998.25. Dien, B.S., Bothast, R.J., Nichols, N.N. and Cotta, M.A., The U.S. corn ethanol
industry: An overview of current technology and future prospects, Int. Sugar J.,104, 204–211, 2002.
26. Belcher, A., The world looks to higher-tech to advance fuel ethanol productioninto the 21st century, Int. Sugar J., 107, 196–199, 2005.
27. Dien, B.S., Cotta, M.A. and Jeffries, T.W., Bacteria engineered for fuel ethanolproduction: Current status, Appl. Microbiol. Biotechnol., 63, 258–266, 2003.
DK9448_C004.fm Page 76 Monday, April 17, 2006 8:06 AM
© 2006 by Taylor & Francis Group, LLC

The Corn Ethanol Industry 77
28. Jeffries, T.W. and Jin, Y.-S., Metabolic engineering for improved fermentation ofpentoses by yeast, Appl. Microbiol. Biotechnol., 63, 495–509, 2004.
29. Gulati, M., Kohlmann, K., Ladisch, M.R., Hespell, R.B. and Bothast, R.J., Assess-ment of ethanol production options for corn products, Bioresource Tech., 58,253–264, 1997.
30. Mosier, N.S., Hendrickson, R., Brewer, M., Ho, N., Sedlack, M., Dreshel, R.,Welch, G., Dien, B.S., Aden, A. and Ladisch, M.R., Industrial scale-up of pH-controlled liquid hot water pretreatment of corn fiber for fuel ethanol production,Appl. Biochem. Biotechnol., 125, 77–98, 2005.
31. Wyman, C.E., Applications of corn stover and fiber, In Corn Chemistry andTechnology, 2nd Ed., White, P.J. and Johnson, L.A., Eds., American Associationof Cereal Chemists, St. Paul, MN, 2003, pp. 723–750.
32. Grohmann, K. and Bothast, R.J., Saccharification of corn fibre by combinedtreatment with dilute suphuric acid and enzymes, Process Biochem., 32, 405–415,1997.
33. Wallace, R., Ibsen, K., McAloon, A. and Yee, W., Feasibility study for co-locatingand integrating ethanol production plants from starch and lignocellulosic feed-stock, U.S. Department of Agriculture and U.S. Department of Energy, NationalRenewable Energy Laboratory Technical Report, 2004.
34. Singh, V. and Eckhoff, S.R., Effect of soak time, soak temperature, and lactic acidon germ recovery parameters, Cereal Chem., 73, 716–720, 1996.
35. Singh, V., Moreau, R.A., Doner, L. W., Eckhoff, S.R. and Hicks, K.B., Recoveryof fiber in the corn dry grind ethanol process: a feedstock for valuable coproducts,Cereal Chem., 76, 868–872, 1999.
36. Johnston, D.B. and Singh, V., Enzymatic milling of corn: Optimization of soaking,grinding, and enzyme incubation steps, Cereal Chem., 81, 626–632, 2004.
37. Singh, V., Johnston, D.B., Naidu, K., Rausch, K.D., Belyea, R.L. and Tumbleson,M.E., Comparison of modified dry-grind corn processes for fermentation charac-teristics and DDGS composition, Cereal Chem., 82, 187–190, 2005.
38. Thomas, K.C., Hynes, S.H. and Ingledew, W.M., Practical and theoretical consid-erations in the production of high concentrations of alcohol by fermentation,Process Biochem., 31, 321–331, 1996.
39. Yamasaki, I., Ueda, S. and Shimada, T., Alcoholic fermentation of rice withoutprevious cooking by using black-koji amylase, J. Ferm. Assoc. Jpn., 21, 83–86,1963.
40. Matsumoto, N., Fukushi, O., Miyanaga, M., Kakihara, K., Nakajima, E. andYoshizumi, H. Industrialization of a noncooking system for alcoholic fermenationfrom grains, Agric. Biol. Chem., 46, 1549–1558, 1982.
41. Swanson, T., Partnering in progress, Ethanol Prod. Mag., 10, 62–68, 2004.42. Berven, D., The making of Broin Project X, Ethanol Prod. Mag., 11, 67–71, 2005.43. Wong, D. and Robertson, G., Applying combinatorial chemistry and biology to
food research, J. Agric. Food Chem., 52, 7187–7198, 2004.44. Galvez, A., Analyzing cold enzyme starch hydrolysis technology in new ethanol
plant design, Ethanol Prod. Mag., 11, 58–60, 2005.45. Cheryan, M., Corn oil and protein extraction method, U.S. Patent 6,433,146, 2002.46. Craig, J.A., Batie, J., Chen, W., Freeland, S.B., Kinkima, M. and Lanahan, M.B.,
Expression of starch hydrolyzing enzymes in corn, In Corn Utilization and Tech-nology Conference Proceedings, Tumbleson, M., Ed., National Corn GrowersAssociation and Corn Refiners Association, Indianapolis, 2004.
DK9448_C004.fm Page 77 Monday, April 17, 2006 8:06 AM
© 2006 by Taylor & Francis Group, LLC

78 Alcoholic Fuels
47. Shigechi, H., Koh, J., Fujita, Y., Matsumoto, T., Bito, Y., Ueda, M., Satoh, E.,Fukuda, H. and Kondo, A., Direct production of ethanol from raw corn starch viafermentation by use of a novel surface-engineered yeast strain codisplaying glu-coamylase and α-amylase, Appl. Environ. Microbiol., 70, 5037–5040, 2004.
48. Roels, J.A., Macroscopic theory, and microbial growth and product formation, InEnergetics and Kinetics in Biotechnology, Elsevier Biomedical Press, Amsterdam,1983, pp. 23–73.
DK9448_C004.fm Page 78 Monday, April 17, 2006 8:06 AM
© 2006 by Taylor & Francis Group, LLC

79
5
Development of Alfalfa (
Medicago sativa
L.) as a Feedstock for Production of Ethanol and Other Bioproducts
Deborah A. Samac, Hans-Joachim G. Jung, and JoAnn F. S. Lamb
USDA-ARS-Plant Science Research, University of Minnesota, St. Paul
CONTENTS
Current Alfalfa Cultivation and Utilization ........................................................80Development and Cultivation of Alfalfa for Biomass........................................82Chemical Composition of Alfalfa.......................................................................83Genetic Impacts on Composition .......................................................................86Alfalfa Leaf Meal................................................................................................87Protein and Fiber Separation ..............................................................................87Pretreatment of Alfalfa Fiber ..............................................................................88Conversion Response after Dilute Acid Pretreatment........................................89Alfalfa Biotechnology and Genomics ................................................................90Conclusions .........................................................................................................93Acknowledgments ...............................................................................................94References ...........................................................................................................94
Alfalfa (
Medicago sativa
L.) has considerable potential as a feedstock for pro-duction of fuels, feed, and industrial materials. However, unlike other major fieldcrops such as corn and soybeans, which are commonly refined for production offuel and industrial materials, refining of alfalfa remains undeveloped. Instead,alfalfa is primarily processed and used on-farm in the form of dried hay, silage,and fresh forage known as “greenchop,” or is grazed by animals in pastures. In
DK9448_C005.fm Page 79 Tuesday, March 28, 2006 2:55 PM
© 2006 by Taylor & Francis Group, LLC

80
Alcoholic Fuels
many countries, including the United States, alfalfa is used as a basic componentin feeding programs for dairy cattle and is an important feed for beef cattle,horses, sheep, and other livestock. Known as the “Queen of the Forages,” alfalfaprovides highly nutritious forage in terms of protein, fiber, vitamins, and mineralsfor ruminant animals. If alfalfa is developed to its full potential as a feedstockfor biorefining, a major shift may occur in the manner in which alfalfa is producedand used for feeding farm animals.
CURRENT ALFALFA CULTIVATION AND UTILIZATION
A number of attributes make alfalfa an attractive crop for production of biofuelsand for biorefining. Alfalfa has a long history of cultivation around the world. Itwas introduced several times into North America during the 1700s and 1800sand is currently grown across the continent (Russelle, 2001). In the United States,alfalfa is the fourth most widely grown crop with over 9.3 million hectares ofalfalfa harvested in 2003 (USDA-NASS, 2004). It is a perennial plant that istypically harvested for four years (an establishment year plus three subsequentyears). Depending on location, alfalfa is harvested three or more times each yearby cutting the stems near ground level. On average across the United States,alfalfa yields 7.8 Mg of dry matter (DM) per hectare each year, although yieldscan vary by location from 3.4 (North Dakota) to 18.4 (Arizona) Mg ha
–1
(USDA-NASS, 2004). In 2003 the national harvest of alfalfa was over 69 million metrictons (USDA-NASS, 2004). The technology for cultivation, harvesting, and storingalfalfa is well established, machinery for harvesting alfalfa is widely available,and farmers are familiar with alfalfa production. There is a well-developed indus-try for alfalfa cultivar development, seed production, processing, and distribution.Alfalfa breeders have utilized the extensive germplasm resources of alfalfa tointroduce disease and insect resistance, expand environmental adaptation, andimprove forage quality. Nonetheless, alfalfa cultivation requires fertile, deep,well-drained soils of near neutral pH and is limited to humid areas with adequaterainfall. In arid or semi-arid areas, irrigation is essential for crop production.Despite breeding efforts that have increased disease and pest resistance, alfalfayields have not increased substantially over the past 25 years (Brummer, 1999).
The high biomass potential of alfalfa is based on underground, typicallyunobserved traits. Alfalfa develops an extensive, well-branched root system thatis capable of penetrating deep into the soil. Root growth rates of 1.8 m a yearare typical in loose soils (Johnson et al., 1996) and metabolically active alfalfaroots have been found 18 m or more below ground level (Kiesselbach et al.,1929). This deep root system allows alfalfa plants to access water and nutrientsthat are not available to more shallowly rooted annual plants, which enablesestablished alfalfa plants to produce adequate yields under less than optimalrainfall conditions. Alfalfa roots engage in a symbiotic relationship with the soilbacterium
Sinorhizobium meliloti
. This partnership between the plant and
DK9448_C005.fm Page 80 Tuesday, March 28, 2006 2:55 PM
© 2006 by Taylor & Francis Group, LLC
Development of Alfalfa as a Feedstock for Production of Ethanol
81
bacterium results in the formation of a unique organ, the root nodule, in whichthe bacterium is localized. The bacteria in root nodules take up nitrogen gas (N
2
)and “fix” it into ammonia. The ammonia is assimilated through the action ofplant enzymes to form glutamine and glutamate. The nitrogen-containing amidegroup is subsequently transferred to aspartate and asparagine for transportthroughout the plant. On average, alfalfa fixes approximately 152 kg N
2
ha
–1
onan annual basis as a result of biological nitrogen fixation, which eliminates theneed for applied nitrogen fertilizers (Russelle and Birr, 2004). Although a signif-icant proportion of the fixed nitrogen is removed by forage harvest, fixed nitrogenis also returned to the soil for use by subsequent crops. This attribute of increasingsoil fertility has made alfalfa and other plants in the legume family crucialcomponents of agricultural systems worldwide. Cultivation of alfalfa has alsobeen shown to improve soil quality, increase organic matter, and promote waterpenetration into soil.
Responsible stewardship of agricultural lands has never been more important.Utilization of alfalfa as a biomass crop has numerous environmental advantages.There is an urgent need to increase the use of perennials in agricultural systemsto decrease erosion and water contamination. Annual row crop production hasbeen shown to be a major source of sediment, nutrient (nitrogen and phosphorus),and pesticide contamination of surface and ground water. Perennial crops suchas alfalfa can reduce the nitrate concentrations in soil and drainage water, andprevent soil erosion (Huggins et al., 2001). In addition, energy costs associatedwith production of alfalfa are low. A recent study shows that energy inputs forproduction of alfalfa are far lower than for production of corn and soybean, andvery similar to switchgrass (Kim and Dale, 2004), primarily because alfalfa doesnot require nitrogen fertilizer. Biorefining could increase the return on alfalfaproduction so that cultivation of the crop is more economically attractive, as wellas environmentally beneficial.
An additional advantage of using alfalfa for biofuel production compared toother crops is the ability to easily separate leaves and stems to produce co-products. In fact, alfalfa herbage can almost be considered two separate cropsbecause leaves and stems differ so dramatically in composition. On a dry weightbasis, total alfalfa herbage contains 18–22% protein with leaves containing26–30% protein and stems only 10–12% (Arinze et al., 2003). In some analyses,alfalfa protein has been valued highly, theoretically greatly reducing the cost ofthe lignocelluose fraction (Dale, 1983). Several different integrated processes forrefining alfalfa have been proposed based primarily on the method of refiningthe protein fraction. From field-dried hay, leaves may be separated from stemmaterial mechanically (see “Protein and Fiber Separation” below). The leaf mealcould be used as a high-protein feed with the stems utilized for gasification andconversion to electricity (Downing et al., 2005) or fermentation to ethanol (Dale,1983). Alternatively, protein could be extracted from total ground material andthe residue used for fermentation. Fresh forage can be “juiced” to remove proteinand the residue fermented to ethanol or other products (Koegel et al., 1999;Sreenath et al., 2001; Weimer et al., 2005). An economic analysis of these
DK9448_C005.fm Page 81 Tuesday, March 28, 2006 2:55 PM
© 2006 by Taylor & Francis Group, LLC
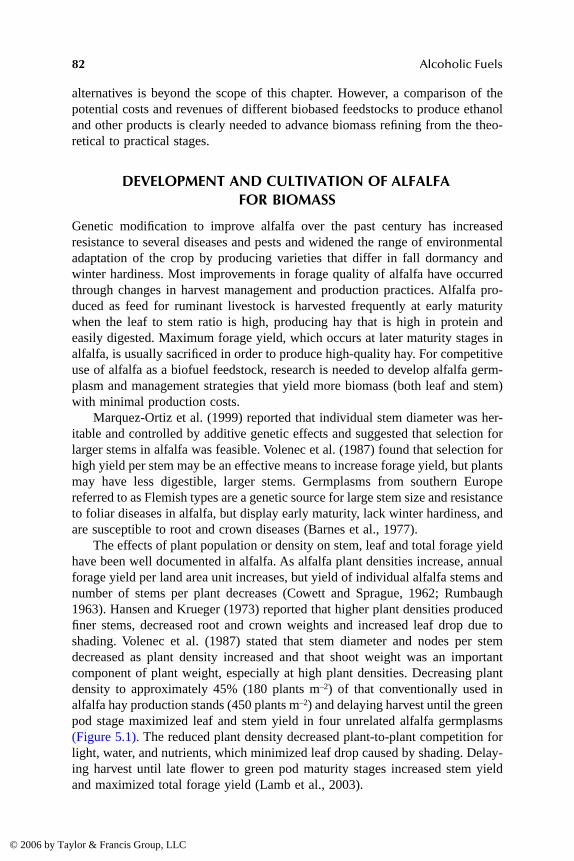
82
Alcoholic Fuels
alternatives is beyond the scope of this chapter. However, a comparison of thepotential costs and revenues of different biobased feedstocks to produce ethanoland other products is clearly needed to advance biomass refining from the theo-retical to practical stages.
DEVELOPMENT AND CULTIVATION OF ALFALFA FOR BIOMASS
Genetic modification to improve alfalfa over the past century has increasedresistance to several diseases and pests and widened the range of environmentaladaptation of the crop by producing varieties that differ in fall dormancy andwinter hardiness. Most improvements in forage quality of alfalfa have occurredthrough changes in harvest management and production practices. Alfalfa pro-duced as feed for ruminant livestock is harvested frequently at early maturitywhen the leaf to stem ratio is high, producing hay that is high in protein andeasily digested. Maximum forage yield, which occurs at later maturity stages inalfalfa, is usually sacrificed in order to produce high-quality hay. For competitiveuse of alfalfa as a biofuel feedstock, research is needed to develop alfalfa germ-plasm and management strategies that yield more biomass (both leaf and stem)with minimal production costs.
Marquez-Ortiz et al. (1999) reported that individual stem diameter was her-itable and controlled by additive genetic effects and suggested that selection forlarger stems in alfalfa was feasible. Volenec et al. (1987) found that selection forhigh yield per stem may be an effective means to increase forage yield, but plantsmay have less digestible, larger stems. Germplasms from southern Europereferred to as Flemish types are a genetic source for large stem size and resistanceto foliar diseases in alfalfa, but display early maturity, lack winter hardiness, andare susceptible to root and crown diseases (Barnes et al., 1977).
The effects of plant population or density on stem, leaf and total forage yieldhave been well documented in alfalfa. As alfalfa plant densities increase, annualforage yield per land area unit increases, but yield of individual alfalfa stems andnumber of stems per plant decreases (Cowett and Sprague, 1962; Rumbaugh1963). Hansen and Krueger (1973) reported that higher plant densities producedfiner stems, decreased root and crown weights and increased leaf drop due toshading. Volenec et al. (1987) stated that stem diameter and nodes per stemdecreased as plant density increased and that shoot weight was an importantcomponent of plant weight, especially at high plant densities. Decreasing plantdensity to approximately 45% (180 plants m
–2
) of that conventionally used inalfalfa hay production stands (450 plants m
–2
) and delaying harvest until the greenpod stage maximized leaf and stem yield in four unrelated alfalfa germplasms(Figure 5.1). The reduced plant density decreased plant-to-plant competition forlight, water, and nutrients, which minimized leaf drop caused by shading. Delay-ing harvest until late flower to green pod maturity stages increased stem yieldand maximized total forage yield (Lamb et al., 2003).
DK9448_C005.fm Page 82 Tuesday, March 28, 2006 2:55 PM
© 2006 by Taylor & Francis Group, LLC
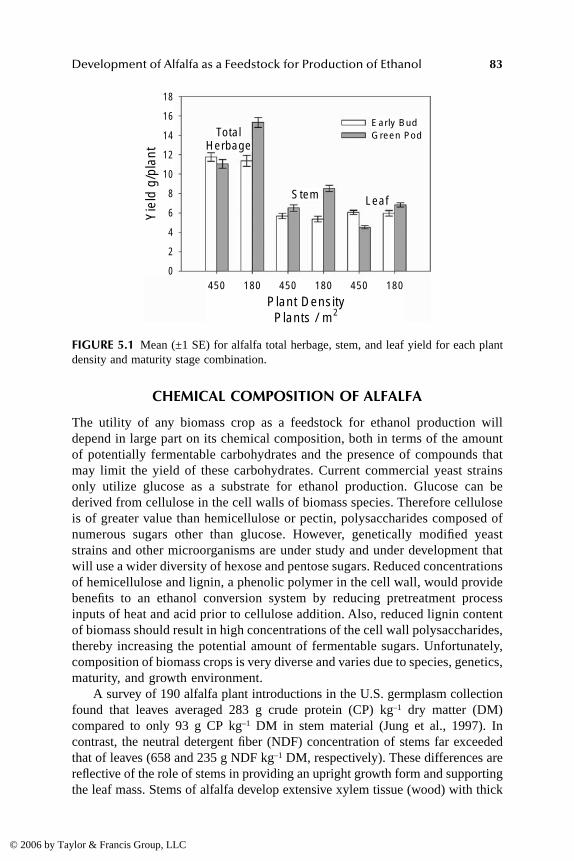
Development of Alfalfa as a Feedstock for Production of Ethanol
83
CHEMICAL COMPOSITION OF ALFALFA
The utility of any biomass crop as a feedstock for ethanol production willdepend in large part on its chemical composition, both in terms of the amountof potentially fermentable carbohydrates and the presence of compounds thatmay limit the yield of these carbohydrates. Current commercial yeast strainsonly utilize glucose as a substrate for ethanol production. Glucose can bederived from cellulose in the cell walls of biomass species. Therefore celluloseis of greater value than hemicellulose or pectin, polysaccharides composed ofnumerous sugars other than glucose. However, genetically modified yeaststrains and other microorganisms are under study and under development thatwill use a wider diversity of hexose and pentose sugars. Reduced concentrationsof hemicellulose and lignin, a phenolic polymer in the cell wall, would providebenefits to an ethanol conversion system by reducing pretreatment processinputs of heat and acid prior to cellulose addition. Also, reduced lignin contentof biomass should result in high concentrations of the cell wall polysaccharides,thereby increasing the potential amount of fermentable sugars. Unfortunately,composition of biomass crops is very diverse and varies due to species, genetics,maturity, and growth environment.
A survey of 190 alfalfa plant introductions in the U.S. germplasm collectionfound that leaves averaged 283 g crude protein (CP) kg
–1
dry matter (DM)compared to only 93 g CP kg
–1
DM in stem material (Jung et al., 1997). Incontrast, the neutral detergent fiber (NDF) concentration of stems far exceededthat of leaves (658 and 235 g NDF kg
–1
DM, respectively). These differences arereflective of the role of stems in providing an upright growth form and supportingthe leaf mass. Stems of alfalfa develop extensive xylem tissue (wood) with thick
FIGURE 5.1
Mean (±1 SE) for alfalfa total herbage, stem, and leaf yield for each plantdensity and maturity stage combination.
450 180 450 180 450 180
Plant DensityPlants / m2
Yie
ld g
/pla
nt
18
16
14
12
10
8
6
4
2
0
TotalHerbage
Stem Leaf
Early BudGreen Pod
DK9448_C005.fm Page 83 Tuesday, March 28, 2006 2:55 PM
© 2006 by Taylor & Francis Group, LLC

84
Alcoholic Fuels
cell walls comprised of cellulose, hemicellulose, pectin, and lignin (Theanderand Westerlund, 1993; Wilson, 1993). Because leaves are the site of most pho-tosynthetic activity in alfalfa, the leaves have high concentrations of enzymesand thin cell walls to facilitate light absorption and gas exchange. Representativecomposition of alfalfa stem material is shown in Table 5.1. Both leaves and stemshave low concentrations of simple sugars and starch (Raguse and Smith, 1966),although alfalfa roots store substantial quantities of starch (150 to 350 g kg
–1
DM) (Dhont et al., 2002). Lipid content of alfalfa is quite low (~20 g kg
–1
DM)(Hatfield et al., 2005).
Because alfalfa is indeterminate in its growth habit, the plants increase insize and mass until harvested or a killing frost occurs. Alfalfa leaf mass increasesduring maturation, but at a lower rate than the increase in stem mass (Sheafferet al., 2000). This results in a decline in leaf percentage in the total herbageharvested that can range from more than 70% leaf during early vegetative stagesto less than 20% leaf when ripe seed is present (Nordkvist and Aman, 1986).During plant maturation, alfalfa leaves change very little in CP or NDF concen-tration whereas stem CP declines and NDF content increases dramatically (Sheaf-fer et al., 2000). The reason for the increase in NDF content of alfalfa stemsduring maturation is the addition of xylem tissue due to cambial activity (Jungand Engels, 2002). This xylem tissue has thick secondary walls and stem xylemaccounts for most cell wall material when the crop is harvested.
Cell walls of alfalfa differ from grass cell wall material because of the greaterpectin content of alfalfa cell walls. In very immature alfalfa stem internodes thatare growing in size, pectins can account for up to 450 g kg
–1
of the cell wall.Cellulose and hemicellulose contribute 340 and 120 g kg
–1
, respectively, to the
TABLE 5.1Composition of Immature (Bud Stage) and Mature (Full Flower) Alfalfa Stem Material
Component Immature Mature
-------------------- g kg
–1
dry matter --------------------
Protein 127 88Lipid 9 7Ash 81 58Soluble carbohydrates 55 49Starch 3 2Cellulose 275 306Hemicellulose 105 122Pectin 125 119Lignin 158 175
Source
: Dien, B.S., Jung, H.G., Vogel, K.P., et al.,
Biomass Bioenergy
, preprint[submitted].
DK9448_C005.fm Page 84 Tuesday, March 28, 2006 2:55 PM
© 2006 by Taylor & Francis Group, LLC

Development of Alfalfa as a Feedstock for Production of Ethanol
85
total cell wall, with lignin accounting for the remaining wall material, in suchyoung internodes (Jung and Engels, 2002). At this developmental stage, all ofthe lignin is localized in the protoxylem vessel cells and no other tissues arelignified. Once alfalfa internodes complete their growth in length, cambiummeristematic activity begins to add new xylem fiber and vessel cells that lignifyalmost immediately. The predominant cell wall component in these tissues iscellulose (400 g kg
–1
cell wall) with the rest of the cell wall material being equallydivided among hemicellulose, pectin, and lignin (Jung and Engels, 2002). Phloemfiber cells also develop thickened secondary cell walls as the plant matures;however, this secondary wall is especially rich in cellulose and does not containlignin (Engels and Jung, 1998). Lignin is deposited in a unique ring structure inthe primary wall region of phloem fiber cells. With the exception of pith paren-chyma cells, all of the other tissues in alfalfa (chlorenchyma, collenchyma,epidermis, cambium, secondary phloem, and protoxylem parenchyma) do notlignify no matter how mature the stem becomes (Engels and Jung, 1998). Thesetissues retain only primary cell walls that are rich in pectin. The pith parenchymawill ultimately lignify, although with only marginal secondary wall development,but usually pith parenchyma cells senesce, leaving a hollow stem cavity (Jungand Engels, 2002).
The composition of the major cell wall polysaccharides and lignin also changeduring maturation. Hemicellulose composition shifts from slightly more than 50%xylose residues, with the remainder being primarily to mannose, in very immatureelongating stem internodes to 80% xylose residues in very mature internodes(Jung and Engels, 2002). The composition of the pectin fraction shifts lessdramatically, with uronic acids increasing from 60% of the pectin to 67% withdecreases in galactose and arabinose content, but no change in rhamnose con-centration. The largest shift in cell wall composition due to maturity is in mono-lignol components of lignin. The syringyl-to-guaiacyl ratio increases from 0.29to 1.01 as alfalfa stem internodes mature (Jung and Engels, 2002).
While maturity is the single most important factor that impacts compositionof alfalfa, growth environment causes some additional shifts in composition.Unfortunately these environmental impacts are complex and difficult to predict.In a study by Sanderson and Wedin (1988), alfalfa herbage from a summerregrowth harvest in one year had a substantially higher NDF concentration thanobserved for that year’s spring harvest (538 and 476 g NDF kg
–1
DM, respec-tively); however, the same plots harvested in the following year showed a smalldifference between summer and spring harvests (588 and 546 g NDF kg
–1
DM,respectively). Acid detergent lignin (ADL) concentration of the NDF fraction wasgreater for summer-harvested alfalfa in both years. During the spring growthperiod of the second year, air temperatures were warmer and there was less rainfallthan in the first year of the study (Sanderson and Wedin, 1988). Vegetativelypropagated clones of individual alfalfa plants divergently selected for stem cellwall quality traits showed environmental variability when evaluated over twelvecuttings (two locations, over two years, with three harvests per year). One cloneaveraged 233 g kg
–1
for stem Klason lignin concentration but varied in response
DK9448_C005.fm Page 85 Tuesday, March 28, 2006 2:55 PM
© 2006 by Taylor & Francis Group, LLC
86
Alcoholic Fuels
from 198 to 261 g kg
–1
over the environments tested. Another clone selected forstem cellulose concentration ranged from 396 to 467 g kg
–1
for the twelve samples(Lamb and Jung, unpublished data).
In the previous study, the impacts of temperature and moisture cannot beevaluated separately. When these two environmental factors have been evaluatedindependently, the major effect of moisture stress alone appeared to be on amountof cell wall accumulated by alfalfa plants as opposed to changes in cell wallcomposition. When rainfall was eliminated using a moveable shelter and alfalfaplots were irrigated to three field capacities (65, 88, and 112% saturation), stemcell wall concentration was reduced when the alfalfa was grown under water-deficit conditions (Deetz et al., 1994). Klason lignin concentration of the cellwalls was not altered due to water-deficit and concentrations of xylose, galactose,and rhamnose in the cell wall were marginally increased and glucose wasdecreased, under the 65% field capacity treatment. In contrast to the impact ofmoisture, temperature was found not to alter cell wall concentration, but didapparently influence cell wall composition. A greenhouse study where alfalfa wasgrown under adequate moisture conditions indicated that higher temperatures(32°C and 26°C, day and night respectively) resulted in no changes in leaf orstem NDF concentration compared to cooler growth conditions (22°C and 16°C,day and night respectively), but ADL content of the NDF was increased by thehigher temperatures (Wilson et al., 1991). However, these temperature effectsshould be viewed with some caution because both the NDF and ADL concentra-tions observed for the greenhouse-grown alfalfa in this study were much lowerthan normally observed for field grown plants.
GENETIC IMPACTS ON COMPOSITION
Genetic differences in chemical composition among alfalfa plant introductions,varieties, and individual genotypes have been reported. Leaf and stem CP differedamong a group of 61 plant introductions, although the ranges were small, from272 to 295 and 88 to 99 g CP kg
–1
DM, respectively (Jung et al., 1997). LeafNDF concentration (235 g kg
–1
DM) did not differ significantly among theseplant introductions, but stem NDF ranged from 636 to 670 g NDF kg
–1
DM.Similar variation was observed among a group of five commercial alfalfa varietieswith CP and NDF differences being noted for leaves and stems, as well as wholeherbage (Sheaffer et al., 2000). Differences in stem cell wall concentration andcomposition were observed among a set of four alfalfa genotypes selected fordivergence in whole herbage ADL and in vitro ruminal DM disappearance(IVDMD) (Jung et al., 1994) and a group of three genotypes selected for divergentIVDMD (Jung and Engels, 2002). More recently, alfalfa genotypes selected fordivergent cell wall Klason lignin, cellulose, and xylan were shown to differgenetically for these cell wall components when grown across a series of envi-ronments (Lamb and Jung, 2004). While the reported genetic variation amongalfalfa germplasm sources is not large, the potential for modifying cell wall
DK9448_C005.fm Page 86 Tuesday, March 28, 2006 2:55 PM
© 2006 by Taylor & Francis Group, LLC
Development of Alfalfa as a Feedstock for Production of Ethanol
87
composition has not been seriously explored, because recurrent selection for thesetraits has not been done.
Significant genotype x environment (G
×
E) interactions have generally notbeen observed for chemical composition of alfalfa varieties. Among 61 plantintroductions, no measures of cell wall concentration or composition were foundto have significant G
×
E interactions for leaf or stem material (Jung et al., 1997).Only differences in magnitude, not rank, for composition due to G
×
E interactionswere noted by Sheaffer et al. (2000) among five alfalfa varieties. These resultsmirror the conclusion of Buxton and Casler (1993) that forage quality traitsgenerally have small G
×
E interaction effects compared to the impact on yield.However, in recent work with alfalfa clones selected for specific cell wall traits,it was found that G
×
E interactions were significant among plants selected forlow and high pectin and xylan concentrations, whereas no G
×
E interactionswere noted among clones selected for Klason lignin or cellulose (Lamb and Jung,2004).
ALFALFA LEAF MEAL
Because alfalfa leaves contain approximately 300 g CP kg
–1
DM, this portion ofthe crop has greater value as an animal feedstuff than for conversion to ethanol.Based simply on its protein concentration, alfalfa leaf meal was estimated to havea value of $138 Mg
–1
(Linn and Jung, unpublished). This price far exceeds thetarget feedstock value of $33 Mg
–1
assumed in a functioning corn stover-to-ethanol production system (Aden et al., 2002). In an extensive series of studiesinvolving lactating dairy cows and fattening beef cattle, alfalfa leaf meal wasshown to be an acceptable protein feed supplement in place of soybean meal(DiCostanzo et al., 1999). Besides providing protein for beef steer growth, alfalfaleaf meal also reduced the incidence of liver abscesses at slaughter, therebyincreasing the market value of the cattle. Furthermore, alfalfa leaf meal couldreplace alfalfa hay in the diet of lactating dairy cows as a source of both proteinand fiber to support normal milk production (Akayezu et al., 1997). Sucklingbeef calves actually gained weight more rapidly when fed alfalfa leaf meal in asupplemental creep feed than observed with a soybean meal-based supplement(DiCostanzo et al., 1999). From these results, it is clear that alfalfa leaf mealcould provide a valuable coproduct for an alfalfa-to-ethanol production system.
PROTEIN AND FIBER SEPARATION
Two methods have been developed for capturing the protein-rich fraction fromalfalfa and separating it from the more fiber-rich fraction. From whole field-driedplant material, leaves can be separated from denser stems using shaking screens(Arinze et al., 2003; Downing et al., 2005). Fresh material can be dried using arotary drum drier and leaves separated aerodynamically due to their lower massand faster drying time than that of stems (Arinz et al., 2003). Wet fractionation
DK9448_C005.fm Page 87 Tuesday, March 28, 2006 2:55 PM
© 2006 by Taylor & Francis Group, LLC
88
Alcoholic Fuels
involves mechanical maceration of fresh total herbage followed by the expressionof protein-rich juice (Jorgensen and Koegel, 1988; Koegel and Straub, 1996).Approximately 20–30% of the herbage DM can be captured in the juice (Koegeland Straub, 1996). The proportion of DM that was captured in the juice wasshown to decrease with increasing maturity of the herbage (Koegel and Straub,1996). The juice contains both particulate and soluble proteins. The solubleproteins, which may have greater value, can be separated from particulate proteinsby heating and centrifugation (Jorgensen and Koegel, 1988). Wet fractionationhas been used successfully in small-scale experiments (see “Pretreatment ofAlfalfa Fiber” below) to refine alfalfa into a high-value protein fraction and afiber fraction that was further refined and fermented to produce ethanol (Koegelet al., 1999; Sreenath et al., 2001), lactic acid (Koegel et al., 1999), and woodadhesive (Weimer et al., 2005). Fiber can also be processed into animal feed. Thedeproteinized juice is a source for extracting xanthophyll and can also be usedas a fertilizer (Koegel and Straub, 1996). Wet fractionation has the advantage ofminimizing leaf loss and is less weather dependent than field drying. Driedmaterial has the advantage of being lighter to transport and is easily stored forlater processing and refining. The nature of the protein product will clearly impactthe method of herbage harvest and processing.
In addition to protein, alfalfa also contains numerous secondary metabolitesthat are of interest in human nutrition and food production. In particular, alfalfais a rich source of flavonoid antioxidants and phytoestrogens including luteolin,coumestrol, and apigenin (Hwang et al., 2001; Stochmal et al., 2001) that havepossible health-promoting activities. Alfalfa foliage also contains high amountsof xanthophylls, which are added to chicken feed to pigment egg yolks and broilerskin (Koegel and Straub 1996). Thus, in a biorefinery model for alfalfa processing,ethanol would be one of several products produced with the protein componentpossibly the more valuable and economically important product.
PRETREATMENT OF ALFALFA FIBER
Ethanol production depends on fermentation of simple sugars by microorganisms.The yield of potentially fermentable sugars from the conversion process is thecritical response variable in assessing the value of alfalfa as an ethanol productionfeedstock. Potentially fermentable sugar yield is a function of both carbohydratecomposition and concentration (discussed earlier), and the efficiency with whichthe cell wall polysaccharides are converted to simple sugars through processing.The results of two pretreatment methods have been reported previously. Ferreret al. (2002) described parameters of ammonia processing of whole dried alfalfahay that influenced the susceptibility of the fiber to subsequent enzymatic hydrol-ysis. The ammonia loading, moisture, time and temperature of treatment werevaried and then the treated material digested with a mixture of cellulase, cello-biase, and xylanase. Conditions of 2 g ammonia g
–1
DM, with 30% moisture andprocessing at 85°C for five minutes was shown to convert 76% of the theoreticalyield of reducing sugars in the fiber. Approximately 200 mg sugars g
–1
DM was
DK9448_C005.fm Page 88 Tuesday, March 28, 2006 2:55 PM
© 2006 by Taylor & Francis Group, LLC
Development of Alfalfa as a Feedstock for Production of Ethanol
89
obtained (Ferrer et al., 2002); however, the yield of ethanol produced from thismaterial remains to be determined.
Liquid hot water (LHW) pretreatments of the fiber fraction obtained afterwet fractionation of alfalfa have been optimized for maximum sugar conversion(Sreenath et al., 1999) and ethanol production (Sreenath et al., 2001). The LHWpretreatment was found to solubilize hemicellulose, and the resulting extractcontained significant amounts of acetic acid and formic acid (Sreenath et al.,1999). The remaining fiber fraction (raffinate) when treated with cellulase released59 g of reducing sugars from 100 g of substrate. Addition of dilute acid (0.07%sulfuric acid) to the LHW decreased the amount of reducing sugars released bycellulase treatment to 24 g 100 g
–1
substrate (Sreenath et al., 1999). Fermentationof the raffinate fraction after LHW pretreatment was tested with two strains of
Candida shehatae
in a simultaneous saccharification and fermentation (SSF)process as well as a separate hydrolysis and fermentation (SHF) process (Sreenathet al., 2001). The yield of ethanol was 0.45 g ethanol g
–1
sugar with SSF and0.47g ethanol g
–1
sugar with SHF. The extract from the LHW pretreatment wasalso used in fermentation experiments and was poorly fermented, most likely dueto the presence of organic acids. Addition of dilute acid to the LHW treatmentresulted in fractions that were poorly fermented. Although untreated fiber sub-strate was shown to yield 51 g reducing sugars from 100 g of substrate (Sreenathet al., 1999), the yield of ethanol by SHF and SSF was 0.25 and 0.16 g ethanolg
–1
sugar, respectively (Sreenath et al., 2001). These experiments demonstrate theimpact of pretreatment on saccharification and ethanol production as well as therequirement to optimize processes for each lignocellulosic feedstock.
CONVERSION RESPONSE AFTER DILUTE ACID PRETREATMENT
For the purposes of this chapter, the high temperature, dilute acid pretreatment andsubsequent enzymatic saccharification method will be examined in more detail asa conversion technology for ethanol production from alfalfa stem fractions. Thehigh temperature, dilute acid pretreatment is designed to remove noncellulosic cellwall polysaccharides and lignin, because these constituents will interfere with thecellulase enzyme cocktails used for hydrolysis of the cellulose. One design goal ofthis pretreatment is to reduce the pH of the feedstock reaction mixture to 1.3–1.5prior to heating (National Renewal Energy Laboratory, Golden, CO; LaboratoryAnalytical Procedure-007, May 17, 1995). The amount of sulfuric acid required toreach this pH target for alfalfa stems was 8.1 mmol g
–1
biomass DM in a 1% solidsslurry, compared to 6.4 mmol for switchgrass and corn stover (Jung, unpublished).Maturity of alfalfa stems and switchgrass did not influence the acid requirement.Dien et al. (2005) observed that the sulfuric acid loading required to maximizerelease of nonglucose sugars from alfalfa stems when heated at 121°C for 1 h was2.5% (wt/vol), whereas 1.5% was sufficient for switchgrass. The higher acid require-ment for alfalfa stems is most likely due to the greater pectin content of alfalfa cell
DK9448_C005.fm Page 89 Tuesday, March 28, 2006 2:55 PM
© 2006 by Taylor & Francis Group, LLC
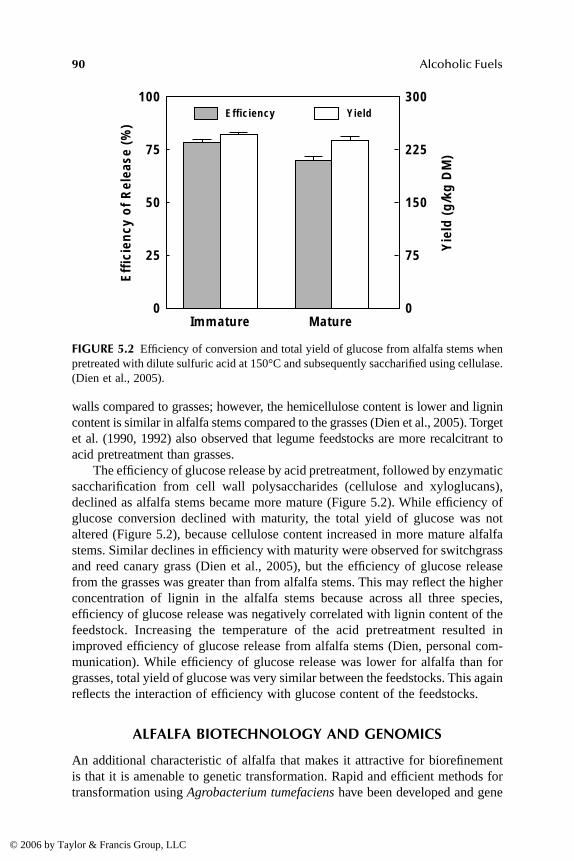
90
Alcoholic Fuels
walls compared to grasses; however, the hemicellulose content is lower and lignincontent is similar in alfalfa stems compared to the grasses (Dien et al., 2005). Torgetet al. (1990, 1992) also observed that legume feedstocks are more recalcitrant toacid pretreatment than grasses.
The efficiency of glucose release by acid pretreatment, followed by enzymaticsaccharification from cell wall polysaccharides (cellulose and xyloglucans),declined as alfalfa stems became more mature (Figure 5.2). While efficiency ofglucose conversion declined with maturity, the total yield of glucose was notaltered (Figure 5.2), because cellulose content increased in more mature alfalfastems. Similar declines in efficiency with maturity were observed for switchgrassand reed canary grass (Dien et al., 2005), but the efficiency of glucose releasefrom the grasses was greater than from alfalfa stems. This may reflect the higherconcentration of lignin in the alfalfa stems because across all three species,efficiency of glucose release was negatively correlated with lignin content of thefeedstock. Increasing the temperature of the acid pretreatment resulted inimproved efficiency of glucose release from alfalfa stems (Dien, personal com-munication). While efficiency of glucose release was lower for alfalfa than forgrasses, total yield of glucose was very similar between the feedstocks. This againreflects the interaction of efficiency with glucose content of the feedstocks.
ALFALFA BIOTECHNOLOGY AND GENOMICS
An additional characteristic of alfalfa that makes it attractive for biorefinementis that it is amenable to genetic transformation. Rapid and efficient methods fortransformation using
Agrobacterium tumefaciens
have been developed and gene
FIGURE 5.2
Efficiency of conversion and total yield of glucose from alfalfa stems whenpretreated with dilute sulfuric acid at 150°C and subsequently saccharified using cellulase.(Dien et al., 2005).
Immature
Eff
icie
ncy
of
Rel
ease
(%
)
Yie
ld (
g/k
g D
M)
Mature
Efficiency Yield100
75
50
25
0
300
225
150
75
0
DK9448_C005.fm Page 90 Tuesday, March 28, 2006 2:55 PM
© 2006 by Taylor & Francis Group, LLC

Development of Alfalfa as a Feedstock for Production of Ethanol
91
promoters identified for high constitutive expression and for tissue-specificexpression (reviewed by Samac and Temple, 2004; Somers et al., 2003). Trans-formation has been used to alter alfalfa for production of valuable coproducts(Table 5.2) and for improving digestion of alfalfa fiber. Transgenic alfalfa hasbeen shown to be capable of producing high levels of phytase (Austin-Phillipsand Ziegelhoffer, 2001; Ullah et al., 2002), a feed enzyme that degrades phyticacid and makes phosphorus in vegetable feeds available to monogastric animalssuch as swine. Adding phytase to feeds reduces the need to add supplementalphosphorus to feed and reduces the amount of phosphorus excreted by animals.In field studies, juice from wet-fractionated alfalfa plants contained 1–1.5%phytase. Phytase activity in juice was stable over two weeks at a temperature of37°C. Activity is also stable in dried leaf meal. Both juice and dried leaf mealadded to feed were as effective in feeding trials as phytase from microbial sources.The value of the enzyme and xanthophyll in the juice was estimated at $1900/acre(Austin-Phillips and Ziegelhoffer, 2001). A wide range of feed enzymes is usedto enhance digestion of feed and improve animal performance. Use of feedenzymes in monogastric and ruminant animals in expected to increase worldwide(Sheppy, 2001). Production of feed enzymes in transgenic plants, particularly inplants used as animal feed, would be an opportunity to increase feed utilizationas well as value of the feed.
TABLE 5.2Transgenic Alfalfa Producing Commercial Enzymes and Polymers
Enzyme Gene Source Amount of Product Citation
Phytase phyA
Aspergillus ficuum
0.85–1.8% of soluble protein
Austin-Phillips and Ziegelhoffer, 2001
Ullah et al., 2002
Manganese-dependent lignin peroxidase
Mn-P
Phanerochaete chrysoporium
0.01–0.5% of soluble protein
Austin et al., 1995
α
-amylase
α
-amylase
Bacillus licheniformis
0.001–0.01% of soluble protein
Austin et al., 1995
Endo-glucanase E2
Thermomonospora fusca
0.01% of soluble protein
Ziegelhoffer et al., 1999
Cellobiohydrolase E3
Thermomonospora fusca
0.001–0.002% of soluble protein
Ziegelhoffer et al., 1999
β
-ketothiolase phbA
Ralstonia eutropha
0.025–1.8 g PHB/kg dry leaves
Saruul et al., 2002
Acetoacetyl-CoA reductase
phbB
PHB synthase phbC
DK9448_C005.fm Page 91 Tuesday, March 28, 2006 2:55 PM
© 2006 by Taylor & Francis Group, LLC

92
Alcoholic Fuels
Transgenic alfalfa has also been used to produce several industrial enzymes.A manganese-dependent lignin peroxidase, which can be used for lignin degra-dation and biopulping in the manufacture of paper, was expressed in alfalfa.However, high levels of production of this enzyme appeared to be detrimental toplants (Austin et al., 1995). In the same study,
α
-amylase was produced at a levelof approximately 0.01% of soluble protein without having a negative effect onplant development. Two cellulases, an endogluconase and a cellobiohydrolase,have been expressed at low levels in alfalfa (Ziegelhoffer et al., 1999). Theseenzymes were stable in dried leaf meal. Expression of cellulose degradingenzymes in biomass plants is one strategy to decrease the costs of saccharificationthat precedes ethanol fermentation. Alfalfa plants have also been shown to be anexcellent “factory” for the production of chitinase (Samac et al., 2004). Chitin,found in shells of crustaceans, is the second most abundant carbohydrate aftercellulose, and a potential feedstock in a biorefinery.
In addition to production of proteins, the use of transgenic alfalfa to produceother industrial feed stocks has been explored. Polyhydroxyalkanoates (PHAs)are produced by many species of bacteria and some PHA polymers are commer-cially valuable as biodegradable plastics. PHA synthesis in plants is seen as amore economically viable means of producing large quantities of these polymers(Poirier, 1999; Slater et al., 1999). Alfalfa was engineered to constitutivelyexpress three bacterial genes for the production of poly-
β
-hydroxybutyrate (PHB)(Saruul et al., 2002). Granules of PHB were shown to accumulate in chloroplastswithout any negative impact on plant growth. Yield of PHB by chemical extrac-tion was relatively low (1.8 g kg
–1
DM), but may be improved by optimizingextraction methods or by utilizing stronger gene promoters.
A major limitation to use of biomass in the production of ethanol is therecalcitrance of the material to saccharification. Cross-linking of lignin with cell-wall polysaccharides interferes with enzymatic degradation of cellulose and canseverely limit the conversion of herbaceous plant material into ethanol. Ligninin alfalfa stems also limits digestion of feed by ruminant animals. In experimentsaimed at increasing feed digestion by ruminants, transgenic alfalfa was producedthat had decreased expression of caffeoyl coenzyme A 3-
O
-methyltransferase, anenzyme involved in synthesis of lignin precursors. These plants were shown tohave approximately 20% less lignin and 10% additional cellulose than the controls(Marita et al., 2003). The rate of digestion of the transgenic material was deter-mined by
in vitro
rumen digestibility assays. In the transgenic material, a2.8–6.0% increase in the rate of digestion was observed (Guo et al., 2001). Thismaterial could have a very significant impact on both animal nutrition and alfalfabiorefining. Casler and Vogel (1999) determined that a 1% increase in foragedigestibility would lead to a 3.2% increase in average daily live-weight gain bybeef steers. Although this material has not yet been tested with different pretreat-ment methods or used in saccharification or fermentation studies, based on chem-ical analyses, it may also have improved qualities as a feedstock for bioethanolproduction.
DK9448_C005.fm Page 92 Tuesday, March 28, 2006 2:55 PM
© 2006 by Taylor & Francis Group, LLC
Development of Alfalfa as a Feedstock for Production of Ethanol
93
During the past several years, barrel medic (
Medicago truncatula
) has beenthe object of a broad range of research efforts worldwide. This annual plant,which is closely related to alfalfa, is a model plant for study of plant-microbeinteractions and plant development (Cook, 1999). Chromosome mapping hasshown that there is a high degree of gene synteny between the two species aswell as a high degree of DNA sequence homology (Choi et al., 2004). Numerousgenomic tools have been developed for
M. truncatula
including isolation of over189,000 expressed sequence tags (ESTs), identification and sequencing of morethan 36,000 unique genes (http://www.tigr.org/tigr-scripts/tgi/T_index.cgi?spe-cies=medicago), extensive genetic and physical mapping (Choi et al. 2004),development of microarrays for transcript profiling, and a genome sequencingproject is currently underway (http://www.medicago.org). In particular, micro-arrays are valuable tools for identifying genes involved in important agriculturalprocesses as they enable researchers to measure expression of thousands of genessimultaneously. More than 100 genes are involved in cell-wall biosynthesis inplants and little is known about regulation of their expression. EST resourcesmay be useful both as markers for selecting plants with favorable characteristicsin bioconversion and in modifying gene expression in transgenic plants forenhancing the efficiency of ethanol production or enhancing yields of valuablecoproducts.
CONCLUSIONS
Although commercial biorefining of alfalfa remains undeveloped, alfalfa hastremendous potential as a feedstock for production of ethanol and other products.Alfalfa is widely adapted and produces large amounts of biomass over the courseof four or more years. The production costs of alfalfa are low and cultivation ofthe crop has numerous environmental benefits. Importantly, alfalfa leaves containthe majority of the protein in the plant and are easily separated from stems throughprocessing. Leaf meal is a valuable coproduct in its own right as animal feed, aswell as a potential source for human nutritional supplements and products derivedfrom transgene expression. The stem fraction of alfalfa is rich in cell wallpolysaccharides that can be used as a source of fermentable sugars to produceethanol and other bioproducts. A biomass-type of alfalfa is being developed thatis more upright in growth habit and performs well in a reduced frequency harvestmanagement system, maximizing the yield of both leaf and stem fractions whilelowering production costs. Incorporation of enhanced compositional traits suchas more cellulose, less lignin and valuable transgenic protein products into thisalfalfa biomass type through traditional breeding and using the tools of biotech-nology will add to the value alfalfa brings to biofuels and bioproduct systems.
DK9448_C005.fm Page 93 Tuesday, March 28, 2006 2:55 PM
© 2006 by Taylor & Francis Group, LLC

94
Alcoholic Fuels
ACKNOWLEDGMENTS
The authors thank members of the USDA-ARS-Plant Science Research Unit (Drs.Carroll P. Vance, Michael P. Russelle, and John Gronwald) and Dr. Sandra Austin-Phillips (University of Wisconsin-Madison) for stimulating conversations,insights, and for providing literature citations.
REFERENCES
Aden, A., Ruth, M., Ibsen, K., Jechura, J., Neeves, K., Sheehan, J., Wallace, B., Montague,L., Slayton, A. and Lukas, J.,
Lignocellulosic Biomass to Ethanol Process Designand Economics Utilizing Co-current Dilute Acid Prehydrolysis and EnzymaticHydrolysis for Corn Stover
, NREL/TP-510-32438, National Renewable EnergyLaboratory, Golden, CO, 2002, pp. 1–88.
Akayezu, J.M., Jorgensen, M., Linn, J.G. and Jung, H.G., Effects of Substituting AlfalfaLeaf Meal for Alfalfa Hay in Diets of Early Lactation Cows,
J. Dairy Sci.
, 80,184, 1997.
Arinze, E.A., Schoenau, G.J., Sokhansanj, S. and Adapa, P., Aerodynamic Separation andFractional Drying of Alfalfa Leaves and Stems—A Review and New Concept,
Drying Technol.
, 21, 1669–1698, 2003.Austin, S., Bingham, E.T., Mathews, D.E., Hahan, M.N., Will, J. and Burgess, R.R.,
Production and Field Performance of Transgenic Alfalfa (
Medicago sativa
L.)Expressing Alpha-Amylase and Manganese-Dependent Lignin Peroxidase,
Euphytica
, 4, 1–13, 1995.Austin-Phillips, S. and Ziegelhoffer, T., The Production of Value-Added Proteins in Trans-
genic Alfalfa,. In
Molecular Breeding of Forage Crops
, Spangenberg, G., Ed.,Kluwer Academic Publishers, Dordrecht, The Netherlands 2001, pp. 285–301.
Barnes, D.K., Bingham, E.T., Murphy, R.P., Hunt, O.J., Beard, D.F., Skrdla, W.H. andTeuber, L.R.,
Alfalfa Germplasm in the United States: Genetic Vulnerability, Use,Improvement, and Maintenance
,. U.S. Department of Agriculture, Tech. Bull.1571, Washington, DC, 1977, pp. 1–21.
Brummer, E.C., Capturing Heterosis in Forage Crop Cultivar Development,.
Crop Sci.
,39, 943–954, 1999.
Buxton, D.R. and Casler, M.D., Environmental and Genetic Effects on Cell Wall Compo-sition and Digestibility,
In
Forage Cell Wall Structure and Digestibility
, Jung,H.G., Buxton, D.R., Hatfield, R.D. and Ralph, J. Eds., American Society ofAgronomy-Crop Science Society of American-Soil Science Society of AmericaPublishers, Madison, WI, 1993, pp. 685–714.
Casler, M.D. and Vogel, K.P., Accomplishments and Impact from Breeding for IncreasedForage Nutritional Value,
Crop Sci.
, 39, 12–20, 1999.Choi, H.K., Kim, D., Uhm, T., Limpens, E., Lim, H., Mun, J.H., Kalo, P., Penmetsa, R.V.,
Seres, A., Kulikova, O., Roe, B.A., Bisseling, T., Kiss, G.B. and Cook, D.R., ASequence-Based Genetic Map of
Medicago truncatula
and Comparison of MarkerColinearity with
M. sativa
,
Genetics
, 166, 1463–1502, 2004.Cook, D.R.,
Medicago truncatula
: A model in the making,.
Curr. Opin. Plant Biol.
, 2,301–304, 1999.
DK9448_C005.fm Page 94 Tuesday, March 28, 2006 2:55 PM
© 2006 by Taylor & Francis Group, LLC
Development of Alfalfa as a Feedstock for Production of Ethanol
95
Cowett, E.R. and Sprague, M A., Factors Affecting Tillering in Alfalfa, Agron. J., 54,294–297, 1962.
Dale, B.E., Biomass Refining: Protein and Ethanol from Alfalfa, Ind. Eng. Chem. Prod.Res. Dev., 22, 466–472, 1983.
Deetz, D.A., Jung, H.G. and Buxton, D.R., Water-Deficit Effects on Cell-Wall Compositionand In Vitro Degradability of Structural Polysaccharides from Alfalfa Stems, CropSci., 36, 383–388, 1994.
Dhont, C., Castonguay, Y., Nadeau, P., Belanger, G. and Chalifour, F.-P., Alfalfa RootCarbohydrates and Regrowth Potential in Response to Fall Harvests, Crop Sci.,42, 754–765, 2002.
Dien, B.S., Jung, H.G., Vogel, K.P., Casler, M.D., Lamb, J.F.S., Weimer, P.J., Iten, L.,Sarath, G. and Mitchell, R., Chemical Composition and Response to Dilute-AcidPretreatment and Enzymatic Saccharification of Alfalfa, Reed Canarygrass, andSwitchgrass, Biomass Bioenergy, preprint [submitted].
DiCostanzo, A., Zehnder, C.M., Akayezu, J.M., Jorgensen, M.A, Cassidy, J.M., Allen,D.M., Standorf, D.G.; Linn, J.G., Jung, H., Smith, L.J., Lamb, G.C., Johnson, D.,Chester-Jones, H. and Robinson, G., Use of Alfalfa Leaf Meal in Ruminant Diets.60th Minnesota Nutrition Conference, Bloomington, MN, Sept. 20–22, 1999, pp.64–75.
Downing, M., Volk, T.A. and Schmidt, D.A., Development of New Generation Coopera-tives in Agriculture for Renewable Energy Research, Development, and Demon-stration Projects, Biomass Bioenergy, 28, 425–434, 2004.
Engels, F.M. and Jung, H.G., Alfalfa Stem Tissues: Cell-Wall Development and Lignifi-cation, Ann. Bot., 82, 561–568, 1998.
Ferrer, A., Byers, F.M., Sulbaran-de-Ferrer, B., Dale, B.E. and Aiello, C., OptimizingAmmonia Processing Conditions to Enhance Susceptibility of Legumes to FiberHydrolysis-Alfalfa, App. Biochem. Biotech., 98, 123–143, 2002.
Guo, D., Chen, F., Wheeler, J., Winder, J., Selman, S., Peterson, M. and Dixon, R.A.Improvement of In-Rumen Digestibility of Alfalfa Forage by Genetic Manipula-tion of Lignin O-Methyltransferases, Transgenic Res., 10, 457–464, 2001.
Hansen, L.H. and Krueger, C.R., Effect of Establishment Method, Variety, and SeedingRate on the Production and Quality of Alfalfa Under Dryland and Irrigation, Agron.J., 65, 755–759, 1973.
Huggins, D.R., Randall, G.W. and Russelle, M.P., Subsurface Drain Losses of Water andNitrate Following Conversion of Perennials to Row Crops, Agronomy J., 93,477–486, 2001.
Hwang, J.L., Hodis, H.N. and Sevanian, A., Soy and Alfalfa Phytoestrogen ExtractsBecome Potent Low-Density Lipoporotein Antioxidants in the Presence of AcerolaCherry Extract, J. Agric. Food Chem., 49, 308–314, 2001.
Johnson, L.D., Marquez-Ortiz, J.J., Barnes, D.K. and Lamb, J.F.S., Inheritance of RootTraits in Alfalfa, Crop Sci., 36, 1482–1487, 1996.
Jorgensen, N.A. and Koegel, R.G., Wet Fractionation Processes and Products, In Alfalfaand Alfalfa Improvement, Hanson, A.A., Barnes, D.K. and Hill, R.R, Eds, Amer-ican Society of Agronomy-Crop Science Society of American-Soil Science Soci-ety of America Publishers, Madison, WI, 1988, pp. 553–566.
Jung, H.G. and Engels, F.M., Alfalfa Stem Tissues: Cell-Wall Deposition, Composition,and Degradability, Crop Sci., 42, 524–534, 2002.
DK9448_C005.fm Page 95 Tuesday, March 28, 2006 2:55 PM
© 2006 by Taylor & Francis Group, LLC

96 Alcoholic Fuels
Jung, H.G., Smith, R.R. and Endres, C.S., Cell-Wall Composition and Degradability ofStem Tissue from Lucerne Divergently Selected for Lignin and In Vitro Dry MatterDisappearance, Grass Forage Sci., 49, 1–10, 1994.
Jung, H.G., Sheaffer, C.C., Barnes, D.K. and Halgerson, J.L., Forage Quality Variation inthe U.S. Alfalfa Core Collection, Crop Sci. 37, 1361–1366, 1997.
Kiesselbach, T.A., Russel, J.C. and Anderson, A., The Significance of Subsoil Moisturein Alfalfa Production. J. Am. Soc. Agron., 21, 241–268, 1929.
Kim, S. and Dale, B.D., Cumulative Energy and Global Warming Impact from the Pro-duction of Biomass for Biobased Products, J. Indust. Ecol., 7, 147–162, 2004.
Koegel, R.G., Sreenath, H.K. and Straub, R.J., Alfalfa Fiber as a Feedstock for Ethanoland Organic Acids, App. Biochem. Biotech., 77–79, 105–115, 1999.
Koegel, R.G. and Straub, R.J., Fractionaltion of Alfalfa for Food, Feed, Biomass, andEnzymes, Trans. Amer. Soc. Ag. Eng., 39, 769–774, 1996.
Lamb, J.F.S. and Jung, H.G., Environmental Stability of Stem Quality Traits in Alfalfa,American Society of Agronomy, Crop Science Society of American, Soil ScienceSociety of America Annual Meetings, Seattle, WA, Oct 31–Nov 4, 2004, Abstr.3885.
Lamb, J.F.S., Sheaffer, C.C. and Samac, D.A., Population Density and Harvest MaturityEffects on Leaf and Stem Yield in Alfalfa, Agron. J., 295, 635–641, 2003.
Marita, J.M., Ralph, J., Hatfield, R.D., Guo, D., Chen, F. and Dixon, R.A., Structural andCompositional Modifications in Lignin of Transgenic Alfalfa Down-Regulated inCaffeic Acid 3-O-Methyltransferase and Caffeoyl Coenzyme A 3-O-Methyltrans-ferase, Phytochemistry, 62, 53–65, 2003.
Marquez-Ortiz, J.J., Lamb, J.F.S., Johnson, L.D., Barnes, D.K. and Stucker, R.E., Herita-bility of Crown Traits in Alfalfa, Crop Sci., 39, 38–43, 1999.
Nordkvist, E. and Aman, P., Changes During Growth in Anatomical and Chemical Com-position and In-Vitro Degradability of Lucerne, J. Sci. Food Agric., 37, 1–7, 1986.
Poirier, Y., Production of New Polymeric Compounds in Plants., Curr. Op. Biotech., 10,181–185, 1999.
Raguse, C.A. and Smith, D., Some Nonstructural Carbohydrates in Forage Legume Herb-age, J. Agric. Food Chem., 14, 423–426, 1966.
Russelle, M.P., Alfalfa, Amer. Sci., 89, 252–261, 2001.Rumbaugh, M.D., Effects of Population Density on Some Components of Yield of Alfalfa,
Crop Sci., 3, 423–424, 1963.Samac, D.A. and Temple, S.J., Development and Utilization of Transformation in Medi-
cago Species,. In Genetically Modified Crops: Their Development, Uses, andRisks, Liang, G.H. and Skinner, D.Z., Eds., Food Products Press, Binghamton,NY, 2004, pp. 165–202.
Samac, D.A., Tesfaye, M., Dornbusch, M., Saruul, P. and Temple, S.J., A Comparison ofConstitutive Promoters for Expression of Transgenes in Alfalfa (Medicago sativa),Transgenic Res., 13, 349–-361, 2004.
Sanderson, M.A. and Wedin, W.F., Cell Wall Composition of Alfalfa Stems at SimilarMorphological Stages and Chronological Age During Spring Growth and SummerRegrowth, Crop Sci., 28, 342–347, 1988.
Saruul, P., Srienc, F., Somers, D.A. and Samac, D.A., Production of a BiodegradablePlastic Polymer, Poly-β-Hydroxybutyrate, in Transgenic Alfalfa, Crop Sci., 42,919–927, 2002.
Sheaffer, C.C., Martin, N.P., Lamb, J.F.S., Cuomo, G.R., Jewett, J.G. and Quering, S.R.,Leaf and Stem Properties of Alfalfa Entries, Agron. J., 92, 733–739, 2000.
DK9448_C005.fm Page 96 Tuesday, March 28, 2006 2:55 PM
© 2006 by Taylor & Francis Group, LLC

Development of Alfalfa as a Feedstock for Production of Ethanol 97
Sheppy, C., The Current Feed Enzyme Market and Likely Trends, In Enzymes in FarmAnimal Nutrition, Bedford, M.R. and Partridge, G.G., Eds., CABI Publishing,Wallingford, CT, 2001, pp. 273–298.
Slater, S., Mitsky, T.A., Houmiel, K.L., Hao, M., Reiser, S.E., Taylor, N.B., Tran, M.,Valentin, H.E., Rodriguez, D.J., Stone, D.A., Pagette, S.R., Kishore, G. and Gruys,K.J., Metabolic Engineering of Arabidopsis and Brassica for Poly(3-Hydroxybu-tyrate-Co-3-Hydroxyvalerate) Copolymer Production, Nat. Biotech., 17,1011–1016, 1999.
Somers, D.A., Samac, D.A. and Olhoft, P.M., Recent Advances in Legume Transformation,Plant Physiol., 131, 892–899, 2003.
Sreenath, H.K., Koegel, R.G., Moldes, A.B., Jeffries, T.W. and Straub, R.J., EnzymicSaccharification of Alfalfa Fibre After Liquid Hot Water Pretreatment, ProcessBiochem., 35, 33–41, 1999.
Sreenath, H.K., Koegel, R.G., Moldes, A.B., Jeffries, T.W. and Straub, R.J., EthanolProduction from Alfalfa Fiber Fractions by Saccharification and Fermentation,Process Biochem., 36, 1199–1204, 2001.
Stochmal, A., Piacente, S., Pizza, C., DeRiccardis, F., Leitz, R. and Oleszek, W., Alfalfa(Medicago sativa L.) Flavonoids: 1. Apigenin and Luteolin Glycosides FromAerial Parts, J. Agric. Food Chem., 49, 753–758, 2001.
Theander, O. and Westerlund, E., Quantitative Analysis of Cell Wall Components, InForage Cell Wall Structure and Digestibility, Jung, H.G., Buxton, D.R., Hatfield,R.D. and Ralph, J., Eds., American Society of Agronomy-Crop Science Societyof American-Soil Science Society of America Publishers, Madison, WI, 1993, pp.83–104.
Torget, R., Himmel, M. and Grohmann, K., Dilute-Acid Pretreatment of Two Short-Rotation Herbaceous Crops: Scientific Note, Appl. Biochem. Biotechnol., 28, 29,115–123, 1992.
Torget, R., Werdene, P., Himmel, M. and Grohmann, K., Dilute Acid Pretreatment of ShortRotation Woody and Herbaceous Crops, Appl. Biochem. Biotechnol., 24, 25,115–126, 1990.
Ullah, A.H., Sethumadhavan, K., Mullaney, E.J., Ziegelhoffer, T. and Austin-Phillips, S.,Cloned and Expressed Fungal phyA Gene in Alfalfa Produces a Stable Phytase,Biochem. Biophys. Res. Commun., 290, 1343–1348, 2002.
USDA-NASS, Agricultural Statistics 2004, http://www.usda.gov/nass/pubs/agr04/04_ch6.pdf
Volenec, J.J., Cherney, J.H. and Johnson, K.D., Yield Components, Plant Morphology, andForage Quality of Alfalfa as Influenced by Plant Population, Crop Sci., 27,321–326, 1987.
Weimer, P.J., Koegel, R.G., Lorenz, L.F., Frihart, C.R. and Kenealy, W.R., Wood adhesivesprepared from lucerne fiber fermentation residues of Ruminococcus albus andClostridium thermocellum, Appl Microbiol. Biotechnol., 66, 635–640, 2005.
Wilson, J.R., Organization of Forage Plant Tissues, In Forage Cell Wall Structure andDigestibility, Jung, H.G., Buxton, D.R., Hatfield, R.D. and Ralph, J., Eds., Amer-ican Society of Agronomy-Crop Science Society of American-Soil Science Soci-ety of America Publishers, Madison, WI, 1993, pp. 1–32.
Wilson, J.R., Deinum, B. and Engels, F.M., Temperature Effects on Anatomy and Digest-ibility of Leaf and Stem of Tropical and Temperate Forage Species, Neth. J. Agric.Sci., 39, 31–48, 1991.
DK9448_C005.fm Page 97 Tuesday, March 28, 2006 2:55 PM
© 2006 by Taylor & Francis Group, LLC

98 Alcoholic Fuels
Ziegelhoffer, T., Will, J. and Austin-Phillips, S., Expression of Bacterial Cellulase Genesin Transgenic Alfalfa (Medicago sativa L.), Potato (Solanum tuberosum L.) andTobacco (Nicotiana tabacum L.), Mol. Breed., 5, 309–318, 1999.
DK9448_C005.fm Page 98 Tuesday, March 28, 2006 2:55 PM
© 2006 by Taylor & Francis Group, LLC
99
6
Production of Butanol from Corn
Thaddeus C. Ezeji,
1
Nasib Qureshi,
2
Patrick Karcher,
1
and Hans P. Blaschek
1
1
University of Illinois, Biotechnology & Bioengineering Group, Department of Food Science & Human Nutrition, Urbana
2
United States Department of Agriculture, National Center for Agricultural Utilization Research, Fermentation/Biotechnology, Peoria, Illinois
CONTENTS
Introduction .......................................................................................................100Butanol Production from Corn .........................................................................101
Amylolytic Enzymes and Solventogenic
Clostridia
............................101Biochemistry of Butanol Production from Corn..................................103Butanol Production from Corn Coproducts .........................................106
Corn Fiber....................................................................................106Corn Steep Water.........................................................................107
Butanol Production Processes...............................................................108Batch Process...............................................................................108Batch Process with Concentrated Sugar Solutions.....................110Fed-Batch Fermentation ..............................................................111Continuous Fermentation ............................................................111
Enhancement of Substrate Utilization and Butanol Productivity ....................113Novel Downstream Processing .............................................................113
Gas Stripping ...............................................................................113Pervaporation ...............................................................................114Liquid-Liquid Extraction.............................................................116Perstraction ..................................................................................116
Economic Scenarios..........................................................................................117Economics of Butanol Production........................................................117
Conclusion.........................................................................................................117References .........................................................................................................118
DK9448_C006.fm Page 99 Tuesday, March 28, 2006 3:21 PM
100
Alcoholic Fuels
Abstract
The last few decades have witnessed dramatic improvements made inthe production of fuels and chemicals from biomass and fermentation derivedbutanol production from corn is no exception. The art of producing butanol fromcorn that existed during World Wars I and II is no longer seen as an art but ratheras science. Recent developments have brought, once again, the forgotten acetonebutanol ethanol (ABE) fermentation from corn closer to commercialization. Supe-rior strains have been developed, along with state-of-the-art upstream, down-stream, and fermentation technologies. Butanol can be produced not only fromcorn starch as was done decades ago, but also from corn coproducts such as cornfiber and corn steep liquor (CSL) as a nutrient supplement. These additionalsubstrates add to the improved yield and superior economics of the butanolprocess. Downstream processing technologies have enabled the use of concen-trated sugar solutions to be fermented, thereby resulting in improved processefficiencies. Application of fed-batch fermentation in combination with
insitu
/inline product recovery by gas stripping and pervaporation is seen as asuperior technology for scale-up of butanol production. Similarly, continuousfermentations (immobilized cell and cell recycle) have resulted in dramaticimprovement in reactor productivities. This chapter details all the above devel-opments that have been made for production of butanol from corn. As of today,butanol production from corn is competitive with petrochemically producedbutanol.
INTRODUCTION
Butanol is a four-carbon alcohol, a clear neutral liquid with a strong characteristicodor. It is miscible with most solvents (alcohols, ether, aldehydes, ketones, andaliphatic and aromatic hydrocarbons), is sparingly soluble in water (water solu-bility 6.3%) and is a highly refractive compound. Currently, butanol is producedchemically by either the oxo process starting from propylene (with H
2
and COover rhodium catalyst) or the aldol process starting from acetaldehyde (Sherman,1979). Butanol is also produced by fermentation of corn and corn-milling by-products. Butanol is a chemical that has excellent fuel characteristics. It containsapproximately 22% oxygen, which when used as a fuel extender will result inmore complete fuel combustion. Use of butanol as fuel will contribute to cleanair by reducing smog-creating compounds, harmful emissions (carbon monoxide)and unburned hydrocarbons in the tail pipe exhaust. Butanol has research andmotor octane numbers of 113 and 94, compared to 111 and 92 for ethanol(Ladisch, 1991). Some of the advantages of butanol as a fuel have been reportedpreviously (Ladisch, 1991).
Butanol production by fermentation dates back to Louis Pasteur (1861) whodiscovered that bacteria can produce butanol. In 1912, Chaim Weizmann (wholater became the first president of Israel) isolated a microorganism that he calledBY, which was later named
Clostridium acetobutylicum
. This microorganism isable to ferment starch to acetone, butanol, and ethanol. The first commercialbutanol fermentation plant in the United States was built in Terre Haute, Indiana
DK9448_C006.fm Page 100 Tuesday, March 28, 2006 3:21 PM
Production of Butanol from Corn
101
in 1918 by commercial Solvents Corporation using corn as the substrate and
C. acetobutylicum
as the fermenting microorganism. By 1945, the acetone-butanol fermentation was second in importance only to ethanol production byyeast (Dürre, 1998). The ultimate demise of the commercial butanol fermentationprocess in the United States occurred in the early 1960s due to unfavorableeconomic conditions brought about by competition with the petrochemical indus-try. Additionally, butanol fermentation suffered from severe limitations includinglow product yield, low productivity, and low final product concentrations due tobutanol toxicity (Qureshi et al., 1992). However, recent advances in strain devel-opment combined with advanced fermentation and product recovery technologieshave, at least partially, overcome the above problems (Annous and Blaschek,1991; Dürre, 1998; Qureshi and Blaschek, 2001a; Ezeji et al., 2003 and 2004).The strain that was used for the commercial production of acetone (butanol was
C. acetobutylicum
P262) (Jones and Woods, 1986). The other species thathave been widely studied for the bioconversion of corn to butanol include
C. beijerinckii
,
C. thermosulfurogenes
EM1,
C. saccharolyticum,
and
C. thermo-saccharolyticum
. Recent developments in liquid biofuel technology, uncertainty of petroleum
supplies, the finite nature of fossil fuels and environmental concerns have revivedresearch efforts aimed at obtaining liquid fuels from renewable resources. TheU.S. Department of Energy has declared that “decreasing U.S dependence onimported oil through the use of biomass-based fuels, power and products is anissue of national security (U.S. Department of Energy 2003).” Butanol is one ofthe biofuels that has the potential to substitute for gasoline and can be producedfrom domestically abundant biomass sources including corn. This chapterdescribes the production of butanol from corn and corn coproducts and the latestdevelopments in butanol production technology including culture development,upstream and downstream processing, and fermentation technology. The formu-lation of such a chapter is a clear indication that technology to produce butanolfrom corn is maturing and getting ready for commercialization.
BUTANOL PRODUCTION FROM CORN
A
MYLOLYTIC
E
NZYMES
AND
S
OLVENTOGENIC
C
LOSTRIDIA
The solventogenic
clostridia
, like all
clostridia
, are Gram positive, spore forming,obligate anaerobes. These bacteria can change to a variety of morphologies duringfermentation, with motile rod-shaped cells present during the exponential growthphase and dormant oval-shaped endospores formed when the culture encountersadverse conditions. The maintenance of cellular growth (like other heterotrophicbacteria) and butanol production by solventogenic
clostridia
depends on theutilization of nutrients obtained from the surroundings. Corn is principally com-posed of starch, and starch is made up of amylose and amylopectin. Amylose iscomposed of a linear polymer of glucose with links exclusively in the
α
-1, 4orientation. On the other hand, amylopectin is a highly branched polysaccharide
DK9448_C006.fm Page 101 Tuesday, March 28, 2006 3:21 PM

102
Alcoholic Fuels
consisting of linear chains of
α
-1, 4-linked D-glucose residues, joined by
α
-1,6-glucosidic bonds. The branch points occur on the average of every 20–25 D-glucose units, so that amylopectin contains 4–5% of
α
-1, 6-glucosidic linkages(Jensen and Norman, 1984). High-molecular-weight macromolecules like starchfrom corn are too large to be assimilated by the bacterial cells and therefore needto be hydrolyzed into low-molecular-weight products by specific extracellulardepolymerases, which can then be taken into the cells via specific transportsystems. Solventogenic
clostridia
have the ability to utilize a wide spectrum ofcarbohydrates through the secretion of several extracellular amylolytic enzymes.
Several amylolytic enzymes with different modes of action necessary forefficient and complete breakdown of starch to glucose have been identified in thesolventogenic
clostridia
. They include
α
-amylase,
β
-amylase, glucoamylase,
α
-glucosidase, and pullulanase, and their mode of action and linkages hydrolyzedin the starch molecule and products formed are summarized in Table 6.1.
Amylases are enzymes that act on starch, glycogen, and derived polysaccha-rides. They hydrolyze
α
-1, 4 or
α
-1, 6 glucosidic bonds between consecutiveglucose units.
α
-Amylase (1,4-
α
-D-glucanohydrolase; EC 3.2.1.1) catalyzes thehydrolysis of
α
-1,4 glucosidic bonds in the interior of the substrate molecule(starch, glycogen and various oligosaccharides) and produces a mixture of glu-cose, maltose, maltotriose, maltotetraose, maltopentose, maltohexaose, and oli-gosaccharides in a ratio depending on the source of the enzyme (Ezeji, 2001).The
β
-amylase (1, 4-
α
-D-glucan maltohydrolase; EC 3.2.1.2) hydrolyzes
α
-1,4glucosidic bonds in starch and oligosaccharides producing maltose units from
TABLE 6.1The Amylolytic Enzymes of the Saccharolytic Solventogenic
Clostridia
EnzymeHydrolyzed
Linkages Mode of Action Products Formed
α
-Amylase
β
-Amylase
Glucoamylase
α
-Glucosidase
Pullulanase
α
-1, 4-linkage
α
-1, 4-linkage
α
-1, 4-linkage and
α
-1, 6-linkage
α
-1, 4-linkages
α
-1, 6-linkage and pullulan and amylopectin
Endo-acting(random fashion)
Exo-acting(nonreducing end)
Exo-acting(nonreducing end)
Exo-acting(nonreducing end)
Endo-acting(random fashion)
Glucose, linear oligosaccharides and
α
-limit dextrins
Maltose and
β
-limit dextrins
Glucose
Glucose
Linear oligosaccharides and maltotriose
DK9448_C006.fm Page 102 Tuesday, March 28, 2006 3:21 PM
Production of Butanol from Corn
103
the nonreducing terminal end of the substrate. Glucoamylase (1, 4-
α
-D-glucanglucohydrolase; EC 3.2.1.3) hydrolyzes both
α
-1, 4 and
α
-1, 6 glucosidic linkagesfrom the nonreducing terminal end of the glucose units in the starch molecule.
α
-Glucosidase (
α
-D-glucoside glucohydrolase; EC 3.2.1.20) catalyzes, like glu-coamylase, the hydrolysis of the terminal nonreducing
α
-1, 4-linked glucose unitsin the starch. The preferred substrates for
α
-glucosidases are maltose, maltotriose,maltotetraose, and short oligosaccharides. Furthermore, pullulanases (
α
-dextrin6-glucanohydrolase;
EC
3.2.1.41) are enzymes that cleave -1, 6 linkages inpullulan and release maltotriose, although pullulan itself may not be the naturalsubstrate.
Synergistic action between pullulanase and
α
-amylase enzymes of
C. ther-mosulfurogenes
has been demonstrated (Spreinat and Antranikian, 1992) and an
α
-glucosidase of
C. beijerinckii
has been shown to hydrolyze both types ofglucosyl linkages (
α
-1, 4 and
α
-1, 6) (Albasheri and Mitchell, 1995). In addition,Paquet et al. (1991) purified and characterized novel
C. acetobutylicum
824
α
-amylase, which possesses some glucoamylase activity (2.7%).
B
IOCHEMISTRY
OF
B
UTANOL
P
RODUCTION
FROM
C
ORN
Solvent-forming species, including
C. acetobutylicum
and
C. beijerinckii
, aremesophilic, growing best between 30° and 40°C. The pH varies during thefermentation and can drop from an initial value of 6.8–7.0 to about 5.0–4.5(acidogenesis) and can also rise up to 7.0 later in the fermentation (solventoge-nesis). It has been suggested that the switch to solvent production is an adaptiveresponse of the cell to the low medium pH resulting from acid production (Bahlet al., 1982).
Solventogenic
clostridia
can be grown on simple media such as ground corn,molasses, whey permeate, or on semidefined and defined media. When semi-defined and defined media are used, a wide array of vitamins and minerals arerequired in addition to a carbohydrate source.
Clostridia
can utilize a wide rangeof carbohydrates.
C. acetobutylicum
and
C. beijerinckii
can utilize starch, hexoses,pentoses, and cellobiose. Currently, those
clostridia
that are able to utilize cellu-lose directly produce little or no solvents. Recently, attempts have been made toexpress cellulase genes in the solventogenic clostridia.
The uptake of carbohydrates in the solventogenic
clostridia
is achieved by aphosphoenolpyruvate (PEP)-dependent phosphotransferase system (PTS). Thismechanism involves simultaneous uptake and phosphorylation of substrate thatresults in the conversion of glucose to glucose-6-phosphate, which is subsequentlymetabolized to pyruvate via the Embden-Meyerhof-Parnas (EMP) pathway(Mitchell, 2001). Fructose is converted to fructose-1-phosphate and enters theEMP pathway upon conversion to fructose 1,6-bisphosphate. D-xylose is con-verted to D-xylulose by the xylose isomerase enzyme and the metabolism pro-ceeds by a phosphorylation reaction. The reaction is catalyzed by xylulokinase,which results in the formation of D-xylulose-5-phosphate. The pentose phosphate
DK9448_C006.fm Page 103 Tuesday, March 28, 2006 3:21 PM

104
Alcoholic Fuels
pathway utilizes enzymes transaldolase and transketolase to convert D-xylulose-5-phosphate to glyceraldehyde-3-phosphate and fructose-6-phosphate (Singh andMishra, 1995). The glyceraldehyde-3-phosphate and fructose-6-phosphate enterthe EMP pathway leading to the formation of pyruvate. The ability of solvento-genic
clostridia
to metabolize these sugars is important when corn is consideredas the starting material for fermentation, as all of these sugars can be derivedfrom corn or corn coproducts.
Solvent producing
clostridia
metabolize substrates in a biphasic fermentationfashion. During the first phase, acid intermediates (acetic and butyric acids),hydrogen, and a large amount of ATP are produced. In the second phase, butanol,acetone, and ethanol are produced, and hydrogen and ATP production decrease(Jones and Woods, 1986). CO
2
is produced during both phases of growth—twomoles are produced from each mole of glucose metabolized to pyruvate—butCO
2
production in the solventogenic phase is higher as an additional mole isproduced for every mole of acetone produced. The simplified overall fermentationpathway is given in Figure 6.1.
During the acidogenic phase, cells typically grow exponentially due to thehigh amount of ATP (3.25 mol/mol of glucose) being produced (Jones and Woods,1986). The enzymes phosphate acetyltransferase and acetate kinase convertacetyl-CoA to acetate and, analogously, phosphate butyltransferase and butyratekinase convert butyryl-CoA to butyrate during this phase of growth. The pH ofthe fermentation broth decreases as butyric and acetic acids accumulate. Theacetic and butyric acids produced during the fermentation may be freely perme-able to the cell membrane and these acids equilibrate the internal (bacterial) andfermentation broth pH. Both reduction of pH and accumulation of acetate andbutyrate have been associated with triggering solventogenesis (Jones and Woods,1986).
The solventogenic phase is typically associated with stationary phase. ATPproduction is reduced to 2 mol/mol of glucose during this phase. The fermentationintermediates (acetic and butyric acids) are reassimilated and converted intoacetone and butanol. It has been suggested that butyric and acetic acids arereassimilated by the action of the enzyme acetoacetyl-CoA:acetate/butyrate:CoAtransferase (Andersch et al., 1983). This enzyme catalyzes the reaction thattransfers CoA from acetoacetyl-CoA to either acetate or butyrate. Acetate isconverted to acetyl-CoA, which can be converted to acetone, butanol, or ethanol.Butyrate is converted to butyryl-CoA, which can only be used to produce butanol.This is because there is no metabolic pathway to regenerate acetyl-CoA frombutyryl-CoA. When CoA is removed from acetoacetyl-CoA, acetoacetate is pro-duced, which can be transformed directly into acetone and CO
2
by acetoacetatedecarboxylase.
The central core of both the acidogenic and solventogenic pathways is theseries of reactions that produces butyryl-CoA from acetyl-CoA. Thiolase con-denses two molecules of acetyl-CoA into one molecule of acetoacetyl-CoA.Acetoacetyl-CoA is reduced to 3-hydroxybutyryl-CoA by hydroxybutyryl-CoAdehydrogenase. From this, crotonyl-CoA is formed by dehydration, catalyzed by
DK9448_C006.fm Page 104 Tuesday, March 28, 2006 3:21 PM

Production of Butanol from Corn
105
crotonase. The carbon-carbon double bond in crotonyl-CoA is reduced withNADH to produce butyryl-CoA. This last step is catalyzed by butyryl-CoAdehydrogenase (Bennett and Rudolph, 1995).
The accumulation of both acids (butyrate and acetate) and solvents (acetone,butanol, and ethanol) in the fermentation broth is toxic to the microorganism andeventually causes cell death. The shift to solventogenesis is effective in extendingthe fermentation, but the butanol produced eventually reaches toxic levels. Thepresence of butanol in the membrane increases membrane fluidity and destabilizesthe membrane and membrane-associated processes (Jones and Woods, 1986). The
FIGURE 6.1
Simplified metabolism of polysaccharides by solventogenic
clostridia
. Sym-bols: 1, Pretreatment of corn; 2, Starch hydrolysis; 3, Cellulose hydrolysis; 4, Hemicel-lulose hydrolysis; 5, Xylose uptake and subsequent breakdown breakdown via thetransketolase-transaldolase sequence; 6, Glucose uptake by the phosphotransferase system(PTS) and conversion to pyruvate by the Embden-Meyerhof-Parnas (EMP) pathway; 7,pyruvate-ferrodoxin oxidoreductase; 8, thiolase; 9, 3-hydroxybutyryl-CoA dehydrogenase,crotonase and butyryl-CoA dehydrogenase; 10, phosphate acetyltransferase and acetatekinase; 11, acetaldehyde dehydrogenase and ethanol dehydrogenase; 12, acetoacetyl-CoA:acetate/butyrate:CoA transferase and acetoacetate decarboxylase; 13, phosphatebutyltransferase and butyrate kinase; 14, butyraldehyde dehydrogenase and butanol dehy-drogenase.
extracellular
starchcellulose
corn fiber
glucose
pyruvate
acetate
acetone
acetyl-CoA
acetoacetyl-CoA
hemicellulose
xylose
intracellular
corn
1 1
1 1
2 3 4
5
6
7
8
9
10
13 14
11
12
ethanol
butyrate butyryl-CoA butanol
DK9448_C006.fm Page 105 Tuesday, March 28, 2006 3:21 PM
106
Alcoholic Fuels
maximum amount of solvents (total acetone, butanol, and ethanol) that the cellcan tolerate is 20 gL
–1
(Maddox, 1989). This limits the amount of glucose thatcan be fermented in batch culture to 60 gL
–1
because using a higher concentrationof glucose would result in incomplete substrate utilization due to butanol toxicity.Many studies today are focused on overcoming the butanol toxicity issue, whetherby developing a more butanol tolerant microorganism or by selectively removingbutanol from the fermentation broth.
B
UTANOL
P
RODUCTION
FROM
C
ORN
C
OPRODUCTS
Corn Fiber
Corn fiber is a coproduct of the corn wet-milling industry. It is a mixture of cornkernel hulls and residual starch not extracted during the wet-milling process. Cornfiber is composed of approximately 40% hemicellulose, 12% cellulose, 25%starch, 10% protein, 3% oil, and 10% other substances such as ash and lignin(Singh et al., 2003). Corn fiber represents a renewable resource that is availablein significant quantities from the corn dry- and wet-milling industries. Approxi-mately 6.3
×
10
6
dry tons of corn fiber is produced annually in the United States.Typically 4.5 lb of corn fiber is obtained from a bushel (56 lb) of corn, whichcan be converted to about 3.0 lb of fermentable sugars. The major fermentablesugars from hydrolysis of lignocellulosic biomass, such as softwood, hardwoodand grasses, rice and wheat straw, sugarcane bagasse, corn stover and corn fiber,are D-glucose and D-xylose (except that softwood also contains substantialamounts of mannose) (Sedlak and Ho, 2004). Industrial
Saccharomyces
yeaststrains used for fermenting sugars to ethanol lack the ability to utilize xylose,one of the major end products of hemicellulose hydrolysis. This is a majorobstacle for the utilization of corn fiber or other forms of lignocellulosic-basedbiomass.
Economically, it is important that both xylose and glucose present in cornfiber be fermented to butanol in order for this renewable biomass to be used asfeedstock for butanol production. Solventogenic
clostridia
have an added advan-tage over many other cultures as they can utilize both hexose and pentose sugars(Singh and Mishra, 1995) released from lignocellulosic biomass upon hydrolysisto produce butanol. Fond and Engasser (1986), during their evaluation of thefermentation of lignocellulosic hydrolysates to butanol by
C. acetobutylicum
ATCC 824, demonstrated that the culture utilized both xylose and glucose,although xylose was utilized more slowly than glucose and also supported lowerbutanol production. However,
C. beijerinckii
BA101 has been shown to utilizexylose and can effectively coferment xylose and glucose to produce butanol(Ebener et al., 2003). Parekh et al. (1988) produced acetone-butanol from hydroly-sates of pine, aspen, and corn stover using
C. acetobutylicum
P262. SimilarlyMarchal et al. (1984) used wheat straw hydrolysate and
C. acetobutylicum,
whileSoni et al. (1982) used bagasse and rice straw hydrolysates and
C. saccharoper-butylacetonicum to convert these agricultural wastes into butanol.
DK9448_C006.fm Page 106 Tuesday, March 28, 2006 3:21 PM
Production of Butanol from Corn 107
An important limitation of corn fiber utilization comes from the pretreatmentand hydrolysis of corn fiber to glucose and xylose. Saccharification of corn fibercan readily be achieved by treatment with dilute H2SO4. However, this acid-catalyzed reaction leads to the degradation of glucose to hydroxy methyl furfural(HMF) and xylose to furfural at the temperatures of hydrolysis, resulting ininhibition of fermentation by these degradation products. Other degradation prod-ucts include syringaldehyde, acetic, ferulic, and glucuronic acids. The formationof these degradation products lowers the yield of fermentable sugars obtainedfrom the corn fiber and the degradation products are inhibitory to yeast andbacterial fermentations. C. beijerinckii BA101 is able to completely utilizeenzyme-hydrolyzed corn fiber to produce acetone-butanol, but performed poorlyin the bioconversion of acid-hydrolyzed corn fiber to acetone-butanol due to thepresence of inhibitory compounds generated during hydrolysis (Ebener et al.,2003). Therefore, the development of strains that can tolerate the inhibitorycompounds generated during acid pretreatment and hydrolysis of corn fiberremains a priority.
Corn Steep Water
Corn steep water (CSW) is a by-product of the corn wet-milling industry andcontains large amounts of substances derived from the fermentative conversionof carbohydrates, proteins, and lipids during corn steeping. Currently, CSW isevaporated to 50% solids and marketed primarily as an economical livestock feedsupplement in the cattle industry. CSW is a rich complement of important nutri-ents such as nitrogen, amino acids, vitamins, and minerals and was proposed tobe a good substitute for yeast extract (Hull et al., 1996). This finding is importantas it impacts the economics of butanol production from corn.
An economic analysis performed by Qureshi and Blaschek (2000a), demon-strated that the fermentation substrate was one of the most important factors thatinfluenced the price of butanol. Development of a cost-effective biomass-to-butanol process can only be commercially viable if cheaper commercial substratesuch as liquefied corn starch and CSW can be used in combination with toxicproduct removal by gas stripping (Ezeji et al., 2005). It is interesting to note thatC. beijerinckii BA101 when grown on liquefied corn starch-CSW medium pro-duced levels of acetone-butanol equal to or higher than the levels produced whengrown on glucose-based yeast extract medium (Ezeji et al., 2005). The fermen-tation time for liquefied corn starch- and saccharified liquefied corn starch-CSWmedia were 120 and 78 h, respectively, while the fermentation time for glucose-based yeast extract medium was 68 h. The presence of sodium metabisulfite(Na2S2O5; a preservative) in the liquefied starch and CSW was found to result ininhibition of C. beijerinckii BA101 and also may have affected the secretion ofamylolytic enzymes by the culture, which is necessary for efficient hydrolysisand utilization of starch and oligosaccharides. However, it appears that the useof CSW has a great potential for the bioconversion of corn to acetone-butanol.The presence of Na2S2O5 in the CSW may be a major problem in a long-term
DK9448_C006.fm Page 107 Tuesday, March 28, 2006 3:21 PM

108 Alcoholic Fuels
fermentation by C. beijerinckii BA101. During a long-term fermentation usingCSW and C. beijerinckii BA101, removal of Na2S2O5 from CSW by oxidationis recommended (Ezeji et al., 2005).
BUTANOL PRODUCTION PROCESSES
Batch Process
Batch fermentation is the most commonly studied process for butanol production.In the batch process the substrate (feed) and nutrients are charged into the reactorthat can be used by the culture. In a batch process, a usual substrate concentrationof 60–80 gL–1 is used as higher concentration results in residual substrate beingin the reactor. The reaction mixture is then autoclaved at 121°C for 15 minutesfollowed by cooling to 35–37°C and inoculation with the seed culture. Duringcooling, nitrogen, or carbon dioxide is swept across the surface to keep themedium anaerobic. After inoculation, the medium is sparged with these gases tomix the inoculum. Details of seed development and inoculation have been pub-lished elsewhere (Formanek et al., 1997; Qureshi and Blaschek, 1999a). Depend-ing on the size of the final fermentor, the seed may have to be transferred severaltimes before it is ready for the production fermentor.
Various substrates can be used to produce butanol including corn, molasses,whey permeate, or glucose derived from corn (Qureshi and Blaschek, 2005).However, some substrates may require processing prior to fermentation, knownas “upstream processing,” such as dilution, concentration, centrifugation, filtra-tion, hydrolysis, etc. The usual batch fermentation time lasts from 48 to 72 hafter which butanol is recovered, usually by distillation. During this fermentationperiod, ABE up to 33 gL–1 is produced using hyperbutanol producing C. beijer-inckii BA101 (Chen and Blaschek, 1999; Formanek et al., 1997). This cultureresults in a solvent yield of 0.40–0.42 (Formanek et al., 1997). The ABE con-centration in the fermentation broth is limited due to butanol inhibition to thecell. At a butanol concentration of approximately 20 gL–1, strong cell growthinhibition occurs that kills the cells and stops the fermentation. Butanol produc-tion is a biphasic fermentation where acetic and butyric acids are produced duringacidogenic phase followed by their conversion into acetone and butanol (solven-togenic phase). During the acidogenic phase, the pH drops due to acid productionand subsequently rises during solvent production. At the end of fermentation, cellmass and other suspended solids (if any) are removed by centrifugation and soldas cattle feed. Figure 6.2 shows fermentation profile of butanol production in atypical batch fermentation process from cornstarch using C. beijerinckii BA101.
Butanol can be produced both by using corn coproduct from i) corn dry-grindand ii) wet-milling processes. During the dry-grind process corn fiber and germare not removed prior to fermentation. At the end of fermentation (after starchutilization during fermentation), corn fiber and other insoluble solids are removedby centrifugation, dried, and sold as cattle feed. The dried solids are known as“Distillers Dry Grain Solids” or DDGS. On the contrary, during the wet-milling
DK9448_C006.fm Page 108 Tuesday, March 28, 2006 3:21 PM
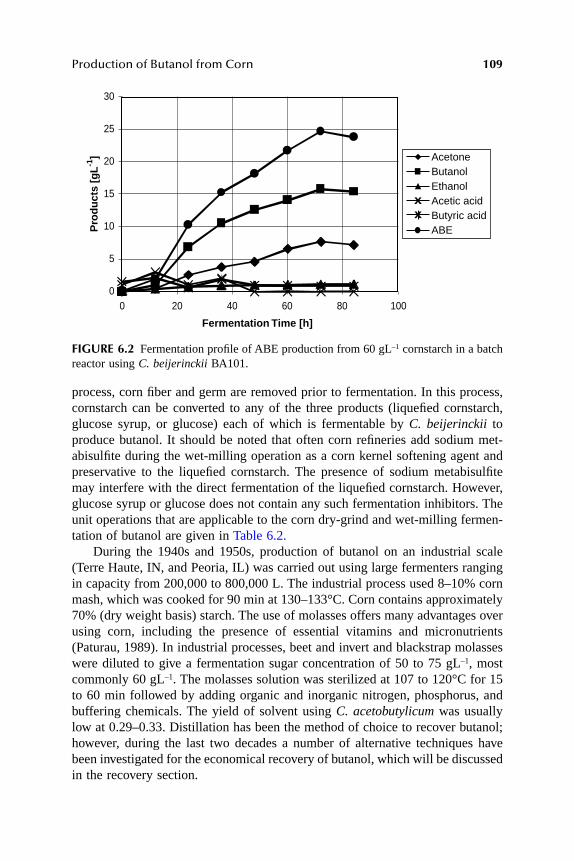
Production of Butanol from Corn 109
process, corn fiber and germ are removed prior to fermentation. In this process,cornstarch can be converted to any of the three products (liquefied cornstarch,glucose syrup, or glucose) each of which is fermentable by C. beijerinckii toproduce butanol. It should be noted that often corn refineries add sodium met-abisulfite during the wet-milling operation as a corn kernel softening agent andpreservative to the liquefied cornstarch. The presence of sodium metabisulfitemay interfere with the direct fermentation of the liquefied cornstarch. However,glucose syrup or glucose does not contain any such fermentation inhibitors. Theunit operations that are applicable to the corn dry-grind and wet-milling fermen-tation of butanol are given in Table 6.2.
During the 1940s and 1950s, production of butanol on an industrial scale(Terre Haute, IN, and Peoria, IL) was carried out using large fermenters rangingin capacity from 200,000 to 800,000 L. The industrial process used 8–10% cornmash, which was cooked for 90 min at 130–133°C. Corn contains approximately70% (dry weight basis) starch. The use of molasses offers many advantages overusing corn, including the presence of essential vitamins and micronutrients(Paturau, 1989). In industrial processes, beet and invert and blackstrap molasseswere diluted to give a fermentation sugar concentration of 50 to 75 gL–1, mostcommonly 60 gL–1. The molasses solution was sterilized at 107 to 120°C for 15to 60 min followed by adding organic and inorganic nitrogen, phosphorus, andbuffering chemicals. The yield of solvent using C. acetobutylicum was usuallylow at 0.29–0.33. Distillation has been the method of choice to recover butanol;however, during the last two decades a number of alternative techniques havebeen investigated for the economical recovery of butanol, which will be discussedin the recovery section.
FIGURE 6.2 Fermentation profile of ABE production from 60 gL–1 cornstarch in a batchreactor using C. beijerinckii BA101.
Fermentation Time [h]
Pro
du
cts
[gL
-1]
30
25
20
15
10
5
0
AcetoneButanolEthanolAcetic acidButyric acidABE
0 20 40 60 80 100
DK9448_C006.fm Page 109 Tuesday, March 28, 2006 3:21 PM

110 Alcoholic Fuels
Batch Process with Concentrated Sugar Solutions
Due to the toxic nature of butanol, the initial substrate concentration is limitedto <80 gL–1 (usually 60 gL–1). A substrate concentration in excess of this resultsin a high residual substrate, thus resulting in inefficient sugar utilization andincreased BOD (biological oxygen demand) load for wastewater treatment. How-ever, recent developments in downstream processing (recovery) of ABE havemade it possible to use concentrated sugar solutions for this fermentation. Duringthe fermentation, the toxic products are removed simultaneously, thus relievinginhibition that results in the utilization of more substrate. The details of therecovery techniques are given in the recovery section (3.1). Employing butanolremoval techniques, sugar solutions containing 161 gL–1 glucose (C. beijerinckii;Ezeji et al., 2003) and 227 gL–1 lactose (C. acetobutylicum; Qureshi and Maddox,2005) have been successfully used. Use of concentrated glucose and lactosesolutions has resulted in the production of 76 and 137 gL–1 ABE, respectively.In such fermentations, fewer acids are produced, thus improving the ABE yield.In another process, 200 gL–1 lactose was successfully fermented in a batch reactorof C. acetobutylicum when integrated with product recovery by gas stripping(Maddox et al., 1995). This system resulted in the production of 70 gL–1 ABEwith a productivity of 0.32 gL–1h–1 as compared to 0.07 gL–1h–1 in the controlbatch reactor. Studies reported in this section demonstrated that a fermentation
TABLE 6.2Unit Operations That Can Be Applied to Butanol Production Employing Corn Dry-Grind and Wet-Milling Processes
Unit OperationsButanol Production by
Dry-Grind ProcessButanol Production by
Wet-Milling Process
Batch fermentation x xBatch process with concentrated feed – xFed-batch fermentation – xContinuous fermentation Difficult due to starch
viscosity xImmobilized cell fermentation – xCell recycle – x
Recovery by gas stripping Possible xPervaporation Possible; solids
separation prior to recovery essential x
Liquid-liquid extraction Same as above xPerstraction Same as above x
Note: Numbers before unit operations are section numbers in this chapter.x - applicable – Not possible
DK9448_C006.fm Page 110 Tuesday, March 28, 2006 3:21 PM
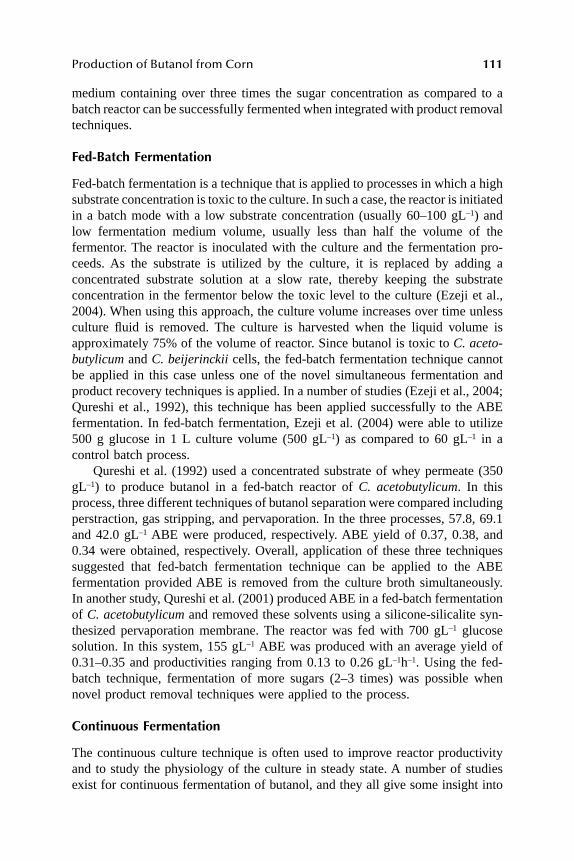
Production of Butanol from Corn 111
medium containing over three times the sugar concentration as compared to abatch reactor can be successfully fermented when integrated with product removaltechniques.
Fed-Batch Fermentation
Fed-batch fermentation is a technique that is applied to processes in which a highsubstrate concentration is toxic to the culture. In such a case, the reactor is initiatedin a batch mode with a low substrate concentration (usually 60–100 gL–1) andlow fermentation medium volume, usually less than half the volume of thefermentor. The reactor is inoculated with the culture and the fermentation pro-ceeds. As the substrate is utilized by the culture, it is replaced by adding aconcentrated substrate solution at a slow rate, thereby keeping the substrateconcentration in the fermentor below the toxic level to the culture (Ezeji et al.,2004). When using this approach, the culture volume increases over time unlessculture fluid is removed. The culture is harvested when the liquid volume isapproximately 75% of the volume of reactor. Since butanol is toxic to C. aceto-butylicum and C. beijerinckii cells, the fed-batch fermentation technique cannotbe applied in this case unless one of the novel simultaneous fermentation andproduct recovery techniques is applied. In a number of studies (Ezeji et al., 2004;Qureshi et al., 1992), this technique has been applied successfully to the ABEfermentation. In fed-batch fermentation, Ezeji et al. (2004) were able to utilize500 g glucose in 1 L culture volume (500 gL–1) as compared to 60 gL–1 in acontrol batch process.
Qureshi et al. (1992) used a concentrated substrate of whey permeate (350gL–1) to produce butanol in a fed-batch reactor of C. acetobutylicum. In thisprocess, three different techniques of butanol separation were compared includingperstraction, gas stripping, and pervaporation. In the three processes, 57.8, 69.1and 42.0 gL–1 ABE were produced, respectively. ABE yield of 0.37, 0.38, and0.34 were obtained, respectively. Overall, application of these three techniquessuggested that fed-batch fermentation technique can be applied to the ABEfermentation provided ABE is removed from the culture broth simultaneously.In another study, Qureshi et al. (2001) produced ABE in a fed-batch fermentationof C. acetobutylicum and removed these solvents using a silicone-silicalite syn-thesized pervaporation membrane. The reactor was fed with 700 gL–1 glucosesolution. In this system, 155 gL–1 ABE was produced with an average yield of0.31–0.35 and productivities ranging from 0.13 to 0.26 gL–1h–1. Using the fed-batch technique, fermentation of more sugars (2–3 times) was possible whennovel product removal techniques were applied to the process.
Continuous Fermentation
The continuous culture technique is often used to improve reactor productivityand to study the physiology of the culture in steady state. A number of studiesexist for continuous fermentation of butanol, and they all give some insight into
DK9448_C006.fm Page 111 Tuesday, March 28, 2006 3:21 PM
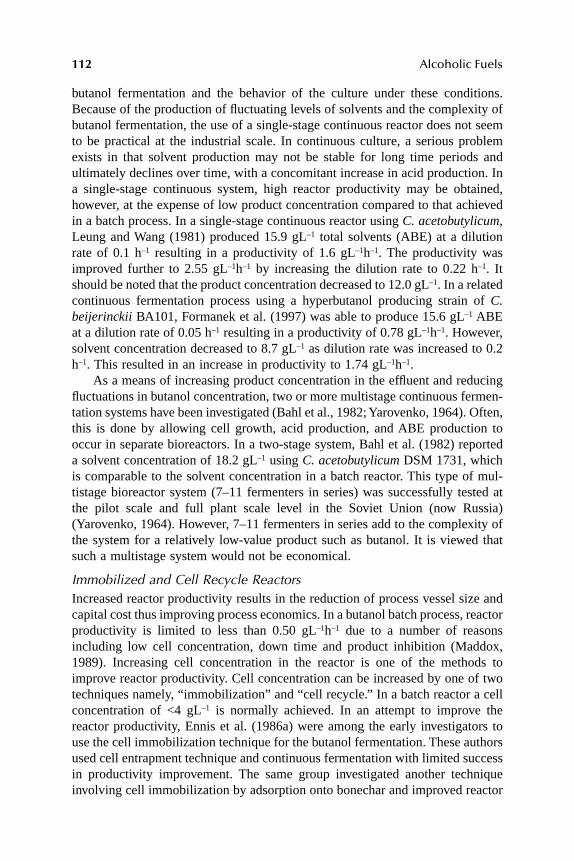
112 Alcoholic Fuels
butanol fermentation and the behavior of the culture under these conditions.Because of the production of fluctuating levels of solvents and the complexity ofbutanol fermentation, the use of a single-stage continuous reactor does not seemto be practical at the industrial scale. In continuous culture, a serious problemexists in that solvent production may not be stable for long time periods andultimately declines over time, with a concomitant increase in acid production. Ina single-stage continuous system, high reactor productivity may be obtained,however, at the expense of low product concentration compared to that achievedin a batch process. In a single-stage continuous reactor using C. acetobutylicum,Leung and Wang (1981) produced 15.9 gL–1 total solvents (ABE) at a dilutionrate of 0.1 h–1 resulting in a productivity of 1.6 gL–1h–1. The productivity wasimproved further to 2.55 gL–1h–1 by increasing the dilution rate to 0.22 h–1. Itshould be noted that the product concentration decreased to 12.0 gL–1. In a relatedcontinuous fermentation process using a hyperbutanol producing strain of C.beijerinckii BA101, Formanek et al. (1997) was able to produce 15.6 gL–1 ABEat a dilution rate of 0.05 h–1 resulting in a productivity of 0.78 gL–1h–1. However,solvent concentration decreased to 8.7 gL–1 as dilution rate was increased to 0.2h–1. This resulted in an increase in productivity to 1.74 gL–1h–1.
As a means of increasing product concentration in the effluent and reducingfluctuations in butanol concentration, two or more multistage continuous fermen-tation systems have been investigated (Bahl et al., 1982; Yarovenko, 1964). Often,this is done by allowing cell growth, acid production, and ABE production tooccur in separate bioreactors. In a two-stage system, Bahl et al. (1982) reporteda solvent concentration of 18.2 gL–1 using C. acetobutylicum DSM 1731, whichis comparable to the solvent concentration in a batch reactor. This type of mul-tistage bioreactor system (7–11 fermenters in series) was successfully tested atthe pilot scale and full plant scale level in the Soviet Union (now Russia)(Yarovenko, 1964). However, 7–11 fermenters in series add to the complexity ofthe system for a relatively low-value product such as butanol. It is viewed thatsuch a multistage system would not be economical.
Immobilized and Cell Recycle ReactorsIncreased reactor productivity results in the reduction of process vessel size andcapital cost thus improving process economics. In a butanol batch process, reactorproductivity is limited to less than 0.50 gL–1h–1 due to a number of reasonsincluding low cell concentration, down time and product inhibition (Maddox,1989). Increasing cell concentration in the reactor is one of the methods toimprove reactor productivity. Cell concentration can be increased by one of twotechniques namely, “immobilization” and “cell recycle.” In a batch reactor a cellconcentration of <4 gL–1 is normally achieved. In an attempt to improve thereactor productivity, Ennis et al. (1986a) were among the early investigators touse the cell immobilization technique for the butanol fermentation. These authorsused cell entrapment technique and continuous fermentation with limited successin productivity improvement. The same group investigated another techniqueinvolving cell immobilization by adsorption onto bonechar and improved reactor
DK9448_C006.fm Page 112 Tuesday, March 28, 2006 3:21 PM
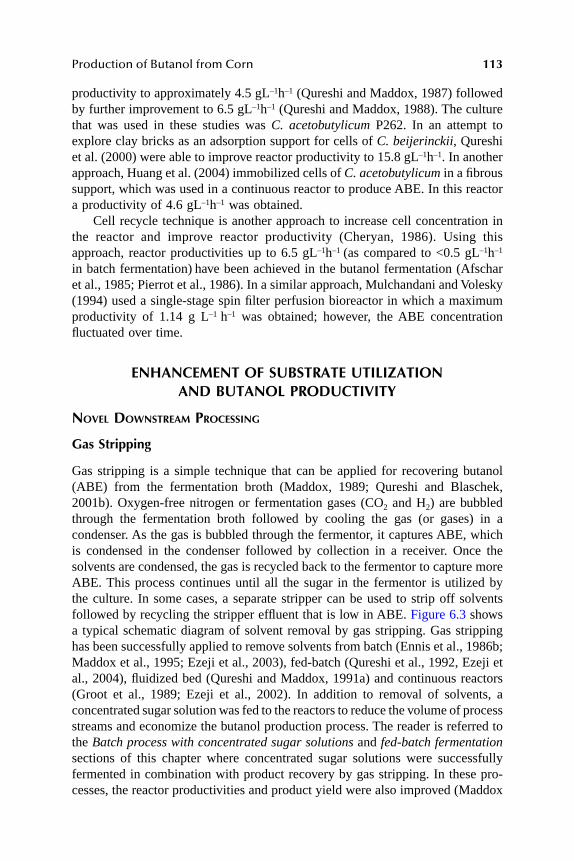
Production of Butanol from Corn 113
productivity to approximately 4.5 gL–1h–1 (Qureshi and Maddox, 1987) followedby further improvement to 6.5 gL–1h–1 (Qureshi and Maddox, 1988). The culturethat was used in these studies was C. acetobutylicum P262. In an attempt toexplore clay bricks as an adsorption support for cells of C. beijerinckii, Qureshiet al. (2000) were able to improve reactor productivity to 15.8 gL–1h–1. In anotherapproach, Huang et al. (2004) immobilized cells of C. acetobutylicum in a fibroussupport, which was used in a continuous reactor to produce ABE. In this reactora productivity of 4.6 gL–1h–1 was obtained.
Cell recycle technique is another approach to increase cell concentration inthe reactor and improve reactor productivity (Cheryan, 1986). Using thisapproach, reactor productivities up to 6.5 gL–1h–1 (as compared to <0.5 gL–1h–1
in batch fermentation) have been achieved in the butanol fermentation (Afscharet al., 1985; Pierrot et al., 1986). In a similar approach, Mulchandani and Volesky(1994) used a single-stage spin filter perfusion bioreactor in which a maximumproductivity of 1.14 g L–1 h–1 was obtained; however, the ABE concentrationfluctuated over time.
ENHANCEMENT OF SUBSTRATE UTILIZATION AND BUTANOL PRODUCTIVITY
NOVEL DOWNSTREAM PROCESSING
Gas Stripping
Gas stripping is a simple technique that can be applied for recovering butanol(ABE) from the fermentation broth (Maddox, 1989; Qureshi and Blaschek,2001b). Oxygen-free nitrogen or fermentation gases (CO2 and H2) are bubbledthrough the fermentation broth followed by cooling the gas (or gases) in acondenser. As the gas is bubbled through the fermentor, it captures ABE, whichis condensed in the condenser followed by collection in a receiver. Once thesolvents are condensed, the gas is recycled back to the fermentor to capture moreABE. This process continues until all the sugar in the fermentor is utilized bythe culture. In some cases, a separate stripper can be used to strip off solventsfollowed by recycling the stripper effluent that is low in ABE. Figure 6.3 showsa typical schematic diagram of solvent removal by gas stripping. Gas strippinghas been successfully applied to remove solvents from batch (Ennis et al., 1986b;Maddox et al., 1995; Ezeji et al., 2003), fed-batch (Qureshi et al., 1992, Ezeji etal., 2004), fluidized bed (Qureshi and Maddox, 1991a) and continuous reactors(Groot et al., 1989; Ezeji et al., 2002). In addition to removal of solvents, aconcentrated sugar solution was fed to the reactors to reduce the volume of processstreams and economize the butanol production process. The reader is referred tothe Batch process with concentrated sugar solutions and fed-batch fermentationsections of this chapter where concentrated sugar solutions were successfullyfermented in combination with product recovery by gas stripping. In these pro-cesses, the reactor productivities and product yield were also improved (Maddox
DK9448_C006.fm Page 113 Tuesday, March 28, 2006 3:21 PM
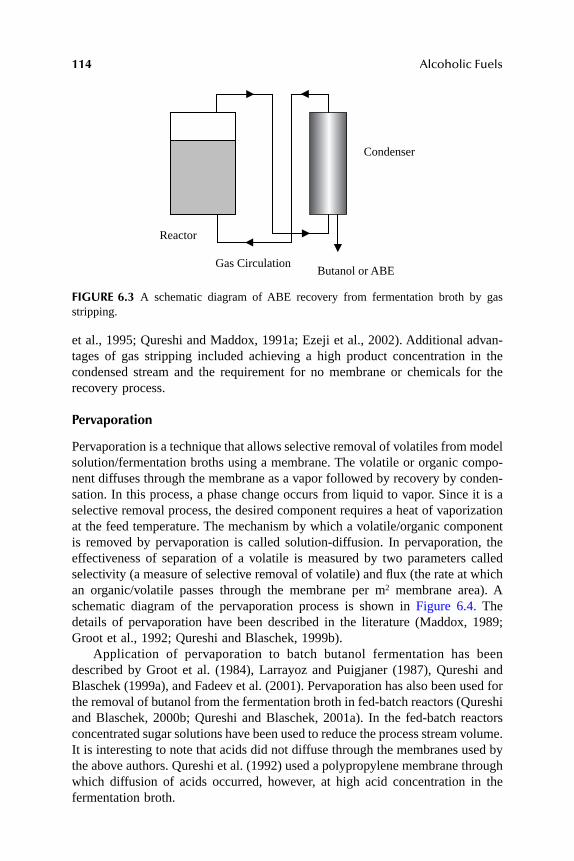
114 Alcoholic Fuels
et al., 1995; Qureshi and Maddox, 1991a; Ezeji et al., 2002). Additional advan-tages of gas stripping included achieving a high product concentration in thecondensed stream and the requirement for no membrane or chemicals for therecovery process.
Pervaporation
Pervaporation is a technique that allows selective removal of volatiles from modelsolution/fermentation broths using a membrane. The volatile or organic compo-nent diffuses through the membrane as a vapor followed by recovery by conden-sation. In this process, a phase change occurs from liquid to vapor. Since it is aselective removal process, the desired component requires a heat of vaporizationat the feed temperature. The mechanism by which a volatile/organic componentis removed by pervaporation is called solution-diffusion. In pervaporation, theeffectiveness of separation of a volatile is measured by two parameters calledselectivity (a measure of selective removal of volatile) and flux (the rate at whichan organic/volatile passes through the membrane per m2 membrane area). Aschematic diagram of the pervaporation process is shown in Figure 6.4. Thedetails of pervaporation have been described in the literature (Maddox, 1989;Groot et al., 1992; Qureshi and Blaschek, 1999b).
Application of pervaporation to batch butanol fermentation has beendescribed by Groot et al. (1984), Larrayoz and Puigjaner (1987), Qureshi andBlaschek (1999a), and Fadeev et al. (2001). Pervaporation has also been used forthe removal of butanol from the fermentation broth in fed-batch reactors (Qureshiand Blaschek, 2000b; Qureshi and Blaschek, 2001a). In the fed-batch reactorsconcentrated sugar solutions have been used to reduce the process stream volume.It is interesting to note that acids did not diffuse through the membranes used bythe above authors. Qureshi et al. (1992) used a polypropylene membrane throughwhich diffusion of acids occurred, however, at high acid concentration in thefermentation broth.
FIGURE 6.3 A schematic diagram of ABE recovery from fermentation broth by gasstripping.
Reactor
Gas CirculationButanol or ABE
Condenser
DK9448_C006.fm Page 114 Tuesday, March 28, 2006 3:21 PM
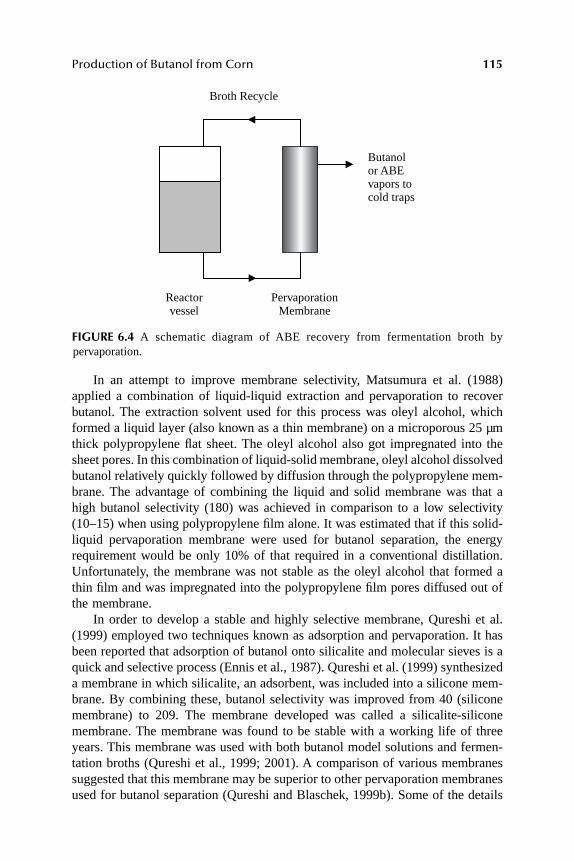
Production of Butanol from Corn 115
In an attempt to improve membrane selectivity, Matsumura et al. (1988)applied a combination of liquid-liquid extraction and pervaporation to recoverbutanol. The extraction solvent used for this process was oleyl alcohol, whichformed a liquid layer (also known as a thin membrane) on a microporous 25 µmthick polypropylene flat sheet. The oleyl alcohol also got impregnated into thesheet pores. In this combination of liquid-solid membrane, oleyl alcohol dissolvedbutanol relatively quickly followed by diffusion through the polypropylene mem-brane. The advantage of combining the liquid and solid membrane was that ahigh butanol selectivity (180) was achieved in comparison to a low selectivity(10–15) when using polypropylene film alone. It was estimated that if this solid-liquid pervaporation membrane were used for butanol separation, the energyrequirement would be only 10% of that required in a conventional distillation.Unfortunately, the membrane was not stable as the oleyl alcohol that formed athin film and was impregnated into the polypropylene film pores diffused out ofthe membrane.
In order to develop a stable and highly selective membrane, Qureshi et al.(1999) employed two techniques known as adsorption and pervaporation. It hasbeen reported that adsorption of butanol onto silicalite and molecular sieves is aquick and selective process (Ennis et al., 1987). Qureshi et al. (1999) synthesizeda membrane in which silicalite, an adsorbent, was included into a silicone mem-brane. By combining these, butanol selectivity was improved from 40 (siliconemembrane) to 209. The membrane developed was called a silicalite-siliconemembrane. The membrane was found to be stable with a working life of threeyears. This membrane was used with both butanol model solutions and fermen-tation broths (Qureshi et al., 1999; 2001). A comparison of various membranessuggested that this membrane may be superior to other pervaporation membranesused for butanol separation (Qureshi and Blaschek, 1999b). Some of the details
FIGURE 6.4 A schematic diagram of ABE recovery from fermentation broth bypervaporation.
Reactorvessel
PervaporationMembrane
Broth Recycle
Butanolor ABEvapors tocold traps
DK9448_C006.fm Page 115 Tuesday, March 28, 2006 3:21 PM

116 Alcoholic Fuels
of the use of this membrane have been given in the section fed-batch fermentation(Qureshi et al., 2001) where 155 gL-1 ABE was produced in the integratedfermentation and product recovery process as compared to <20 gL–1 in a batchprocess. This membrane was so efficient that a butanol concentration up to 700gL–1 was achieved in the permeate.
Liquid-Liquid Extraction
Liquid-liquid extraction has been considered an important technique for therecovery of ABE from fermentation broths. Usually, a water-insoluble organicextractant is mixed with the fermentation broth. Butanol is more soluble in theorganic (extractant) phase than in the aqueous (fermentation broth) phase. There-fore, butanol selectively concentrates in the organic phase. Since the extractantand fermentation broth are immiscible, the extractant can easily be separatedfrom the fermentation broth after butanol extraction. Liquid-liquid extraction isable to remove fermentation products without removing substrates, water, ornutrients.
In order to improve substrate utilization and productivity, liquid-liquid extrac-tion must be integrated with butanol fermentation such that simultaneous fermen-tation and butanol removal from the fermentation broth is achieved. The choiceof extractant is critical because an extractant with low partition coefficient willnot be efficient in the recovery of butanol and a toxic extractant will inhibit orkill the bacterial cells. Unfortunately, most extractants with high partition coef-ficient are toxic to the clostridia. The extractant of choice among researchers hasbeen oleyl alcohol because it is nontoxic and a good extractant as well (Evansand Wang, 1988, Groot et. al., 1990).
Perstraction
Perstraction is a butanol recovery technique similar to liquid-liquid extraction thatseeks to solve some of the problems inherent in liquid-liquid extraction. In aperstraction separation, the fermentation broth and the extractant are separatedby a membrane (Qureshi et. al., 1992). The membrane contactor provides a surfacearea where the two immiscible phases can exchange the butanol. Since there isno direct contact between the two phases, extractant toxicity, phase dispersion,emulsion and rag layer formation are drastically reduced or eliminated. In sucha system, butanol should diffuse preferentially across the membrane, while othercomponents such as medium compositions and fermentation intermediates (aceticand butyric acids) should be retained in the aqueous phase. The total masstransport of butanol from the fermentation broth to the organic side depends onthe rate of diffusion of butanol across the membrane. The net movement ismeasured as membrane flux or rate of movement, J = dQb/dt, where J = net fluxand dQb/dt = diffusion rate (influx + efflux) of butanol. The membrane does,however, present a physical barrier that can limit the rate of solvent extraction.
DK9448_C006.fm Page 116 Tuesday, March 28, 2006 3:21 PM
Production of Butanol from Corn 117
ECONOMIC SCENARIOS
ECONOMICS OF BUTANOL PRODUCTION
In recent years a number of economic studies have been performed on theproduction of butanol from corn (Marlatt and Datta, 1986; Qureshi and Blaschek,2000a; 2001a), whey permeate (Qureshi and Maddox, 1991b; 1992), and molasses(Qureshi and Maddox, 1991b; 1992). In these studies, it has been determinedthat distillative recovery of butanol from fermentation broth is not economical ascompared to butanol derived from petrochemicals (current route). It has also beenidentified that new developments in process technology for butanol productionfrom renewable substrates allows for a significant reduction in the price ofbutanol. The price of butanol derived from corn also depends upon the coproductscredit, which is significant. Currently, it is anticipated that the petrochemicalindustries would reduce the price of butanol in an attempt to prevent the fermen-tative production of butanol from being successful. At present, the petrochemicalindustries have a monopoly with respect to the butanol market.
To bring fermentatively derived butanol closer to commercialization andcompete with petrochemically derived butanol, it is suggested that research befocused on the development of superior cultures (as compared to the existingstrains: C. beijerinckii BA101 and C. acetobutylicum PJC4BK). These culturesproduce total ABE on the order of 25-33 gL–1 (Formanek et al., 1997; Chen andBlaschek, 1999; Harris et al., 2000). Further improvements in ABE yield, whichis 0.40–0.42 when using C. beijerinckii BA101, should also be examined. Othercultures have been reported to result in a product yield of approximately 0.30.Material balance suggests that approximately 53% of carbon is lost as CO2,indicating that only 47% of the substrate is directed for the product conversion.
Another problem with butanol fermentation is the inability of these culturesto use sugars derived from economically available substrates such as corn fiberhydrolysate (Ebener et al., 2003). As with corn fiber hydrolysate, it is anticipatedthat sugars derived from hydrolysed corn stalks, wheat straw, and rice husk wouldnot be utilized without pretreatment of these substrates, which would further addto the processing cost. In order to meet these challenges, new strains capable ofutilizing agricultural biomass derived sugars should be developed. Alternately,economic methods capable of removing inhibitors from the hydrolysates shouldbe developed. Simultaneous saccharification and fermentation is another approachthat should be investigated for this process.
CONCLUSION
The production of butanol via the fermentation route is a relatively complicatedprocess because the solventogenic clostridia are obligate anaerobes and the fer-mentation product (butanol) is toxic to the producing cultures. The possibility ofincorporating in-line product recovery processes such as liquid-liquid extraction,perstraction, pervaporation, and gas stripping has generated a lot of interest.
DK9448_C006.fm Page 117 Tuesday, March 28, 2006 3:21 PM
118 Alcoholic Fuels
Simultaneous butanol fermentation and recovery has dramatically improved theproductivity of butanol production from corn. By employing in-line recoverysystems during butanol fermentation, substrate inhibition and butanol toxicity tothe culture are drastically reduced. Given that butanol is an excellent potentialfuel and the United States is rich in biomass, butanol production from corn hasa bright future. As it is seen at this stage, the technology of butanol productionfrom corn (and other substrates) is ready for commercialization; however, thisalso depends upon the fluctuations in crude oil prices.
REFERENCES
Afschar, A.S., Biebl, H., Schaller, K. and Schugerl, K., Production of acetone and butanolby Clostridium acetobutylicum in continuous culture with cell recycle, Appl.Microbiol. Biotechnol., 22, 394–398, 1985.
Albasheri, K.A. and Mitchell, W.J., Identification of two α-glucosidase activities inClostridium acetobutylicum NCIB 8052, J. Appl. Bacteriol., 78, 149–156, 1995.
Andersch, W., Bahl, H. and Gottschalk, G., Level of enzymes involved in acetate, butyrate,acetone and butanol formation by Clostridium acetobutylicum, Eur. J. Appl. Micro-biol. Biotechnol., 18, 327–332, 1983.
Annous, B.A. and Blaschek, HP., Isolation and characterization of Clostridium acetobu-tylicum mutants with enhanced amylolytic activity, Appl. Environ. Microbiol., 57,2544–2548, 1991.
Bahl, H., Andersch, W. and Gottschalk, G., Continuous production of acetone and butanolby Clostridium acetobutylicum in a two-stage phosphate limited chemostat, Eur.J. Appl. Microbiol. Biotechnol., 15, 201–205, 1982.
Bennett, G.N. and Rudolph, F.B., The central metabolic pathway from acetyl-CoA tobutyryl-CoA in Clostridium acetobutylicum, FEMS Microbiol. Rev., 17, 241–249,1995.
Chen, C.K. and Blaschek, H.P., Acetate enhances solvent production and prevents degen-eration in Clostridium beijerinckii BA101, Appl. Microbiol. Biotechnol., 52,170–173, 1999.
Cheryan, M., Ultrafiltration Handbook, Technomic Press, Lancaster, PA, 1986.Dürre, P., New insights and novel developments in clostridial acetone/butanol/isopropanol
fermentation, Appl. Microbiol. Biotechnol., 49, 639–648, 1998.Ebener, J., Qureshi, N., Ezeji, T.C. and Blaschek, H.P. Corn fiber hydrolysis and fermen-
tation to butanol using Clostridium beijerinckii BA101, In Proceedings of 25thBiotechnology Symposium on Fuels and Chemicals, Breckenridge, CO, May 4–7,2003, p. 65.
Ennis, B.M., Maddox, I.S. and Schoutens, G.H. Immobilized Clostridium acetobutylicumfor continuous butanol production from whey permeate, New Zealand J. DairySci. Technol., 21, 99–109, 1986a.
Ennis, B.M., Marshall, C.T., Maddox, I.S. and Paterson, A.H.J., Continuous productrecovery by in-situ gas stripping/condensation during solvent production fromwhey permeate using Clostridium acetobutylicum, Biotechnol. Lett., 8, 725–730,1986b.
DK9448_C006.fm Page 118 Tuesday, March 28, 2006 3:21 PM
Production of Butanol from Corn 119
Ennis, B.M., Qureshi, N. and Maddox, I.S., Inline toxic product removal during solventproduction by continuous fermentation using immobilized Clostridium acetobu-tylicum, Enzym. Microbial Technol., 9, 672–675, 1987.
Evans, P.J. and Wang, H.Y., Enhancement of butanol formation by Clostridium acetobu-tylicum in the presence of decanol-oleyl alcohol mixed extractants, Appl. Env.Microbiol., 54, 1662–1667, 1988.
Ezeji, T.C., Production, purification and characterization of thermostable amylolyticenzymes from the newly isolated Bacillus thermodenitrificans HRO10. Ph.D.Dissertation. Der Andere Verlag, Kollegienwall, Osnabruek, Germany, 2001, pp.1–125.
Ezeji, T.C., Qureshi, N. and Blaschek, H.P., Continuous production of butanol usingClostridium beijerinckii BA101 and recovery by gas stripping, Clostridium 2002:The Seventh International Conference and Workshop on Regulation of Metabo-lism, Genetics and Development of the Solvent and Acid Forming Clostridia,Rostock, Germany, Sept. 19–21, 2002.
Ezeji, T.C., Qureshi, N. and Blaschek, H.P., Production of butanol by Clostridium beijer-inckii BA101 and in-situ recovery by gas stripping, World J. Microbiol. Biotech-nol., 19, 595–603, 2003.
Ezeji, T.C., Qureshi, N. and Blaschek H.P., Acetone-butanol-ethanol production fromconcentrated substrate: reduction in substrate inhibition by fed-batch techniqueand product inhibition by gas stripping, Appl. Microbiol. Biotechnol., 63, 653–658,2004.
Ezeji, T.C., Qureshi, N. and Blaschek, H.P., Toward acetone butanol (AB) fermentationcommercialization: Use of liquefied corn starch and corn steep liquor (CSL) andin situ removal by gas stripping, Biosc. Biotech. Biochem., submitted.
Fadeev, A.G., Selinskaya, Y.A., Kelley, S.S., Meagher, M.M., Litvinova, E.G., Khotimsky,V.S. and Volkov, V.V., Extraction of butanol from aqueous solutions by pervapo-ration through poly(1-trimethylsilyl-1-propyne), J. Memb. Sci., 186, 205–217,2001.
Fond, O. and Engasser, J.-M., The acetone butanol fermentation on glucose and xylose.1. Regulation and kinetics in batch cultures, Biotechnol. Bioeng., 28, 160–166,1986.
Formanek, J., Mackie, R. and Blaschek, H.P., Enhanced butanol production by Clostridiumbeijerinckii BA101 grown in semidefined P2 medium containing 6 percent mal-todextrin or glucose, Appl. Environ. Microbiol., 63, 2306–2310, 1997.
Groot, W.J., Soedjak, H.S., Donck, P.B., van der Lans, R.G.J.M. and Luyben, K.C.A.M.,Butanol recovery from fermentations by liquid-liquid extraction and membranesolvent extraction, Bioprocess Eng., 5, 203–216, 1990.
Groot, W.J., van der Lans, R.G.J.M. and Luyben, K.Ch.A.M., Batch and continuous butanolfermentation with free cells: integration with product recovery by gas stripping,Appl. Microbiol. Biotechnol., 32, 305–308, 1989.
Groot, W.J., van der Lans, R.G.J.M. and Luyben K.Ch.A.M., Technologies for butanolrecovery integrated with fermentations, Process Biochem., 27, 61–75, 1992.
Groot, W.J., van den Oever, C.E. and Kossen, N.W.F., Pervaporation for simultaneousproduct recovery in the butanol/isopropanol batch fermentation, Biotechnol. Lett.,6, 709–714, 1984.
DK9448_C006.fm Page 119 Tuesday, March 28, 2006 3:21 PM

120 Alcoholic Fuels
Harris, L.M., Desai, R.P., Welker, N.E. and Papoutsakis, E.T., Characterization of recom-binant strains of the Clostridium acetobutylicum butyrate kinase inactivationmutant: Need for new phenomenological models for solventogenesis and butanolinhibition?, Biotechnol. Bioeng., 67, 1–11, 2000.
Huang, W.-C., Ramey, D.E. and Yang, S.-T., Continuous production of butanol by Clostrid-ium acetobutylicum immobilized in a fibrous bed reactor, Appl. Biochem. Biotech-nol., 113, 887–898, 2004.
Hull, S., Yang, B.Y., Venzke, D., Kulhavy, K. and Montgomery, R., Composition of cornsteep water during steeping, J. Agric. Food Chem., 44, 1857–1863, 1996.
Jensen, B.F. and Norman, B.E., Bacillus acidopullulyticus pullulanase: application andregulatory aspects for use in the food industry, Process Biochem., 19, 351–369,1984.
Jones, D.T. and Woods, D.R., Acetone-butanol fermentation revisited, Microbiol. Rev., 50,484–524, 1986.
Ladisch, M.R., Fermentation—derived butanol and scenarios for its uses in energy—related applications, Enzyme Microb. Technol., 13, 280–283, 1991.
Larrayoz, M.A. and Puigjaner, L., Study of butanol extraction through pervaporation inacetobutylic fermentation, Biotechnol. Bioeng., 30, 692–696, 1987.
Leung, J.C.Y. and Wang, D.I.C., Production of acetone and butanol by Clostridium ace-tobutylicum in continuous culture using free cells and immobilized cells, In: Proc.2nd World Cong. Chem. Eng., 1, 348–352, 1981.
Maddox, I.S., The acetone-Butanol-Ethanol Fermentation: Recent Progress in Technology,Biotechnol. Genetic Eng. Reviews, 7, 190–220, 1989.
Maddox, I.S., Qureshi, N. and Roberts-Thompson, K., Production of acetone-butanol-ethanol from concentrated substrates using Clostridium acetobutylicum in anintegrated fermentation-product removal process, Process Biochem., 30, 209–215,1995.
Marchal, R., Rebeller, M. and Vandecasteele, J.P., Direct bioconversion of alkali-pretreatedstraw using simultaneous enzymatic hydrolysis and acetone butanol production,Biotechnol. Lett., 6, 523–528, 1984.
Marlatt, J.A., Datta, R. Acetone-butanol fermentation process development and economicevaluation, Biotechnol. Prog., 2, 23–28, 1986.
Matsumura, M., Kataoka, H., Sueki, M. and Araki, K., Energy saving effect of pervapo-ration using oleyl alcohol liquid membrane in butanol purification, Bioproc. Eng.,3, 93–100, 1988.
Mitchell, W.J., Biology and Physiology, In Clostridia: Biotechnology and Medical Appli-cations, Bahl, H., Durre, P., Eds., Wiley, Weinheim, Germany, 49–104, 2001.
Mulchandani, A. and Volesky, B., Production of acetone-butanol-ethanol by Clostridiumacetobutylicum using a spin filter perfusion bioreactor, J. Biotechnol., 34, 51–60,1994.
Paquet, V., Croux, C., Goma, G. and Soucaille, P., Purification and characterization of theextracellular α-amylase from Clostridium acetobutylicum ATCC 824, Appl. Envi-ron. Microbiol., 57, 212–218, 1991.
Parekh, S.R., Parekh, R.S. and Wayman, M., Ethanol and butanol production by fermen-tation of enzymatically saccharified SO2-prehydrolyzed lignocellulosics, Enzym.Microb. Technol., 10, 660–668, 1988.
Paturau, J.M., By-products of cane sugar industry: An introduction to their industrializedutilization, 3rd ed., Elsevier, New York, 1989, pp. 265–285.
DK9448_C006.fm Page 120 Tuesday, March 28, 2006 3:21 PM
Production of Butanol from Corn 121
Pierrot, P., Fick, M. and Engasser, JM., Continuous acetone-butanol fermentation withhigh productivity by cell ultrafiltration and recycling, Biotechnol. Lett., 8,253–256, 1986.
Qureshi, N. and Blaschek, H.P., Production of acetone-butanol-ethanol (ABE) by a hyper-butanol producing mutant strain of Clostridium beijerinckii BA101 and recoveryby pervaporation, Biotechnol. Prog., 15, 594–602, 1999a.
Qureshi, N. and Blaschek, H.P., Butanol recovery from model solution/fermentation brothby pervaporation: Evaluation of membrane performance, Biomass Bioenergy, 17,175–184, 1999b.
Qureshi, N., and Blaschek, H.P., Economics of butanol fermentation using hyper-butanolproducing Clostridium beijerinckii BA101, Trans. Institution Chemical Engineers(Trans IChemE), (Chemical Engineering Research and Design), 78, 139–144,2000a.
Qureshi, N., and Blaschek, H.P., Butanol production using hyper-butanol producing mutantstrain of Clostridium beijerinckii BA101 and recovery by pervaporation, Appl.Biochem. Biotechnol., 84, 225–235, 2000b.
Qureshi, N., and Blaschek, H.P., Evaluation of recent advances in butanol fermentation,upstream and downstream processing, Bioproc. Biosyst. Eng., 24, 219–226, 2001a.
Qureshi, N., and Blaschek, H.P., Recovery of butanol from fermentation broth by gasstripping, Renewable Energy: An International Journal, 22, 557–564, 2001b.
Qureshi, N. and Blaschek, H.P., Butanol production from agricultural biomass, In Advancesin Food Biotechnology, Shetty, K., Pometo, A. and Paliyath, G., Eds, Taylor &Francis, New York, 2005 (in press).
Qureshi, N. and Maddox, I.S., Continuous solvent production from whey permeate usingcells of Clostridium acetobutylicum immobilized by adsorption onto bonechar,Enz. Microbial Technol., 9, 668–671, 1987.
Qureshi, N., and Maddox, I.S., Reactor design for the ABE fermentation using cells ofClostridium acetobutylicum immobilized by adsorption onto bonechar, BioprocEng., 3, 69–72, 1988.
Qureshi, N. and Maddox, I.S., Integration of continuous production and recovery ofsolvents from whey permeate: Use of immobilized cells of Clostridium acetobu-tylicum in fluidized bed bioreactor coupled with gas stripping, Bioproc. Eng., 6,63–69, 1991a.
Qureshi, N. and Maddox, I.S., An economic assessment of the Acetone-Butanol-Ethanol(ABE) fermentation process, Australian J. Biotechnol., 5, 56–59, 1991b.
Qureshi, N. and Maddox, I.S., Application of novel technology to the ABE fermentationprocess: An economic analysis, Appl. Biochem. Biotechnol., 34, 441–448, 1992.
Qureshi, N. and Maddox, I.S., Reduction in butanol inhibition by perstraction: Utilizationof concentrated lactose/whey permeate by Clostridium acetobutylicum to enhancebutanol fermentation economics, Official Journal of the European Federation ofChemical Engineering: Food and Bioproducts Processing, Part C, 2005 (in press).
Qureshi, N., Maddox, I.S. and Friedl, A., Application of continuous substrate feeding tothe ABE fermentation: Relief of product inhibition using extraction, perstraction,stripping and pervaporation, Biotechnol. Prog., 8, 382–390, 1992.
Qureshi, N., Meagher, M.M., Huang, J. and Hutkins, R.W., Acetone butanol ethanol (ABE)recovery by pervaporation using silicalite-silicone composite membrane fromfed-batch reactor of Clostridium acetobutylicum, J. Memb. Sci., 187, 93–102,2001.
DK9448_C006.fm Page 121 Tuesday, March 28, 2006 3:21 PM
122 Alcoholic Fuels
Qureshi, N., Meagher, M.M. and Hutkins, R.W., Recovery of butanol from model solutionsand fermentation broth using a silicalite/silicone membrane, J. Memb. Sci., 158,115–125, 1999.
Qureshi, N., Schripsema, J., Lienhardt, J. and Blaschek, H.P., Continuous solvent produc-tion by Clostridium beijerinckii BA101 immobilized by adsorption onto brick,World J. Microbiol. Biotechnol., 16, 377–382, 2000.
Sedlak, M. and Ho, N.W.Y., Production of ethanol from cellulosic biomass hydrolysatesusing genetically engineered Saccharomyces yeast capable of cofermenting glu-cose and xylose, Appl. Biochem. Biotechnol., 113–116, 403–416, 2004.
Sherman, P.D., Kirk-Othmer Encyclopedia of Chemical Technology, 3rd ed., John Wiley,New York, 1979, Vol. 4, pp. 338–345.
Singh, V., Johnston, D.B., Moreau, R.A., Hicks, K.B., Dien, B.S. and Bothast, R.J.,Pretreatment of wet-milled corn fiber to improve recovery of corn fiber oil andphytosterols, Cereal Chem., 80, 118–122, 2003.
Singh, A. and Mishra, P., Microbial production of acetone and butanol, In MicrobialPentose Utilization: Current Applications in Biotechnology, Elsevier Science, NewYork, 1995, Vol. 33, pp. 119–220.
Soni, B.K., Das, K. and Ghose, T.K., Bioconversion of agro-wastes into acetone butanol,Biotechnol. Lett. 4, 19–22, 1982.
Spreinat, A. and Antranikian, G., Analysis of the amylolytic enzymes system of C. ther-mosulfurogenes EM1: purification and synergistic action of pullulanases and mal-tohexaose forming α-amylase, Starch 44, 305–312. U.S. Department of Energy:Office of Energy Efficiency and Renewable Energy, Office of the Biomass Pro-gram, Multiyear Plan 2004 and Beyond, Washington, DC, 2003, 1–40.
Yarovenko, V.L., Principles of the continuous alcohol and butanol-acetone fermentationprocesses, In Continuous Cultivation of Microorganisms: 2nd Symposium, Malek,I., Ed, Czechoslovakian Academy of Sciences, Prague, 1964, pp. 205–217.
DK9448_C006.fm Page 122 Tuesday, March 28, 2006 3:21 PM

Section II
Blended Fuels
DK9448_S002.fm Page 123 Friday, March 3, 2006 3:20 PM
© 2006 by Taylor & Francis Group, LLC

125
7
Ethanol Blends: E10 and E-Diesel
Shelley D. Minteer
Department of Chemistry, Saint Louis University,Missouri
CONTENTS
History of Ethanol-Based Fuels........................................................................125Oxygenated Fuels..............................................................................................126Ethanol Production............................................................................................128Engine Issues.....................................................................................................129E-Diesel .............................................................................................................131Conclusions .......................................................................................................133References .........................................................................................................133
Abstract
Ethanol was first used as a fuel for a combustion engine in 1897, butit has not emerged into the fuel market as a fuel, but rather as an oxygenate. TheUnited States, Canada, Brazil, and many other countries have adopted the use ofethanol blended with gasoline at low concentration to improve emissions. Ethanolcan also be blended with diesel at low concentrations (10% to 15%). Mostcommonly, ethanol is blended with gasoline at concentration of 10% and thisoxygenated fuel is referred to as E10 or gasohol.
HISTORY OF ETHANOL-BASED FUELS
The use of ethanol in an internal combustion engine was first investigated in 1897(1). Henry Ford originally designed the Model T in 1908 to run on ethanol, butincreasing taxes limited its use (2). The concept of employing ethanol as a fuelwas reintroduced during the fuel shortages during both World Wars, but the U.S.federal ethanol program was not started until the oil crisis of the 1970s (2). In1973, OPEC quadrupled the cost of purchasing crude oil (3), which started theresurgence of promoting ethanol as an alternative fuel for combustion engines.However, ethanol as an alternative fuel has not infiltrated the fuel market in theway blended ethanol/gasoline fuels have for automobiles.
DK9448_C007.fm Page 125 Monday, April 17, 2006 8:12 AM
© 2006 by Taylor & Francis Group, LLC

126
Alcoholic Fuels
Although research in the United States from the Society of AutomotiveEngineers showed extensive engine testing of E10 (10% ethanol/90% gasoline)in 1933, it was not until 1978 that the U.S. government established a NationalAlcohol Fuel Commission (4). In 1980, President Carter signed into the law theEnergy Security Act containing Title 11, which is commonly called the BiomassEnergy and Alcohol Fuels Act of 1980 (4). The Clean Air Act of 1970 allowedthe Environmental Protection Agency (EPA) to set standards for vehicle emissionsof carbon monoxide, nitrogen oxides, and ozone (4). In 1992, the EPA startedrequiring cities that were considered to have serious or moderate carbon monoxidepollution problems to establish oxygenated fuel programs. The oxygen contentof 2.7% by wt is a required minimum for gasoline sold in these cities. Thiscorresponds to approximately 7.5% by volume ethanol and approximately 15.0%by volume methyl tertiary butyl ether (MTBE) in gasoline.
In 1994, the EPA proposed a policy that at least 30% of the oxygenate bederived from renewable resources (4). However, this proposed policy was notpassed by Congress. Ninety-five percent of the oxygenate used in Chicago isethanol (4). Ethanol has been marketed in every state except California (MTBEhas been the mandated oxygenate) (4), but currently MTBE is being phased outof California and ethanol is being phased in due to environmental issues.
In view of the recent Kyoto Conference at which the United States committedto decreasing greenhouse gas emissions by 2012 to below the 1990 level (5),ethanol/gasoline blends from E10 to E85 are an excellent way to achieve thesegreenhouse gas reductions. Argonne National Laboratory has shown that green-house gas emissions is 2.4 to 2.9% less for E10 than 100% gasoline overall (5).Most of this decrease is due to a decrease in greenhouse gas emissions fromvehicle combustion because there is actually a small increase in greenhouse gasemission from the fuel due to volatility.
OXYGENATED FUELS
Over the last 30 years, ethanol has been used widely to blend with gasoline inthe United States, Brazil, and other countries. In the United States, ethanol isusually blended in a mix of 10% ethanol and 90% gasoline. Early in the use ofethanol blends, this blend was referred to as gasohol, but it is now commonlyreferred to as E10. The purpose of blending a small percentage of ethanol intogasoline is to oxygenate the fuel for cleaner combustion and fewer carbon mon-oxide and hydrocarbon exhaust emissions. The most common additive to gasolineto improve oxygen is methyl tertiary butyl ether (MTBE), but it is an extremelytoxic chemical that has been found to contaminate groundwater. A comparisonof the emission of sulphur, olefins, carbon dioxide, aromatics, and NOx fromMTBE oxygenated gasoline and ethanol oxygenated gasoline is shown in Table7.1. The U.S. Environmental Protection Agency is beginning the process ofeliminating MTBE from gasoline (6). Iowa and South Dakota have already phasedout MTBE (2). If MTBE were completely replaced with ethanol, it would producea 12-billion-gallon market for ethanol each year (2), which is considerably more
DK9448_C007.fm Page 126 Monday, April 17, 2006 8:12 AM
© 2006 by Taylor & Francis Group, LLC
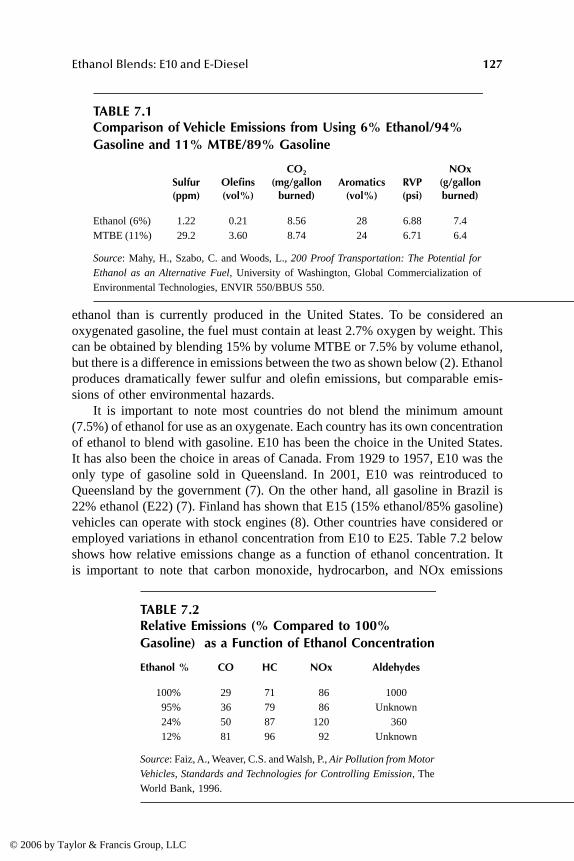
Ethanol Blends: E10 and E-Diesel
127
ethanol than is currently produced in the United States. To be considered anoxygenated gasoline, the fuel must contain at least 2.7% oxygen by weight. Thiscan be obtained by blending 15% by volume MTBE or 7.5% by volume ethanol,but there is a difference in emissions between the two as shown below (2). Ethanolproduces dramatically fewer sulfur and olefin emissions, but comparable emis-sions of other environmental hazards.
It is important to note most countries do not blend the minimum amount(7.5%) of ethanol for use as an oxygenate. Each country has its own concentrationof ethanol to blend with gasoline. E10 has been the choice in the United States.It has also been the choice in areas of Canada. From 1929 to 1957, E10 was theonly type of gasoline sold in Queensland. In 2001, E10 was reintroduced toQueensland by the government (7). On the other hand, all gasoline in Brazil is22% ethanol (E22) (7). Finland has shown that E15 (15% ethanol/85% gasoline)vehicles can operate with stock engines (8). Other countries have considered oremployed variations in ethanol concentration from E10 to E25. Table 7.2 belowshows how relative emissions change as a function of ethanol concentration. Itis important to note that carbon monoxide, hydrocarbon, and NOx emissions
TABLE 7.1Comparison of Vehicle Emissions from Using 6% Ethanol/94% Gasoline and 11% MTBE/89% Gasoline
Sulfur(ppm)
Olefins(vol%)
CO
2
(mg/gallonburned)
Aromatics(vol%)
RVP(psi)
NOx(g/gallonburned)
Ethanol (6%) 1.22 0.21 8.56 28 6.88 7.4MTBE (11%) 29.2 3.60 8.74 24 6.71 6.4
Source
: Mahy, H., Szabo, C. and Woods, L.,
200 Proof Transportation: The Potential forEthanol as an Alternative Fuel
, University of Washington, Global Commercialization ofEnvironmental Technologies, ENVIR 550/BBUS 550.
TABLE 7.2Relative Emissions (% Compared to 100% Gasoline) as a Function of Ethanol Concentration
Ethanol % CO HC NOx Aldehydes
100% 29 71 86 100095% 36 79 86 Unknown24% 50 87 120 36012% 81 96 92 Unknown
Source
: Faiz, A., Weaver, C.S. and Walsh, P.,
Air Pollution from MotorVehicles, Standards and Technologies for Controlling Emission
, TheWorld Bank, 1996.
DK9448_C007.fm Page 127 Monday, April 17, 2006 8:12 AM
© 2006 by Taylor & Francis Group, LLC
128
Alcoholic Fuels
decrease with increasing ethanol concentration, but aldehyde emissions increasewith ethanol concentrations. Also, Thailand has shown that the emission rates ofbenzene, toluene, and xylene are decreased in cars using E10 and E15 fuels (9).This decrease in emissions is important due to the major health effects (includingleukemia) of long-term inhalation of benzene and toluene (10). However, E10and E15 fuels show an increase in formaldehyde and acetaldehyde emissions andexposure to formaldehyde and acetaldehyde has been shown to cause eye irrita-tion, respiratory problems, and nervous disorders (9).
It is also important to consider that E10 is considered an oxygenated fuel,but not an alternative fuel. E85, E95, and biodiesel have large enough biofuelconcentrations to be considered alternative fuels, but E10 is simply consideredan oxygenated fuel. From 1992 to 1998, the U.S. consumption of vehicle fuelincreased by 14.5% (11). However, the U.S. consumption of alternative fuelsincreased 49.1% and the U.S. consumption of oxygenated fuels has increased96.9% (11). This shows that more consumers are using alternative and oxygenatedfuels today than in 1992. However, there has only been a 21.6% increase in theuse of ethanol as an oxygenate (12). This will likely increase as MTBE is phasedout due to environmental issues.
Ethanol is an easy fuel to work with because it is liquid at room temperature,can be stored in conventional fuel tanks, is less toxic than many fuels, and is easyto splash blend with gasoline at any stage of the production/distribution process.
ETHANOL PRODUCTION
In 2000, 29.9 billion liters of ethanol were produced worldwide (13). The majorityof the production comes from Brazil and the United States. In 2003, 2.8 billiongallons of ethanol were produced in the United States alone (2). Production in2005 is expected to be approximately 4.0 billion gallons of ethanol (8). The topfour producers of ethanol are Iowa (575 million gallons per year), Illinois (523million gallons per year), Minnesota (486 million gallons per year), and Nebraska(454 million gallons per year). These four states produce approximately 72% ofthe total ethanol for the United States. The demand for ethanol is approximatelydivided into 68% fuel, 21% industry, and 11% food and beverages (3). Over 95%of the fuel ethanol produced in the United States was used to make E10, however,a small portion is used for the ever-increasing E85 market.
In comparison, 120 billion gallons of gasoline are sold in the United Stateseach year (2) while only 2.8 billion gallons of ethanol are produced, so the UnitedStates does not produce enough ethanol for all gasoline sold to be E10 (maximumethanol concentrations allowed by the U.S. Environmental Protection Agency)(4). Currently, E10 represents 8% to 10% of the total gasoline sales in the UnitedStates (4). This ethanol production shortage is likely to be a major problem asMTBE is phased out and there is more demand for ethanol as an oxygenate. Thisincrease in demand will likely result in a dramatic increase in production ofethanol in the United States.
DK9448_C007.fm Page 128 Monday, April 17, 2006 8:12 AM
© 2006 by Taylor & Francis Group, LLC

Ethanol Blends: E10 and E-Diesel
129
Ethanol is a controversial fuel. The Renewable Fuels Association states thatthe ethanol fuel market adds $4.5 billion to farm revenue yearly, employs almost200,000 people, and increases state tax revenue by $450 million (14). In theUnited States, there are four federal tax incentives for ethanol sold for fuel: (1)excise tax exemption, (2) blender’s tax credit, (3) income tax credit for businessesproducing or selling ethanol, and (4) small-producers tax credit for farm co-ops.The first tax benefit is $0.52 per gallon, but the fourth tax benefit is only $0.10per gallon. Over 30 states have also implemented tax incentives for ethanol asfuel. Most range from $0.20 to $0.40 per gallon. Although many argue assump-tions and data, researchers at Cornell University have calculated that a gallon ofethanol requires 29% more energy to produce than it contains as fuel (15). It hasalso been argued that ethanol production increases environmental degradation,because corn causes more soil erosion than any other farm crop (15). Althoughsoil erosion is an issue, the environmental impacts of ethanol are considerablyless than the toxic MTBE. The latest results from the U.S. Department of Agri-culture contradict researchers at Cornell University and show that corn ethanolis energy efficient and contains 34% more energy than is required to produceethanol (16). Part of this dramatic increase in energy efficiency is due to lowerenergy use in the fertilizer industry and advances in fuel conversion technologyover the last decade (16). Similar energy efficiency data has been shown by severalother researchers (16–19).
Cost of production of ethanol is a function of plant location, feedstock,production scale, and end use. The choice of feedstock depends on the country.Brazil has used sugar cane as their primary feedstock. France has attempted touse Jerusalem artichokes, but later found that sugar beets and wheat were betterfor ethanol production. Sweden uses its surplus of wheat to produce the ethanolfor their 6% ethanol-blended gasoline. However, in the United States, corn hasbeen determined to be one of the best feedstocks. Approximately, 2.5 gallons ofethanol are produced from every bushel of corn (16), but the corn yield per acrevaries as a function of state, along with the fertilizer and irrigation needs in thatregion. In a corn-based ethanol industry, the cost of the corn is approximately50–60% of the cost of production of the ethanol (20). It is predicted that the costof production of ethanol will decrease by $0.11 per liter over the next 10 yearsdue to genetic engineering (21). Currently, the cost of production of ethanol fromcorn is $0.88 per gallon versus $1.50 gallon from cellulose-based biomass (22).As gas prices rise, the cost of ethanol and ethanol blends becomes more com-petitive with gasoline.
ENGINE ISSUES
The major engine operation issues with alcohol-blended fuels are fuel quality,volatility, octane number, enleanment, cold start, hot operation, and fuel con-sumption. The physical properties of the blended fuels compared to pure gasolineare shown in Table 7.3. Octane numbers determined by the usual ASTM proce-dures indicate that alcohol-blended gasoline increases fuel octane over the base
DK9448_C007.fm Page 129 Monday, April 17, 2006 8:12 AM
© 2006 by Taylor & Francis Group, LLC

130
Alcoholic Fuels
gasoline (23–28). Fuel consumption increases when oxygenates are blended withgasoline due to the lower energy content of the oxygenated fuel. Table 7.4 showsthat fuel economy decreases with ethanol concentration. The theoretical increasein fuel consuption is 3% for E10 and 6% for E20 (29).
Corrosion of metallic fuel system components is generally not an issue withE10 (28). Researchers have also shown that E20 blends do not appear to affectfuel-system operation (8). Elastomeric and plastic components of new enginesare compatible with E10, but many older engines are not (28). Evidence reportedhas shown that ethanol blends offer less lubrication than pure gasoline (29);
TABLE 7.3Physical Properties of Blended Fuels
Physical Property Gasoline Ethanol E10 E20
Specific gravity @ 15.5°C 0.72–0.75 0.79 0.73–0.76 0.74–0.77Heating value (BTU/gallon) 117,000 76,000 112,900 109,000Reid vapor pressure @37.8°C (kPa) 59.5 17 64 63.4Stoichiometric air/fuel ratio 14.6 9 14 13.5Oxygen content (%wt.) 0 35 3.5 7.0
Source
: Guerrieri, D.A., Caffrey, P.J. and Rao, V.,
Investigation into the Vehicle ExhaustEmissions of High Percentage Ethanol Blends
, SAE Technical Paper Series, #950777, 1995.
TABLE 7.4Fuel Economy Decreases with Ethanol Concentration
EthanolPercentage
Heat of Combustion(BTU/gallon)
Fuel Economy (mpg)
0 115,650 22.0010 112,080 21.2514 110,500 20.9020 108,550 20.4825 106,510 20.1330 104,860 20.0035 102,750 19.57
Source
: Alternate Fuels Committee of the Engine Manufac-turers Association,
A Technical Assessment of AlcoholFuels
, SAE 82026. Report to Environment Australia,
ALiterature Review Based Assessment on the Impacts of a10% and 20% Ethanol Gasoline Fuel Blend on Non-Auto-motive Engines
, Orbital Engine Company, 2002.
DK9448_C007.fm Page 130 Monday, April 17, 2006 8:12 AM
© 2006 by Taylor & Francis Group, LLC

Ethanol Blends: E10 and E-Diesel
131
however, that has not been a noticeable issue in terms of wear or engine life overthe last 20 years. Over the last few years, Brazil has shown that conventionalcatalysts used in U.S. vehicles can operate on 10% and neat (100% ethanol) (30).Ref. 8
states that higher ethanol blends show higher catalytic efficiency, becausethere is a smaller concentration of sulfur species. Barnes (1999), from Ref. 8,says that the increase in catalytic efficiency could be as large as 24%. Guerrieri,Caffrey, and Rao 1995 from Ref. 8 show that volatility decreases with higherethanol blends. The highest volatility is around 5% ethanol (31). Carbon mon-oxide emissions are lower for ethanol blends (32–35). E10 can be employed invehicles without equipment changes and without violating manufacturer’s war-ranties (4).
Enleanment is defined as an excess of oxygen compared to the ideal air/fuelratio. Common problems of enleanment are loss of power and engine misfires(8). Both problems increase emissions. Finland has shown that E15 vehicles canoperate with stock carburetors and that 80% of vehicles running on E15 showless wear compared to pure gasoline. Fluorinated polymers have good resistanceto both gasoline and ethanol (36). Nylon-coated nitrile rubber has also shownresistance to both gasoline and ethanol (37). Overall, engine operation and life(wear) are not affected by small (10–20%) concentration of ethanol blended withunleaded gasoline.
E-DIESEL
Since the 1980s, there has been increased interest in low concentration blendingof ethanol with diesel fuel. Ethanol/diesel blends are commonly referred to as E-diesel. They generally contain from 10% to 15% ethanol and are used for manyof the same reasons that ethanol/gasoline blends are used (decreased petroleumneed and decreased emissions). Ethanol and diesel blending is more complicatedthan ethanol/gasoline blending, because of the low solubility of ethanol in dieselat low temperatures and the high flammability. At temperatures below 10°C,ethanol and diesel will separate [39]. The solution is either to add an emulsifieror a cosolvent. Boruff et al. has shown that approximately 2% surfactant (emul-sifier) is needed for every 5% of ethanol added to diesel fuel (40). The additionof the surfactant to the ethanol/diesel blend led to transparent solutions with novisible separation down to –15.5°C (40). Ethyl acetate has been studied as a co-solvent. Researchers have shown that adding 2.5% ethyl acetate for every 5%ethanol will ensure no separation down to 0°C (41). Cosolvents have been morepopular than surfactants. The second issue with e-diesel is the increased risk offire and explosions compared to plain diesel fuel. The National Renewable EnergyLaboratory recommends solving this problem by equipping all fuel tanks withvents, better electrical grounding, and employing safer fuel tank level detectors(42). The physical properties of E-diesel compared to ethanol and diesel areshown in Table 7.5.
Blending ethanol with diesel fuel decreases emissions in a similar way toethanol/gasoline blends. E-diesel has achieved reported 20% to 30% decreases
DK9448_C007.fm Page 131 Monday, April 17, 2006 8:12 AM
© 2006 by Taylor & Francis Group, LLC

132
Alcoholic Fuels
in carbon monoxide emissions and 20% to 40% decreases in particulate matteremissions (43). Miyamoto et al. showed that these improvements in emissionsdepend directly on the oxygen content (44). However, minimal decreases in NOxemissions have been reported (43) and an increase in hydrocarbon emissions havebeen reported (45–46). Table 7.6 shows the vehicle emissions from the use of10% and 15% ethanol in diesel.
As far as engine use is concerned, the decrease in fuel viscosity and lubricityhave been investigated for ethanol blends with diesel, but they do meet dieselspecifications (42). Materials compatibility has also been investigated. E-dieselwas found to have similar corrosive properties to typical diesel (42).
It is important to note that E-diesel fleet demonstrations have shown no fireor explosions incidents and no mechanical failures associated with the fuel system43). Many studies of engine wear have been conducted and have shown noabnormal wear or deterioration due to the blending of ethanol with diesel at lowconcentrations (10–15%). E-diesel does shows a reduction in engine power, butthis reduction is small and equivalent to the reduction in energy content of theethanol versus diesel (39). The main engine performance issue with E-diesel isthe leakage of fuel from the fuel injection pump due to slight decrease in viscosityof the blended fuel. Studies of engine power loss have shown decreases in powerfrom 4% to 10% for ethanol/diesel blends ranging from 10% to 15% ethanol(46–48). Therefore, ethanol is a good choice as an oxygenate for diesel. It hasminimal effect on engine power while dramatically decreasing particulate matterand carbon monoxide emissions.
TABLE 7.5Physical Properties of E-Diesel
Physical Property Diesel Ethanol E-Diesel (15%)
Vapor pressure @ 37.8C (kPa) 3 15 15Flashpoint (
°
C) 64 13 13Flammability limits
(%)(
°
C)0.6 to 5.664 to 150
3.3 to 19.013 to 42
3.3 to 19.013 to 42
Density (g/mL) 0.86 0.79 0.85Heating value (BTU/gallon) 132,000 76,000 123,000
Source
: Hansen, A.C., Lye, P.W., Zhang, Q.,
Ethanol-diesel blends: A step towardsa bio-based fuel for diesel engines,
ASAE Paper No. 01-6048, August 2001; Water-land, L.R., Venkatesh, S., Unnasch, S.,
Safety and performance assessment of etha-nol/diesel blends (E-Diesel)
, NREL/SR-540-34817, September 2003.
DK9448_C007.fm Page 132 Monday, April 17, 2006 8:12 AM
© 2006 by Taylor & Francis Group, LLC

Ethanol Blends: E10 and E-Diesel
133
CONCLUSIONS
Ethanol can be blended with gasoline to produce an oxygenated fuel with lowerhydrocarbon emissions. Ethanol can also be blended with diesel to decreasecarbon monoxide emissions and particulate matter emissions. Although green-house gas emissions are decreased with ethanol-blended fuels, emissions ofcertain aldehydes are increased, which could cause health issues. Automobilescan be operated on ethanol/gasoline blends from 5% to 25% and ethanol/dieselblends from 10% to 15% without need for any alterations in engine equipmentor settings and with no effect on engine lifetime.
REFERENCES
1. Rothman, H., Greenshields R. and Calle F.R.,
The Alcohol Economy: Fuel Ethanoland the Brazilian Experience
,
Francis Printer, London, 1983.2. Mahy, H., Szabo, C. and Woods, L.,
200 Proof Transportation: The Potential forEthanol as an Alternative Fuel
,
University of Washington, Global commercial-ization of Environmental Technologies, ENVIR 550/BBUS 550, Hund, G. andLaverty, K., Eds., 2003.
3. Taherzadeh, M.J.,
Ethanol from Lignocellulose: Physiological Effects of Inhibitorsand Fermentation Strategies
,
Chalmers University of Techology, Dept. of Chem-ical Engineering, Goteborg, Sweden, 1999.
TABLE 7.6Vehicle Emissions from the Use of 10% to 15% Ethanol in Diesel
Emissions Range(% ratio of blend/diesel)
10%Ethanol
15%Ethanol
Particulate matter 73–80 59–70NOx 96–100 95–100CO 80–160 73–140Hydrocarbons 171–200 175–210
Source
: Data compiled from Hansen, A.C., Lye, P.W.and Zhang, Q., ASAE Paper No. 01-6048, Aug. 2001;Waterland, L.R., Venkatesh, S. and Unnasch, S.,NREL/SR-540-34817, Sept. 2003; Spreen, K., FinalReport for Pure Energy Corporation prepared at SRI,San Antonio, TX, 1999; Kass, M.D., Thomas, J.F., Sto-rey, J.M., et al., SAE Technical Paper 2001-01-2018,2001.
DK9448_C007.fm Page 133 Monday, April 17, 2006 8:12 AM
© 2006 by Taylor & Francis Group, LLC
134
Alcoholic Fuels
4. Prakash, C., Motor Vehicle Emissions and Fuels Consultant,
Use of Higher than10 Volume Percent Ethanol/Gasoline Blends in Gasoline Powered Vehicles.
Trans-portation Systems Branch Air Pollution Prevention Directorate Environment Can-ada, 1998.
5. Wang, M., Saricks, C., Wu, M.,
Fuel-Cycle Fossil Energy Use and GreenhouseGas Emissions of Fuel Ethanol
,
Illinois Department of Commerce and CommunityAffairs, Center for Transportation Research, Argonne National Laboratory, 1997.
6. Browner, C., Remarks as prepared for delivery to press conference on March 20,2000, http://www.epa.gov/otaq/consumer/fuels/mtbe/press34b.pdf. (accessed2002).
7. Kimble, D., Is ethanol fuel the answer to our environmental problems?8. (October 2002),
Issues Associated with the Use of Higher Ethanol Blends (E17-E24)
, Hammel-Smith, C., Fang, J., Powders, M. and Aabakken, J., Eds., NationalRenewable Energy Laboratory, Golden, CO, 2002.
9. Leong, S.T., Muttamara, S. and Laortanakul, P., Applicability of gasoline contain-ing ethanol as Thailand’s alternative fuel to curb toxic VOC pollutants fromautomobile emission,
Atmospheric Environment
, 2002.10. U.S. EPA,
Motor vehicle-related air toxic study
, U.S. Environmental ProtectionAgency, Office of Mobile Sources, Ann Arbor, MI, EPA Report No. EPA 420-R-93-005, April 1993.
11. EIA, Energy Information Administration:
Alternative to traditional transportationfuels 1996
,
U.S. Department of Energy, DOE/EIA-0484(98), 1998.12. Faiz, A., Weaver, C.S. and Walsh, M.P.,
Air Pollution from Motor Vehicles, Stan-dards and Technologies for Controlling Emission
, The World Bank, 1996, p. 207. 13. Berg, C.,
World Ethanol Production
2001, http://www.distill.com/world_ethanol_production.htm (accessed 2002).
14. Renewable Fuels Association, Official Statement, http://www.ethanol-rfa.org/leg_official.shtml.
15. Pimentel, D.,
Ethanol Fuels: Energy Balance, Economics, and EnvironmentalImpacts Are Negative
,
Natural resources research, 12, 2, Kluwer Academic/Ple-num Publishers, New York, 2003.
16. Shapouri, D., James A. and Wang, M.,
The Energy Balance of Corn Ethanol: AnUpdate
,
Agricultural Economic Report Number 814, U.S. Department of Agri-culture, 2002.
17. Agriculture and Agri-Food Canada, Assessment of Net Emissions of GreenhouseGases From Ethanol-Gasoline Blends in Southern Ontario, Prepared by LeveltonEngineering Ltd. #150-12791, Clarke Place, Richmond, B.C. and (S&T)
2
Con-sulting Inc., J.E. & Associates, Aug. 1999.
18. Lorenz, D. and David M
.
,
How Much Energy Does it Take to Make a Gallon ofEthanol
? Revised and Updated, Institute for Local Self-Reliance, Washington,DC, Aug. 1995.
19. Marland, G., and Turhollow, A.F.,
CO
2
Emissions from the Production and Com-bustion of Fuel Ethanol from Corn
, Oak Ridge National Laboratory, Oak Ridge,TN, Environmental Sciences Division, No. 3301. U.S. Department of Energy, May1990.
20. Kaylen, M., Van Dyne, D.L., Choi, Y.S., and Blasé, M., Economic feasibility ofproducing ethanol from lignocellulosic feedstocks,
Bioresource Technology
, 72,2000, 19–32.
DK9448_C007.fm Page 134 Monday, April 17, 2006 8:12 AM
© 2006 by Taylor & Francis Group, LLC
Ethanol Blends: E10 and E-Diesel
135
21. Wooley, R., Ruth, M., Glassner, D. and Sheehan, J., Process design and costingof bioethanol technology: a tool for determining the status and direction ofresearch and development,
Biotechnology Progress
, 15, 794–803, 1999.22. McAloon, A., Taylor, F., Yee, W., Ibsen, K. and Wooley, R.,
Determining the costof producing ethanol from corn starch and lignocellulosic feedstocks
, NationalRenewable Energy Laboratory (NREL), Golden, CO, http://www.afdc.doe.gov/pdfs/4898.pdf (accessed 2002).
23. Alternate Fuels Committee of the Engine Manufacturers Association,
A TechnicalAssessment of Alcohol Fuels
, SAE 82026.24. Birrell, J.S.,
Ethanol as a petrol extender in spark ignition engines
, SAE 825026.25. Brinkman, N.D. et al,
Exhaust emissions, fuel economy and driveability of vehiclesfuelled with alcohol-gasoline blends
, SAE 750120.26. Owen, K. and Coley, T.,
Automotive Fuel Handbook
, 1990.27. Wagner, T.O. et al,
Practicality of alcohols as motor fuels
, SAE 790429.28. Report to Environment Australia,
A Literature Review Based Assessment on theImpacts of a 10% and 20% Ethanol Gasoline Fuel Blend on Non-AutomotiveEngines
, Orbital Engine Company, 2002.29. Black, F.,
An overview of the technical implications of methanol and ethanol ashighway motor vehicle fuels
, SAE 912413.30. Szwarc, A., ADS Technology and Sustainable Development, State of California
(Mar. 1999), Governor Gray Davis, Executive Department, Executive Order D-5-99, e-mail, July 26, 1999.
31. American Petroleum Institute,
Alcohol and Ethers: A Technical Assessment ofTheir Application as Fuels and Fuel Components
, API Publication 4261, thirded., June 2001.
32. Myron, W.B. et. al.,
Ethanol Blended Fuel as a CO Reduction Strategy at HighAltitude,
Colorado Department of Health, Air Pollution Control Division, Aug.1985.
33. California Air Resources Board, http://www.arb.ca.gov.34. Guerrieri, D.A., Caffrey, P.J. and Rao, V.,
Investigation into the Vehicle ExhaustEmissions of High Percentage Ethanol Blends
, SAE Technical Paper Series,#950777, 1995.
35. Faiz, A., Weaver, C.S. and Walsh, M.P.,
Air Pollution from Motor Vehicles, Stan-dards and Technologies for Controlling Emission
, The World Bank, 1996.36. Nersasian, A., (E.I. Du Pont de Nemours & Co., Inc.),
The Vol. Increase of FuelHandling Rubbers in Gasoline/Alcohol Blends
, SAE Paper No. 800789, Jun. 1980.37. Dunn, J.R. and Pfisterer, H.A., (Polystar Limited),
Resistance of NBR-Based FuelHose Tube to Fuel-Alcohol Blends
, SAE Paper No. 800856, Jun. 1980.38. Environment Australia, Setting the ethanol limit in petrol.39. Hansen, A.C., Lye, P.W. and Zhang, Q.,
Ethanol-diesel blends: A step towards abio-based fuel for diesel engines
, ASAE Paper No. 01-6048, Aug. 2001.40. Boruff, P.A., Schwab, A.W., Goering, C.E. and Pryde, E.H., Evaluation of diesel
fuel-ethanol microemulsions,
Transactions of ASAE
, 25, 47–53, 1982.41. Letcher, T.M., Diesel blends for diesel engines,
South African J. Sci.
, 79(1), 4–7,1983.
42. Waterland, L.R., Venkatesh, S. and Unnasch, S.,
Safety and performance assess-ment of ethanol/diesel blends (E-Diesel)
, NREL/SR-540-34817, Sept. 2003.
DK9448_C007.fm Page 135 Monday, April 17, 2006 8:12 AM
© 2006 by Taylor & Francis Group, LLC

136
Alcoholic Fuels
43. Marek, N. and Evanoff, J., Pre-commercialization of E-diesel fuels in off-roadapplications, In
Proceedings of A&WMA 2002 Annual Conference
, Paper No.42740, June 2002.
44. Miyamoto, N., Ogawa, H., Nurun, N., Obata, K. and Arima, T.,
Smokeless, lownox, high thermal efficiency, and low noise diesel combustion with oxygenatedagents as main fuel
, SAE Technical Paper No. 980506, 1998.45. Spreen, K.,
Evaluation of oxygenated diesel fuels
, Final Report for Pure EnergyCorporation Prepared at SRI, San Antonio, TX, 1999.
46. Kass, M.D., Thomas, J.F., Storey, J.M., Domingo, N., Wade, J. and Kenreck, G.,
Emissions from a 5.9 liter diesel engine fueled with ethanol diesel blends
, SAETechnical Paper 2001-01-2018, 2001.
47. Hansen, A.C., Hornbaker, R.H., Zhang, Q. and Lyne, P.W.,
On-farm evaluationof diesel fuel oxygenated with ethanol
, ASAE Paper No. 01-6173, 2001.48. Hansen, A.C., Mendoza, M., Zhang, Q. and Ried, J.R.,
Evaluation of oxydieselas a fuel for direct-injection compression-ignition engines
, Final Report for IllinoisDepartment of Commerce and Community Affairs, Contract IDCCA 96-32434,2000.
DK9448_C007.fm Page 136 Monday, April 17, 2006 8:12 AM
© 2006 by Taylor & Francis Group, LLC
137
8
Using E85 in Vehicles
Gregory W. Davis, Ph.D., P.E.
Director, Advanced Engine Research Laboratory and Professor of Mechanical Engineering, Kettering University, Flint, Michigan
CONTENTS
History...............................................................................................................138Types of Vehicles Using E85............................................................................139
Flexible Fuel Vehicles ...........................................................................139Off-Road Vehicles .................................................................................140
Material Compatibility......................................................................................140Metallic Substances...............................................................................141Nonmetallic Substances ........................................................................142Vehicle Fuel Pumps ..............................................................................142
Property Comparison with Gasoline ................................................................143Effect of E85 on Vehicle Fuel Economy, Performance, and Safety................145
Fuel Economy .......................................................................................145Vehicle Power........................................................................................147Cold Startability ....................................................................................147Safety.....................................................................................................147
Effect of E85 on the Environment....................................................................148Vehicle Tailpipe Emissions ...................................................................148Other Environmental Emissions ...........................................................149Sustainability .........................................................................................149
Future Trends in E85 ........................................................................................150References .........................................................................................................151
Abstract
The use of E85 as a fuel for vehicles is discussed in this chapter. E85,a blend of 85% ethanol and 15% gasoline is a liquid fuel that can be utilized ina wide variety of vehicles. The use of E85 has been encouraged because itdramatically reduces exhaust and greenhouse gas emissions. Additionally, theethanol used can be derived from renewable sources. In order to use E85, thevehicle must have a spark-ignited engine. Furthermore, this engine must beadapted to accept E85.
DK9448_C008.fm Page 137 Tuesday, March 28, 2006 3:33 PM
© 2006 by Taylor & Francis Group, LLC
138
Alcoholic Fuels
E85 is a high-blend alcohol-based fuel containing 85% ethanol and 15% gasolineby volume. Because pure ethanol has a lower vapor pressure than gasoline, it isblended with 15% gasoline to produce E85 in order to minimize difficulties instarting engines and with drivability during cold weather.
E85 is used to operate spark-ignited engines that have been modified to acceptthis fuel. Spark-ignited engines cannot directly use E85 without modification dueto higher mixture requirements and some material compatibility issues. E85 isused in vehicles to reduce vehicle tailpipe emissions. Further, E85, in which theethanol has been derived from biomass, also reduces the net production of carbondioxide, a greenhouse gas. Additionally, E85 is becoming cost competitive withgasoline, with wholesale prices lower than gasoline in early 2005 in the UnitedStates. Because of this, and the fact that ethanol can be produced from renewableresources instead of petroleum has led to its development and use in a variety ofvehicles. The use of E85 is growing rapidly in the United States; however, thetotal number of vehicles currently using E85 is still small when compared withthe total number of vehicles on the road.
1
HISTORY
High-blend alcohol fuels have been used in vehicles for many years in differentregions of the world. Brazil is probably the most well-known region, havingestablished government policies in the 1970s to develop this fuel.
2
During the1990s, 4.5 million automobiles operating on 93% ethanol (balance gasoline),were in use in Brazil.
3
In the United States, E85 has received increasing attentionand use due to stricter emissions standards and worries about energy security.For example, in 1992 the federal government passed the Energy Policy Act(EPAct).
4
This legislation was established with the goals of enhancing the nation’senergy security and improving environmental quality. The EPAct encourages thedevelopment and use of alternative fuels that are not substantially derived frompetroleum.
Alternative fuels are defined to include alcohols at blends of 85% or moreof alcohol (such as ethanol) with gasoline. The U.S. Department of Energy (DoE)is charged with the responsibility of implementing this act. The EPAct containsboth voluntary and mandatory provisions designed to develop an alternative fueleconomy. The EPAct’s voluntary activities are administered through the DoEClean Cities Program, which helps create markets for alternative fuels and alter-native fuel vehicles (AFVs) through public/private partnerships in more than 80U.S. cities.
5
The mandatory EPAct provisions consist of four programs: The State &Alternative Fuel Provider Program; The Federal Fleet Program; Alternative FuelPetitions Program; and the Private & Local Government Fleet Program. Theseprograms give the DoE the power to require Federal and State governmentalagencies to purchase AFVs as a percentage of their vehicle acquisitions. ThePrivate & Local Government Fleet Program even gives the DoE the authority to
DK9448_C008.fm Page 138 Tuesday, March 28, 2006 3:33 PM
© 2006 by Taylor & Francis Group, LLC
Using E85 in Vehicles
139
impose AFV acquisition requirements on private and local government fleets,although this program has not been implemented.
In addition to the EPAct, the U.S. Federal government maintains a system oftax incentives for E85 in order to encourage its use and development. For example,a Volumetric Ethanol Excise Tax Credit of 51 cents per gallon of ethanol usedin fuel is currently available to transportation fuel producers.
6
This law alsoeliminates alternative minimum tax (AMT) on the Alcohol Fuels Income TaxCredit. Small ethanol producers are also provided with a 10 cents per gallon taxcredit on up to 15 million gallons of production annually. Finally, states and theU.S. Federal government offer many grants to help in the production and use ofE85.
In the United States, legislation and incentives have led to the developmentand use of many E85 capable vehicles. The U.S. Energy Information Adminis-tration (EIA) estimates that more than four million Flexible Fueled Vehicles wereon U.S. roadways in 2002.
7
The annual growth in E85 capable vehicles from1996 to 2005 was 78.8%, and the projected E85 fuel use was projected to growby 11.5% from 2003 to 2004 according to the EIA.
1
TYPES OF VEHICLES USING E85
E85 is used to operate spark-ignited engines that have been modified to acceptthis fuel. Unlike E10, E85 cannot be used in spark-ignited engines that have notbeen modified. This has slowed the adoption of E85 because there is a supplyand demand problem: consumers will not buy vehicles unless there is a readilyavailable source of fuel, and fuel companies will not invest in the alternative fuelsunless there is a large supply of vehicles that use the fuel. This has led to thedevelopment of a new type of vehicle, called a Flexible Fuel Vehicle, which canoperate using various blends of alcohol.
F
LEXIBLE
F
UEL
V
EHICLES
Flexible Fuel Vehicles, or FFVs, can operate on ethanol-blends from 0% (gaso-line) up to 85% (E85) by volume. This eliminates the supply and demand problemas consumers can fuel with any combination of fuel, not worrying whether thecorrect fuel will be available. These vehicles are produced by most of the majorautomakers and represent the largest class of vehicles using E85. Most of thesevehicles are sold without any cost penalty to the consumer. This is both anindication of the automakers’ desire to develop the market and the incrementalcosts required to produce these vehicles compared with their gasoline-fueledcounterparts.
These vehicles are designed and manufactured using E85 compatible mate-rials. Further, due to the different fuel-air mixture requirements of gasoline andE85, the fuel delivery systems are sized to handle the increased volumes of fuelwhen using E85. Other changes are made to the control algorithms in order tooptimize the vehicle for use with this fuel. Since E85 has a higher octane than
DK9448_C008.fm Page 139 Tuesday, March 28, 2006 3:33 PM
© 2006 by Taylor & Francis Group, LLC

140
Alcoholic Fuels
gasoline, the spark timing can be advanced, improving engine performance.Further, the fuel injection pulsewidth or duration must be lengthened to increasethe flowrate of E85 for given engine load and speed conditions.
Since consumers can fuel these vehicles with either E85 or gasoline (or anyblend in between), these vehicles must determine the levels of ethanol presentonboard the vehicle in order to ensure that the engine is operating at the bestconditions for the given fuel blend. In order to accomplish this, current FFVshave a fuel sensor, which is located in the fuel delivery lines leading from thefuel tank to the engine. The fuel sensor measures the conductivity of the currentfuel blend. Since ethanol and gasoline have vastly different levels of conductivity(ethanol is about 135,000 times more conductive than gasoline),
8
this is a rela-tively easy task to accomplish with some precision. Older FFVs relied on the useof a feedback signal from an exhaust gas oxygen (EGO) sensor located in theexhaust stream. This sensor, already present on all spark-ignited vehicles, detectsthe presence of excess oxygen in the exhaust. Because of exhaust after-treatmentrequirements on-road vehicles generally operate using stoichiometric mixtures offuel and air. Thus, the oxygen sensor is used to maintain stoichiometric combus-tion in an engine. This sensor can be used to determine fuel mixture as ethanolis an oxygenated fuel with a richer stoichiometric mixture; thus, the mixture usedfor gasoline will be too lean with E85 and lead to excess oxygen in the exhaust.Unfortunately, these sensors only function when warm, so they cannot be usedto help during cold starts of the engine. Thus, going from gasoline to E85 resultsin a lean mixture until the EGO is functioning. This can lead to poorer qualitycold starts and poor drivability under acceleration.
9
Many environmental groups have been critical of using FFVs, since modify-
ing gasoline-powered vehicles to operate using E85 puts E85 at an inherentdisadvantage and it does not force the rapid buildup of an E85 fueling infrastruc-ture since consumers can continue to use gasoline.
2
It is important to rememberthat the automakers need to produce vehicles that consumers will actually buy;most consumers will not buy a vehicle for which there are few fueling opportu-nities. This criticism is perhaps premature at this early stage of E85 development.
O
FF
-R
OAD
V
EHICLES
Although many E85 vehicle demonstrations have been made using off-road vehi-cles such as airplanes,
10
snowmobiles,
11
boats, and all-terrain vehicles, there arenot currently any significant numbers of these vehicles operating on E85.
MATERIAL COMPATIBILITY
Some materials that are commonly used with gasoline-powered vehicles are notcompatible with E85. These materials are degraded when in contact with E85and cause leaks or fuel system contamination.
13
Fortunately, there are manyalternatives for these materials. Also, limited duration contact with E85 in many
DK9448_C008.fm Page 140 Tuesday, March 28, 2006 3:33 PM
© 2006 by Taylor & Francis Group, LLC

Using E85 in Vehicles
141
of these materials has shown no detrimental effects. Most degradation requireslong-term contact with E85.
E85 can be used in both four-stroke and two-stroke spark-ignited engines.Four-stroke engines are widely used in on-road vehicles because they generallyoffer better emissions and fuel consumption than two-stroke spark-ignitedengines. In countries with strict air-pollution standards, even most motorcyclesgenerally employ this type of engine. The strict emissions standards are alsocontributing to more widespread use of four-stroke engines for off-road vehicleuse, such as snowmobiles and all-terrain vehicles (ATVs).
Most four-stroke spark-ignited engines currently available today introducethe fuel into the air intake system, not directly into the cylinder. This means thatthe fuel will come into contact with the materials used in the intake manifold ofthe engine. Fuel also comes into contact with the engine cylinders and the fuelinduction and storage systems of these engines.
Two-stroke engines are lighter and often have better power-to-weight ratiosthan four-stroke spark-ignited engines and are, therefore, often used in smallervehicles or in cases where weight is a major design consideration.
Developing countries still widely use two-stroke spark-ignited engines invehicles due to their lower costs and smaller sizes. Two-stroke spark-ignitedengines complete a mechanical cycle in two strokes of the piston, or one enginerevolution. These types of engines do not have separate intake and exhaustprocesses. Because of this, these engines produce power every revolution, leadingto smaller, lighter engines. Unfortunately, this also leads to higher tailpipe emis-sions and problems with bypass, where raw fuel and air pass through the engineunburned. To help combat this, many two-stroke spark-ignited engines use crank-case compression to improve scavenging efficiency and to reduce bypass.
This means that in two-stroke spark-ignited engines fuel not only comes intocontact with the fuel storage and delivery systems, the intake, and the enginecylinders, but also the engine crankcase and even the exhaust manifold. Further,residual fuel is left in the crankcase after the engine is stopped, leading to potentiallong-term exposure.
Unfortunately, to save weight, most of these engines use aluminum exten-sively in their blocks, leading to potential long-term corrosion problems. Asdescribed later, hard-anodized aluminum has been shown to be resistant to E85degradation. At this time, the long-term use of E85 in off-road vehicles with two-stroke engines has not been studied.
M
ETALLIC
S
UBSTANCES
Metallic substances that are degraded by E85 include: zinc, brass, aluminum, andlead-plated steel. Alloys containing these metals must be individually investigatedto determine their E85 compatibility. For example, lead-tin alloy is not E85compatible. Unfortunately, many vehicles use aluminum in the fuel deliverysystems to save weight, including in the fuel pump, lines, fuel rail, and fuelpressure regulator. Fuel also often is allowed to contact the aluminum block of
DK9448_C008.fm Page 141 Tuesday, March 28, 2006 3:33 PM
© 2006 by Taylor & Francis Group, LLC

142
Alcoholic Fuels
many two-stroke engines. Furthermore, older vehicles often use lead-plated steelfor the vehicle fuel storage tanks. These materials will react with E85, partiallydissolving in the fuel. This can contaminate the fuel system, leading to cloggedfuel filters and injectors, which in turn, cause poor vehicle drivability. Aluminumcan be safely used if it is hard anodized or nickel plated. Most FFVs use hardanodized aluminum for the fuel delivery systems. Also, most modern vehiclesuse fuel storage tanks that are made of polymer compounds (which are resistantto E85) instead of lead-plated steel; thus, this problem is only a factor in oldervehicles.
Other metallic compounds that are resistant to E85 include: unplated steel,stainless steel, black iron, and bronze. These materials can be substituted for theother compounds as required.
N
ONMETALLIC
S
UBSTANCES
Nonmetallic materials that degrade when in contact with E85 include natural rubber,polyurethane, cork gasket material, leather, polyvinyl chloride (PVC), polyamides,methyl-methacrylate plastics, and certain thermo and thermoset plastics.
This author has had much experience using E85 in a variety of vehicles withplastic fuel tanks with no noticeable negative consequences. The types of vehicletanks tested include late model automobiles and light-duty trucks, snowmobiles,small engines, and many plastic fuel delivery tanks. Many of these tanks aremade of thermo/thermoset plastics, so this appears not be a major issue forvehicles.
Older vehicles may still use rubber, polyurethane or cork gaskets and O-ringsfor sealing fuel delivery systems; fortunately, most late model vehicles (vehiclesproduced after the mid-1990s) no longer use these materials in favor of moreadvanced sealants.
Many of the other sensitive materials are not used in areas where they mightcome into contact with the fuel; however, care should be taken to ensure that fuelspillage is cleaned from leather or plastic interior surfaces of the vehicles.
Nonmetallic materials that are resistant to E85 degradation include nonme-tallic thermoset reinforced fiberglass, thermoplastic piping, thermoset reinforcedfiberglass tanks, Buna-N, Neoprene rubber, polypropylene, nitrile, Viton, andTeflon. All of these materials may be used with E85. Furthermore, most modernvehicles already use these materials for gaskets and O-rings as they offer superiorleak resistance. For example, most automakers now use Viton O-rings to sealtheir fuel injectors.
V
EHICLE
F
UEL
P
UMPS
During the mid-1990s, many gasoline fuel pumps suffered high failure rates whendelivering E85. Early on, the lower lubricity of ethanol was blamed for thesefailures. Later, it became clear that the much higher electrical conductivity (eth-anol is about 135,000 times more conductive than gasoline) was at least partly
DK9448_C008.fm Page 142 Tuesday, March 28, 2006 3:33 PM
© 2006 by Taylor & Francis Group, LLC

Using E85 in Vehicles
143
to blame. These problems have been addressed by the automakers and prematurefailures are no longer a problem. These “hardened” pumps are now standard onmany vehicles that are not specifically rated for E85 due to their superior perfor-mance and reduced failure rates.
PROPERTY COMPARISON WITH GASOLINE
Like gasoline, ethanol is liquid at room temperature and pressure. It can behandled and dispensed using equipment designed for gasoline-with some modi-fications to accommodate material incompatibilities as discussed above. Mostconsumers would not notice any difference when fueling their vehicles using E85.
One of the major differences between using E85 and gasoline affecting engineoperation is due to the differences in vapor pressure and latent heat of vaporiza-tion. In order for combustion to begin in an engine, a portion of the fuel must bevaporized. Gasoline is a mixture of many hydrocarbon compounds with variedvapor pressures and latent heats of vaporization. This means that even under coldconditions a portion of gasoline will still evaporate. Because ethanol is a puresubstance, it becomes difficult to vaporize when cold. In fact ethanol will notform an air/fuel vapor mixture high enough to support combustion below 11
°
C.
12
This led to the use of E85. Gasoline is added to the ethanol in order to supportcold startability. Most E85 is blended with regular grade unleaded gasoline.
A comparison of E85 and gasoline is presented in Table 8.1. One complicationin using values from this table is the fact that E85 is made from ethanol that hasbeen denatured with up to 5% gasoline; thus E85 is usually composed of lessthan 85% pure ethanol. This means that the data in Table 8.1 is an approximationof E85 as it is based upon a true blend of 85% ethanol.
Further, E85 is determined on a volume basis, but many users mistakenly usea mass basis in order to determine its composition.
3
Fortunately, the densities ofgasoline and E85 are similar as shown in Table 8.1. Assuming constant componentvolumes during mixing, 85% ethanol on a volume basis produces about 85.7%ethanol on a mass basis.
Finally, the actual blends of E85 are seasonally adjusted depending on thegeographical region and the season. During warm weather the blends have higherlevels of ethanol to lower vapor pressure; thus minimizing evaporative emissionsand vapor lock. These blends of E85 typically contain 85% denatured ethanol.While in cold weather, more gasoline is added to the blend to avoid startingproblems. Most winter blends of E85 are actually 70% ethanol by volume. Ofcourse, the gasoline, too, is seasonally adjusted to minimize vapor pressure duringthe warmer months and to aid in cold startability during the colder months. Asone can see, the values in Table 8.1 are simply nominal values. Samples of E85used in emissions testing should first be analyzed by a qualified laboratory toobtain precise property values.
American Society for Testing and Materials (ASTM) standards for E85 arepresented in the following table. These standards, although generally voluntary,are usually followed by major fuel producers. Table 8.2 lists physical properties
DK9448_C008.fm Page 143 Tuesday, March 28, 2006 3:33 PM
© 2006 by Taylor & Francis Group, LLC
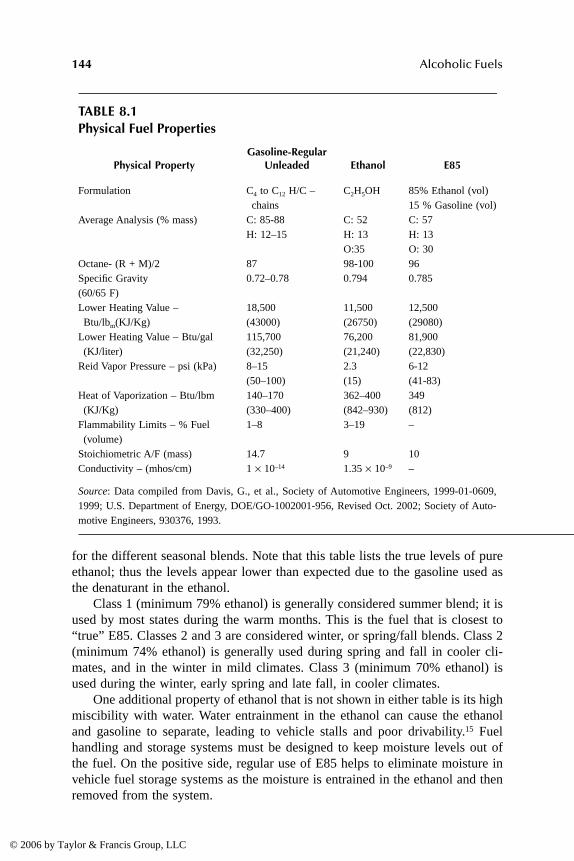
144
Alcoholic Fuels
for the different seasonal blends. Note that this table lists the true levels of pureethanol; thus the levels appear lower than expected due to the gasoline used asthe denaturant in the ethanol.
Class 1 (minimum 79% ethanol) is generally considered summer blend; it isused by most states during the warm months. This is the fuel that is closest to“true” E85. Classes 2 and 3 are considered winter, or spring/fall blends. Class 2(minimum 74% ethanol) is generally used during spring and fall in cooler cli-mates, and in the winter in mild climates. Class 3 (minimum 70% ethanol) isused during the winter, early spring and late fall, in cooler climates.
One additional property of ethanol that is not shown in either table is its highmiscibility with water. Water entrainment in the ethanol can cause the ethanoland gasoline to separate, leading to vehicle stalls and poor drivability.
15
Fuelhandling and storage systems must be designed to keep moisture levels out ofthe fuel. On the positive side, regular use of E85 helps to eliminate moisture invehicle fuel storage systems as the moisture is entrained in the ethanol and thenremoved from the system.
TABLE 8.1Physical Fuel Properties
Physical PropertyGasoline-Regular
Unleaded Ethanol E85
Formulation C
4
to C
12
H/C – chains
C
2
H
5
OH 85% Ethanol (vol)15 % Gasoline (vol)
Average Analysis (% mass) C: 85-88H: 12–15
C: 52H: 13O:35
C: 57H: 13O: 30
Octane- (R + M)/2 87 98-100 96Specific Gravity(60/65 F)
0.72–0.78 0.794 0.785
Lower Heating Value – Btu/lb
m
(KJ/Kg)18,500(43000)
11,500(26750)
12,500(29080)
Lower Heating Value – Btu/gal (KJ/liter)
115,700(32,250)
76,200(21,240)
81,900(22,830)
Reid Vapor Pressure – psi (kPa) 8–15(50–100)
2.3(15)
6-12(41-83)
Heat of Vaporization – Btu/lbm (KJ/Kg)
140–170(330–400)
362–400(842–930)
349(812)
Flammability Limits – % Fuel (volume)
1–8 3–19 –
Stoichiometric A/F (mass) 14.7 9 10Conductivity – (mhos/cm) 1
×
10
–14
1.35
×
10
–9
–
Source
: Data compiled from Davis, G., et al., Society of Automotive Engineers, 1999-01-0609,1999; U.S. Department of Energy, DOE/GO-1002001-956, Revised Oct. 2002; Society of Auto-motive Engineers, 930376, 1993.
DK9448_C008.fm Page 144 Tuesday, March 28, 2006 3:33 PM
© 2006 by Taylor & Francis Group, LLC

Using E85 in Vehicles
145
EFFECT OF E85 ON VEHICLE FUEL ECONOMY, PERFORMANCE, AND SAFETY
Table 8.1 compares the physical properties of E85 and gasoline. The propertydifferences that exert the most influence on vehicle performance are: octane,energy density, Reid vapor pressure, stoichiometric A/F mixture, heat of vapor-ization, and flammability limits. The effects of these different properties aredescribed below.
F
UEL
E
CONOMY
The energy density on a mass basis for E85 is only about 68% of the level forgasoline. Fortunately, the specific gravity of E85 is slightly greater than that forgasoline leading to an E85 energy density of 71% of that for gasoline on a volumebasis. Therefore, in order to achieve the same level of power, and assuming nochange in engine efficiency, a vehicle operating on E85 would have to consumeabout 1.4 times as much fuel on a volume basis. This would lead directly to a29% loss in fuel economy. However, in practice, this reduction is limited as theE85 fuel burns more cleanly, and the engine calibration is adjusted to advancethe spark timing, further improving engine efficiency.
Actual test values for FFVs are published by the U.S. federal government; aportion of this is shown in Table 8.3. This data reveals an average loss of about25% in fuel economy on both the federal highway and city tests when going fromgasoline to E85 in FFVs.
16
It is interesting to note that the test data reveal lossesas high as 29% and as low as 20%, demonstrating the effect that proper engine
TABLE 8.2ASTM D5798-99 Specification for Seasonal Blends of E85
Physical Property Value for ClassASTM
Test Method
ASTM volatility 1 2 3 –Minimum level of ethanol (plus higher alcohols) – % volume
79 74 70 D5501
Hydrocarbons (including denaturant) – % volume
17–21 17–26 17–30 D4815
Vapor pressure ( 37.8°C) – psi(kPa)
5.5–8.5(38–59)
7.0–9.5(48–65)
9.5–12.0(66–83)
D4953, D5190, D5191
Sulfur (maximum) – mg/kg 210 260 300 D3120, D1266, D2622
Water (maximum) – % mass 1.0 1.0 1.0 E203Acidity (as acetic acid) – ppm 50 50 50 D1613
Source
: U.S. Department of Energy DOE/GO-1002001-956, Revised Oct. 2002.
DK9448_C008.fm Page 145 Tuesday, March 28, 2006 3:33 PM
© 2006 by Taylor & Francis Group, LLC
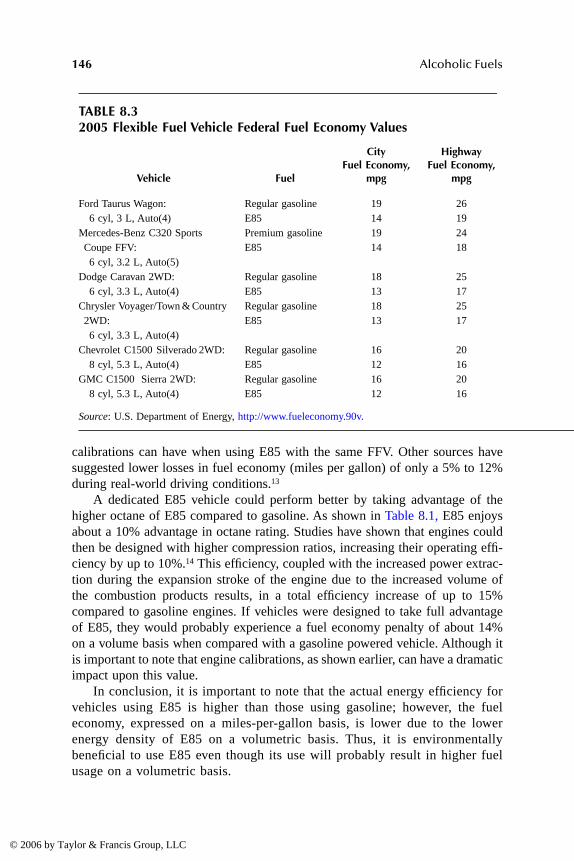
146
Alcoholic Fuels
calibrations can have when using E85 with the same FFV. Other sources havesuggested lower losses in fuel economy (miles per gallon) of only a 5% to 12%during real-world driving conditions.
13
A dedicated E85 vehicle could perform better by taking advantage of the
higher octane of E85 compared to gasoline. As shown in Table 8.1, E85 enjoysabout a 10% advantage in octane rating. Studies have shown that engines couldthen be designed with higher compression ratios, increasing their operating effi-ciency by up to 10%.
14
This efficiency, coupled with the increased power extrac-tion during the expansion stroke of the engine due to the increased volume ofthe combustion products results, in a total efficiency increase of up to 15%compared to gasoline engines. If vehicles were designed to take full advantageof E85, they would probably experience a fuel economy penalty of about 14%on a volume basis when compared with a gasoline powered vehicle. Although itis important to note that engine calibrations, as shown earlier, can have a dramaticimpact upon this value.
In conclusion, it is important to note that the actual energy efficiency forvehicles using E85 is higher than those using gasoline; however, the fueleconomy, expressed on a miles-per-gallon basis, is lower due to the lowerenergy density of E85 on a volumetric basis. Thus, it is environmentallybeneficial to use E85 even though its use will probably result in higher fuelusage on a volumetric basis.
TABLE 8.32005 Flexible Fuel Vehicle Federal Fuel Economy Values
Vehicle Fuel
CityFuel Economy,
mpg
HighwayFuel Economy,
mpg
Ford Taurus Wagon: 6 cyl, 3 L, Auto(4)
Regular gasoline 19 26E85 14 19
Mercedes-Benz C320 Sports Coupe FFV: 6 cyl, 3.2 L, Auto(5)
Premium gasoline 19 24E85 14 18
Dodge Caravan 2WD: 6 cyl, 3.3 L, Auto(4)
Regular gasoline 18 25E85 13 17
Chrysler Voyager/Town & Country 2WD: 6 cyl, 3.3 L, Auto(4)
Regular gasoline 18 25E85 13 17
Chevrolet C1500 Silverado 2WD: 8 cyl, 5.3 L, Auto(4)
Regular gasoline 16 20E85 12 16
GMC C1500 Sierra 2WD: 8 cyl, 5.3 L, Auto(4)
Regular gasoline 16 20E85 12 16
Source
: U.S. Department of Energy, http://www.fueleconomy.90v.
DK9448_C008.fm Page 146 Tuesday, March 28, 2006 3:33 PM
© 2006 by Taylor & Francis Group, LLC

Using E85 in Vehicles
147
V
EHICLE
P
OWER
Ethanol has long been used in racing because of its desirable properties forincreasing engine power output. E85, too, increases the power and torque capa-bility of engines compared with gasoline. Most spark-ignited engines used in on-road vehicles operate with air to fuel mixtures at or near the stoichiometriccondition. Since the stoichiometric air to fuel ratio of E85 is less than gasoline,engines operating on E85 can use about 1.48 times more E85 for the same amountof air. Remembering that about 1.4 times more E85 is required to equal the energyof gasoline on a volume basis, this leads to about a 6–7% increase in power.
Since E85 burns cleaner and the engine spark timing can be advanced dueto the increased octane number, an engine operating on E85 can actually achievehigher increases in power.
Additionally, E85 has a higher heat of vaporization than gasoline. This isimportant in spark-ignited engines as the fuel is inducted into the intake manifold.As the fuel vaporizes due to the heat of the engine, it displaces air, reducing theability of the engine to draw in fresh air. This reduces the volumetric efficiencyof the engine, reducing the power. By increasing the heat of vaporization, E85increases the engine volumetric efficiency, allowing more air to be drawn intothe engine. This additional air allows the engine to use additional fuel, leadingto increased power.
Further, an engine can be designed with a higher compression ratio to takefull advantage of the increased octane of E85. All of these factors can be combinedto increase power by more than 25% compared with the same-sized gasolineengine.
C
OLD
S
TARTABILITY
Pure ethanol becomes difficult to vaporize when cold, leading to poor coldstartability. In fact ethanol will not form an air/fuel vapor mixture high enoughto support combustion below 11
°
C.
12
Therefore, gasoline is added to the ethanolin order to support cold startability and increased cold start enrichment is usedto achieve combustible vapor air mixtures in the engine.
Additional difficulties when cold starting with E85 can be attributed to itshigh conductivity. During cold starts, the spark plug electrodes can become wettedwith fuel. Since E85 is much more conductive, this can leading to plug shortingand misfire.
8
These problems have been addressed by the major automakers through bettercold-start fuel calibrations. Most manufacturers now report good cold starts attemperatures below 0°F (–18°C) when using E85 in a winter blend (E70).
S
AFETY
E85 has wider flammability limits on the rich side, and it has a higher flamespeed compared to gasoline. This increases the probability of encountering flash-back or fuel vapor ignition during fuel filling.
17
Because of this, vehicles using
DK9448_C008.fm Page 147 Tuesday, March 28, 2006 3:33 PM
© 2006 by Taylor & Francis Group, LLC

148
Alcoholic Fuels
E85 require a flame arrestor, which is installed into the fuel filling tube. Thisdevice will extinguish any flame that might occur.
EFFECT OF E85 ON THE ENVIRONMENT
One of the main motivations for using E85 is its ability to help reduce the impactof vehicle emissions on the environment. E85 provides major reductions in sometailpipe emissions compared to gasoline. E85 is also less toxic than gasoline.Furthermore, the ethanol used in E85 can be derived from renewable resources,thus reducing net greenhouse gas emissions.
V
EHICLE
T
AILPIPE
E
MISSIONS
Determining the effect of E85 on vehicle emissions is complex, since many factorsinfluence the emissions of vehicles. Further, E85 use is a politically charged issue,effecting the environment, domestic employment, and petroleum imports. Findingreliable emissions data is, therefore, challenging. Actual emissions will vary withengine design and calibration. One of the more recent sources, the U.S. Environ-mental Protection Agency (EPA), reports potential substantial tailpipe emissionsbenefits when using E85 relative to conventional gasoline.
18
These benefits areshown in Figure 8.1. This source suggests these benefits for an engine optimizedto operate on E85. The EPA also reports that fewer total toxics are produced, andthat the hydrocarbon emissions have a lower reactivity. The use of E85 doesproduce higher ethanol and acetaldehyde emissions than gasoline.
Other sources provide different values, but most sources tend to show sub-stantial reductions in carbon monoxide. For example, the Renewable Fuels Asso-ciation reports a reduction of 25%.
19
E85 typically results in slightly reducedlevels of unburned hydrocarbons. Emissions of nitrous oxides (NOx) are slightly
FIGURE 8.1
Estimated emissions reductions for an engine optimized to use E85 com-pared to those when operating on gasoline.
Source
: Data compiled from U.S. Environ-mental Agency, EPA420-F-00-035, Mar. 2002.
Per
cen
t R
edu
ctio
n
Emissions Species
908070605040302010
0Carbon
MonoxideVolatileOrganic
Compounds
ParticulateMatter
NitrousOxides
Sulfate
DK9448_C008.fm Page 148 Tuesday, March 28, 2006 3:33 PM
© 2006 by Taylor & Francis Group, LLC

Using E85 in Vehicles
149
reduced with some sources showing slight increases and others showingdecreases. Again, much of the data is subject to the test schedule used, and thevehicle and its optimization for E85.
Data from a snowmobile powered by a four-stroke, spark-ignited enginemodified to operate using blends up to E85 is shown in Figure 8.2.
20
If the ethanol used in E85 comes from renewable resources such as corn,
E85 can show substantial reductions in greenhouse gas emissions. In 1998, theU.S. DoE Argonne National Laboratory estimated that 1 gallon of E85 reducesgreenhouse gas emissions by 16–28% compared to gasoline.
21
Other referencessuggest higher reductions exceeding 50%.
22
O
THER
E
NVIRONMENTAL
E
MISSIONS
E85 is safer than gasoline to store, transport, and refuel. Ethanol is water solubleand biodegradable. Land and water spills of pure ethanol are usually harmless,dispersing and decomposing quickly. In E85 spills, the gasoline portion of a spillis still a problem; however, the total volume of gasoline in the spill is reduced.This is significant as it is estimated that the amount of oil leaked from vehiclesinto rivers, lakes, and groundwater is estimated to be six times the annual volumeof oil spills.
23
Finally, since E85 has fewer highly volatile components than gasoline, it
produces lower levels of emissions resulting from evaporation. This leads to lowervehicle evaporative emissions during fueling and when the vehicle is not beingused. This, of course, is what causes the problems in cold starting a vehicle usingpure ethanol, which is why E85 is used in vehicles instead of pure ethanol.
S
USTAINABILITY
Ethanol can be made from biomass resources containing sugar. The main sourceof ethanol in the United States is corn. Over the years, considerable debatesurrounded the energy balance for the production of fuel ethanol from corn. An
FIGURE 8.2
Reduction in emissions when using E85 compared with E10 for a cleansnowmobile.
Source
: Davis, G. and Pilger, C., American Institute of Aeronautics andAstronautics, AIAA-2004-5681, 2004.
Per
cen
t R
edu
ctio
n
Emissions Species
70%
60%
50%
40%
30%
20%
10%
0%Hydrocarbons Carbon Monoxide Nitrous Oxides Particulate Matter
DK9448_C008.fm Page 149 Tuesday, March 28, 2006 3:33 PM
© 2006 by Taylor & Francis Group, LLC

150
Alcoholic Fuels
early study,
24
found that it takes more energy to produce and distribute fuel ethanolthan is recovered when combusting the fuel. This led critics to proclaim that cornethanol is not a fossil energy substitute and its use would actually increasepetroleum use. More recent studies have shown that ethanol production is netenergy positive, that is burning ethanol liberates more energy than is consumedin its production.
22
One of the most comprehensive studies from an independentsource found that 1.34 BTU of energy are delivered for each 1 BTU input.
25
Bycontrast, gasoline delivers about 0.8 BTU for each 1 BTU input. Thus, E85 useprovides about 1.25 BTU for every 1 BTU of energy input.
While the energy balance is important, the type of energy used and producedis perhaps even more important. For example, ethanol is a high-energy densityliquid fuel. E85 can be used to displace the use of fossil energy. This approachfocuses the energy balance issue, looking at the energy value of the liquid fossilfuels used in the production of ethanol. Using this approach, 1 BTU of fossilenergy (typically petroleum) generates between 4.07 and 6.34 BTU of ethanolfuel energy.
26,25
Converting to E85, this means each 1 BTU of fossil fuel generatesbetween 3.46 and 5.39 BTU of E85 fuel. According to a 1998 report from ArgonneNational Laboratory, each gallon of E85 used reduces petroleum use by 73–75%.
21
FUTURE TRENDS IN E85
The future for E85 use in vehicles remains uncertain. The use of ethanol hasgrown dramatically in the United States, rising from about 175,000 gallons in1980 to a projected 4.4 billion gallons in 2005.
22
Yet the use of E85 is stillrelatively small. The United States has over 4.1 million E85 capable vehicles onthe road. While this sounds impressive, consider that in 1999 the United Stateshad almost 0.8 vehicles per capita, or over 200 million vehicles in use.
27
ThusE85 vehicles represent only about 2–3% of all vehicles. This means that theconsumer demand is not yet high enough to provide economic incentive for thefuel-producing companies to produce large quantities of E85 at the pump. Further,most, if not all, of the E85 capable vehicles are FFVs, which means that theyoperate well on gasoline, reducing the consumer demand for E85.
Still, as more experience is gained using lower blends of ethanol fuels,governments and fleet operators have shown a greater willingness to use E85.For example in 2005, the state of Minnesota legislature voted to require E20 use,up from the current requirement of E10. Furthermore, the U.S. Postal ServiceNorthern District has a large fleet of E85 FFVs, comprising about 13% of thetotal fleet.
The turning point for E85 use in vehicles appears to hinge on the total marketpenetration of FFVs and on the total fuel cost. As the market develops in size,owners of FFVs will demand E85 when it is economically advantageous to use.If this happens then, perhaps, Henry Ford was correct when he proclaimed ethanolthe fuel of the future and designed the Model T to operate on ethanol or gasoline.
DK9448_C008.fm Page 150 Tuesday, March 28, 2006 3:33 PM
© 2006 by Taylor & Francis Group, LLC
Using E85 in Vehicles 151
REFERENCES
1. Port, D. The Road Ahead, Natural Gas Fuels, May, 2005.2. Lambrecht, B., Brazil Offers Model for Ethanol Success,. St. Louis Post-Dispatch,
May 20, 2005.3. Pulkrabek, W., Thermochemistry and Fuels,. Engineering Fundamentals of the
Internal Combustion Engine, 2nd Edition, Pearson Prentice Hall, EnglewoodCliffs, NJ, 2004, pp. 173–177.
4. EPAct: Alternative Fuels for Energy Security, Cleaner Air, U.S. Department ofEnergy, DOE/GO-102005-2012, Jan., 2005, http://www.eere.energy.gov/vehicle-sandfuels/epact.
5. Clean Cities Program, U.S. Department of Energy, Energy Efficiency and Renew-able Energy, http://www.eere.energy.gov/cleancities.
6. RFA Tax Guidance on VEETC. The Renewable Fuels Association, Publication #050, Feb. 1, 2005.
7. Alternative Fuels Data Center, U.S. Department of Energy, Energy Efficiency andRenewable Energy, http://www.eere.energy.gov/afdc/e85toolkit/eth_vehicles.html.
8. Davis, G. et al., The Effect of Multiple Spark Discharge on the Cold-Startabilityof an E85 Fueled Vehicle, Society of Automotive Engineers, 1999-01-0609, 1999.
9. Stodert, A. et al., Fuel System Development to Improve Cold start Performanceof a Flexible Fuel Vehicle, Society of Automotive Engineers, 982532, 1998.
10. Shauck, M., and Znain, M, The Future is Now: Ethanol in Aviation, RenewableAviation Fuels Development Center, Baylor University, 1998.
11. Davis, G., Reduction In Snowmobile Emissions When Using High Blend Alcohol(E-85) Fuel, Presented at the 2003 International Energy Conversion EngineeringConference, AIAA, AIAA-2003-6025, 2003.
12. Markel, A.J. and Balley, B.K., Modeling and Cold Start in Alcohol-FueledEngines. National Renewable Energy Laboratory Report NREL/TP 640-24180,1998.
13. Handbook for Handling, Storing, and Dispensing E85, U.S. Department of Energy,DOE/GO-1002001-956, Revised Oct. 2002.
14. Sinor, J. and Bailey, B., Current and Potential Future Performance of EthanolFuels, Society of Automotive Engineers, 930376, 1993.
15. Bolt, J., A Survey of Alcohol as a Motor Fuel, SAE Special Publication SAE/PT-80/19, 1980.
16. 2005 Flexible Fueled Vehicles, U.S. Department of Energy, http://www.fuelecon-omy.gov.
17. Davis, G. and Heil, E., The Development and Performance of a High BlendEthanol Fueled Vehicle, Society of Automotive Engineers, 200-01-1602, 2000.
18. Clean Alternative Fuels: Ethanol. U.S. Environmental Protection Agency,EPA420-F-00-035, Mar. 2002.
19. E85 Can Reduce Ethanol Fueling America’s Future Today. Brochure produced bythe Renewable Fuels Association, 2001.
20. Davis, G. and Pilger, C., Effect of Biomass-based Fuels and Lubricants on Snow-mobiles, American Institute of Aeronautics and Astronautics, AIAA-2004-5681,2004.
21. Corn to Fuel Your Car: A Good Environmental Choice? TransForum, Summer1998.
DK9448_C008.fm Page 151 Tuesday, March 28, 2006 3:33 PM
© 2006 by Taylor & Francis Group, LLC

152 Alcoholic Fuels
22. Wang, M., Fuel-Cycle Energy and Greenhouse Emission Impacts of Fuel Ethanol,Center for Transportation Research, Argonne National Laboratory, Presentationat EPA Cincinnati, Cincinnati, May 8, 2003.
23. The State of Canada’s Environment 1995, Environment Canada, 1996.24. Pimentel, D., Ethanol Fuels: Energy Security, Economics, and the Environment,
J. Agric. Environ. Ethics, 4, 1991.25. Shapouri, H. et al., The Energy Balance of Corn Ethanol: An Update, U.S.
Department of Agriculture, Agricultural Economic Report Number 813, 2002.26. Fuel Cycle Evaluations of Biomass Ethanol and Reformulated Gasoline, Biofuels
Systems Division, U.S. Department of Energy, DOEYGO100094.002, Jul. 1994.27. Environmental Data Compendium 1999,. Organization for Economic Cooperation
and Development, OECD, Paris, 1999.
DK9448_C008.fm Page 152 Tuesday, March 28, 2006 3:33 PM
© 2006 by Taylor & Francis Group, LLC

Section III
Applications of Alcoholic Fuels
DK9448_S003.fm Page 153 Monday, March 6, 2006 9:09 AM
© 2006 by Taylor & Francis Group, LLC

155
9
Current Status of Direct Methanol Fuel-Cell Technology
Drew C. Dunwoody, Hachull Chung, Luke Haverhals, and Johna Leddy*
University of Iowa, Department of Chemistry, Iowa City
CONTENTS
Introduction .......................................................................................................155Historical Perspective........................................................................................157
Catalyst Development ...........................................................................158Membrane Development .......................................................................159
Thermodynamic Considerations .......................................................................160Thermodynamic Optimum....................................................................160Realities of Surface Kinetics ................................................................161
Performance Targets and Efficiencies...............................................................164General Optimization........................................................................................166Electrocatalysts and Supports ...........................................................................172Membrane Technology......................................................................................175
Nafion-Based Membranes.....................................................................176New Separators .....................................................................................178
Closing Thoughts ..............................................................................................182Abbreviations ....................................................................................................184References .........................................................................................................185
INTRODUCTION
This chapter presents aspects of current developments in direct methanol fuelcell (DMFC) technologies. In particular, the focus is on systems where thefuel stream is a solution of water and methanol fed directly to the fuel cellanode. These systems are the primary focus of the review as cells usingreformed methanol as the fuel is a subset of the general class of polymer
* Author to whom correspondence should be addressed.
DK9448_C009.fm Page 155 Monday, April 17, 2006 8:35 AM
© 2006 by Taylor & Francis Group, LLC

156
Alcoholic Fuels
electrolyte membrane (PEM) fuel cells that derive hydrogen from reformatesources such as alcohols and hydrocarbons. A diagram of a DMFC is shownin Figure 9.1. A short, historical, retrospective of relevant technologies andthe thermodynamics that govern methanol-based fuel cell systems are pre-sented. A survey of the state of the art, largely in terms of performance, arepresented for a variety of fuel cell categories. Efficiency and cost are oftenthe driving force behind development efforts. Trends in DMFC design, elec-trocatalyst, and membrane development are discussed. Finally, some closingthoughts and discussion of one of the more challenging limitations of extantDMFC technology. The chapter focuses on the application side of the tech-nology, and, given space constraints, computer modeling studies are not cov-ered in depth. Save for historical references, pains are taken to use the mostcurrent references available. The majority range from 2003 to the present.
FIGURE 9.1
Diagram of a DMFC. A methanol and water solution is fed to the anodeand oxidant is fed to the cathode. The catalyst layers serve as the sites for electrolysis andthe membrane serves as the electrical separator and ionic conductor. Methanol crossoverfrom anode to cathode causes parasitic power loss. Reducing the degree of methanolcrossover is an active area of DMFC research.
Anode | Membrane | CathodeCatalyst Catalyst
CH3OH + H2O Air or O2
CO2 + trace CO + H2O(+ excess CH3OH)
H2O(+ excess oxidant)
H+
CH1OH Crossover
R load
e- e-
DK9448_C009.fm Page 156 Monday, April 17, 2006 8:35 AM
© 2006 by Taylor & Francis Group, LLC

Current Status of Direct Methanol Fuel-Cell Technology
157
HISTORICAL PERSPECTIVE
The development of modern fuel cells has been driven by the need to generateclean and efficient electrical power for different applications. The first demon-stration of a fuel cell was described by William Grove in 1839. Grove was inspiredby the observation that electrolysis of water produces hydrogen and oxygen gas.He ran the process in reverse by feeding oxygen to a Pt cathode and hydrogento a Pt anode, where all electrodes were immersed in a common sulfuric acidbath. Several such cells were connected in series to generate voltage that wasmeasured as shown in Figure 9.2. This “gas voltaic battery” was of little practicalvalue.
Notable work done in the late 19th century by Ludwig Mond and CharlesLanger aimed to produce a working fuel cell run on air and industrial coal gas.They were the first to suggest the use of “stacks” of cells with manifolds to deliverfuel and oxidant streams. William White Jaques, who is generally credited withcoining the term “fuel cell,” replaced Grove’s sulfuric acid electrolyte with aphosphoric acid electrolyte. All of these systems fell short of producing practicalpower plants.
FIGURE 9.2
Diagram of Grove’s “gas battery.” The cell on top is connected with reversedpolarity relative to the four cells on bottom. Water is electrolyzed to hydrogen and oxygengas in the top cell and fed to the anode and cathode of the bottom cells. Voltage is measuredacross the top cell. The cell was run several times and performed similarly for eachi te ra t ion . Image used wi th permiss ion f rom
Phi losophical Magaz ine
(http://www.tandf.co.uk).
DK9448_C009.fm Page 157 Monday, April 17, 2006 8:35 AM
© 2006 by Taylor & Francis Group, LLC
158
Alcoholic Fuels
Francis T. Bacon, direct descendant of the renowned and similarly namedphilosopher, was first in developing a truly useful fuel cell power plant in 1959.It was a 5-kW system used to power a welding machine. It used nickel electrodesand an alkaline KOH electrolyte. Later that same year, Harry Karl Ihrig demon-strated the first fuel cell-powered vehicle, an Allis Chalmers tractor, powered by1008 cells split into 112 stacks comprising a 15-kW power source [1,2,3]. Bacon’sfuel cell design was the product of more than a quarter century of effort on hispart and was the basis for rapid development of fuel cells during the “space race”between the United States and the Soviet Union. Fuel cell development culmi-nated in the use of fuel cells in the Gemini and Apollo missions during the late1960s and early 1970s [1,2,3]. It is interesting to note that during the earlierMercury missions and Gemini missions 1 through 4, batteries were used forpower. In Gemini 5 and later missions, power was generated by polymer elec-trolyte fuel cells (PEFCs). In the Apollo missions, PEFCs were replaced by thealkaline fuel cell design because of performance problems caused by oxygencrossover and PEM instability.
The early 1970s to the present can arguably be thought of as the modern eraof fuel cell development. A modern fuel cell design generally falls into one offive categories: alkaline fuel cell (AFC), polymer electrolyte fuel cell (PEFC),phosphoric acid fuel cell (PAFC), molten carbonate fuel cell (MCFC), and solidoxide fuel cell (SOFC). All of the categories generate considerable attention inthe scientific and patent literature.
Evolution of the modern DMFC is intimately linked to the development ofthe modern low-temperature PEFC. PEFCs fueled with a pure hydrogen or refor-mate stream have received the majority of attention in the literature as the topcandidate for power systems ranging from the 10
–3
to 10
5
W needed for powerplants. The recent historical development of the PEFC follows a bifurcated pathof parallel development of electrocatalysts and PEMs. DMFCs are under increas-ing consideration as an attractive alternative to PEFCs because of the inherenteconomic and technological limitations of hydrogen production and storage[1,2,3,4,5].
C
ATALYST
D
EVELOPMENT
Pioneering work in DMFC technology was undertaken by Shell, Exxon-Alsthom,Allis Chalmers, and Hitachi during the 1960s and 1970s [1,6]. Research focusedon developing noble metal catalysts in liquid acid and alkaline electrolytes [1].During this period, the mechanistics of methanol oxidation at Pt-based catalystswere studied [1,7,8]. While fundamental understanding of methanol oxidationbecame more clear, maximum current densities remained low. It was thought thelimitation on current density was largely due to inadequate ionic conduction andstability of the PEMs employed in the fuel cells.
DK9448_C009.fm Page 158 Monday, April 17, 2006 8:35 AM
© 2006 by Taylor & Francis Group, LLC

Current Status of Direct Methanol Fuel-Cell Technology
159
M
EMBRANE
D
EVELOPMENT
In the mid 1960s, DuPont introduced the perfluorinated superacid membraneNafion®. It was considered a major advancement in PEM materials [3]. Earlier,less effective PEM materials included polystyrene-based ionomers and heteroge-neous sulfonated divinylbenzene cross-linked polystyrene [2,3]. These earlyPEMs had poor long-term chemical stability and low proton conductivity. Nafionperformance was considerably better than these other materials, however, it wasquickly recognized that methanol crossover through Nafion would limit its use-fulness as a separator in DMFCs [9]. Crossover diminishes cell efficiency andoccurs when fuel that is fed to the anode crosses through the membrane to thecathode and reacts directly with the oxidant. The process also poisons the cathodeelectrocatalyst with methanol oxidation products.
In the mid-1980s, Nafion membranes became more widely available andsolubilized Nafion was introduced to the market. As Nafion became more widelyavailable, PEFC research began in earnest and has since continued. The mostnotable improvement is a dramatic reduction in catalyst loading at ever-increasingpower outputs [6]. Another important discovery was that the stability of the Ptelectrocatalyst is greatly enhanced when Nafion is added to the electrocatalystlater. These developments set the stage for a revival of interest in low-temperatureDMFCs during the late 1990s [6,10,11,12]. Figure 9.3 demonstrates the increasein DMFC research activity over this period.
FIGURE 9.3
Plot of hits by year for the topical search “polymer electrolyte fuel cell”(
�
) and “methanol fuel cell” (
�
) using the SciFinder Scholar 2004 search engine.Searches conducted in May of 2005.
120011001000900800700600500
400
300
200
100
0
Nu
mb
er o
f P
ub
licat
ion
s
1955 1965 1975 1985 1995 2005Year
Polymer Electrolyte Fuel Cell
Methanol Fuel Cell
DK9448_C009.fm Page 159 Monday, April 17, 2006 8:35 AM
© 2006 by Taylor & Francis Group, LLC

160
Alcoholic Fuels
As will be seen in later sections of this chapter, current efforts in DMFC researchinclude minimizing methanol crossover through the separator of DMFCs whilemaintaining high proton conductivity, developing methanol tolerant oxygen reduc-tion catalysts, and identifying more cost-effective methanol oxidation catalysts [13].
THERMODYNAMIC CONSIDERATIONS
The following is a brief treatment of the thermodynamics governing the methanoloxidation reaction of a DMFC. Also, the impact of surface kinetics on the practicalefficiency of the cell are presented. Some intriguing reports suggesting a newgeneral direction for CO-tolerant catalyst development are cited [14,15,16].
T
HERMODYNAMIC
O
PTIMUM
When an organic fuel is used, essentially as a hydrogen source in a fuel cell, theexpectation is that the fuel will be completely oxidized to carbon dioxide. Formethanol, this is summarized thermodynamically [17] in terms of the reductionpotentials as
(9.1)
While methanol is oxidized at the anode, oxygen is reduced at the cathode:
(9.2)
The net cell reaction is
(9.3)
where the standard cell potential (electromotive force, emf) is
E
cell
0
= 1.229 –0.016 = 1.213
V
. For a six-electron process (
n
= 6), the standard free energy is
∆
G
0
= –
nFE
cell
0
= –702.2
kJ
/
mol
for methanol. With a molecular mass,
M
, of0.03204 kg/mol, the theoretical specific energy for methanol is
W
= –
∆
G
0
/(
M
×
3600
s
/
hr
) = 6.088
kWh
/
kg
; because the density of methanol is 0.7914 kg/l, thiscorresponds to an energy density of 4.818
kWh
/
l
. The standard enthalpy [17],
∆
H
0
= –726
kJ
/
mol
, is similar to
∆
G
0
, consistent with a small entropy term. Formally, the complete oxidation of methanol can be viewed thermodynam-
ically as a series of two-electron/two-proton oxidation steps. The reduction poten-tials for this sequence in acid are given as [18]:
(9.4)
CO H CH OH H O2 3 206 6 0 016+ + + = .+
( )e E Vaq�
O H H O2 204 4 2 1 229+ + = .+ e E V�
CH OH O H O CO3 2 2 21 5 2aq( ) + . +�
HCHO H CH OH( )aq aqe E V+ + = .+( )2 2 0 2323
0�
DK9448_C009.fm Page 160 Monday, April 17, 2006 8:35 AM
© 2006 by Taylor & Francis Group, LLC

Current Status of Direct Methanol Fuel-Cell Technology
161
(9.5)
(9.6)
where the oxidation of formic acid is reported to carbonic acid, consistent withthe solubility of carbon dioxide and its equilibrium with carbonate [19].
(9.7)
(9.8)
The acidity constants for carbonic acid are
pK
a
1
= 6.352 and
pK
a
2
= 10.329;for formic acid,
pK
a
= 3.745. Note that these reaction steps embed informationabout the complexities of the solution chemistry in the fuel cell as reactionproducts build and local pH changes. Note also, that reactions are reported inacid because practical DMFCs are usually run under acidic conditions. Underbasic conditions, the formation of insoluble carbonates dramatically complicatesthe design of plant and limits applicability as electrolytes must be replaced ascarbonate levels build.
For species in solution, the standard potentials (reactions 4 to 6) are such thatthermodynamically, the oxidation of methanol proceeds cleanly and sequentiallyfrom alcohol to aldehyde to acid to CO
2
/carbonic acid with approximately 200mV separating each successive two proton/two electron transfer. The specificenergy and energy density of methanol are high. Thus, thermodynamically, theexpectation is that methanol is an excellent fuel for a direct reformation fuel cell.However, the thermodynamics do not capture the complexity of the surfacereactions that dictate the fate of methanol in a direct reformation fuel cell.
R
EALITIES
OF
S
URFACE
K
INETICS
The kinetic limitations of DMFCs have been well reviewed in detail fromseveral different perspectives in recent years [17,20,21]; an early and thoroughreview is provided by Parsons and VanderNoot [22]. For effective utilizationof methanol as a fuel, the catalyst must provide a good surface for adsorptionof methanol and its sequential breakdown to carbon dioxide/carbonate throughloss of paired protons and electrons. Under acidic conditions, this has largelyrestricted practical catalysts to platinum and its alloys and bimetallics. Methanolwill adsorb to platinum and platinum serves as an excellent electron transfercatalyst. The difficulty is that platinum passivates as carbon monoxide by-product accumulates and adsorbs to the platinum surface. To oxidize carbonmonoxide to carbon dioxide/carbonic acid, oxygenated species such aswater must adsorb to the catalyst surface. Because platinum is not strongly
HCOOH H HCHO H O( ) ( )aq aqe E V+ + + = .+2 2 0 03420�
H CO H HCOOH H O2 3 202 2 0 166( ) ( )aq aqe E V+ + + = − .+ �
CO CO CO2 2 2 0 034( )g aq K� ( ) = .
CO H O HCO H2 2 3 6 36( ) ( )aq aq pK+ + = .− +�
DK9448_C009.fm Page 161 Monday, April 17, 2006 8:35 AM
© 2006 by Taylor & Francis Group, LLC

162
Alcoholic Fuels
hydrophilic, platinum bimetallics and alloys formed with more hydrophilicmetals such as ruthenium are typically used to facilitate CO oxidation.
Consider the mechanistic constraints for oxidation of methanol. As in equa-tion 1, the complete oxidation of methanol to carbon dioxide proceeds by a six-proton, six-electron process. The mechanism presented in Scheme 9.1 outlinesthe basic route by which methanol is fully oxidized. The loss of paired protonsand electrons is noted for each step. To account for all six electrons, recognizethat the adsorption of water to the catalyst surface also generates an electron andproton. For a catalyst metal site, M,
(9.9)
Following the notation from Ref. [21], methanol first adsorbs to liberate oneelectron and one proton.
(9.10)
This is followed by two steps to form the formyl intermediate, –CHO.
SCHEME 9.1
Reaction pathways for methanol oxidation.
CH3OH
-H+, -e
CH2OHads
CO2
-H+, -e
CHOHads
-CHOads (weak)
-COads (strong) -COOHads (weak)
-H+, -e
-H+, -e-H+, -e
-H+, -e-H+, -e
+M-OH
+M-OH
M H O M OH H+ − + ++2 � e
CH OH CH OH H3 2+ − + ++Pt Pt eads�
DK9448_C009.fm Page 162 Monday, April 17, 2006 8:35 AM
© 2006 by Taylor & Francis Group, LLC

Current Status of Direct Methanol Fuel-Cell Technology
163
(9.11)
(9.12)
On clean platinum surfaces, these oxidations proceed smoothly to providetwo electrons and two protons. Consider Scheme 9.1. The weakly adsorbed –CHOis a point at which the oxidation mechanism breaks into two paths. One pathyields adsorbed CO and the other adsorbed COOH. Adsorbed COOH is generatedby reaction of –CHO and an adjacent M – OH to yield one proton and one electronand form weakly adsorbed –COOH. Adsorbed CO is generated by the directoxidation of –CHO by one proton and one electron to form strongly adsorbedCO. Basic kinetic arguments would favor the strongly adsorbed CO
over theweakly adsorbed –COOH
because first, the oxidation of –CHO
to
–
CO is directand does not require an adjacent second species, M – OH, and second, because
–
CO is strongly bound and –COOH
is weakly bound. It should be pointed out that there is an alternative branch point in the
oxidation process in which adsorbed –CHOH undergoes a one-electron and aone-proton oxidation to form adsorbed –COH.
(9.13)
The adsorbed –COH can then either undergo one-proton/one-electron oxida-tion to adsorbed
–
CO or react with an adjacent M – OH to form HCOOH insolution. Neither process leads to the efficient oxidation to carbon dioxide/car-bonic acid.
To the extent the platinum surface is passivated by CO, the reaction isterminated. Thus, the design of a system for the efficient and complete oxidationof methanol can be approached in two ways.
The first approach is to circumvent the formation of adsorbed CO by favoringthe formation of –COOH. Experimentally, this is done by enhancing the proba-bility that –CHO is adjacent to an oxygen source, M – OH, by using bimetallicsand alloys of platinum where M is more hydrophilic than platinum. There arequestions of stability and cost associated with these catalysts although they havebeen shown to enhance conversion efficiency. But, based on the relative strengthsof the adsorbates
–
CO and –COOH and the need for an additional catalyst site(M – OH), this approach poses some challenges.
The second approach is to consider why
–
CO is so difficult to oxidize; thatis, why does CO adsorb so strongly. Thermodynamically, the oxidation of CO
toCO
2
in solution occurs at low potential [18].
(9.14)
Pt Pt Pt eads− + + ++CH OH CHOH H2 2�
Pt Pt Pt e2CHOH CHO H� + − + ++
Pt Pt Pt e2 3CHOH COH H+ + ++�
CO H CO H O2 202 2 1 0 106+ + + ( ) = − .+ e in E V�
DK9448_C009.fm Page 163 Monday, April 17, 2006 8:35 AM
© 2006 by Taylor & Francis Group, LLC

164 Alcoholic Fuels
But, the oxidation of CO on platinum in acidic solution occurs 600 to 700mV positive of this value; Pt-Ru alloys are shown to oxidize CO at 200 to 300mV lower overpotential than Pt [23]. The oxidation of adsorbed CO is stronglydisfavored. There are two ways to think about overcoming this large overpotential.One is to design better catalysts. One common approach has been through thebifunctional mechanism where the bimetallic catalyst is designed to place Pt –CO adjacent to an oxygen source through M – OH. The other approach wouldrely on a paradigm shift in how the oxidation of –CO is viewed at a morefundamental level; better understanding could lead to better catalysts [14,15,16].
The above discussion is provided in a very general manner. Many factorssignificantly impact the catalytic efficiency of the conversion of methanol tocarbon dioxide/carbonic acid. This includes surface structure, catalyst size, andcatalyst crystal face as well as the history of the cell, the current coverage of CO,the pH, and the time since the start of the cell.
PERFORMANCE TARGETS AND EFFICIENCIES
Discussions of performance targets and efficiencies for DMFCs are complicateddue to the wide-ranging conditions, fuel and oxidant sources, and intended appli-cations for DMFCs. In this section, a survey of performance data and examplesof target system requirements listed by government agencies are used to give asense of the state of the art. Also, targets set by researchers in the literature arediscussed.
In 2002, Jörissen et al. suggested DMFC performance targets to compete interms of efficiency with reformate fed PEFCs [24]. The target they set for aDMFC is a power density of 250 mW cm–2 at a cell voltage of 500 mV and thatfurthermore, parasitic power loss due to methanol crossover should be no morethan 50 mA cm-2 at a power density of 250 mW cm–2.
In a 1999 review of advanced electrode materials for use in DMFCs, Lamyand Léger discussed the suitability of a number of energy systems in relation toDMFCs for use in automobiles [17]. Secondary batteries (e.g., Li-ion) are limitedby recharge time and power density (100–150 Wh kg-1 at maximum). PEFCs areattractive with specific power densities on the order of 1000 W kg–1 and specificenergy density >500 Wh. Energy density of pure H2 is 33 kWh kg–1 but storageconcerns make it less attractive and less efficient. Performance characteristics ofDMFCs circa 1999 is 200 mA cm–2 at 0.5 V, or 100 mW cm–2 with electrocatalystloadings under 1 mg cm–2.
Performance targets for a complete DMFC power system were posted in theSpring of 2005 by the U.S. Army Operational Test Command (OTC). The spec-ifications are target requirements for a ruggedized DMFC power plant for use inthe field on armored and other military vehicles [25]. The specifications outlinethreshold requirements and objective targets for the power system. A summaryof the requirements are listed in Table 9.1. In an effort to meet the objectiveslisted in Table 9.1, a 300-W prototype DMFC power plant was developed byT. Valdez and his team at the Jet Propulsion Laboratory [26]. The demonstration
DK9448_C009.fm Page 164 Monday, April 17, 2006 8:35 AM
© 2006 by Taylor & Francis Group, LLC
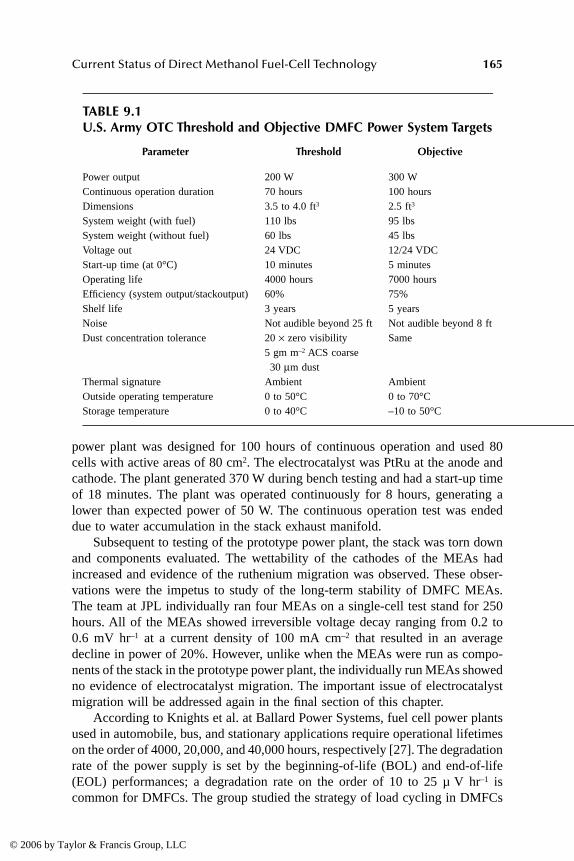
Current Status of Direct Methanol Fuel-Cell Technology 165
power plant was designed for 100 hours of continuous operation and used 80cells with active areas of 80 cm2. The electrocatalyst was PtRu at the anode andcathode. The plant generated 370 W during bench testing and had a start-up timeof 18 minutes. The plant was operated continuously for 8 hours, generating alower than expected power of 50 W. The continuous operation test was endeddue to water accumulation in the stack exhaust manifold.
Subsequent to testing of the prototype power plant, the stack was torn downand components evaluated. The wettability of the cathodes of the MEAs hadincreased and evidence of the ruthenium migration was observed. These obser-vations were the impetus to study of the long-term stability of DMFC MEAs.The team at JPL individually ran four MEAs on a single-cell test stand for 250hours. All of the MEAs showed irreversible voltage decay ranging from 0.2 to0.6 mV hr–1 at a current density of 100 mA cm–2 that resulted in an averagedecline in power of 20%. However, unlike when the MEAs were run as compo-nents of the stack in the prototype power plant, the individually run MEAs showedno evidence of electrocatalyst migration. The important issue of electrocatalystmigration will be addressed again in the final section of this chapter.
According to Knights et al. at Ballard Power Systems, fuel cell power plantsused in automobile, bus, and stationary applications require operational lifetimeson the order of 4000, 20,000, and 40,000 hours, respectively [27]. The degradationrate of the power supply is set by the beginning-of-life (BOL) and end-of-life(EOL) performances; a degradation rate on the order of 10 to 25 µ V hr–1 iscommon for DMFCs. The group studied the strategy of load cycling in DMFCs
TABLE 9.1U.S. Army OTC Threshold and Objective DMFC Power System Targets
Parameter Threshold Objective
Power output 200 W 300 WContinuous operation duration 70 hours 100 hoursDimensions 3.5 to 4.0 ft3 2.5 ft3
System weight (with fuel) 110 lbs 95 lbsSystem weight (without fuel) 60 lbs 45 lbsVoltage out 24 VDC 12/24 VDCStart-up time (at 0°C) 10 minutes 5 minutesOperating life 4000 hours 7000 hoursEfficiency (system output/stackoutput) 60% 75%Shelf life 3 years 5 yearsNoise Not audible beyond 25 ft Not audible beyond 8 ftDust concentration tolerance 20 × zero visibility Same
5 gm m–2 ACS coarse 30 µm dust
Thermal signature Ambient Ambient Outside operating temperature 0 to 50°C 0 to 70°CStorage temperature 0 to 40°C –10 to 50°C
DK9448_C009.fm Page 165 Monday, April 17, 2006 8:35 AM
© 2006 by Taylor & Francis Group, LLC
166 Alcoholic Fuels
to reduce performance degradation caused by water build-up at the cathode withtime.
Ball Aerospace is developing a personal DMFC power system to meet theneeds of the U.S. foot soldier [28]. It was developed under the Defense AdvancedResearch Projects Agency (DARPA) Palm Power program and produces averagepower of 20 W at 12 V and has a 30-W peak power. The unit operates for 50hours on the fuel provided by one fuel cartridge, and is ten times lighter thanthe equivalent battery power plant; weighing in at three pounds with full fuelcomplement.
Yi et al. characterize the changes in MEA morphology of a single-cell DMFCrun for a little longer than three days [29]. Long-term stability of the cell andelectrocatalyst are important questions. The cell was run at 100 mA cm–2 andsuffered from irrecoverable performance degradation, degrading at the rate of 1.0to 1.5 mV hr–1. Following the run, Yi and his group found signs of delaminationbetween the layers of the MEA and that both of the carbon-supported electrocat-alysts, PtRu/C on the anode and Pt/C on the cathode, had undergone a particlesize redistribution resulting in larger particle sizes on average. The redistributionfor the PtRu electrocatalyst was more pronounced than for Pt and more severein the anode.
An assessment of the state of the art in DMFC performance can be made fromrelevant data from references in this chapter; data are listed in Tables 9.2 and 9.3.Where possible, the data listed from a particular reference includes data for the“best” test cell and the associated control cell. The best test cell is considered theone with highest maximum power density. The control cell is usually of a typicalNafion MEA construction consisting of carbon-supported PtRu on the anode, car-bon-supported Pt on the cathode and a Nafion 115 membrane as the separator.Efforts have been made to include operating conditions and loadings. Where anentry is listed as “n/a” the value for that parameter is not available. That is, thereference does not explicitly state the value of that parameter.
GENERAL OPTIMIZATION
The following section cites selected studies aimed at optimizing the performanceof DMFCs through careful variation of design, materials, and operating condi-tions. An excellent study of a wide range of experimental conditions is presentedfirst, then issues of cathode flooding, electrolyte/electrode contact, parasitic powerloss associated with fuel pumping, electrode design, and CO2 bubble formationare considered.
A systematic study by Liu and Ge varied operational parameters such as celltemperature, methanol concentration, anode flow rate, air flow rate, and cathodehumidification, and showed that changing any one of the parameters has a pro-nounced effect on the performance of the DMFC [30]. However, varying cathodehumidification has negligible impact on DMFC performance. The range of param-eters evaluated are listed in Table 9.4. In general, higher cell temperatures leadto better DMFC performance; however, other processes that diminish cell
DK9448_C009.fm Page 166 Monday, April 17, 2006 8:35 AM
© 2006 by Taylor & Francis Group, LLC

Current Status of Direct Methanol Fuel-Cell Technology 167
performance as temperature increases such as methanol crossover and watertransfer from cathode to anode set a limit on optimum performance. The studyfound the optimal methanol solution to have a concentration between 1 and 2 M.This is in general agreement with other studies that found the optimum concen-tration to be 2.0 M [5] and 2.5 M [31] for DMFCs run under similar operatingconditions. Methanol crossover from the anode to the cathode can be minimizedby increasing either the cathode air flow rate or oxygen partial pressure. The worksuggests that the cathode structure and operating conditions play a major role inDMFC performance. The reference by Liu and Ge contains a large amount ofdata, both plotted and tabulated, and is a useful resource for making comparisonsof DMFC performance over a range of conditions.
For DMFCs power plants, performance degradation occurs when water buildsup at the cathode. Knights et al. describe a load-cycling strategy to reduce cathodeflooding [27]. By removing the load of the DMFC for 30 seconds of every 30minutes of operation, the rate for performance degradation is shown to be 13 µVhr-1 over 2000 hr of failure-free operation, which is in the low range of the typicalperformance degradation rate of 10 to 25 µV hr–1.
The use of solid PEMs such as Nafion prevents electrolytes from fully envel-oping the electrode as liquid electrolyte does. This limits the reaction area topoints of direct contact between membrane and electrode. To increase the reactivearea, Nafion suspension is often compounded directly into the catalyst layer.Sudoh et al. use the spray method to optimize the electrochemical characteristicsof the catalyst layer [37]. The spray method consists of introducing a catalyst tothe electrode surface and then spraying Nafion over the catalyst. Three Nafionloadings are considered: 0.5, 1.0, and 3.5 mg cm–2. The resulting electrodes areincorporated into DMFCs and the performance measured. The cell made withcatalyst layers having a Nafion loading of 1.0 mg cm-2 performed the bestproducing 258 mA cm–2 at 0.4 V. The cell made from electrodes with 0.5 mgcm–2 Nafion loading generated roughly half the current and the cell with thehighest Nafion loading was resistive and performed poorly. The performance ofthe spray-coated, in-house DMFC is similar to that of commercially availableELAT® electrode with similar catalyst loading (0.5 mg cm–2). ELAT is thetrademarked name of gas diffusion electrode material distributed by E-Tek, Inc.It is frequently used in PEFCs and DMFCs.
Zhang and Wang present a piezoelectric micropump design for deliveringfuel to a miniaturized DMFC power source [39]. For low current densities (<100mA cm–2) methanol concentrations between 0.5 M and 2.0 M do not significantlyimpact the power generated. The authors suggest their DMFC running at 40°Cwill have a maximum current density, or Jmax of 120 mA cm–2 at 0.35 V for a1-W system where a 25 cm2 cell will be required. The estimated power consump-tion of their piezoelectric pump operating at 100 Hz, pushing 1 ml min-1 over theface of the cell is on the order of 70 mW, or 7% of the power produced by thecell, which compares well with other literature examples.
Typical DMFC anode structures consist of strata of a supported/unsupportedcatalyst bonded with a Nafion suspension over Teflon-bonded carbon black
DK9448_C009.fm Page 167 Monday, April 17, 2006 8:35 AM
© 2006 by Taylor & Francis Group, LLC

168A
lcoh
olic Fu
els
TABLE 9.2Survey of DMFC Performance
SeparatorAno.
Catalyst
Loading AnodeFlow
Cath.Catalyst
LoadingCath.Press.MPa
Cath.Flow
Cell T(°C)
[MeOH]M
Max.Power
Potential(mV) Ref.
Naf. 117a Pt-Ru 1.0 1.0 Pt 1.0 0.1 75 air 23 1.0 2.8 180 [32]Naf. 117 Pt-Ru 1.0 1.0 Pt 1.0 0.1 75 air 23 1.0 0.9 160Naf. 117b Pt-Ru 2.0 2.0 Pt 2.0 0.1 500 O2 40 2.0 36 380 [33]Naf. 117 Pt-Ru 2.0 2.0 Pt 2.0 0.1 500 O2 40 2.0 26 100Naf. 117c Pt, Ru/C 2.0 n/a Pt 2.0 0.1 n/a O2 95 2.0 82 390 [34]Naf. 117 Pt, Ru/C 2.0 n/a Pt 2.0 0.1 n/a O2 95 2.0 32 360Naf. 117 PtRu 5.0 4.0 Pt 6.0 0.4 1500 air 110 1.0 120* 500 [24]Naf. 105 PtRu 5.0 4.0 Pt 6.0 0.4 1500 air 110 1.0 270* 500Polyaryld PtRu 5.0 4.0 Pt 6.0 0.4 1500 air 110 1.0 230* 500Naf. 115e PtRu n/a n/a Pt n/a n/a 300 O2 65 2.0 49 350 [35]Naf. 115 PtRu n/a n/a Pt n/a n/a 300 O2 65 2.0 40 350Naf. 115 PtRu/NTf 0.4 2.0 Pt/C 0.4 0.1 80 O2 70 2.0 70 200 [36]Naf. 115 PtRu/C 0.4 2.0 Pt/C 0.4 0.1 80 O2 70 2.0 50 200Naf. 115 PtRu/NTf 0.4 2.0 Pt/C 0.4 0.3 80 O2 90 2.0 140 250Naf. 115 PtRu/C 0.4 2.0 Pt/C 0.4 0.3 80 O2 90 2.0 125 250Naf. 117 PtPu/C 2.0 3.0 Pt/Cg 2.0 0.2 350 O2 90 2.0 103* 400 [37]sPEEK N/a n/a n/a n/a n/a 0.3 n/a 120 n/a 140 n/a [38]Polymerh N/a n/a n/a n/a n/a n/a n/a 110 n/a 300 n/aPolymeri N/a n/a n/a n/a n/a n/a n/a 60 n/a 50 n/aNaf. 117 PtRu 3.0 6.0 Pt 3.0 n/a 600 air 70 2.0 66 270 [30]†
mg
cm2( ) mlmin( ) mg
cm2( ) mlmin( ) mW
cm2( )
DK
9448_C009.fm
Page 168 Monday, A
pril 17, 2006 8:35 AM
© 2006 by Taylor & Francis Group, LLC
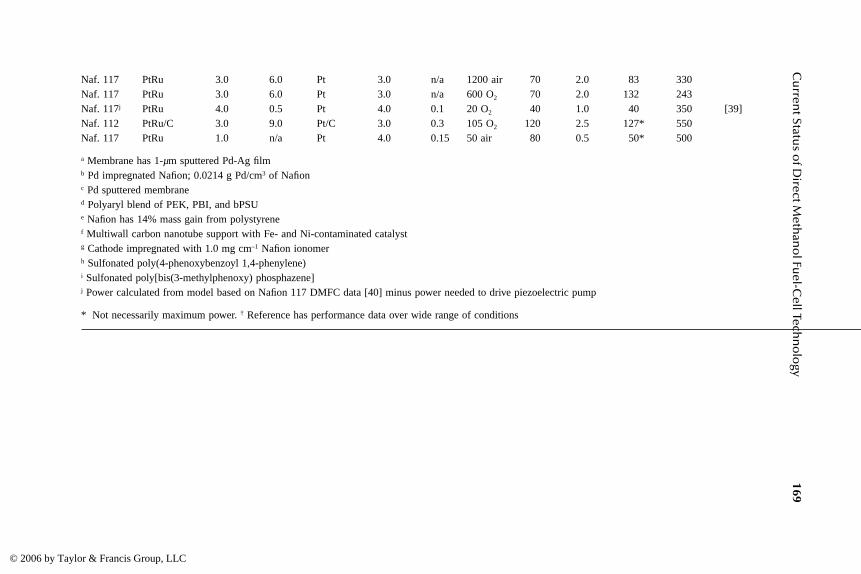
Cu
rrent Statu
s of D
irect Meth
ano
l Fuel-C
ell Techn
olo
gy169
Naf. 117 PtRu 3.0 6.0 Pt 3.0 n/a 1200 air 70 2.0 83 330Naf. 117 PtRu 3.0 6.0 Pt 3.0 n/a 600 O2 70 2.0 132 243Naf. 117j PtRu 4.0 0.5 Pt 4.0 0.1 20 O2 40 1.0 40 350 [39]Naf. 112 PtRu/C 3.0 9.0 Pt/C 3.0 0.3 105 O2 120 2.5 127* 550Naf. 117 PtRu 1.0 n/a Pt 4.0 0.15 50 air 80 0.5 50* 500
a Membrane has 1-µm sputtered Pd-Ag filmb Pd impregnated Nafion; 0.0214 g Pd/cm3 of Nafionc Pd sputtered membraned Polyaryl blend of PEK, PBI, and bPSUe Nafion has 14% mass gain from polystyrenef Multiwall carbon nanotube support with Fe- and Ni-contaminated catalystg Cathode impregnated with 1.0 mg cm–1 Nafion ionomerh Sulfonated poly(4-phenoxybenzoyl 1,4-phenylene)i Sulfonated poly[bis(3-methylphenoxy) phosphazene]j Power calculated from model based on Nafion 117 DMFC data [40] minus power needed to drive piezoelectric pump
* Not necessarily maximum power. † Reference has performance data over wide range of conditions
DK
9448_C009.fm
Page 169 Monday, A
pril 17, 2006 8:35 AM
© 2006 by Taylor & Francis Group, LLC
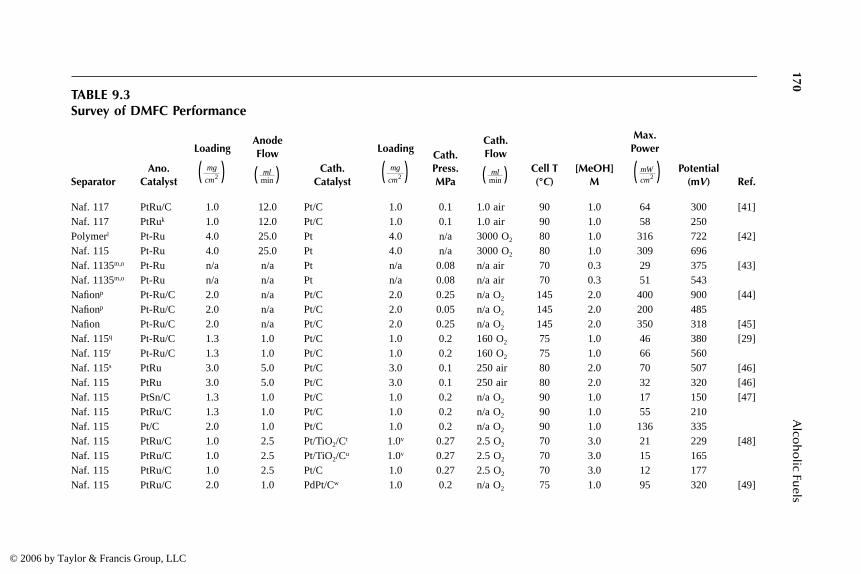
170A
lcoh
olic Fu
els
TABLE 9.3Survey of DMFC Performance
SeparatorAno.
Catalyst
Loading AnodeFlow
Cath.Catalyst
LoadingCath.Press. MPa
Cath.Flow
Cell T(°C)
[MeOH]M
Max.Power
Potential (mV) Ref.
Naf. 117 PtRu/C 1.0 12.0 Pt/C 1.0 0.1 1.0 air 90 1.0 64 300 [41]Naf. 117 PtRuk 1.0 12.0 Pt/C 1.0 0.1 1.0 air 90 1.0 58 250Polymerl Pt-Ru 4.0 25.0 Pt 4.0 n/a 3000 O2 80 1.0 316 722 [42]Naf. 115 Pt-Ru 4.0 25.0 Pt 4.0 n/a 3000 O2 80 1.0 309 696Naf. 1135m,n Pt-Ru n/a n/a Pt n/a 0.08 n/a air 70 0.3 29 375 [43]Naf. 1135m,o Pt-Ru n/a n/a Pt n/a 0.08 n/a air 70 0.3 51 543Nafionp Pt-Ru/C 2.0 n/a Pt/C 2.0 0.25 n/a O2 145 2.0 400 900 [44]Nafionp Pt-Ru/C 2.0 n/a Pt/C 2.0 0.05 n/a O2 145 2.0 200 485Nafion Pt-Ru/C 2.0 n/a Pt/C 2.0 0.25 n/a O2 145 2.0 350 318 [45]Naf. 115q Pt-Ru/C 1.3 1.0 Pt/C 1.0 0.2 160 O2 75 1.0 46 380 [29]Naf. 115r Pt-Ru/C 1.3 1.0 Pt/C 1.0 0.2 160 O2 75 1.0 66 560Naf. 115s PtRu 3.0 5.0 Pt/C 3.0 0.1 250 air 80 2.0 70 507 [46]Naf. 115 PtRu 3.0 5.0 Pt/C 3.0 0.1 250 air 80 2.0 32 320 [46]Naf. 115 PtSn/C 1.3 1.0 Pt/C 1.0 0.2 n/a O2 90 1.0 17 150 [47]Naf. 115 PtRu/C 1.3 1.0 Pt/C 1.0 0.2 n/a O2 90 1.0 55 210Naf. 115 Pt/C 2.0 1.0 Pt/C 1.0 0.2 n/a O2 90 1.0 136 335Naf. 115 PtRu/C 1.0 2.5 Pt/TiO2/Ct 1.0v 0.27 2.5 O2 70 3.0 21 229 [48]Naf. 115 PtRu/C 1.0 2.5 Pt/TiO2/Cu 1.0v 0.27 2.5 O2 70 3.0 15 165Naf. 115 PtRu/C 1.0 2.5 Pt/C 1.0 0.27 2.5 O2 70 3.0 12 177Naf. 115 PtRu/C 2.0 1.0 PdPt/Cw 1.0 0.2 n/a O2 75 1.0 95 320 [49]
mg
cm2( ) mlmin( ) mg
cm2( ) mlmin( ) mW
cm2( )
DK
9448_C009.fm
Page 170 Monday, A
pril 17, 2006 8:35 AM
© 2006 by Taylor & Francis Group, LLC

Cu
rrent Statu
s of D
irect Meth
ano
l Fuel-C
ell Techn
olo
gy171
Naf. 115 PtRu/C 2.0 1.0 Pt/C 1.0 0.2 n/a O2 75 1.0 68 322Naf. 115 PtRu/C 2.0 1.0 PtFe/MWNT 1.0x 0.2 1.0 O2 90 1.0 65 272 [50]Naf. 115 PtRu/C 2.0 1.0 Pt/MWNT 1.0 1.0 O2 90 1.0 54 241H2SO4 Pt n/a n/a Pt n/a n/a n/a O2 60 n/a 40 n/a [51]KOH PtPd n/a n/a Ag n/a n/a n/a O2 60 n/a 25 n/ak Anode made from Ti mesh with electrodeposited catalyst layerl Membrane is 5-µm thick copolymer of TFE and ethylenem MEAs made of half cells placed back to back so Nafion thickness between electrodes is 7 mil and potential listed for cell is iR correctedn MEA run as component of 22-cell DMFC stack for 6 monthso Same cell as listed with “n” superscript prior to use in DMFC stackp 100-µm thick PEMs made from recast Nafion and 3 wt % SiO2 – PWA fillerq Single-cell DMFC after 75-hour lifetime testr Same cell as listed with superscript “q” superscript prior to 75-hour lifetime tests 1 wt % CeO2 doped cathodet Catalyst heat treated at 500°Cu No heat treatmentv Listed value is Pt loading; Pt to Ti ratio of 1:1w Ratio Pd to Pt is 3:1x Ratio Fe to Pt is 1:1; Pt loading 1.0 mg cm–2
DK
9448_C009.fm
Page 171 Monday, A
pril 17, 2006 8:35 AM
© 2006 by Taylor & Francis Group, LLC
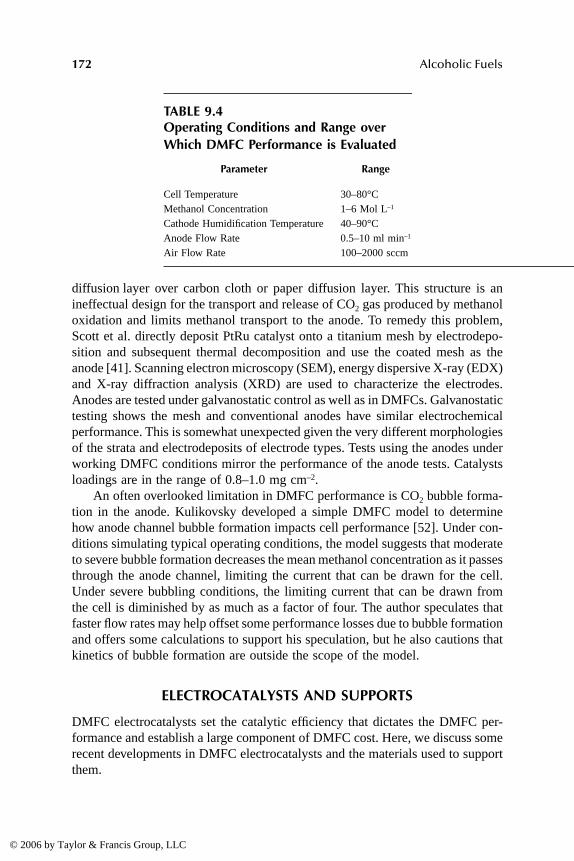
172 Alcoholic Fuels
diffusion layer over carbon cloth or paper diffusion layer. This structure is anineffectual design for the transport and release of CO2 gas produced by methanoloxidation and limits methanol transport to the anode. To remedy this problem,Scott et al. directly deposit PtRu catalyst onto a titanium mesh by electrodepo-sition and subsequent thermal decomposition and use the coated mesh as theanode [41]. Scanning electron microscopy (SEM), energy dispersive X-ray (EDX)and X-ray diffraction analysis (XRD) are used to characterize the electrodes.Anodes are tested under galvanostatic control as well as in DMFCs. Galvanostatictesting shows the mesh and conventional anodes have similar electrochemicalperformance. This is somewhat unexpected given the very different morphologiesof the strata and electrodeposits of electrode types. Tests using the anodes underworking DMFC conditions mirror the performance of the anode tests. Catalystsloadings are in the range of 0.8–1.0 mg cm–2.
An often overlooked limitation in DMFC performance is CO2 bubble forma-tion in the anode. Kulikovsky developed a simple DMFC model to determinehow anode channel bubble formation impacts cell performance [52]. Under con-ditions simulating typical operating conditions, the model suggests that moderateto severe bubble formation decreases the mean methanol concentration as it passesthrough the anode channel, limiting the current that can be drawn for the cell.Under severe bubbling conditions, the limiting current that can be drawn fromthe cell is diminished by as much as a factor of four. The author speculates thatfaster flow rates may help offset some performance losses due to bubble formationand offers some calculations to support his speculation, but he also cautions thatkinetics of bubble formation are outside the scope of the model.
ELECTROCATALYSTS AND SUPPORTS
DMFC electrocatalysts set the catalytic efficiency that dictates the DMFC per-formance and establish a large component of DMFC cost. Here, we discuss somerecent developments in DMFC electrocatalysts and the materials used to supportthem.
TABLE 9.4Operating Conditions and Range over Which DMFC Performance is Evaluated
Parameter Range
Cell Temperature 30–80°CMethanol Concentration 1–6 Mol L–1
Cathode Humidification Temperature 40–90°CAnode Flow Rate 0.5–10 ml min–1
Air Flow Rate 100–2000 sccm
DK9448_C009.fm Page 172 Monday, April 17, 2006 8:35 AM
© 2006 by Taylor & Francis Group, LLC

Current Status of Direct Methanol Fuel-Cell Technology 173
Gonzalez et al. evaluated Pt and PtRu supported on single-wall carbon nano-tubes (SWNTs) and multiwall carbon nanotubes (MWNTs) as electrocatalysts[36]. The materials are integrated into electrodes and hot pressing with Nafion115 to form MEAs. Half-cell experiments show the PtRu/C electrocatalysts havean earlier onset of methanol oxidation (i.e., lower potential) than the Pt/C coun-terparts. An MEA made with PtRu/MWNT showed the highest activity. Whenthe electrocatalysts are evaluated in DMFCs, it was found the PtRu/C electrocat-alysts performed better than their Pt/C counterparts. The sequence of electroac-tivity being PtRu/MWNT > PtRu/C > PtRu/SWNT. Maximum power densitiesgreater than 100 mW cm–2 are obtained with PtRu catalyst loadings of 0.4 mgcm–2.
A modified alcohol reduction method was used by Hwang et al. to producednanosized PtRu/C electrocatalysts [53]. Various electrocatalyst preparations arecompared to a commercial PtRu/C electrocatalyst, E-Tek 40 for morphology andeffectiveness as an electrocatalyst. Transmission electron microscopy (TEM)show in-house preparations similarly well-dispersed as the commercial electro-catalyst. Metal particle size can be tailored by selection of the concentrations ofpreparation components. Activity of the electrocatalysts are compared undervarious methanol conditions in half-cell measurements made in a three-electrodecell. The results are mixed. Under realistic operating conditions (e.g., 40°C, 0.4V, and [MeOH] ~ 15%) one of the in-house electrocatalysts outperforms thecommercial catalyst. However, at higher potentials, the commercial catalyst per-forms better. This same trend holds true at [MeOH] = 35% and 50%, where thein-house catalyst performs better than the commercial at 0.4 V, but the commercialperforms better at higher potentials. AC impedance data for this in-house catalystsuggest it has a lower resistance at all potentials and for all concentrations ofmethanol considered in the study.
An alternative to the costly Ru often employed in Pt-based bimetallic elec-trocatalysts of DMFCs may be Sn. The impact of introducing Sn to the Pt/Canode electrocatalyst of direct alcohol fuel cells (i.e., methanol and ethanol) wasevaluated by Zhou et al. [47]. Cyclic voltammograms recorded vs. SCE showedthe Sn-bearing electrocatalyst, PtSn/C, had a more favorable onset of oxidationpotential (20 mV) than Pt/C (250 mV) and PtRu/C (110 mV), however, the peakoxidation potential of PtSn/C was intermediate (640 mV) to Pt/C (700) andPtRu/C (500 mV). For further comparison, three single-cell DMFCs were pre-pared. The maximum power densities of the three cell tracked with the peakoxidation potentials of the cyclic voltammetric experiments: PtRu/C (136 mWcm–2) > PtSn/C (55 mW cm–2) > Pt/C (17 mW cm–2). The work points to thepossibility that adding relatively inexpensive Sn to the Pt/C anode may signifi-cantly improve DMFC catalysts. The effectiveness of this approach is difficult toassess as the performance of the Pt/C blank is so poor, however, the performancetrends warrant further research.
One strategy to limit the effects of methanol crossover in DMFCs is todevelop cathode electrocatalysts active toward the oxygen reduction reaction(ORR) but inactive toward the methanol oxidation reaction (MOR). Pt is active
DK9448_C009.fm Page 173 Monday, April 17, 2006 8:35 AM
© 2006 by Taylor & Francis Group, LLC
174 Alcoholic Fuels
toward both reactions whereas Pd is active only toward ORR. In a short com-munication, Sun et al. use voltammetry and chronoamperometry to demonstratea Pd:Pt alloy in the ratio of 3:1 supported on carbon is effective toward the ORRand ineffective toward the MOR [49]. The group goes on to compare theperformance of DMFCs impregnated with either the Pd3Pt1/C electrocatalyst orPt/C control in the cathode. The cell using the PdPt alloy had better overallperformance with a maximum power density, ~40% higher than that of the Pt/Ccontrol. The authors think that once the ratio of Pd to Pt rises above a certainpoint, the active sites of the Pt become isolated and overall activity of the alloytoward MOR drops precipitously.
The incorporation of the oxygen storage material CeO2 into the carbon sup-ported Pt electrocatalysts of the cathode was found to enhance the performanceof DMFCs when run on air [46]. The ceria compound is known to act as anoxygen storage buffer and helps to maintain the local oxygen pressure, but theeffect only appears to be beneficial when using air. Yu et. al. found that whenrun on pure oxygen, the presence of ceria oxide in the cathode diminished themaximum power of a DMFC by ~20%. The most pronounced enhancements onperformance are when operating the cell at low air-flow rates (250 sccm), but theeffect becomes minimal at higher flow rates (1250 sccm). Impedance spectro-scopy was used to determine the polarization resistance of the ceria-doped andnondoped Pt/C cathodes under air and O2. The resistance of the ceria-dopedcathode was lower than the control when under an air atmosphere, but the ceria-doped cathode had a higher resistance under O2. An optimized cathode compo-sition for use in air was found to be 1 wt % CeO2 and 40 wt % Pt/C.
The performance of PEFCs run on H2 and O2 has been shown to improveupon the incorporation of TiO2 into the carbon-supported Pt electrocatalyst layer[54]. Manthiram and Xiong tested the same modification of the DMFC electro-catalyst layer [48]. A number of deposition methods were tried as well as a seriesof heat treatments under a reducing atmosphere. The treatments result in an arrayof different sized particles (3.8 to 25.4 nm) that do not necessarily correlate withthe electrochemically active surfaces areas (2.59 to 21.87 m2 g–1) of the particles.Some of the Pt/TiO2/C electrocatalysts showed higher activity toward ORR insulfuric acid at room temperature than the Pt/C control. Also, a number of theTiO2-doped electrocatalysts have lower charge transfer resistances, as measuredby AC impedance, than the Pt/C control. Cyclic voltammetry shows the hydrogendesorption potential decreases and the potential for reduction of platinum oxideincreases in the presence of the added TiO2. When the performance parametersof the various Pt/TiO2/C electrocatalysts are compared, it is found the Pt/TiO2/Celectrocatalyst prepared by depositing hydrated TiO2 onto a Pt/C substrate andsubsequently heat treating at 500°C performed best. When integrated into thecathode of a DMFC, the TiO2 doped electrocatalyst shows higher tolerance tomethanol crossover than the Pt/C control. The tolerance becomes more pro-nounced as the methanol concentration of the fuel stream is raised above 1.0 M.The performance of this TiO2-doped electrocatalyst, used either in the heat-treated
DK9448_C009.fm Page 174 Monday, April 17, 2006 8:35 AM
© 2006 by Taylor & Francis Group, LLC
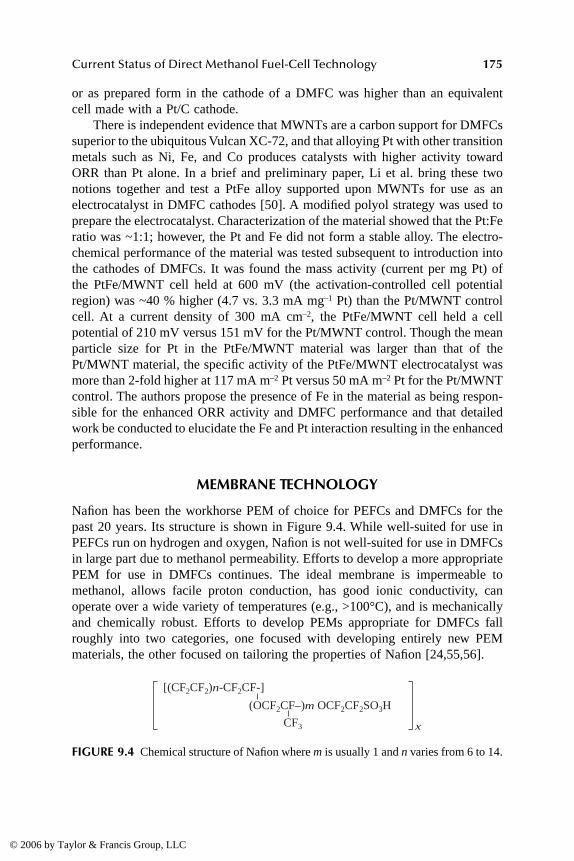
Current Status of Direct Methanol Fuel-Cell Technology 175
or as prepared form in the cathode of a DMFC was higher than an equivalentcell made with a Pt/C cathode.
There is independent evidence that MWNTs are a carbon support for DMFCssuperior to the ubiquitous Vulcan XC-72, and that alloying Pt with other transitionmetals such as Ni, Fe, and Co produces catalysts with higher activity towardORR than Pt alone. In a brief and preliminary paper, Li et al. bring these twonotions together and test a PtFe alloy supported upon MWNTs for use as anelectrocatalyst in DMFC cathodes [50]. A modified polyol strategy was used toprepare the electrocatalyst. Characterization of the material showed that the Pt:Feratio was ~1:1; however, the Pt and Fe did not form a stable alloy. The electro-chemical performance of the material was tested subsequent to introduction intothe cathodes of DMFCs. It was found the mass activity (current per mg Pt) ofthe PtFe/MWNT cell held at 600 mV (the activation-controlled cell potentialregion) was ~40 % higher (4.7 vs. 3.3 mA mg–1 Pt) than the Pt/MWNT controlcell. At a current density of 300 mA cm–2, the PtFe/MWNT cell held a cellpotential of 210 mV versus 151 mV for the Pt/MWNT control. Though the meanparticle size for Pt in the PtFe/MWNT material was larger than that of thePt/MWNT material, the specific activity of the PtFe/MWNT electrocatalyst wasmore than 2-fold higher at 117 mA m–2 Pt versus 50 mA m–2 Pt for the Pt/MWNTcontrol. The authors propose the presence of Fe in the material as being respon-sible for the enhanced ORR activity and DMFC performance and that detailedwork be conducted to elucidate the Fe and Pt interaction resulting in the enhancedperformance.
MEMBRANE TECHNOLOGY
Nafion has been the workhorse PEM of choice for PEFCs and DMFCs for thepast 20 years. Its structure is shown in Figure 9.4. While well-suited for use inPEFCs run on hydrogen and oxygen, Nafion is not well-suited for use in DMFCsin large part due to methanol permeability. Efforts to develop a more appropriatePEM for use in DMFCs continues. The ideal membrane is impermeable tomethanol, allows facile proton conduction, has good ionic conductivity, canoperate over a wide variety of temperatures (e.g., >100°C), and is mechanicallyand chemically robust. Efforts to develop PEMs appropriate for DMFCs fallroughly into two categories, one focused with developing entirely new PEMmaterials, the other focused on tailoring the properties of Nafion [24,55,56].
FIGURE 9.4 Chemical structure of Nafion where m is usually 1 and n varies from 6 to 14.
[(CF2CF2)n-CF2CF-]
(OCF2CF–)m OCF2CF2SO3H
CF3 x
DK9448_C009.fm Page 175 Monday, April 17, 2006 8:35 AM
© 2006 by Taylor & Francis Group, LLC

176 Alcoholic Fuels
NAFION-BASED MEMBRANES
Strategies for tailoring the properties of Nafion membranes include surface mod-ification of the membrane with a barrier less permeable to methanol that stillallows facile proton conduction, addition of intercalants into the membrane toreact with methanol to reduce crossover, and blending Nafion with other polymersto form hybrid membranes.
Palladium metal is of particular interest for researchers as it is impermeableto methanol but not proton [33,56]. A variety of methods to apply the Pd layerto Nafion have been assessed and the effectiveness of the modification in reducingmethanol crossover evaluated.
Ma et al. looked at the effectiveness of reducing methanol crossover bysputtering a Pt/Pd-Ag/Pt layer onto Nafion [32]. It was found that while the layerswere not crack-free, the Pd alloy-coated Nafion had increased performance overuncoated Nafion. A DMFC made with a Nafion membrane coated with a 1-µmthick Pd alloy layer generated a maximum current density roughly 35% (2.3 vs.1.7 mW cm–2) higher than a control DMFC made with twice the electrocatalystloading, though, the power densities are lower than one might expect.
Hejze et al. evaluated the performance of electrolessly deposited Pd-coatedNafion 117 to that of unmodified Nafion 117 membrane [56]. Here, Pd layerswere coated onto fully hydrated Nafion substrates and the performance as aseparator evaluated in a specialized cell for methanol concentrations <10%. Overthe course of 10 hours, methanol crossover through the Pd-coated membrane wasfound to be much lower than for the unmodified Nafion control. The design ofthe fuel cell and large iR drop disallowed using realistic current densities. Theauthors think the technology can be applied to MEA type cells and acknowledgethe increased cost of using another noble metal in a DMFC.
Methods to deposit Pd onto the surface of Nafion membranes by means ofion exchange and chemical reduction were studied by Hong et al. [33]. Palladi-nized Nafion PEMs were found to be less permeable to methanol and uptakemore water then unmodified Nafion. A DMFC made with the palladinized NafionPEM generated roughly 40% higher maximum current density than the Nafioncontrol cell. Of the palladinized membranes tested, the best performers werefound to have nanoparticles deposited near the surface of the membrane.
Choi et al. modified Nafion membranes in one of three ways: plasma etchingthe Nafion surface, sputtering Pd onto the Nafion surface, and combining bothplasma etching and Pd sputtering [34]. Plasma etching changes the membranemorphology. Sputtering Pd “plugs” the pores of the water-rich domain of themembrane that allow proton conduction, but acts as a barrier to methanol cross-over. When tested against an untreated Nafion membrane, it was found that allthree treated membranes had lower permeability to methanol with the plasma/Pdsputtered membrane having the lowest permeability. When the membranes weretested in single DMFCs, it was found all of the test cells had higher open circuitpotentials than the control cell. The current-voltage performance of the Pd sput-tered and plasma-etched cells were superior to the control cell. The test cell with
DK9448_C009.fm Page 176 Monday, April 17, 2006 8:35 AM
© 2006 by Taylor & Francis Group, LLC
Current Status of Direct Methanol Fuel-Cell Technology 177
both treatments performed poorly relative to the control cell. The Pd sputteredcell had a power maximum of ~80 mW cm–2, which is slightly more than twicethe control cell power maximum.
Kim et al. used supercritical carbon dioxide (sCO2) to graft polystyrene ontoNafion 115 as sCO2 produces low thermal stress and has a plasticizing effectwhen used as a swelling agent in polymers [35]. Following impregnation, themembrane was sulfonated and its properties compared to unmodified Nafion.Impregnated membranes have higher ion exchange capacity and lower perme-ability to methanol. DMFCs made with impregnated membranes generate morecurrent at 350 mV (~140 mA cm–2) than a Nafion 115 control cell (~113 mA cm–2).
Kang et al. deposited thin (0.1 µm), clay-nanocomposite films onto Nafion117 using layer-by-layer assembly [57]. The purpose was to reduce methanolcrossover using exfoliated (leaf-like) clay nanosheets that are efficient compo-nents in barrier membranes for gas and water vapor. Permeability of methanoland ionic conductivity of the treated Nafion are measured and compared to aNafion control. The control membrane has a methanol permeability of 1.91 ×10⁻⁶ cm2 s–1 and in-plane conductivity of 0.122 S cm–1. The Nafion modified witha 20-bilayer nanocomposite, has roughly half the methanol permeability as thecontrol Nafion, 7.58 × 10⁻⁷ cm2 s–1 and nearly the same in-plane ionic conductivity,0.124 S cm–1.
Chan et al. modified Nafion 115 membranes using in situ acid-catalyzedpolymerization of furfuryl alcohol (PFA) to introduce highly cross-linked andmethanol impermeable domains into the Nafion matrix. Modified and untreatedNafion PEMs were prepared and characterized [58]. It was found that methanolflux through the membranes, measured potentiostatically, changed as a functionof the wt% of PFA in the membranes. A “sweet spot” of 8 wt% showed the lowestmethanol flux, nearly 3× smaller than unmodified Nafion, while membranes withlower and higher PFA content had methanol flux intermediate to the 8 wt% andcontrol. The PFA membranes were integrated into DMFCs and the output at roomtemperature and 60°C compared to that of a native Nafion control DMFC. Underall conditions, the DMFCs made with PFA PEMs generated significantly morepower than the control DMFC. Peak power densities for DMFCs made with thePFA membranes were 2 to 3× larger than the unmodified Nafion DMFC.
One strategy to enhance water retention in PEFCs is to incorporate inorganicparticulates into the PEMs of fuel cells [59,60,61]. Nafion membranes impreg-nated in this fashion act as a barrier to methanol crossover and can be used inhigh temperature (~150°C) direct alcohol fuel cells and H2/air fuel cells [44].Aricò et al. evaluated the surface properties of basic and neutral alumina, ZrO2,SiO2, and SiO2-phosphotungstic acid (SiO2-PWA) using X-ray photoelectronspectroscopy (XPS), Brunauer Emmett and Teller (BET) surface area, and acid-base characterizations. Composite membranes were prepared by recasting Nafionwith the inorganic fillers. The resulting membranes were incorporated intoDMFCs [44]. All of the membranes showed similar methanol crossover behaviorof 4 ± 1 × 10⁻⁶ mol min–1 cm–2 at 145°C and 0.5 A cm–2. The electrochemicalperformance and conductivity of the composite membranes tracks the acidity of
DK9448_C009.fm Page 177 Monday, April 17, 2006 8:35 AM
© 2006 by Taylor & Francis Group, LLC

178 Alcoholic Fuels
the intercalants and follow the series: SiO2-PWA > SiO2 > ZrO2 > n-Al2O3 > b-Al2O3. That is, the membranes with the best performance were the most acidic.Here “n” stands for neutral and “b” for basic. The DMFC made with the hybridSiO2-PWA/Nafion membrane produced 400 mW cm–2 at 900 mV using pressur-ized O2 and a cell temperature of 145°C.
In another study Baglio et al. studied Nafion-TiO2 membranes for use in hightemperature DMFCs [45]. The electrochemical performance of the membrane issignificantly influenced by the properties of the intercalants such as surface areaand pH. Here, the TiO2 intercalated into the membranes had been calcined attemperatures ranging between 500 and 800°C. The pH of the resulting particlestrends with the temperature; a lower calcination temperature gives a particle withlower pH. As seen in [44], the membrane with the highest acidity generated themost power. Under similar operating conditions of 145°C cell temperature, 2.0M methanol solution, and pressurized O2, a DMFC using TiO2 calcined at 500°Cgenerated 350 mW cm–2. This DMFC, subjected to longevity tests, operated fora month with daily cycles of start-up and shut-down under the conditions men-tioned above. The cell potential was potentiostatically held at 400 mV. At start-up, the cell generated ~800 mA cm–2 (320 mW cm–2) and decreased to roughly760 mA cm–2 (304 mW cm–2) after 4 hours of operation. This occurred daily.Upon feeding water to the anode, start-up performance was restored the followingday.
Bauer and Willert-Porada characterized Zr-phosphate-Nafion membranes ascandidate materials for use in DMFCs [62]. The inorganic filler reduced methanolpermeability and the phosphate layer had preferred permeability to water overmethanol. The preliminary results suggest Zr-phosphate can be used to tailor suchNafion properties.
NEW SEPARATORS
New materials are being developed for use as separators/ionic conductors inDMFCs. These materials generally fall into one of two categories, fluorinatedand nonfluorinated. Here some current developments in both areas are presented.
In an effort to develop an inexpensive and effective separator for DMFCs andfuel cells operated on other fuels, Melman et al. developed a nanoporous proton-conducting membrane (NP-PCM) [63]. The NP-PCM is made of polyvinylidenefluoride (PVDF) and SiO2. Fuels are mixed into 3 M sulfuric acid electrolyte andcirculated past the anode. Characteristics of the NP-PCM separator that bestsNafion include: membrane cost lowered by 2 orders of magnitude; pore sizesroughly 50% that of Nafion; methanol crossover cut in half; as much as 4× greaterionic conductivity; and a membrane insensitive to heavy metal corrosion productsthat allow for less expensive hardware and catalysts. The maximum powerachieved with the cell was 85 mW cm–2 at ~243 mV on oxygen at atmosphericpressure, and cell temperature of 80°C. One disadvantage of this type of mem-brane is the peripheral systems must be corrosion resistant.
DK9448_C009.fm Page 178 Monday, April 17, 2006 8:35 AM
© 2006 by Taylor & Francis Group, LLC
Current Status of Direct Methanol Fuel-Cell Technology 179
Nafion is made by copolymerizing tetrafluoroethylene (TFE) and perfluorovi-nyl ether (PSEPVE) containing a sulfonyl fluoride. Whereas Nafion providesgood performance in PEFCs at temperatures below 100°C, the material is expen-sive due to the relatively difficult polymerization and expense of the monomerPSEPVE. Also, chemical modifications to tailor Nafion properties has provendifficult. Yang and Rajendran describe an effective copolymerization strategy ofTFE and ethylene to produce less expensive melt-processable terpolymers thatare easily hydrolyzed and acidified to give polymers of high ionic conductivity[42]. The conductivity is similar to or slightly higher than that of Nafion. Themembrane also uptakes more water (by weight) than Nafion under the sameconditions. An unoptimized 5-mil thick membrane tested in a DMFC yieldedperformance comparable to a DMFC made with Nafion 115. The power outputof the DMFCs were quite similar, though the methanol crossover through theexperimental membrane is 9% higher than for Nafion 115 (i.e., 10.9 × 10⁻⁴ vs.9.9 × 10–4 g min–1 cm–2). The authors speculate that the PEM may be optimizedby making a more homogeneous thickness and cross-linking.
A review of nonfluorinated PEMs for use in DMFCs was prepared by Rozièreand Jones [38]. The number of nonfluorinated polymer materials for applicationin higher-temperature fuel cells (i.e., > 80°C) is limited by thermal instability.Thermally stable polymers tend to have either polyaromatic or polyheterocyclicrepeat units. Examples of these include polybenzimidazole (PBI), poly(etherketone)s (PEK), poly(phenyl quinoxaline (PPQ), polysulfone (PSU), andpoly(ether sulfone) (PES). The chemical structures of some common nonfluori-nated polymers are shown in Figure 9.5. These polymers are thermally stable butare poor ionic conductors until modified. Modification methods include acid andbase doping of the polymer, sulfonation of the polymer backbone, grafting phos-phonated or sulfonated functional groups onto the polymer (where sulfonatedpolymers generally contain “s” in the acronym), graft polymerization onto thepolymer followed by functionalization of the graft material, and total synthesis.Many of these membranes exhibit good proton conductivity (0.01 to 0.1 S cm–1)when well-hydrated but a balance between the sulfonation level imparting ionicconductivity, adequate membrane strength, and membrane swelling must be metbefore long-term use in fuel cells is possible. Rozière and Jones suggest thatsPEKs and related polymer blends hold the most promise for use in DMFCs.They cite unpublished performance data of a DMFC made using polyaromaticmembrane with comparable power density to Nafion cells and little degradationafter start/stop regimes at temperatures >100°C over a period of weeks.
There is a limited amount of DMFC performance data for fuel cells madewith these PEMs, and the conditions under which the PEMs are tested in DMFCsare quite varied. Relevant DMFC performance data included here are listed inthe “Performance Targets and Efficiencies” section of this chapter. A more rig-orous set of evaluations for candidate PEMs in operational DMFCs should includedurability tests including startup and shutdowns over extended periods.
An engaging two-paper study by Silva et al. evaluates inorganic-organichybrid membranes made from sulfonated poly(ether ether ketone) (sPEEK)
DK9448_C009.fm Page 179 Monday, April 17, 2006 8:35 AM
© 2006 by Taylor & Francis Group, LLC
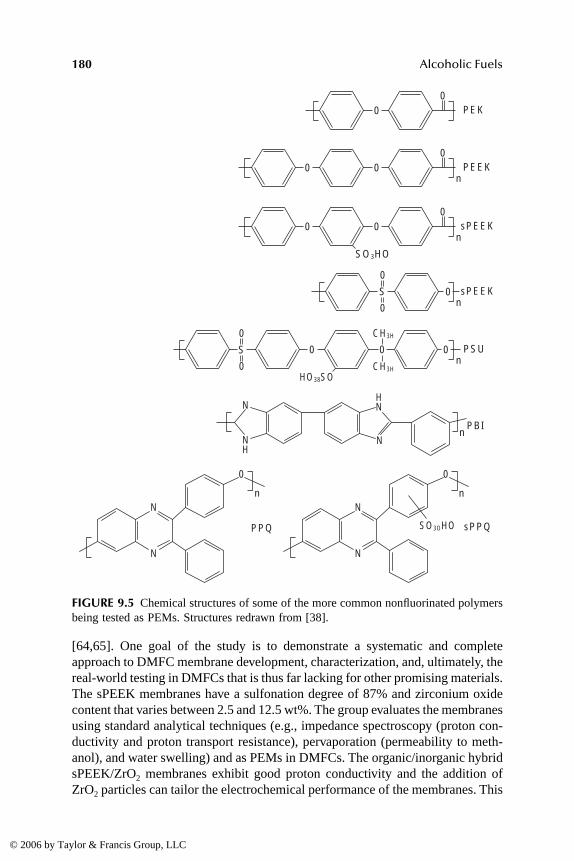
180 Alcoholic Fuels
[64,65]. One goal of the study is to demonstrate a systematic and completeapproach to DMFC membrane development, characterization, and, ultimately, thereal-world testing in DMFCs that is thus far lacking for other promising materials.The sPEEK membranes have a sulfonation degree of 87% and zirconium oxidecontent that varies between 2.5 and 12.5 wt%. The group evaluates the membranesusing standard analytical techniques (e.g., impedance spectroscopy (proton con-ductivity and proton transport resistance), pervaporation (permeability to meth-anol), and water swelling) and as PEMs in DMFCs. The organic/inorganic hybridsPEEK/ZrO2 membranes exhibit good proton conductivity and the addition ofZrO2 particles can tailor the electrochemical performance of the membranes. This
FIGURE 9.5 Chemical structures of some of the more common nonfluorinated polymersbeing tested as PEMs. Structures redrawn from [38].
00
PEK
000
nPEEK
0
SO3HO
00
nsPEEK
0 0
0
HO38SO
SO3OHO
0n
PSU
n
n
PBI
PPQ
0
0
0
S
0
0
S
nsPEEK
CH3H
CH3H
HNN
N
N
0
n
sPPQ
N
N
NH
N
DK9448_C009.fm Page 180 Monday, April 17, 2006 8:35 AM
© 2006 by Taylor & Francis Group, LLC

Current Status of Direct Methanol Fuel-Cell Technology 181
makes the organic/inorganic hybrid sPEEK/ZrO2 membranes a possible alterna-tive to perfluorinated membranes. It was found the proton transport resistanceincreased as the wt% ZrO2 in the membrane increased and that proton conduc-tivity followed the opposite trend. Water uptake decreases as the inorganic com-ponent increases, following the same trend as the proton conductivity. Thissupports the observation of the importance of sorbed water in proton conductionin sulfonated matrices. Methanol permeability decreases as the inorganic contentof the membrane increases. The permeability of O2, CO2, and N2, reductionproducts and oxidant stream constituents were evaluated as a function inorganiccontent of the membrane. It was found that as ZrO2 content increases, the per-meability of O2 and CO2 decreases and N2 permeability is unaffected. In general,the desirable characteristic of decreasing permeability of reactants, products, andoxidant stream constituents as the ZrO2 content increases were observed but witha corresponding decrease in proton conductivity.
Jörissen et al. evaluated DMFCs made with nonfluorinated PEMs (sPEEKand sPEK using PBI and basically substituted PSU (bPSU)) prepared by a thin-film method [24], in which the catalytic layer is sprayed directly onto the PEM.The authors used unsupported electrocatalysts at relatively high loadings (1.5 to6.5 mg cm–2) to overcome the effects of flooding at both electrodes. The fuelcells were operated at 110°C with little or no cathode humidification and perfor-mance was compared to DMFCs made with Nafion 117 and 105. None of theDMFCs prepared from the test PEMs had optimized catalyst layer/PEM inter-faces, yet a number of the test cells performed similarly to the control cell madewith Nafion 105. The best performing of these cells was a membrane composedof PEK, PBI, and bPSU that generated 85% of the power density (230 mW cm–2
@ 500 mV) of the Nafion 105 cell (270 mW cm–2 @ 500 mV). The control cellmade from Nafion 117 exhibited poor performance generating less than half thepower density of Nafion 105 cell under the same conditions.
Another nonfluorinated material of promise is poly(vinyl alcohol) (PVA). Thematerial is chemically and thermally robust and quite inexpensive relative toNafion. In a recent article by Khan et al., the synthesis and characterization ofPVA-based membrane is described [66]. Membranes were based on PVA and itsionic blends with sodium alginate (SA) and chitosan (CS). The membrane ionexchange capacity (IEC, in milliequivalents of ion per gram dry polymer) weredetermined to be ~0.5 for PVA, 0.6 for PVA-CS and 0.8 for PVA-SA. All of thePVA-based membranes were found to have lower methanol permeability thanNafion. The PVA-CS membrane had the lowest permeability at 6.9 × 10⁻⁸ cm2
s–1 as compared to Nafion 117 with a permeability of 2.76 × 10⁻⁷ cm2 s–1. Theother two membranes had permeability intermediate to PVA-SA and Nafion.Contrasting the desirable characteristic of lower methanol permeability thanNafion 117, the proton conductivities of the PVA-based membranes are signifi-cantly lower (~0.01 S cm–1) than that for Nafion 117 (0.1 S cm–1). The investi-gators hold out the possibility of improving proton conduction in the PVA mem-branes through doping.
DK9448_C009.fm Page 181 Monday, April 17, 2006 8:35 AM
© 2006 by Taylor & Francis Group, LLC
182 Alcoholic Fuels
Lee et al. also investigated the use of PVA-based materials. The group pre-pared membranes made from PVA, SiO2, and sulfosuccinic acid (SSA) [67]. TheSSA acted both as the cross-linking agent and as the source of hydrophilicsulfonate groups. The SSA content of the membranes was varied from 5 to 25wt %. Both the proton conductivity and methanol permeability decreased as thewt % of SSA increased to 20 wt %. At over 20 wt % SSA both trends reversed.Similar to what Khan et al. found, the membranes had proton conductivities onthe order of 1 × 10⁻³ to 1 × 10⁻² S cm–1 and methanol permeability of 1 × 10⁻⁸
to 1 × 10⁻⁷ cm2 s–1. In a related study, Lee and his group expanded the previouswork by adding poly(acrylic acid) (PAA) to the hybrid membranes [68]. Thethought was the addition of unreacted carboxylic acid groups may improve protonconductivity, but the PAA did not markedly improve upon the original hybridmembranes.
CLOSING THOUGHTS
A general observation made while surveying the DMFC literature is the unsettlinglack of replicates in many studies. Frequently, one test cell is compared to onecontrol cell and no statistics are provided to gauge cell performance. The incom-plete reporting of test condtions further confounds comparison. While impracticalfor some studies, an analysis of cell performance over extended periods of timeand with intermittent startup and shutdowns should be the standard. As a resultof the limited data, broad conclusions drawn from these studies must be assessedwith caution.
As can be seen from the breadth of topics covered in this chapter, many avenuesare being pursued to make DMFC technology a practical reality. Effort is expendedin the engineering of hardware and fuel delivery systems and in developing PEMsimpermeable to methanol. That being said, the outlook for DMFC technologyappears mixed. At this point, the development of alternative (e.g., less expensive,more effective, more robust) electrocatalysts appears to be the foremost obstaclein making DMFCs a practicable power generation alternative.
An important study by Zelenay et al. shows that use of the highly active PtRuelectrocatalyst present in the great majority of DMFC anodes (see Tables 9.2 and9.3) will contaminate the cathode with Ru [43]. The migration of Ru occurs undernearly all operating conditions, including conditions where the cell is only humid-ified with inert gases and no current is drawn from the cell. Cathode contaminationwith Ru inhibits oxygen reduction kinetics and reduces cathode electrocatalysttolerance to methanol crossover. The degree to which Ru contamination occursdepends on such factors as anode potential and operating lifetime of the cell.Depending upon the degree of Ru contamination at the cathode, the associated lossof cell performance is estimated to be from as little as ~40 mV to as much as 200mV. Figure 9.6 shows data for a Pt-only cathode subject to Ru contamination.
The top plots of Figure 9.6, marked “a” and “b,” include CO stripping scans(a) and cyclic voltammograms recorded in the absence of CO (b) for a DMFCcathode made with Pt only as the electrocatalyst. The DMFC cathode was part
DK9448_C009.fm Page 182 Monday, April 17, 2006 8:35 AM
© 2006 by Taylor & Francis Group, LLC
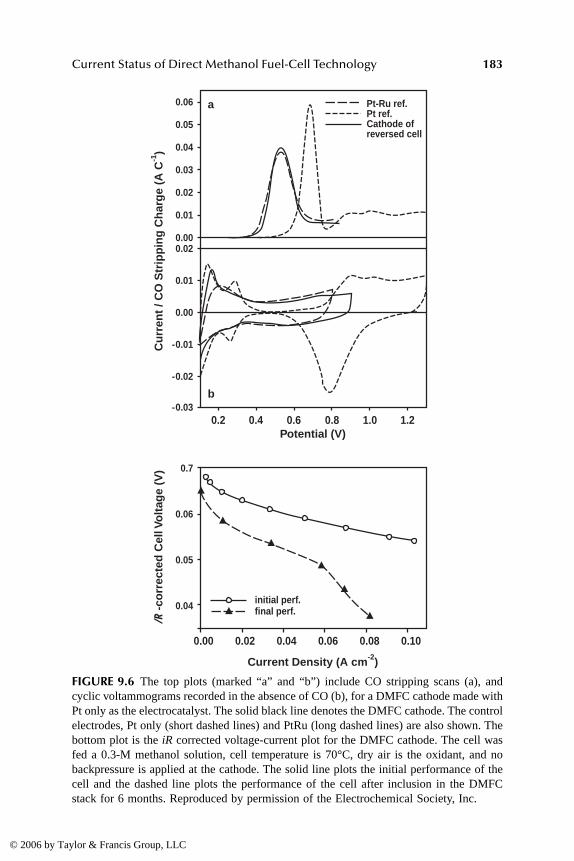
Current Status of Direct Methanol Fuel-Cell Technology 183
FIGURE 9.6 The top plots (marked “a” and “b”) include CO stripping scans (a), andcyclic voltammograms recorded in the absence of CO (b), for a DMFC cathode made withPt only as the electrocatalyst. The solid black line denotes the DMFC cathode. The controlelectrodes, Pt only (short dashed lines) and PtRu (long dashed lines) are also shown. Thebottom plot is the iR corrected voltage-current plot for the DMFC cathode. The cell wasfed a 0.3-M methanol solution, cell temperature is 70°C, dry air is the oxidant, and nobackpressure is applied at the cathode. The solid line plots the initial performance of thecell and the dashed line plots the performance of the cell after inclusion in the DMFCstack for 6 months. Reproduced by permission of the Electrochemical Society, Inc.
Current Density (A cm-2)
Potential (V)
Cu
rren
t / C
O S
trip
pin
g C
har
ge
(A C
-1)
/R-c
orr
ecte
d C
ell V
olt
age
(V)
0.2 0.4 0.6 0.8 1.0 1.2
0.00 0.02 0.04 0.06 0.08 0.10
b
a Pt-Ru ref.Pt ref.Cathode ofreversed cell
initial perf.final perf.
0.06
0.05
0.04
0.03
0.02
0.01
0.000.02
0.01
0.00
-0.01
-0.02
-0.03
0.7
0.06
0.05
0.04▲
▲
▲
▲
▲
▲
▲
DK9448_C009.fm Page 183 Monday, April 17, 2006 8:35 AM
© 2006 by Taylor & Francis Group, LLC

184 Alcoholic Fuels
of a 22-cell stack run intermittently for 6 months that experienced voltage reversal.The plots include data for control electrodes, Pt only (short dashed lines) andPtRu (long dashed lines). As can be seen in (a), the Pt-only DMFC cathodebehaves in a near identical fashion to the PtRu control, consistent with PtRu inthe electrocatalyst layer of the cathode. The CVs of plot (b) shows a similar trendwith the traces for the DMFC cathode morphologically similar to the PtRu control.
The bottom plot of Figure 9.6 shows how cell performance can diminish withRu migration. The plot is the iR corrected voltage-current plot for the DMFCcathode described above. The cell was fed a 0.3-M methanol solution, celltemperature is 70°C, dry air is the oxidant, and no backpressure is applied at thecathode. The solid line plots the initial performance of the cell and the dashedline plots the performance of the cell after inclusion in the DMFC stack for 6months.
It should be noted the fate of the cathode shown in Figure 9.6 is a ratherextreme example of Ru migration and the conditions the cell experienced are notideal, however, as the researchers found, Ru migration occurs even under themost benign conditions. Similar electrocatalyst migration in the form of agglom-eration was found by Yi et al. following a 75-hour DMFC life test [29]. The PtRuelectrocatalyst used by Yi differed from the Zelenay study in that the anodecatalyst is carbon supported PtRu rather than PtRu black and suggests that allforms of PtRu electrocatalysts are likely susceptible to migration in DMFC.
In summary, the principle challenges to commercializing DMFC technologyare effective and stable electrocatalysts tolerant to methanol contamination of thecathode and membranes significantly less permeable to methanol. The mostcommonly used separator, Nafion, is not sufficient for the task. Nor are Pt andPtRu electrocatalysts. The outlook for membrane development for the near futureseems to be somewhat static. However, promising electrocatalyst developmentssuch as relatively inexpensive Pd-based catalysts that are stable and reactionspecific may be the breakthrough that allows for the use of a less than idealseparator such as Nafion.
ABBREVIATIONS
AFC Alkaline Fuel Cell BET Brunauer Emmett and Teller BOL Beginning of Life CS Chitosan DARPA Defense Advanced Research Projects AgencyPPQ Poly(Phenyl Quinoxaline)DMFC Direct Methanol Fuel Cell EDX Energy Dispersive X-ray ELAT Commercial Gas Diusion Electrode (E-Tek)PVA Poly(Vinyl Alcohol)EOL End of Life
DK9448_C009.fm Page 184 Monday, April 17, 2006 8:35 AM
© 2006 by Taylor & Francis Group, LLC
Current Status of Direct Methanol Fuel-Cell Technology 185
IEC Ion Exhcange Capacity Jmax Maximum Current Density MCFC Molten Carbonate Fuel Cell MOR Methanol Oxidation Reaction MWNT Multiwall Carbon Nanotubes NP-PCM Nanoporous Proton-Conducting MembraneSSA Sulfosuccinic AcidORR Oxygen Reduction Reaction OTC Operational Test Command PAFC Phosphoric Acid Fuel Cell PBI Polybenzimidazole PEFC Polymer Electrolyte Fuel Cell PEK Poly(Ether Ketone)PEM Polymer Electrolyte MembranePES Poly(Ether Sulfone)PFA Polymerized Furfuryl AlcoholPSEPVE Perfluorovinyl EtherPSU PolysulfoneSA Sodium AlginateSCE Saturated Calomel ElectrodeSEM Scanning Electron MicroscopySiO2-PWA SiO2-Phosphotungstic AcidSOFC Solid Oxide Fuel CellsPEEK Sulfonated Poly(Ether Ether Ketone)SWNT Single-Wall Carbon NanotubesTEM Transmission Electron MicroscopyTFE TetrafluoroethyleneXPS X-ray Photoelectron SpectroscopyXRD X-ray Diffraction Analysis
REFERENCES
1. McNicol, B.D., Rand, D.A.J. and Williams, K.R., Direct Methanol-Air Fuel Cellsfor Road Transportation, Journal of Power Sources, 83, 15–31, 1999.
2. Perry, M.L. and Fuller, T.F., A Historical Perspective of Fuel Cell Technology inthe 20th Century, Journal of the Electrochemical Society, 149, S59–S67, 2002.
3. Stone, C. and Morrison. A.E., From Curiosity to “Power to Change the World,”Solid State Ionics, 152, 153, 1–13, 2002.
4. Glazebrook, R.W., Sciences of Heat Engines and Fuel Cells: The Methanol FuelCell as a Competitor to Otto and Diesel Engines, Journal of Power Sources, 7,215–256, 1982.
5. Surampudi, S., Narayanan, S.R., Vamos, E., Frank, H., Halpert, G., LaConti, A.,Kosek, Prakash, G.K.S. and Olah, G.A., Advances in Direct Oxidation MethanolFuel Cells, Journal of Power Sources, 47, 377–385, 1994.
DK9448_C009.fm Page 185 Monday, April 17, 2006 8:35 AM
© 2006 by Taylor & Francis Group, LLC
186 Alcoholic Fuels
6. Costamagna, P. and Srinivasan, S., Quantum Jumps in the PEMFC Science andTechnology from the 1960s to the Year 2000 Part I. Fundamental ScientificAspects, Journal of Power Sources, 102, 242–252, 2001.
7. Bagotskii, V.S. and Vasil’ev, Y.B., Mechanism of Electrooxidation of Methanolon the Platinum Electrode, Electrochimica Acta 12, 1323–1343, 1967.
8. Petry, O.A., Podlovchenko, B.I., Frumkin, A.N. and Lal, H., The Behavior ofPlatinized-Platinum and Platinum-Ruthenium Electrodes in Methanol Solutions,Journal of Electroanalytical Chemistry, 10, 253–269, 1965.
9. Verbrugge, M.W., Methanol Diusion in Perfluorinated Ion-exchange Membranes,Journal of the Electrochemical Society, 136, 417–423, 1989.
10. Aramata, A. and Ohnishi, R., Methanol Electrooxidation on Platinum DirectlyBonded to a Solid Polymer Electrolyte Membrane, Journal of ElectroanalyticalChemistry and Interfacial Electrochemistry, 162, 153–162, 1984.
11. Katayama-Aramata, A. and Ohnishi, R., Metal Electrodes Bonded on Solid Poly-mer Electrolytes: Platinum Bonded on Solid Polymer Electrolyte for Electrooxi-dation of Methanol in Perchloric Acid Solution, Journal of the American ChemicalSociety, 105, 658, 659, 1983.
12. Watanabe, M., Takahashi, T. and Kita, H., The Use of Thin Films of SulfonatedFluoropolymers for Improvements in the Activity and Durability of PlatinumElectrocatalysts for Methanol Electrooxidation, Journal of ElectroanalyticalChemistry and Interfacial Electrochemistry, 284, 511–515, 1990.
13. Apanel, G., Direct Methanol Fuel Cells—Ready to go Commercial?, Fuel CellsBulletin, Nov., 12–17, 2004.
14. Dunwoody, D., Gellett, W., Chung, H. and Leddy, J., Magnetic Modification ofProton Exchange Membrane Fuel Cells for Improved Carbon Monoxide Toler-ance, in 40th Power Sources Conference, Cherry Hill, NJ, 2002, pp. 262–265.
15. Gellett, W.L., Magnetic Microparticles on Electrodes: Polymer Electrolyte Mem-brane Fuel Cells, Carbon Monoxide Oxidation, and Transition Metal ComplexElectrochemistry, Ph.D. thesis, University of Iowa, 2004.
16. Leddy, J., Gellett, W.L. and Dunwoody, D.C., Self-Hydrating Membrane ElectrodeAssemblies for Fuel Cells, in US Patent Application, USA, Filed Oct. 15, 2003,published 21 April 2005, University of Iowa.
17. Lamy, C. and Léger, J.M., Advanced Electrode Materials for the Direct MethanolFuel Cell, in Interfacial Electrochemistry Theory, Experiment, and Applications,Wreckowski, Ed., Marcel Dekker, Inc., New York, 1999, pp. 885–894.
18. Galus, Z., Carbon, Silicon, Germanium, Tin, and Lead, in Standard Potentials inAqueous Solution, Bard, A.J., Parsons, R. and Jordan, J., Eds., Marcel Dekker, Inc.
19. Harris, D.C., Quantitative Chemical Analysis, W.H. Freeman and Company, NewYork, sixth ed., 2003.
20. Vielstich, W., CO, Formic Acid, and Methanol Oxidation in Acid Electrolytes—Mechanisms and Electrocatalysis, in Encyclopedia of Electrochemistry, Volume2: Interfacial Kinetics and Mass Transport, Bard, A.J., Stratmann, M. and Calvo,E.J., Eds.
21. Hamnett, A., Mechanism of Methanol Electro-Oxidation, in Interfacial Electro-chemistry: Theory, Experiment, and Applications, Wieckowski, A., Ed., MarcelDekker, Inc.
22. Parsons, R. and VanderNoot, T., The Oxidation of Small Organic Molecules: ASurvey of Recent Fuel Cell Related Research, J. Electroanal. Chem.
DK9448_C009.fm Page 186 Monday, April 17, 2006 8:35 AM
© 2006 by Taylor & Francis Group, LLC

Current Status of Direct Methanol Fuel-Cell Technology 187
23. Gasteiger H.A., Markovic, N., P. N. Ross Jr., and Cairns, E.J., Electro-Oxidationof Small Organic Molecules on Well-Characterized Pt-Ru Alloys, ElectrochimicaActa, 39, 1825–1832, 1994.
24. Jorissen, L., Gogel, V., Kerres, J. and Garche, J., New Membranes for DirectMethanol Fuel Cells, Journal of Power Sources, 105, 267–273, 2002.
25. Electrochemical Technologies Group, Jet Propulsion Laboratory, Additional Infor-mation Direct Methanol Fuel Cell Requirement, 2005, https://www.datm01.atec.army.mil/readroom%20DMFC.htm
26. Electrochemical Technologies Group, Jet Propulsion Laboratory, 300-Watt PowerSource Development at the Jet Propulsion Laboratory, 2005, https://www.datm01.atec.army.mil/readroom%20DMFC.htm.
27. Knights, S.D., Colbow, K.M., St-Pierre, J. and Wilkinson, D.P., Aging Mechanismsand Lifetime of PEFC and DMFC, Journal of Power Sources, 127, 127–134, 2004.
28. Ball Aerospace & Technologies Corp., Direct-methanol Fuel Cell—20 Watts Pre-liminary Technology Update, 2005, http://www.ballaerospace.com/pdf/pps20.pdf.
29. Liu, J., Zhou, Z., Zhao, X., Xin, Q., Sun, G. and Yi, B., Studies on PerformanceDegradation of a Direct Methanol Fuel Cell (DMFC) in Life Test, PhysicalChemistry Chemical Physics 6, 134–137, 2004.
30. Ge, J. and Liu, H., Experimental Studies of a Direct Methanol Fuel Cell, Journalof Power Sources, 142, 56–69, 2005.
31. Jung, D.H., Lee, C.H., Kim, C.S. and Shin, D.R., Performance of a Direct Meth-anol Polymer Electrolyte Fuel Cell, Journal of Power Sources 71, 169–173, 1998.
32. Ma, Z.Q., Cheng, P. and Zhao, T.S., A Palladium-Alloy Deposited Nafion Mem-brane for Direct Methanol Fuel Cells, Journal of Membrane Science, 215,327–336, 2003.
33. Kim, Y.J., Choi, W.C., Woo, S.I. and Hong, W.H., Evaluation of a palladinizedNafion for direct methanol fuel cell application, Electrochimica Acta, 49,3227–3234, 2004.
34. Choi, W.C., Kim, J.D. and Woo, S.I., Modification of Proton Conducting Mem-brane for Reducing Methanol Crossover in a Direct-Methanol Fuel Cell, Journalof Power Sources, 96, 411–414, 2001.
35. Sauk, J., Byun, J. and Kim, H., Grafting of styrene on to Nafion membranes usingsupercritical CO2 impregnation for direct methanol fuel cells, Journal of PowerSources 132, 59–63, 2004.
36. Carmo, M., Paganin, V.A., Rosolen, J.M. and Gonzalez, E.R., Alternative Supportsfor the Preparation of Catalysts for Low-Temperature Fuel Cells: The Use ofCarbon Nanotubes, Journal of Power Sources, 142, 169–176, 2005.
37. Furukawa, K., Okajima, K. and Sudoh, M., Structural Control and ImpedanceAnalysis of Cathode for Direct Methanol Fuel Cell, Journal of Power Sources,139, 9–14, 2005.
38. Roziere, J. and Jones, D.J., Non-Fluorinated Polymer Materials for ProtonExchange Membrane Fuel Cells, Annual Review of Materials Research. 33,503–555, 2003.
39. Zhang, T. and Wang, Q.-M., Valveless Piezoelectric Micropump for Fuel Deliveryin Direct Methanol Fuel Cell (DMFC) Devices, Journal of Power Sources, 140,72–80, 2005.
40. Gurau, B. and Smotkin, E.S., Methanol Crossover in Direct Methanol Fuel Cells:A Link Between Power and Energy Density, Journal of Power Sources, 112,339–352, 2002.
DK9448_C009.fm Page 187 Monday, April 17, 2006 8:35 AM
© 2006 by Taylor & Francis Group, LLC
188 Alcoholic Fuels
41. Allen, R.G., Lim, C., Yang, L.X., Scott, K. and Roy, S., Novel Anode Structurefor the Direct Methanol Fuel Cell, Journal of Power Sources, 143, 142–149, 2005.
42. Yang, Z.-Y. and Rajendran, R.G., Copolymerization of Ethylene, Tetrafluoroeth-ylene, and an Olefin-containing Fluorosulfonyl Fluoride: Synthesis of High-Pro-ton-Conductive Membranes for Fuel-Cell Applications, Angewandte Chemie,International Edition, 44, 564–567, S564/1–S564/5, 2005.
43. Piela, P., Eickes, C., Brosha, E., Garzon, F. and Zelenay, P., Ruthenium Crossoverin Direct Methanol Fuel Cell with Pt-Ru Black Anode, Journal of The Electro-chechemical Society, 151, A2053–A2059, 2004.
44. Arico, A.S., Baglio, V., Blasi, A.D., Modica, E., Antonucci, P.L. and Antonucci,V., Surface Properties of Inorganic Fillers for Application in Composite Mem-branes—Direct Methanol Fuel Cells, Journal of Power Sources, 128, 113–118,2004.
45. Baglio, V., Arico, A.S., Blasi, A.D., Antonucci, V., Antonucci, P.L., Licoccia, S.,Traversa, E. and Fiory, F.S., Nafion-TiO2 Composite DMFC Membranes: Physico-chemical Properties of the Filler Versus Electrochemical Performance, Electro-chimica Acta, 50, 1241–1246, 2005.
46. Yu, H.B., Kim, J.-H., Lee, H.-I., Scibioh, M.A., Lee, J., Han, J., Yoon, S.P. andHa, H.Y., Development of Nanophase CeO2-Pt/C Cathode Catalyst for DirectMethanol Fuel Cell, Journal of Power Sources, 140, 59–65, 2005.
47. Zhou, W.J., Zhou, B., Li, W.Z., Zhou, Z.H., Song, S.Q., Sun, G.Q., Xin, Q.,Douvartzides, S., Goula, M. and Tsiakaras, P., Performance Comparison of Low-Temperature Direct Alcohol Fuel Cells with Different Anode Catalysts, Journalof Power Sources, 126, 16–22, 2004.
48. Xiong, L. and Manthiram, A., Synthesis and Characterization of Methanol TolerantPt/TiOx/C Nanocomposites for Oxygen Reduction in Direct Methanol Fuel Cells,Electrochimica Acta 49, 4163–4170, 2004.
49. Li, H., Xin, Q., Li, W., Zhou, Z., Jiang, L., Yang, S. and Sun, G., An ImprovedPalladium-Based DMFCs Cathode Catalyst, Chemical Communications, Cam-bridge, U.K., 2776–2777, 2004.
50. Li, W., Liang, C., Qiu, J., Li, H., Zhou, W., Sun, G. and Xin, Q., Multi-WalledCarbon Nanotubes Supported Pt-Fe Cathodic Catalyst for Direct Methanol FuelCell, Reaction Kinetics and Catalysis Letters, 82, 235–240, 2004.
51. Bockris, J.O. and Srinivasan, S., Fuel Cells: Their Electrochemistry, McGraw-Hill, New York, 1969.
52. Kulikovsky, A.A., Model of the Flow with Bubbles in the Anode Channel andPerformance of a Direct Methanol Fuel Cell, Electrochemistry Communications,7, 237–243, 2005.
53. Sarma, L.S., Lin, T.D., Tsai, Y.-W., Chen, J.M. and Hwang, B.J., Carbon-Sup-ported Pt-Ru Catalysts Prepared by the Nafion Stabilized Alcohol-ReductionMethod for Application in Direct Methanol Fuel Cells, Journal of Power Sources,139, 44–54, 2005.
54. Shim, J., Lee, C.-R., Lee, H.-K., Lee, J.-S. and Cairns, E.J., ElectrochemcialCharacteristics of Pt-WO3/C and Pt-TiO2/C Electrocatalysts in a Polymer Elec-trolyte Fuel Cell, Journal of Power Sources, 102, 172–177, 2001.
55. Manea, C. and Mulder, M., New Polymeric Electrolyte Membranes Based onProton Donor-Proton Acceptor Properties for Direct Methanol Fuel Cells, Desali-nation, 147, 179–182, 2002.
DK9448_C009.fm Page 188 Monday, April 17, 2006 8:35 AM
© 2006 by Taylor & Francis Group, LLC

Current Status of Direct Methanol Fuel-Cell Technology 189
56. Hejze, T., Gollas, B.R., Sauerbrey, R.K., Schmied, M., Hofer, F. and Besenhard,J.O., Preparation of Pd-Coated Polymer Electrolyte Membranes and their Appli-cation in Direct Methanol Fuel C, Journal of Power Sources, 140, 21–27, 2005.
57. Kim, D.W., Choi, H.-S., Lee, C., Blumstein, A. and Kang, Y., Investigation onMethanol Permeability of Nafion Modified by Self-Assembled Clay-Nanocom-posite Multilayers, Electrochimica Acta 50, 659–662, 2004.
58. Liu, J., Wang, H., Cheng, S. and Chan, K.-Y., Nafion-polyfurfuryl Alcohol Nano-composite Membranes for Direct Methanol Fuel Cells, Journal of MembraneScience, 246, 95–101, 2005.
59. Watanabe, M., Uchida, H., Seki, Y. and Emori, M., Self-Humidifying PolymerElectrolyte Membranes for Fuel Cells, Journal of The Electrochemical Society,143, 3847–3852, 1996.
60. Watanabe, M., Uchida, H. and Emori, M., Polymer Electrolyte Membranes Incor-porated with Nanometer-Size Particles of Pt and/or Metal-Oxides: ExperimentalAnalysis of the Self-Humidification and Suppression of Gas-Crossover in FuelCells, Journal of Physical Chemistry B, 102, 3129–3137, 1998.
61. Watanabe, M., Uchida, H., Ueno, Y. and Hagihara, H., Self-Humidifying Electro-lyte Membranes for Fuel Cells, Journal of the Electrochemical Society, 150,A57–A62, 2003.
62. Bauer, F. and Willert-Porada, M., Microstructural characterization of Zr-phos-phate-Nafion membranes for direct methanol fuel cell (DMFC) applications, Jour-nal of Membrane Science, 233, 141–149, 2004.
63. Peled, E., Duvdevani, T., Aharon, A. and Melman, A., Direct-Oxidation Fuel CellsBased on Nanoporous Proton- Conducting Membrane (NP-PCM), In Direct Meth-anol Fuel Cells: Proceedings of the International Symposium, S. R. Narayanan,S.R., Gottesfeld, S. and Zawodzinski, T., Eds.
64. Silva, V.S., Rumann, B., Silva, H., Gallego, Y.A., Mendes, A., Madeira, L.M. andNunes, S.P., Proton Electrolyte Membrane Properties and Direct Methanol FuelCell Performance I. Characterization of Hybrid Sulfonated Poly (ether etherketone)/Zirconium Oxide Membranes, Journal of Power Sources, 140, 34–40,2005.
65. Silva, V.S., Schirmer, J., Reissner, R., Rumann, B., Silva, H., Mendes, A., Madeira,L.M. and Nunes, S.P., Proton Electrolyte Membrane Properties and Direct Meth-anol Fuel Cell Performance II. Fuel Cell Performance and Membrane PropertiesEects, Journal of Power Sources, 140, 41–49, 2005.
66. Smitha, B., Sridhar, S. and Khan, A.A., Synthesis and characterization ofpoly(vinyl alcohol)-based membranes for direct methanol fuel cell, Journal ofApplied Polymer Science, 95, 1154–1163, 2005.
67. Kim, D.S., Park, H.B., Rhim, J.W. and Lee, Y.M., Preparation and Characterizationof Crosslinked PVA/SiO2 Hybrid Membranes Containing Sulfonic Acid Groupsfor Direct Methanol Fuel Cell Applications, Journal of Membrane Science, 240,37–48, 2004.
68. Kim, D.S., Park, H.B., Rhim, J.W. and Lee, Y.M., Proton Conductivity and Meth-anol Transport Behavior of Cross-Linked PVA/PAA/Silica Hybrid Membranes,Solid State Ionics, 176, 117–126, 2005.
DK9448_C009.fm Page 189 Monday, April 17, 2006 8:35 AM
© 2006 by Taylor & Francis Group, LLC

191
10
Direct Ethanol Fuel Cells
Shelley D. Minteer
Department of Chemistry, Saint Louis University, Missouri
CONTENTS
Introduction .......................................................................................................191Direct Ethanol Fuel Cells .................................................................................192Ethanol Electrocatalysts ....................................................................................193
PtRu Catalysts .......................................................................................193PtSn Catalysts .......................................................................................194
Conclusions .......................................................................................................201References .........................................................................................................201
Abstract
This chapter details the background and performance of direct ethanolfuel cells (DEFCs). This chapter compares direct ethanol fuel cells to directmethanol fuel cells and other alcohol-based fuel cells. It discusses recent devel-opments in bimetallic electrocatalysts, membrane electrode assembly (MEA)fabrication techniques, temperature effects, and the effects of fuel concentrationon the performance of the direct ethanol fuel cell.
INTRODUCTION
Portable power requires simplistic systems that operate at or near room temper-ature. Most research in fuel cells for use as portable power have employedpolymer electrolyte membrane fuel cells. Polymer electrolyte membrane (PEM)fuel cells can be characterized into two categories: reformed and direct systems.Reformed systems require the use of an external reformer to reform a fuel(methane, methanol, ethanol, gasoline, etc.) into hydrogen for use in the fuel cell.In direct systems the fuel is oxidized at the surface of the electrode withouttreatment. Over the last 40 years, there has been extensive research on directmethanol fuel cells (DMFC) for portable power applications at low to moderatetemperatures [1–4]. However, there are a number of problems associated withthe use of methanol as a fuel for portable power supplies. Methanol is highly
DK9448_C010.fm Page 191 Monday, April 17, 2006 8:53 AM
© 2006 by Taylor & Francis Group, LLC
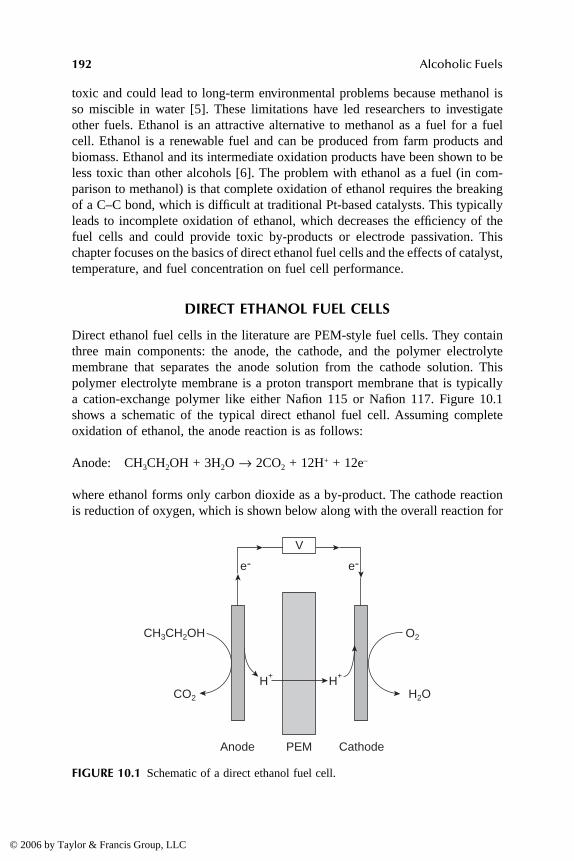
192
Alcoholic Fuels
toxic and could lead to long-term environmental problems because methanol isso miscible in water [5]. These limitations have led researchers to investigateother fuels. Ethanol is an attractive alternative to methanol as a fuel for a fuelcell. Ethanol is a renewable fuel and can be produced from farm products andbiomass. Ethanol and its intermediate oxidation products have been shown to beless toxic than other alcohols [6]. The problem with ethanol as a fuel (in com-parison to methanol) is that complete oxidation of ethanol requires the breakingof a C–C bond, which is difficult at traditional Pt-based catalysts. This typicallyleads to incomplete oxidation of ethanol, which decreases the efficiency of thefuel cells and could provide toxic by-products or electrode passivation. Thischapter focuses on the basics of direct ethanol fuel cells and the effects of catalyst,temperature, and fuel concentration on fuel cell performance.
DIRECT ETHANOL FUEL CELLS
Direct ethanol fuel cells in the literature are PEM-style fuel cells. They containthree main components: the anode, the cathode, and the polymer electrolytemembrane that separates the anode solution from the cathode solution. Thispolymer electrolyte membrane is a proton transport membrane that is typicallya cation-exchange polymer like either Nafion 115 or Nafion 117. Figure 10.1shows a schematic of the typical direct ethanol fuel cell. Assuming completeoxidation of ethanol, the anode reaction is as follows:
Anode: CH
3
CH
2
OH + 3H
2
O
→
2CO
2
+ 12H
+
+ 12e
–
where ethanol forms only carbon dioxide as a by-product. The cathode reactionis reduction of oxygen, which is shown below along with the overall reaction for
FIGURE 10.1
Schematic of a direct ethanol fuel cell.
V
CH3CH2OH
CO2
O2
H+ H+
H2O
Anode PEM Cathode
e- e-
DK9448_C010.fm Page 192 Monday, April 17, 2006 8:53 AM
© 2006 by Taylor & Francis Group, LLC
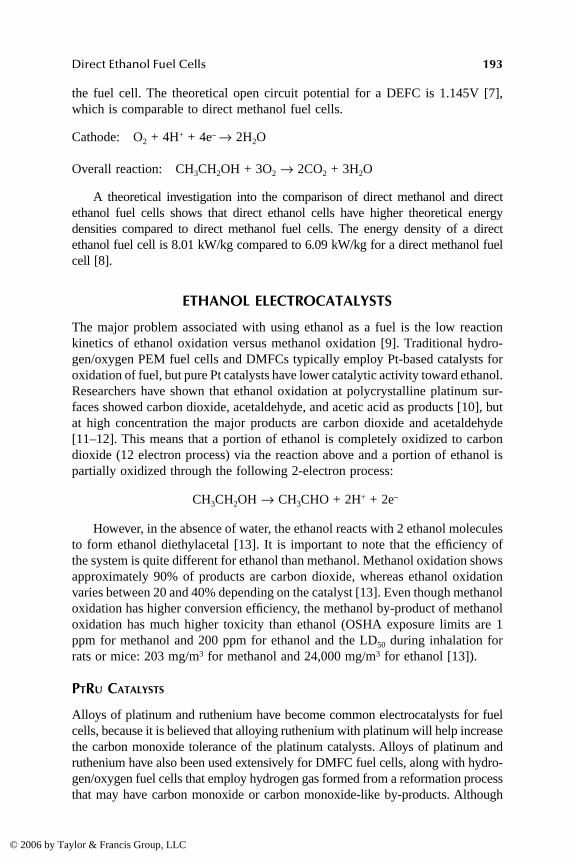
Direct Ethanol Fuel Cells
193
the fuel cell. The theoretical open circuit potential for a DEFC is 1.145V [7],which is comparable to direct methanol fuel cells.
Cathode: O
2
+ 4H
+
+ 4e
–
→
2H
2
O
Overall reaction: CH
3
CH
2
OH + 3O
2
→
2CO
2
+ 3H
2
O
A theoretical investigation into the comparison of direct methanol and directethanol fuel cells shows that direct ethanol cells have higher theoretical energydensities compared to direct methanol fuel cells. The energy density of a directethanol fuel cell is 8.01 kW/kg compared to 6.09 kW/kg for a direct methanol fuelcell [8].
ETHANOL ELECTROCATALYSTS
The major problem associated with using ethanol as a fuel is the low reactionkinetics of ethanol oxidation versus methanol oxidation [9]. Traditional hydro-gen/oxygen PEM fuel cells and DMFCs typically employ Pt-based catalysts foroxidation of fuel, but pure Pt catalysts have lower catalytic activity toward ethanol.Researchers have shown that ethanol oxidation at polycrystalline platinum sur-faces showed carbon dioxide, acetaldehyde, and acetic acid as products [10], butat high concentration the major products are carbon dioxide and acetaldehyde[11–12]. This means that a portion of ethanol is completely oxidized to carbondioxide (12 electron process) via the reaction above and a portion of ethanol ispartially oxidized through the following 2-electron process:
CH
3
CH
2
OH
→
CH
3
CHO + 2H
+
+ 2e
–
However, in the absence of water, the ethanol reacts with 2 ethanol moleculesto form ethanol diethylacetal [13]. It is important to note that the efficiency ofthe system is quite different for ethanol than methanol. Methanol oxidation showsapproximately 90% of products are carbon dioxide, whereas ethanol oxidationvaries between 20 and 40% depending on the catalyst [13]. Even though methanoloxidation has higher conversion efficiency, the methanol by-product of methanoloxidation has much higher toxicity than ethanol (OSHA exposure limits are 1ppm for methanol and 200 ppm for ethanol and the LD
50
during inhalation forrats or mice: 203 mg/m
3
for methanol and 24,000 mg/m
3
for ethanol [13]).
P
T
R
U
C
ATALYSTS
Alloys of platinum and ruthenium have become common electrocatalysts for fuelcells, because it is believed that alloying ruthenium with platinum will help increasethe carbon monoxide tolerance of the platinum catalysts. Alloys of platinum andruthenium have also been used extensively for DMFC fuel cells, along with hydro-gen/oxygen fuel cells that employ hydrogen gas formed from a reformation processthat may have carbon monoxide or carbon monoxide-like by-products. Although
DK9448_C010.fm Page 193 Monday, April 17, 2006 8:53 AM
© 2006 by Taylor & Francis Group, LLC

194
Alcoholic Fuels
extensive research was done on Pt/Ru alloys on carbon supports and platinum oncarbon supports, there was no statistical difference between the selectivity of thetwo catalysts for ethanol electrooxidation [13]. Figure 10.2 shows a comparison offuel cell performance for different alcohol fuels employing Pt/Ru alloys as catalysts.It is apparent that methanol performance is better at high current densities (at acurrent density of 250mA/cm
2
, the cell voltages are 0.354V for methanol, 0.305Vfor ethanol, 0.174V for 1-propanol, and 0.054V for 2-propanol [13]), but ethanolperformance is better at low current densities (>0.05V at low current densities).The excellent performance of ethanol at low current density is likely due to adecrease in crossover of ethanol versus methanol to the cathode. It is also interestingto note that propanol performance is significantly worse than methanol and ethanol.1-propanol oxidation forms carbon dioxide and propionaldehyde, but 2-propanoloxidation forms carbon dioxide and acetone [14]. The direct alcohol fuel cellsstudied in Figure 10.2 are being operated at a temperature of 170°C [13]. Thistemperature is extremely high (harsh enough that Nafion is not particularly stableand another polymer electrolyte (polybenzimidazole) was used) and is above thetemperatures that are realistic for portable power applications, but they provide abenchmark for comparing the 4 alcohols.
P
T
S
N
C
ATALYSTS
Zhou and coworkers have studied the effect of other alloys on ethanol electro-oxidation. Figure 10.3 shows representative cyclic voltammograms of alloys of
FIGURE 10.2
Comparison of fuel cell performance for 4 different alcohol fuels employinga 4-mg/cm
2
Pt/Ru catalyst at the anode and a 4-mg/cm
2
platinum black at the cathode.
Source
: Wang, J., Wasmus, S. and Savinell, R.F.,
J. Electrochemical Society
, 142, 4218,1995. With permission.
Current Density / mA/cm2
Cel
l Vo
ltag
e / V
0 100 200 300 400 500
0.8
0.6
0.4
0.2
0
◆
◆◆
◆◆
◆
◆
◆
◆
◆
◆
◆◆
■
■■
■
■■
■
■
■
■■■■■■
▲
▲
▲
▲
▲
▲
▲
▲
▲
▲
▲
●
●
●
●
●
●
●
●
●
methanolethanol1-propanol2-propanol
DK9448_C010.fm Page 194 Monday, April 17, 2006 8:53 AM
© 2006 by Taylor & Francis Group, LLC

Direct Ethanol Fuel Cells
195
platinum with ruthenium, tungsten, palladium, and tin. These voltammograms weretaken at room temperature in solutions that contain 1.0 M ethanol and 0.5 M sulfuricacid. The voltammograms show the largest catalytic activity (current density at theoxidation peak) for PtSn on carbon, but the PtRu on carbon has the lowest over-potential for the ethanol oxidation peaks (0.23 V lower than pure platinum oncarbon) [15]. Figure 10.4 shows voltage-current curves and power curves for thesame catalysts in a direct ethanol fuel cell at 90°C. The results indicate that Sn,Ru, and W increase the catalytic activity for ethanol oxidation on platinum (max-imum power density of 52.0 mW/cm
2
, 28.6 mW/cm
2
, and 16.0mW/cm
2
, respec-tively, compared to 10.8 mW/cm
2
for pure platinum on carbon [15]). Tin andruthenium are believed to have a bifunctional mechanism to supply surface oxygencontaining species for the oxidative removal of carbon monoxide like species thattypically passivate the surface of pure platinum [16]. The proposed mechanism forethanol oxidation at Pt/Sn alloys is shown below [17]:
FIGURE 10.3
Representative cyclic voltammograms of ethanol oxidation at differentanode catalysts in a solution of 1.0 M ethanol and 0.5 M sulfuric acid. The voltammogramswere taken at a scan rate of 10 mV/s at 25°C.
Source
: Wang, J., Wasmus, S. and Savinell,R.F.,
J. Electrochemical Society
, 142, 4218, 1995. With permission.
Potential (mV vs SCE)
Cur
rent
Des
enti
ty (
mA
/cm
2 )
0 300 600 900 0 300 600 900 0 300 600 900 0 300 600 900 0 300 600 900
Pt1Ru1/C Pt1Pd1/C Pt1Sn1/C Pt/CPt1W1/C50
40
30
20
10
0
50
40
30
20
10
0
50
40
30
20
10
0
50
40
30
20
10
0
50
40
30
20
10
0
C H OH Pt H O Pt C H OH H O
Pt C H OH Pt
2 5 2 2 5 2
2 5
+ → +
+ →
( ) ( )
( ) PPt CO Pt res xH + xe
Pt C H OH Pt CH CH
+ –
2 5 3
( ) ( )
( ) (
+ +
→ OO H e
CH CHO SnCl (OH) CH COOH3 4 3
)
Pt( )
+ +
+ → +
+ −
−
2 2
22 SSnCl 2H O e H
Pt(CO Pt(res) SnCl OH
242
4
− − ++ + +
+), ( )222
2 42
2− −
−
→ + + +
+ = + +
CO SnCl H O Pt
H O Pt Pt OH e2 ( )ads HH
Pt OH SnCl SnCl OH Pt
+
− −+ = +2 242
4 22( ) ( )ads
DK9448_C010.fm Page 195 Monday, April 17, 2006 8:53 AM
© 2006 by Taylor & Francis Group, LLC
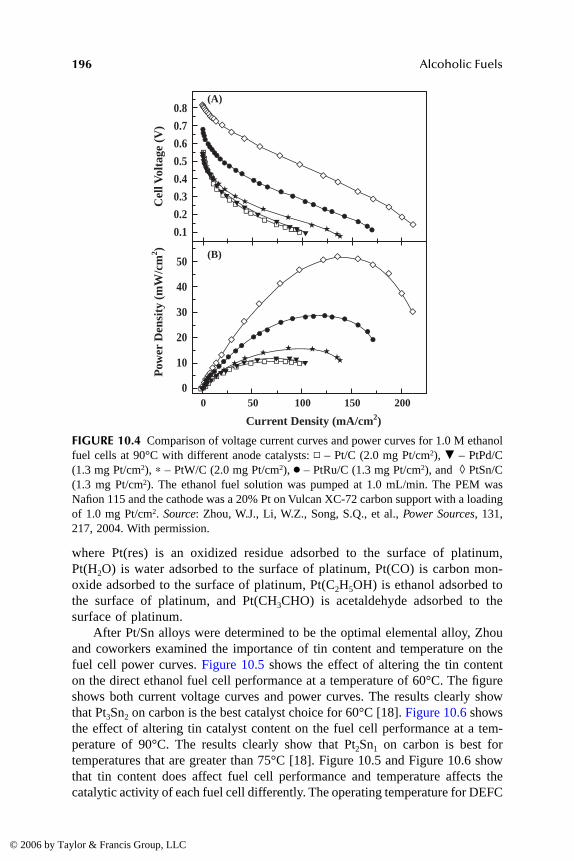
196
Alcoholic Fuels
where Pt(res) is an oxidized residue adsorbed to the surface of platinum,Pt(H
2
O) is water adsorbed to the surface of platinum, Pt(CO) is carbon mon-oxide adsorbed to the surface of platinum, Pt(C
2
H
5
OH) is ethanol adsorbed tothe surface of platinum, and Pt(CH
3
CHO) is acetaldehyde adsorbed to thesurface of platinum.
After Pt/Sn alloys were determined to be the optimal elemental alloy, Zhouand coworkers examined the importance of tin content and temperature on thefuel cell power curves. Figure 10.5 shows the effect of altering the tin contenton the direct ethanol fuel cell performance at a temperature of 60°C. The figureshows both current voltage curves and power curves. The results clearly showthat Pt
3
Sn
2
on carbon is the best catalyst choice for 60°C [18]. Figure 10.6 showsthe effect of altering tin catalyst content on the fuel cell performance at a tem-perature of 90°C. The results clearly show that Pt
2
Sn
1
on carbon is best fortemperatures that are greater than 75°C [18]. Figure 10.5 and Figure 10.6 showthat tin content does affect fuel cell performance and temperature affects thecatalytic activity of each fuel cell differently. The operating temperature for DEFC
FIGURE 10.4
Comparison of voltage current curves and power curves for 1.0 M ethanolfuel cells at 90°C with different anode catalysts:
▫
– Pt/C (2.0 mg Pt/cm
2
),
�
– PtPd/C(1.3 mg Pt/cm
2
),
∗
– PtW/C (2.0 mg Pt/cm
2
),
●
– PtRu/C (1.3 mg Pt/cm
2
), and
◊
PtSn/C(1.3 mg Pt/cm
2
). The ethanol fuel solution was pumped at 1.0 mL/min. The PEM wasNafion 115 and the cathode was a 20% Pt on Vulcan XC-72 carbon support with a loadingof 1.0 mg Pt/cm
2
.
Source
: Zhou, W.J., Li, W.Z., Song, S.Q., et al.,
Power Sources
, 131,217, 2004. With permission.
■■■
■■■■
■■
■■■
■■ ■ ■■■
■■■■■■■■
■■■
■■■■
◆
◆◆◆◆◆◆◆◆
◆
◆
◆
◆
◆◆ ◆ ◆
◆◆
◆
◆
◆◆
◆◆
◆◆
◆◆
◆◆
◆◆
●●●●●●●●●●●●
★★★★★★★★★
★★
★★
★★
★★
★★
★ ★ ★★★
★ ★★★▼
▼▼▼▼▼▼▼▼▼▼
▼▼▼▼
▼▼▼
▼▼
▼
▼▼▼▼▼▼▼▼▼▼▼
●●
●●
●●
●●
●● ●
●●
●●
●●●●●●●●●
●●
●●
●
●● ● ● ● ● ●
●●
●
◆◆◆◆◆◆◆◆◆◆◆◆
Current Density (mA/cm2)
Pow
er D
ensi
ty (
mW
/cm
2 )C
ell V
olta
ge (
V)
0.8
0.7
0.6
0.5
0.4
0.3
0.2
0.1
50
40
30
20
10
00 50 100 150 200
(A)
(B)
DK9448_C010.fm Page 196 Monday, April 17, 2006 8:53 AM
© 2006 by Taylor & Francis Group, LLC

Direct Ethanol Fuel Cells
197
FIGURE 10.5
Fuel cell performance data for different tin catalyst content at 60°C. Theanode catalyst notation corresponds to different Pt/Sn atomic ratios with a constant plat-inum loading of 1.3 mg/cm
2
. The cathode catalyst has a loading of 1.0 mg/cm
2
. Bothcathode and anode catalysts are supported on Vulcan XC-72 carbon. The PEM is Nafion115 and the cell is run in 1 M ethanol at a flow rate of 1 mL/min.
Source
: Zhou, W.J.,Song, S.Q., Li, W.Z., et al.,
Power Sources
, 140, 50, 2005. With permission.
Current Density (mA/cm2)
Current Density (mA/cm2)
Atomic concentration of Sn in PtSn (%)
Pow
er D
ensi
ty (
mW
/cm
2 )P
ower D
ensity (mW
/cm2)
(A)
(B)
(C)
30
20
10
30
25
20
15
10
5
0
Cel
l Vol
tage
(V
)
0.8
0.7
0.6
0.5
0.4
0.3
0.2
0.1
0.0
0 10 20 30 40 50
0 20 40 60 80 100 120 140
0 20 40 60 80 100 120 140
Pt1Sn1/CPt3Sn2/CPt2Sn1/CPt3Sn1/CPt4Sn1/CPt/C
Power Density at 30mA/cm2
Power Density at 40mA/cm2
Maximum Power Density
★
★
★
★★
★★
★★
★
★★
★★★★★★★★★★★★★
★★
★★★★
★
★★
★★★★
★
DK9448_C010.fm Page 197 Monday, April 17, 2006 8:53 AM
© 2006 by Taylor & Francis Group, LLC

198
Alcoholic Fuels
FIGURE 10.6
Fuel cell performance data for different tin catalyst content at 90°C. Theanode catalyst notation corresponds to different Pt/Sn atomic ratios with a constant plat-inum loading of 1.3 mg/cm
2
. The cathode catalyst has a loading of 1.0 mg/cm
2
. Bothcathode and anode catalysts are supported on Vulcan XC-72 carbon. The PEM is Nafion115 and the cell is run in 1 M ethanol at a flow rate of 1 mL/min.
Source
: Zhou, W.J.,Song, S.Q., Li, W.Z., et al.,
Power Sources
, 140, 50, 2005. With permission.
★★
★★
★
★★
★★
★
★
★
★★★
★★★★★★★★★★★
70
60
50
40
30
20
10
65605550454035302520151050
0 10 20 30 40 50
0 40 80 120 160 200
Power Density at 30mA/cm2
Power Density at 60mA/cm2
Power Density at 90mA/cm2
Maximum Power Density
★★★★★
★★
★★
★★ ★
★ ★ ★★★
Current Density (mA/cm2)
Current Density (mA/cm2)
Atomic concentration of Sn in PtSn (%)
Pow
er D
ensi
ty (
mW
/cm
2 )P
ower D
ensity (mW
/cm2)
(A)
(B)
(C)
Cel
l Vol
tage
(V
)
0.8
0.7
0.6
0.5
0.4
0.3
0.2
0.1
0 40 80 120 160 200
Pt1Sn1/CPt3Sn2/CPt2Sn1/CPt3Sn1/CPt4Sn1/CPt/C
★
DK9448_C010.fm Page 198 Monday, April 17, 2006 8:53 AM
© 2006 by Taylor & Francis Group, LLC
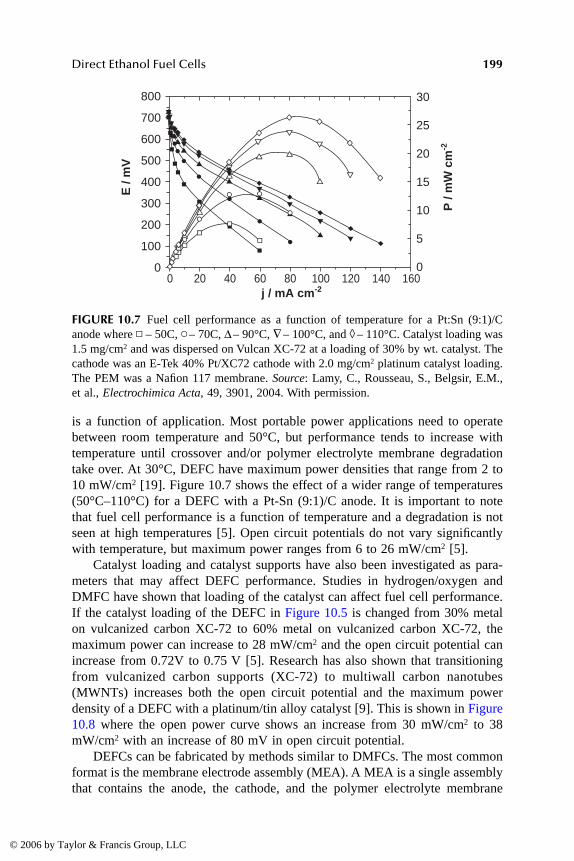
Direct Ethanol Fuel Cells
199
is a function of application. Most portable power applications need to operatebetween room temperature and 50°C, but performance tends to increase withtemperature until crossover and/or polymer electrolyte membrane degradationtake over. At 30°C, DEFC have maximum power densities that range from 2 to10 mW/cm
2
[19]. Figure 10.7 shows the effect of a wider range of temperatures(50°C–110°C) for a DEFC with a Pt-Sn (9:1)/C anode. It is important to notethat fuel cell performance is a function of temperature and a degradation is notseen at high temperatures [5]. Open circuit potentials do not vary significantlywith temperature, but maximum power ranges from 6 to 26 mW/cm
2
[5]. Catalyst loading and catalyst supports have also been investigated as para-
meters that may affect DEFC performance. Studies in hydrogen/oxygen andDMFC have shown that loading of the catalyst can affect fuel cell performance.If the catalyst loading of the DEFC in Figure 10.5 is changed from 30% metalon vulcanized carbon XC-72 to 60% metal on vulcanized carbon XC-72, themaximum power can increase to 28 mW/cm
2
and the open circuit potential canincrease from 0.72V to 0.75 V [5]. Research has also shown that transitioningfrom vulcanized carbon supports (XC-72) to multiwall carbon nanotubes(MWNTs) increases both the open circuit potential and the maximum powerdensity of a DEFC with a platinum/tin alloy catalyst [9]. This is shown in Figure10.8 where the open power curve shows an increase from 30 mW/cm
2
to 38mW/cm
2
with an increase of 80 mV in open circuit potential. DEFCs can be fabricated by methods similar to DMFCs. The most common
format is the membrane electrode assembly (MEA). A MEA is a single assemblythat contains the anode, the cathode, and the polymer electrolyte membrane
FIGURE 10.7
Fuel cell performance as a function of temperature for a Pt:Sn (9:1)/Canode where
▫
– 50C,
�
– 70C,
∆
– 90°C,
∇
– 100°C, and
◊
– 110°C. Catalyst loading was1.5 mg/cm
2
and was dispersed on Vulcan XC-72 at a loading of 30% by wt. catalyst. Thecathode was an E-Tek 40% Pt/XC72 cathode with 2.0 mg/cm
2
platinum catalyst loading.The PEM was a Nafion 117 membrane.
Source
: Lamy, C., Rousseau, S., Belgsir, E.M.,et al.,
Electrochimica Acta
, 49, 3901, 2004. With permission.
▲
▲▼
▼
▼
▼
▼
▼
▼
▲▲
▲
▲
▲
▲
▲
▲
▲
▲
▲▲▲
▲
▲
◆◆◆
◆
◆
◆
◆
◆
◆
◆▼
▼
▼
▼
▼
▼
▼▼▼▼
▼
▼
●
●●
●
●
●●
●
●
●
●
●
●
●
■
■
■
■
■
■
■
■
■
■
■
■
■■■■
■
◆
◆
◆◆
◆
◆
◆
◆
◆◆◆◆◆
E /
mV
P /
mW
cm
-2
j / mA cm-2
800
700
600
500
400
300
200
100
0
30
25
20
15
10
5
00 20 40 60 80 100 120 140 160
DK9448_C010.fm Page 199 Monday, April 17, 2006 8:53 AM
© 2006 by Taylor & Francis Group, LLC

200
Alcoholic Fuels
in ionic contact with each other. MEAs are formed most commonly using aconventional heat pressing method, but they can also be fabricated using a decaltransfer method. The conventional method involves sandwiching the PEMbetween an anode and cathode and heat pressing the sandwich at a temperatureabove the glass transition temperature of the PEM to melt the electrodes intoionic contact with the PEM. The conventional method shows a 34% decrease inpower density over a 10-hour period and delamination of the electrodes from theNafion [20]. This is likely due to the increased swelling of Nafion in the presenceof ethanol, but the decal transfer method only shows a 15% decrease and nodelamination, along with no change in resistance [20]. Therefore, the decaltransfer method is a better method for forming DEFC MEAs. The decal transfermethod involves spray painting the catalyst layer directly onto the polymerelectrolyte membrane, instead of onto an electrode support (such as carbon paper)and then heat pressing into the polymer electrolyte membrane.
Researchers have also studied tertiary catalyst systems, but the fuel cellperformance has not been greatly affected by adding a third component to thesystem for alloys containing platinum and ruthenium with a third component oftungsten, tin, or molybdenum [15]. Tertiary catalysts with tungsten and tin didshow a measurable increase in power compared to pure Pt/Ru alloys, but bothpower densities are less than pure Pt/Sn alloys under the same operating condi-tions [15].
FIGURE 10.8
Voltage current curve for two DEFC with the same platinum/tin alloy ondifferent carbon substrates at 75°C and a concentration of 1 M ethanol. Anode and cathodeloading was 1.0 mg/cm
2
platinum. Nafion 115 was used as the polymer electrode membraneand the flow rate was 1mL/min.
Source
: Zhao, X., Li, W., Jiang, L., et al.,
Carbon
, 42,3251, 2004. With permission.
Current Density (mA/cm2)
Cel
l Vo
ltag
e (V
)
0 40 80 120 160 200
PtSn/MWNTsPtSn/XC-72
0.8
0.6
0.4
0.2
0.0
DK9448_C010.fm Page 200 Monday, April 17, 2006 8:53 AM
© 2006 by Taylor & Francis Group, LLC
Direct Ethanol Fuel Cells
201
CONCLUSIONS
Direct ethanol fuel cells are a relatively new technology for portable powergeneration. Results have concluded that electrochemical oxidation of ethanol onplatinum-based catalysts is not significantly lower than for methanol [21] and theintermediate products of ethanol oxidation are less toxic than methanol oxidation.Although catalytic performance with pure platinum catalysts is low, the perfor-mance of Pt/Sn and Pt/Ru alloys is good. Future research will focus on thedevelopment of electrocatalysts that show improved catalytic activity and lowerelectrode fouling at low and moderate temperatures (room temperature to 50°C).Research on fuel cell lifetimes will also be conducted to study the long-termeffects of continuous operation on the catalysts, electrode support, and polymerelectrolyte membranes. Improved lifetimes are an issue for both methanol andethanol, because both oxidation processes produce carbon monoxide and carbonmonoxide-like products that adsorb/passivate the catalyst and both alcohols swellthe polymer electrolyte membrane, which typically decreases the lifetime andstability of the membrane. Overall, DEFCs are a relatively new technologycompared to DMFCs, but ethanol has advantages over methanol in decreasedtoxicity and environmental issues. From a catalytic perspective, the catalytic ratesare similar between ethanol and methanol oxidation, but methanol oxidation ismore efficient (produces a larges percentage of carbon dioxide (the completeoxidation product)).
REFERENCES
1. Ren, X., Wilson, M. and Gottesfeld, S.,
J. Electrochem. Soc.
, 143, 12, 1996.2. Ren, X., Zelenay, P., Thomas, S., Davey, J. and Gottesfeld, S.,
J. Power Sources
,86, 111, 2000.
3. Thomas, S.C., Ren, X.M., Gottesfeld, S. and Zelenay, P.,
Electrochimica Acta
,47, 3741, 2002.
4. Glaebrook, W.,
J. Power Sources
, 7, 215, 1982.5. Lamy, C., Rousseau, S., Belgsir, E.M., Coutanceau, C. and Leger, J.M.,
Electro-chimica Acta
, 49, 3901, 2004.6.
Energy from Biological Processes: Technical and Policy Opinions, Office of Tech-nology Assessment, Westview Press, 1981.
7. Lamy, C., Belgsir, E.M. and Leger, J.M., J. Applied Electrochemistry, 31, 799,2001.
8. Lamy, C., Lima, A., LeRhun, V., Delime, F., Cutanceau, C. and Leger, J.M., J.Power Sources, 105, 283, 2002.
9. Zhao, X., Li, W., Jiang, L., Zhou, W., Xin, Q., Yi, B. and Sun, G., Carbon, 42,3251, 2004.
10. Gao, P., Chang, S., Zhou, Z. and Waver, M.J., J. Electroanal. Chem., 272, 161,1989.
11. Willsau, J. and Heitbaum, J., J. Electrochtroanal. Chem., 194, 27, 1985.12. Bittins-Cattaneo, B., Wilhelm, S., Cattaneo, E., Buschmann, H.W. and Vielstich,
W. Ber. Bunsenges. Phys. Chem., 92, 1210, 1988.
DK9448_C010.fm Page 201 Monday, April 17, 2006 8:53 AM
© 2006 by Taylor & Francis Group, LLC
202 Alcoholic Fuels
13. Wang, J., Wasmus, S. and Savinell, R.F., J. Electrochemical Society 142, 4218,1995.
14. Hartung, T., Ph.D. thesis, University of Witten, Germany, 1988.15. Zhou, W.J., Li, W.Z., Song, S.Q., Zhou, Z.H., Jiang, L.H., Sun, G.Q., Xin, Q.,
Poulianitis, K., Kontou, S. and Tsiakaras, P., J. Power Sources, 131, 217, 2004.16. Gurau, B., Viswanathan, R., Liu, R. and Lafrenz, T.J., J. Phys. Chem. B, 102,
9997, 1998.17. Jiang, L., Zhou, Z., Li, W., Zhou, W., Song, S., Li, H., Sun, G. and Xin, Q., Energy
and Fuels, 18, 866, 2004.18. Zhou, W.J., Song, S.Q., Li, W.Z., Zhou, Z.H., Sun, G.Q., Xin, Q., Douvartzides,
S. and Tsiadkaras, P., J. Power Sources, 140, 50, 2005.19. Jiang, L., Zhou, Z., Wang, S., Liu, J., Zhao, X., Sun, G., Xin, Q. and Zhou, B.,
Preprints of the American Chemical Society Division of Fuel Chemistry 49, 668,2004.
20. Song, S., Wang, G., Zhou, W., Zhao, X., Sun, G., Xin, Q., Kontou, S., andTsiakaras, P., J. Power Sources, 140, 103, 2005.
21. Arico, A.S., Creti, P.L. and Antonucci, P.L., Electrochemical and Solid-StateLetters, 1, 66, 1998.
DK9448_C010.fm Page 202 Monday, April 17, 2006 8:53 AM
© 2006 by Taylor & Francis Group, LLC
203
11
Solid-Oxide Fuel Cells Operating with Direct-Alcohol and Hydrocarbon Fuels
Fatih Dogan
Department of Materials Science and Engineering University of Missouri-Rolla
CONTENTS
Introduction .......................................................................................................204Fuels for Solid-Oxide Fuel Cells......................................................................205Single-Chamber Solid-Oxide Fuel Cells and Hydrocarbon Fuels...................209Summary ...........................................................................................................211References .........................................................................................................212
Abstract
This chapter addresses utilization of alcohol and other hydrocarbon-based fuels to generate electricity in solid-oxide fuel cells (SOFCs). One of thekey advantages of SOFC is that both external as well internal fuel reforming ispossible to operate the fuel cell under stable conditions. While alcohol fuels canbe obtained sulfur-free and in high purity, hydrocarbon fuels have higher energydensity and existing infrastructure of production and distribution. Developmentof more energy-efficient and chemically stable electrode materials is necessaryfor SOFC operating at high (800–1000ºC) and intermediate (500–800ºC) tem-peratures. Significant progress has been made in recent years in the developmentof carbon monoxide-tolerant fuel electrodes (anodes) to prevent carbon depositionon the catalyst that results in a reduced performance of the fuel cell. Developmentof fuel electrodes compatible with alcohol and hydrocarbon fuels will lead tomore efficient and widespread applications of SOFCs in double-chamber andsingle-chamber modes.
DK9448_C011.fm Page 203 Tuesday, March 28, 2006 3:46 PM
© 2006 by Taylor & Francis Group, LLC

204
Alcoholic Fuels
INTRODUCTION
Fuel cells are viewed as environmentally compatible and efficient energy conver-sion systems. A fuel cell works much like a battery with external fuel supplies.Chemical fuels are electrochemically converted into electricity at high efficiencieswithout producing significant amount of pollutants such as nitrogen oxides ascompared to combustion engines. Hydrogen is the ideal fuel since it reacts withoxygen in the air to produce water and an electric current, but hydrogen isexpensive and difficult to store. Until the hydrogen economy is well established,other fuels can be used indirectly with an external reformer or directly to operatefuel cells. Hydrogen is stored naturally in alcohols (e.g., ethanol and methanol)or hydrocarbons such as propane and methane, which are available to producecleaner power if the electrochemical processes of hydrocarbon oxidation reactionsare well understood.
Among various fuel cells, solid oxide fuel cells (SOFCs) and molten car-bonate fuel cells can be operated using hydrogen as well as carbon monoxide.Particularly, SOFC is viewed as the most flexible fuel cell system that can operateusing various fuel gases directly supplied to the fuel electrodes [1–3]. Removalof CO from H
2
fuel is essential for polymer electrolyte membrane fuel cells,which are generally considered to be the most viable approach for mobileapplications.
The application of high and intermediate temperature SOFCs range fromsmall-scale domestic heat and power to large-scale distributed power generation.SOFCs offer high efficiencies up to 60–70% in individual systems and up to 80%in hybrid systems by extracting the energy present in the high-temperature exhaustgases, e.g., by using gas or steam turbines [4]. High-temperature SOFC applica-tions include multimegawatt-scale centralized power generation, distributedpower generation up to 1 MW and combined heat/power (CHP) plants in the100-kW to 1-MW range. Potential areas of application for intermediate SOFCsare in the transport sector (up to 50 kW), military and aerospace (5 to 50 kW),domestic CHP (up to 10 kW) and miniaturized fuel cells “palm-power” in the10-W range.
In SOFC, the electrolyte is typically a dense yttria-stabilized zirconia(YSZ), which is an ionic conductor blocking electron transport as shown inFigure 11.1. The electrolyte allows the transport of oxygen ions via the oxygenvacancies from the interface at the air electrode (cathode) to the interface withthe fuel electrode (anode). The cathode is typically composed of a porouslanthanum strontium manganese oxide with YSZ and facilitates the reaction forthe reduction of oxygen gas to oxygen ions at the electrode/electrolyte interface.The anode material is typically a porous Ni-YSZ composite allowing the oxi-dation of the fuel and transport of the electrons from the electrolyte/electrodeinterface to the interconnect of the fuel cell stack. The interconnect material istypically lanthanum strontium chromite for high-temperature operation whilecorrosion-resistant metallic alloys are employed in the development of SOFCsoperating at intermediate temperatures. The role of the interconnect is to transfer
DK9448_C011.fm Page 204 Tuesday, March 28, 2006 3:46 PM
© 2006 by Taylor & Francis Group, LLC

SOFCs Operating with Direct-Alcohol and Hydrocarbon Fuels
205
the electrons between the individual cells in the stack and to prevent mixingof fuel and oxidant gases [5].
A diverse range of fuels can be used in SOFCs since the internal temperatureis high enough to initiate fuel conversion reactions. Hence, SOFCs have anefficiency advantage over polymer electrolyte membrane fuel cells when alcoholor hydrocarbon fuels are to be used, even though direct-methanol fuel cells withpolymer electrolyte membranes are widely studied. The use of these fuels inSOFCs without preprocessing, however, requires further advances in developmentof appropriate electrode materials toward preventing unwanted reactions such ascarbon formation on the anode, which significantly affects the performance ofthe fuel cell.
FUELS FOR SOLID-OXIDE FUEL CELLS
Until the hydrogen economy is well established, it is more sensible to generateelectricity directly from alcohols or hydrocarbons. SOFCs may become veryattractive for portable, transportation, and stationary applications if alcohols andhydrocarbons can be utilized directly without applying any fuel pretreatments.The main advantage of liquid hydrocarbons is their relatively higher energy
FIGURE 11.1
The microstructure of a typical SOFC and the electrochemical reactionsoccurring at the interface between the electrodes and electrolyte. Reprinted with permissionfrom [5]. Nature Publishing Group.
DK9448_C011.fm Page 205 Tuesday, March 28, 2006 3:46 PM
© 2006 by Taylor & Francis Group, LLC

206
Alcoholic Fuels
density compared to alcohols. However, most hydrocarbon fuels such as naturalgas, bioderived gases, diesel, and gasoline contain impurities such as hydrogensulfide and halogens, which may lead to poisoning of the SOFC electrode mate-rials. Particularly, sulfur content in such fuels should be reduced through pre-treatments to prevent the fuel cell electrodes from poisoning. Alternatively,progress is being made toward development of sulfur-resistant electrode materialsfor long-lasting operation of SOFCs using hydrocarbon fuels, which generallycontain sulfide compounds in relatively high concentrations. For instance, a highlysulfur-tolerant anode composed of Cu, CeO
2
, and YSZ was developed to operatea SOFC using hydrogen with H
2
S levels up to 450 ppm at 1073 K [6]. Anotherstudy based on La
x
Sr
1–x
VO
3–
as anode material for SOFC showed a maximumpower density of 135 mW/cm
2
at 280 mA/cm
2
when the fuel was a 5% H
2
S–95%H
2
mixture at 1273K [7].The advantage of liquid oxygenated hydrocarbons, such as alcohols, in com-
parison to gasoline is that they are cleaner (low sulfur content) and can be derivedfrom agricultural by-products and biomass as a renewable energy source. Alcoholis an ideal fuel for the fuel cells because of ease of transportation, storage, andhandling, as well as their high energy density. Partially oxidized (hydrated) fuelsmay be easily reformed, such as alcohols, as they contain oxygen, in a liquidform. Since water is often used for internal reforming of the fuel, water solubilityof alcohols (especially methanol, ethanol, and propanol) offers the advantage thatadditional fuel processing may not be necessary for operation of the fuel cell.
An anode-supported SOFC utilizing direct alcohol was reported by Jiang andVirkar [8]. A thin-film YSZ electrolyte was deposited on a Ni–YSZ anode witha composite of Sr-doped LaMnO
3
and YSZ as a cathode. Pure methanol and anequivolume mixture of ethanol and water were used as fuels to operate the cellsover a range of temperatures. Power densities achieved with ethanol and watermixtures were between 0.3 W/cm
2
at 650ºC and 0.8 W/cm
2
at 800ºC, and withmethanol between 0.6 W/cm
2
at 650ºC and 1.3 W/cm
2
at 800ºC as shown inFigures 11.2 and 11.3. Carbon deposition on the electrodes was not observedwhen methanol was used as fuel. On the other hand, maximum power densityusing humidified H
2
was 1.7 W/cm
2
at 800ºC. This indicates that a lack of H
2
inthe fuel may substantially increase concentration polarization thus limiting theperformance of the cell.
Another study on direct-alcohol SOFCs reported a comparison of methanol,ethanol, propanol, and butanol as fuel sources [9]. With an increasing carbonnumber of the alcohol, a decrease in cell voltage was observed, which wasattributed to slower decomposition and/or reforming kinetics of alcohols.Decreasing operational temperatures led to an increase of unreacted alcohols,aldehydes, and aromatic compounds. Thermochemical calculations were used toreveal the equilibrium amounts of reaction products of fuels during fuel celloperation [10,11]. Figure 11.4 shows the limit lines of carbon deposition as afunction of temperature in the C–H–O diagram. No carbon deposition is expectedif the carbon-to-oxygen ratio is less than unity. It is shown that the addition of
DK9448_C011.fm Page 206 Tuesday, March 28, 2006 3:46 PM
© 2006 by Taylor & Francis Group, LLC

SOFCs Operating with Direct-Alcohol and Hydrocarbon Fuels
207
H
2
O, O
2
and/or CO
2
is necessary to prevent the carbon deposition since thepositions of various fuels are within the deposition region.
FIGURE 11.2
Cell performance at 800°C with methanol, ethanol, and hydrogen as fuels.Flow rate for hydrogen was 100 mL/min. Methanol used was undiluted. Ethanol used wasan equivolume solution of ethanol and water. The flow rates for liquid fuels were 0.2mL/min for both.
Source
: Jiang, Y. and Virkar, A., High Performance, Anode-SupportedSolid Oxide Fuel Cell Operating on Hydrogen Sulfide (H
2
S) and Sulfur-Containing Fuels,
J. Power Sources
, 2004. With permission. Copyright [2001], The Electrochemical Society.
FIGURE 11.3
Cell performance with methanol as a fuel at various temperatures. The flowrate was 0.2 mL/min.
Source
: Jiang, Y. and Virkar, A., High Performance, Anode-SupportedSolid Oxide Fuel Cell Operating on Hydrogen Sulfide (H
2
S) and Sulfur-Containing Fuels,
J. Power Sources
, 2004. With permission. Copyright [2001], The Electrochemical Society.
▲
▲▲▲
▲
▲▲
▲
▲
▲
▲
▲▲
▲▲▲
▲
●
●
●
●
●
●●
●●
●
●●●●
▲■
■
■
■
■■
■
■
■
■
■
■
■
■
■■
■ ■ ■■
■
■
■
■■
■■
■
■■
■■
■■
■■
■■
■■■■
●
●
●●●
●●
●
●
●●
●
●●●●
▲
▲▲
▲▲
▲▲
▲▲
▲
Current Density (A/cm2)
Power D
ensity (W/cm
2)V
olta
ge (
V)
1.0
0.8
0.6
0.4
0.2
0.0
2.0
1.5
1.0
0.5
0.00.0 0.5 1.51.0 2.0 2.5 3.53.0 4.54.0
800°C
.138 ohm.cm2
H2CH3OHC2H3OH/H2O (1:1)
●●●
●
●●
●
●
●
●
●
●●
●●●●
●●
●●
▲
▲
▲
▲
▲
▲
▲
▲▲▲▲
▲
▲▲
▲▲▲▲
▲▲
▲
▲▲
▲▲
▲▲
▲
▲ ■
■
■
■■
■■
■■
■■
■■
■■
■
■
■■■
■
■
■■■
■
■
■
■
Current Density (A/cm2)
CH3OH
.16 ohm.cm2
800 °C650550
Power D
ensity (W/cm
2)V
olta
ge (
V)
1.0
0.8
0.6
0.4
0.2
0.0
1.4
1.2
1.0
0.8
0.6
0.4
0.2
0.00.0 0.5 1.0 1.5 2.0 2.5 3.0 3.5
DK9448_C011.fm Page 207 Tuesday, March 28, 2006 3:46 PM
© 2006 by Taylor & Francis Group, LLC

208
Alcoholic Fuels
Further development of electrode materials that do not require introductionof water, will lead to better performance of the SOFCs, provided carbon deposi-tion can be suppressed. Recent studies showed that coking issues can be resolvedthrough selection of appropriate catalysts and anode materials in fuel cell devel-opment [4,5]. Because nickel is an excellent catalyst for hydrocarbon cracking,Ni/ZrO
2
cermets are used as anode materials for YSZ-based SOFCs. As mentionedearlier, these cermets can only be used in hydrocarbon or alcohol fuels if excesswater is present to ensure complete fuel reforming. Mixing
iso
-octane with water,alcohol, and surfactant to produce an oil in water microemulsion was successfulin reducing the carbon formation significantly, while retaining a high octanenumber [12]. It has been shown that the problem of carbon deposition may beavoided by using a copper–ceria anode [13] or applying an yttria–ceria interfacebetween YSZ and Ni–YSZ cermet anode [3]. A nickel-free SOFC anode,La
0.75
Sr
0.25
Cr
0.5
Mn
0.5
O
3
with comparable electrochemical performance to Ni/YSZcermets was developed for methane oxidation without using excess steam [5]. Arecent study showed that a Ru–CeO
2
catalyst layer with a conventional anodeallows internal reforming of
iso
-octane without cocking and yields stable powerdensities of 0.3 to 0.6 W/cm
2
in a SOFC design operating at intermediate tem-peratures [14].
FIGURE 11.4
Carbon deposition limit lines for various fuels and temperatures in theC–H–O diagram. Reprinted with permission from [11]. Copyright [2003], The Electro-chemical Society.
Source
: Sasaki, K. and Teraoka, Y.,
J. Electrochem. Soc.
, 150(7), 2003.With permission.
●
●●
▼
■◆▲
▼
▲
◆
■●
●●
C
H O
CH4
CH4
CnH2n CO2
CO
C2H4C2H4CH3OHC2H3OH
C3H7OH
H2O
1000°C800°C600°C400°C200°C100°C
1000°C
800°C
600°C
100°C
H2O
Carbondeposition
region
0 100
80
60
40
20
20
40
60
80
01000 20 40 60 80 100
DK9448_C011.fm Page 208 Tuesday, March 28, 2006 3:46 PM
© 2006 by Taylor & Francis Group, LLC

SOFCs Operating with Direct-Alcohol and Hydrocarbon Fuels
209
SINGLE-CHAMBER SOLID-OXIDE FUEL CELLS AND HYDROCARBON FUELS
A single-chamber solid-oxide fuel cell (SC-SOFC), which operates using a mix-ture of fuel and oxidant gases, provides several advantages over the conventionaldouble-chamber SOFC, such as simplified cell structure (no sealing required) anddirect use of hydrocarbon fuel [15,16]. Figure 11.5 shows a schematic diagramof SC–SOFC operation. The oxygen activity at the electrodes of the SC–SOFCis not fixed and one electrode (anode) has a higher electrocatalytic activity forthe oxidation of the fuel than the other (cathode). Oxidation reactions of ahydrocarbon fuel can be represented with a simplified multistep, quasi-generalmechanism as follows:
C
n
H
m
+ (n/2)O
2
�
nCO + (m/2)H
2
(11.1)
H
2
+ O
2–
�
H
2
O + 2e
–
(11.2)
CO + O
2–
�
CO
2
+ 2e
–
(11.3)
On the other hand, the cathode has a higher electrocatalytic activity for thereduction of oxygen according to the reaction:
1/2O
2
+ 2e
–
�
O
2–
(11.4)
These reactions lead to a low oxygen partial pressure at the anode locally,while the oxygen partial pressure at the cathode remains relatively high. As a
FIGURE 11.5
Schematic diagram of a single-chamber solid-oxide fuel cell operating witha mixture of fuel and air.
Furnace thermocouple
Fuel - air mixture
Sample thermocouplePt mesh and wire (anode)
Au mesh and wire
cathode
electrolyte
anode
DK9448_C011.fm Page 209 Tuesday, March 28, 2006 3:46 PM
© 2006 by Taylor & Francis Group, LLC
210
Alcoholic Fuels
result, an electromotive force (emf) between two electrodes is generated with amixed fuel and air mixture. Due to the presence of oxygen at the anode, SC–SOFCis not affected by the problems associated with carbon deposition, which is asignificant drawback for double-chamber SOFCs when Ni–cermet is used asanode material.
The fuel/air mixtures for SC–SOFC were generally chosen to be richer thanthe upper explosion limits, yet they were fuel-lean enough to prevent the carbondeposition, which has been a significant problem in double-chamber SOFCs [17].However, variations in the ratios of the local fuel-air mixture were also dependenton catalytic activity and test conditions that affect the performance of the fuelcell [15]. An ideal SC–SOFC has the same open circuit voltage (OCV) and I-Voutput as a double-chamber cell, given a uniform oxygen partial pressure. Thedifference in catalytic properties of the electrodes must be sufficient to cause asignificant difference in oxygen partial pressure between the anode and thecathode. For the ideal SC–SOFC, one electrode would be reversible towardoxygen adsorption and inert to fuel, while the other electrode would be reversibletoward fuel adsorption and completely inert to oxygen [18]. If the electrodematerials are not sufficiently selective, a parasitic reaction creates mixed poten-tials at the electrodes, which reduces the efficiency of the cell. Compared totraditional double-chamber fuel cells, parasitic reactions in a single-chamber fuelcell have historically reduced the OCV by about half. This is analogous to a leakthat allows the fuel to seep into the oxidizer side of a double-chamber fuel cell[19]. Advances in electrode catalyst materials for SC–SOFC may lead to a similarperformance as a conventional double-chamber SOFC with a substantial reductionin complexity and cost of the fuel cell.
Significant improvement in the performance of single-chamber solid-oxidefuel cells has been achieved in recent years [15, 20–22]. Since SC–SOFC doesnot require high-temperature sealing materials to prevent the mixing of fuel gasand oxygen at operation temperatures, it offers a robust and more reliable alter-native to double-chamber SOFC for special applications. As further advances aremade toward controlling the catalytic activity of electrode materials, electrolyteresistance particularly at lower operating temperatures, optimizing of the gas flowrate and the cell configuration, SC–SOFCs may find widespread implementationas compact power sources in the future.
Several recent studies on the development of SC–SOFCs have been conductedin our laboratory to improve their performance and understand complex electrodereactions [20,23–26]. Initial experiments were carried out using fuel cells pre-pared by deposition of YSZ thin-film electrolytes (1-2 µm thickness) on theNiO–YSZ anode as a substrate with (La,Sr)(Co,Fe)O
3
(LSCF) as the cathode(Figure 11.6). A power density of 0.12 W cm
–2
was obtained at an OCV of >0.8V using a methane-air gas mixture as a fuel [23].
In another study, the effect of mixed gas
flow rates on the performance ofSC–SOFCs has been investigated
using a cell that consists of a 18-µm thick
YSZporous electrolyte on a NiO–YSZ anode substrate with a
(La, Sr)(Co, Fe)O
3
cathode. Higher gas flow rates led to an increase of cell temperature due to
DK9448_C011.fm Page 210 Tuesday, March 28, 2006 3:46 PM
© 2006 by Taylor & Francis Group, LLC

SOFCs Operating with Direct-Alcohol and Hydrocarbon Fuels
211
increasing methane reaction rate, which resulted in improved cell performance.Figure 11.7 shows that optimization of gas flow rate (linear velocity) lead to adecrease of the operating temperature effectively and increased cell performanceas well as fuel efficiency. At a cell temperature of 744°C (furnace temperature:606°C), an OCV of ~0.78 V and a maximum power density of ~660 mW cm
–2
(0.44 V) were obtained. The results indicated that a porous ion-conducting mem-brane provides sufficient separation of oxygen activity at the electrodes by selec-tion of an optimum operation temperature and a gas flow rate. Thus, it appearsthat SC–SOFCs with porous electrolyte provide opportunities to design thermallyand mechanically more robust stacks by utilizing hydrocarbon fuels. It also allowsfabrication of the cells at lower temperatures using conventional processing tech-niques
such as screen printing, since densification of the electrolyte at highsintering temperatures is not required.
SUMMARY
Solid oxide fuel cells are very promising energy conversion systems that cangenerate electricity at high efficiencies using not only hydrogen but also alcoholand hydrocarbon fuels. Further progress on the development of fuel cell materials,particularly the electrodes, which prevents carbon deposition and sulfur-resis-tance, will play a key role to achieve a stable operation of direct-alcohol SOFCswith high power densities. In contrast to double-chamber SOFCs, the single-chamber solid-oxide fuel cells offer a simple design that are not affected by thechallenges of high temperature sealing and may be a cost-effective alternative
FIGURE 11.6
Microstructural development of a fuel cell with a dense YSZ electrolyte(1–2
µ
m thick) prepared by a low-temperature processing method (annealed at 950°C).
Source
: Suzuki, T., Jasinski, P., Anderson, H., et al.,
J. Electrochem. Soc.
, 151(9), 2004.With permission.
Cathode
Electrolyte
Ni-YSZ substrate
8μm 5000X
DK9448_C011.fm Page 211 Tuesday, March 28, 2006 3:46 PM
© 2006 by Taylor & Francis Group, LLC
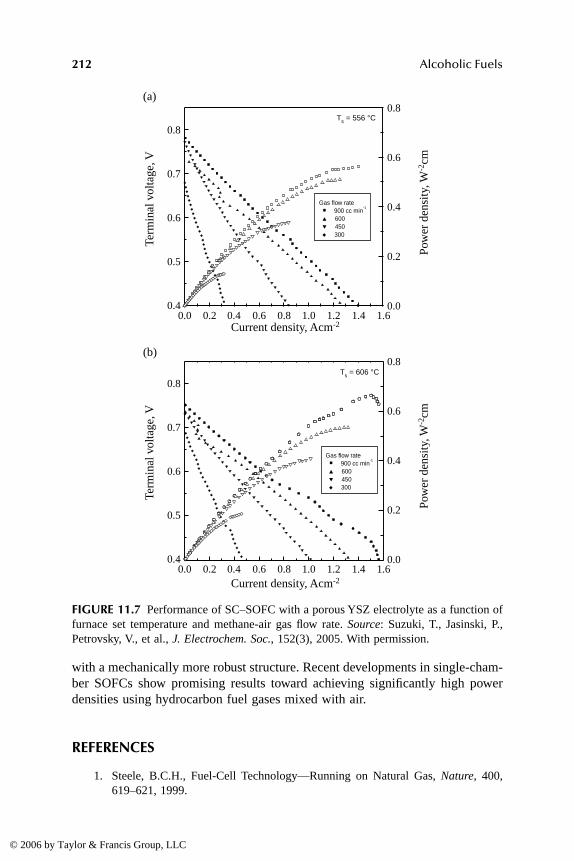
212
Alcoholic Fuels
with a mechanically more robust structure. Recent developments in single-cham-ber SOFCs show promising results toward achieving significantly high powerdensities using hydrocarbon fuel gases mixed with air.
REFERENCES
1. Steele, B.C.H., Fuel-Cell Technology—Running on Natural Gas,
Nature
, 400,619–621, 1999.
FIGURE 11.7
Performance of SC–SOFC with a porous YSZ electrolyte as a function offurnace set temperature and methane-air gas flow rate.
Source
: Suzuki, T., Jasinski, P.,Petrovsky, V., et al.,
J. Electrochem. Soc.
, 152(3), 2005. With permission.
(a)
(b)
Current density, Acm-2
Current density, Acm-2
Pow
er d
ensi
ty, W
-2cm
Term
inal
vol
tage
, V
0.0 0.2 0.4 0.6 0.8 1.0 1.2 1.4 1.6
0.8
0.7
0.6
0.5
0.4
0.8
0.6
0.4
0.2
0.0
Pow
er d
ensi
ty, W
-2cm
Term
inal
vol
tage
, V
0.0 0.2 0.4 0.6 0.8 1.0 1.2 1.4 1.6
0.8
0.7
0.6
0.5
0.4
0.8
0.6
0.4
0.2
0.0
Gas flow rate ■ 900 cc min
-1
▲ 600 ▼ 450 ◆ 300
Gas flow rate ■ 900 cc min
-1
▲ 600 ▼ 450 ◆ 300
Ts = 556 °C
Ts = 606 °C
DK9448_C011.fm Page 212 Tuesday, March 28, 2006 3:46 PM
© 2006 by Taylor & Francis Group, LLC
SOFCs Operating with Direct-Alcohol and Hydrocarbon Fuels
213
2. Putna, E.S., Stubenrauch, J., Vohs, J.M. and Gorte, R.J., Ceria-Based Anodes forthe Direct Oxidation of Methane in Solid Oxide Fuel Cells,
Langmuir
, 11 (12),4832–4837, 1995.
3. Murray, E.P., Tsai, T. and Barnett, S.A., A Direct-Methane Fuel Cell with a Ceria-Based Anode,
Nature
, 400, 649–651, 1999.4. Song, C., Fuel Processing for Low-Temperature and High-Temperature Fuel Cells:
Challenges, and Opportunities for Sustainable Development in the 21st Century,
Catalysis Today
, 77, 17–49, 2002.5. Atkinson, A., Barnett, S., Gorte, R.J., Irvine, J.T.S., McEvoy, A.J., Mogensen, M.,
Singhal, S.C. and Vohs, J., Advanced Anodes for High-Temperature Fuel Cells,
Nature Materials
, 3, 17–27, 2004.6. He, H.P., Gorte, R.J. and Vohs, J.M., Highly Sulfur Tolerant Cu-Ceria Anodes for
SOFCs,
Electrochem. Solid State Lett.
, 8 (6), A279, A280, 2005.7. Aguilar, L., Zha, S.W., Cheng Z., Winnick, J. and Liu, M.L., A Solid Oxide Fuel
Cell Operating on Hydrogen Sulfide (H
2
S) and Sulfur-Containing Fuels,
J. PowerSources
, 135 (1-2), 17–24, 2004.8. Jiang, Y. and Virkar, V.A., High Performance, Anode-Supported Solid Oxide Fuel
Cell Operating on Direct Alcohol,
J. Electrochem. Soc.
, 148 (7), A706–A709,2001.
9. Sasaki, K., Watanabe, K. and Teraoka, Y., Direct-Alcohol SOFCs: Current-VoltageCharacteristics and Fuel Gas Compositions,
J. Electrochem. Soc.
, 151 (7),A965–A970.
10. Sasaki, K. and Teraoka, Y., Equilibria in Fuel Cell Gases—I. Equilibrium Com-positions and Reforming Conditions,
J. Electrochem. Soc.
, 150 (7), A878–A884,2003.
11. Sasaki, K. and Teraoka, Y., Equilibria in Fuel Cell Gases—II. The C-H-O TernaryDiagrams,
J. Electrochem. Soc.
, 150 (7), A885–A888, 2003.12. Saunders, G. J., Preece, J. and Kendall, K., Formulating Liquid Hydrocarbon Fuels
for SOFCs,
J. Power Sources
, 131, 23–26, 2004.13. Park, S., Vohs, J.M. and Gorte, R.J., Direct Oxidation of Hydrocarbons in a Solid-
Oxide Fuel Cell,
Nature
, 404, 265–267, 2000.14. Zhan, Z. and Barnett, S.A., An Octane-Fueled Solid Oxide Fuel Cell, 308,
844–847, 2005.15. Hibino, T., Hashimoto, A., Inoue, T., Tokuno, S. and Sano, M.A., Low-Operating-
Temperature Solid Oxide Fuel Cell in Hydrocarbon-Air Mixtures,
Science
, 288,2031–2033, 2000.
16. Hibino, T., Hashimoto, A., Yano, M., Suzuki, M., Yoshida, S. and Sano, M.A.,Solid Oxide Fuel Cell Using an Exothermic Reaction as the Heat Source,
J.Electrochem. Soc.
, 148, A544–A549, 2001.17. Steele, B.C.H., Survey of Materials Selection for Ceramic Fuel Cells II. Cathodes
and Anodes,
Solid State Ionics
, 1223, 86–88, 1996.18. Riess, I., Vanderput, P.J. and Schoonman, J., Solid Oxide Fuel Cells Operating
on Uniform Mixtures of Fuel and Air,
Solid State Ionics
, 82, 1–4, 1995.19. Priestnall, M., Kotzeva, V., Fish, D. and Nilsson, E., Compact Mixed Reactant
Fuel Cells,
J. Power Sources
, 106, 21–30, 2002.20. Suzuki, T., Jasinski, P., Petrovsky, V., Anderson, H. and Dogan, F., Performance
of a Porous Electrolyte in Single-Chamber SOFCs, J. Electrochem. Soc., 152 (3),A527–A531, 2005.
DK9448_C011.fm Page 213 Tuesday, March 28, 2006 3:46 PM
© 2006 by Taylor & Francis Group, LLC
214 Alcoholic Fuels
21. Shao, Z.P., Haile, S.M., Ahn, J., Ronney, P.D., Zhan, Z.L. and Barnett, S.A., AThermally Self-Sustained Micro Solid-Oxide Fuel-Cell Stack with High PowerDensity, Nature, 435, 795–798, 2005.
22. Stefan, I.C., Jacobson, C.P., Visco, S.J. and De Jonghe, L.C., Single Chamber FuelCells: Flow, Geometry, Rate, and Composition Considerations, Electrochem.Solid-State Lett., 7, A198–A200, 2004.
23. Suzuki, T., Jasinski, P., Petrovsky, V., Anderson, H. and Dogan, F., Anode Sup-ported Single Chamber Solid Oxide Fuel Cell in CH4-Air Mixture, J. Electrochem.Soc., 151 (9), A1473–A1476, 2004.
24. Suzuki, T., Jasinski, P., Anderson, H. and Dogan, F., Single Chamber ElectrolyteSupported SOFC Module, Electrochem. Solid-State Lett., 7 (11), A391–A393,2004.
25. Jasinski, P., Suzuki, T., Dogan, F. and Anderson, H., Impedance Spectroscopy ofSingle Chamber SOFC, Solid State Ionics, 175 (1–4), 35–38, 2004.
26. Suzuki, T., Jasinski, P., Anderson, H. and Dogan, F., Role of Composite Cathodesin Single Chamber SOFC, J. Electrochem. Soc., 151 (10), A1678–A1682, 2004.
DK9448_C011.fm Page 214 Tuesday, March 28, 2006 3:46 PM
© 2006 by Taylor & Francis Group, LLC

215
12
Alcohol-Based Biofuel Cells
Sabina Topcagic, Becky L. Treu, and Shelley D. Minteer
Department of Chemistry, Saint Louis University, Missouri
CONTENTS
Introduction .......................................................................................................216Portable Electrical Energy Sources ..................................................................216
Batteries.................................................................................................216Fuel Cells ..............................................................................................217Biofuel Cells .........................................................................................218
Enzyme Immobilization Techniques.................................................................220Wired Technique ...................................................................................221Sandwich Technique .............................................................................222Entrapment Technique ..........................................................................222Nafion® Modification ...........................................................................223NAD+-Dependent Alcohol Dehydrogenase Biofuel Cells...................225PQQ-Dependent Alcohol Dehydrogenase Biofuel Cells......................226Membraneless Biofuel Cells.................................................................227
Conclusions .......................................................................................................229References .........................................................................................................230
Abstract
There are three types of batteries: primary, secondary, and fuel cells.A fuel cell is an electrochemical device that converts chemical energy intoelectrical energy via catalysts. Fuel cells have many advantages over the twoother types of batteries due to the fact they can be regenerated with the additionof fuel specific to the system. Traditional fuel cells employ heavy metal orprecious metal catalysts, whereas biofuel cells employ biological catalysts(enzymes). Enzymes are highly specific catalysts, so they allow for the simplifi-cation of the fuel cell by eliminating the need for a polymer electrolyte membrane,which is one of the mostly costly parts of a fuel cell. Dehydrogenase enzymeshave been employed at the anode of biofuel cells to oxidize alcohols. Methanol,ethanol, propanol, and butanol are examples of alcohols that can be used in biofuel
DK9448_C012.fm Page 215 Wednesday, March 29, 2006 7:09 AM
© 2006 by Taylor & Francis Group, LLC

216
Alcoholic Fuels
cells. Long-term goals include investigating a variety of power applications forthis technology ranging from portable electronics to sensors.
INTRODUCTION
Previous chapters of this book detail methods for producing ethanol from agri-cultural products and biomass. Although many of these methods are efficient, itis crucial to be able to efficiently convert energy to electrical power. As detailedin an earlier chapter, researchers have been attempting to develop direct ethanolfuel cells (DEFCs), but there have been problems because traditional preciousmetal catalysts (Pt-based catalysts) are unable to efficiently catalyze the oxidationethanol and maintain an electrode with minimal fouling at low temperatures.However, living organisms are capable of efficiently catalyzing the oxidation ofethanol at 20–40
°
C. Living organisms, such as
Pseudomonas aeruginosa
[1],acetobacter [2], and gluconobacter [3], contain enzymes that can oxidize a varietyof alcohols, including ethanol. Over the last 40 years, researchers have beenworking on employing living organisms and/or their enzymes in a fuel cell toconvert chemical energy to electrical energy. This type of battery or fuel cell isreferred to as a biofuel cell. The early research was plagued with enzyme stabilityproblems and low power densities, but those issues are being overcome withcurrent research. In this chapter, we will discuss the brief history, techniques, andapplications of alcohol-based biofuel cells.
PORTABLE ELECTRICAL ENERGY SOURCES
B
ATTERIES
Batteries are usually categorized as primary batteries, secondary batteries, or fuelcells [4]. Primary batteries cannot be recharged, because they have irreversibleelectrochemistry. They are single use and disposable. Examples of a primarybattery include alkaline batteries (such as silver oxide/zinc, mercury oxide/zinc,and manganese oxide/zinc) [5].
Secondary batteries experience reversible elec-trochemistry, so they are reusable and can be recharged by an external powersupply after the operating voltage has dropped to zero. Examples of a secondarybattery include nickel-cadmium, nickel-metal-hydride, and lithium-ion batteries.Problems associated with secondary batteries are that they undergo hysteresis,which prohibits them from being recharged to their original state once used [4].Unlike secondary batteries, fuel cells do not undergo hysteresis. A fuel cell is anelectrochemical device that generates power upon fuel addition; therefore, it isnot of single use nor does it need to be recharged by an external power source,but only by the addition of more fuel.
A battery is a portable, self-contained electrochemical power source thatconsists of one or more voltaic cells [5]. Single voltaic cells consist of twoelectrodes (an anode and a cathode) and at least one electrolyte. In all electro-chemical power sources, electrodes are used to donate and accept electrons in
DK9448_C012.fm Page 216 Wednesday, March 29, 2006 7:09 AM
© 2006 by Taylor & Francis Group, LLC

Alcohol-Based Biofuel Cells
217
order to generate power. Oxidation of fuel occurs at the anode electrode, whilereduction occurs at the cathode electrode. Traditional electrode materials utilizedin batteries are metal-based, such as platinum, nickel, lead, and lithium. Employ-ment of these catalysts is limited due to the fact that they are nonrenewableresources and highly expensive. In addition, precious metal catalysts whenemployed at electrodes will oxidize a variety of fuels (hydrogen gas, methane,and alcohols: methanol, ethanol, propanol, butanol, other alkyl alcohols) andtherefore they are nonselective catalysts.
Due to the nonspecificity of the catalysts, a salt bridge must be employed toseparate the anode and cathode compartments in order to increase the operatingvoltage of the electrochemical cell by separating anodic fuel from cross-reactingat the cathodic electrode. Theoretically, if selective catalysts were utilized at bothelectrodes, the polymer electrolyte membrane that acts as a salt bridge in a typicalcell can be eliminated from the system. This can result in simplifying the elec-trochemical power system as well as the manufacturing procedure, which willresult in lower production costs. Elimination of resistance that is associated withthe polymer electrolyte membrane results in an increase in ion conductivity thatresults in higher power density outputs.
F
UEL
C
ELLS
In 1839, William Grove demonstrated the first fuel cell, which employed a verysimple and basic system where generation of electricity was accomplished bysupplying hydrogen and oxygen to two separate electrodes that were immersedin sulfuric acid [6]. A schematic of a hydrogen/oxygen fuel cell is shown in Figure12.1. In a fuel cell, the respective fuel is oxidized at the anode producing anddischarging electrons to an external circuit, which transfers them to the cathodewhere they are utilized along with discharged proton to reduce oxygen to water.Fuel cells (like batteries) consist of two electrodes and at least one electrolyte;but unlike batteries, their lifetime is much longer due to the fact they are easilyrecharged by the addition of more fuel to the anode chamber.
Batteries store energy, so they eventually expire, whereas a fuel cell is anenergy conversion device that will produce power as long as fuel is supplied.Fuel cells were first developed for use in space vessels due to the demand forhigher-power density and long-term power supply, which could not be deliveredby traditional batteries [7]. Electrical power in outer space was required foroperation of scientific data collection and transmission instrumentation to transmitinformation back to earth. The average battery has a lifetime up to 30 hours,which is relatively short for operations in outer space, where demand is at least200–300 hours of constant supplied power.
The general interest in fuel cells is due to their potentially high efficiency.Efficiency is the ratio of energy produced to the amount of energy supplied, whichis always higher than the energy produced. Conversion processes of one form ofenergy to another are never 100%. Therefore, the energy lost is actually convertedto another form of energy, since the First Law of Thermodynamics declares that
DK9448_C012.fm Page 217 Wednesday, March 29, 2006 7:09 AM
© 2006 by Taylor & Francis Group, LLC
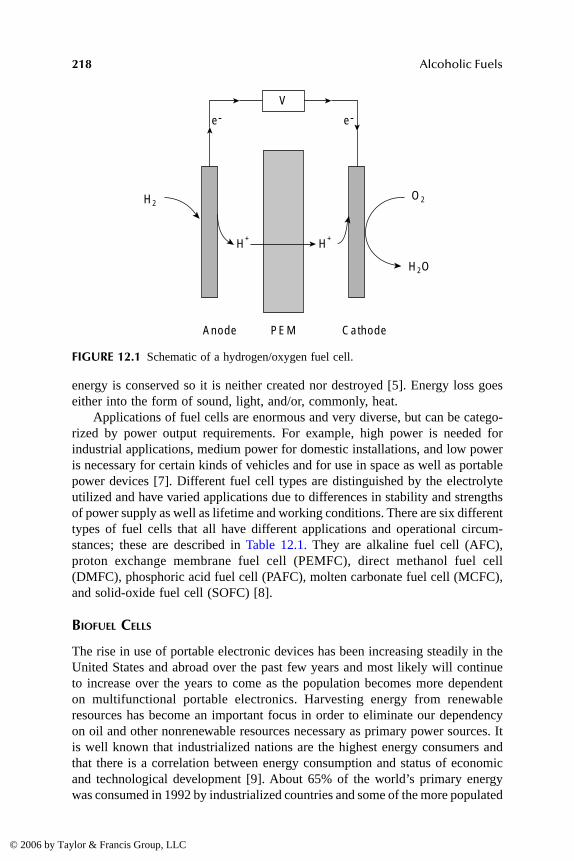
218
Alcoholic Fuels
energy is conserved so it is neither created nor destroyed [5]. Energy loss goeseither into the form of sound, light, and/or, commonly, heat.
Applications of fuel cells are enormous and very diverse, but can be catego-rized by power output requirements. For example, high power is needed forindustrial applications, medium power for domestic installations, and low poweris necessary for certain kinds of vehicles and for use in space as well as portablepower devices [7]. Different fuel cell types are distinguished by the electrolyteutilized and have varied applications due to differences in stability and strengthsof power supply as well as lifetime and working conditions. There are six differenttypes of fuel cells that all have different applications and operational circum-stances; these are described in Table 12.1. They are alkaline fuel cell (AFC),proton exchange membrane fuel cell (PEMFC), direct methanol fuel cell(DMFC), phosphoric acid fuel cell (PAFC), molten carbonate fuel cell (MCFC),and solid-oxide fuel cell (SOFC) [8].
B
IOFUEL
C
ELLS
The rise in use of portable electronic devices has been increasing steadily in theUnited States and abroad over the past few years and most likely will continueto increase over the years to come as the population becomes more dependenton multifunctional portable electronics. Harvesting energy from renewableresources has become an important focus in order to eliminate our dependencyon oil and other nonrenewable resources necessary as primary power sources. Itis well known that industrialized nations are the highest energy consumers andthat there is a correlation between energy consumption and status of economicand technological development [9]. About 65% of the world’s primary energywas consumed in 1992 by industrialized countries and some of the more populated
FIGURE 12.1
Schematic of a hydrogen/oxygen fuel cell.
V
H2
H+ H+
O2
H2O
Anode PEM Cathode
e- e-
DK9448_C012.fm Page 218 Wednesday, March 29, 2006 7:09 AM
© 2006 by Taylor & Francis Group, LLC

Alcohol-Based Biofuel Cells
219
countries, while developing areas consume more biomass energy such as woodand wood wastes.
The demand for energy is slowly increasing with developing technology,which in turn explains the extreme situation of the United States. The UnitedStates has only 5% of the world’s population and yet consumes about one quarterof the total global primary energy. The sources for energy production in the UnitedStates are usually obtained from coal, natural gas, and oil where oil is mostcommon [9]. In order to minimize our dependency on oil, researchers are attempt-ing to harvest energy from renewable resources, such as alcohols, sugars, fats,and other biologically derived materials.
Biofuel cells are electrochemical devices in which energy derived from bio-chemical reactions is converted to electrical energy by means of the catalyticactivity of microorganisms and/or their enzymes. Unlike metal catalysts, biocat-alysts are derived from biomatter, which is a renewable resource. Recent biofuelcell research has explored using enzymes as biocatalysts due to their availabilityand specificity. Enzymes are functional proteins whose purpose is to catalyzespecific biochemical reactions by lowering the activation energy of the reaction,without undergoing a permanent chemical change itself. Enzymes can be manip-ulated and produced by genetic engineering or harvested and extracted from livingorganisms. Both means of acquiring enzymes are more cost effective than miningprecious metals used as traditional catalysts. Biofuel cell catalysts are moreenvironmentally friendly compared to heavy metal batteries due to the fact theynaturally biodegrade. Another advantage of enzyme employment in biofuel cellsis the enzyme specificity that pushes the fuel cell technology one step further.Specificity of the enzyme’s fuel utilization eliminates the need for employmentof a salt bridge and therefore simplifies the fuel cell system [4].
TABLE 12.1Comparison of the Six Traditional Types of Fuel Cells
Fuel Cell TypeMobile
IonOperating
Temperature Applications and Notes
Alkaline (AFC) OH
–
50–200°C Used in space vehicles, e.g., Apollo, shuttleProton exchange membrane (PEMFC)
H
+
30–100°C vehicles and mobile applications, and for lower-power systems
Direct methanol (DMFC)
H
+
20–90°C Suitable for portable electronics systems of low power, running or long times
Phosphoric acid (PAFC)
H
+
~220°C Large numbers of 200-kW systems in use
Molten carbonate (MCFC)
CO
3–2
~650°C Suitable for medium- to large-scale systems, up to MW capacity
Solid oxide (SOFC) O
2–
500–1000°C Suitable for all sizes of CHP systems, 2-kW to multi-MW
DK9448_C012.fm Page 219 Wednesday, March 29, 2006 7:09 AM
© 2006 by Taylor & Francis Group, LLC
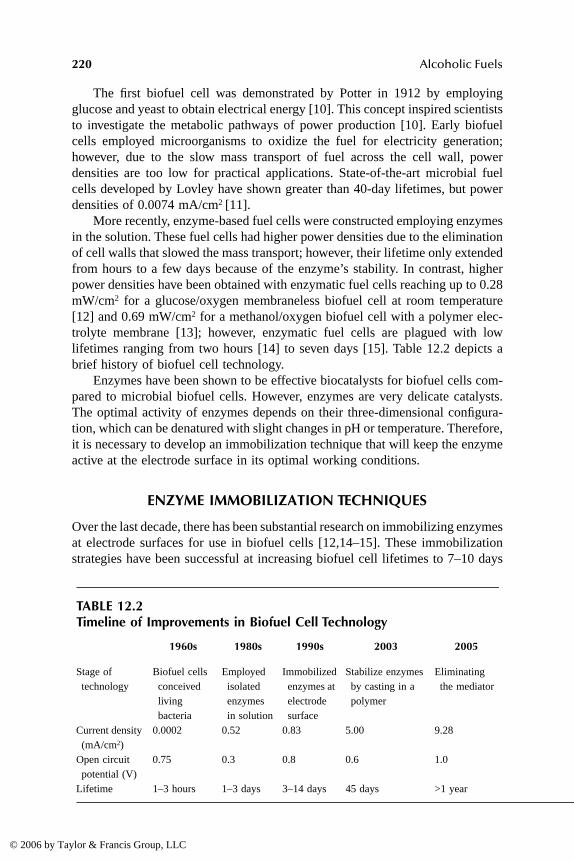
220
Alcoholic Fuels
The first biofuel cell was demonstrated by Potter in 1912 by employingglucose and yeast to obtain electrical energy [10]. This concept inspired scientiststo investigate the metabolic pathways of power production [10]. Early biofuelcells employed microorganisms to oxidize the fuel for electricity generation;however, due to the slow mass transport of fuel across the cell wall, powerdensities are too low for practical applications. State-of-the-art microbial fuelcells developed by Lovley have shown greater than 40-day lifetimes, but powerdensities of 0.0074 mA/cm
2
[11].More recently, enzyme-based fuel cells were constructed employing enzymes
in the solution. These fuel cells had higher power densities due to the eliminationof cell walls that slowed the mass transport; however, their lifetime only extendedfrom hours to a few days because of the enzyme’s stability. In contrast, higherpower densities have been obtained with enzymatic fuel cells reaching up to 0.28mW/cm
2
for a glucose/oxygen membraneless biofuel cell at room temperature[12] and 0.69 mW/cm
2
for a methanol/oxygen biofuel cell with a polymer elec-trolyte membrane [13]; however, enzymatic fuel cells are plagued with lowlifetimes ranging from two hours [14] to seven days [15]. Table 12.2 depicts abrief history of biofuel cell technology.
Enzymes have been shown to be effective biocatalysts for biofuel cells com-pared to microbial biofuel cells. However, enzymes are very delicate catalysts.The optimal activity of enzymes depends on their three-dimensional configura-tion, which can be denatured with slight changes in pH or temperature. Therefore,it is necessary to develop an immobilization technique that will keep the enzymeactive at the electrode surface in its optimal working conditions.
ENZYME IMMOBILIZATION TECHNIQUES
Over the last decade, there has been substantial research on immobilizing enzymesat electrode surfaces for use in biofuel cells [12,14–15]. These immobilizationstrategies have been successful at increasing biofuel cell lifetimes to 7–10 days
TABLE 12.2Timeline of Improvements in Biofuel Cell Technology
1960s 1980s 1990s 2003 2005
Stage of technology
Biofuel cells conceived living bacteria
Employed isolated enzymes in solution
Immobilized enzymes at electrode surface
Stabilize enzymes by casting in a polymer
Eliminating the mediator
Current density (mA/cm
2
)0.0002 0.52 0.83 5.00 9.28
Open circuit potential (V)
0.75 0.3 0.8 0.6 1.0
Lifetime 1–3 hours 1–3 days 3–14 days 45 days >1 year
DK9448_C012.fm Page 220 Wednesday, March 29, 2006 7:09 AM
© 2006 by Taylor & Francis Group, LLC

Alcohol-Based Biofuel Cells
221
[15]. Therefore, one of the main obstacles that is still plaguing enzyme-basedbiofuel cells is the ability to immobilize the enzyme in a membrane at theelectrode surface that will extend the lifetime of the enzyme and form a mechan-ically and chemically stable layer, while not forming a capacitive region at theelectrode surface.
The problem associated with bioelectrodes as reported in the literature isineffective techniques for enzyme immobilization [16]. The most common tech-niques used are sandwich [17] or wired [16,18]. However, sandwich and wiredtechniques still leave the enzyme exposed to the matrix, so the enzyme’s three-dimensional configuration can change due to the harsh physical and chemicalforces resulting in the loss of optimal enzymatic activity [14,16,18,19].
To solve these issues and offer a more stable enzyme immobilization,researchers have employed a micellar polymer (Nafion
®
). Nafion
®
is a perfluori-nated ion exchange polymer that has excellent properties as an ion conductor andhas been widely employed to modify electrodes for a variety of sensor and fuelcell applications. The molecular structure of Nafion
®
is shown in Figure 12.2.Nafion
®
is a cation exchange polymer that has superselectivity against anions.Nafion
®
also preconcentrates cations at the electrode surface and serves as aprotective coating for the electrode. A simple approach to obtain selective elec-trodes is performed by solvent casting of the Nafion
®
polymer directly onto theelectrode surface. Nafion
®
can be employed for enzyme immobilization in threedifferent ways by employing either the wired technique, sandwich technique, orentrapment technique [20].
W
IRED
T
ECHNIQUE
The “wired” technique is most commonly used today for enzyme immobilizationand can be employed with Nafion
®
polymers, as shown in Figure 12.3. However,this approach decreases the activity of the enzyme due to the change in the three-dimensional configuration of the enzyme that results from covalent bondingbetween the enzyme and the polymer. Another problem associated with thistechnique is that the enzyme is still subjected to the chemical environment of the
FIGURE 12.2
Structure of Nafion polymer.
Teflon-based fluorocarbon backbone
Sulfonic acid side chains
[(CF2CF2)n - CF2CF-]
(OCF2CF-) m OCF2CF2SO3H
xCF3
Nafion® 117 m = 1 n = 6, 7…14
DK9448_C012.fm Page 221 Wednesday, March 29, 2006 7:09 AM
© 2006 by Taylor & Francis Group, LLC
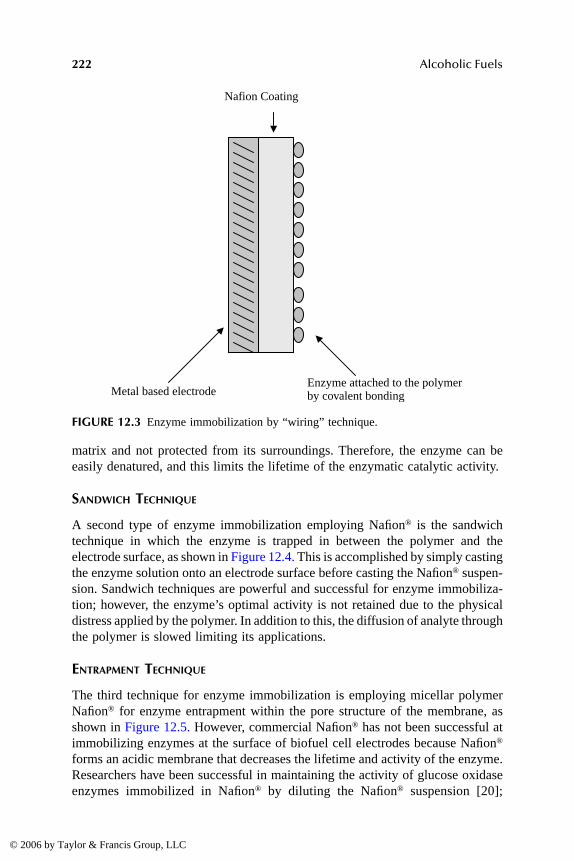
222
Alcoholic Fuels
matrix and not protected from its surroundings. Therefore, the enzyme can beeasily denatured, and this limits the lifetime of the enzymatic catalytic activity.
S
ANDWICH
T
ECHNIQUE
A second type of enzyme immobilization employing Nafion
®
is the sandwichtechnique in which the enzyme is trapped in between the polymer and theelectrode surface, as shown in Figure 12.4. This is accomplished by simply castingthe enzyme solution onto an electrode surface before casting the Nafion
®
suspen-sion. Sandwich techniques are powerful and successful for enzyme immobiliza-tion; however, the enzyme’s optimal activity is not retained due to the physicaldistress applied by the polymer. In addition to this, the diffusion of analyte throughthe polymer is slowed limiting its applications.
E
NTRAPMENT
T
ECHNIQUE
The third technique for enzyme immobilization is employing micellar polymerNafion
®
for enzyme entrapment within the pore structure of the membrane, asshown in Figure 12.5. However, commercial Nafion
®
has not been successful atimmobilizing enzymes at the surface of biofuel cell electrodes because Nafion
®
forms an
acidic membrane that decreases the lifetime and activity of the enzyme.Researchers have been successful in maintaining the activity of glucose oxidaseenzymes immobilized in Nafion
®
by diluting the Nafion
®
suspension [20];
FIGURE 12.3
Enzyme immobilization by “wiring” technique.
Nafion Coating
Metal based electrodeEnzyme attached to the polymerby covalent bonding
DK9448_C012.fm Page 222 Wednesday, March 29, 2006 7:09 AM
© 2006 by Taylor & Francis Group, LLC

Alcohol-Based Biofuel Cells
223
however, this approach did not form stable and uniform films. The most recentmethod employed by Karyakina and coworkers was to neutralize the Nafion
®
casting solution and dilute the solution to a lesser degree in ethanol; however,both of these approaches have problems with maintaining activity of enzymesfor extended times. As the pH environment in the solution around the Nafion
®
membrane decreases, protons will exchange back into the membrane and re-acidify the membrane [20].
N
AFION
®
M
ODIFICATION
The technique developed by Minteer et al. [20–22] involves modifying Nafion
®
with quaternary ammonium bromide salts. This technique provides an idealenvironment for enzyme immobilization due to the biocompatibility and structureof the micellar pores. This method helps to keep the enzyme at the electrodesurface as well as maintain high enzymatic activity and protect the enzyme fromthe surrounding environment. Previous studies by Schrenk et al. have shown thatmixture-cast films of quaternary ammonium bromide salts and Nafion
®
haveincreased the mass transport of small analytes through the films and decreasedthe selectivity of the membrane against anions [21].
FIGURE 12.4
Enzyme immobilization by sandwich technique.
Nafion CoatingMetal based electrode
Enzyme casting layer
DK9448_C012.fm Page 223 Wednesday, March 29, 2006 7:09 AM
© 2006 by Taylor & Francis Group, LLC

224
Alcoholic Fuels
Quaternary ammonium bromide salts have a higher affinity to the sulfonic acidside chain than the proton; therefore, they can be utilized to modify the polymerand extend the enzymes lifetime because protons are less likely to exchange backinto the membrane and reacidify it. A much higher preference to the quaternaryammonium bromide salts than to the proton has been shown by titrating the numberof available exchange sites to protons in the membranes [21]. Due to the fact thatquaternary ammounium bromide salts are larger in size than protons, the micellarstructure will also be enlarged to facilitate enzyme entrapment.
Immobilizing enzymes in micellar pores will eliminate the issue of covalentbonding, which “wired” techniques are plagued with, because the process canbuffer the pH of the membrane for optimal enzyme catalytic activity. In addition,the pore structure also provides a protective and restrictive 3D pore, unlike“wired” techniques where an enzyme is freely subjected to the surroundings andcan be easily denatured if introduced to a harsh environment. Also, quaternaryammonium bromide salts have similar hydrophobicity as the enzymes. Nafion
®
modified with quaternary ammonium bromide salts will not only provide a buff-ered micellar structure for easier enzyme immobilization, but will also retain theelectrical properties of unmodified Nafion
®
as well as increase the mass transport
FIGURE 12.5
Enzymes immobilized by entrapment.
Metal based electrode
Enzyme entrapped within a micellarpolymer
DK9448_C012.fm Page 224 Wednesday, March 29, 2006 7:09 AM
© 2006 by Taylor & Francis Group, LLC

Alcohol-Based Biofuel Cells
225
flux of ions and neutral species through the membrane minimizing problemsassociated with slow diffusion [20].
NAD
+
-D
EPENDENT
A
LCOHOL
D
EHYDROGENASE
B
IOFUEL
C
ELLS
The bioanode of the biofuel cell is the electrode at which the fuel is utilized byenzymes to produce electrons and protons, which are then utilized by enzymesof biocathodes to reduce O
2
to H
2
O. Alcohol-based enzymatic systems that havebeen chosen most frequently for the bioanode involve NAD
+
-dependent alcoholdehydrogenase (ADH), which oxidizes alcohols to aldehydes. This enzyme canbe employed with aldehyde dehydrogenase to further oxidize the aldehyde. Lit-erature reports of alcohol biofuel cells are limited to only two alcohol-basedenzymatic schemes. They are for methanol and ethanol and are shown in Figure12.6. Methanol is oxidized to formaldehyde by alcohol dehydrogenase and thenthe formaldehyde is oxidized to formate by formaldehyde dehydrogenase. Theformate is completely oxidized to carbon dioxide by formate dehydrogenase. Theethanol system involves oxidizing ethanol to acetaldehyde by alcohol dehydro-genase and then oxidizing the acetaldehyde to acetate by aldehyde dehydrogenase.
All of these enzymatic systems require NAD
+
as a coenzyme/cofactor andthe reduced form (NADH) is the hydrogen source at the electrode surface. How-ever, NADH has a high overpotential at most typical electrode surfaces (platinum,carbon, etc.), so an electrocatalyst layer is necessary to decrease the potential andincrease the power output. The problem with electrocatalyst layers is that theyare not as conductive as carbon or most metals and they add an extra complexityto the system that makes forming high surface area bioanodes difficult. A variety
FIGURE 12.6
Oxidation schemes for methanol (top) and ethanol (bottom).
CH3OH
CH3CH2OH CH3CH = OH Acetate
CH2 = O CO2O = CH-O–
ADH AldDH
ADH AldDH
FDH
3NAD+ 3NADH
2NAD+ 2NADH
DK9448_C012.fm Page 225 Wednesday, March 29, 2006 7:09 AM
© 2006 by Taylor & Francis Group, LLC
226
Alcoholic Fuels
of electrocatalysts have been used, but at this stage, there is no optimal electro-catalyst. Palmore and coworkers have employed a diaphorase/benzyl viologensystem that has shown good thermodynamics properties, but poor lifetimes [13].Minteer and coworkers have employed methylene green as the electrocatalystlayer due to its optimal electrocatatlytic properties. Poly(methylene green) pre-pared via electropolymerization has been shown to be an electrocatalyst forNADH [23].
The second problem with an NAD
+
-dependent bioanode is the instability ofthe NAD
+
/NADH couple in the membrane. When ethanol is oxidized to acetate,the NAD
+
is converted to NADH. It is simple to electrostatically immobilizeNAD
+
in the bioanodes membrane, but NAD
+
has a short lifetime in solution anda limited lifetime in the membrane. NAD
+
is only stable in solution for a fewhours, but it can be stabilized for up to 45 days in the membrane. Dehydrogenaseenzymes are stable for much longer (>6 months) in the membrane, so it isnecessary to employ a coenzyme that is stable for at least as long as the enzymeis stable.
Akers et al. have tested ethanol-based biofuel cells fabricated using bioanodescontaining NAD
+
-dependent ADH immobilized in a modified Nafion
®
membraneas discussed above and cathodes formed from ELAT electrodes with 20% Pt onVulcan XC-72 (E-Tek). These bioanodes can function for greater than 30 days[23]. The test cell contains an anode solution of 1.0 mM ethanol in pH 7.15phosphate buffer and a cathode solution containing pH 7.15 phosphate buffersaturated with dissolved oxygen. The two solutions are separated by a Nafion
®
117 membrane. The ethanol-based biofuel cells have had open-circuit potentialsranging from 0.61 to 0.82 V at 20
°
C and have maximum power densities of 1.12mW/cm
2
[23]. This is a 16-fold increase in power density versus the state-of-the-art biofuel cell developed by Heller and co-workers [24]. The milestone that wasrequired to further develop a biofuel cell is to eliminate the need for the electro-catalyst layer, poly(methylene green). This will be done by replacing NAD
+
-dependent ADH with PQQ-dependent ADH.
PQQ-D
EPENDENT
A
LCOHOL
D
EHYDROGENASE
B
IOFUEL
C
ELLS
More recent research in developing long-term stability in biofuel cell systemshas focused on studying a new enzymatic system. Initial studies have beensuccessful in utilizing PQQ-dependent ADH as a catalyst at the anode of a biofuelcell. Pyrroloquinoline quinone (PQQ)-dependent alcohol dehydrogenase (ADH)has been chosen to replace NAD
+
-dependent ADH in order to extend the lifetimeand simplicity of the fuel cell. PQQ is the coenzyme of PQQ-dependent ADH,and it remains electrostatically attached to PQQ-dependent ADH; therefore, theenzyme and coenzyme will remain in the membrane leading to an increasedlifetime and activity for the biofuel cell. Also, PQQ-dependent ADH possessesdesirable electrochemistry (it has the ability to transition between its oxidizedand reduced state). The coenzyme PQQ has quasireversible electrochemistry anda low overpotential at an unmodified carbon electrode. This eliminates the need
DK9448_C012.fm Page 226 Wednesday, March 29, 2006 7:09 AM
© 2006 by Taylor & Francis Group, LLC

Alcohol-Based Biofuel Cells
227
for an electrocatalyst layer, thereby simplifying the process of forming high-surface-area bioanodes.
PQQ-dependent ADH bioanodes fabricated and tested by Treu et al. usingthe same procedures and methods as for the NAD
+
-dependent ADH system haddesirable results. The PQQ-dependent ADH enzymatic system has shown life-times of greater than 1 year of continuous use, open circuit potentials of 1.0 Vand power densities of up to 3.61 mW/cm
2
for a 1.0 mM ethanol solution at roomtemperature in a static system [25].
The PQQ-dependent ADH-based biofuel cell outperformed the NAD
+
-depen-dent ADH-based fuel cell in all aspects of traditional systems. For the traditionalsystem of PQQ-dependent ADH anode coupled with a traditional platinum cath-ode, the PQQ-based enzymatic system increased the overall lifetime by greaterthan 711%, increased open circuit potential by 67%, and increased power densityby 251% [25]. There was no correlation between power and different pHs for thePQQ-dependent ADH biofuel cell [26].
PQQ-dependent ADH has optimum selectivity for ethanol, but will oxidizeother alcohols. Similar fuel cells have been developed for methanol, butanol, andpropanol using PQQ-dependent ADH bioanodes. The performance of those fuelcells is shown in Table 12.3. PQQ-dependent ADH is a desirable substitute fora biocatalyst at the anode of a biofuel cell. Eliminating the poly(methylene green)layer simplifies the fabrication of a bioanode and lowers the IR drop leading toan increase in performance. Research has shown that PQQ-dependent ADHenables simple and timely electrode fabrication, along with impressive opencircuit potentials, current densities, power densities, and lifetime for a completeethanol/oxygen biofuel cell.
M
EMBRANELESS
B
IOFUEL
C
ELLS
Since enzymes are highly selective, there are limited problems associated withfuel crossover from the anode to the cathode in a biofuel cell. If an anode andcathode are both selective, then a polymer electrolyte membrane is no longerrequired to separate the anode and cathode solutions. Topcagic et al. have devel-oped the first ethanol membraneless biofuel cell. At the cathode, bilirubin oxidasehas been chosen to replace platinum as the reducing catalyst to increase specificityof the cathode. A schematic showing the simplicity of a membraneless biofuelcell can be seen in Figure 12.7.
Alternatives for platinum found in the literature typically use laccase enzymeas studied by Heller’s Group [27]. Laccase lowers the power of a biofuel celldue to the maximum turnover rate of laccase occuring at pH 5.0 and deactivationin the presence of chlorine ions. Bilirubin oxidase has been chosen as a catalystfor future studies, because it has optimum performance in a physiological envi-ronment (near-neutral pH and presence of various ions). The second problemassociated with many biocathodes in the literature is that electrodes are osmium-based creating a toxicity hazard to the surrounding environment. Topcagic et al.have replaced the osmium-based mediator with a ruthenium-based complex of
DK9448_C012.fm Page 227 Wednesday, March 29, 2006 7:09 AM
© 2006 by Taylor & Francis Group, LLC
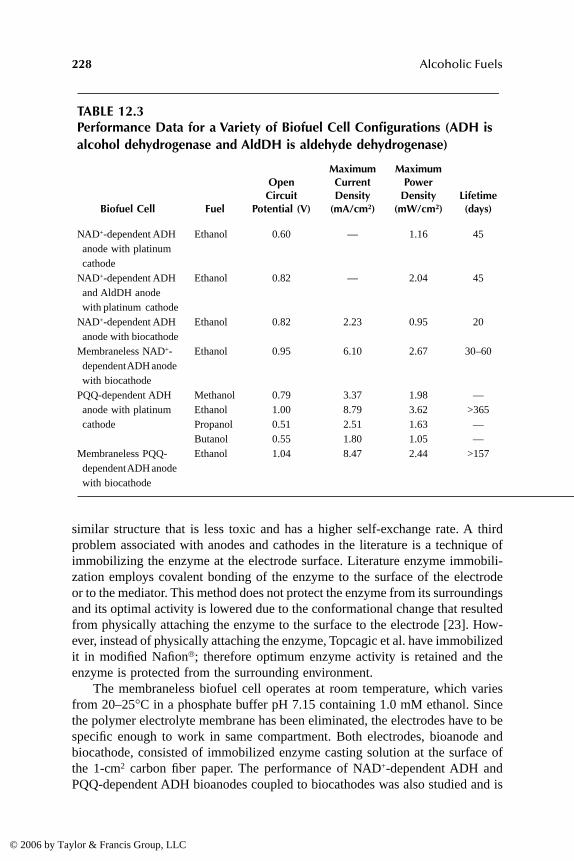
228 Alcoholic Fuels
similar structure that is less toxic and has a higher self-exchange rate. A thirdproblem associated with anodes and cathodes in the literature is a technique ofimmobilizing the enzyme at the electrode surface. Literature enzyme immobili-zation employs covalent bonding of the enzyme to the surface of the electrodeor to the mediator. This method does not protect the enzyme from its surroundingsand its optimal activity is lowered due to the conformational change that resultedfrom physically attaching the enzyme to the surface to the electrode [23]. How-ever, instead of physically attaching the enzyme, Topcagic et al. have immobilizedit in modified Nafion; therefore optimum enzyme activity is retained and theenzyme is protected from the surrounding environment.
The membraneless biofuel cell operates at room temperature, which variesfrom 20–25°C in a phosphate buffer pH 7.15 containing 1.0 mM ethanol. Sincethe polymer electrolyte membrane has been eliminated, the electrodes have to bespecific enough to work in same compartment. Both electrodes, bioanode andbiocathode, consisted of immobilized enzyme casting solution at the surface ofthe 1-cm2 carbon fiber paper. The performance of NAD+-dependent ADH andPQQ-dependent ADH bioanodes coupled to biocathodes was also studied and is
TABLE 12.3Performance Data for a Variety of Biofuel Cell Configurations (ADH is alcohol dehydrogenase and AldDH is aldehyde dehydrogenase)
Biofuel Cell Fuel
OpenCircuit
Potential (V)
Maximum CurrentDensity
(mA/cm2)
MaximumPower
Density(mW/cm2)
Lifetime(days)
NAD+-dependent ADH anode with platinum cathode
Ethanol 0.60 — 1.16 45
NAD+-dependent ADH and AldDH anode with platinum cathode
Ethanol 0.82 — 2.04 45
NAD+-dependent ADH anode with biocathode
Ethanol 0.82 2.23 0.95 20
Membraneless NAD+-dependent ADH anode with biocathode
Ethanol 0.95 6.10 2.67 30–60
PQQ-dependent ADH anode with platinum cathode
Methanol 0.79 3.37 1.98 —Ethanol 1.00 8.79 3.62 >365Propanol 0.51 2.51 1.63 —Butanol 0.55 1.80 1.05 —
Membraneless PQQ-dependent ADH anode with biocathode
Ethanol 1.04 8.47 2.44 >157
DK9448_C012.fm Page 228 Wednesday, March 29, 2006 7:09 AM
© 2006 by Taylor & Francis Group, LLC

Alcohol-Based Biofuel Cells 229
summarized in Table 12.3. The bioanode used for most studies had PQQ-depen-dent alcohol dehydrogenase enzymes, while the biocathode had bilirubin oxidase,bilirubin with Ru(bpy)3
+2 immobilized at the surface of the electrode. Maximumopen circuit potential is 1.04 V with maximum current density of 8.47 mA/cm2
[28]. For the membraneless system comprised of a PQQ-dependent ADH anodeand bilirubin oxidase biocathode, the fuel cell has an increased lifetime of greaterthan 353%, increased open circuit potential of 15%, and increased power densityof 97% compared to the NAD+-dependent ADH bioanode [28].
CONCLUSIONS
Research has succeeded in increasing the stability of enzymes at the electrodesurface, which in turn increases the open circuit potential, current and power ofa biofuel cell. Also, by eliminating the need for an electrocatalyst layer and apolyelectrolyte membrane, it reduces the cost of production of the current biofuelcell and simplifies fabrication. Replacing NAD+-dependent ADH with PQQ-dependent ADH is a step toward reaching the goal of increasing the overalllifetime of the biofuel cell for future use in multiple power applications. Themost important phenomenon to examine is the increase in lifetime of the mem-braneless system with PQQ-dependent bioanodes. The PQQ-dependent bioanodesare more stable than NAD+-dependent bioanodes. In addition to better data results,PQQ-dependent ADH serves as an invaluable replacement for NAD+-dependentADH due to the simplicity it offers in bioanode fabrication.
FIGURE 12.7 Membraneless biofuel cell schematic.
Electrical Load
Bilirubin OxidaseBiocathode
Alcohol inElectrolyte
Alcohol DehydrogenaeBioanode
DK9448_C012.fm Page 229 Wednesday, March 29, 2006 7:09 AM
© 2006 by Taylor & Francis Group, LLC

230 Alcoholic Fuels
REFERENCES
1. Gorisch, H., The Ethanol Oxidation System and its Regulation in PseudomonasAeruginosa, Biochimica et Biophysica Acta, 98, 1647, 2003.
2. Ikeda, T., Kato, K., Tatsumi, H. and Kano, K., Mediated Catalytic Current for theOxidation of Ethanol Produced by Acetobacter Aceti Cells Suspended in Solution,J. Electroanal. Chem., 265, 440, 1997.
3. Molinari, F., Villa, R., Manzoni, M. and Aragozzini, F., Aldehyde Production byAlcohol Oxidation with Gluconobacter Oxydans, Applied Microbiology and Bio-technology, 43, 989, 1995.
4. Moore, C.M., From Macro to Micro Biofuel Cells, thesis, Saint Louis University,2004.
5. Brown, T.L., LeMay, H.E., Jr. and Bursten, B.E., Chemistry, Pearson Education,Inc., New Jersey, 2003.
6. Williams, K.R., An Introduction to Fuel Cells, Elsevier Publishing Company,Amsterdam, 1966.
7. McDougall, A., Fuel Cells, John Wiley and Sons, New York, 1976.8. Dicks, A., Fuel Cell Systems Explained, John Wiley and Sons, Ltd., United
Kingdom, 2003.9. Klass, D.L., Biomass fo Renewable Energy, Fuels, and Chemicals, Academic
Press, San Diego, 1998.10. Williams, K.R., An Introduction to Fuel Cells, Elsevier Publishing Company, New
York, 1966.11. Chaudhuri, S. and Lovley, D.R., Electricity generation by direct oxidation of
glucose in mediatorless microbial fuel cells, Nature Biotechnology, 21, 1229, 2002.12. Mano, N., Mao, F. and Heller, A., Characteristics of a miniature compartmentless
glucose-O2 biofuel cell and its operation in a living plant, J. Am. Chem. Soc., 125,6588, 2003.
13. Palmore, G.T., Bertschy, H., Bergens S.H. and Whitesides, G.M., A Metha-nol/Dioxygen Biofuel Cell That Uses NAD+-Dependent Dehydrogenase as Cat-alysts: Application of an Electro-Enzymatic Method to Regenerate NicotinamideAdenine Dinucleotide at Low Overpotentials, Journal of Electroanalytical Chem.,443, 155, 1998.
14. Mano, N., Kim, H.H. and Heller, A. On the Relationship between the Character-icstics of Bilirubin Oxidase and O2 Cathodes Based on Their “Wiring,” J. Phys. Chem. B, 106, 8842, 2002.
15. Mano, N., Mao, F., Shin, W., Chen. T. and Heller, A., A miniature biofuel celloperating at 0.78V, Chem. Commun., 4, 518, 2003.
16. Barton, S.C., Kim, H., Binyamin, G., Zhang, Y. and Heller, A., Electroreductionof O2 to Water on the “Wired” Laccase Cathode, J. Phys. Chem. B, 105, 11917,2001.
17. Kim, E., Kim K., Yang, H., Kim, Y.T. and Kwak, J., Enzyme-Amplified Electro-chemical Detection of DNA Using Electrocatalysis of Ferrocenyl-Tethered Den-drimer, Anal. Chem., 75, 5665, 2003.
18. Mano, N., Mao, F. and Heller, A., A Miniature Biofuel Cell Operating in aPhysiological Buffer, J. Am. Chem. Soc., 124, 12962, 2002.
19. Kim, H., Zhang, Y. and Heller, A., Bilirubin Oxidase Label for an Enzyme-LinkedAffinity Assay with O2 as Substrate in a Neutral pH NaCl Solution, Anal. Chem.,76, 2411, 2004.
DK9448_C012.fm Page 230 Wednesday, March 29, 2006 7:09 AM
© 2006 by Taylor & Francis Group, LLC

Alcohol-Based Biofuel Cells 231
20. Moore, C.M., Akers N.L., Hill, A.A., Johnson, Z.C. and Minteer, S.D., Improvingthe Envoroment for Immobilized Dehydrogenase Enzymes by Modifying Nafionwith Tetraalkylammonium Bromides, Biomacromolecules, 5, 1241, 2004.
21. Schrenk, M.J., Villigram, R.E., Torrence, N.J., Brancato, S.J. and Minteer, S.D.,Effects of mixture-casting Nafion with quaternary ammonium bromide salts onthe ion-exchange capacity and mass transport in the membranes, J. MembraneScience, 203, 3, 2002.
22. Thomas, T.J., Ponnusamy, K.E., Chang, N.M., Galmore, K. and Minteer, S.D.,Effects of annealing on mixture-cast membranes of Nafion and quaternary ammo-nium bromide salts, J. Membrane Science, 213, 55, 2003.
23. Akers, N.L., Moore, C.M. and Minteer, S.D., Development of Alcohol/OxygenBiofuel Cells Using Salt-Extracted Tertabutylammonim Bromide/Nafion Mem-branes to Immobilize Dehydrogenase Enzymes, Electrochimica Acta, 50, 2521,2005.
24. Chen, T., Barton, S.C., Binyamin, G., Gao, G., Zhang, Y., Kim, H.H. and Heller,A., A Miniature Biofuel Cell, Journal of the American Chemical Society, 123,8630, 2001.
25. Treu, B.L. and Minteer, S.D., Improving the Lifetime, Simplicity, and Power ofand Ethanol Biofuel Cell by Employing Ammonium Treated Nafion Membranesto Immobilize PQQ-Dependent Alcohol Dehydrogenase, Polymeric Materials:Science and Engineering, 92, 192, 2005.
26. Treu, B.L., The Development of a PQQ-Dependent Alcohol DehydrogenaseBioanode, thesis, Saint Louis University, 2005.
27. Heller, A., Miniature Biofuel Cells, Physical Chemistry Chemical Physics, 6, 209,2004.
28. Topcagic, S., Treu, B.L. and Minteer, S.D., Characterization of Oxygen Biocath-odes Employing Tetrabutylammonium Bromide Treated Nafion ImmobilizationMembranes, Polymeric Materials: Science and Engineering, 92, 201, 2005.
DK9448_C012.fm Page 231 Wednesday, March 29, 2006 7:09 AM
© 2006 by Taylor & Francis Group, LLC

233
13
Ethanol Reformation to Hydrogen
Pilar Ramírez de la Piscina and Narcís Homs
Inorganic Chemistry Department,Universitat de Barcelona, Spain
CONTENTS
Background .......................................................................................................233Energetically Integrated Ethanol Reforming Processes ...................................236Catalytic Systems..............................................................................................238
Mechanistic Aspects..............................................................................240Nickel- and Cobalt-Based Catalysts .....................................................241Noble Metal-Based Catalysts................................................................243Catalysts for Autothermal Steam Reforming .......................................244
Perspectives .......................................................................................................244References .........................................................................................................245
BACKGROUND
Energy is one of the main factors that must be taken into account when sustainabledevelopment of our society is envisioned because there is an intimate connectionbetween energy, the environment and development. In response to the need forcleaner and more efficient energy technology, a number of alternatives to thecurrent energy network have emerged. In this context, the general use of fuelcells for automotive purposes or stationary power generation is envisioned in themedium term. This is a promising advance in the production of electrical energyfrom chemical energy, since the efficiency of a fuel cell is much higher than thatof a combustion engine.
The fuel most widely studied for use in a fuel cell is hydrogen. Although theideal situation would be the production of hydrogen from water, using renewableenergy sources (e.g., solar energy), this is unlikely to become extensively oper-ative in the short to medium term. At present, hydrogen is mainly produced bysteam reforming of fossil fuel-derived feedstock, mostly natural gas and naphtha.
DK9448_C013.fm Page 233 Wednesday, March 29, 2006 7:13 AM
© 2006 by Taylor & Francis Group, LLC

234
Alcoholic Fuels
The main objective of the steam reforming process is to extract the hydrogenfrom the substrate. From hydrocarbons, hydrogen is obtained via the generalequation:
C
n
H
2n+2
+ nH
2
O
↔
nCO + (2n + 1)H
2
∆
Hº > 0
Then, the production of hydrogen is completed by the successive water gasshift reaction (WGSR):
CO + H
2
O
↔
CO
2
+ H
2
∆
Hº = –41.1 kJ mol
–1
Both reactions can only be carried out in a practical way by catalytic means.The steam reforming reaction is endothermic and the real amount of energyrequired depends on both the stability of the substrate to be reformed and theability of the catalyst to activate and transform the substrate into the products.The WGSR is slightly exothermic, and the forward reaction is not favored at thetemperature used for steam reforming, which is higher than 1000 K for CH
4
.Therefore, the overall process requires the use of different catalysts, which operateunder different reaction conditions in separate reactors. In the case of natural gasand naphtha, many years of industrial practice have led the total process to becometechnologically mature. However, if a strong increase in the demand for hydrogenis contemplated, some advanced research and development in catalysis and tech-nology would still be needed in the next few years [1,2].
On the other hand, society has become environmentally conscious and sen-sitive to its oil dependency because petroleum is likely to become scarce andexpensive and the reserves are concentrated in a few countries. If a long-termglobal solution is envisioned, other, nonfossil-derived
fuels, which are renewableand environmentally friendly must be contemplated for the supply of hydrogen.In this context, ethanol is a very promising alternative. As has been stated inprevious chapters, ethanol, which can be considered a renewable and ecofriendlyhydrogen carrier, can be produced from a large variety of biomass-based sources.
The catalytic steam reforming of ethanol may provide up to 6 moles ofhydrogen per mol of ethanol reacted:
CH
3
CH
2
OH + 3H
2
O
↔
2CO
2
+ 6H
2
∆
Hº = 173.4 kJ mol
–1
If the primary production of CO is considered in the steam reforming ofethanol, the WGS reaction must be taken into account. The overall process, then,will be the combination of both reactions:
CH
3
CH
2
OH + H
2
O
↔
2CO + 4H
2
CO + H
2
O
↔
CO
2
+ H
2
DK9448_C013.fm Page 234 Wednesday, March 29, 2006 7:13 AM
© 2006 by Taylor & Francis Group, LLC

Ethanol Reformation to Hydrogen
235
Although globally the reaction releases 2 moles of carbon dioxide, the totalprocess is almost neutral from the point of view of CO
2
generation, since it maybe assumed that the CO
2
produced is consumed in biomass growth. Consequently,the use of the steam reforming of ethanol as a source of hydrogen can contributeto the global reduction of CO
2
emissions. Moreover, other emissions of green-house or polluting gases such as hydrocarbons and NOx could also be mitigated.
As we have just said, the reaction of ethanol steam reforming is highlyendothermic. However, theoretical and experimental studies have shown thatethanol steam reforming can take place at temperatures above 500 K [3]. Table13.1 shows that relatively high values of equilibrium constant (Kp) can beachieved for temperatures of over 600 K. On the other hand, it is worth mentioningthat, in this case, the energy required per mol of hydrogen generated (Table 13.1)is lower than half of that required to obtain hydrogen from the steam reformingof hydrocarbons. As an example, values of H (kJ per mol of hydrogen generated)at 600 K can be considered; 32.33 kJ must be supplied when H
2
is obtained fromethanol, and 72.82 kJ if methane is used [4].
An issue of major importance in ethanol steam reforming is the developmentof catalysts that operate with high levels of activity, selectivity, and stability.Several products that can be formed under reaction conditions could need otherexperimental conditions to be reformed. Consequently, the total process leadingto an effluent that mainly contains H
2
and CO
2
and is free of undesirable productsmay be complex. Depending on the reaction conditions and catalyst used, thefollowing reactions could contribute to a low selectivity of the process, amongothers:
CH
3
CH
2
OH
→
CH
3
CHO + H
2
CH
3
CH
2
OH
→
CH
2
CH
2
+ H
2
O
CH
3
CH
2
OH
→
CH
4
+ CO + H
2
CH
3
CHO
→
CH
4
+ CO
TABLE 13.1Several Thermodynamic Constants of Ethanol Steam Reforming [4]; CH
3
CH
2
OH + 3H
2
O
↔↔↔↔
2CO
2
+ 6H
2
T(K)
∆
H(kJ/mol ethanol reacted)
∆
H(kJ/molH
2
generated) K
p
298.15 173.36 28.89 5.49 10
–13
600 193.95 32.33 5.33 10
4
1000 208.80 34.80 5.32 10
11
DK9448_C013.fm Page 235 Wednesday, March 29, 2006 7:13 AM
© 2006 by Taylor & Francis Group, LLC
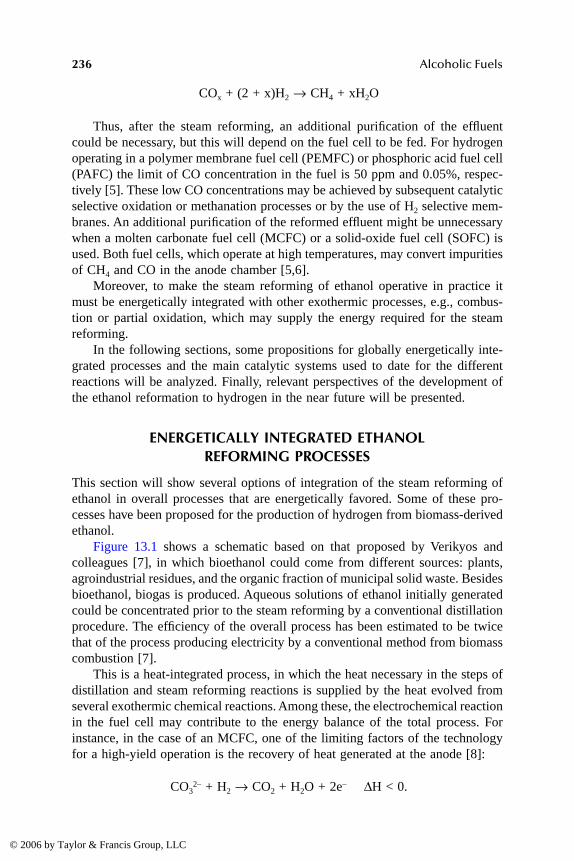
236
Alcoholic Fuels
CO
x
+ (2 + x)H
2
→
CH
4
+ xH
2
O
Thus, after the steam reforming, an additional purification of the effluentcould be necessary, but this will depend on the fuel cell to be fed. For hydrogenoperating in a polymer membrane fuel cell (PEMFC) or phosphoric acid fuel cell(PAFC) the limit of CO concentration in the fuel is 50 ppm and 0.05%, respec-tively [5]. These low CO concentrations may be achieved by subsequent catalyticselective oxidation or methanation processes or by the use of H
2
selective mem-branes. An additional purification of the reformed effluent might be unnecessarywhen a molten carbonate fuel cell (MCFC) or a solid-oxide fuel cell (SOFC) isused. Both fuel cells, which operate at high temperatures, may convert impuritiesof CH
4
and CO in the anode chamber [5,6].Moreover, to make the steam reforming of ethanol operative in practice it
must be energetically integrated with other exothermic processes, e.g., combus-tion or partial oxidation, which may supply the energy required for the steamreforming.
In the following sections, some propositions for globally energetically inte-grated processes and the main catalytic systems used to date for the differentreactions will be analyzed. Finally, relevant perspectives of the development ofthe ethanol reformation to hydrogen in the near future will be presented.
ENERGETICALLY INTEGRATED ETHANOL REFORMING PROCESSES
This section will show several options of integration of the steam reforming ofethanol in overall processes that are energetically favored. Some of these pro-cesses have been proposed for the production of hydrogen from biomass-derivedethanol.
Figure 13.1 shows a schematic based on that proposed by Verikyos andcolleagues [7], in which bioethanol could come from different sources: plants,agroindustrial residues, and the organic fraction of municipal solid waste. Besidesbioethanol, biogas is produced. Aqueous solutions of ethanol initially generatedcould be concentrated prior to the steam reforming by a conventional distillationprocedure. The efficiency of the overall process has been estimated to be twicethat of the process producing electricity by a conventional method from biomasscombustion [7].
This is a heat-integrated process, in which the heat necessary in the steps ofdistillation and steam reforming reactions is supplied by the heat evolved fromseveral exothermic chemical reactions. Among these, the electrochemical reactionin the fuel cell may contribute to the energy balance of the total process. Forinstance, in the case of an MCFC, one of the limiting factors of the technologyfor a high-yield operation is the recovery of heat generated at the anode [8]:
CO
32–
+ H
2
→
CO
2
+ H
2
O + 2e
–
∆
H < 0.
DK9448_C013.fm Page 236 Wednesday, March 29, 2006 7:13 AM
© 2006 by Taylor & Francis Group, LLC
Ethanol Reformation to Hydrogen
237
The use of this heat to produce H
2
by steam reforming may optimize theoperation of the cell, and the direct contact of catalyst with vapor carbonates maybe avoided by placing a chamber with the catalyst adjacent to the anode.
In MCFC and SOFC fuel cells, the catalyst may be placed in the anodecompartment and then the internal steam reforming of ethanol occurs. In thiscase, formation of carbon residues must be avoided since the electrode structuremay break down [9]. In this respect, it must be highlighted that the presence ofsome of the by-products, such as ethylene, has been related to the deactivationof catalysts by carbon deposition.
Moreover, for stationary applications, the use of heat generated by the com-bustion of methane (biogas) is proposed:
CH
4
+ 2O
2
→
CO
2
+ 2H
2
O
∆
Hº = –803 kJ mol
–1
Recently, catalytic methane combustion coupled to ethanol steam reformingacross an autothermal wall, which eliminated heat transfer boundary layers, wasreported [10]. On the other hand, if oxygen is introduced in the ethanol:watermixture, the coupling of two oxidation reactions may take place:
CH
3
CH
2
OH + 3O
2
→
2CO
2
+ 3H
2
O
∆
Hº= –1280 kJ mol
–1
H
2
+ 1/2O
2
→
H
2
O
∆
Hº = –242 kJ mol
–1
FIGURE 13.1
Renewable ethanol reformation to hydrogen. Energetically integrated proc-ess using a fuel-cell.
Fertilizer residue
Solidresidue
BIOMASSCellulosic material/
Sugars
Hydrolysis/Fermentation
WGSR/Selective oxidation(catalytic processes)
Anaerobicdegestion
Biogascombustion
Agroindustrialresidues
Fuel Cell
Steam-Reforming(catalytic process)
(variable O2/H2O/ethanol)
Bioethanol(C2H5OH/H2O)(variable ratio,
distillation)air
air
CO2
CO2separator
CO2
H2
CH4 + CO2
heat
heat
SolarEnergy
H2O
ElectricEnergy
DK9448_C013.fm Page 237 Wednesday, March 29, 2006 7:13 AM
© 2006 by Taylor & Francis Group, LLC

238
Alcoholic Fuels
By tuning the amount of oxygen, using air as a carrier and an appropriatecatalyst, the catalytic partial oxidation of ethanol can be effective:
CH
3
CH
2
OH + 3/2O
2
→
2CO
2
+ 3H
2
∆
Hº = –545 kJ mol
–1
Although the combination of these reactions with steam reforming will pro-duce a decrease in the hydrogen yield, all of them are fast reactions and highlyexothermic [11,12]. For mobile applications, there are certain advantages to thecombination of endothermic and exothermic reactions, which overcomes thedifficulty of quenching the exothermic process by cooling. The endothermicreaction may control the temperature of the exothermic process, alleviating theneed for additional cooling equipment.
Thus, the operation of the global process under autothermal conditions canbe proposed [13,14]. The O
2
/H
2
O/C
2
H
5
OH molar ratio can be adjusted so thatthe combined steam reforming and oxidation reactions could come close to athermally neutral process:
CH
3
CH
2
OH +
x
O
2
+ (3 – 2
x
)H
2
O
→
2CO
2
+ (6 – 2
x
)H
2
for which
∆
Hº = ((3 – 2x)/3)173 – (x/1.5)545) kJ mol
–1
Thermodynamic calculations under autothermal conditions, consideringCH3CH2OH, O2, and H2O as reactants and H2, CO, and CO2 as products, haverecently been carried out [4]. Other thermodynamically possible reaction prod-ucts, such as methane, ethylene, etc. were not taken into account. Results fordifferent fuels (methane, methanol, dimethylether, and gasoline) have beencompared. The calculations lead to a maximum hydrogen content in the productof 41–43% when ethanol is used as fuel. This maximum is achieved between530–600 K with a water/ethanol molar ratio of 1.6–2.9; under these conditions,the CO content in the effluent is approximately 5–10% [4].
Several studies are centered on the optimization of fuel cells that are fueledby H2 produced in the ethanol steam reforming [3,15–17]. Ethanol has beenclaimed to be a promising alternative to CH4 as a source of H2 for these systems,and an efficiency for the SOFC system of 94% has been calculated for ethanol,which compares well with the efficiency values calculated for CH4, 96%; meth-anol, 91%; and gasoline, 83% [16].
CATALYTIC SYSTEMS
Steam reforming reactions are catalyzed by metals of Groups 8–10 of the PeriodicTable, nickel being preferred for industrial applications [5]. However, early stud-ies on ethanol steam reforming were carried out over copper-based catalysts [18].
DK9448_C013.fm Page 238 Wednesday, March 29, 2006 7:13 AM
© 2006 by Taylor & Francis Group, LLC

Ethanol Reformation to Hydrogen 239
They were previously used extensively for methanol steam reforming becausethey were well-known catalysts for methanol synthesis and were available andhighly cost effective. Moreover, copper is a very appropriate catalyst for dehy-drogenation and WGS reactions, and both reactions may be involved in the totalprocess of ethanol steam reforming. However, over copper-based catalysts understeam reforming conditions, ethanol can be transformed to ethyl acetate or aceticacid. The former transformation takes place via a nucleophilic addition of ethox-ide or ethanol species to acetaldehyde, while the formation of acetic acid takesplace via the nucleophilic addition of OH– or H2O to acetaldehyde [18]. Bothtransformations are favored only at temperatures below 600 K, and their rate islower than the dehydrogenation reaction [18,19]. Iwasa and Takezawa havealready pointed out differences between the behavior of copper-based catalystsin methanol and ethanol steam reforming [18]. In the former, the dehydrogenationof methanol to formaldehyde was found to be the rate-determining step, and thencarbon dioxide and hydrogen were selectively produced. For ethanol steamreforming, acetaldehyde was formed by ethanol dehydrogenation, but then ethylacetate and acetic acid were produced. Consequently, copper shows a lowerselectivity in ethanol steam reforming because of its effectiveness in the cleavageof C–C bonds. Other metals such as cobalt, nickel, or noble metals, which showgreater ability to break C–C bonds [20], were preferred for steam reforming ofhigher alcohols than methanol. Thus, ethanol steam reforming has been mainlystudied over supported metal catalysts of Groups 9 and 10. Several studies indicatethe influence of the nature of the support on the behavior of the catalysts. Thesupport itself can promote the formation of different products under steam reform-ing conditions, depending on its acidic/basic properties and redox characteristics[21]. Over acidic supports dehydration of ethanol to ethylene may occur. Onceit is formed, ethylene would adsorb very strongly on the metal component of thecatalyst and become a precursor of coke formation. In this case the neutralizationof the acid centers of the support by introduction of alkaline additives preventsthe formation of ethylene and consequently diminishes the catalyst deactivation.On the other hand, basic centers may be involved in the ketonization reaction:
2CH3CH2OH → CH3COCH3 + CO + 3H2
which occurs through several successive reactions such as dehydrogenation andaldol condensation. Consequently, a decrease of hydrogen yield and the formationof undesired by-product could occur.
In what follows, relevant aspects of nickel, cobalt, and noble metal catalyticsystems, including catalysts for autothermal operation, will be discussed. How-ever, before entering into a discussion of the behavior of specific catalysts in theprocess, general trends of mechanistic aspects will be introduced. Then, thebehavior of different catalysts in the steam reforming of ethanol will be analyzedin the light of their behavior in the consecutive steps that must be completed inorder to ensure the total process.
DK9448_C013.fm Page 239 Wednesday, March 29, 2006 7:13 AM
© 2006 by Taylor & Francis Group, LLC
240 Alcoholic Fuels
MECHANISTIC ASPECTS
As stated above, the overall reaction network of ethanol steam reforming is highlycomplex because numerous reactions may coexist in equilibrium in the experi-mental conditions in which the process is carried out. Moreover, both the activemetallic phase and the support can interact with ethanol, and consequently theproposed pathway depends not only on the reaction conditions but also on thenature of the catalyst.
For Ni- [7,22], Pd- [23], Co- [24–26], and Rh-based [8,27,28] catalysts, ithas been proposed that the first step is the dehydrogenation of ethanol:
CH3CH2OH ↔ CH3CHO + H2
and in several cases the reaction has been determined to occur via a surfaceethoxide species (CH3CH2O-). Over Ni-, Pd-, and Rh-based catalysts the subse-quent decomposition of acetaldehyde into CH4 and CO is proposed:
CH3CHO → CH4 + CO
and then, depending on the temperature, reforming of CH4 and/or WGSR occurs,and, consequently, the extension of both reactions controls the final distributionof products:
CH4 + H2O ↔ CO + 3H2 ∆Hº = 205.8 kJ mol–1
CO + H2O ↔ CO2 + H2 ∆Hº = –41.1 kJ mol–1
Concerning rhodium-based catalysts, for Rh/CeO2-ZrO2 the direct decompo-sition of ethanol to CH4, CO and H2 have been proposed [29]. This seems tooccur via an oxametallacycle intermediate, –CH2CH2O–, formed from a surfaceethoxide species by abstraction of an H from the methyl group by Rh. Then, thereforming of methane and WGS reaction takes place. Other studies, which com-pare Rh-based catalysts on supports with different ceria content, point to theproduction of CO2 as the primary product in the ethanol steam reforming andthen its transformation to CO via the WGSR to reach thermodynamic equilibrium[30].
For the steam reforming of ethanol over Rh/Al2O3, the mechanism proposedby Cavallaro contemplates the dehydration of ethanol over the support and thedehydrogenation of ethanol over Rh. Then, ethylene is reformed and acetaldehydeis decomposed to CO and CH4. At 923 K, both reactions are faster than theformation of intermediates [27].
Concerning cobalt-based catalysts, studies of ethanol and acetaldehyde steamreforming employing microcalorimetry and infrared spectroscopy to investigatethe adsorption of ethanol and acetaldehyde onto Co/ZnO catalysts, have shownthat acetaldehyde transforms to surface acetate species over the fresh catalyst,
DK9448_C013.fm Page 240 Wednesday, March 29, 2006 7:13 AM
© 2006 by Taylor & Francis Group, LLC

Ethanol Reformation to Hydrogen 241
and these species have been related to the production of H2 and CO2 from thesteam reforming of acetaldehyde [24,26]. On the other hand, the deactivatedcatalyst Co/ZnO, which does not show surface acetate species after the acetalde-hyde adsorption, promoted the decomposition of acetaldehyde to CO and CH4
under reforming conditions [26].
NICKEL- AND COBALT-BASED CATALYSTS
Many studies of ethanol steam reforming have been carried out over nickel-basedcatalysts, because these are used effectively on an industrial scale for the steamreforming of natural gas and higher hydrocarbons. Different carriers have beenstudied [7,31–34], a major concern being the catalyst deactivation by carbondeposition. In this context, basic supports give better results, concerning cokeformation, than do acidic carriers.
Two nickel-based systems, Ni/La2O3 and Ni/MgO can be highlighted [7,34].Ni/La2O3 showed a good performance in terms of activity, selectivity, and stability[7]. No dehydration products were detected in the course of catalytic tests. Below573 K, only dehydrogenation of ethanol occurred. The ethanol steam reformingtakes place above 673 K. At this temperature, the presence of CO2 and CH4 iscaused by the WGSR and methanation reaction, respectively:
CO + H2O ↔ CO2 + H2 ∆Hº = –41.1 kJ mol–1
CO + 3H2 ↔ CH4 + H2O ∆Hº = –205.6 kJ mol–1
Then, at higher temperatures, the yield of H2 increases and the selectivity toCO2 and CH4 decreases. On the one hand, high temperature does not favorthe WGSR. On the other hand, the reforming of CH4 with H2O and/or CO2 (dryreforming of methane) could take place, because these reactions become thermo-dynamically feasible above 823 K. Moreover, the Ni/La2O3 catalyst was seen tobe very active for these reforming reactions:
CH4 + H2O ↔ CO + 3H2 ∆Hº = 205.6 kJ mol–1
CH4 + CO2 ↔ 2CO + 2H2 ∆Hº = 246.9 kJ mol–1
It is worth mentioning that there is good long-term stability of Ni/La2O3 whenit is compared with other nickel-supported catalysts. This feature has been attrib-uted to the lack of formation of carbon deposits on its surface, and a model hasbeen proposed for this [7]. A lanthanum oxycarbonate species is formed whenCO2 reacts with a La2Ox species:
La2O3 + CO2 → La2O2CO3
DK9448_C013.fm Page 241 Wednesday, March 29, 2006 7:13 AM
© 2006 by Taylor & Francis Group, LLC

242 Alcoholic Fuels
La2O2CO3, which decorates the nickel particles, removes the surface carbonlocated at its periphery; the following reaction has been proposed:
La2O2CO3 + C → La2O3 + 2CO
The Ni/MgO system has been proposed as appropriate to carry out the steamreforming of bioethanol to supply H2 to MCFC [34]. The addition of alkalineions produces metal particles of larger size and higher specific activity. Theauthors claimed that potassium addition stabilizes nickel catalysts by depressingthe metal sintering under steam reforming conditions [34]. It has been suggestedthat the addition of potassium could change the electronic properties of Ni/MgOcatalysts by electronic transfer from alkali-oxide moieties to nickel particles,which may depress the Boudouard reaction (2CO → CO2 + C) and hydrocarbondecomposition, which can lead to coke formation during steam reforming [31].
On the other hand, several studies have been carried out over Ni–Cu-basedcatalysts [35–39]. When alumina was used as support [35–37]. Potassium wasadded to avoid dehydration reactions. The study of catalyst generation as afunction of the calcination step and the reducibility of different phases has beenanalyzed. Copper has been proposed to be responsible for the fast ethanol dehy-drogenation to acetaldehyde and nickel for the C–C rupture of acetaldehyde toproduce methane and CO. A new aspect was recently introduced when Cu–Nicatalysts supported on SiO2 were considered: the formation of Cu–Ni, alloyswhich may prevent the deactivation of catalysts by carbon deposits [40].
As stated above, cobalt is also considered an appropriate active phase for thesteam reforming of ethanol. An early study on supported cobalt-based catalystswas reported by Haga et al. [41]. This study provided evidence that the supportstrongly influences the catalyst performance. However, most of the cobalt-basedcatalysts that were tested (ZrO2-, MgO-, SiO2- and C-supported) showed highyields of methane, probably coming from ethanol or acetaldehyde decompositionor CO hydrogenation, and these reactions were highly suppressed over Co/Al2O3.Several later studies have been devoted to clarifying the role of support and cobaltphases in the behavior of catalysts [21,42–45]. Unsupported or ZnO-supportedCo3O4 transforms under steam reforming conditions to small Co particles, whichshow a high catalytic performance in ethanol steam reforming [43,45]. Usingbioethanol-like mixtures (H2O/CH3CH2OH = 13, molar ratio), these catalysts canyield up to 5.5 moles of hydrogen per mole of ethanol reacted at 623 K. The useof relatively low reaction temperature and an excess of H2O makes it possible toobtain almost exclusively CO2 and H2 as reaction products with a low presenceof by-products [43,45]. The addition of alkaline metals on Co/ZnO catalysts hasbeen found to have a promoter effect because they stabilize the catalyst byinhibiting coke formation [25].
DK9448_C013.fm Page 242 Wednesday, March 29, 2006 7:13 AM
© 2006 by Taylor & Francis Group, LLC

Ethanol Reformation to Hydrogen 243
NOBLE METAL-BASED CATALYSTS
A review of ethanol reactions over the surface of supported noble metal catalystshas recently been published [46]. The noble metal-based catalysts most widelystudied in ethanol steam reforming are those based on Pd, Pt, Ru, and Rh, andtheir behavior also depends, in this case, on the support. Comparative studies ofg-Al2O3-supported catalysts showed Rh to be the most active metallic phase[47,48]. Taking into account that ethylene and methane were the main by-prod-ucts, the performance of different metals in the reformation of ethylene andmethane is a key aspect to take into account. Rh turned out to be the most activein ethylene steam reforming, whereas Pd was almost inactive. In this context, theselectivity to ethylene of an Rh/Al2O3 catalyst showed a maximum at 973–1023K, and then dropped at higher temperatures because ethylene reforming tookplace [47]. To optimize the hydrogen production by steam reforming of bioethanolon Rh/Al2O3 catalyst, high temperature and long contact times (high reactorvolume/volumetric flow rate ratios) are required [8]. Although Rh is highly activein hydrogenation and its presence may reduce coke formation, under steamreforming conditions the catalyst deactivates by sintering and coke formation.The introduction of a small amount of O2 (0.4 vol%) has been proposed to reducecoke formation by combustion of carbonaceous species forming during the reac-tion. However, this combustion could be responsible for the formation of largermetal particles and consequently of the decrease in activity [8].
Several papers have been published in which the reforming of ethanol iscarried out over Rh on supports other than alumina, namely, CeO2, ZrO2, andderived systems [29,49]. A high yield in H2 is found for catalysts containing ZrO2.This is related to the available oxygen on the surface, which participates in theWGS reaction [49].
As for palladium catalysts, it has recently been shown that the steam reform-ing of ethanol can be effectively carried out over a commercial Pd/g-Al2O3
catalyst, which does not produce ethylene as a by-product [23]. At 473–623 K,ethanol is dehydrogenated to acetaldehyde, which is decomposed to CH4 and CO.Then, at temperatures higher than 733 K, CH4 can be reformed as a function ofthe H2O/ethanol ratio.
Other promising systems for the steam reforming of ethanol could contem-plate the concurrence of different catalysts, with an appropriate active phase tocatalyze each step of the total process. A two-layer fixed-bed reactor containingPd/C and a Ni-based catalyst has been proposed to produce COx:H2 mixturesfrom ethanol steam reforming [50]. Ethanol can be converted to carbon oxides,CH4 and H2 over the Pd/C catalyst (608 K). Then, over the second layer containingthe Ni-based catalyst, methane can be reformed with steam (923–1073 K) [50].
DK9448_C013.fm Page 243 Wednesday, March 29, 2006 7:13 AM
© 2006 by Taylor & Francis Group, LLC

244 Alcoholic Fuels
CATALYSTS FOR AUTOTHERMAL STEAM REFORMING
As mentioned above, one possibility of operation with a more favorable energeticbalance is under autothermal steam reforming conditions, which are produced byintroducing oxygen in the reaction mixture. As has occurred for hydrocarbonsand methanol feedstock [5,51], research is now under way to develop catalyststhat control the oxidation process through the combining of catalytic partialoxidation and steam reforming of ethanol. The oxidizing environment reducesthe carbon poisoning of the catalyst and could promote the decomposition ofintermediate molecules such as ethylene and acetaldehyde. On the other hand,an excess of oxygen leads to a strong reduction of hydrogen as reaction product.In this respect, studies under partial oxidation conditions could contribute to abetter knowledge of autothermal ethanol steam reforming. Some studies on cat-alytic behavior of Ni- [52], Pt- [53] and Ru-based [54] catalysts have recentlybeen reported.
In autothermal conditions, reports concerned the use of Ni and Cu catalysts[38–40,55] and promoted noble metals supported on highly stable carriers, i.e.,Pt-CeO2-La2O3/Al2O3 [13], Rh/CeO2 [14], Rh/Al2O3 [56]. The main role of pro-moters is related in this case to metal-promoter interactions [13], which affectthe adsorption-decomposition of ethanol to CH4 and CO and their subsequentreforming with steam to produce H2. Most of the results reported point to theneed to operate in a narrow range of water/oxygen/ethanol ratios to achieve 100%ethanol conversion, maximum hydrogen yield and minimum methane and carbonmonoxide production.
PERSPECTIVES
As we have mentioned above, one difficulty to be overcome for the practical andextensive use of biomass-derived ethanol as a hydrogen source to fuel-cell systemsis supplying the energy needed to distill and/or vaporize the H2O/ethanol mix-tures, and that related to the endothermicity of the steam reforming reaction.
Recently, Dumesic and coworkers have shown that methanol, ethylene glycol,glycerol, and sorbitol can be reformed in the aqueous phase to H2 and CO2 attemperatures near 500 K and at pressures between 15–50 bar [57–59]. On thebasis of these studies, the reforming of ethanol in the aqueous phase appears asa new approach to be considered for the production of H2 from ethanol reforma-tion. This process would have several advantages over steam reforming: i) it doesnot need energy to vaporize alcohol and water before the reaction; ii) the operatingtemperatures and pressures are suitable for the water–gas shift reaction, so it maybe possible to generate hydrogen with low amounts of CO in a single step; andiii) the step of H2 purification or CO2 separation is simplified because of thepressure range of the effluent.
Another possibility that merits greater study is the operation under autother-mal conditions with ethanol/water/air mixtures. Here, the goal is to maximize thehydrogen yield, while minimizing the total combustion and the formation of
DK9448_C013.fm Page 244 Wednesday, March 29, 2006 7:13 AM
© 2006 by Taylor & Francis Group, LLC
Ethanol Reformation to Hydrogen 245
by-products and carbon deposits on the catalysts. For both steam reforming andoxidative steam reforming, future research is needed to develop more stable,active, selective, and inexpensive catalytic systems that operate under the requiredfinal experimental conditions.
Finally, the integration of the ethanol reformation in an energetically favoredtotal process is also an area, which, still in our day, remains to be completed froma technological point of view.
Efforts in the above-mentioned areas could lead to the practical use of ethanolas H2 supplier to generate clean electrical power in the not-so-distant future.
REFERENCES
1. Wheeler, C., Jhalani, A., Klein, E.J., Tummala, S. and Schmidt, L.D., The water-gas-shift reaction at short contact times, J. Catal., 233, 191–199, 2004.
2. Schumacher, N., Boisen, A., Dahl, S., Gokhale, A.A., Kandoi, S., Grabow, L.C.,Dumesic, J.A., Mavrikakis, M. and Chorkendorff, I., Trends in low-temperaturewater-gas shift reactivity on transition metals, J. Catal., 229, 265–275, 2005.
3. Comas, J., Laborde, M. and Amadeo, N., Thermodynamic analysis of hydrogenproduction from ethanol using CaO as a CO2 sorbent, J. Power Sources, 138,61–67, 2004.
4. Semelsberger, T.A., Brown, L.F., Borup, R.L. and Inbody, M.A., Equilibriumproducts from autothermal processes for generating hydrogen-rich fuel-cell feeds,Int. J. Hydrogen Energy, 29, 1047–1064, 2004.
5. Rostrup-Nielsen, J.R., Conversion of hydrocarbons and alcohols for fuel cells,Phys. Chem. Chem. Phys., 3, 283–288, 2001.
6. Rostrup-Nielsen, J.R. and Christiansen, L.J., Internal steam reforming in fuel cellsand alkali poisoning, Appl. Catal. A: General, 126, 381–390, 1995.
7. Fatsikostas, A.N., Kondarides, D.I. and Verykios, X.E., Production of hydrogenfor fuel cells by reformation of biomass-derived ethanol, Catal. Today, 75,145–155, 2002.
8. Cavallaro, S., Chiodo, V., Freni, S., Mondello, N. and Frusteri, F., Performanceof Rh/Al2O3 catalyst in the steam reforming of ethanol: H2 production for MCFC,Appl. Catal. A: General, 249, 119–128, 2003.
9. Assabumrungrat, S., Pavarajarn, V., Charojrochkul, S. and Laosiripojana, N., Ther-modynamic analysis for a solid oxide fuel cell with direct internal reforming fueledby ethanol, Chem. Eng. Sci., 59, 6015–6020, 2004.
10. Wanat, E.C., Venkataraman, K. and Schmidt, L.D., Steam reforming and water-gas shift of ethanol on Rh and Rh-Ce catalysts in a catalytic wall reactor, Appl.Catal. A: General, 276, 155–162, 2004.
11. Brown, L.F., A comparative study of fuels for on-board hydrogen production forfuel-cell-powdered automobiles, Int. J. Hydrogen Energy, 26, 381–397, 2001.
12. Ioannides, T., Thermodynamic analysis of ethanol processors for fuel cell appli-cations, J. Power Sources, 92, 17–25, 2001.
13. Navarro, R.M., Álvarez-Galván, M.C., Sánchez-Sánchez, M.C., Rosa, F. andFierro, J.L.G., Production of hydrogen by oxidative reforming of ethanol over Ptcatalysts supported on Al2O3 modified with Ce and La, Appl. Catal. B: Environ-mental, 55, 229–241, 2005.
DK9448_C013.fm Page 245 Wednesday, March 29, 2006 7:13 AM
© 2006 by Taylor & Francis Group, LLC
246 Alcoholic Fuels
14. Deluga, G.A., Salge, J.R., Schmidt, L.D. and Verykios, X.E., Renewable hydrogenfrom ethanol by autothermal reforming, Science, 303, 993–997, 2004.
15. Douvartzides, S.L., Coutelieris, F.A. and Tsiakaras, P.E., On the systematic opti-mization of ethanol fed SOFC-based electricity generating systems in terms ofenergy and exergy, J. Power Sources, 114, 203–212, 2003.
16. Douvartzides, S.L., Coutelieris, F.A., Demin, A.K. and Tsiakaras, P.E., Fueloptions for solid oxide fuel cells: a thermodynamic analysis, AIChE Journal, 49,248–257, 2003.
17. Ioannides, T. and Neophytides, S., Efficiency of solid polymer fuel cell operatingon ethanol, J. Power Sources, 91, 150–156, 2000.
18. Iwasa, N. and Takezawa, N., Reforming of ethanol. Dehydrogenation to ethylacetate and steam reforming to acetic acid over copper-based catalysts, Bull. Chem.Soc. Jpn., 64, 2619–2623, 1991.
19. Cavallaro, S. and Freni, S., Ethanol steam reforming in a molten carbonate fuelcell. A preliminary kinetic investigation, Int. J. Hydrogen Energy, 21, 465–469,1996.
20. Somorjai, G., Introduction to Surface Chemistry and Catalysis, Wiley, New York,1994.
21. Llorca, J., Ramírez de la Piscina, P., Sales, J. and Homs, N., Direct production ofhydrogen from ethanolic aqueous solutions over oxide catalysts, Chem. Commun.,641–642, 2001.
22. Freni, S., Cavallaro, S., Mondello, N., Spadaro, L. and Frusteri, F., Steam reform-ing of ethanol on Ni/MgO catalysts: H2 production for MCFC, J. Power Sources,108, 53–57, 2002.
23. Goula, M.A., Kontou, S.K. and Tsiakaras, P.E., Hydrogen production by ethanolsteam reforming over a commercial Pd/g-Al2O3 catalyst, Appl. Catal. B: Environ-mental, 49, 135–144, 2004.
24. Llorca, J., Homs, N. and Ramírez de la Piscina, P., In situ DRIFT-mass spectrom-etry study of the ethanol steam-reforming reaction over carbonyl-derived Co/ZnOcatalysts, J. Catal., 227, 556–560, 2004.
25. Llorca, J., Homs, N., Sales, J., Fierro, J.L.G. and Ramírez de la Piscina, P., Effectof sodium addition on the performance of Co-ZnO-based catalysts for hydrogenproduction from bioethanol, J. Catal., 222, 470–480, 2004.
26. Guil, J.M., Homs, N., Llorca, J. and Ramírez de la Piscina, P., Microcalorimetricand infrared studies of ethanol and acetaldehyde adsorption to investigate theethanol steam reforming on supported cobalt catalysts, J. Phys. Chem. B, 109,10813–10819, 2005.
27. Cavallaro, S., Ethanol steam reforming on Rh/Al2O3 catalysts, Energy & Fuels,14, 1195–1199, 2000.
28. Frusteri, F., Freni, S., Spadaro, L., Chiodo, V., Bonura, G., Donato, S. and Cav-allaro, S., H2 production for MC fuel cell by steam reforming of ethanol overMgO supported Pd, Rh, Ni and Co catalysts, Catal. Commun., 5, 611–615, 2004.
29. Diagne, C.; Idriss, H.; Kiennemann, A. Hydrogen production by ethanol reformingover Rh/CeO2-ZrO2 catalysts, Catal. Commun., 3, 565–571, 2002.
30. Auprêtre, F., Descorme, C. and Duprez, D., Bio-ethanol catalytic steam reformingover supported metal catalysts, Catal. Commun., 3, 263–267, 2002.
31. Frusteri, F., Freni, S., Chiodo, V., Spadaro, L., Bonura, G. and Cavallaro, S.,Potassium improved stability of Ni/MgO in the steam reforming of ethanol forthe production of hydrogen for MCFC, J. Power Sources 132, 139–144, 2004.
DK9448_C013.fm Page 246 Wednesday, March 29, 2006 7:13 AM
© 2006 by Taylor & Francis Group, LLC

Ethanol Reformation to Hydrogen 247
32. Fatsikostas, A.N., Kondarides, D.I. and Verykios, X.E., Steam reforming of bio-mass-derived ethanol for the production of hydrogen for fuel cell applications,Chem. Commun., 851–852, 2001.
33. Fatsikostas, A.N. and Verykios, X.E., Reaction network of steam reforming ofethanol over Ni-based catalysts, J. Catal., 225, 439–452, 2004.
34. Frusteri, F., Freni, S., Chiodo, V., Spadaro, L., Di Blasi, O., Bonura, G. andCavallaro, S., Steam reforming of bio-ethanol on alkali-doped Ni/MgO catalysts:hydrogen production for MC fuel cell, Appl. Catal. A: General, 270, 1–7, 2004.
35. Mariño, F., Baronetti, G., Jobbagy, M. and Laborde, M., Cu-Ni-K/g -Al2O3 sup-ported catalysts for ethanol steam reforming. Formation of hydrotalcite-type com-pounds as a result of metal-support interaction, Appl. Catal. A: General, 238,41–54, 2003.
36. Mariño, F.; Boveri, M.; Baronetti, G.; Laborde, M. Hydrogen production fromsteam reforming of bioethanol using Cu/Ni/K/g-Al2O3 catalysts. Effect of Ni. Int.J. Hydrogen Energy, 26, 665–668, 2001.
37. Mariño, F.J., Cerrella, E.G., Duhalde, S., Jobbagy, M. and Laborde, M.A., Hydro-gen from steam reforming of ethanol. Characterization and performance of copper-nickel supported catalysts, Int. J. Hydrogen Energy, 23, 1095–1101, 1998.
38. Klouz, V., Fierro, V., Denton, P., Katz, H., Lisse, J.P., Bouvot-Mauduit, S. andMirodatos, C., Ethanol reforming for hydrogen production in a hybrid electricvehicle: process optimisation, J. Power Sources, 105, 26–34, 2002.
39. Fierro, V., Klouz, V., Akdim, O. and Mirodatos, C., Oxidative reforming of biomassderived ethanol for hydrogen production in fuel cell applications, Catal. Today,75, 141–144, 2002.
40. Fierro, V., Akdim, O. and Mirodatos, C., On-board hydrogen production in ahybrid electric vehicle by bio-ethanol oxidative steam reforming over Ni and noblemetal based catalysts, Green Chemistry 5, 20–24, 2003.
41. Haga, F., Nakajima, T., Miya, H. and Mishima, S., Catalytic properties of sup-ported cobalt catalysts for steam reforming of ethanol, Catal. Lett., 48, 223–227,1997.
42. Llorca, J., Homs, N., Sales, J. and Ramírez de la Piscina, P., Efficient productionof hydrogen over supported cobalt catalysts from ethanol steam reforming, J.Catal., 209, 306–317, 2002.
43. Llorca, J., Ramírez de la Piscina, P., Dalmon, J.A. and Homs, N., Transformationof Co3O4 during ethanol steam-reforming activation process for hydrogen produc-tion, Chem. Mater., 16, 3573–3578, 2004.
44. Llorca, J., Dalmon, J.-A., Ramírez de la Piscina, P. and Homs, N., In situ magneticcharacterisation of supported cobalt catalysts under steam-reforming of ethanol,Appl. Catal. A: General, 243, 261–269, 2003.
45. Llorca, J., Ramírez de la Piscina, P., Dalmon, J.-A., Sales, J. and Homs, N., CO-free hydrogen from steam-reforming of bioethanol over ZnO-supported cobaltcatalysts, Effect of the metallic precursor, Appl. Catal. B: Environmental, 43,355–369, 2003.
46. Idriss, H., Ethanol reactions over surfaces of noble metal/cerium oxide catalysts,Platinum Metals Rev., 48, 105–115, 2004.
47. Liguras, D.K., Kondarides, D.I. and Verykios, X.E., Production of hydrogen forfuel cells by steam reforming of ethanol over supported noble metal catalysts,Appl. Catal. B: Environmental, 43, 345–354, 2003.
DK9448_C013.fm Page 247 Wednesday, March 29, 2006 7:13 AM
© 2006 by Taylor & Francis Group, LLC

248 Alcoholic Fuels
48. Breen, J.P., Burch, R. and Coleman, H.M., Metal-catalysed steam reforming ofethanol in the production of hydrogen for fuel cell applications, Appl. Catal. B:Environmental, 39, 65–74, 2002.
49. Diagne, C., Idriss, H., Pearson, K., Gómez-García, M.A. and Kiennemann, A.,Efficient hydrogen production by ethanol reforming over Rh catalysts. Effect ofaddition of Zr on CeO2 for the oxidation of CO to CO2, CR Chimie, 7, 617–622,2004.
50. Galvita, V.V., Semin, G.L. Belyaev, V.D., Semikolenov, V.A., Tsiakaras, P. andSobyanin, V.A., Synthesis gas production by steam reforming of ethanol, Appl.Catal. A: General, 220, 123–127, 2001.
51. Peña, M.A., Gomez, J.P. and Fierro, J.L.G., New catalytic routes for syngas andhydrogen production, Appl. Catal. A: General, 144, 7–57, 1996.
52. Liguras, D.K., Goundani, K. and Verykios, X.E., Production of hydrogen for fuelcells by catalytic partial oxidation over structured Ni catalysts, J. Power Sources,130, 30–37, 2004.
53. Mattos, L.V. and Noronha, F.B., Partial oxidation of ethanol on supported Ptcatalysts, J. Power Sources, 2005, in press.
54. Liguras, D.K., Goundani, K. and Verykios, X.E., Production of hydrogen for fuelcells by catalytic partial oxidation of ethanol over structured Ru catalysts, Int. J.Hydrogen Energy, 29, 419–427, 2004.
55. Velu, S., Satoh, N., Gopinath, Ch.S. and Suzuki, K., Oxidative reforming of bio-ethanol over CuNiZnAl mixed oxide catalysts for hydrogen production, Catal.Lett. 82, 145–152, 2002.
56. Cavallaro, S., Chiodo, V., Vita, A. and Freni, S., Hydrogen production by auto-thermal reforming of ethanol on Rh/Al2O3 catalyst, J. Power Sources, 123, 10–16,2003.
57. Cortright, R.D., Davda, R.R. and Dumesic, J.A., Hydrogen from catalytic reform-ing of biomass-derived hydrocarbons in liquid water, Nature, 418, 964–967, 2002.
58. Huber, G.W., Shabaker, J.W. and Dumesic, J.A., Raney Ni-Sn catalyst for H2
production from biomass-derived hydrocarbons, Science, 300, 2075–2077, 2003.59. Davda, R.R., Shabaker, J.W., Huber, G.W., Cortright, R.D. and Dumesic, J.A., A
review of catalytic issues and process conditions for renewable hydrogen andalkanes by aqueous-phase reforming of oxygenated hydrocarbons over supportedmetal catalysts, Appl. Catal. B: Environmental, 56, 171–186, 2005.
DK9448_C013.fm Page 248 Wednesday, March 29, 2006 7:13 AM
© 2006 by Taylor & Francis Group, LLC

249
14
Ethanol from Bakery Waste: The Great Provider for Aquaponics?
Robert Haber
One Accord Food Pantry, Inc.Troy, New York
CONTENTS
Introduction .......................................................................................................250The Project — Phase 1 .....................................................................................251
Alcohol Fuel..........................................................................................251Municipal Solid Waste (MSW) Fuel — Wood and Cardboard ...........251
Carbon-Cycle Neutral..................................................................251Procedure .....................................................................................252Potential Savings .........................................................................252
Aquaponics............................................................................................252Fish Produced ..............................................................................253Auto-Feeders................................................................................253Roof of the Structure...................................................................254Floor of the Structure ..................................................................254Balanced Diet ..............................................................................255Efficient Use of Water .................................................................255Power Generation ........................................................................255Potential Yield..............................................................................255Smaller Family-Sized Unit..........................................................256Bacteria Production .....................................................................256
Fish Feed Formulation ..........................................................................256Fish Hatchery and Seedling Greenhouse .............................................257
Hatchery.......................................................................................257Greenwater System......................................................................258Seedling Greenhouse ...................................................................258
Energy Plantation ..................................................................................258Compost ................................................................................................259
DK9448_C014.fm Page 249 Wednesday, March 29, 2006 7:18 AM
© 2006 by Taylor & Francis Group, LLC
250
Alcoholic Fuels
Processing..............................................................................................259Technology Transfer — Website ..........................................................260
The Project — Phase 2 .....................................................................................260Abundance of Biomass .........................................................................260Saving Family Farms ............................................................................261Food Imported into the Northeast ........................................................261Reserve Food Supply ............................................................................261Energy Plantation ..................................................................................262Growth of Fish Feed from Plant Sources.............................................262Compost-Based Aquaponic Greenhouses.............................................263
Using Vertical Space — Potatoes in Scrap Tires and Strawberries .................................................................................263
References .........................................................................................................264
INTRODUCTION
The evolution of this project took a period of over 20 years. Originating in thepre-Reagan era of what we once thought were high gasoline prices, the conceptwas to simply make ethanol for electric or transportation use and feed the by-products to pigs and chickens. This still left remaining waste to manage, however.With the change of politics and policies, all federal grants for alcohol researchwere cancelled. As a result, the concept went unfulfilled for 20 years. But theworld is a different place now. Today, the concept has evolved to design andimplement a zero-discharge, closed, recirculating, environmentally isolated sys-tem, which produces microelement-enhanced, high-quality protein food usingmunicipal solid waste as a source for nonpetroleum power generation. Afterhaving been the 13-year director of a rural food pantry, which met the emergencyfood needs of over 40,000 rural needy a year (half of whom were children), Ienjoyed a unique perspective of the massive amounts of food waste that arediscarded daily, especially breads and bakery sweets. As a resource for thisproject, the huge quantity of useable bakery waste was staggering and dictatedthe type of fuel to be made. At issue for the project were not only the need togenerate heat and electricity, but also the need to have an ingredient base for on-site manufactured fish feed. These three expenses (heat, electric, and feed) com-prise the bulk of all operating expenses associated with the long-term success orfailure of the project. Reducing or eliminating these expenses would then enhancethe economic viability and potential success of the project. Of critical importancewere the ingredients for the feed, since it was the only nutrient input into thesystem for both fish and plants. Only one type of fuel met all three needs —ethanol — and in particular, ethanol from bakery waste. Additionally, and for thepurposes of this project, were the by-products of fermentation (carbon dioxideand DDGS (distillers dried grains and solubles)) and combustion (carbon dioxideand water vapor). The following is an in-depth description of the project.
DK9448_C014.fm Page 250 Wednesday, March 29, 2006 7:18 AM
© 2006 by Taylor & Francis Group, LLC
Ethanol from Bakery Waste: The Great Provider for Aquaponics?
251
THE PROJECT
—
PHASE 1
The first phase of this project is composed of the following subsystems:
1. Alcohol fuel.2. Solid MSW fuel — wood and cardboard. 3. Aquaponics.4. Fish feed formulation.5. Fish hatchery. 6. Energy plantation. 7. Compost.8. Processing.9. Technology transfer — website.
A
LCOHOL
F
UEL
One greenhouse (50
|
×
156
|
) will be used to house the alcohol fuel productionequipment and fish feed equipment. It will be located separately from the aqua-ponic greenhouses. Site preparation has been completed for this greenhouse, aswell as water supply and electric transmission lines. The water supply is from adeveloped artesian well, which will have its capacity expanded. The project willuse bakery waste as the feedstock for alcohol since it is so plentiful locally. Afterpackaging is removed, the production of fuel will follow these steps: A) the bakerywaste is passed through a standard garden chipper-shredder, B) the shreddedbakery waste is mixed with hot water in a tank, C) a liquefication enzyme isadded and the mixture is boiled for about 20 minutes — this enzyme preventsthe slurry from jelling, D) the mash is cooled to 140°F and a saccharificationenzyme is added. It is held at this temperature for another 20 minutes. Thesaccharification enzyme converts starch to sugar, E) once starch conversion iscomplete, the mash is cooled to 90°F, adjusted for optimum yeast activity tooccur (Ph and brix), and distillers yeast is added. A vapor lock is installed toeliminate contamination of the ferment by airborne putrescent bacteria. CO
2
iscaptured at this stage, F) when yeast activity stops — from 3–5 days — theferment is filtered to remove solids, and G) the clear liquid beer is now ready fordistillation. Once distilled and denatured, it is ready for the microturbine togenerate electricity and heat for the greenhouses. The solids that are generatedwill be mixed with other components, pelletized, and used as the base for fishfeed. Packaging is sorted, compressed, and sold as scrap, or used as directcombustibles.
M
UNICIPAL
S
OLID
W
ASTE
(MSW) F
UEL
—
W
OOD
AND
C
ARDBOARD
Carbon-Cycle Neutral
Two types of potential fuels (cardboard and wood) are presently a major part ofthe Municipal Solid Waste (MSW) stream, and comprise approximately 45.8%
DK9448_C014.fm Page 251 Wednesday, March 29, 2006 7:18 AM
© 2006 by Taylor & Francis Group, LLC
252
Alcoholic Fuels
of all MSW composition (1). These green energy fuels are organic in origin andrenewable in nature; therefore, they are carbon-cycle neutral, i.e., since they arecomposed of former living plant tissue, when used as fuel for heat or convertedto alcohol fuel for electric generation, they do not add to greenhouse gasses orcarcinogens to the environment. The carbon dioxide that is emitted is used bythe next generation of growing plants to store energy; therefore, the carbon cycleis stabilized through their use. Petroleum fuels add carbon dioxide to the cycle,which has been sequestered and removed from the cycle for millennia.
Procedure
Wood and cardboard will be removed from the waste stream at the source. Theproject will utilize nonrecyclable cardboard and wood as direct combustible fuel.Compressed, baled, and placed on a pallet for ease of handling, nonrecyclablecardboard and other solid combustibles will be fed directly into a speciallydesigned outdoor furnace that generates 1,000,000 BTUs per hour. Ash generatedis rich in boron, an element normally deficient in New England soils. It will beincorporated into compost.
Potential Savings
As an example of the potential savings to be realized from utilizing these twoforms of MSW, the BTUs in just one 500-pound bale of cardboard (at 8200BTUs/lb) are equal to the BTUs in 29.7 gallons of #2 home heating oil (at 138,000BTUs/gallon). Given the fact that one barrel (42 gallons) of crude oil only yields9.2 gallons of home heating oil or diesel (2), the savings from using one ton ofcardboard is the equivalent heating oil yield from 12.92 barrels of crude oil. Thereare approximately 7500 BTUs in one pound of wood. Given the above informa-tion, the project will be a net reducer of MSW that will contribute to the overallreduction of landfill mass.
A
QUAPONICS
Aquaponics is the joining together of two food-producing systems, aquaculture(food fish farming) and hydroponics (soilless vegetable farming). When thesetwo systems are joined, they form a symbiotic relationship with each other (eachbenefits from the other). Fish breathe in the same water in which they eliminate,creating an overabundance of ammonia waste and a deficiency of oxygen. If theoxygen is not replaced and the ammonia waste not removed, the fish will die.Using the effluent from the fish tanks to grow plants does two things: first, theplants remove the nitrogenous wastes from the water through their roots and useit for growth, second, the clean water is then oxygenated and returned to the fishtank. The only nutrient input into the system is fish feed. The dimensions for theconcrete grow-out tank are 4
|
high, 20
|
wide and 60
|
long. This tank has thecapability to produce 1 metric ton of fish weekly (2200 pounds), and will carryan average of 18,000 pounds of fish at all stages of growth. The tank is a modified
DK9448_C014.fm Page 252 Wednesday, March 29, 2006 7:18 AM
© 2006 by Taylor & Francis Group, LLC
Ethanol from Bakery Waste: The Great Provider for Aquaponics?
253
raceway, which is folded back on itself, i.e., it is a 10
|
wide raceway folded back,which now makes it 20
|
wide with a divider in the middle. The water flow isstraight through. The return from the grow beds enters on the right side of thetank and flows all the way around to exit on the left side, carrying solid wasteswith it. A 2
| |
recess in the tank floor on the left side allows the solids to accumulateand be pumped to the grow beds. Insulated plumbing will connect the tanks tothe aquaponic grow beds in other parts of greenhouse. These beds use pea gravelas a growing medium and measure 4
|
×
8
|
×
1
|
, and are elevated to hip height,eliminating stooping. These beds are required to provide adequate biofiltrationfor the fish tank and will provide approximately 9888 square feet of plant growingarea. The surface of the gravel will provide growing space for nitrifying bacteria,which convert the fish wastewater to a useable form for the growing plants toabsorb. The growing beds, therefore, act as a biofilter to cleanse the water forthe fish and the fish provide nutrients for the plants, which are so stimulating tothe plants that days-to-maturity are often reduced by 1/3 to 1/2. The grow bedsare flooded to 1
| |
beneath the top surface of the gravel every hour for 3–5 minutes.The water is then drained by gravity into the sump tanks and pumped back intothe fish tank. Project research has not discovered any explanation for this astound-ing growth rate, so it remains a mystery. However, empirical evidence is veryreal as observed by the effect on field-grown red raspberries (the reader is invitedto see picture documentation on pantry homepage at: www.oneaccordfoodpan-try.org and specific weeds, i.e., Queen Anne’s Lace — or wild carrot, nettles, andgoldenrod — which attained heights of approximately 9
|
. The effect was alsoevident on strawberries which reached hipheight and had stems as thick as one’slittle finger.
Fish Produced
The type of fish the project will use are tilapia. They are a very forgiving fish,adaptable to a wide range of environments. They are fecund (have lots of babies)and grow from birth to marketable size in 6 months. They are efficient users offeed (5 pounds of feed = 1 pound of fish). By contrast, beef requires 19 poundsof feed to produce 1 pound of gain. Tilapia are the answer to a hungry world.The flesh is mild and flavorful. They are mouth breeders (the mother carries theeggs in her mouth until they hatch) and a tropical fish that require warm water,so there is no danger of their “escape” from cultivation and contamination oflocal waterways.
Auto-Feeders
The fish finish tank will be equipped with auto-feeders, which hold a reserve offeed and are activated by hungry fish bumping a rod that projects down into thewater. When activated, it releases a small amount of pellets to the fish below. Thefish always have a supply of feed before them that is released on their demand.As a result, the feed is always fresh and overfeeding is reduced thereby enhancing
DK9448_C014.fm Page 253 Wednesday, March 29, 2006 7:18 AM
© 2006 by Taylor & Francis Group, LLC
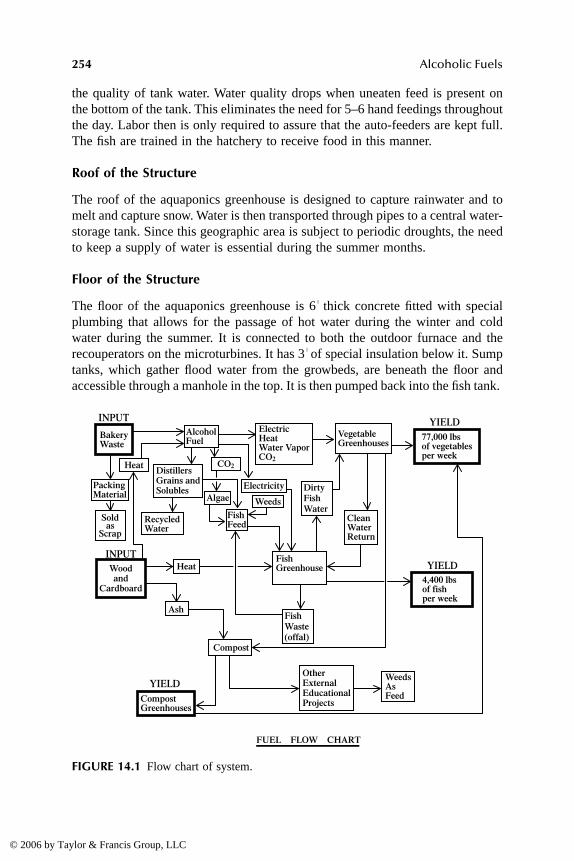
254
Alcoholic Fuels
the quality of tank water. Water quality drops when uneaten feed is present onthe bottom of the tank. This eliminates the need for 5–6 hand feedings throughoutthe day. Labor then is only required to assure that the auto-feeders are kept full.The fish are trained in the hatchery to receive food in this manner.
Roof of the Structure
The roof of the aquaponics greenhouse is designed to capture rainwater and tomelt and capture snow. Water is then transported through pipes to a central water-storage tank. Since this geographic area is subject to periodic droughts, the needto keep a supply of water is essential during the summer months.
Floor of the Structure
The floor of the aquaponics greenhouse is 6
| |
thick concrete fitted with specialplumbing that allows for the passage of hot water during the winter and coldwater during the summer. It is connected to both the outdoor furnace and therecouperators on the microturbines. It has 3
| |
of special insulation below it. Sumptanks, which gather flood water from the growbeds, are beneath the floor andaccessible through a manhole in the top. It is then pumped back into the fish tank.
FIGURE 14.1
Flow chart of system.
INPUT
INPUT
YIELD
YIELDBakeryWaste
PackingMaterial
FishGreenhouse
CleanWaterReturn
DirtyFishWater
FishWaste(offal)
Soldas
Scrap
Heat
Algae
FishFeed
CO2
Heat
Weeds
WeedsAsFeed
OtherExternalEducationalProjects
Electricity
Ash
Compost
CompostGreenhouses
77,000 lbsof vegetablesper week
YIELD4,400 lbsof fishper week
AlcoholFuel
ElectricHeatWater VaporCO2
VegetableGreenhouses
RecycledWater
DistillersGrains andSolubles
Woodand
Cardboard
FUEL FLOW CHART
DK9448_C014.fm Page 254 Wednesday, March 29, 2006 7:18 AM
© 2006 by Taylor & Francis Group, LLC

Ethanol from Bakery Waste: The Great Provider for Aquaponics?
255
Balanced Diet
Many types of plants can be grown in this system, if all of their cultural require-ments are met (light, heat, nutrients, and water). There are no weeds, so eachplant can reach its full potential. The beds are comfortable to work with sincethey are hip height and require no stooping. As such, the project can potentiallybe used to provide a complete diet. Initially, the project will produce lettuce,broccoli, tomatoes, parsley, oregano, basil, cucumbers, peppers, onions, swisschard, and spinach.
Efficient Use of Water
Whereas the aquaponics system is water-based, the system as a whole is veryefficient in the use of water to distribute nutrients. There is a small amount ofevaporation from the fish tanks and growbeds, but the majority of water usedgoes into plant and fish growth, i.e., the only water actually removed from thesystem is in the form of plant material and fish flesh.
Power Generation
The aquaponics greenhouse will have microturbines placed inside during thewinter to generate electricity. A microturbine is an aircraft engine that has beenminiaturized and turns an alternator. The turbines are inside because the exhaustfrom burning the alcohol fuel is composed of carbon dioxide and water vapor —at a temperature of around 1300°F. An 80-kw turbine will generate nearly 900,000BTUs per hour in its exhaust. The carbon dioxide “fertilizes” the air for the plants,increasing growth potential. The plants in turn release oxygen into the air. Each30
|
bay of the greenhouse will require approximately 40 kw of power for lightingduring the winter. The lighting is essential even on sunny days due to the lowangle of incidence of insolation (incoming solar radiation). The sunlight bouncesoff the roof of the structure and does not penetrate in enough candlepower tobenefit the plants. Without lights, there is a very real danger of nitrogen poisoningin green leafy vegetables grown inside. Heat and carbon dioxide levels will bemonitored continuously. Should either exceed acceptable limits, the exhaust fromthe microturbines will be switched to a recouperator — gathering excess heat —and then outside. The recouperator stores excess heat in the thermal mass of thefloor.
Potential Yield
Published results from researchers state that for every pound of fish produced,50–75 pounds of vegetables are produced (3). Our goal is 35 pounds of vegetables,and each tank has the ability to produce 2200 pounds of fish a week at fullcapacity (we have room for 2–3 tanks). The project can be duplicated nearlyanywhere in the world, and requires very little room. The yield from the
DK9448_C014.fm Page 255 Wednesday, March 29, 2006 7:18 AM
© 2006 by Taylor & Francis Group, LLC

256
Alcoholic Fuels
aquaponics system is enormous. Square foot for square foot, the yield is 15 timesthat of traditional soil farming, given the same period of time.
Smaller Family-Sized Unit
The project will convert a smaller 17
|
×
48
|
greenhouse to a family-sized unit byscaling down the commercial unit. It will contain a smaller tank capable ofproducing 200 pounds of fish and enough growbed room to accommodate thewaste from the fish. Additional growing area will be used for the growth of rootcrops in compost. The smaller unit will be able to meet the annual vegetable andfish needs for a family of 6. The technology will differ in this pilot project byusing whole kernel corn to heat the radiant floor, and used vegetable oil (UVOor WVO) to directly fuel a diesel-powered electric generator.
Bacteria Production
The project will generate a continuous supply of nitrifying bacteria for additionto the system on a weekly basis. Bacteria, which are an integral and critical partof the system, cannot be shipped during the winter since cold temperatures willkill them. The pantry has grown bacteria previously for its aquaculture project.Weekly additions of balanced bacteria to the system will guarantee a large andhealthy population of nitrifying bacteria within the system. Lack of bacteria willresult in the accumulation of lethal concentrations of ammonia and nitrites, whichcan kill fish in a matter of hours. The bacteria must be in balance, i.e., equallystrong populations. Since the two types of nitrifying bacteria grow at extremelydifferent rates, it is essential to allow enough time for the two populations toequalize to similar population density. Determining population density is throughdefault. Monitoring culture medium for ammonia, nitrite, and nitrate gives a veryaccurate indication of bacterial growth. All that is required for monitoring is awater quality test kit.
F
ISH
F
EED
F
ORMULATION
An important secondary benefit of generating alcohol fuel from bakery waste isthat the residual solids remaining after processing are largely the protein contentof the bakery waste in a concentrated form. Also, waste from fish processing canbe dehydrated and substituted for marine, or salt water fish meal, since the proteinsignature is identical to the fish being raised. Marine fish meal is becoming scarceand expensive due to the overharvesting of native fisheries. Feed components arenot a minor consideration in any type of aquaculture project, since feed costs canconstitute 35–90% of all production costs. When each tank is at full capacity,feed requirements will be about 900 pounds per day. Waste not appropriate forfeed will be composted. Some of this compost will be used during the summerfor the outdoor cultivation of common yet specific garden weeds that are rich innutrients for feeding fish. The carbon dioxide captured during fermentation willbe used in a “photobioreactor” for the growth of blue-green algae, which will
DK9448_C014.fm Page 256 Wednesday, March 29, 2006 7:18 AM
© 2006 by Taylor & Francis Group, LLC

Ethanol from Bakery Waste: The Great Provider for Aquaponics?
257
also be incorporated into fish feed. This algae will also be used to seed theGreenwater System for specific species of fish we intend to raise. Equipment forthe processing of fish feed will be situated in about 1/4 of the alcohol fuelgreenhouse. Drying will be accomplished through the use of commercial dehy-drators and formulation through the use of a hammermill, mixer, and pelletizer.It is the goal of the project to produce all the components of fish feed from plantsources. The only feed component input outside the project is kelp meal, whichsupplies vital microelements.
F
ISH
H
ATCHERY
AND
S
EEDLING
G
REENHOUSE
Hatchery
Tilapia are a tropical fish and require warm water. As a result, shipping fingerlingsduring the winter is extremely risky. Therefore, the project will produce all neededfingerlings on-site. The project will require from 1100 to 3300 fingerlings perweek. It can also act as a regional resource for others that require fingerlings aswell. The bulk of the equipment needed to breed these fingerlings is already inplace. Whereas the hatchery is somewhat labor intensive, it does guarantee acontinuous supply of fingerlings. The males are kept in tanks by themselves andthe females are brought to them to mate. Once mating has stopped and the femalehas a mouth full of eggs, the males are removed and the female is left alone andundisturbed to hatch her young (about 72 hours). After this time, the hatchlingswill remain in the mother’s mouth for another 3–7 days, taking short excursionsoutside to feed on minute particulates and then dart back inside. At a timedetermined by the mother, she spits them all out and she will accept feed again.When this occurs, she is removed to an isolation tank and full fed until she regainsweight. She is then ready to breed again. The particular variety of tilapia to beused is patented and produces all males (males grow 40% faster than females),which are a bright red in color. They are a very forgiving fish, adaptable to manydifferent cultural conditions and, from past experience with them, quite easy tobreed and raise. Presently, there is enough room for future expansion to otherspecies, i.e., giant Australian Red Claw crawfish (
Cherax quadricarinatus
— alobster-sized crawfish that lives in fresh water), giant freshwater prawns (
macro-braccium Rosenbergii
) which grow to one pound, and a variety of giant sunfish(bream), which grows to a weight of 5 pounds. All these species, except forsunfish, are tropical or subtropical and must be bred on-site to have a year-longsupply. The sunfish will remain isolated from the environment, since interbreedingwith native varieties will dilute their genetic uniqueness, resulting in muchsmaller, stunted fish. The hatchery will be connected to its own smaller aquaponicsgreenhouse, which will provide biofiltration and a use for the waste generatedfrom the hatchery. It will also add to the weekly harvest of vegetables. Breedingfish on-site will also enable the project to add genetics to its teaching curriculum.
DK9448_C014.fm Page 257 Wednesday, March 29, 2006 7:18 AM
© 2006 by Taylor & Francis Group, LLC
258
Alcoholic Fuels
Greenwater System
Both the prawns and crawfish go through a critical juvenile phase in their devel-opment. At this time, they become cannibalistic and will feed on each other.Molting is frequent, on the order of every 3–5 days, since the growth rate is sovery rapid during this stage of development. When they molt, they remain motion-less until the outer skin hardens into a new shell. But this immobility is a signalto other juveniles nearby that they are vulnerable. Before the shell hardens, theycan literally be torn to pieces. In a clearwater system, even with adequate hidingplaces, there is considerable loss. This is because they can see each other, andtheir appetites are so great at this time, they are almost continually hungry. Toaddress both of these causes for loss, the project will utilize a greenwater systemfor this stage of development. Greenwater is simply clearwater that has so muchalgae growing in it, that it becomes opaque and vision is limited to less than oneinch, which provides considerable concealment to molting individuals. It looksmuch like pea soup. The project will deliberately seed the greenwater systemwith spirulina, a very nutritious form of algae, high in protein and essential aminoacids in addition to vitamins, minerals, and microelements. Between feedings, itmakes an excellent snack for juveniles. Even though both of these species arecannibalistic in the juvenile phase, between feedings they will forage vigorouslyon algae, which are all around them. The algae then becomes a continuous supplyof high-quality feed — much the same as pasture for ruminants. There is nobiofiltration used in this rearing system, rather simple oxygenation. Spirulina actas biofilters by digesting spent feed and wastes from the juveniles for their growthand reproduction. Algae also add oxygen to the water, and remove carbon dioxide.Once past the juvenile stage, these species lose their cannibalistic tendencies andwill not return to them unless they are overcrowded and underfed.
Seedling Greenhouse
The seedling greenhouse is a smaller structure designed to provide replacementplants for those harvested in the aquaponics greenhouse. Very shortly after sprout-ing, the young plants are switched to being irrigated with fish tank effluent. Thisprovides the maximum growth potential in the shortest amount of time. This partof the project will be an extremely rich learning environment.
E
NERGY
P
LANTATION
The majority of the energy crops grown will be hybrid poplar and the projectwill utilize whole tree technology in the harvest and use of the trees. This meansthe entire tree is cut during the winter and processed into chips. The stump doesnot die — the root system is well established by this time — but rather the stumpsprouts new shoots, which are then trimmed to one central leader. Because of theextensive root system, the tree reaches its original size again in 3 years ratherthan 5 and is ready for harvest once more. At least one year will be needed toassess the potential of the property, but in particular to plant cover crops and
DK9448_C014.fm Page 258 Wednesday, March 29, 2006 7:18 AM
© 2006 by Taylor & Francis Group, LLC

Ethanol from Bakery Waste: The Great Provider for Aquaponics?
259
build soil fertility before planting energy crops. Given these restrictions, it willtake 5 years from planting before the project is able to harvest a first crop oftrees. Also, the project will be experimenting with salix (willow), alfalfa, andrapeseed (canola) crops during this 5–6 year lag in time. The project will alsoestablish fish grow-out tanks on this land. However, the effluent will be used toirrigate outdoor energy crops during the summer and only produce vegetablesduring the fall, winter, and spring. The heart of this phase of the project is thegasification unit, which converts crop residues, stems from hay, and wood chipsinto synthesis gas. Feedstock is placed in the unit, which heats it to about 1500degrees. The heat chamber is without oxygen so the feedstock will not burn, butrather give off a gas that is then filtered, cooled, and stored. This fuel cannot onlyprovide heat and electricity, but also used directly in an internal combustionengine. The unit can also produce alcohol fuel and diesel fuel, #2 home heatingfuel, and accommodate rubber tires as a feedstock. Excess heat from the operationof the gasifier will be used to dehydrate certain components for fish feed includingthe protein remains (DDGS — distillers dried grains and solubles) from thealcohol fuel project, vegetable waste and fish meal from the aquaponics projectand other experimental feeds such as duckweed.
C
OMPOST
Through normal daily operations, the project will generate a large quantity ofhigh-nutrient-level organic matter, i.e., vegetable trimmings, ash, leaves, grassclippings, and fish offal not suitable for feed. This material will be composted inspecially designed containers that conserve nutrients. It will then be tested andadjusted for nutrient balance and ph, and used in separate greenhouses for theproduction of root crops. Fish tank effluent will be used to irrigate these cropsas well. Since the effluent will not return to the tanks in this type of system, itwill be replaced with fresh water. However, the plant growth stimulating effectof the fish effluent will still be in force, resulting in vigorous growth of the plants.
P
ROCESSING
The fish sold will be processed into fillets to increase consumer sales appeal,although the project has potential customers presently who wish to purchase livefish. The project will process the fish in a specially designed portable unit.Processing will be done by special equipment that strips off all the scales fromthe fish and automatically fillets them. The equipment is very fast, using no morethan a few seconds to process each fish. All waste from this processing is savedand made into fish meal, another very important feed ingredient making theproject just that much more efficient. The need for marine, or salt water, fish mealis thereby eliminated and the protein signature of the meal is identical to therequirements of the fish being raised.
DK9448_C014.fm Page 259 Wednesday, March 29, 2006 7:18 AM
© 2006 by Taylor & Francis Group, LLC
260
Alcoholic Fuels
T
ECHNOLOGY
T
RANSFER
—
W
EBSITE
The Food Pantry has established a Web presence. During construction it will bepossible to tape record and follow along step by step and document just how thegreenhouses were sited, erected, equipped, and operated. As such, this will be asoup-to-nuts type of educational experience, giving students an in-depth pictureof the entire project. The Website will be upgraded to an interactive site withperiodic live teaching segments — broadcast directly from inside any of theoutbuildings live over the Internet through streaming video — which will enableviewers to ask questions in real time. The segments will be archived for down-loading as a reference and offered for sale in CD format for a modest fee. In thisway, the project can offer 1/2-hour teaching segments on every aspect of thesystem and from every location within the system through the use of a Web cam.Land lines will connect all the external buildings to project offices and computers.Everything then can be broadcast live over the Internet. A certain amount ofupgrading will be required to make the offices suitable for this purpose.
The project will be promoting the use of this system worldwide, and modifiedto meet almost any climatic conditions. Phase 2 of this project will address theadaptation of this system to differing worldwide climatic needs, and other sourcesof renewable and sustainable fuels to power the project according to those needs.Through the Web page and e-mail, the project would be able to act as a resourceto anyone anywhere in the world. Upon completion, it will be a powerful learningtool.
THE PROJECT
—
PHASE 2
Whereas the first phase of the project is primarily passive, i.e., simply recapturingwaste biomass, the second phase will actively demonstrate the culture, growth,harvest, and use of renewable biomass fuels — biomass here being defined asplants specifically grown for their fuel value. The project will also be conductingresearch into the production of oilseed crops specific to this geographic region— these crops can be directly converted into biodiesel, and used for either electricgeneration or transportation. Crops specifically grown for gasification includehybrid poplar, salix (willow), and alfalfa. Crop by-products that can be gasifiedinclude corn cobs, corn stover, sawdust, wood chips, and chipped brush. Non-crop items include rubber tires, plastic, and construction debris. Oilseed cropsinclude canola (rapeseed), soybeans, and corn. All energy crops will be irrigatedwith fish effluent with controls in place to determine the beneficial effect thiswaste product has on field-grown plants.
A
BUNDANCE
OF
B
IOMASS
To give some idea of the abundance of biomass, the energy content of all biomassfuels available today would produce an estimated 2740 Quads (one Quad equals1,000,000,000,000,000 BTUs) (4). Swedish physicist John Holmberg claims we
DK9448_C014.fm Page 260 Wednesday, March 29, 2006 7:18 AM
© 2006 by Taylor & Francis Group, LLC

Ethanol from Bakery Waste: The Great Provider for Aquaponics?
261
have no energy crisis. He believes that since human society’s energy use is onlyabout 1/13,000 of our daily solar income, the simple solution to the “crisis” isto harvest the abundance (5). That harvest is carried out day by day throughphotosynthesis, and stored in the form of biomass. This project then will uniteall of its other energy-dependent educational projects into a cohesive whole bydemonstrating the advantages of the local production of multiple-use biomassfuels.
S
AVING
F
AMILY
F
ARMS
The project has specifically chosen an agricultural application in the hopes thatsome of this information may be used by operating farms as a means to createadditional on-farm income or that it may encourage others to enter farming.Approximately 450 farms per year go out of business in New York State due tohigh energy costs and economic failure (6). With no remaining income, manyfarms fall prey to land developers, resulting in the loss of irreplaceable farmlandforever.
F
OOD
I
MPORTED
INTO
THE
N
ORTHEAST
It is extremely important to remember that even during the summer, when farmsin the Northeast are at peak production, the Northeast still imports 95% of itsfood. During the winter, this number increases to 98% (7). As a result, 95–98%of all money spent on food in the Northeast leaves the Northeast, creating atremendous cash flow out of region. At the same time, this represents a hugemarket that is virtually untapped by local growers. These local food producershave the advantage of not having to transport their product into the area. There-fore, promoting local production of food will save on the associated costs of long-distance hauling of food and the fuel associated with transportation. Environmen-tal impact will also be reduced as a result.
R
ESERVE
F
OOD
SUPPLY
Additionally, the reserve food supply for the entire Northeast (i.e., all the foodon supermarket shelves and in warehouses) will supply the food needs of itsinhabitants for only 3 days. This constitutes a terrible vulnerability for the entireregion, should anything such as terrorism interrupt this constant influx of food.This project, which promotes the decentralization of fuel production, encouragesthe expansion of local food production, and may potentially save family farms,will address all of these community problems.
The second phase of this project is composed of the following subsystems:
1. Energy plantation — gasification2. Growth of fish feed from plants3. Compost-based aquaponic greenhouses4. Duplication in inner cities
DK9448_C014.fm Page 261 Wednesday, March 29, 2006 7:18 AM
© 2006 by Taylor & Francis Group, LLC

262 Alcoholic Fuels
ENERGY PLANTATION
The plantation will consist of hybrid poplar trees (at 600 trees per acre) plantedin a “lawn” of Dutch white clover. During the first year of growth, the youngtrees can tolerate no competition from weeds and require irrigation in order tobecome established. The project will mow the “lawn” with a bagging commercialmower to remove the clippings, which will then be dehydrated and used as a basefor fish feed, or used to produce compost. Colonies of honeybees will be estab-lished to forage on the clover, since these plants produce an excellent water-whitehoney. As a result, the project will harvest 3 different crops from the same pieceof land. The trees are ready to harvest the 5th year and will regenerate toharvestable size every 3 years thereafter. One pound of hardwood chips generatesapproximately 7500 BTUs of energy and poplar contains about 60% of this value— or about 4500 BTUs per pound. This reduction in heat value is more thanoffset by the rapid growth and regeneration. Poplar also absorbs and stores morecarbon dioxide during growth than the wood gives off when used as a fuel source.Harvest will commence after leaf drop and when the ground is frozen to reduceturf damage. The project will use a feller/buncher to cut the trees, which are thenplaced in windrows. A self-propelled chipper reduces the entire tree into 2 | | orless sized chips — this size being optimal for the gasifier. Chips can then bestored in a silo that self-feeds directly into the gasifier. After this point the entiresystem is automatic and needs no operator — all that is required is a continuoussupply of feedstock (chips). At the heart of this phase is a gasification unit, whichheats and thermally degrades the biomass in a chamber devoid of oxygen. Thegas generated from this heating (pyrolysis) is extracted, filtered, cooled, andstored. It contains approximately 50% of the BTUs in natural gas and can beused for electric, heat generation, or transportation. The difference here is thatgasification can utilize so many other different feedstocks that are unsuitable forthe first phase. There is no exhaust from this process, since there is no activecombustion, as a result, there is no pollution. The “exhaust” is actually the gasproduced. The gasification unit can also be configured to produce methanol (woodalcohol), which is used in the conversion (transesterification) of raw and usedvegetable oil into biodiesel. It can also produce dimethylether (“DME”), a clean-burning replacement for diesel fuel, or #2 home heating fuel — depending onthe configuration. Solids and nutrient ash from wood biomass pyrolysis can beincorporated into compost as a bulking/nutrient agent. Inert solids remaining fromplastic and tire pyrolysis can be used for making asphalt paving products orconcrete blocks. The only feedstock under consideration that is not carbon-cycleneutral is plastic.
GROWTH OF FISH FEED FROM PLANT SOURCES
Excess heat generated from gasification can be captured and used for processheat in any application. Since there will be no edible residuals from gasification,fish feed will have to be produced in another manner. To this end, we will conduct
DK9448_C014.fm Page 262 Wednesday, March 29, 2006 7:18 AM
© 2006 by Taylor & Francis Group, LLC
Ethanol from Bakery Waste: The Great Provider for Aquaponics? 263
production and use trials with feeds ranging from alfalfa leaf, small grains, soy,corn, legume lawn clippings, algae (spirulina), and duckweed. The feed rationdoes not need to be complex, only complete. Field crops will be irrigated withfish effluent during the summer in a controlled test. The control will be plainwater and yields will be noted and recorded. All other parameters will be constant.
COMPOST-BASED AQUAPONIC GREENHOUSES
As vegetables are grown and sold, there will be a certain amount of waste plantparts — roots, stems, and trimmings — which will be composted along withgrass clippings, leaves, and other materials the project has available, includingthe ashes from the outdoor furnaces. Ashes are a rich source of boron — anelement lacking in most northeastern soils. The project will use the compost ina separate growing system that will allow for the growth of root crops in purecompost, and irrigated with fish tank water.
Using Vertical Space — Potatoes in Scrap Tires and Strawberries
In TowersPotatoes and strawberries lend themselves nicely to the use of vertical space.Potatoes especially can be grown in this manner using individual stacks of wastetires to contain the growing medium (compost) and provide room for the tubersto develop. The black of the tire absorbs heat and there is usually a heavy yield.Strawberries are a more economically advantageous crop as Louisiana StateUniversity has demonstrated. Grown in vertical stacks of pots, the university wasable to fit the equivalent of 10 acres of strawberries into a 6000-square-footgreenhouse. Total space for each tower is 1 square foot and the reported yield is32 pints from each tower. The growing medium is perlite and pine bark andnutrients can be supplied through either hydroponic or fish effluent fluids.
Food that Nourishes UsThrough the use of kelp meal and solar-evaporated sea salt as ingredients in thefish feed we make, we directly add microelements to the food we are producing.The microelements remain available to the plants since there is no leaching, asin the case with soil culture. New feed each day adds more microelements to thesystem and thereby maintains the availability for plants and fish alike. Differentvegetables have different micronutrient signatures that are made available to uswhen we eat these vegetables. Providing a broad range of micronutrients to theyoung growing plants gives each plant the opportunity to reach its full potentialmicronutrient signature. For instance, it is a commonly held belief that spinachhas iron in it — which it does. However, it has only 10% of the iron in it thanit had in 1948. As a result, you would need to eat 10 bowls of spinach today toequal the nutritional value of 1 bowl of spinach grown in 1948 (source: Internetsearch, Google, “bowl of spinach”).
Given the above information — which I have witnessed personally — it ismy belief that aquaponics — supported by green energy — will become a major
DK9448_C014.fm Page 263 Wednesday, March 29, 2006 7:18 AM
© 2006 by Taylor & Francis Group, LLC
264 Alcoholic Fuels
provider of high-micronutrient-content food, not only in northern climates, butalso in more temperate regions of the world, where wintertime heating andlighting are not a factor. In short, our breathless, visionless, juvenile, and (oh,call it not rabid) love affair with petroleum will not last forever. The resource issimply not infinite. Considering our enormous dependence on petroleum, if thelast barrel of oil were sold today, what would we do tomorrow?
REFERENCES
U.S. Environmental Protection Agency, Characterization of Municipal Solid Waste in theUnited States, 1996 update, Jun. 1997.
American Petroleum Institute, http://www.api.org/edu/factsoil.htm.S & S Aqua Farm, 8386 County Road 8820, West Plains, MO 65775, Design and Imple-
mentation Package. U.S. Department of Energy, http://www.eren.doe.gov/biopower/faqs.html.Gil Friend, http://www.eco-ops.com/eco-ops, 1997.New York State Department of Agriculture and Markets, Annual Bulletins,
http://www.nass.usda.gov/ny/annualbulletins.As remembered from a newsletter published by the Taskforce for Food and Farm Policy,
Albany, NY. Taskforce now defunct.
DK9448_C014.fm Page 264 Wednesday, March 29, 2006 7:18 AM
© 2006 by Taylor & Francis Group, LLC
265
15
Conclusion
Nick L. Akers
Akermin, Incorporated, St. Louis, Missouri
CONTENTS
Introduction .......................................................................................................265Statistical Highlights .........................................................................................265New Power Opportunities.................................................................................267Military..............................................................................................................269Large-Scale Power ............................................................................................269Conclusion.........................................................................................................269References .........................................................................................................270
Abstract
This chapter presents the author’s opinion on the drivers and need foralternative energy sources. First, global energy use is commented on, which servesas an indicator for available resources. In-depth commentary is provided on theopportunities for fuel cells as an alternative energy source, especially as a near-term potential replacement for rechargeable batteries. Potential for fuel cells inthe military and as large-scale power plants is also discussed.
INTRODUCTION
The need to fully develop alternative energy sources is apparent. The first fewyears of the new century have seen the highest energy prices in recent historydue to geographic isolation of the primary fuel and its finite supply. Coupled withinsatiable demand from emerging industrialized nations, such as China, energyhas arguably become the greatest stress factor in modern society. The presidentof the United States held his first prime-time address in over a year in April 2005to campaign for, among other things, the need for innovations in new sources ofenergy.
STATISTICAL HIGHLIGHTS
The U.S. Department of Energy’s
Annual Energy Review
, published September7, 2004, provides a wealth of statistics and research into the use, production, andavailability of energy throughout the world. The “holy grail” of alternative energy
DK9448_C015.fm Page 265 Wednesday, March 29, 2006 7:25 AM
© 2006 by Taylor & Francis Group, LLC

266
Alcoholic Fuels
sources is to address the use of petroleum since it accounts for 39.4% of energyconsumption followed by coal and natural gas, each accounting for 23.2% (Figure15.1) [1].
The presidential prime-time address was not purely political; the United Statesis by far the largest user of petroleum, followed by Japan whose consumption isquickly being surpassed by China’s budding development (Figures 15.2 and 15.3)[1].
FIGURE 15.1
Energy consumption by source.
Source
: Department of Energy, EnergyInformation Administration: Annual Energy Review, 2003. With permission.
FIGURE 15.2
Petroleum consumption by country.
Source
: Department of Energy, EnergyInformation Administration: Annual Energy Review, 2003. With permission.
45
30
15
0Geothermal,Solar, Wind
Hydro-electricPower
Wood,Waste,Alcohol
NuclearElectricPower
Natural GasCoal
0.533
8
2323
Petroleum
39
Qu
adri
llio
n B
tuBy Source, 2003
25
20
15
10
5
0SpainUnited
KingdomItalyMexicoFranceCanadaSouth
KoreaGermanyJapanUnited
States
1.51.71.92.02.02.12.22.7
5.3
19.8
Mill
ion
Bar
rels
per
Day
Selected OECD Consumers, 2002
DK9448_C015.fm Page 266 Wednesday, March 29, 2006 7:25 AM
© 2006 by Taylor & Francis Group, LLC
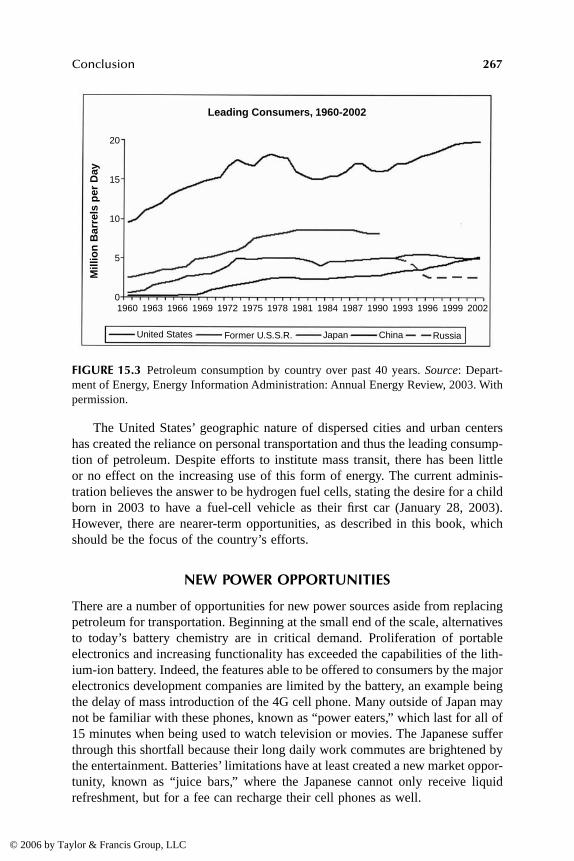
Conclusion
267
The United States’ geographic nature of dispersed cities and urban centershas created the reliance on personal transportation and thus the leading consump-tion of petroleum. Despite efforts to institute mass transit, there has been littleor no effect on the increasing use of this form of energy. The current adminis-tration believes the answer to be hydrogen fuel cells, stating the desire for a childborn in 2003 to have a fuel-cell vehicle as their first car (January 28, 2003).However, there are nearer-term opportunities, as described in this book, whichshould be the focus of the country’s efforts.
NEW POWER OPPORTUNITIES
There are a number of opportunities for new power sources aside from replacingpetroleum for transportation. Beginning at the small end of the scale, alternativesto today’s battery chemistry are in critical demand. Proliferation of portableelectronics and increasing functionality has exceeded the capabilities of the lith-ium-ion battery. Indeed, the features able to be offered to consumers by the majorelectronics development companies are limited by the battery, an example beingthe delay of mass introduction of the 4G cell phone. Many outside of Japan maynot be familiar with these phones, known as “power eaters,” which last for all of15 minutes when being used to watch television or movies. The Japanese sufferthrough this shortfall because their long daily work commutes are brightened bythe entertainment. Batteries’ limitations have at least created a new market oppor-tunity, known as “juice bars,” where the Japanese cannot only receive liquidrefreshment, but for a fee can recharge their cell phones as well.
FIGURE 15.3
Petroleum consumption by country over past 40 years.
Source
: Depart-ment of Energy, Energy Information Administration: Annual Energy Review, 2003. Withpermission.
20
15
10
5
019991996199319901987198419811978197519721969196619631960 2002
United States RussiaChinaJapanFormer U.S.S.R.
Mill
ion
Bar
rels
per
Day
Leading Consumers, 1960-2002
DK9448_C015.fm Page 267 Wednesday, March 29, 2006 7:25 AM
© 2006 by Taylor & Francis Group, LLC
268
Alcoholic Fuels
This, of course, is a temporary solution to an obvious problem: the need fornew portable power sources. Fuel cells have been studied for over 40 years as apotential battery replacement technology. With a potential $4-billion-plus lithiumbattery market takeover opportunity, there are a plethora of entities working todeliver portable fuel cells [2]. The Direct Methanol Fuel Cell (DMFC) hasprobably received the majority of attention in this area. Despite hundreds ofmillions in research and development dollars, in early 2005 there is no consumerproduct on the market. DMFC has applications and viability in other markets,but the size, cost, and performance requirements for rechargeable battery replace-ment have thus far proved insurmountable. New catalyst developments as wellas new membrane technology may push DMFCs over the hump to widespreadcommercialization; however, toxicity will remain a serious obstacle.
Enter the opportunity for fuels other than methanol in the portable batterymarket. Ethanol is the obvious choice because it is already widely available inday-to-day life and on airlines as well, a necessity. Additionally, ethanol hascertain chemical properties making it desirable as a fuel, such as higher energydensity than methanol while remaining a small enough molecule for good diffu-sion properties. As discussed in this book, innovations in catalysts are requiredto employ ethanol. Efficacy has been demonstrated; however, catalyst stabilityand operating temperature must still be addressed for metal-based systems.
Perhaps a previously considered fringe effort, now gaining momentum, is theuse of nontraditional catalysts, i.e., biological catalysts. The advantages are costsavings from elimination of precious metals, simplification of system design dueto high selectivity for analyte, dramatically increased fuel options, and efficientoperation at room temperature, among others discussed. Enzymes in particular,have the potential to compete (and in some cases already are competing) withDMFC and DEFCs and surpass their performance. It may be breakthroughs inthis area of research that ultimately enable commercial applications. Eliminationof PEMs, bipolar plates, and precious metal catalysts are significant advantages.
SOFC fuel cells have also had a resurgence of effort, most likely driven bymilitary interest. Advances in catalysts and insulating materials are showingpromise for portable applications, portable meaning 20-W systems.
Overall, it is the opinion of this author that the portable fuel cell effortemerged too early for its time. Hundreds of millions of dollars, if not billions,have been taken in by start-up companies through institutional, noninstitutional,and government sources over the past 10+ years with no product to show for it.The technology continues to suffer from essentially the same key hurdles that itdid since the start of effort. Many investors are losing interest and have becomecalloused to the excitement surrounding portable fuel cells. That is unfortunatebecause we are nearing the opportune time for this market. Key breakthroughsare on the verge of occurring, which will hopefully burst the bubble and pavethe way for commercial applications. Some venture firms recognize this oppor-tunity and are sticking with fuel cells in the belief that we are near the gold rush.
DK9448_C015.fm Page 268 Wednesday, March 29, 2006 7:25 AM
© 2006 by Taylor & Francis Group, LLC
Conclusion
269
MILITARY
Today’s military has become increasingly reliant on portable power to main-tain a devastating advantage over less sophisticated enemies. Vital communica-tions equipment, night-vision goggles, and weapon systems are being developedand deployed that require immense amounts of portable power available to theindividual soldier. Lieutenant Marc Lewis was quoted in Iraq in June 2003 stating,“If we run out of batteries, this war is screwed.” Soldiers are typically employingdisposable batteries and some rechargeables for their equipment. Batteries canaccount for up to 50 pounds of a soldier’s rucksack due to inability to rechargebatteries in the field. To reinforce the reliance on batteries, a 12-person SpecialForces team on a 30-day deployment can go through 3000 batteries at a cost of$350,000 [3]. Many of these batteries are only used for 10–20% of their capacitybefore being discarded. This may immediately seem wasteful but imagine stakingyour combative edge on being able to see at night or communicate with othertroops; one would much rather pop open a new battery than use one that was notfully charged.
Portable fuel cells could provide incredible advantages to the military. Ratherthan carrying a number of disposable or rechargeable batteries, a solider couldcarry a couple fuel cells and the fuel needed to refuel them as needed in the field.Additionally, because fuel cells can provide more energy for longer periods oftime than batteries, they could enable the next generation of electronic devicesfor the military to further enhance its combative advantage.
LARGE-SCALE POWER
Perhaps somewhat counterintuitive to the layperson, the first commercial fuelcells have been introduced for large-scale applications. Stationary power plantsare being installed all across the globe. As the cost of such systems decreasesand reliability increases, large-scale fuel cells will begin to be used for residentialpower. One fairly obvious operating concern is how to provide the fuel to resi-dential areas. It is doubtful that such systems would operate on direct hydrogen,just as the large-scale industrial fuel cells being used today do not. Possibilitiesinclude using natural gas or piping in other liquid fuels such as methanol orethanol using the existing infrastructure.
CONCLUSION
It would be hard for anyone to deny that energy is one of the most importantissues at the start of 21st century. Energy is at the root of the major conflicts ofour time as well as the catalyst for previously disadvantaged society’s emergenceinto modern culture. As energy demand increases at staggering rates, the murmurfor alternative energy technologies is quickly turning into a scream.
DK9448_C015.fm Page 269 Wednesday, March 29, 2006 7:25 AM
© 2006 by Taylor & Francis Group, LLC

270
Alcoholic Fuels
REFERENCES
1. U.S. Department of Energy, Energy Information Administration,
Annual EnergyReview
, 2003.2.
Darnell Group Report to the U.S. Fuel Cell Council
, Jan. 2003.3. Valdes, J.,
The World Congress on Industrial Biotechnology and Bioprocessing
,Orlando, FL, Apr. 21–23, 2004.
DK9448_C015.fm Page 270 Wednesday, March 29, 2006 7:25 AM
© 2006 by Taylor & Francis Group, LLC