EXPERIMENTAL PROCEDURE AND RESULTS TO …bouillot/publications/Duyen_et_al_2016.pdf · Mixed...
37
EXPERIMENTAL PROCEDURE AND RESULTS TO MEASURE THE COMPOSITION OF GAS HYDRATE, DURING CRYSTALLIZATION AND AT EQUILIBRIUM, FROM N 2 -CO 2 - CH 4 -C 2 H 6 -C 3 H 8 -C 4 H 10 GAS MIXTURES LE QUANG Duyen, LE QUANG Du, *BOUILLOT Baptiste, HERRI Jean-Michel Gas Hydrate Dynamics Centre, Ecole Nationale Supérieure des Mines de Saint-Etienne, Centre SPIN - LGF UMR CNRS 5307 158 Cours Fauriel, 42023 Saint-Etienne, France, GLENAT, Philippe, TOTAL S.A., CSTJF, Avenue Larribau, 64018 PAU Cedex, France DUCHET-SUCHAUX, Pierre TOTAL S.A., 2 place Jean Millier La Défense 6 92400 Courbevoie, France ABSTRACT Mixed Clathrate hydrates are an important issue in many fields, like flow assurance in the oil industry, as well as gas capture and storage, air conditioning, etc… Usually, studies of gas hydrates from hydrocarbon gas mixtures do not mention the volume of hydrate, nor the hydrate composition, and ternary or quaternary mixtures are not considered. Also, data involving propane and butane are limited. Therefore, we suggest both an experimental and modeling study of mixed clathrate hydrates from N 2 -CO 2 -CH 4 -C 2 H 6 -C 3 H 8 -C 4 H 10 gas mixtures, in temperature range of [0.8-19°C] and pressure range of [1.4 – 66bars]. The experimental work provides 78 equilibrium points. Two procedures were used to perform crystallizations. The main procedure (71 equilibrium data) corresponds to a method at high crystallization rate (high supersaturation, or high ΔP) . The first objective is to study the gas hydrates formation in usual dynamic conditions (start-up or reboot of an oil exploitation). The second method, 7 data, corresponds to a low rate of crystallization. This second objective is to investigate the impact of the speed of crystallization on the final equilibrium. For both procedures, P-T data are given, as well as the compositions of each phase at equilibrium. At last, thermodynamic modeling is used to compare the experimental results of both procedures. Kihara parameters of N 2 , CO 2 and CH 4 are taken from the literature, while parameters for C 2 H 6 are regressed and given in this work. Results show a better agreement of the thermodynamic modeling with experimental study for pure gas hydrate and mixed gas hydrates at low crystallization rate. This observation suggests that mixed gas hydrates might form at thermodynamic equilibrium only at low crystallization rate. Keywords: Clathrate hydrates, Experimental study, Thermodynamics, Phase equilibria * To whom correspondence should be addressed: [email protected]
Transcript of EXPERIMENTAL PROCEDURE AND RESULTS TO …bouillot/publications/Duyen_et_al_2016.pdf · Mixed...
EXPERIMENTAL PROCEDURE AND RESULTS TO MEASURE THE COMPOSITION
OF GAS HYDRATE, DURING CRYSTALLIZATION AND AT EQUILIBRIUM, FROM
N2-CO2- CH4-C2H6-C3H8-C4H10 GAS MIXTURES
LE QUANG Duyen, LE QUANG Du, *BOUILLOT Baptiste, HERRI Jean-Michel
Gas Hydrate Dynamics Centre, Ecole Nationale Supérieure des Mines de Saint-Etienne,
Centre SPIN - LGF UMR CNRS 5307
158 Cours Fauriel, 42023 Saint-Etienne, France,
GLENAT, Philippe,
TOTAL S.A., CSTJF, Avenue Larribau, 64018 PAU Cedex, France
DUCHET-SUCHAUX, Pierre
TOTAL S.A., 2 place Jean Millier La Défense 6 92400 Courbevoie, France
ABSTRACT
Mixed Clathrate hydrates are an important issue in many fields, like flow assurance in the oil
industry, as well as gas capture and storage, air conditioning, etc…
Usually, studies of gas hydrates from hydrocarbon gas mixtures do not mention the volume of
hydrate, nor the hydrate composition, and ternary or quaternary mixtures are not considered.
Also, data involving propane and butane are limited.
Therefore, we suggest both an experimental and modeling study of mixed clathrate hydrates from
N2-CO2-CH4-C2H6-C3H8-C4H10 gas mixtures, in temperature range of [0.8-19°C] and pressure
range of [1.4 – 66bars]. The experimental work provides 78 equilibrium points. Two procedures
were used to perform crystallizations. The main procedure (71 equilibrium data) corresponds to a
method at high crystallization rate (high supersaturation, or high ΔP). The first objective is to
study the gas hydrates formation in usual dynamic conditions (start-up or reboot of an oil
exploitation). The second method, 7 data, corresponds to a low rate of crystallization. This second
objective is to investigate the impact of the speed of crystallization on the final equilibrium. For
both procedures, P-T data are given, as well as the compositions of each phase at equilibrium.
At last, thermodynamic modeling is used to compare the experimental results of both procedures.
Kihara parameters of N2, CO2 and CH4 are taken from the literature, while parameters for C2H6
are regressed and given in this work.
Results show a better agreement of the thermodynamic modeling with experimental study for
pure gas hydrate and mixed gas hydrates at low crystallization rate. This observation suggests that
mixed gas hydrates might form at thermodynamic equilibrium only at low crystallization rate.
Keywords: Clathrate hydrates, Experimental study, Thermodynamics, Phase equilibria
* To whom correspondence should be addressed: [email protected]
1. Introduction
Gas hydrates, or clathrate hydrates, are components crucial components in many fields. Flow assurance
issue is probably the reason why they were so widely studied in the past decades [1]. Exploration and
exploitation of methane hydrate buried in permafrost and deep-sea is also a major issue [2], as well as gas
capture and storage (mainly CO2) [3].
Pipe-line plugging in the oil industry is the start of the study, brought by TOTAL SA about hydrocarbon
gas mixtures. Indeed, the interest for unconventional oil resources is growing (mainly in deep-offshore). In
this situation, hydrate risk is significant and has to be controlled (zero tolerance policy).
Therefore, to study the hydrate risk of formation, experimental data as well as thermodynamic modeling,
are essential. But, if gas hydrate from hydrocarbon gas mixtures has been widely studied, few data
involving propane and butane are available. Moreover, these studies do not provide the hydrate volume and
water consumption. Sometimes, a modelling approach is suggested using classic van der Waals and
Platteuw theory [4]. The use of such theory usually involves parameters, the so-called Kihara parameters.
However, these parameters are very dependent on the authors and on the quality of the experimental data
used (both equilibrium data and reference thermodynamic properties). We showed in a previous paper such
differences (ε/k from 165 to 175 for CO2 as example) [5]. This is why acquiring accurate and complete data
is an essential part of the modeling work. But, obtaining satisfying results can be tricky if hydrate
crystallization involve kinetic considerations.
In this work, gas hydrates from CO2-CH4-C2H6-C3H8-C4H10 gas mixtures are studied. To go further in
the experimental approach, the procedure used provides not only the measurement of the classic
Pressure/Temperature data at equilibrium, but also the hydrate composition and volume.
To evaluate the influence of the speed of crystallization on the final state, two procedures were used: at high
crystallization rate (high driving force, for example at the start-up of a well), and at low crystallization rate
(low driving force, corresponding to steady state exploitation). 12 Experiments were performed providing
78 equilibrium points. 71 data were obtained from quick crystallization, and 7 from slow crystallization
experiments.
In the end, experimental results were compared to the classic van der Waals and Platteuw model. Ethane
Kihara parameters needed to be calculated. Parameters of propane and butane could not be regressed from
pure gas hydrates.
2. Gas Hydrates
Gas hydrates, or clathrate hydrates, are ice-like crystalline compounds composed of molecules of water and
small molecules (usually gaseous at standard conditions). They present different polymorphic structures
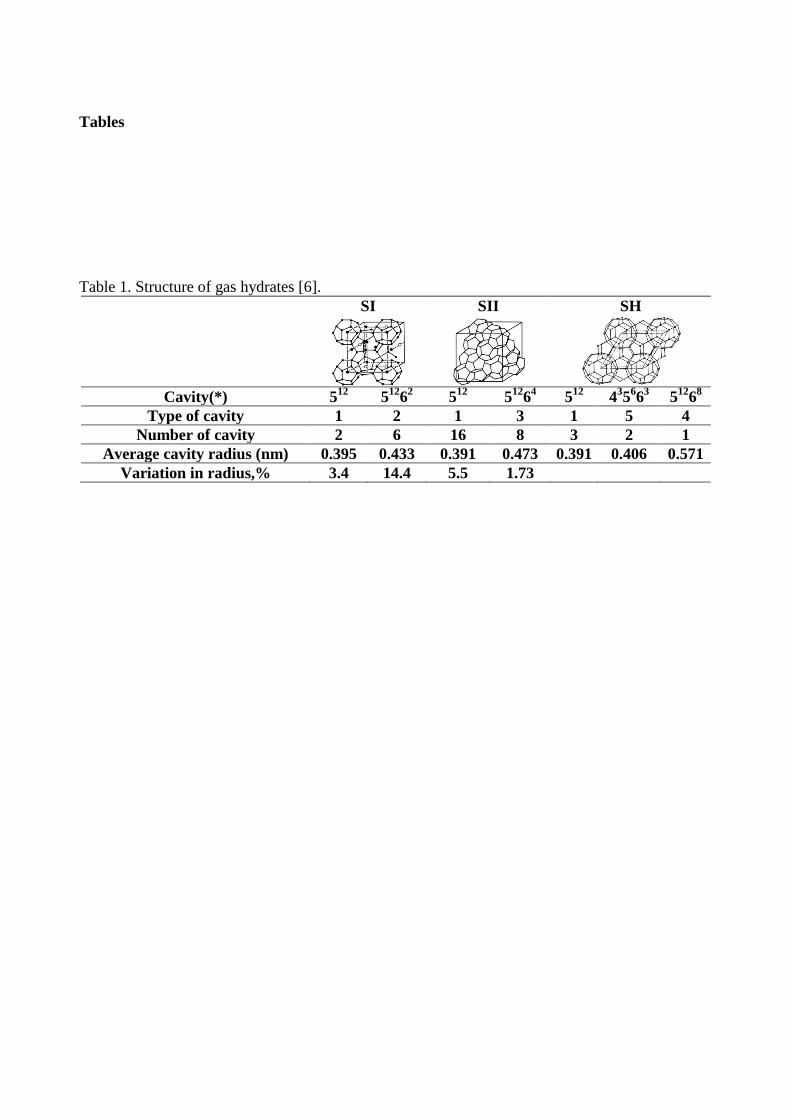
depending on the guest molecules. Three main structures were identified: SI, SII and SH ([6]). Table I
presents a brief description of classic clathrate hydrate structures.
These compounds may be formed at low temperature and high pressure. The liquid-hydrate phase diagrams
depend on the structure (I, II, H) and guest molecules, see figure 2 as example.
3. Materials and methods
3.1 Experimental set-up
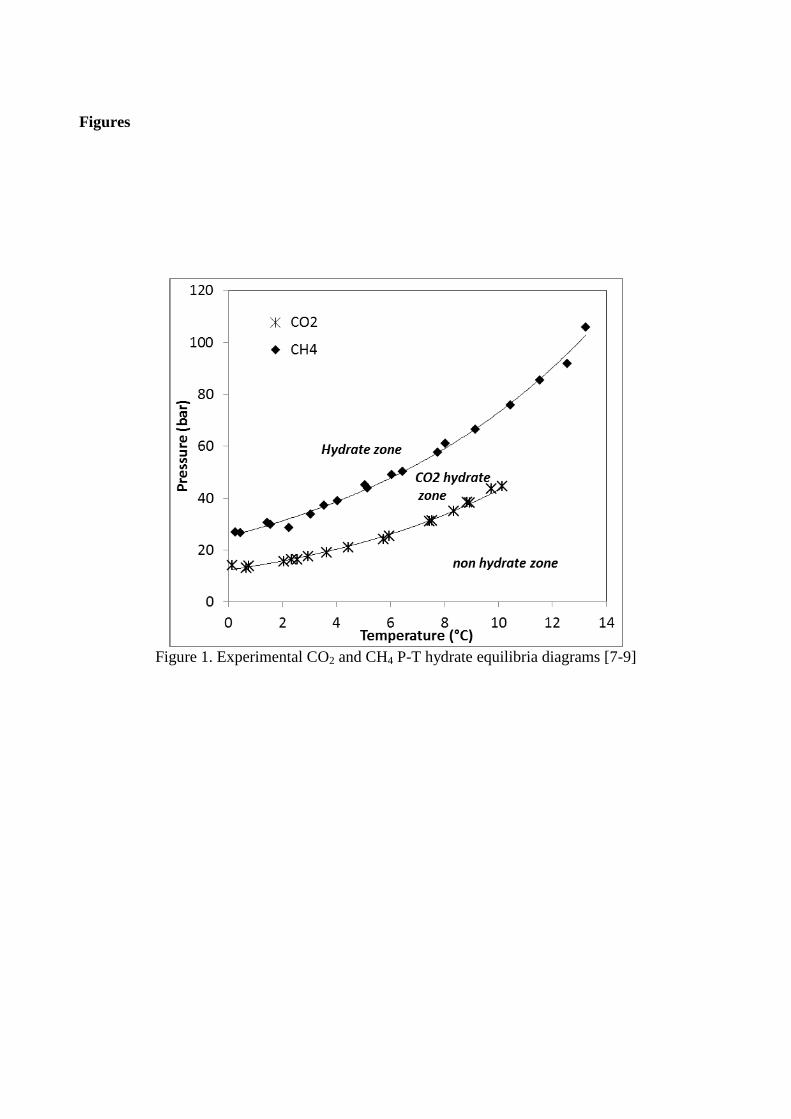
The experimental set-up (figure 2) allows the measure of hydrate equilibria. From temperature and pression
measurements, as well as gas and liquid sampling, the equilibrium state can be completely determined:
compositions and masses of each phase in the reactor. The apparatus composed of an instrumented batch
reactor (Autoclave, 2.36 L). This reactor is fed with pure gas, or prepared gas mixture. A HPLC pump
(JASCO-PU-1587) is used to inject the liquid phase (water + LiNO3, used as tracer for the determination of
the water concentration). A cryostat (HUBERT CC-505) keep a constant temperature in the reactor (0.02°C
accuracy), and two sapphire windows (12cm x 2cm) are placed on each sides of the reactor to keep an eye
on the crystallization. The reactor is stirred on the upper side (vapor phase) and lower side (liquid/hydrate
phase). The pressure, as well as the temperature on the upper/lower side, is monitored online with a data
acquisition system (Pt 100, accuracy 0.02°C, pressure accuracy 0.1 bar).
To determine the composition of each phase at equilibrium (by mass balance calculations), the gas phase
composition is sampled (ROLSITM
) and injected in a gas chromatograph (VARIAN model CP-3800 GC
with a 50m PORA BOND Q column). A few µm3 is taken each time. Helium is used a carrier gas in the
GC. The liquid phase is analyzed offline by ionic chromatography (DIONEX ionic exchange
chromatograph). A simple valve is used to sample the liquid phase (water + LiNO3).
3.2 Experimental procedure at high crystallization rate
The first experimental procedure is the same as in previous studies [5]. Figure 3 shows the crystallization
and dissociation process. This procedure is performed at high crystallization rate (or at a high
supersaturation). For gas hydrates this means high ΔP (or high ΔT).
At the begining, the reactor is cleaned and emptied (40 minutes). Then, the cell is filled with gas mixture,
either by direct injection of the pure gases or from a prepared bottle.
The pressure is measured, and the temperature is then set to 0-1°C (internal regulation of the cryostat). The
gas composition in the cell is checked with GC analysis at the beginning and before any measurement.
A 10 mL/L water mixture of LiNO3 is prepared and injected (about 800g) into the reactor thanks to a HPLC
pump (n°13). Ultrapure water is used (first category, 18.2 MΩ.cm). The LiNO3 is added as a tracer to
measure the water concentration, and thus the volume. A pressure rise, due to the added volume of liquid, is
observed. Then, the reactor is stirred at 450 rpm rate, on the upper and bottom side of the reactor. The gas is
dissolved into the liquid phase. After a while (induction time), the crystallization begins. Due to the
exothermicity of the reaction, a brief raise of temperature is observed. At this point, we wait for the
equilibrium to happen (stabilization of temperature and pressure). This takes about 2 to 4 days depending
on gas mixture and initial pressure. When the equilibrium is reached, a sample of the gas phase is taken and
injected into the gas chromatograph to determine the molar composition. A liquid sample is also taken to be
analyzed offline by ionic chromatography (about 4.5mg).
At this moment, the dissociation of the hydrate start. The temperature is increased of 1.5°C. When the new
equilibrium is reached (about 24h), new samples of the fluid phases are taken. Then, the process is repeated
until there is no more hydrates into the reactor. The whole procedure is summarized on figure 3. This
concerns gas mixtures n°1 to n°11 in table 2.
3.3 Experimental procedure at low crystallization rate
The objective of this second procedure is to focus on thermodynamic equilibrium, limiting as much as
possible kinetic effects. In this case, the crystallization rate is closer to hydrate formation in pipelines at
steady state (constant and low evolution of the pressure and temperature).
Only the last experiment (n°12, see table 2) is concerned. The aim is to investigate and give perspectives for
mixed hydrates equilibrium modeling (thermodynamics or kinetics?).
Figure 4 illustrates this method. Instead of decreasing very quickly the temperature to the final state
(between 0 and 2°C), the crystallization occurs close to the first liquid-hydrate equilibrium temperature.
Then, the temperature is decreased very slowly (about 0.1 to 0.2 °C per day). Every 1°C decreased, samples
of both gas and liquid phases are taken and analyzed.
3.4 Gas compositions
Studied gas compositions are given in table 2. There are 12 gas mixtures from N2-CO2-CH4-C2H6-C3H8-(n-
C4H10). Gases were provided by Air Liquid and Air Product (CO2 premium, impurities < 60ppm, nitrogen
premium impurities < 6ppm, methane 3.5, ethane 2.5, propane 3.5 and n-butane 3.5). These initial
compositions given in table 2 were determined by GC (n°9 on figure 2).
To prepare these gas mixtures, two methods were applied: For binary mixtures (gas 3 to 5), the mixtures
were prepared from pure gas directly connected to the reactor. The less volatile gas (CO2) was first injected
into the reactor. Then, the second one (N2 or CH4) was injected. The knowledge of the pressure after each
injection, and the use of the Soave-Redlich-Kwong (SRK) equation of state, allow the calculation of the
number of mole of each gas (and so the gas composition).
The second method used was a prior preparation of the mixtures. Bottles were prepared by injecting the
different pure gases, from the less volatile to the most volatile, and by weighting the bottle after each
injection. Molar composition was calculated from the knowledge of the injected mass of each gas. To
homogenize the mixtures, bottles were not used before a few days after the preparation.
A 20% margin from the vapor pressure was chosen in order to avoid any condensation in the gas cylinders
and in the reactor.
3.5 Phase Compositions
3.5.1 Mass balance
The calculation of the composition of each phase (superscripts G, L, and H for respectively the gas, the
aqueous phase and the hydrate) is a standard mass balance for each component j based on the experimental
measurements (Li+ concentration in the aqueous phase, pressure, temperature and gas composition):
𝑛𝑗0 = 𝑛𝑗
𝐺 + 𝑛𝑗𝐿 + 𝑛𝑗
𝐻 (1)
3.5.2 Gas phase calculation
The gas phase density (initial gas mixture, superscript 0, and at equilibrium) is calculated by the following
equation:
𝑃𝑉 = 𝑍(𝑃, 𝑇, 𝑧)𝑛𝐺𝑅𝑇 (2)
The compressibility factor Z is calculated using SRK Equation of State which. This equation is of
reasonable accuracy for the moderate pressures and gases used in these experiments [10]. The SRK
parameters used are given in table 3.
The gas composition z in the SRK equation is experimentally measured by GC. The initial volume of the
gas V0 is the volume of the reactor, VR (=2.36 L). The gas volume at the equilibrium is:
VG = VR – V
L – V
H (3)
The two last volumes are calculated thanks to the knowledge of the water concentration (see 3.5.3).
In the end, the SRK EoS allows the calculation of 𝑛𝑗0 and 𝑛𝑗
𝐺.
3.5.3 Liquid phase calculation
The liquid phase calculation is a three steps calculation:
- Calculation of the water mass (or volume) in the liquid phase,
- Calculation of the hydrates volume (water mass balance).
- Calculation of the vapor-liquid equilibrium.
Liquid volume is calculated with the LiNO3 concentration (added as tracer). This tracer is not involved in
the crystallization process, and the quantity of each ion remains constant in the aqueous phase. From the Li+
concentration (obtained by ionic chromatography), the liquid volume is deducted (conservation of Li+ ions
quantity):
𝑉𝐿 =𝑉0
𝐿[𝐿𝑖+]0
[𝐿𝑖+] (4)
Equation (4) gives the water mass in the liquid phase, as well as the mass of water in the hydrate phase
(mass balance). Note: we neglect the water in the gas phase. Knowing the mass of water in the hydrate
phase, the hydrate volume is calculated from theoretical empty hydrate structure density. This density is
obtained from lattice constants [6], and depends en the structure (790kg/m3 for SI structure, and 785kg/m
3
for SII structure).
Then, the number of moles of gas molecules in the liquid phase is calculated with the use of Henry’s law.
The vapor-liquid equation used is the following one:
𝑛𝑗𝐿 =
𝑉𝐿𝜌𝑤𝑜
𝑀𝑤
𝑧𝑗𝜑𝑗𝐺𝑃
𝐾𝐻,𝑗∞ (5)
Some assumptions are made: the fugacity coefficients in the gas phase 𝜑𝑗𝐺 are taken equal to the unity. The
Poynting correction is neglected. The water density is considered to be 1000 kg/m3. The Henry’s constants
𝐾𝐻,𝑗∞ are calculated using Holder correlation [11]:
𝐾𝐻,𝑗∞ (𝑇) = exp (𝐴 +
𝐵
𝑇) (6)
The A and B constants are given in table 4.
In the end, equation (4) allows the calculation of 𝑛𝑗𝐿.
3.5.4 Hydrate phase calculation
The hydrate phase calculation comes from a mass balance on the hydrocarbons components (equation 1).
The hydration number is also calculated.
3.6 Sampling effects and uncertainties
The gas sampling is assumed to be negligible (a few μm3 per sample). But the masses of water and Li
+ ions
are taken into account in the calculation: the mass of water in the reactor is actualized at each step, as well
as the new [Li+]
0 concentration,. This variation is due to the liquid sampling (about 4-5mL per sample).
Evaluation of the various sources of errors in the calculations was made and described previously [5]. This
evaluation led to an uncertainty on the gas phase Δzi < 10-3
(determined from GC errors), and to an
uncertainty of the hydrate phase of Δxi/xi < 6%. In the present work, another evaluation was performed
using Monte Carlo simulations using the following assumptions:
- Δ[Li+]/[Li+] = 0.1%,
- Δzi ≈ 10-3
,
- ΔT = 0.2°C,
- ΔP = 0.1 bar,
- Δmw = 0.1g,
- ΔVR = 3%,
- Δρw = 10 kg.m-3
,
- Δ ρHβ = 40 kg.m
-3.
- ρwater = 1000 kg/m3.
- ρHβ = 790 kg/m3 (structure I from lattice constant [6])
Monte Carlo simulations were performed 1000 times (each point). The molar fraction errors on the hydrate
composition of major molecules were found to be lower than 4%. The minor molecules (zi<5%) present
uncertainties from 4% to 50%. The standard deviations close to the total dissociation point were calculated
to be between 20% and 100%. Indeed, the initial and final Li+ concentrations for these points are very close.
In any case, the obtained deviations are higher than the previous evaluation [5].
In the result tables, we chose to give the maximum absolute deviation, instead of giving the relative
deviation. The Monte Carlo simulations provided a maximum absolute deviation of 3.10-3
concerning the
hydrate composition (in molar fractions).
Note: since the hydrates amount is obtained by difference in water concentration, the more crystals there
are, the more accurate are the calculations.
4. Theory of clathrate hydrate equilibrium
4.1. Thermodynamic modeling
Classic van der Waals and Platteuw model [4] was used for the description of the hydrate phase, leading to
the standard Liquid-Hydrate equilibrium (LHE) equation:
∆𝜇𝑤𝐻−𝛽
= ∆𝜇𝑤𝐿−𝛽
(7)
Where ∆𝜇𝑤𝐻−𝛽
and ∆𝜇𝑤𝐿−𝛽
are the difference between the chemical potential of the water in the hydrate
phase (respectively the liquid phase) and the chemical potential of the reference β phase (empty clathrate).
∆𝜇𝑤𝐿−𝛽
is described by classic thermodynamics (Gibbs-Duhem equation) while ∆𝜇𝑤𝐻−𝛽
is expressed from
statistical thermodynamics:
∆𝜇𝑤𝐻−𝛽
= 𝑅𝑇 ∑ 𝑣𝑖𝑙𝑛(1 − ∑ 𝜃𝑗𝑖
𝑗 )𝑖 (8)
4.1.1 Hydrate phase
In equation (8), 𝑣𝑖 is the numbers of cavities of type i, and 𝜃𝑗𝑖 is the occupancy factor of molecule j in the
cavity i. This parameter is the most important to define the thermodynamic equilibrium and the hydrate
properties.
Usually, this last term is described by a model based on Langmuir adsorption theory [12]:
- The guest molecule is adsorbed at the surface,
- The adsorption energy is independent from the presence of other adsorbed molecules,
- The maximum amount of adsorbed gas corresponds to one molecule per site (one molecule
par cavity),
- The expression of the occupancy factor 𝜃𝑗𝑖 is given by:
𝜃𝑗𝑖 =
𝐶𝑗𝑖𝑓𝑗(𝑇,𝑃)
1+∑ 𝐶𝑗𝑖𝑓𝑗(𝑇,𝑃)𝑗
(9)
Leading to:
∆𝜇𝑤𝐻−𝛽
= 𝑅𝑇 ∑ 𝑣𝑖𝑙𝑛(1 − ∑ 𝐶𝑗𝑖𝑓𝑗(𝑇, 𝑃)𝑗 )𝑖 (10)
Where 𝐶𝑗𝑖 is the Langmuir constant of component j in the cavity j. It describes the interaction potential
between the encaged guest molecule and the surrounding water molecules of the spherically symmetrical
cavity. 𝐶𝑗𝑖 is expressed from a spherical symmetrical potential:
𝐶𝑗𝑖 =
4𝜋
𝑘𝑇∫ exp (−
𝜔(𝑟)
𝑘𝑇) 𝑟²𝑑𝑟
𝑅−𝑎
0 (11)
where 𝜔(𝑟) is the interaction potential between the cavity and the guest gas molecule according the the
distance r. (R-a) is the difference between the cavity radius and the molecule radius. It means that the only
interactions between guest molecules and the surrounding water molecules of the cavity are taken into
account .This is a commonly accepted simplification.
Interaction potential 𝜔 can be calculated using different models. The most commonly used for this purpose
is the Kihara potential [13]:
𝜔(𝑟) = 2𝑧휀 [𝜎12
𝑅11𝑟(𝛿10 +
𝑎
𝑅𝛿11) −
𝜎6
𝑅5𝑟(𝛿4 +
𝑎
𝑅𝛿5)] (12)
with:
𝛿𝑁 =1
𝑁[(1 −
𝑟
𝑅+
𝑎
𝑅)
−𝑁− (1 +
𝑟
𝑅+
𝑎
𝑅)
−𝑁] (13)
The parameters ε, σ and a are the so-called Kihara parameters. They are molecules dependent, and fitted
from experimental results. Hence, they are characteristics of the guest molecules. The parameter ε stands
for the maximum attractive potential; the parameter σ represents the distance from the cavity center at
which the interaction potential is zero. At last, a is the spherical hard-core radius. It is a geometric
parameter.
In the case of gas hydrates, only ε and σ are considered as fitting parameters. Since a is a geometric
parameter, its value is known and set once for all. To fit these parameters, P-T equilibrium data from pure
gas phase are needed. If this is not sufficient, the use of data from gas mixtures is a good complement,
provided that the equilibrium composition of the hydrate phase is known, and that the results are at
thermodynamic equilibrium. This last remark can be critical. More details on the Kihara parameters
optimization can be found in Herri et al., 2011[5], and in section 4.2.
4.1.2 Liquid phase
Chemical potential of the liquid phase can be written:
∆𝜇𝑤𝐿−𝛽
= 𝑇∆𝜇𝑤
𝐿−𝛽|𝑇0,𝑃0
𝑇0 + (𝑏𝑝,𝑤𝐿−𝛽
𝑇0 − ∆𝑐𝑝,𝑤𝐿−𝛽
|𝑇0,𝑃0) 𝑇𝑙𝑛𝑇
𝑇0 +1
2𝑏𝑝,𝑤
𝐿−𝛽𝑇(𝑇0 − 𝑇) + (∆ℎ𝑤
𝐿−𝛽
|𝑇0,𝑃0 +
(𝑏𝑝,𝑤𝐿−𝛽
𝑇0 − ∆𝑐𝑝,𝑤𝐿−𝛽
|𝑇0,𝑃0) 𝑇0 −1
2𝑏𝑝,𝑤
𝐿−𝛽𝑇02
) (1 −𝑇
𝑇0) + ∆𝑣𝑤𝐿−𝛽
|𝑇0(𝑃 − 𝑃0) − 𝑅𝑇 𝑙𝑛𝑥𝑤 (14)
∆𝜇𝑤𝐿−𝛽
, ∆ℎ𝑤𝐿−𝛽
, and ∆𝑣𝑤𝐿−𝛽
are thermodynamic properties of the water liquid phase compared to the
reference β phase (gas free hydrate structure). They are first order parameters. ∆𝑐𝑝,𝑤𝐿−𝛽
|𝑇0,𝑃0 and 𝑏𝑝,𝑤𝐿−𝛽
,
secondary parameters, have been calculated by Sloan et al. [6] (see table 6).
Parameters ∆𝜇𝑤𝐿−𝛽
and ∆ℎ𝑤𝐿−𝛽
from Handa and Tse, 1986 [14] were used (see table 5).
More details on equation (14) can be found elsewhere [5]
This thermodynamic modeling has been implemented in our in-house software GasHyDyn which calculates
the hydrates composition from the pressure and gas composition. This software does not perform a flash
calculation. It does not provide the hydrate volume.
4.2 Modeling Kihara parameters: Theory
The optimization of the Kihara parameters of the gas molecules is based on equation (7). For a given set of
Kihara parameters and a given molecule, this equation provides the equilibrium pressure (𝑃𝑐𝑎𝑙𝑐) at which
∆𝜇𝑤𝐻−𝛽
= ∆𝜇𝑤𝐿−𝛽
. Kihara parameters optimization is the minimization of the following deviation function:
𝐹(휀𝑗, 𝜎𝑗) = ∑ |𝑃𝑐𝑎𝑙𝑐
𝑃𝑒𝑥𝑝− 1| → min (𝑟𝑒𝑠𝑝. 𝐹(휀𝑗 , 𝜎𝑗) = |
𝑇𝑐𝑎𝑙𝑐
𝑇𝑒𝑥𝑝− 1| → min)𝑁
𝑙=1 (15)
The index l is a specific data over N experimental data set. The calculations can be based on the pressure
(𝑃𝑐𝑎𝑙𝑐) knowing the temperature, and vice versa.
The whole optimization process has been explained in a previous work [5]. In a few words, for a given
molecule, an experimental data set of LHE is chosen. Among these data, the temperature range has to be as
wide as possible. Also, the whole data set has to be consistent. Then, calculations of the objective function
𝐹(휀𝑗, 𝜎𝑗) are performed for different values of (휀𝑗, 𝜎𝑗). A diagram showing 𝐹 as a function of the Kihara
parameters is drawn. The minimum, when it exists, gives the best parameters. This optimization does not
always provide a satisfying result. Sometimes, the minimum of the 𝐹 function is not obvious, and
additional data are needed. Usually, these data are the mixed hydrate composition. But, this brings a crucial
problem. If the thermodynamic model is compared to mixed gas hydrate composition, then the
experimental data have to be at thermodynamic equilibrium. How to be sure that they are? Indeed, the
thermodynamic modeling only provides the hydrate composition of the first nucleus for a given gas
composition and temperature (or pressure). This is experimentally hard to achieve. Moreover, by
crystallizing a significant volume of hydrate, the measured composition corresponds to an average
composition. The hydrate phase is presumed to be not homogeneous. So, the hydrate composition is a
consequence of the crystallization process, influenced by the speed of the involved phenomena. This is why
we used only pure hydrate data to regress the parameters (N2, CO2, C2H6). Sometimes this could not be
done (C3H8, C4H10).
The Kihara parameters obtained in this study (C2H6), as well as in previous studies (N2, CO2, CH4), are
given in table 7. Next section quickly explains how these parameters were optimized.
4.3 Modelling Kihara parameters of N2, CO2, and CH4
Kihara parameters for N2, CO2, and CH4 have been obtained from pure clathrate hydrates by assuming a SI
structure in the work of Herri and Chassefière 2012 [15]. These parameters are used in the present work.
4.4 Modelling Kihara parameters of ethane
The Kihara parameters have been obtained for pure ethane clathrate hydrate by assuming a SI structure. The
equilibrium data are numerous (Figure 5) and 61 experimental results have been retained for the
optimisation, from Yasuda and Ohmura (2008) [7], Robert et al. (1940) [16], Deaton and Frost (1946) [17],
Reamer et al. (1952) [18], Falabella (1975) [19], Mohammadi and Richon (2010) [20], which covers a wide
range of temperature from 200.08K to 287.4K and a pressure range from 8.3kPa to 3298kPa. On Figure 5,
the deviation presents a clear minimum which can be considered as the best values of 휀/𝑘 and σ (reported
in Table 7).
Figure 6 shows the good correlation of GasHyDyn simulations to a wider range of experimental data from
pure C2H6 hydrates [7,16-26].
4.5 Modelling Kihara parameters of propane and butane
Up, to now, the determination of the Kihara parameters for the propane has not been possible since no
minimum was found from pure hydrates data. More data are needed, especially results giving the hydrate
composition for binary mixtures.
The modeling of n-butane was not possible since very few data are available in the literature. Moreover, the
optimization of the Kihara parameters is difficult because the vapor pressure of n-butane is quite low.
4.6. Kinetic modeling
Mixed hydrate formation is suspected to occur at non-thermodynamic equilibrium. Kinetics could be
predominant in the process. Herri and Kwaterski [27] suggested a new approach combining thermodynamic
(for liquid water chemical potential) and kinetics (the expression of Langmuir constant in the hydrate
chemical potential). This model leads to the calculation of the crystal growth rate and to different hydrate
phase composition.
In the next sections, we investigate experimentally through the two procedures (quick and slow
crystallization), LHE from hydrocarbon gas mixtures. A thermodynamic modeling follows these results.
5. RESULTS
5.1. Experimental Results
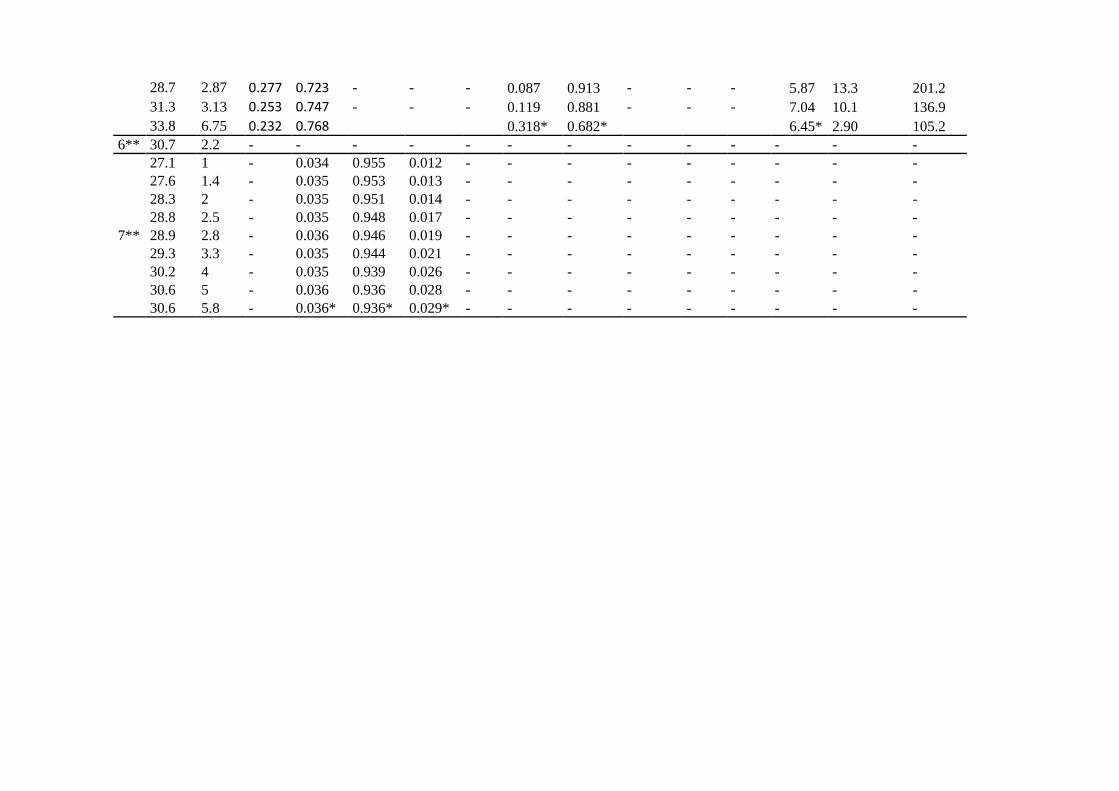
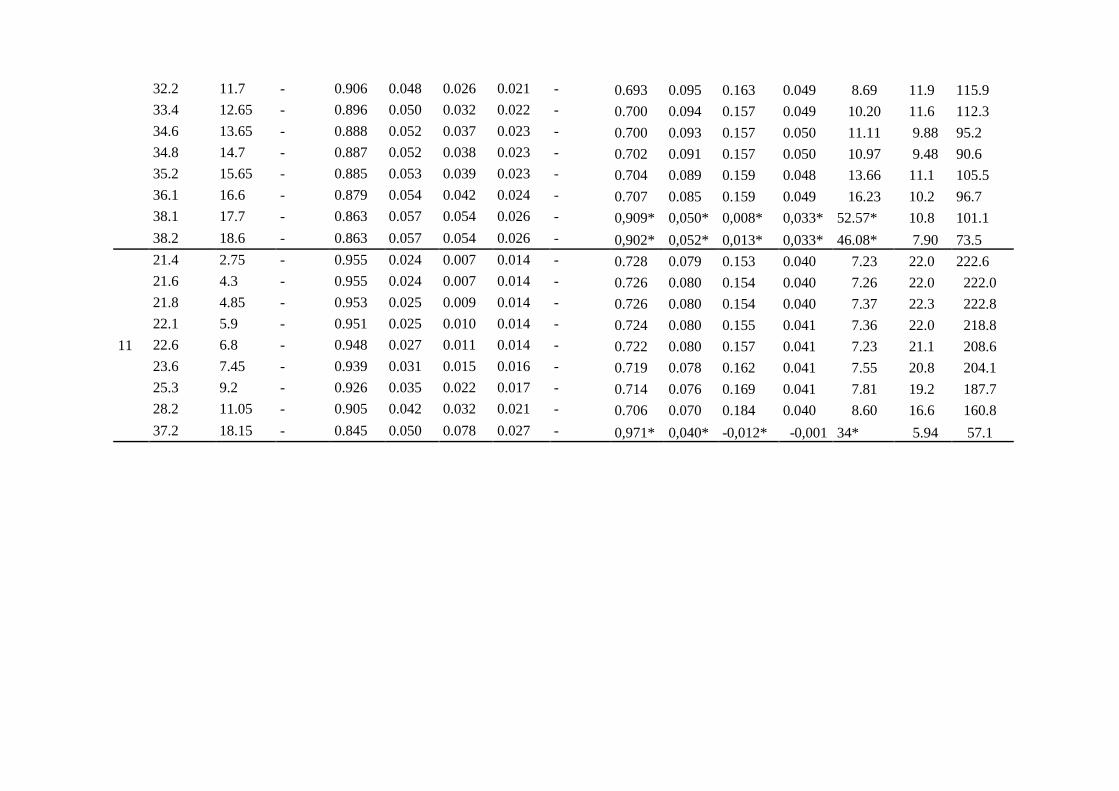
The experimental results are presented in tables 8, 9 and 10. Tables 8 and 9 correspond to the first
procedure (high crystallization rate). Table 10 corresponds to the second procedure (low crystallization
rate).
All these tables provide: the equilibrium pressure; temperature; gas phase composition; hydrate
composition (except for Gas 6 and 7 that suffered from analysis problems); hydration number; water
conversion (%mass); hydrate volume.
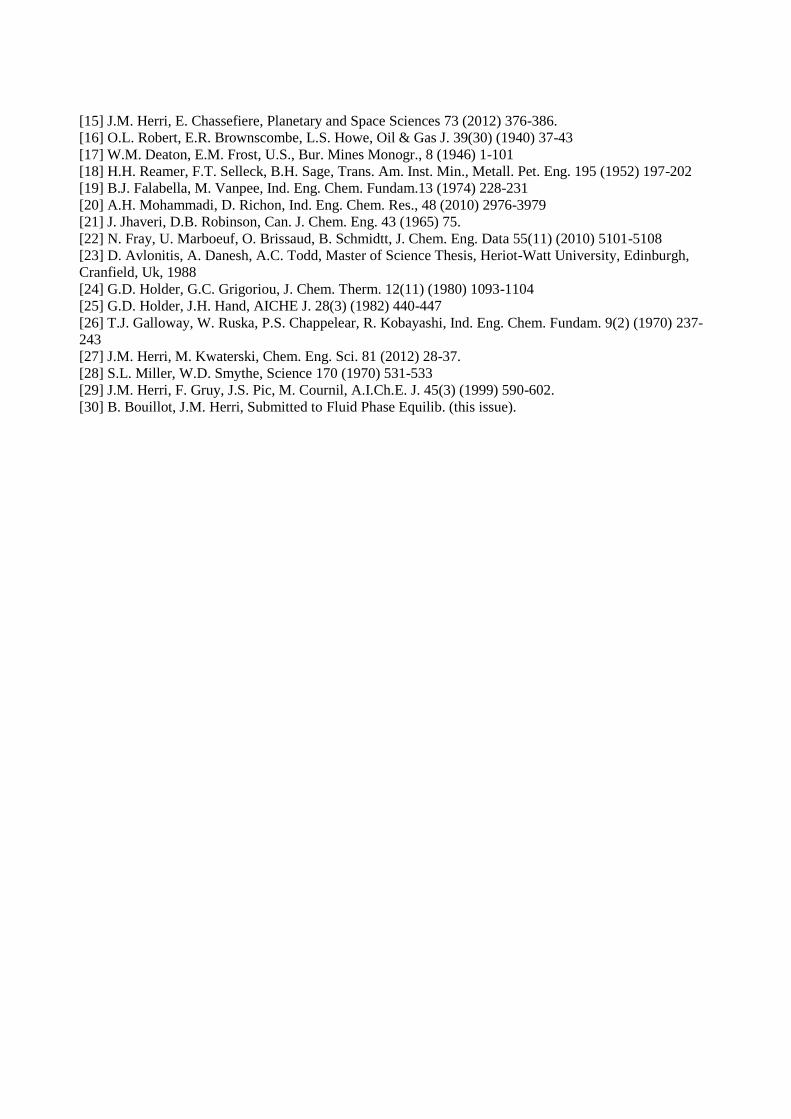
Pressure-Temperature results for mixed hydrates could not be compared to data from the literature since all
authors studied different gas compositions. However, the results on pure gases can easily be compared.
Figure 7 shows that the experimental results on pure CO2 and pure CH4 are in accordance with the
literature. This is a satisfying observation. This shows that the obtained results, when they can be compared
to other studies, are in accordance with them. Then, the calculated hydration numbers are usually between 5
and 10 (except the points close to total dissociation). This also is a good point. However, hydration numbers
can be found higher than 8 due to uncertainties.
Results concerning mixed hydrates show a water conversion under 38%mass depending on the gas mixtures
and the initial pressure, but are quite similar except for gas mixture n°12 (discussed later). The results also
show that the selectivity of mixed gas hydrates to carbon dioxide, ethane and propane is good, compared to
methane. Molar composition in the hydrate phase of the heaviest hydrocarbons is at least ten times higher
than in the gas phase (mixtures 8 to 12). Uncertainties on the gas phase composition are usually lower
than 4%.
The most interesting observation is the comparison between the two procedures (gas 1 to 11 compared to
gas 12). Looking at gas 8 and 12, (with the “same” initial global composition), the PT data are a bit
different (about 1.5°C at same equilibrium pressure). The equilibrium temperature is higher at low
crystallization rate (fr example at 35.6 bars and 37.75 bars). Moreover, the enclathration of C2H6 is more
important (mole fractions two times higher) while the molar fraction of CH4 is lower. It shows that the
enclathration of heavier molecules is larger at a slow process. Finally, the water conversion is slightly lower
in the case of gas 12. This means that less hydrates were crystallized, and that there is a larger occupation of
the cavities. These observations highlight the apparent kinetic effects on hydrate formation. In other words,
the crystallization driving force affects the enclathration,of the guest molecules and hence their selectivity.
This statement can be supported by a modeling point of view, using thermodynamic models. In the next
section, our in-house model is compared to the experimental results.
5.2. Modeling results and discussion
Standard LHE calculations (section 4) have been implemented in our in-house software, “GasHyDyn”.
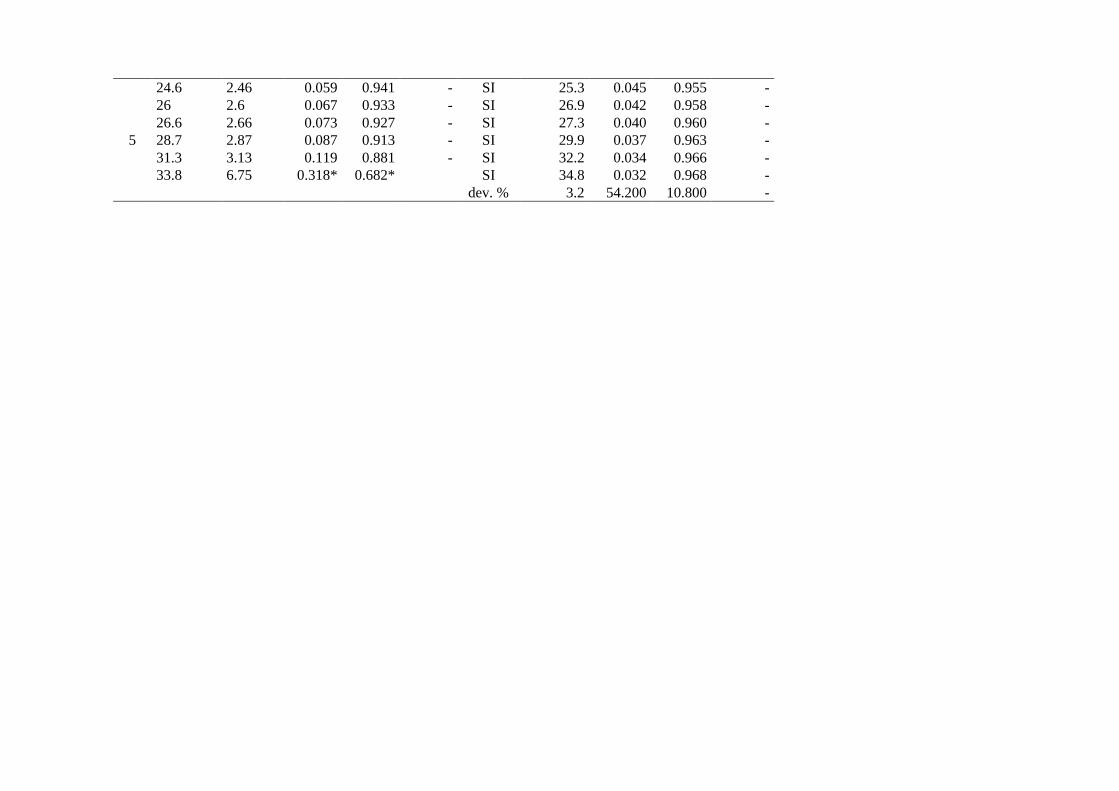
Tables 11 and 12 present the simulated results (predicted pressures and hydrate compositions) and the mean
deviations to experimental results.
Concerning pure gases (mixtures 1 and 2), the simulations are very solid (mean deviations between 1.4%
and 2.3%). This is not surprising since the Kihara parameter optimizations showed very good accordance to
the experimental results on a wide range of temperature.
The case of mixed hydrate is more interesting. First, predicted equilibrium pressure for binary mixtures of
CO2/N2 or CO2/CH4 are well predicted by the model (mean deviation between 2.4 and 3.2%). In these
cases, the errors on the predicted hydrate compositions are between 10% and 30% for the major species and
50% for the minor species.
In the case of ternary mixtures, the mean deviations on the pressure and hydrate composition are higher.
This means that it is more difficult to model LHE when more molecules are involved. Moreover, it is
important to notice that the experimental hydrate composition is an average value. However, the results for
ternary gas 12 (at low driving force) are in better accordance with the experimental data (than gases 7 and 8
at high rate). The mean deviation on the pressure is 1.8 assuming a S1 structure, and the molar composition
errors are under 24%. From this observation, the crystallization of gas hydrates at low driving force (slow
crystallization) is likely to occur at thermodynamic equilibrium. Maybe the hydrate crystal shows, in this
case, are more homogeneous composition. At the contrary, formation at high driving force (quick
crystallization) could involve kinetic considerations rather than thermodynamic.
Kinetics effects would not be a surprise. Indeed, the hydrate crystallization from an initial vapor-liquid
equilibrium involves many transfer phenomena. First, the gas dissolution in the aqueous phase is usually a
limiting step [29]. This is dependent on the driving force (fugacity difference), the contact surface and the
mass transfer coefficients. Moreover, this affects the instantaneous gas concentration in the liquid phase,
and so the driving force for the crystallization (LHE). Then, we suggested recently [27] that the
enclathration of the gas molecules into the hydrate structure could be significantly affected by kinetics
considerations (diffusion in the liquid hydrate layer). Depending on the rate of enclathration, and the crystal
growth speed, the final composition of the mixed hydrate could be different than predicted by
thermodynamic modeling.
From the above results, the comparison of the experimental and modeling observations seems to confirm
the influence of the crystallization rate. Unfortunately, equilibria involving propane and butane could not be
simulated with the thermodynamic model. Indeed, the Kihara parameters could not be regressed. To give a
new dimension to the thermodynamic modeling, and discuss more specifically the experimental results, a
mass balance should be considered. This way, the hydrate volume could be compared with the simulation,
and highlight more precisely the kinetic influence on the crystallization. This is the purpose of a parallel
work [30].
6. Conclusion
Gas hydrates equilibrium experiments of hydrocarbon gas mixtures (N2-CO2-CH4-C2H6-C3H8-C4H10) were
performed in an instrumented batch reactor. The molar compositions (gas phase and hydrate phase) were
provided as well as the mass of each phase and liquid water consumption. Two procedures were used in
order to investigate the importance of kinetics: quick and slow crystallization.
The results for pure gas hydrates are in very good accordance with literature data. Mixed gas hydrates could
not be compared to literature results since few data are available with propane and butane. The
experimental uncertainties on molar composition were usually lower than 10-3
(absolute).
To evaluate the importance of kinetic effects on hydrate formation, a thermodynamic model, implementing
classic van der Waals and Platteuw model, were used. The Kihara parameters used were taken from a
previous study (CH4, CO2, N2) and calculated (C2H6). They were obtained from pure gas hydrate
equilibrium data (PT). Parameters for propane and butane could not be obtained.
The two procedures used suggest a kinetic influence on mixed hydrate formation. Experimental results
showed that the enclathration of the heavier molecule (ethane) is more important at low than high
crystallization rate. Moreover, the equilibrium pressure for a given temperature and initial gas composition,
is slightly different. Finally, the thermodynamic simulations are also in better accordance with the results at
slow crystallization.
In the end, the results show that mixed hydrate equilibrium could not be at thermodynamic equilibrium. If
the measurements are performed at high crystallization rate the hydrate volume and composition will not be
in accordance with the thermodynamic modeling. This observation could have a significant impact on
design calculations in which the assumption of thermodynamic equilibrium is made (leading to an over
estimation of the hydrates volume in the pipe-lines).
This is why the description of the procedure is essential. Authors have to be careful when computing and
regressing model parameters if other data than PT are considered.
To extend the last discussion, a new approach of the modeling for the whole hydrate volume is presented in
the same issue [30].
List of symbols
a Hard core radius [Å]
H Hydrate phase (as superscript)
j Molecule index (as subscript)
k Boltzmann constant [J/K]
𝐾𝐻,𝑗∞ Henry constant at solvent vapor pressure [Pa]
L Liquid phase (as superscript)
Mw water molecular weight [g/mol.]
𝑛𝑗0 Initial number of moles of molecule j [mol.]
𝑛𝑗𝐺 Number of moles of j in the gas phase [mol.]
𝑛𝑗𝐿 Number of moles of j in the liquid phase [mol.]
𝑛𝑗𝐻 Number of moles of j in the hydrate [mol.]
Nhyd Hydration number
P Pressure [bar]
r Distance between guest molecule and cavity [Å]
R Cavity radius [Å]
T Temperature [°C]
xj Mole fraction of j in the hydrate phase
yj Mole fraction of j in the liquid phase
V Volume [m3]
VH Hydrate Volume [m
3]
VL Liquid Volume [m
3]
VR Volume of the reactor [m3]
w Water (as subscript)
zj Mole fraction of j in the vapor phase
ε maximum attractive potential [J]
ρHβ Pure clathrate (gas free) density [kg.m
-3]
ρw Water density [kg.m-3
]
σ Soft core radius [Å]
φ Fugacity coefficient
ω interaction potential [J]
0 initial situation (as subscript or superscript)
Acknowledgements
The authors would like to thanks TOTAL SA for its support in this study.
The authors would also like to thanks all the members of the technical staff for their constant support: Alain
Lallemand, Fabien Chauvy, Richard Drogo and Albert Boyer.
References
[1] E.D. Sloan, Fluid Phase Equilibria 228-229 (2008) 67-74.
[2] T. Collett, J.J. Bahk, R. Baker, R. Boswell, D. Divins, M. Frye, D. Goldberg, J. Husebo, C.A. Koh, M.
Malone, M. Morell, G. Myers, C. Shipp, M. Torres, J. Chem. Eng. Data 60(2) (2015) 319-329.
[3] D. NguyenHong, F. Chauvy, J.M. Herri, Energy Conversion Manag. 48(4) (2007) 1313–1322.
[4] J.H. Van der Waals, J.C. Platteeuw, Adv. Chem. Phys. 2 (1959) 1-57
[5] J.M. Herri, A. Bouchemoua, M. Kwaterski , A. Fezoua, Y. Ouabbas, A. Cameirao, Fluid Phase
Equilibria, 301 (2011) 171-190
[6] E.D. Sloan, C.A. Koh, Clathrate hydrates of natural gases, 3rd ed., CRC Press, Boca Raton, 2007.
[7] K. Yasuda, R. Ohmura, J. Chem. Eng. Data, 53 (2008) 2182-2188
[8] S. Adisasmito, R.K. Frank, E.D. Sloan, J. Chem. Eng. Data, 36 (1991) 68-71
[9] J.L. Thakore, G.D. Holder, Ind. Eng. Chem. Res. 26 (1987) 462.
[10] A. Danesh, PVT and Phase Behavior of Petroleum Reservoir Fluids. Elsevier, 1998.
[11] G.D. Holder, S.P. Zetts, N. Pradhan, N., Review in Chemical Engineering 5 (1988) 1-70.
[12] V. McKoy, O.J. Sinanoğlu, J Chem. Phys 38 (1963) 2946-2956.
[13] C.C. Chen, H.I. Britt, J.F. Boston, L.B. Evans, AIChE J., 28 (1982) 588-596.
[14] Y.P. Handa, J.S. Tse, J. Phys. Chem. 23 (1986) 5917.
[15] J.M. Herri, E. Chassefiere, Planetary and Space Sciences 73 (2012) 376-386.
[16] O.L. Robert, E.R. Brownscombe, L.S. Howe, Oil & Gas J. 39(30) (1940) 37-43
[17] W.M. Deaton, E.M. Frost, U.S., Bur. Mines Monogr., 8 (1946) 1-101
[18] H.H. Reamer, F.T. Selleck, B.H. Sage, Trans. Am. Inst. Min., Metall. Pet. Eng. 195 (1952) 197-202
[19] B.J. Falabella, M. Vanpee, Ind. Eng. Chem. Fundam.13 (1974) 228-231
[20] A.H. Mohammadi, D. Richon, Ind. Eng. Chem. Res., 48 (2010) 2976-3979
[21] J. Jhaveri, D.B. Robinson, Can. J. Chem. Eng. 43 (1965) 75.
[22] N. Fray, U. Marboeuf, O. Brissaud, B. Schmidtt, J. Chem. Eng. Data 55(11) (2010) 5101-5108
[23] D. Avlonitis, A. Danesh, A.C. Todd, Master of Science Thesis, Heriot-Watt University, Edinburgh,
Cranfield, Uk, 1988
[24] G.D. Holder, G.C. Grigoriou, J. Chem. Therm. 12(11) (1980) 1093-1104
[25] G.D. Holder, J.H. Hand, AICHE J. 28(3) (1982) 440-447
[26] T.J. Galloway, W. Ruska, P.S. Chappelear, R. Kobayashi, Ind. Eng. Chem. Fundam. 9(2) (1970) 237-
243
[27] J.M. Herri, M. Kwaterski, Chem. Eng. Sci. 81 (2012) 28-37.
[28] S.L. Miller, W.D. Smythe, Science 170 (1970) 531-533
[29] J.M. Herri, F. Gruy, J.S. Pic, M. Cournil, A.I.Ch.E. J. 45(3) (1999) 590-602.
[30] B. Bouillot, J.M. Herri, Submitted to Fluid Phase Equilib. (this issue).
Figures
Figure 1. Experimental CO2 and CH4 P-T hydrate equilibria diagrams [7-9]
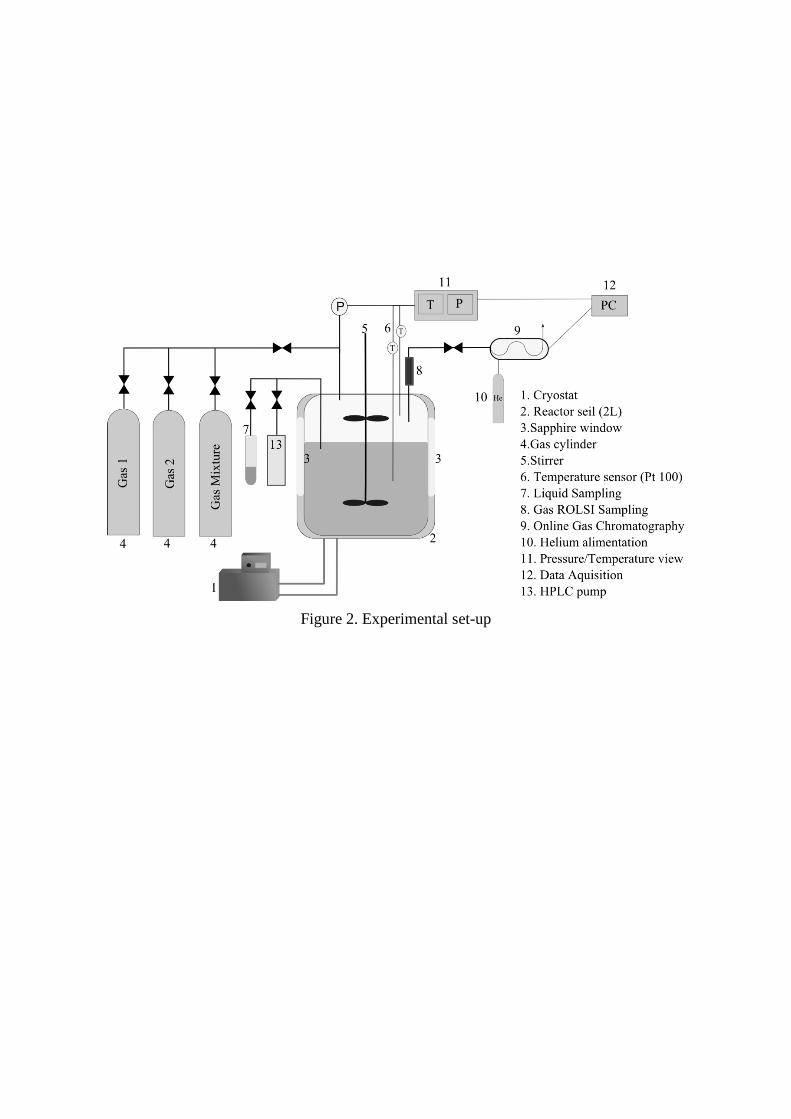
Figure 2. Experimental set-up
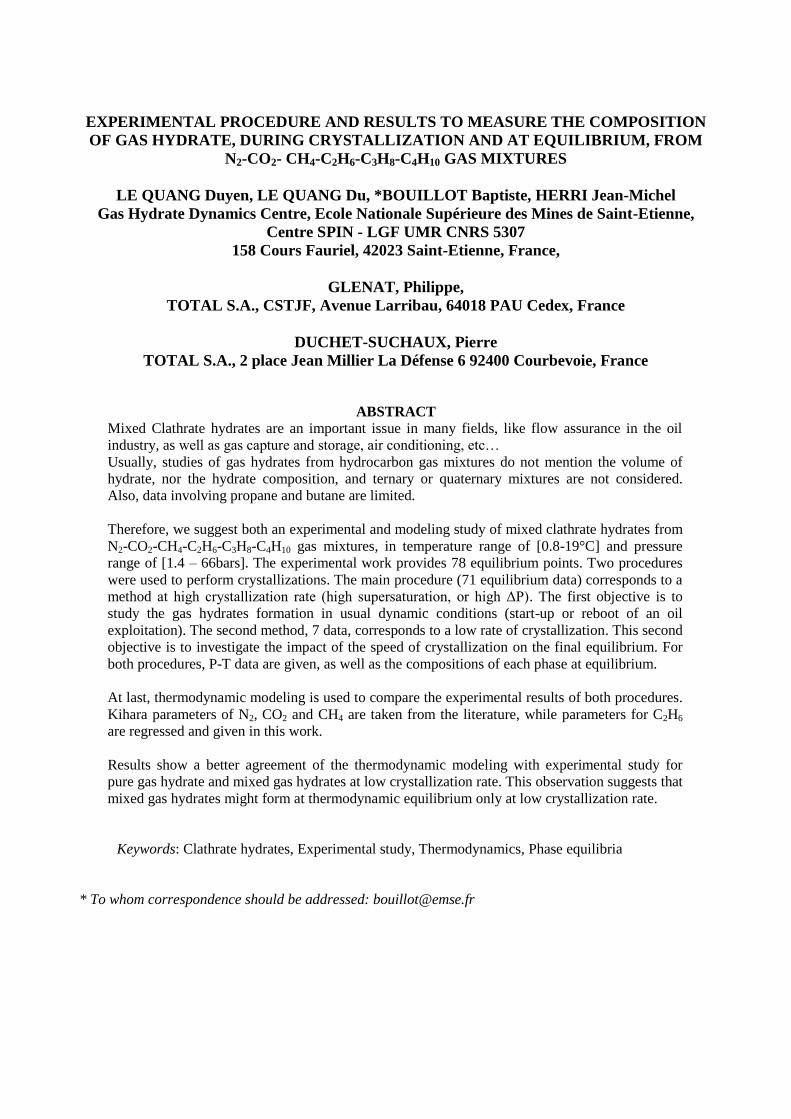
Figure 3. Pressure – Temperature evolution during equilibria experiments at high crystallization
rate.
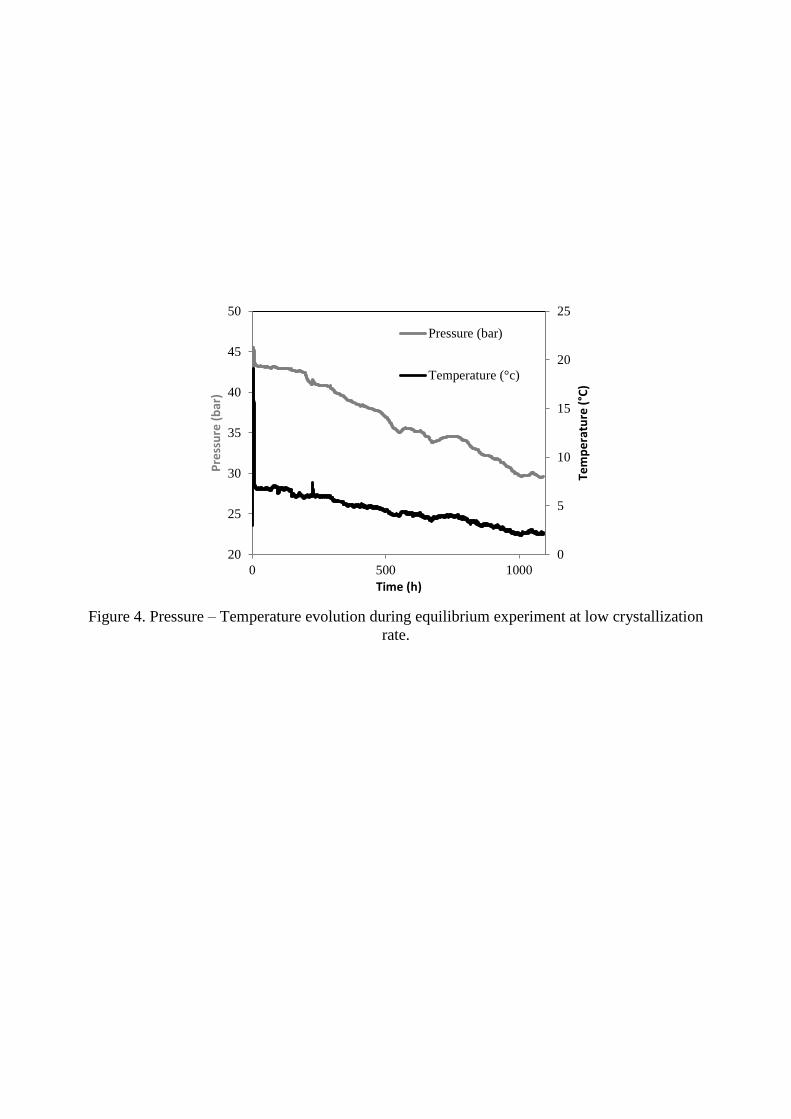
Figure 4. Pressure – Temperature evolution during equilibrium experiment at low crystallization
rate.
0
5
10
15
20
25
20
25
30
35
40
45
50
0 500 1000Te
mp
era
ture
(°C
)
Pre
ssu
re (
bar
)
Time (h)
Pressure (bar)
Temperature (°c)
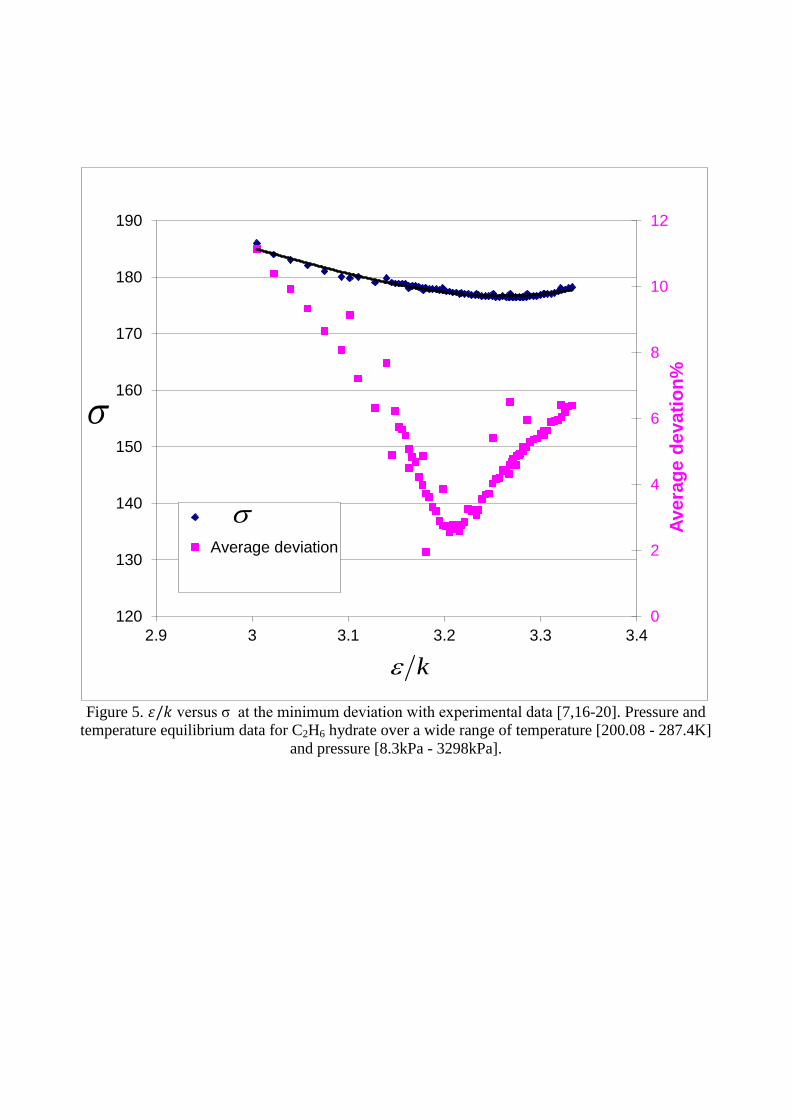
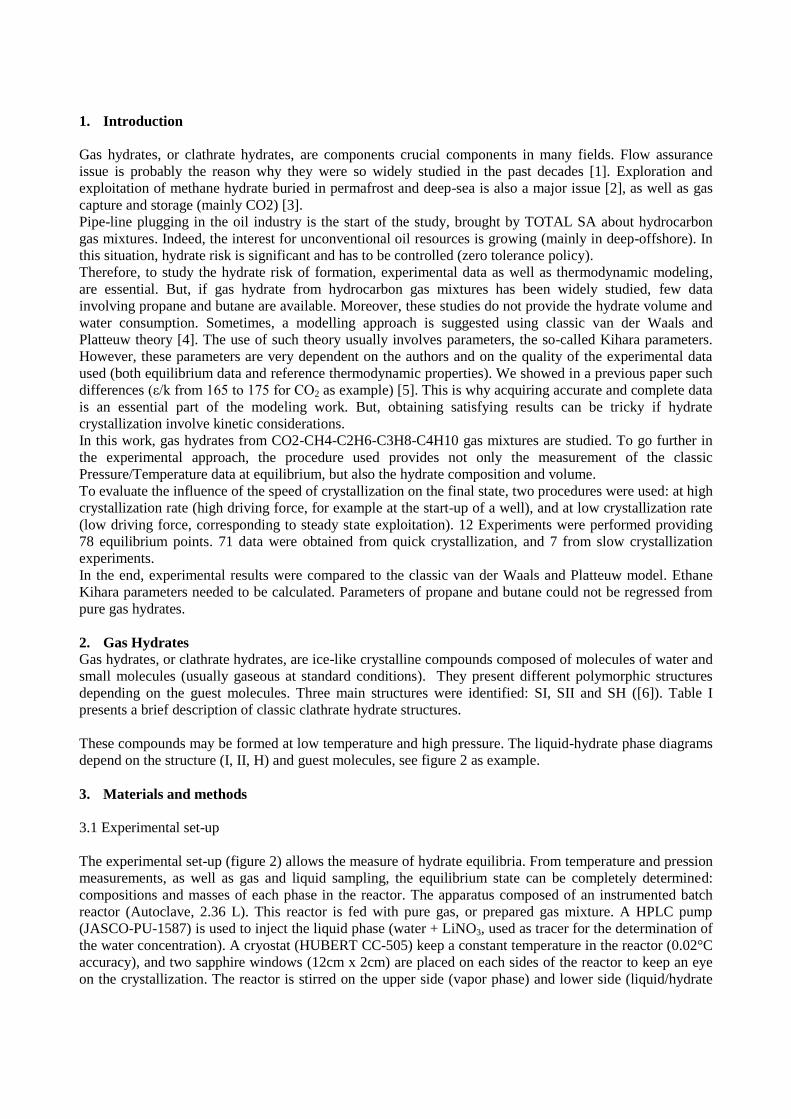
Figure 5. 휀/𝑘 versus σ at the minimum deviation with experimental data [7,16-20]. Pressure and
temperature equilibrium data for C2H6 hydrate over a wide range of temperature [200.08 - 287.4K]
and pressure [8.3kPa - 3298kPa].
0
2
4
6
8
10
12
120
130
140
150
160
170
180
190
2.9 3 3.1 3.2 3.3 3.4
Ave
rag
e d
eva
tio
n%
Average deviation
Poly. ()
k
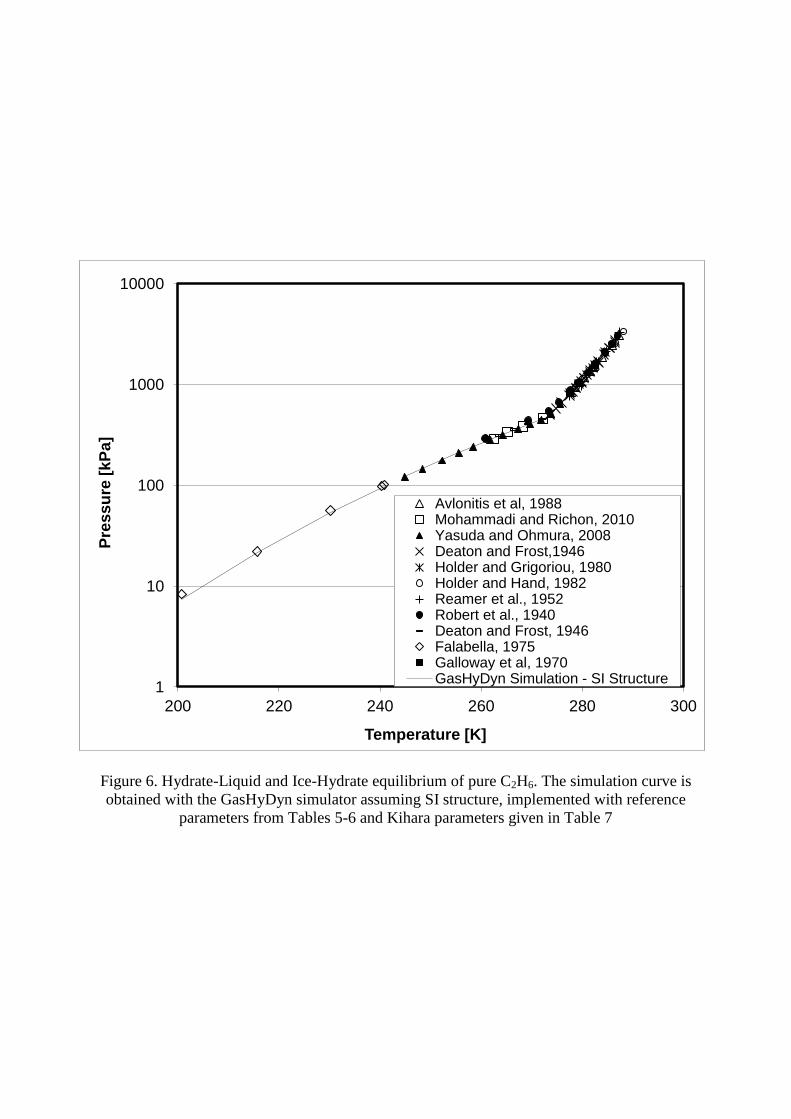
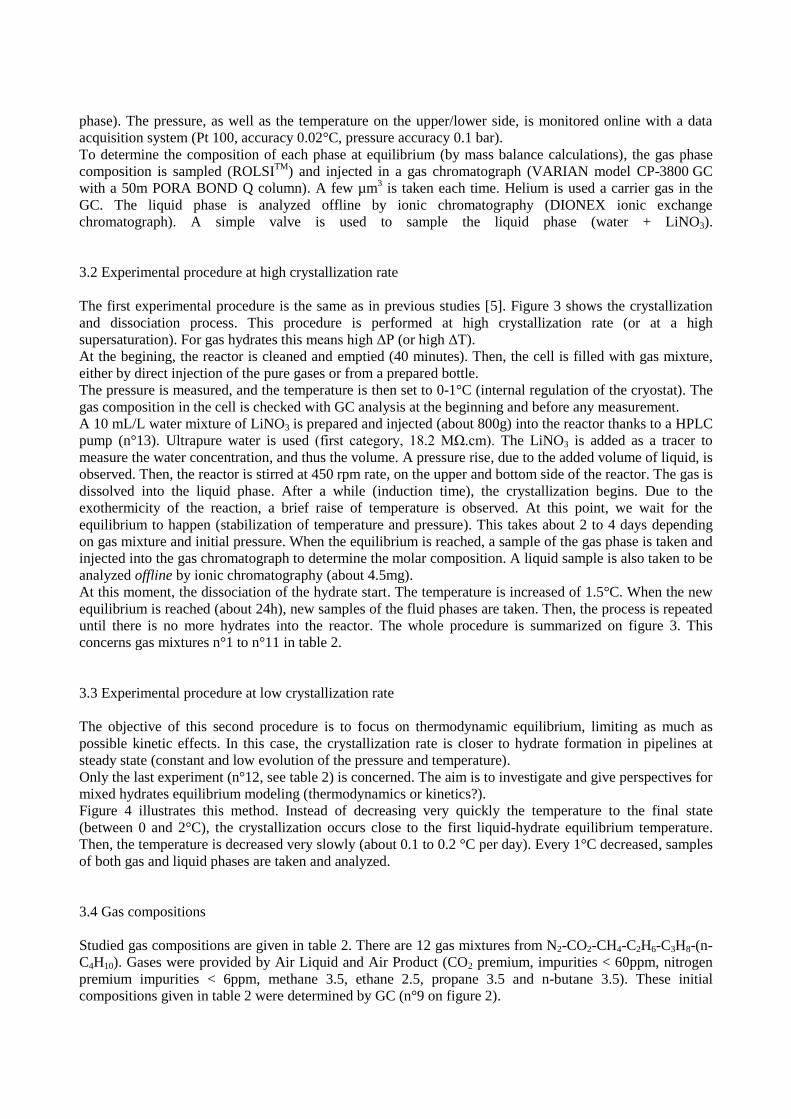
Figure 6. Hydrate-Liquid and Ice-Hydrate equilibrium of pure C2H6. The simulation curve is
obtained with the GasHyDyn simulator assuming SI structure, implemented with reference
parameters from Tables 5-6 and Kihara parameters given in Table 7
1
10
100
1000
10000
200 220 240 260 280 300
Pre
ss
ure
[kP
a]
Temperature [K]
Avlonitis et al, 1988Mohammadi and Richon, 2010Yasuda and Ohmura, 2008Deaton and Frost,1946Holder and Grigoriou, 1980Holder and Hand, 1982Reamer et al., 1952Robert et al., 1940Deaton and Frost, 1946Falabella, 1975Galloway et al, 1970GasHyDyn Simulation - SI Structure
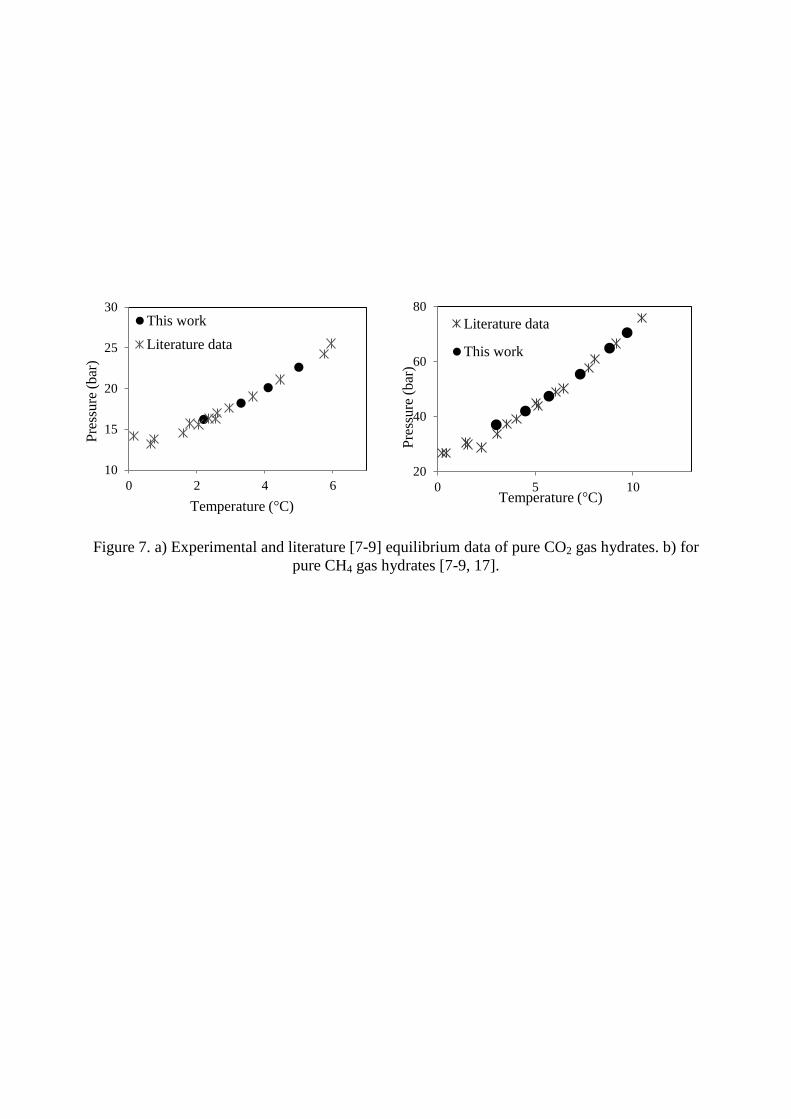
Figure 7. a) Experimental and literature [7-9] equilibrium data of pure CO2 gas hydrates. b) for
pure CH4 gas hydrates [7-9, 17].
20
40
60
80
0 5 10
Pre
ssu
re (
bar
)
Temperature (°C)
Literature data
This work
10
15
20
25
30
0 2 4 6
Pre
ssu
re (
bar
)
Temperature (°C)
This work
Literature data
Tables
Table 1. Structure of gas hydrates [6].
SI SII SH
Cavity(*) 5
12 5
126
2 5
12 5
126
4 5
12 4
35
66
3 5
126
8
Type of cavity 1 2 1 3 1 5 4
Number of cavity 2 6 16 8 3 2 1
Average cavity radius (nm) 0.395 0.433 0.391 0.473 0.391 0.406 0.571
Variation in radius,% 3.4 14.4 5.5 1.73
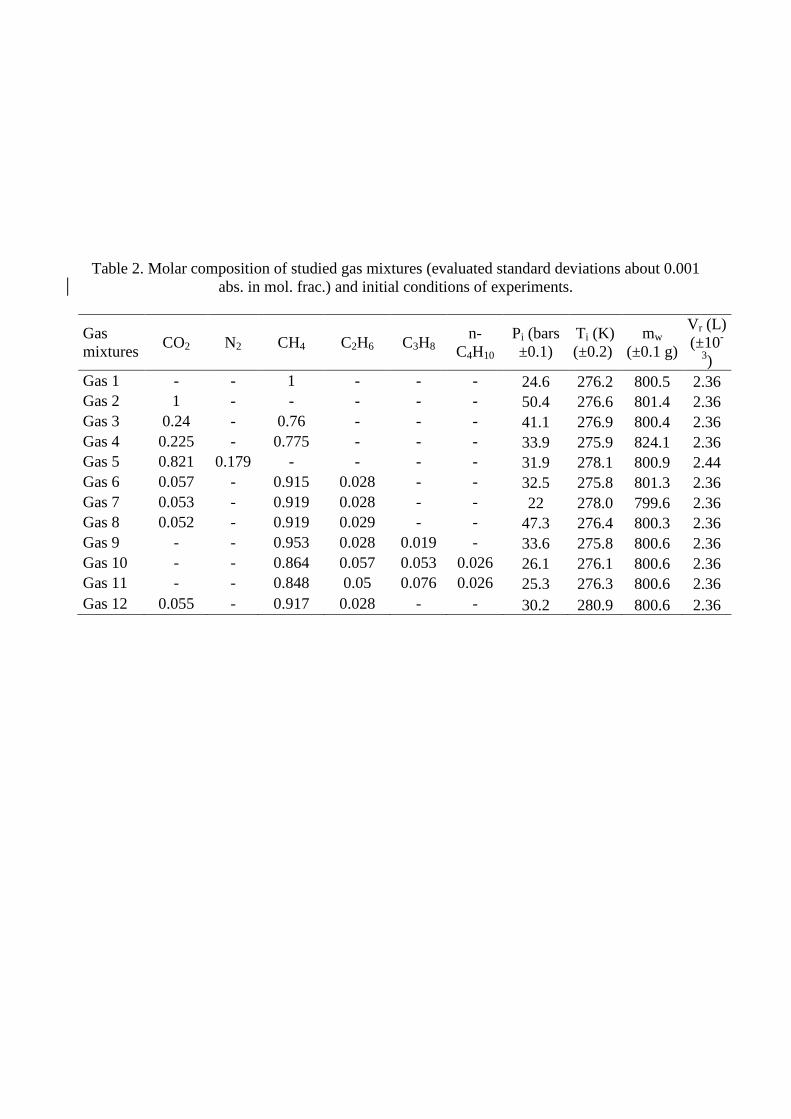
Table 2. Molar composition of studied gas mixtures (evaluated standard deviations about 0.001
abs. in mol. frac.) and initial conditions of experiments.
Gas
mixtures CO2 N2 CH4 C2H6 C3H8
n-
C4H10
Pi (bars
±0.1)
Ti (K)
(±0.2)
mw
(±0.1 g)
Vr (L)
(±10-
3)
Gas 1 - - 1 - - - 24.6 276.2 800.5 2.36
Gas 2 1 - - - - - 50.4 276.6 801.4 2.36
Gas 3 0.24 - 0.76 - - - 41.1 276.9 800.4 2.36
Gas 4 0.225 - 0.775 - - - 33.9 275.9 824.1 2.36
Gas 5 0.821 0.179 - - - - 31.9 278.1 800.9 2.44
Gas 6 0.057 - 0.915 0.028 - - 32.5 275.8 801.3 2.36
Gas 7 0.053 - 0.919 0.028 - - 22 278.0 799.6 2.36
Gas 8 0.052 - 0.919 0.029 - - 47.3 276.4 800.3 2.36
Gas 9 - - 0.953 0.028 0.019 - 33.6 275.8 800.6 2.36
Gas 10 - - 0.864 0.057 0.053 0.026 26.1 276.1 800.6 2.36
Gas 11 - - 0.848 0.05 0.076 0.026 25.3 276.3 800.6 2.36
Gas 12 0.055 - 0.917 0.028 - - 30.2 280.9 800.6 2.36
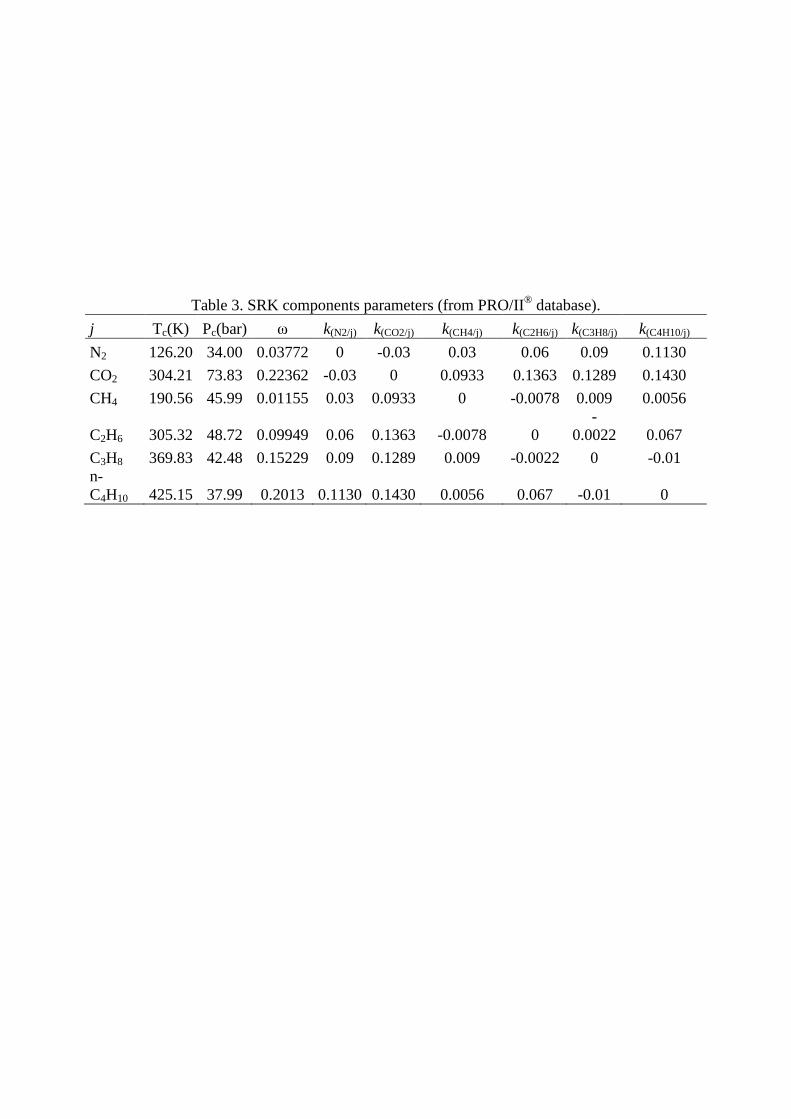
Table 3. SRK components parameters (from PRO/II®
database).
j Tc(K) Pc(bar) ω k(N2/j) k(CO2/j) k(CH4/j) k(C2H6/j) k(C3H8/j) k(C4H10/j)
N2 126.20 34.00 0.03772 0 -0.03 0.03 0.06 0.09 0.1130
CO2 304.21 73.83 0.22362 -0.03 0 0.0933 0.1363 0.1289 0.1430
CH4 190.56 45.99 0.01155 0.03 0.0933 0 -0.0078 0.009 0.0056
C2H6 305.32 48.72 0.09949 0.06 0.1363 -0.0078 0
-
0.0022 0.067
C3H8 369.83 42.48 0.15229 0.09 0.1289 0.009 -0.0022 0 -0.01
n-
C4H10 425.15 37.99 0.2013 0.1130 0.1430 0.0056 0.067 -0.01 0
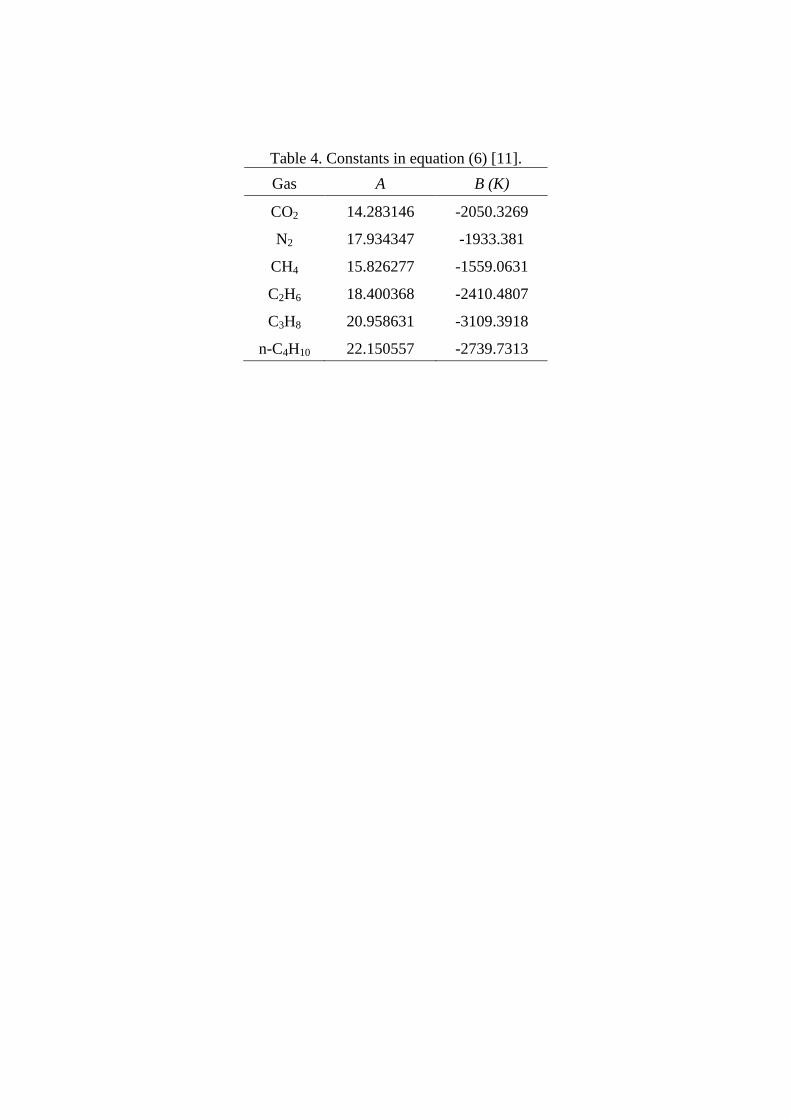
Table 4. Constants in equation (6) [11].
Gas A B (K)
CO2 14.283146 -2050.3269
N2 17.934347 -1933.381
CH4 15.826277 -1559.0631
C2H6 18.400368 -2410.4807
C3H8 20.958631 -3109.3918
n-C4H10 22.150557 -2739.7313
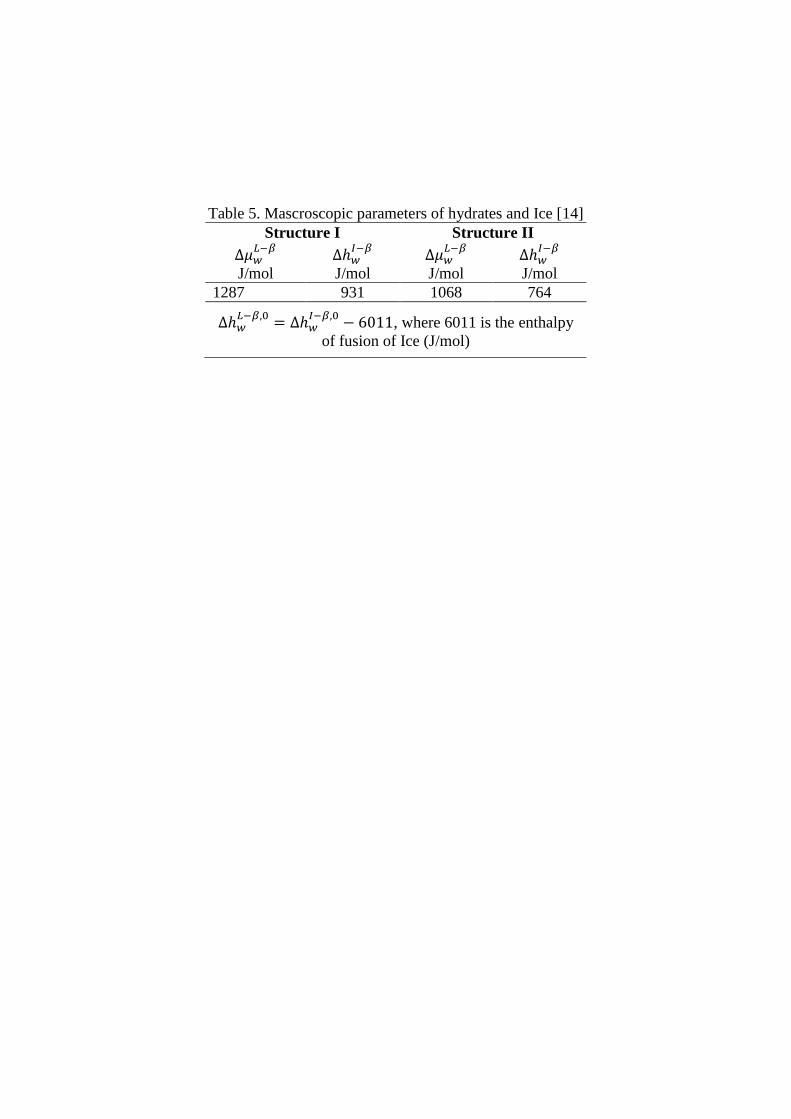
Table 5. Mascroscopic parameters of hydrates and Ice [14]
Structure I Structure II
∆𝜇𝑤𝐿−𝛽
∆ℎ𝑤𝐼−𝛽
∆𝜇𝑤𝐿−𝛽
∆ℎ𝑤𝐼−𝛽
J/mol J/mol J/mol J/mol
1287 931 1068 764
∆ℎ𝑤𝐿−𝛽,0
= ∆ℎ𝑤𝐼−𝛽,0
− 6011, where 6011 is the enthalpy
of fusion of Ice (J/mol)
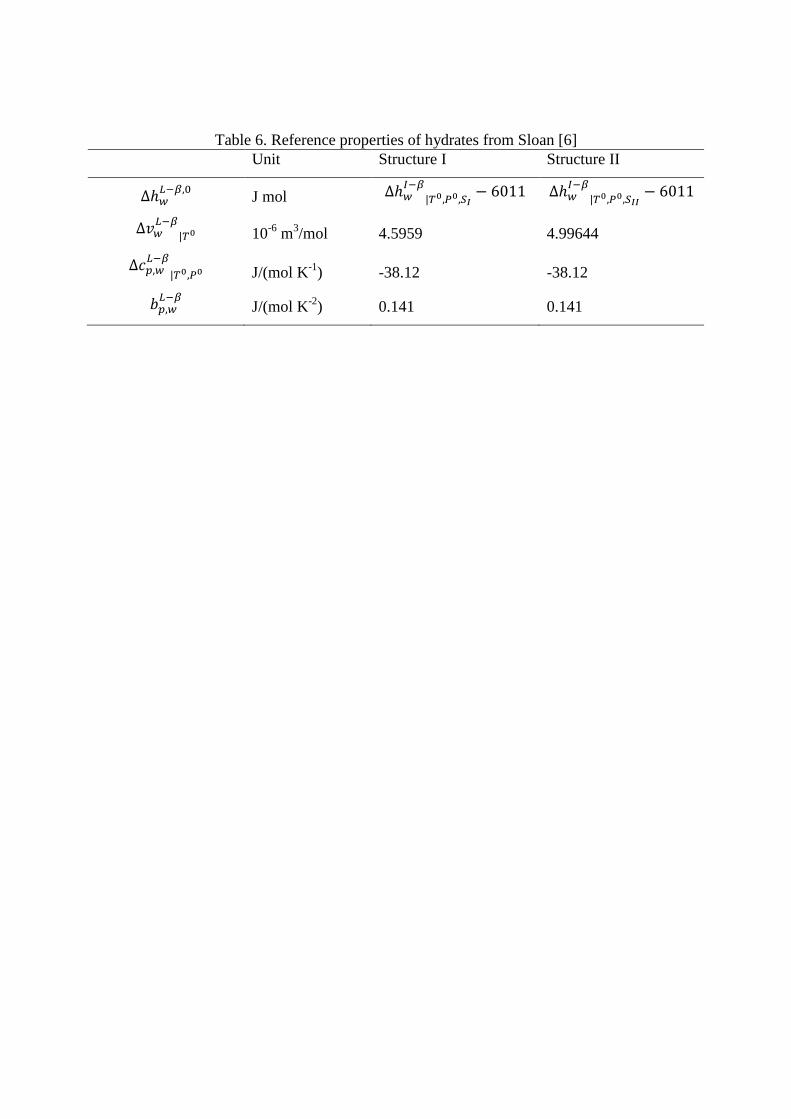
Table 6. Reference properties of hydrates from Sloan [6]
Unit Structure I Structure II
∆ℎ𝑤𝐿−𝛽,0
J mol ∆ℎ𝑤𝐼−𝛽
|𝑇0,𝑃0,𝑆𝐼− 6011 ∆ℎ𝑤
𝐼−𝛽
|𝑇0,𝑃0,𝑆𝐼𝐼− 6011
∆𝑣𝑤𝐿−𝛽
|𝑇0 10-6
m3/mol 4.5959 4.99644
∆𝑐𝑝,𝑤𝐿−𝛽
|𝑇0,𝑃0 J/(mol K
-1) -38.12 -38.12
𝑏𝑝,𝑤𝐿−𝛽
J/(mol K-2
) 0.141 0.141
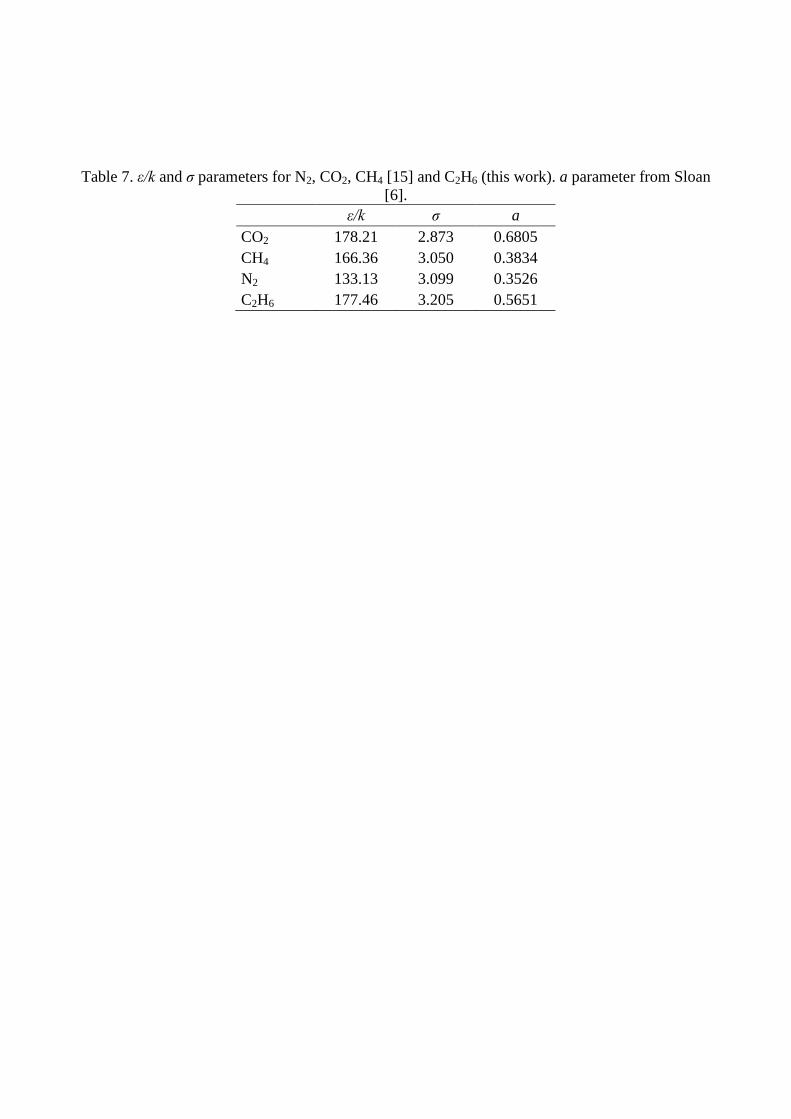
Table 7. ε/k and σ parameters for N2, CO2, CH4 [15] and C2H6 (this work). a parameter from Sloan
[6].
ε/k σ a
CO2 178.21 2.873 0.6805
CH4 166.36 3.050 0.3834
N2 133.13 3.099 0.3526
C2H6 177.46 3.205 0.5651
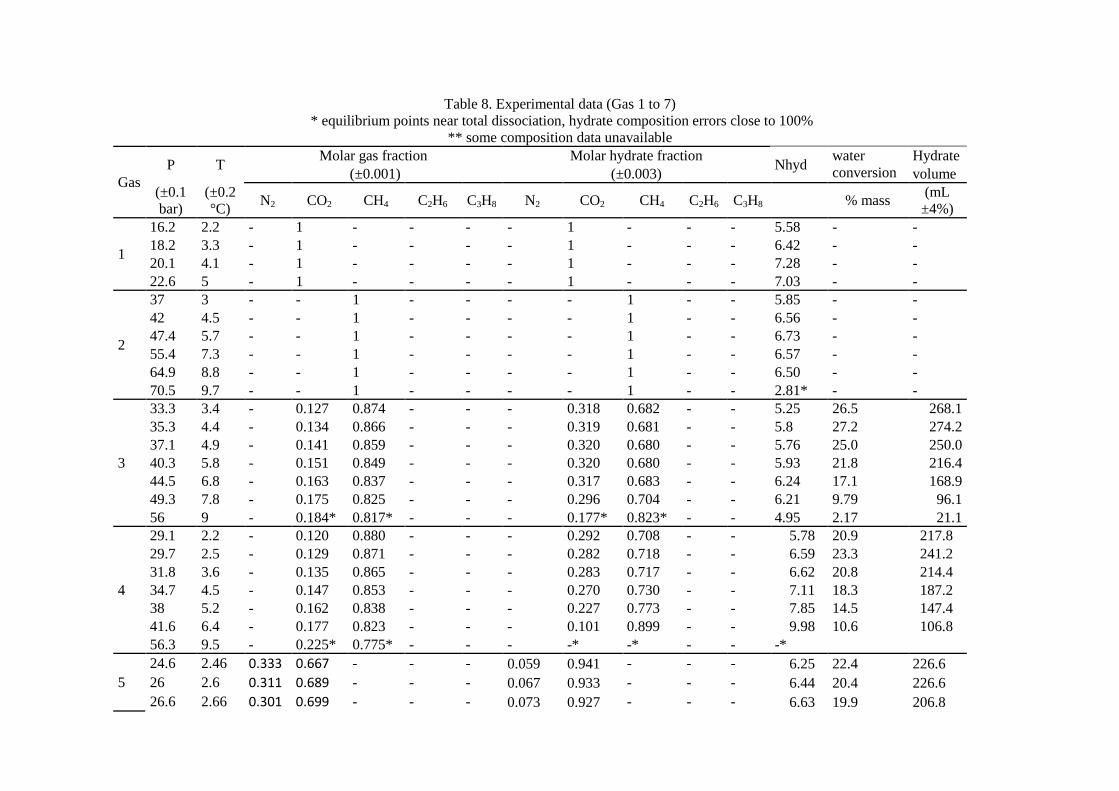
Table 8. Experimental data (Gas 1 to 7)
* equilibrium points near total dissociation, hydrate composition errors close to 100%
** some composition data unavailable
Gas
P T Molar gas fraction Molar hydrate fraction
Nhyd water
conversion
Hydrate
(±0.001) (±0.003) volume
(±0.1
bar)
(±0.2
°C) N2 CO2 CH4 C2H6 C3H8 N2 CO2 CH4 C2H6 C3H8
% mass (mL
±4%)
1
16.2 2.2 - 1 - - - - 1 - - - 5.58 - -
18.2 3.3 - 1 - - - - 1 - - - 6.42 - -
20.1 4.1 - 1 - - - - 1 - - - 7.28 - -
22.6 5 - 1 - - - - 1 - - - 7.03 - -
2
37 3 - - 1 - - - - 1 - - 5.85 - -
42 4.5 - - 1 - - - - 1 - - 6.56 - -
47.4 5.7 - - 1 - - - - 1 - - 6.73 - -
55.4 7.3 - - 1 - - - - 1 - - 6.57 - -
64.9 8.8 - - 1 - - - - 1 - - 6.50 - -
70.5 9.7 - - 1 - - - - 1 - - 2.81* - -
3
33.3 3.4 - 0.127 0.874 - - - 0.318 0.682 - - 5.25 26.5 268.1
35.3 4.4 - 0.134 0.866 - - - 0.319 0.681 - - 5.8 27.2 274.2
37.1 4.9 - 0.141 0.859 - - - 0.320 0.680 - - 5.76 25.0 250.0
40.3 5.8 - 0.151 0.849 - - - 0.320 0.680 - - 5.93 21.8 216.4
44.5 6.8 - 0.163 0.837 - - - 0.317 0.683 - - 6.24 17.1 168.9
49.3 7.8 - 0.175 0.825 - - - 0.296 0.704 - - 6.21 9.79 96.1
56 9 - 0.184* 0.817* - - - 0.177* 0.823* - - 4.95 2.17 21.1
4
29.1 2.2 - 0.120 0.880 - - - 0.292 0.708 - - 5.78 20.9 217.8
29.7 2.5 - 0.129 0.871 - - - 0.282 0.718 - - 6.59 23.3 241.2
31.8 3.6 - 0.135 0.865 - - - 0.283 0.717 - - 6.62 20.8 214.4
34.7 4.5 - 0.147 0.853 - - - 0.270 0.730 - - 7.11 18.3 187.2
38 5.2 - 0.162 0.838 - - - 0.227 0.773 - - 7.85 14.5 147.4
41.6 6.4 - 0.177 0.823 - - - 0.101 0.899 - - 9.98 10.6 106.8
56.3 9.5 - 0.225* 0.775* - - - -* -* - - -*
5
24.6 2.46 0.333 0.667 - - - 0.059 0.941 - - - 6.25 22.4 226.6
26 2.6 0.311 0.689 - - - 0.067 0.933 - - - 6.44 20.4 226.6
26.6 2.66 0.301 0.699 - - - 0.073 0.927 - - - 6.63 19.9 206.8
28.7 2.87 0.277 0.723 - - - 0.087 0.913 - - - 5.87 13.3 201.2
31.3 3.13 0.253 0.747 - - - 0.119 0.881 - - - 7.04 10.1 136.9
33.8 6.75 0.232 0.768 0.318* 0.682* 6.45* 2.90 105.2
6** 30.7 2.2 - - - - - - - - - - - - -
7**
27.1 1 - 0.034 0.955 0.012 - - - - - - - - -
27.6 1.4 - 0.035 0.953 0.013 - - - - - - - - -
28.3 2 - 0.035 0.951 0.014 - - - - - - - - -
28.8 2.5 - 0.035 0.948 0.017 - - - - - - - - -
28.9 2.8 - 0.036 0.946 0.019 - - - - - - - - -
29.3 3.3 - 0.035 0.944 0.021 - - - - - - - - -
30.2 4 - 0.035 0.939 0.026 - - - - - - - - -
30.6 5 - 0.036 0.936 0.028 - - - - - - - - -
30.6 5.8 - 0.036* 0.936* 0.029* - - - - - - - - -
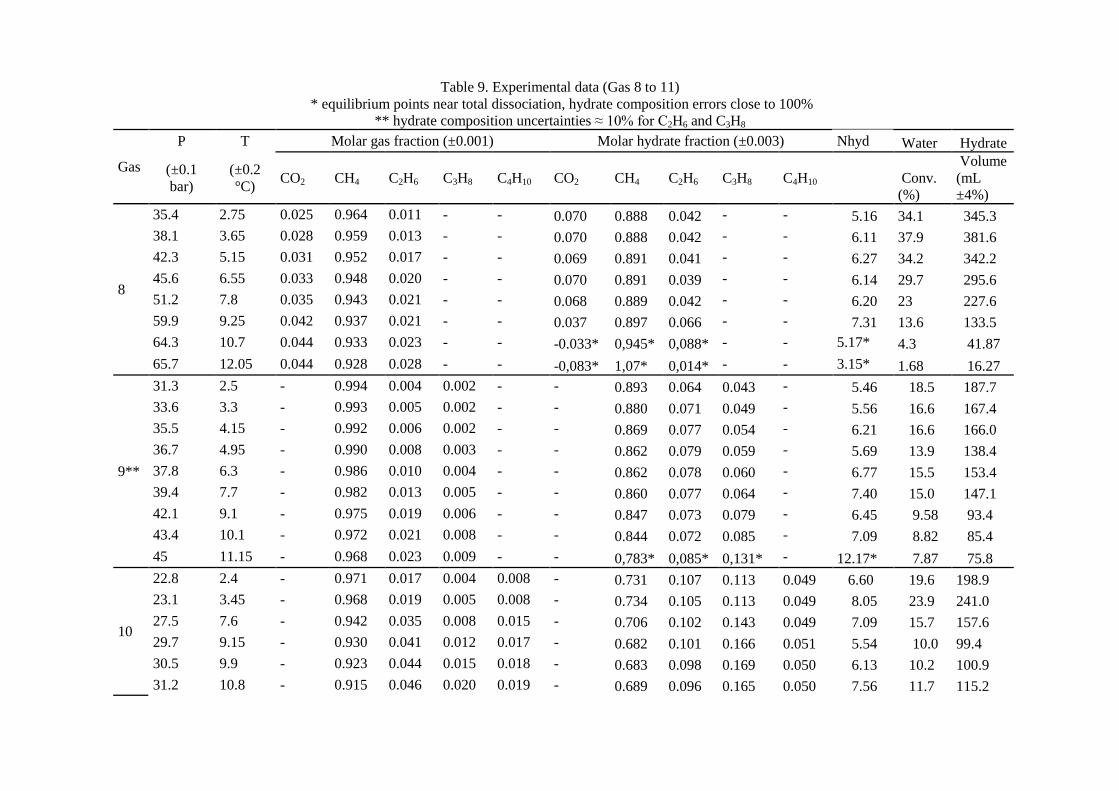
Table 9. Experimental data (Gas 8 to 11)
* equilibrium points near total dissociation, hydrate composition errors close to 100%
** hydrate composition uncertainties ≈ 10% for C2H6 and C3H8
Gas
P T Molar gas fraction (±0.001) Molar hydrate fraction (±0.003) Nhyd Water Hydrate
(±0.1
bar)
(±0.2
°C) CO2 CH4 C2H6 C3H8 C4H10 CO2 CH4 C2H6 C3H8 C4H10
Conv.
(%)
Volume
(mL
±4%)
8
35.4 2.75 0.025 0.964 0.011 - - 0.070 0.888 0.042 - - 5.16 34.1 345.3
38.1 3.65 0.028 0.959 0.013 - - 0.070 0.888 0.042 - - 6.11 37.9 381.6
42.3 5.15 0.031 0.952 0.017 - - 0.069 0.891 0.041 - - 6.27 34.2 342.2
45.6 6.55 0.033 0.948 0.020 - - 0.070 0.891 0.039 - - 6.14 29.7 295.6
51.2 7.8 0.035 0.943 0.021 - - 0.068 0.889 0.042 - - 6.20 23 227.6
59.9 9.25 0.042 0.937 0.021 - - 0.037 0.897 0.066 - - 7.31 13.6 133.5
64.3 10.7 0.044 0.933 0.023 - - -0.033* 0,945* 0,088* - - 5.17* 4.3 41.87
65.7 12.05 0.044 0.928 0.028 - - -0,083* 1,07* 0,014* - - 3.15* 1.68 16.27
9**
31.3 2.5 - 0.994 0.004 0.002 - - 0.893 0.064 0.043 - 5.46 18.5 187.7
33.6 3.3 - 0.993 0.005 0.002 - - 0.880 0.071 0.049 - 5.56 16.6 167.4
35.5 4.15 - 0.992 0.006 0.002 - - 0.869 0.077 0.054 - 6.21 16.6 166.0
36.7 4.95 - 0.990 0.008 0.003 - - 0.862 0.079 0.059 - 5.69 13.9 138.4
37.8 6.3 - 0.986 0.010 0.004 - - 0.862 0.078 0.060 - 6.77 15.5 153.4
39.4 7.7 - 0.982 0.013 0.005 - - 0.860 0.077 0.064 - 7.40 15.0 147.1
42.1 9.1 - 0.975 0.019 0.006 - - 0.847 0.073 0.079 - 6.45 9.58 93.4
43.4 10.1 - 0.972 0.021 0.008 - - 0.844 0.072 0.085 - 7.09 8.82 85.4
45 11.15 - 0.968 0.023 0.009 - - 0,783* 0,085* 0,131* - 12.17* 7.87 75.8
10
22.8 2.4 - 0.971 0.017 0.004 0.008 - 0.731 0.107 0.113 0.049 6.60 19.6 198.9
23.1 3.45 - 0.968 0.019 0.005 0.008 - 0.734 0.105 0.113 0.049 8.05 23.9 241.0
27.5 7.6 - 0.942 0.035 0.008 0.015 - 0.706 0.102 0.143 0.049 7.09 15.7 157.6
29.7 9.15 - 0.930 0.041 0.012 0.017 - 0.682 0.101 0.166 0.051 5.54 10.0 99.4
30.5 9.9 - 0.923 0.044 0.015 0.018 - 0.683 0.098 0.169 0.050 6.13 10.2 100.9
31.2 10.8 - 0.915 0.046 0.020 0.019 - 0.689 0.096 0.165 0.050 7.56 11.7 115.2
32.2 11.7 - 0.906 0.048 0.026 0.021 - 0.693 0.095 0.163 0.049 8.69 11.9 115.9
33.4 12.65 - 0.896 0.050 0.032 0.022 - 0.700 0.094 0.157 0.049 10.20 11.6 112.3
34.6 13.65 - 0.888 0.052 0.037 0.023 - 0.700 0.093 0.157 0.050 11.11 9.88 95.2
34.8 14.7 - 0.887 0.052 0.038 0.023 - 0.702 0.091 0.157 0.050 10.97 9.48 90.6
35.2 15.65 - 0.885 0.053 0.039 0.023 - 0.704 0.089 0.159 0.048 13.66 11.1 105.5
36.1 16.6 - 0.879 0.054 0.042 0.024 - 0.707 0.085 0.159 0.049 16.23 10.2 96.7
38.1 17.7 - 0.863 0.057 0.054 0.026 - 0,909* 0,050* 0,008* 0,033* 52.57* 10.8 101.1
38.2 18.6 - 0.863 0.057 0.054 0.026 - 0,902* 0,052* 0,013* 0,033* 46.08* 7.90 73.5
11
21.4 2.75 - 0.955 0.024 0.007 0.014 - 0.728 0.079 0.153 0.040 7.23 22.0 222.6
21.6 4.3 - 0.955 0.024 0.007 0.014 - 0.726 0.080 0.154 0.040 7.26 22.0 222.0
21.8 4.85 - 0.953 0.025 0.009 0.014 - 0.726 0.080 0.154 0.040 7.37 22.3 222.8
22.1 5.9 - 0.951 0.025 0.010 0.014 - 0.724 0.080 0.155 0.041 7.36 22.0 218.8
22.6 6.8 - 0.948 0.027 0.011 0.014 - 0.722 0.080 0.157 0.041 7.23 21.1 208.6
23.6 7.45 - 0.939 0.031 0.015 0.016 - 0.719 0.078 0.162 0.041 7.55 20.8 204.1
25.3 9.2 - 0.926 0.035 0.022 0.017 - 0.714 0.076 0.169 0.041 7.81 19.2 187.7
28.2 11.05 - 0.905 0.042 0.032 0.021 - 0.706 0.070 0.184 0.040 8.60 16.6 160.8
37.2 18.15 - 0.845 0.050 0.078 0.027 - 0,971* 0,040* -0,012* -0,001 34* 5.94 57.1
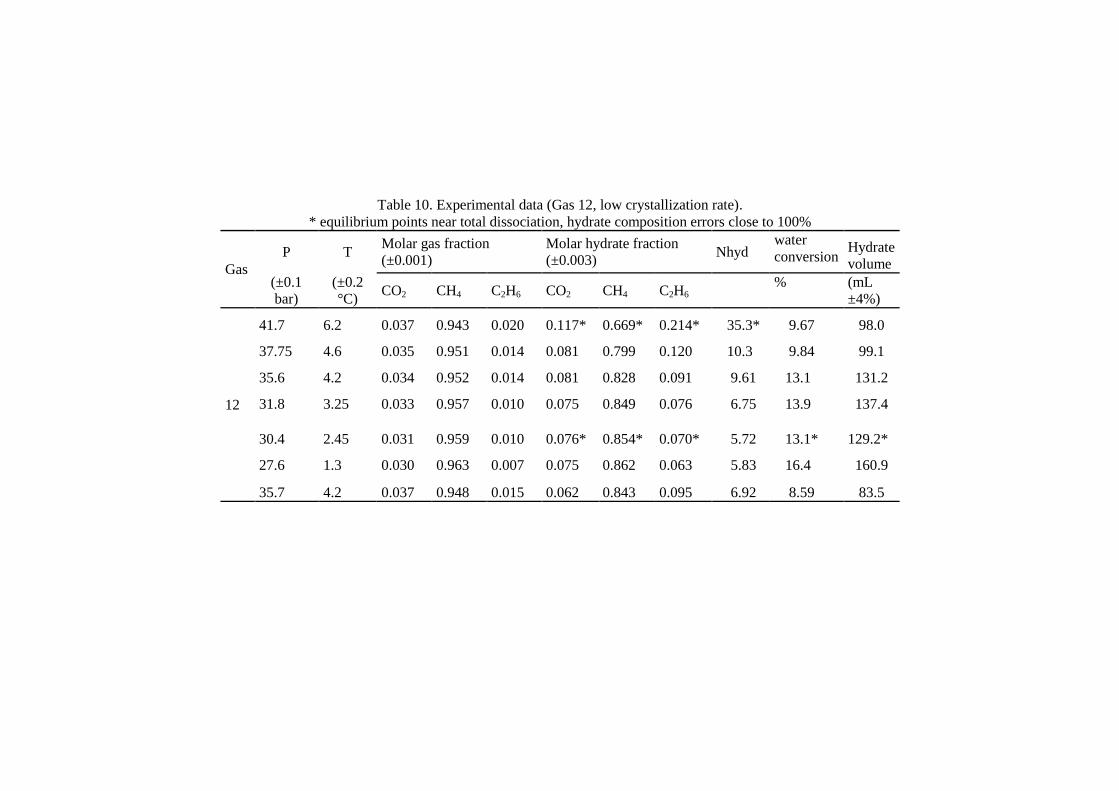
Table 10. Experimental data (Gas 12, low crystallization rate).
* equilibrium points near total dissociation, hydrate composition errors close to 100%
Gas
P T Molar gas fraction
(±0.001)
Molar hydrate fraction
(±0.003) Nhyd
water
conversion Hydrate
volume
(±0.1
bar)
(±0.2
°C) CO2 CH4 C2H6 CO2 CH4 C2H6
% (mL
±4%)
12
41.7 6.2 0.037 0.943 0.020 0.117* 0.669* 0.214* 35.3* 9.67 98.0
37.75 4.6 0.035 0.951 0.014 0.081 0.799 0.120 10.3 9.84 99.1
35.6 4.2 0.034 0.952 0.014 0.081 0.828 0.091 9.61 13.1 131.2
31.8 3.25 0.033 0.957 0.010 0.075 0.849 0.076 6.75 13.9 137.4
30.4 2.45 0.031 0.959 0.010 0.076* 0.854* 0.070* 5.72 13.1*
129.2*
27.6 1.3 0.030 0.963 0.007 0.075 0.862 0.063 5.83 16.4 160.9
35.7 4.2 0.037 0.948 0.015 0.062 0.843 0.095 6.92 8.59 83.5
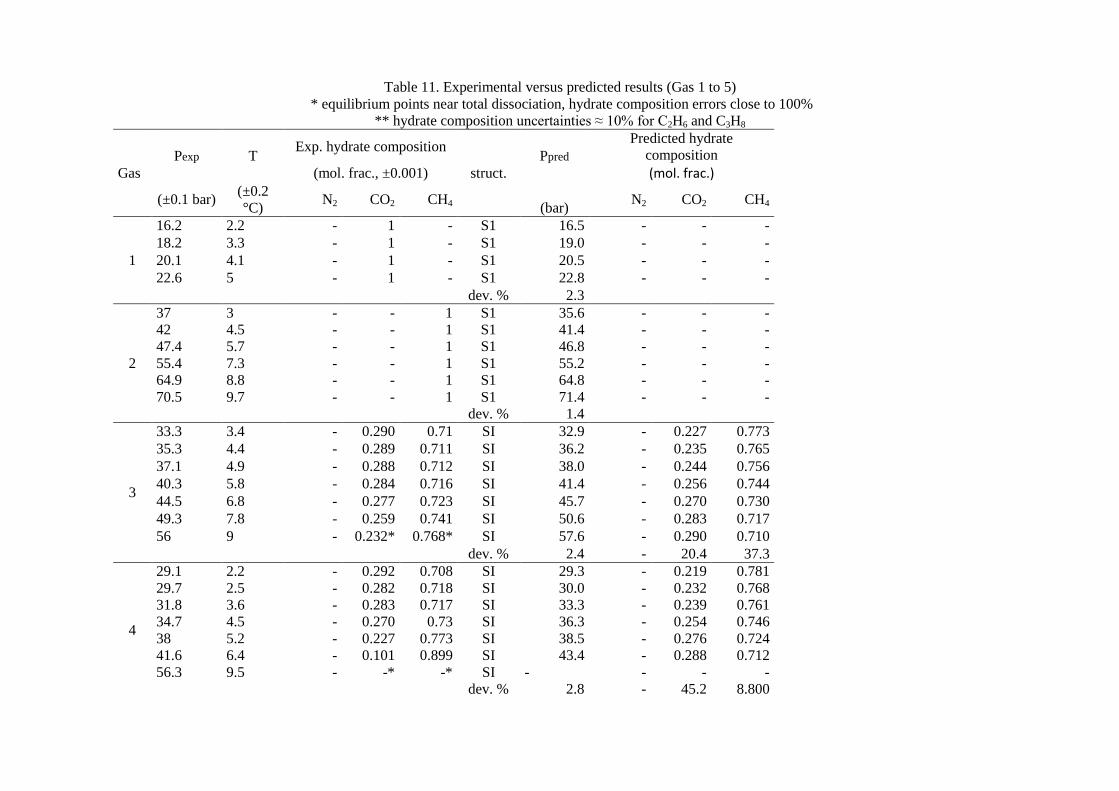
Table 11. Experimental versus predicted results (Gas 1 to 5)
* equilibrium points near total dissociation, hydrate composition errors close to 100%
** hydrate composition uncertainties ≈ 10% for C2H6 and C3H8
Gas
Pexp T Exp. hydrate composition
struct.
Ppred
Predicted hydrate
composition
(mol. frac., ±0.001) (mol. frac.)
(±0.1 bar) (±0.2
°C) N2 CO2 CH4 (bar)
N2 CO2 CH4
1
16.2 2.2 - 1 - S1 16.5 - - -
18.2 3.3 - 1 - S1 19.0 - - -
20.1 4.1 - 1 - S1 20.5 - - -
22.6 5 - 1 - S1 22.8 - - -
dev. % 2.3
2
37 3 - - 1 S1 35.6 - - -
42 4.5 - - 1 S1 41.4 - - -
47.4 5.7 - - 1 S1 46.8 - - -
55.4 7.3 - - 1 S1 55.2 - - -
64.9 8.8 - - 1 S1 64.8 - - -
70.5 9.7 - - 1 S1 71.4 - - -
dev. % 1.4
3
33.3 3.4 - 0.290 0.71 SI 32.9 - 0.227 0.773
35.3 4.4 - 0.289 0.711 SI 36.2 - 0.235 0.765
37.1 4.9 - 0.288 0.712 SI 38.0 - 0.244 0.756
40.3 5.8 - 0.284 0.716 SI 41.4 - 0.256 0.744
44.5 6.8 - 0.277 0.723 SI 45.7 - 0.270 0.730
49.3 7.8 - 0.259 0.741 SI 50.6 - 0.283 0.717
56 9 - 0.232* 0.768* SI 57.6 - 0.290 0.710
dev. % 2.4 - 20.4 37.3
4
29.1 2.2 - 0.292 0.708 SI 29.3 - 0.219 0.781
29.7 2.5 - 0.282 0.718 SI 30.0 - 0.232 0.768
31.8 3.6 - 0.283 0.717 SI 33.3 - 0.239 0.761
34.7 4.5 - 0.270 0.73 SI 36.3 - 0.254 0.746
38 5.2 - 0.227 0.773 SI 38.5 - 0.276 0.724
41.6 6.4 - 0.101 0.899 SI 43.4 - 0.288 0.712
56.3 9.5 - -* -* SI - - - -
dev. % 2.8 - 45.2 8.800
5
24.6 2.46 0.059 0.941 - SI 25.3 0.045 0.955 -
26 2.6 0.067 0.933 - SI 26.9 0.042 0.958 -
26.6 2.66 0.073 0.927 - SI 27.3 0.040 0.960 -
28.7 2.87 0.087 0.913 - SI 29.9 0.037 0.963 -
31.3 3.13 0.119 0.881 - SI 32.2 0.034 0.966 -
33.8 6.75 0.318* 0.682*
SI 34.8 0.032 0.968 -
dev. % 3.2 54.200 10.800 -
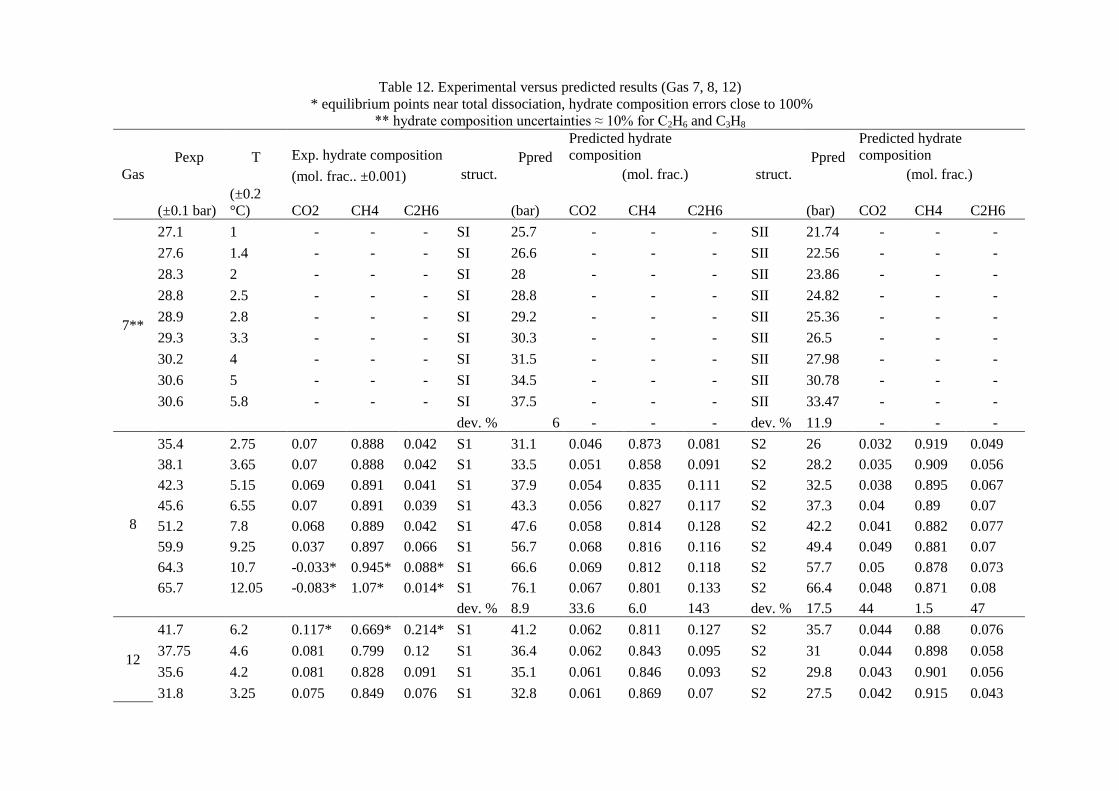
Table 12. Experimental versus predicted results (Gas 7, 8, 12)
* equilibrium points near total dissociation, hydrate composition errors close to 100%
** hydrate composition uncertainties ≈ 10% for C2H6 and C3H8
Gas
Pexp T Exp. hydrate composition
struct.
Ppred
Predicted hydrate
composition
struct.
Ppred
Predicted hydrate
composition
(mol. frac.. ±0.001) (mol. frac.) (mol. frac.)
(±0.1 bar)
(±0.2
°C) CO2 CH4 C2H6 (bar) CO2 CH4 C2H6 (bar) CO2 CH4 C2H6
7**
27.1 1 - - - SI 25.7 - - - SII 21.74 - - -
27.6 1.4 - - - SI 26.6 - - - SII 22.56 - - -
28.3 2 - - - SI 28 - - - SII 23.86 - - -
28.8 2.5 - - - SI 28.8 - - - SII 24.82 - - -
28.9 2.8 - - - SI 29.2 - - - SII 25.36 - - -
29.3 3.3 - - - SI 30.3 - - - SII 26.5 - - -
30.2 4 - - - SI 31.5 - - - SII 27.98 - - -
30.6 5 - - - SI 34.5 - - - SII 30.78 - - -
30.6 5.8 - - - SI 37.5 - - - SII 33.47 - - -
dev. % 6 - - - dev. % 11.9 - - -
8
35.4 2.75 0.07 0.888 0.042 S1 31.1 0.046 0.873 0.081 S2 26 0.032 0.919 0.049
38.1 3.65 0.07 0.888 0.042 S1 33.5 0.051 0.858 0.091 S2 28.2 0.035 0.909 0.056
42.3 5.15 0.069 0.891 0.041 S1 37.9 0.054 0.835 0.111 S2 32.5 0.038 0.895 0.067
45.6 6.55 0.07 0.891 0.039 S1 43.3 0.056 0.827 0.117 S2 37.3 0.04 0.89 0.07
51.2 7.8 0.068 0.889 0.042 S1 47.6 0.058 0.814 0.128 S2 42.2 0.041 0.882 0.077
59.9 9.25 0.037 0.897 0.066 S1 56.7 0.068 0.816 0.116 S2 49.4 0.049 0.881 0.07
64.3 10.7 -0.033* 0.945* 0.088* S1 66.6 0.069 0.812 0.118 S2 57.7 0.05 0.878 0.073
65.7 12.05 -0.083* 1.07* 0.014* S1 76.1 0.067 0.801 0.133 S2 66.4 0.048 0.871 0.08
dev. % 8.9 33.6 6.0 143 dev. % 17.5 44 1.5 47
12
41.7 6.2 0.117* 0.669* 0.214* S1 41.2 0.062 0.811 0.127 S2 35.7 0.044 0.88 0.076
37.75 4.6 0.081 0.799 0.12 S1 36.4 0.062 0.843 0.095 S2 31 0.044 0.898 0.058
35.6 4.2 0.081 0.828 0.091 S1 35.1 0.061 0.846 0.093 S2 29.8 0.043 0.901 0.056
31.8 3.25 0.075 0.849 0.076 S1 32.8 0.061 0.869 0.07 S2 27.5 0.042 0.915 0.043
30.4 2.45 0.076* 0.854* 0.070* S1 30.3 0.059 0.871 0.07 S2 25.4 0.04 0.917 0.043
27.6 1.3 0.075 0.862 0.063 S1 27.5 0.057 0.885 0.058 S2 22.8 0.039 0.926 0.035
35.7 4.2 0.062 0.843 0.095 S1 34.7 0.066 0.835 0.099 S2 29.7 0.046 0.894 0.06
dev. % 1.8 23.8 5.3 12 dev. % 16.1 45.7 11.6 45.4


![[Elearnica.ir]-Bioinspired Composites From Freeze Casting With Clathrate Hydrates](https://static.fdocuments.net/doc/165x107/55cf8532550346484b8bb928/elearnicair-bioinspired-composites-from-freeze-casting-with-clathrate-hydrates.jpg)