Water solubility & clathrate hydrates in HFC refrigerants & …€¦ · ·...
71
DOE/CE/23810-112 Final Report ASHRAE RP-923 WATER SOLUBILITY AND CLATHRATE HYDRATES IN HFC REFRIGERANTS AND REFRIGERANT BLENDS by Richard C. Cavestri, Ph.D. and William R. Schafer Imagination Resources, Inc. 5130 Blazer Memorial Parkway Dublin, Ohio 43017 July, 2000 Prepared for submission to American Society of Heating, Refrigerating and Air-Conditioning Engineers, Inc.
Transcript of Water solubility & clathrate hydrates in HFC refrigerants & …€¦ · ·...
DOE/CE/23810-112
Final ReportASHRAE RP-923
WATER SOLUBILITYAND CLATHRATE HYDRATES
INHFC REFRIGERANTS
AND REFRIGERANT BLENDS
by
Richard C. Cavestri, Ph.D.
and
William R. Schafer
Imagination Resources, Inc.5130 Blazer Memorial Parkway
Dublin, Ohio 43017
July, 2000
Prepared for submission to
American Society of Heating, Refrigerating and Air-Conditioning Engineers, Inc.
ii
ABSTRACT
This research project determined the solubility of water in HFC refrigerants R-134a, R-
32, R-143a, R-125, and R-152a and HFC refrigerant blends R410A, R407C, R507A, and R404A
from -100°F (-73°C) to 160°F (71°C) (or within 15°F (8.3°C) of critical temperature) in liquid
refrigerant and in the presence of refrigerant clathrate hydrate below 60°F (16°C). Water
solubility curves were constructed for each refrigerant and blend by measuring water content at
20°F (11°C) increments over the entire temperature range. In this study, all refrigerants in the
presence of 1% w/w water were confirmed to form stable solid clathrate hydrates between 50°F
(10°C) and 60°F (16°C), with R-32 and blends containing R-32 demonstrating stable clathrate
hydrates up to 80°F (27°C).
Evaluation of water solubility in HFC refrigerants and blends was performed using a
small, bench-top unit constructed of type 316 stainless steel that was temperature controlled,
inexpensive to build, and easy to operate. The test cell/unit controlled the temperature of both
the liquid and vapor refrigerant phases. This instrument and a Karl Fischer coulometer were
used to measure the water equilibrium in solution of the aforementioned HFC refrigerants and
blends at the specified temperatures, as well as water equilibrium between clathrate hydrate and
liquid refrigerant. This project determined the maximum amount of water permissible for
operating systems down to -40°F (-40°C).
iii
TABLE OF CONTENTS
ABSTRACT.................................................................................................................................... ii
LIST OF TABLES ......................................................................................................................... iv
LIST OF FIGURES..........................................................................................................................v
LIST OF APPENDICES............................................................................................................... vii
ACKNOWLEDGMENTS ...............................................................................................................1
INTRODUCTION............................................................................................................................2
BACKGROUND .............................................................................................................................3
ANALYTICAL PROTOCOL..........................................................................................................3
Test Unit 1 .....................................................................................................................................3Test Unit 2 .....................................................................................................................................4Test Unit 3 .....................................................................................................................................7Clathrate Hydrates .......................................................................................................................11Method.........................................................................................................................................13Refrigerant and Water Introduction.............................................................................................13Data Collection............................................................................................................................14
DISCUSSION OF RESULTS........................................................................................................14
R-134a .........................................................................................................................................15R-32 .............................................................................................................................................15R-143a .........................................................................................................................................16R-125 ...........................................................................................................................................16R-152a .........................................................................................................................................17R410A..........................................................................................................................................17R407C..........................................................................................................................................18R507A..........................................................................................................................................19R404A..........................................................................................................................................19R-22 .............................................................................................................................................19R-23 .............................................................................................................................................20
CONCLUSION..............................................................................................................................20
REFERENCES ..............................................................................................................................38
iv
LIST OF TABLES
Table 1: Maximum Amount of Water Tolerable in Systems at -40°F (-40°C) Based on ClathrateFormation.............................................................................................................................................22
Table A.1 Raw Data Points: Solubility of H2O in R-134a with 8.0g H2O and 1.0Kg R-134a............42
Table A.2 Raw Data Points: Solubility of H2O in R-32 with 15g H2O and 1.5Kg R-32 ....................43
Table A.3 Raw Data Points: Solubility of H2O in R-32 with 25g H2O in 50g 14-20 mesh SilicaGel and 1.5Kg R-32 .............................................................................................................................44
Table A.4 Raw Data Points: Solubility of H2O in R-143a with 15g H2O and 1.5Kg R-143a.............45
Table A.5 Raw Data Points: Solubility of H2O in R-125 with 10g H2O and 1.0Kg R-125 ................46
Table A.6 Raw Data Points: Solubility of H2O in R-152a with 15g H2O and 1.5Kg R-152a.............47
Table A.7 Raw Data Points: Solubility of H2O in R410A with 10g H2O and 1.0Kg R410A .............48
Table A.8 Raw Data Points: Solubility of H2O in R407C with 10g H2O and 1.0Kg R407C..............49
Table A.9 Raw Data Points: Solubility of H2O in R507A with 10g H2O and 1.0Kg R507A .............50
Table A.10 Raw Data Points: Solubility of H2O in R404A with 15g H2O and 1.5Kg R404A ...........51
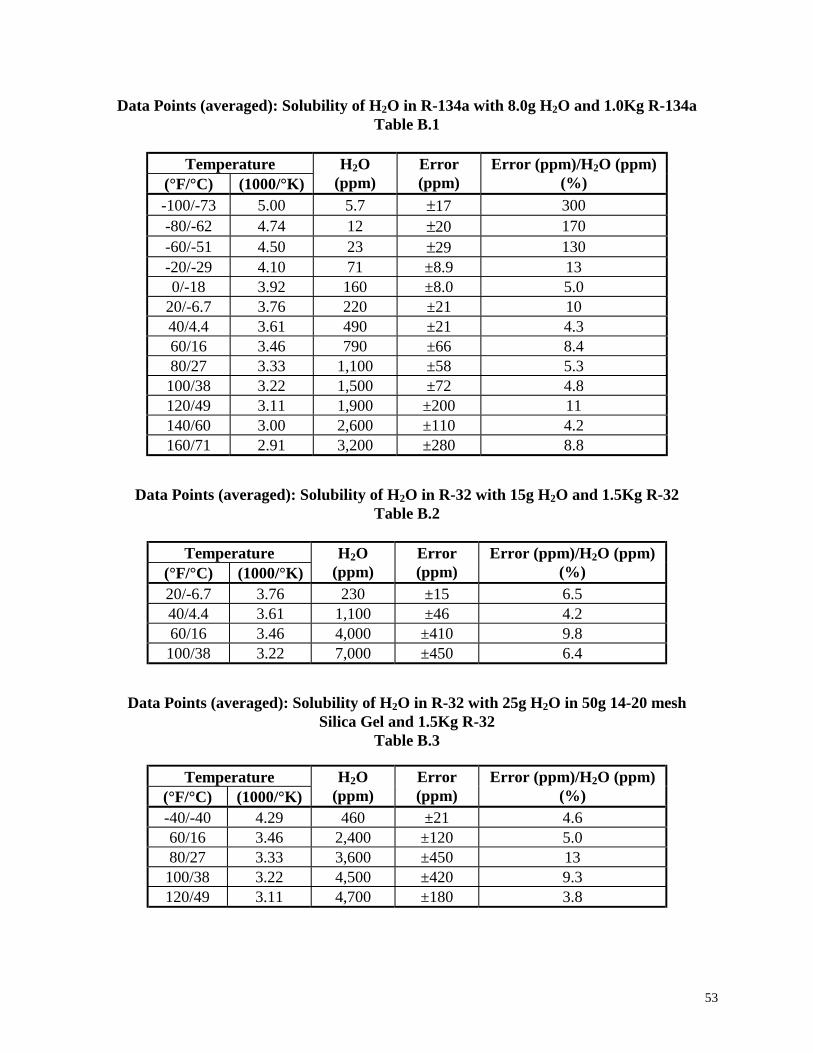
Table B.1 Data Points (averaged): Solubility of H2O in R-134a with 8.0g H2O and 1.0Kg R-134a...53
Table B.2 Data Points (averaged): Solubility of H2O in R-32 with 15g H2O and 1.5Kg R-32 ...........53
Table B.3 Data Points (averaged): Solubility of H2O in R-32 with 25g H2O in 50g 14-20 meshSilica Gel and 1.5Kg R-32 ...................................................................................................................53
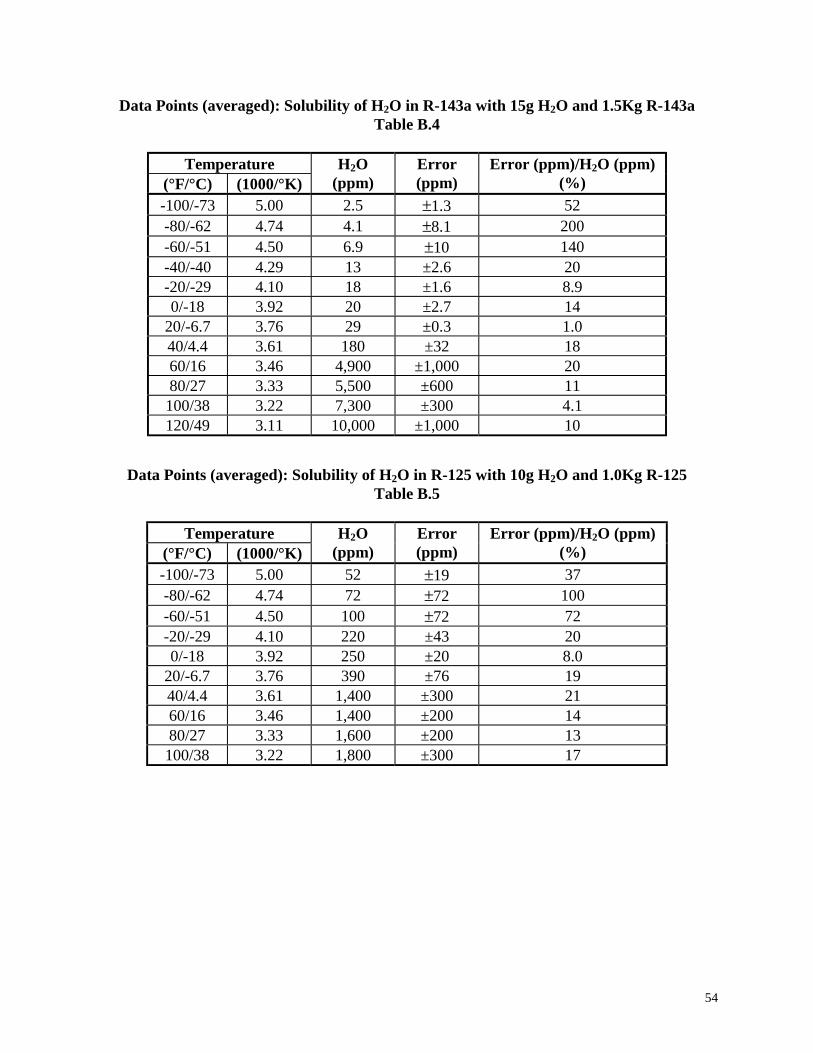
Table B.4 Data Points (averaged): Solubility of H2O in R-143a with 15g H2O and 1.5Kg R-143a....54
Table B.5 Data Points (averaged): Solubility of H2O in R-125 with 10g H2O and 1.0Kg R-125 .......54
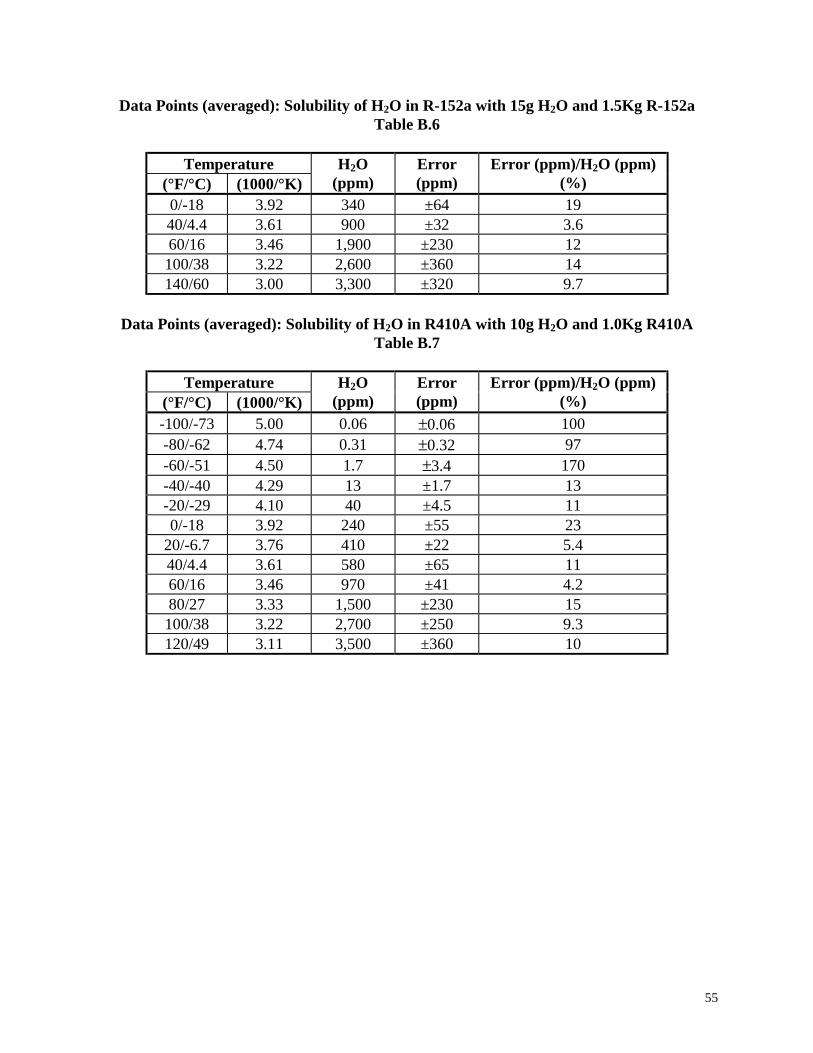
Table B.6 Data Points (averaged): Solubility of H2O in R-152a with 15g H2O and 1.5Kg R-152a....55
Table B.7 Data Points (averaged): Solubility of H2O in R410A with 10g H2O and 1.0Kg R410A....55
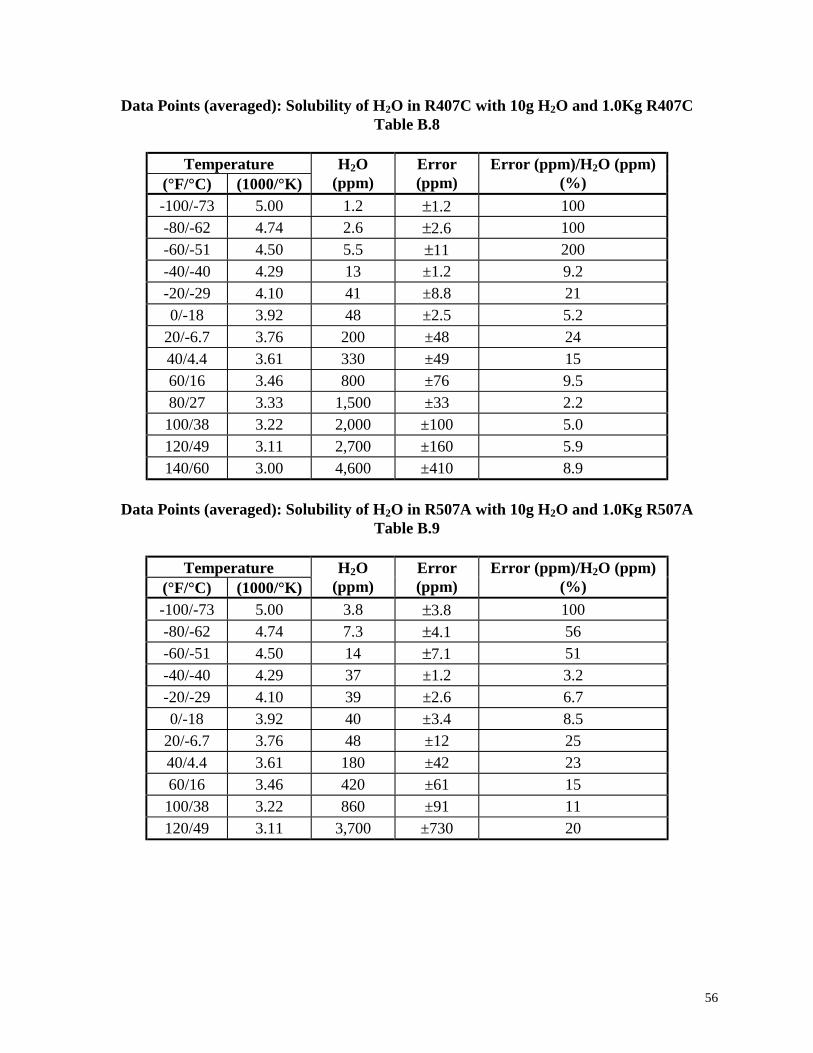
Table B.8 Data Points (averaged): Solubility of H2O in R407C with 10g H2O and 1.0Kg R407C ....56
Table B.9 Data Points (averaged): Solubility of H2O in R507A with 10g H2O and 1.0Kg R507A....56
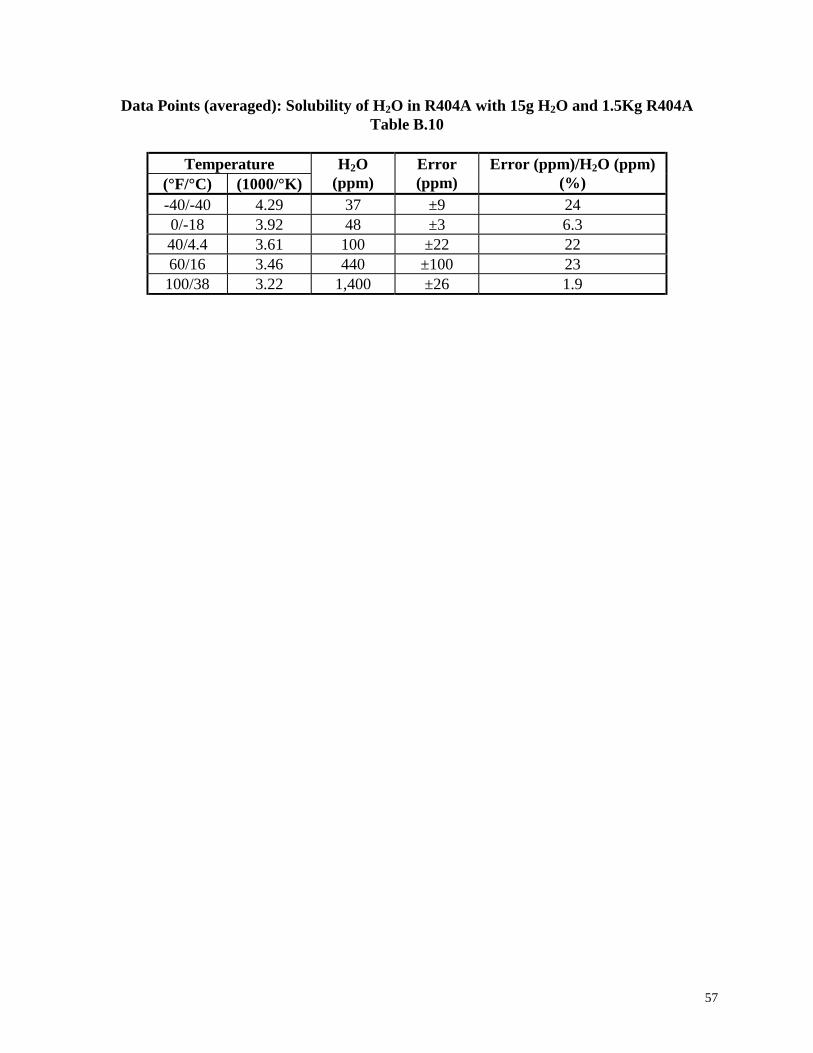
Table B.10 Data Points (averaged): Solubility of H2O in R404A with 15g H2O and 1.5Kg R404A..57
v
LIST OF FIGURES
Figure 1: Test Unit 1 ..............................................................................................................................5
Figure 2: Test Unit 2 ..............................................................................................................................6
Figure 3: Observations of HFC Refrigerants and Blends with 1% and 5% Water (w/w) Added(Observations made at 10° intervals from 80°F (27°C) down through 0°F (-18°C)) ............................8
Figure 4: Observations of HFC Refrigerants and Blends with 1% and 5% Water (w/w) Added(Observations made at 10° intervals from 0°F (-18°C) up through 80°F (27°C)) .................................9
Figure 5: Test Unit 3 ............................................................................................................................10
Figure 6: Solubility of H2O in R-134a with 8g H2O and 1.0Kg R-134a [temperature (1000/°K)vs. refrigerant H2O content (ppm)(log)] ..............................................................................................23
Figure 7: Solubility of H2O in R-32 with 15g H2O and 1.5Kg R-32 [temperature (1000/°K) vs.refrigerant H2O content (ppm)(log)] ....................................................................................................24
Figure 8: Solubility of H2O in R-32 with 25g H2O in 50g 14-20 mesh Silica Gel and 1.5Kg R-32[temperature (1000/°K) vs. refrigerant H2O content (ppm)(log)]........................................................25
Figure 9: Solubility of H2O in R-143a with 15g H2O and 1.5Kg R-143a [temperature 1000/°K)vs. refrigerant H2O content (ppm)(log)] ..............................................................................................26
Figure 10: Solubility of H2O in R-125 with 10g H2O and 1.0Kg R-125 [temperature (1000/°K)vs. refrigerant H2O content (ppm)(log)] ..............................................................................................27
Figure 11: Solubility of H2O in R-152a with 15g H2O and 1.5Kg R-152a [temperature (1000/°K)vs. refrigerant H2O content (ppm)(log)] ..............................................................................................28
Figure 12: Solubility of H2O in R410A with 10g H2O and 1.0Kg R410A [temperature (1000/°K)vs. refrigerant H2O content (ppm)(log)] ..............................................................................................29
Figure 13: Solubility of H2O in R407C with 10g H2O and 1.0Kg R407C [temperature (1000/°K)vs. refrigerant H2O content (ppm)(log)] ..............................................................................................30
Figure 14: Solubility of H2O in R507A with 10g H2O and 1.0Kg R507A [temperature (1000/°K)vs. refrigerant H2O content (ppm)(log)] ..............................................................................................31
Figure 15: Solubility of H2O in R404A with 15g H2O and 1.5Kg R404A [temperature (1000/°K)vs. refrigerant H2O content (ppm)(log)] ..............................................................................................32
Figure 16: Water Solubility Comparison of R-134a, R-32, R-143a, R-125, and R-152a[temperature (1000/°K) vs. refrigerant H2O content (ppm)(log)]........................................................33
Figure 17: Water Solubility Comparison of R-32, R-125, and R410A [temperature (1000/°K) vs.refrigerant H2O content (ppm)(log)] ....................................................................................................34
Figure 18: Water Solubility Comparison of R-134a, R-32, R-125, and R407C [temperature(1000/°K) vs. refrigerant H2O content (ppm)(log)] .............................................................................35
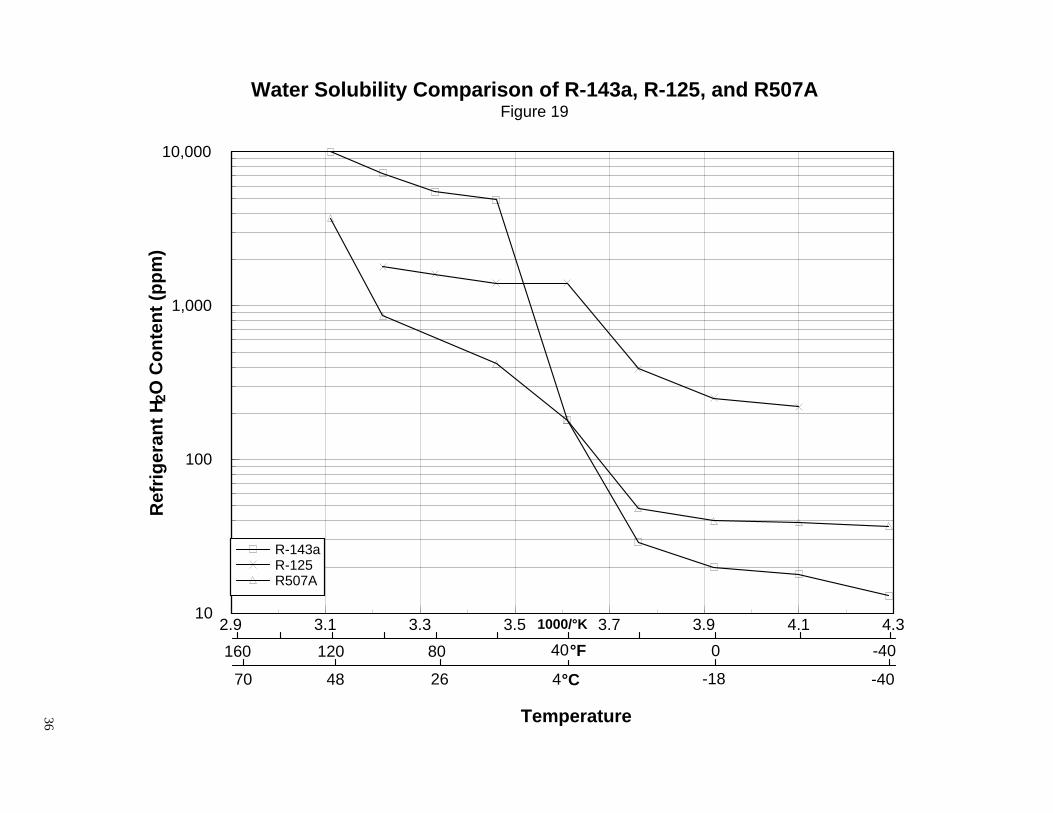
Figure 19: Water Solubility Comparison of R-143a, R-125, and R507A [temperature (1000/°K)vs. refrigerant H2O content (ppm)(log)] ..............................................................................................36
vi
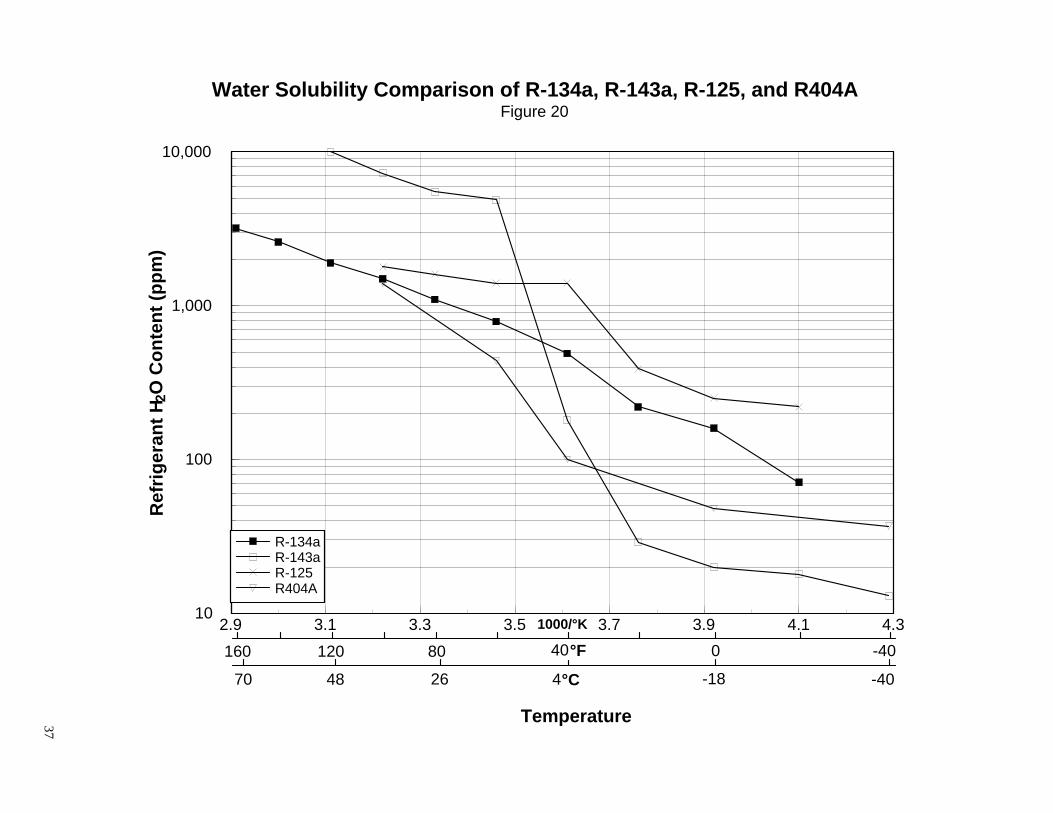
Figure 20: Water Solubility Comparison of R-134a, R-143a, R-125, and R404A [temperature(1000/°K) vs. refrigerant H2O content (ppm)(log)] .............................................................................37
vii
LIST OF APPENDICES
Appendix A: Raw Data........................................................................................................................41
Appendix B: Data Points (averaged) ...................................................................................................52
Appendix C: Sealed Tube Analysis Method........................................................................................58
Appendix D: Photographic Evidence of Clathrate Hydrate Formation ...............................................61
1
ACKNOWLEDGMENTS
This study was sponsored by the American Society of Heating, Refrigerating, and Air-
Conditioning Engineers, Inc. (ASHRAE) and the Air-Conditioning and Refrigeration Technology
Institute (ARTI; supported in part by U.S. Department of Energy – Office of Building
Technology grant number DEFGO-91CE23810: Materials Compatibility and Lubricants
Research (MCLR) on CFC-Refrigerant Substitutes) as Research Project RP-923. The support of
both organizations is gratefully acknowledged. In particular, we wish to give special
consideration to Mr. Alan Cohen, chair, Mr. Cary Haramoto, Dr. Raymond Thomas, Mr. William
Walter, Mr. Shel Rosen, and Mr. William Seaton, manager of ASHRAE research, for their
interest. Thanks to Kelly Ruona for the preparation of this report.
2
INTRODUCTION
One of the universal contaminants in hermetic systems is water, which can enter the
system through manufacturing and other means. HVAC sealed systems are manufactured,
evacuated, and nitrogen purged with heat to remove moisture before refrigerant is added. The
solubility of water in refrigerant is important nonetheless. Knowing the solubility properties of
water in refrigerant is necessary to help manufacturers in the production of sealed systems, the
calculation of desiccant quantity, the determination of water distribution ratios, and the
prevention of freeze-up conditions. Normally, a properly desiccated system has a water content
below 50 ppm, which generally does not pose a problem.
Desiccants play the vital role of maintaining refrigerant systems in an acceptably dry state
and free of circulating inorganic acid contaminants (Cavestri and Schooley 1998). Historically,
refrigerant systems were CFC and HCFC chemicals with mineral or alkylbenzene lubricants.
However, the latest systems are quite different; HFC refrigerants generally use polyolesters,
which are more polar oxygen bearing lubricants. The equilibrium water solubility in HFCs may
be different and requires measurement. Since the circulating water equilibrium conditions are
desiccant/temperature dependent, knowledge of water equilibrium with desiccant at various
temperatures is a necessity (Cavestri and Schafer 1999a and 1999b).
Unlike CFC refrigerants, HFC and HCFC refrigerants carry hydrogen atoms that create a
polarized portion of the molecule, increasing the solubility of water. Refrigerants that are fully
substituted, such as R-12, carry the least amount of water in solution (ASHRAE 1994 and
DuPont 1982a). One or two hydrogen-substituted carbon refrigerants such as R-22 and R-134a
provide the best solubility for water.
Regardless of which refrigerant or lubricant is used, moisture can cause problems in
refrigerating and air-conditioning systems. These problems are avoidable when loose and solid
filter driers are used with new and/or field-serviced equipment, or with refrigerant reclaim and
recycle equipment. For maximum life and reliability, it is essential for a system to be maintained
at a minimum circulating water content.
3
BACKGROUND
No measured data is available regarding the solubility of water in HFC refrigerants R-32,
R-143a, R-125, and R-152a and blends of these refrigerants, R410A, R407C, R507A, and
R404A. While data for R-123, R-134a, and R-22 is available (ASHRAE 1994), literature on
simple, cost-effective test methods that provide unequivocal analytical data is not. Thrasher et
al. (1993), using an NMR to measure dissolved water, reported measurement difficulties at low
temperatures.
The temperature range of this research study was -100°F (-73°C) to 160°F (71°C), or
within 15°F (8.3°C) of critical temperature. The formation of clathrate hydrates was a serious
point of concern, since their constraints on this project were unknown. However, an abundance
of information on clathrate hydrates has been published by such researchers as Chinworth and
Katz (1947), Akiya et al. (1997), Holder et al. (1988), Walker et al. (1960), and Sloan (1990).
The main objective of this research was to determine the solubility of water in liquid refrigerants;
this is simple in theory, but difficult in practice. Logic dictated the development of a test device
and method that was insensitive to temperature, refrigerant changes, and solid suspensions. The
method was actualized with a device custom-built from readily available components.
ANALYTICAL PROTOCOL
The initial protocol was to load an apparatus that circulated a quantity of degassed
refrigerant and dissolved water. Dissolved air was reported to reduce water solubility at the
specified temperature and pressure in an excess of 2.7% deionized, degassed water (w/w)
(Thrasher et al. 1993).
Test Unit 1
The first test device (Figure 1), designed for safety and high pressure, was intended to
promote slow agitation of the water and liquid refrigerant and to incorporate the vapor space in a
temperature controlled environment. This was similar in concept and design to a device used by
4
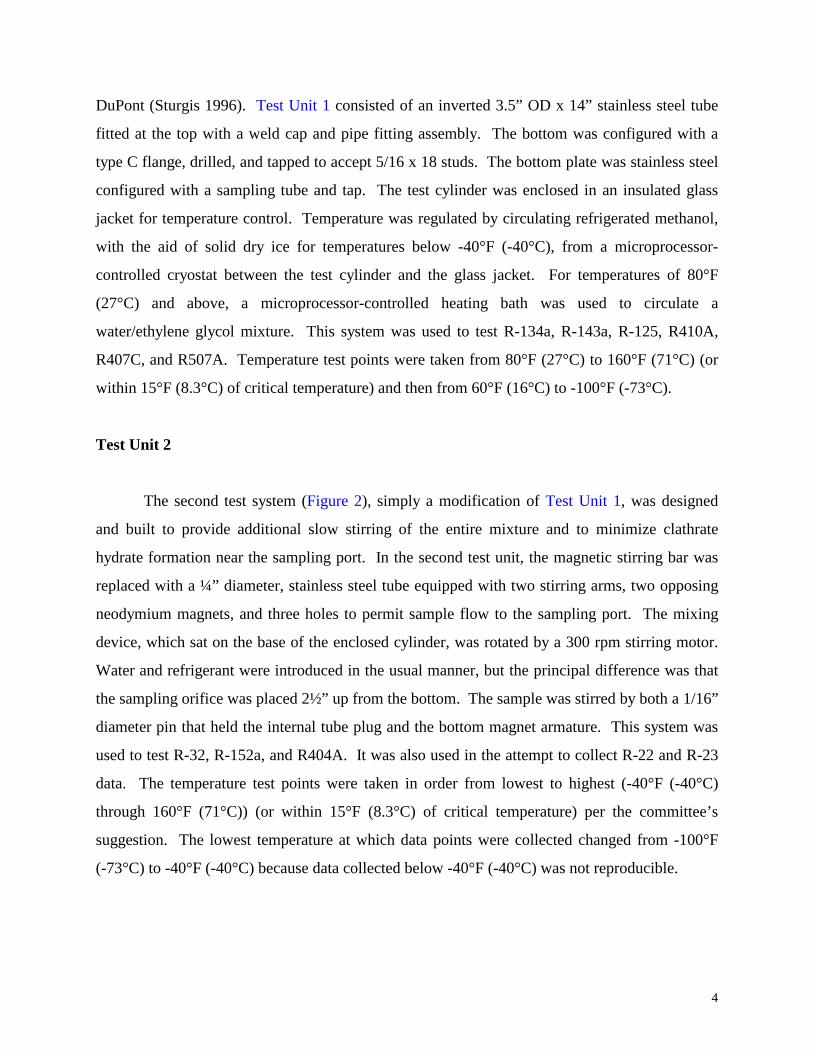
DuPont (Sturgis 1996). Test Unit 1 consisted of an inverted 3.5” OD x 14” stainless steel tube
fitted at the top with a weld cap and pipe fitting assembly. The bottom was configured with a
type C flange, drilled, and tapped to accept 5/16 x 18 studs. The bottom plate was stainless steel
configured with a sampling tube and tap. The test cylinder was enclosed in an insulated glass
jacket for temperature control. Temperature was regulated by circulating refrigerated methanol,
with the aid of solid dry ice for temperatures below -40°F (-40°C), from a microprocessor-
controlled cryostat between the test cylinder and the glass jacket. For temperatures of 80°F
(27°C) and above, a microprocessor-controlled heating bath was used to circulate a
water/ethylene glycol mixture. This system was used to test R-134a, R-143a, R-125, R410A,
R407C, and R507A. Temperature test points were taken from 80°F (27°C) to 160°F (71°C) (or
within 15°F (8.3°C) of critical temperature) and then from 60°F (16°C) to -100°F (-73°C).
Test Unit 2
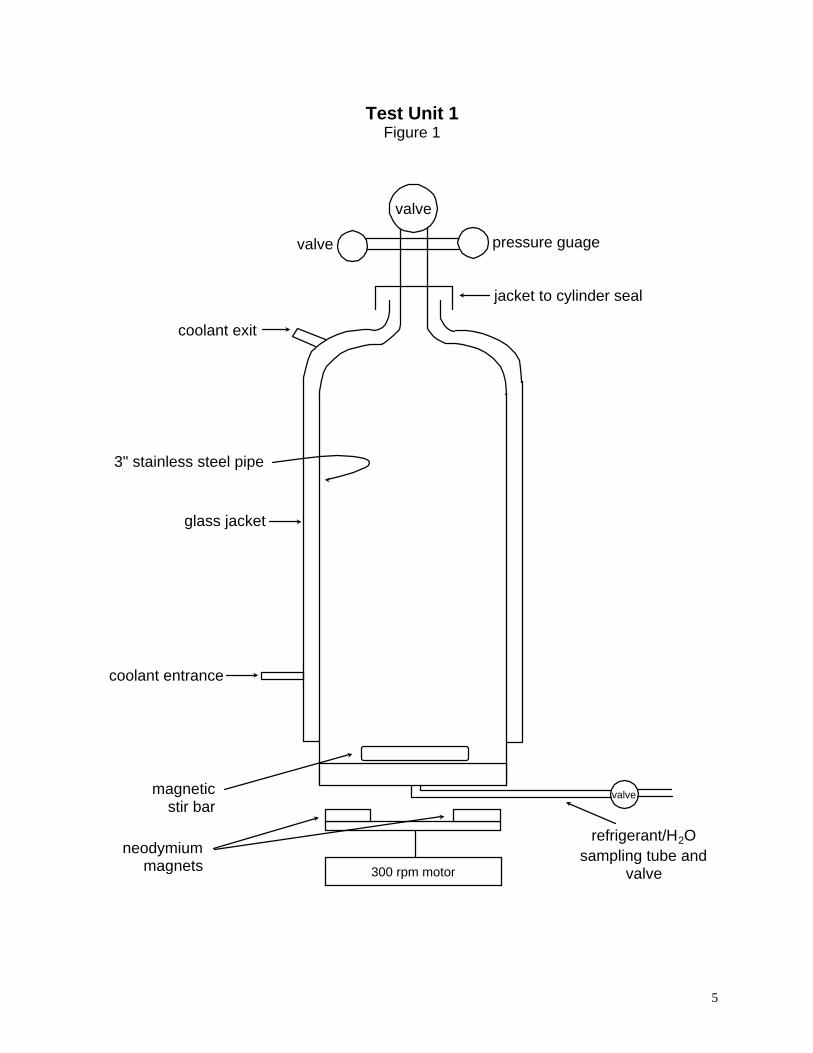
The second test system (Figure 2), simply a modification of Test Unit 1, was designed
and built to provide additional slow stirring of the entire mixture and to minimize clathrate
hydrate formation near the sampling port. In the second test unit, the magnetic stirring bar was
replaced with a ¼” diameter, stainless steel tube equipped with two stirring arms, two opposing
neodymium magnets, and three holes to permit sample flow to the sampling port. The mixing
device, which sat on the base of the enclosed cylinder, was rotated by a 300 rpm stirring motor.
Water and refrigerant were introduced in the usual manner, but the principal difference was that
the sampling orifice was placed 2½” up from the bottom. The sample was stirred by both a 1/16”
diameter pin that held the internal tube plug and the bottom magnet armature. This system was
used to test R-32, R-152a, and R404A. It was also used in the attempt to collect R-22 and R-23
data. The temperature test points were taken in order from lowest to highest (-40°F (-40°C)
through 160°F (71°C)) (or within 15°F (8.3°C) of critical temperature) per the committee’s
suggestion. The lowest temperature at which data points were collected changed from -100°F
(-73°C) to -40°F (-40°C) because data collected below -40°F (-40°C) was not reproducible.
5
refrigerant/H2O sampling tube and
valve300 rpm motor
neodymium magnets
magnetic stir bar
glass jacket
3" stainless steel pipe
Test Unit 1Figure 1
pressure guagevalve
valve
valve
jacket to cylinder seal
coolant exit
coolant entrance
6
neodymium magnets
stainless steel stirring wire
glass jacket
3" stainless steel pipe
Test Unit 2Figure 2
pressure guagevalve
valve
port to sampling valve
coolant exit
refrigerant/H2O sampling tube and
valve
valve
300 rpm motor
jacket to cylinder seal
refrigerant and water addition ports
tube plug
coolant entrance
7
The redesign of Test Unit 1 resulted from examining the water equilibrium test points
plotted as log refrigerant water content (ppm) vs. temperature (1000/°K). In particular, R-143a
clearly demonstrated two distinct slopes (see Discussion). At this point in the project, clathrate
hydrates were assumed less dense than the refrigerant; therefore, it was presumed, they would
float. Additional experimentation became necessary to learn more about the characteristics of
clathrate hydrates.
Unlike previous investigations (Akiya et al. 1997 and Lederhos et al. 1992), this study
showed clathrate hydrate formation in excess refrigerant. In order to characterize the physical
properties of the clathrate hydrates formed, sealed tubes were made with 1% and 5% water (w/w)
(Appendix C), which was outside the scope of the work statement, but necessary for this
investigation. Observation of the sealed tubes containing water and refrigerant confirmed
clathrate hydrate formation and disappearance as temperatures increased and decreased between
0°F (-18°C) and 80°F (27°C) (Appendix C). The amount of clathrate hydrates formed and the
temperature at which they appeared depended on the amount of water in the system, the
refrigerant being tested, and whether measurements were taken as the temperature was
decreasing or increasing (Figures 3 and 4).
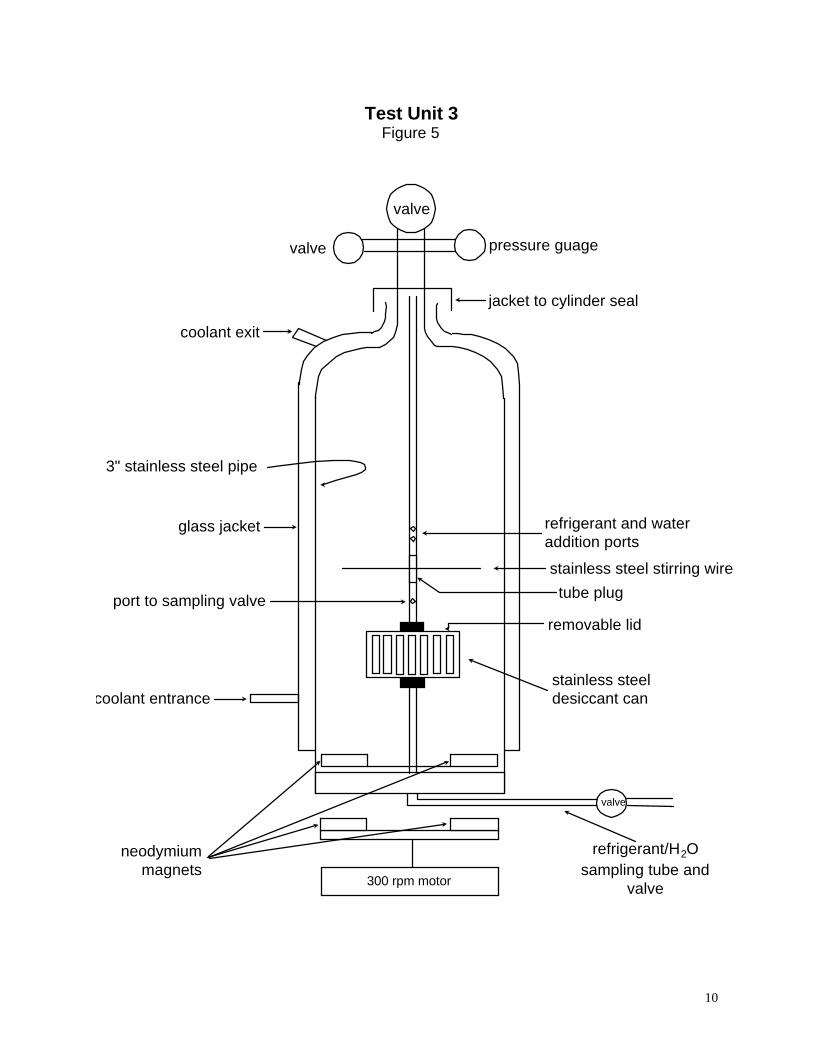
Test Unit 3
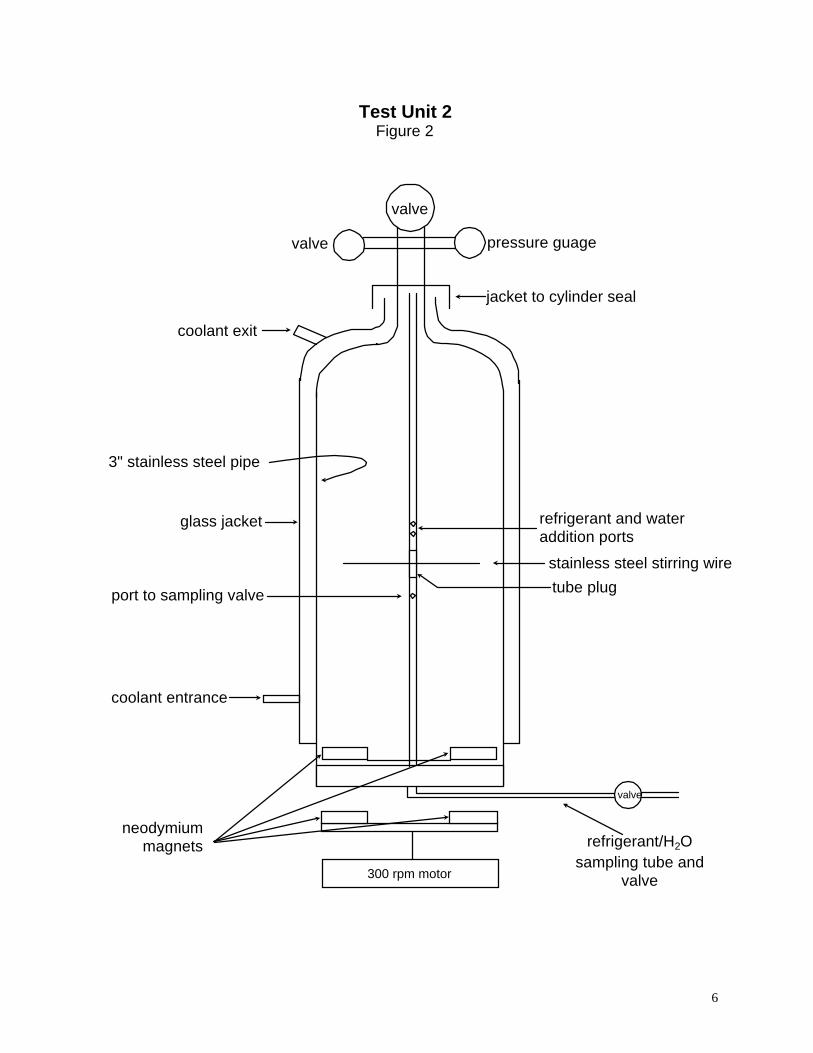
Test Unit 3 (Figure 5) is a modification of Test Unit 2. It was suggested that free water
should not be used in water solubility equilibrium studies with liquid refrigerant and that the
available water be retained in a saturated desiccant in an effort to minimize clathrate hydrate
crystal formation (Parrish et al. 1982 and Walker et al. 1960). A small can was fabricated that
could hold up to 75g of desiccant by using 30 gauge stainless steel sheet metal and 80 mesh
screens. The top was removable, but spring loaded in compression to retain the desiccant. The
top, sides, and bottom of the can had slots allowing free flow of the liquid refrigerant. The set up
of the system was otherwise the same as Test Unit 2. This system was used only with R-32 (see
Discussion).
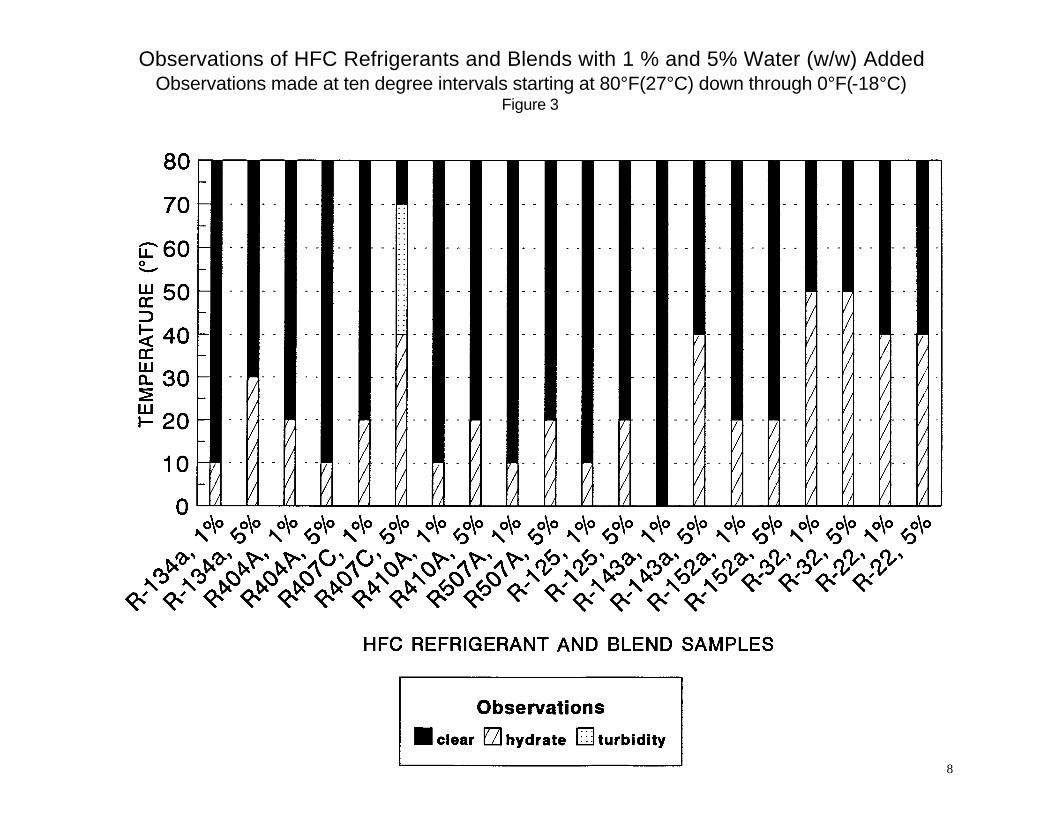
Observations of HFC Refrigerants and Blends with 1 % and 5% Water (w/w) AddedObservations made at ten degree intervals starting at 80°F(27°C) down through 0°F(-18°C)
Figure 3
8
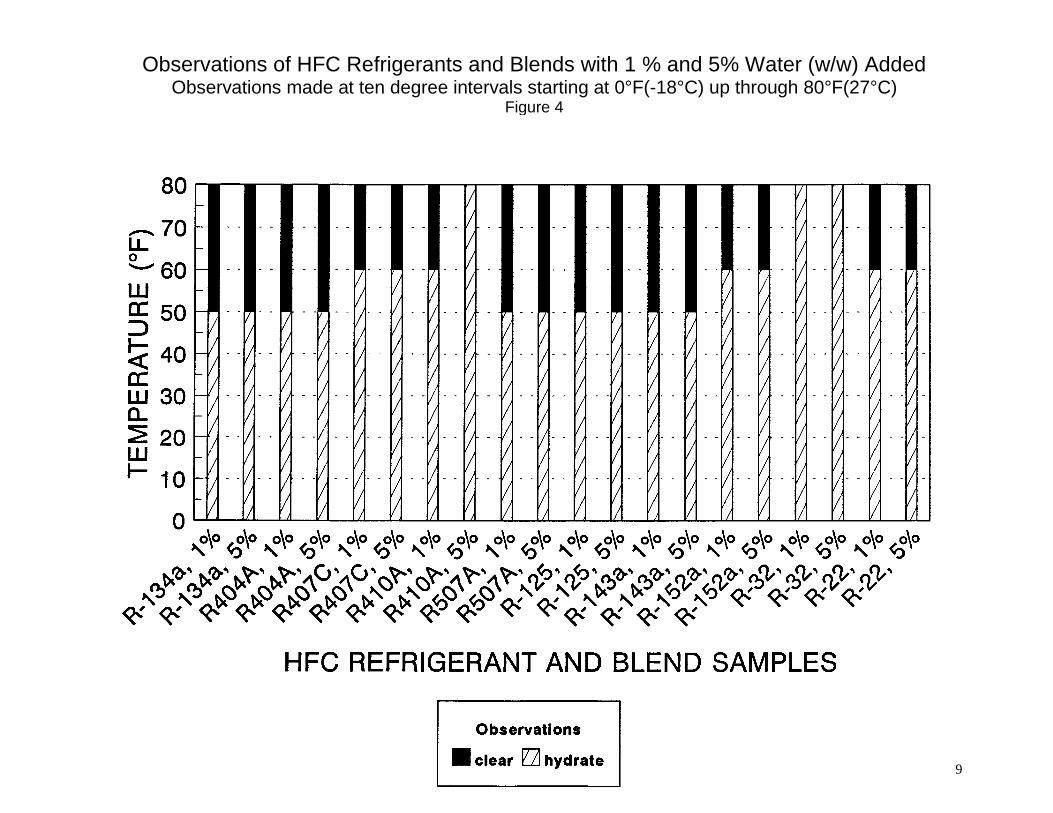
Observations of HFC Refrigerants and Blends with 1 % and 5% Water (w/w) AddedObservations made at ten degree intervals starting at 0°F(-18°C) up through 80°F(27°C)
Figure 4
9
10
neodymium magnets
stainless steel desiccant can
removable lid
stainless steel stirring wire
glass jacket
3" stainless steel pipe
Test Unit 3Figure 5
pressure guagevalve
valve
coolant exit
refrigerant/H2O sampling tube and
valve
valve
300 rpm motor
jacket to cylinder seal
port to sampling valve
refrigerant and water addition ports
tube plug
coolant entrance
11
Clathrate Hydrates
A brief discussion of clathrate hydrates, commonly referred to as gas hydrates, is
necessary given the impact these crystalline molecular complexes have on the findings of this
study. A hydrate is a complex containing water that belongs to the class of compounds known as
clathrates. Clathrate refers to an open crystalline structure of one compound, in this case water,
which encloses molecules of another compound, which are usually gas molecules typically
referred to as the guest molecule. The guest molecule or gas molecule (refrigerant) is referred to
as such even when it is not in the gas phase. There is no chemical tie between the gas and water
molecules; instead, they interact through van der Waals type dispersion forces (Holder et al.
1988). These forces between molecules reflect the momentary and induced dipoles from
electrons normally moving about; the net result is attraction between the two molecules. van der
Waals forces are short range and act between portions of different molecules that are in close
contact (Morrison and Boyd 1973). The crystalline lattice entrapping the gas molecules is
formed by strong hydrogen bonds between water molecules. Examination of clathrate hydrates
reveals that they may have two different structural forms, referred to as Structures I and II.
Formation of either structure is dependent on their stability and both can coexist under certain
conditions. Structure I is comprised of 46 water molecules configured to provide two small and
six large cavities for gas molecules to occupy. Structure II’s arrangement of 136 water molecules
hosts 16 small and eight large cavities in which gas molecules can reside (Holder et al. 1988).
A discussion of clathrate hydrates centers around three concepts: solubility, metastability,
and the establishment of critical nuclei as they relate to water clustering (Sloan 1990). The water
in refrigerant, as temperature decreases, becomes a short-lived liquid cluster of irregular and
broken hydrogen-bonded water molecules (metastability) surrounding a dissolved hydrocarbon.
This metastability develops into well-formed hydrogen bonds fixed in position to form a solid
clathrate cage around a guest molecule (refrigerant) defining the critical nuclei or nucleation
phase (Sloan 1990). Therefore, water measurements above the metastable temperature represent
water solubility/equilibrium in liquid refrigerant. Water measured at metastability or nucleation
temperatures is likely decomposed clathrate hydrate in liquid refrigerant.
12
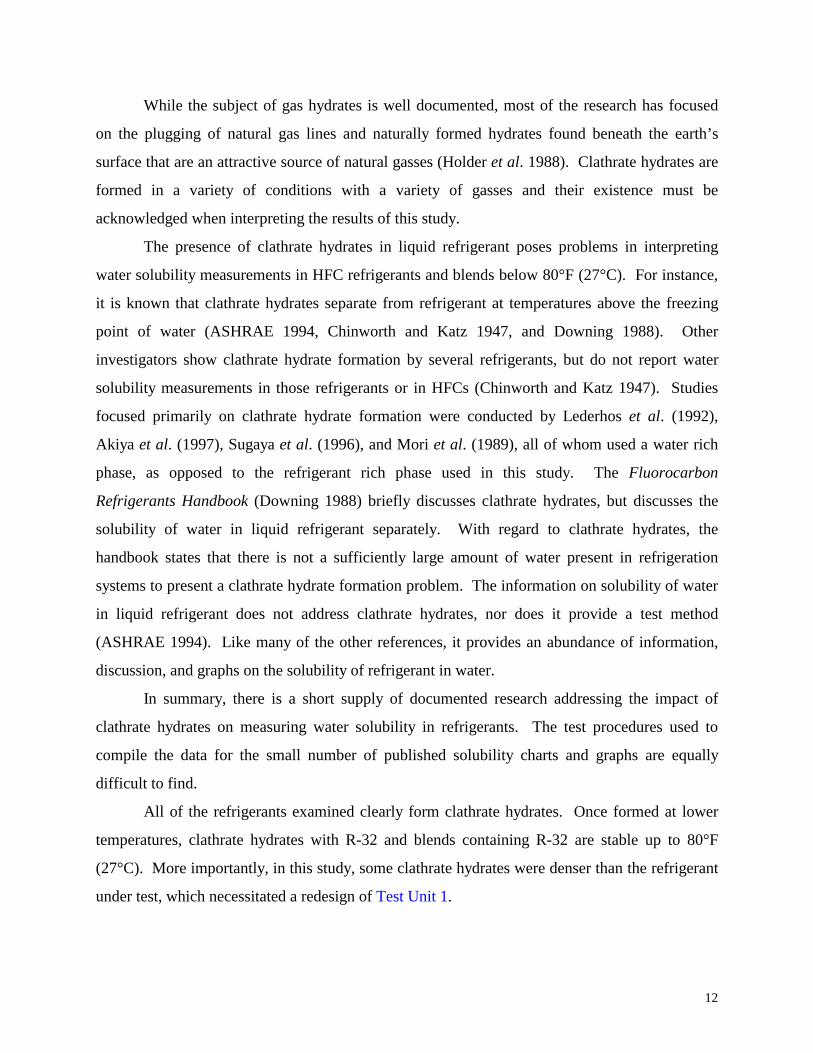
While the subject of gas hydrates is well documented, most of the research has focused
on the plugging of natural gas lines and naturally formed hydrates found beneath the earth’s
surface that are an attractive source of natural gasses (Holder et al. 1988). Clathrate hydrates are
formed in a variety of conditions with a variety of gasses and their existence must be
acknowledged when interpreting the results of this study.
The presence of clathrate hydrates in liquid refrigerant poses problems in interpreting
water solubility measurements in HFC refrigerants and blends below 80°F (27°C). For instance,
it is known that clathrate hydrates separate from refrigerant at temperatures above the freezing
point of water (ASHRAE 1994, Chinworth and Katz 1947, and Downing 1988). Other
investigators show clathrate hydrate formation by several refrigerants, but do not report water
solubility measurements in those refrigerants or in HFCs (Chinworth and Katz 1947). Studies
focused primarily on clathrate hydrate formation were conducted by Lederhos et al. (1992),
Akiya et al. (1997), Sugaya et al. (1996), and Mori et al. (1989), all of whom used a water rich
phase, as opposed to the refrigerant rich phase used in this study. The Fluorocarbon
Refrigerants Handbook (Downing 1988) briefly discusses clathrate hydrates, but discusses the
solubility of water in liquid refrigerant separately. With regard to clathrate hydrates, the
handbook states that there is not a sufficiently large amount of water present in refrigeration
systems to present a clathrate hydrate formation problem. The information on solubility of water
in liquid refrigerant does not address clathrate hydrates, nor does it provide a test method
(ASHRAE 1994). Like many of the other references, it provides an abundance of information,
discussion, and graphs on the solubility of refrigerant in water.
In summary, there is a short supply of documented research addressing the impact of
clathrate hydrates on measuring water solubility in refrigerants. The test procedures used to
compile the data for the small number of published solubility charts and graphs are equally
difficult to find.
All of the refrigerants examined clearly form clathrate hydrates. Once formed at lower
temperatures, clathrate hydrates with R-32 and blends containing R-32 are stable up to 80°F
(27°C). More importantly, in this study, some clathrate hydrates were denser than the refrigerant
under test, which necessitated a redesign of Test Unit 1.
13
Method
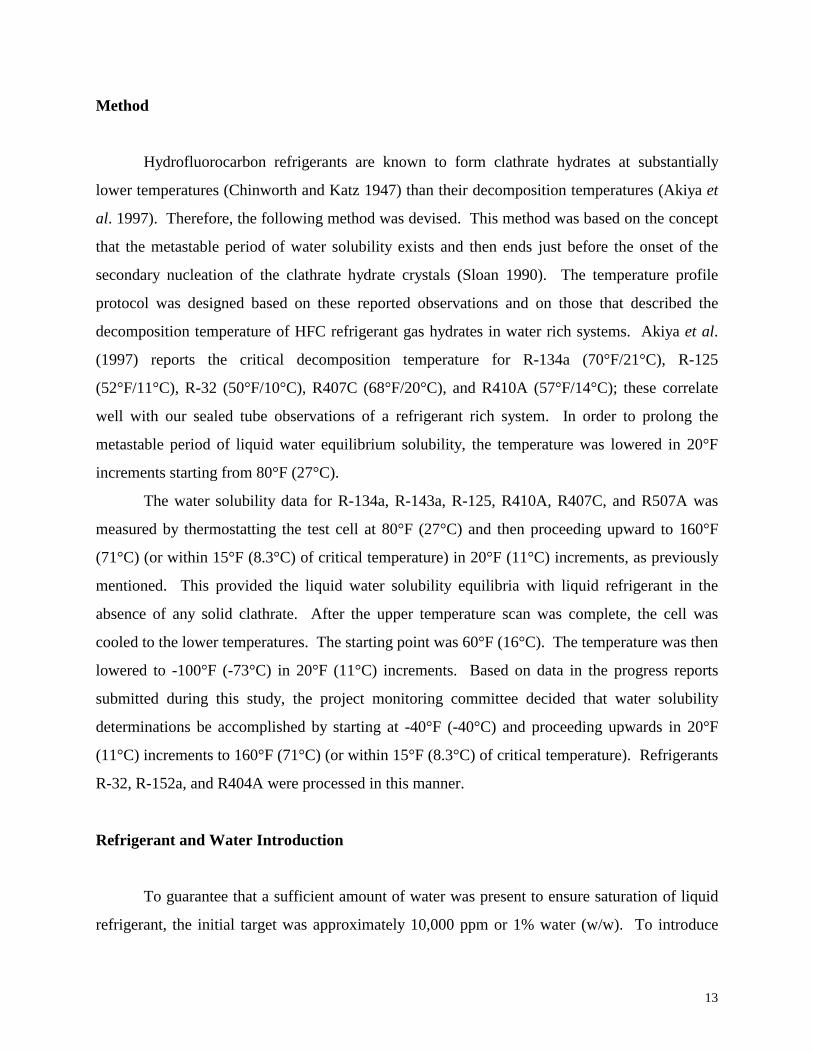
Hydrofluorocarbon refrigerants are known to form clathrate hydrates at substantially
lower temperatures (Chinworth and Katz 1947) than their decomposition temperatures (Akiya et
al. 1997). Therefore, the following method was devised. This method was based on the concept
that the metastable period of water solubility exists and then ends just before the onset of the
secondary nucleation of the clathrate hydrate crystals (Sloan 1990). The temperature profile
protocol was designed based on these reported observations and on those that described the
decomposition temperature of HFC refrigerant gas hydrates in water rich systems. Akiya et al.
(1997) reports the critical decomposition temperature for R-134a (70°F/21°C), R-125
(52°F/11°C), R-32 (50°F/10°C), R407C (68°F/20°C), and R410A (57°F/14°C); these correlate
well with our sealed tube observations of a refrigerant rich system. In order to prolong the
metastable period of liquid water equilibrium solubility, the temperature was lowered in 20°F
increments starting from 80°F (27°C).
The water solubility data for R-134a, R-143a, R-125, R410A, R407C, and R507A was
measured by thermostatting the test cell at 80°F (27°C) and then proceeding upward to 160°F
(71°C) (or within 15°F (8.3°C) of critical temperature) in 20°F (11°C) increments, as previously
mentioned. This provided the liquid water solubility equilibria with liquid refrigerant in the
absence of any solid clathrate. After the upper temperature scan was complete, the cell was
cooled to the lower temperatures. The starting point was 60°F (16°C). The temperature was then
lowered to -100°F (-73°C) in 20°F (11°C) increments. Based on data in the progress reports
submitted during this study, the project monitoring committee decided that water solubility
determinations be accomplished by starting at -40°F (-40°C) and proceeding upwards in 20°F
(11°C) increments to 160°F (71°C) (or within 15°F (8.3°C) of critical temperature). Refrigerants
R-32, R-152a, and R404A were processed in this manner.
Refrigerant and Water Introduction
To guarantee that a sufficient amount of water was present to ensure saturation of liquid
refrigerant, the initial target was approximately 10,000 ppm or 1% water (w/w). To introduce
14
refrigerant and water into any of the test systems, the apparatus was first placed under vacuum by
the top sampling port valve for approximately 15-30 minutes. After isolating the system with the
top valve, the appropriate amount of water was aspirated into the apparatus through the bottom
sampling port valve (Test Units 1 and 2) and then the system was cooled to 0°F (-18°C). Test
Unit 3 required disassembly for wetted silica gel addition for each refrigerant test. Then, a
second vacuum was pulled from the top cell valve for approximately one minute and the
appropriate amount of refrigerant was added through the bottom port.
The amount of water in the test system was also critical to data collection at lower
temperatures (<80°F (27°C)). Ideally, water should be present in slight excess of saturation at
each temperature measurement to insure maximum water saturation (Daniels et al. 1962).
Clathrate hydrate formation is compounded by the addition of too much water (see Appendix C).
Data Collection
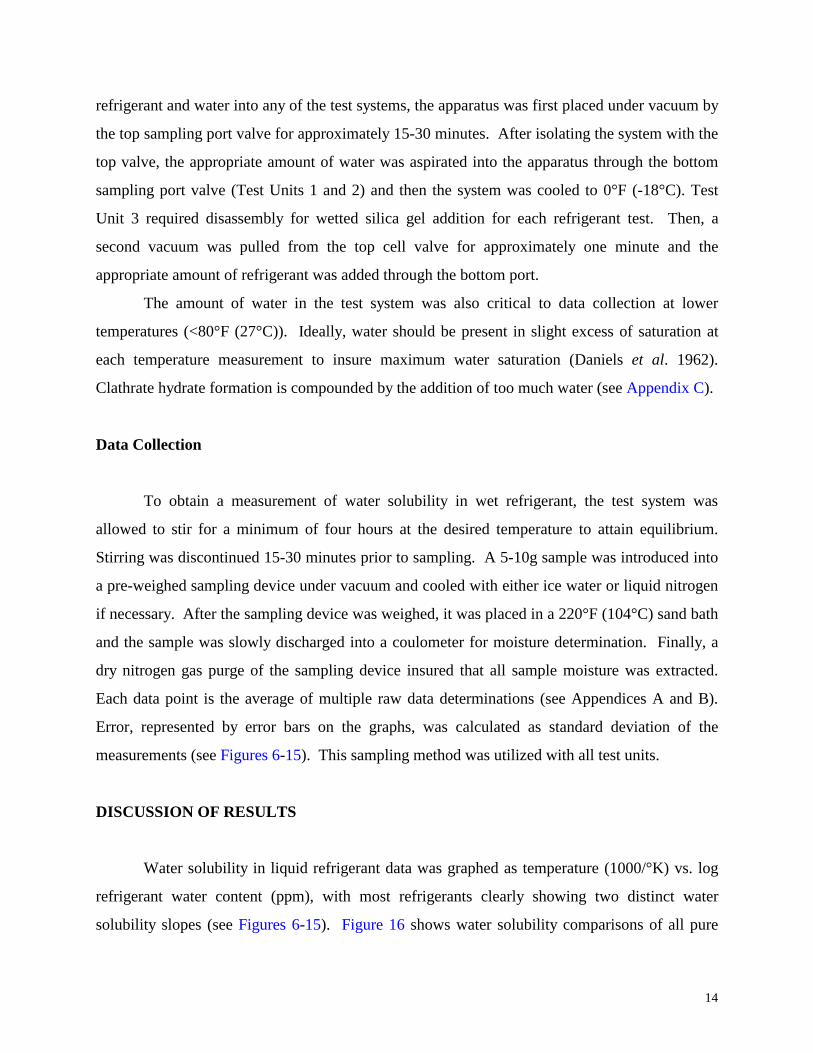
To obtain a measurement of water solubility in wet refrigerant, the test system was
allowed to stir for a minimum of four hours at the desired temperature to attain equilibrium.
Stirring was discontinued 15-30 minutes prior to sampling. A 5-10g sample was introduced into
a pre-weighed sampling device under vacuum and cooled with either ice water or liquid nitrogen
if necessary. After the sampling device was weighed, it was placed in a 220°F (104°C) sand bath
and the sample was slowly discharged into a coulometer for moisture determination. Finally, a
dry nitrogen gas purge of the sampling device insured that all sample moisture was extracted.
Each data point is the average of multiple raw data determinations (see Appendices A and B).
Error, represented by error bars on the graphs, was calculated as standard deviation of the
measurements (see Figures 6-15). This sampling method was utilized with all test units.
DISCUSSION OF RESULTS
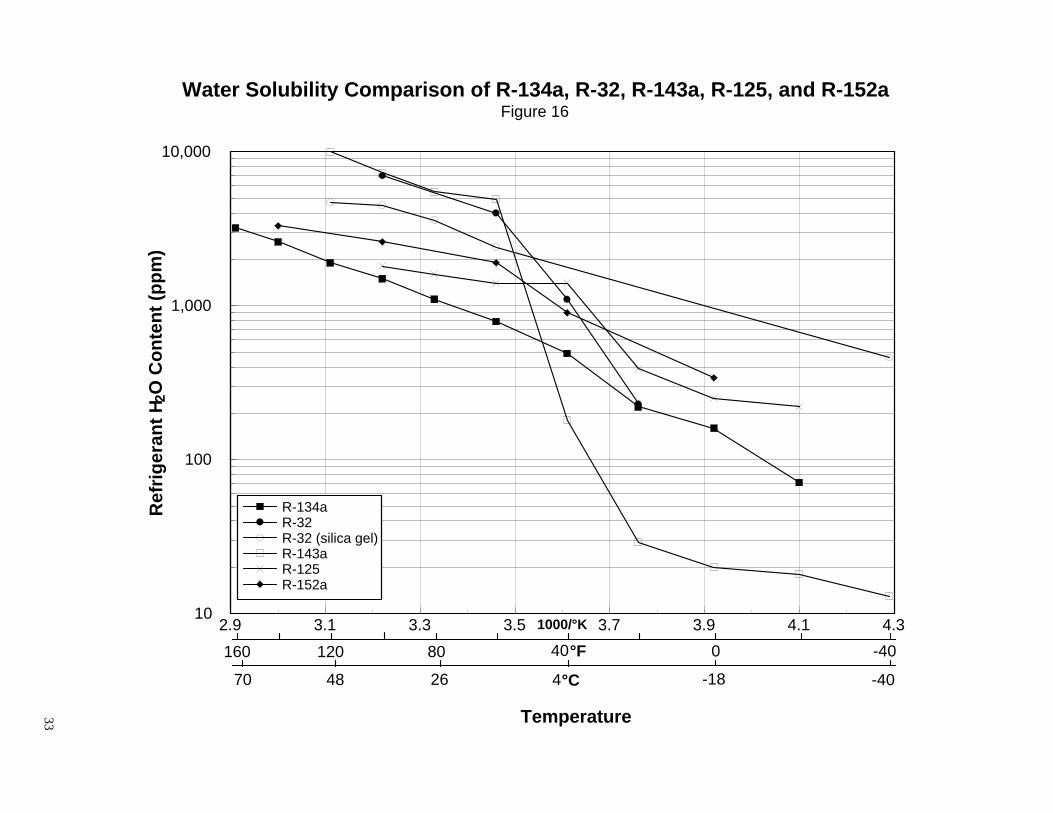
Water solubility in liquid refrigerant data was graphed as temperature (1000/°K) vs. log
refrigerant water content (ppm), with most refrigerants clearly showing two distinct water
solubility slopes (see Figures 6-15). Figure 16 shows water solubility comparisons of all pure
15
refrigerants used in this study and figures 17-20 show water solubility data for the blends,
azeotropes, and their components. Some refrigerants tested have data points at -60°F (-51°C),
-80°F (-62°C), and -100°F (-73°C), but these low temperature data points were excluded from
the water solubility graphs because the percent error calculations called their validity into
question.
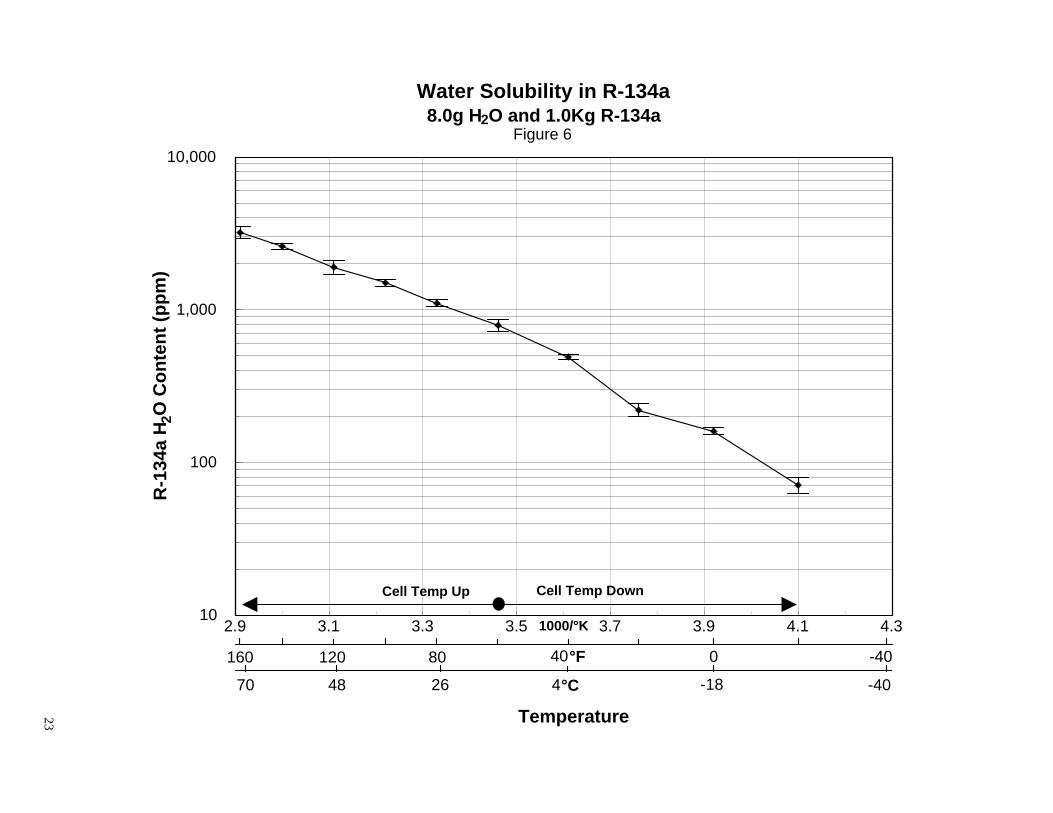
R-134a
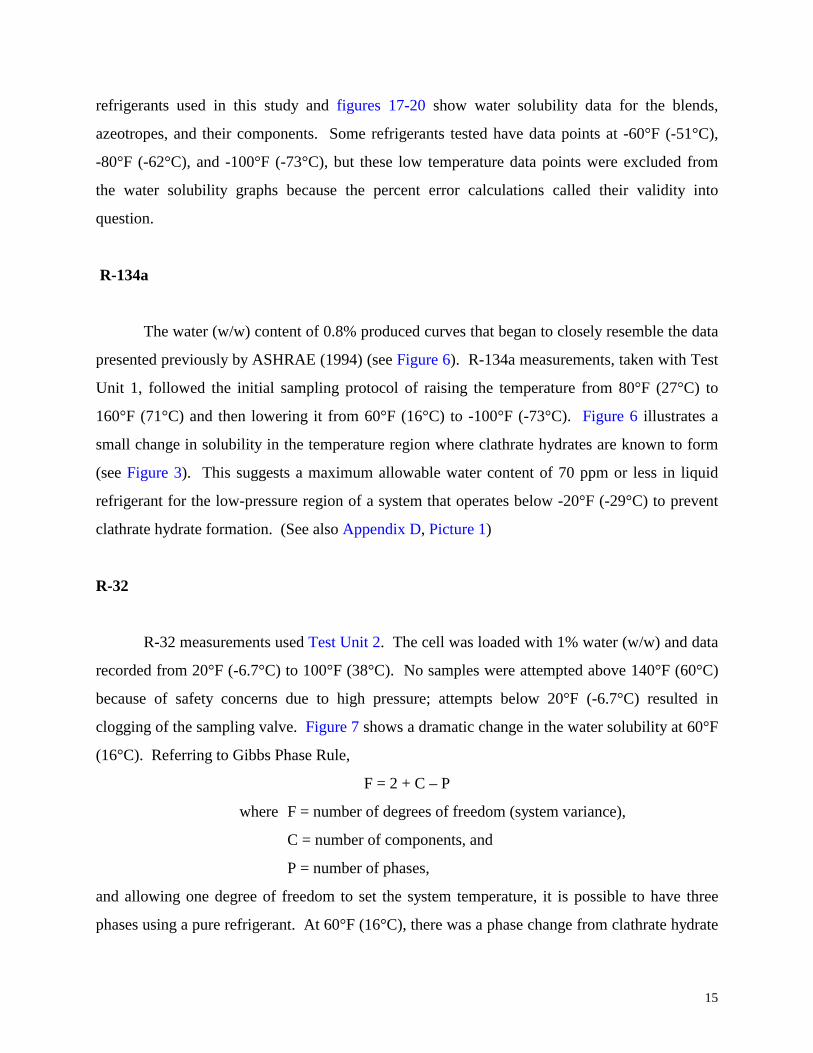
The water (w/w) content of 0.8% produced curves that began to closely resemble the data
presented previously by ASHRAE (1994) (see Figure 6). R-134a measurements, taken with Test
Unit 1, followed the initial sampling protocol of raising the temperature from 80°F (27°C) to
160°F (71°C) and then lowering it from 60°F (16°C) to -100°F (-73°C). Figure 6 illustrates a
small change in solubility in the temperature region where clathrate hydrates are known to form
(see Figure 3). This suggests a maximum allowable water content of 70 ppm or less in liquid
refrigerant for the low-pressure region of a system that operates below -20°F (-29°C) to prevent
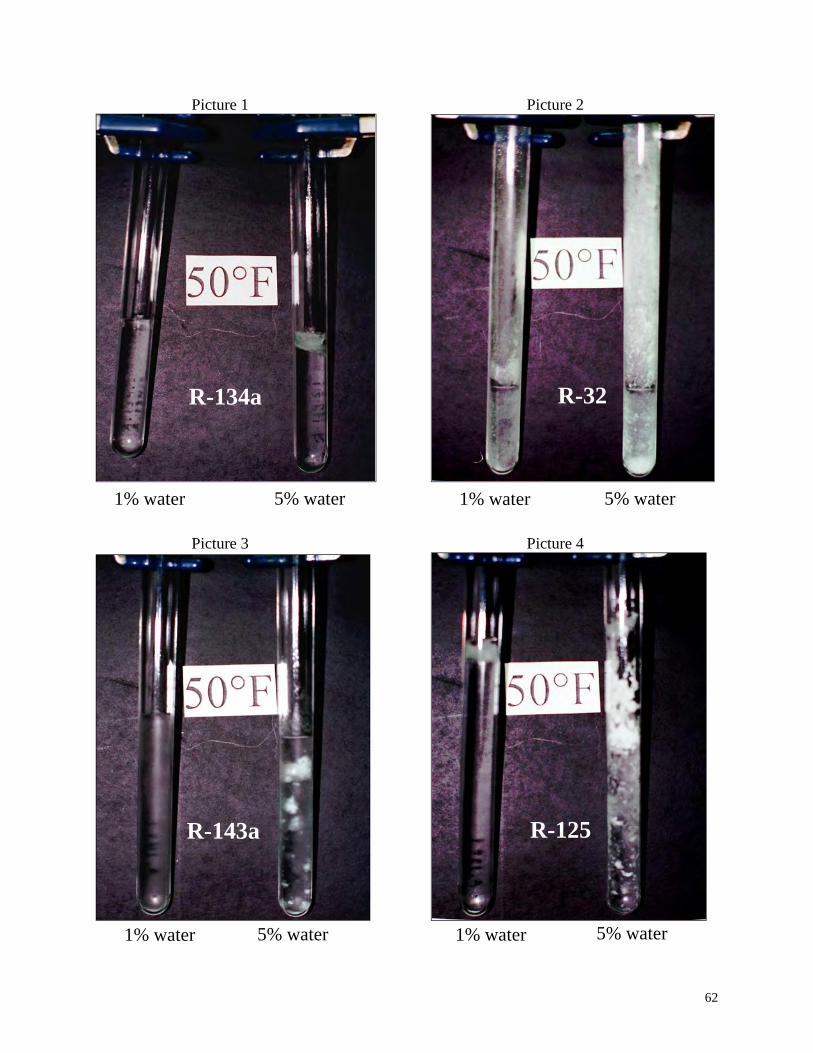
clathrate hydrate formation. (See also Appendix D, Picture 1)
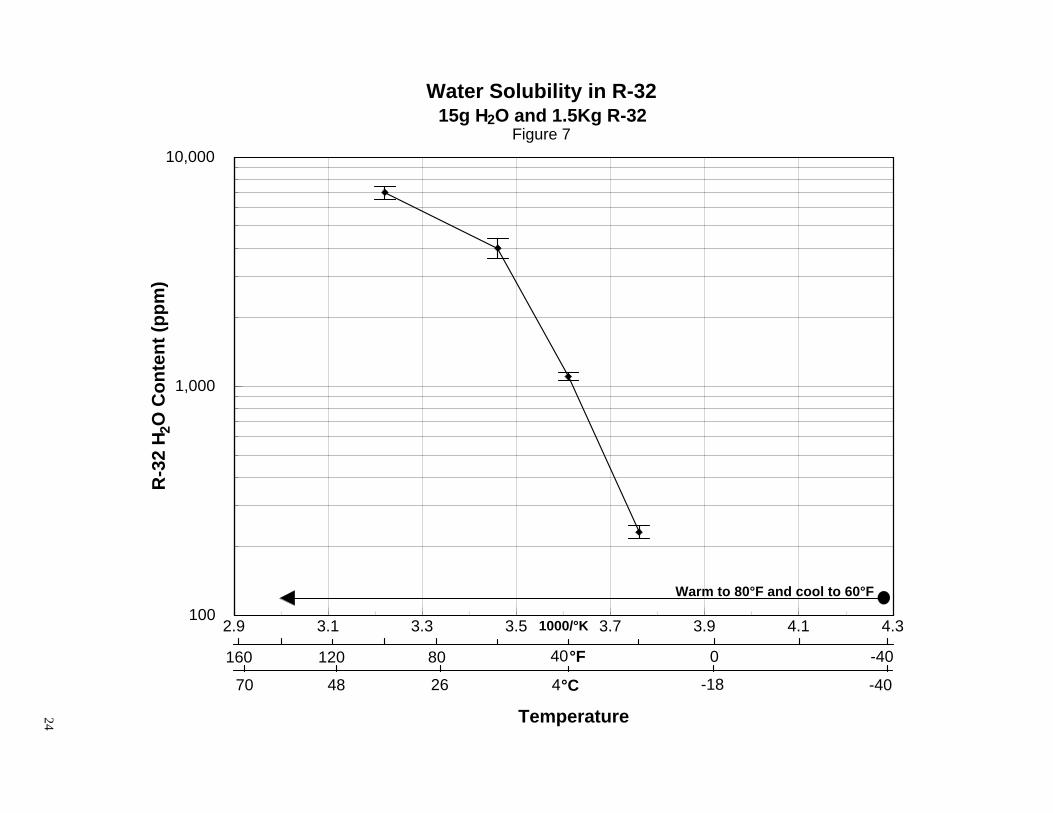
R-32
R-32 measurements used Test Unit 2. The cell was loaded with 1% water (w/w) and data
recorded from 20°F (-6.7°C) to 100°F (38°C). No samples were attempted above 140°F (60°C)
because of safety concerns due to high pressure; attempts below 20°F (-6.7°C) resulted in
clogging of the sampling valve. Figure 7 shows a dramatic change in the water solubility at 60°F
(16°C). Referring to Gibbs Phase Rule,
F = 2 + C – P
where F = number of degrees of freedom (system variance),
C = number of components, and
P = number of phases,
and allowing one degree of freedom to set the system temperature, it is possible to have three
phases using a pure refrigerant. At 60°F (16°C), there was a phase change from clathrate hydrate
16
to liquid water, thereby affecting water solubility. The other two phases are liquid and vapor
refrigerant. Figure 7 shows that a water level below 125 ppm at 20°F (-6.7°C) will reduce
clathrate hydrate formation in the evaporator region of an operating system.
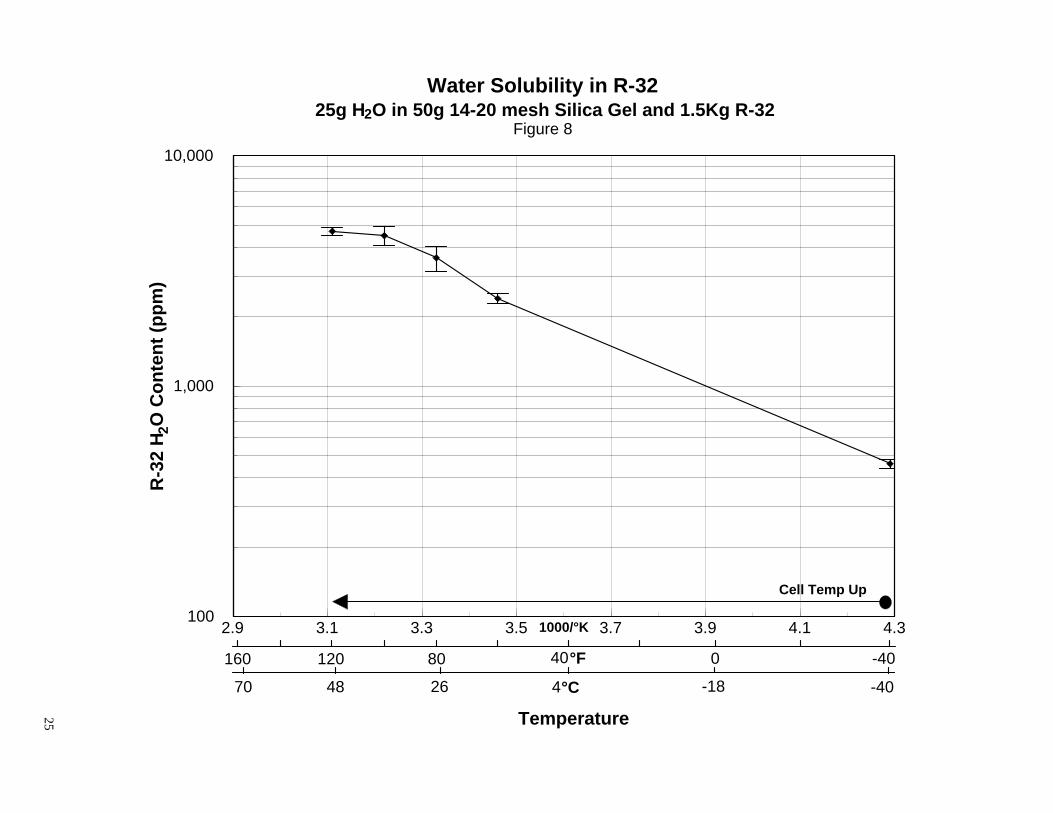
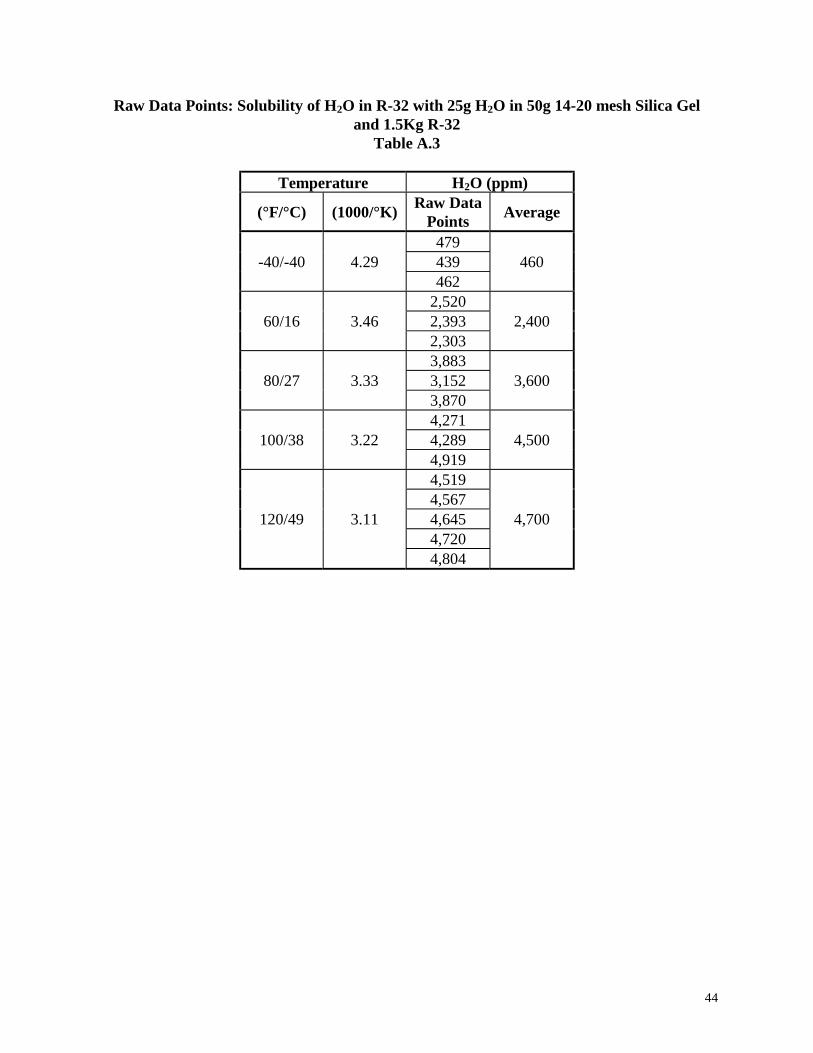
R-32 was also tested using Test Unit 3 (Figure 5) with wetted 14-20 mesh silica gel as the
source of water (25 g H2O/50 g silica gel) (see Figure 8). No data was taken between -40°F
(-40°C) and 60°F (16°C) due to clogging of the sampling valve. In this work, solubility results
obtained using a solid adsorbent (silica gel) as the water source differed from results using
straight water addition. The adsorbent method of water reported by Walker et al. (1960) was
limited to one data point for R-22 at 86°F (30°C) in their study of the stability of fluorocarbon
refrigerants and refrigerating oil mixtures. Here, the adsorbent-generated data form a straight
line while the water-addition data form two intersecting lines (see Figures 7 and 8). Since both
data sets are limited, it is difficult to draw a conclusion about which method of water addition is
better. (See also Appendix D, Picture 2)
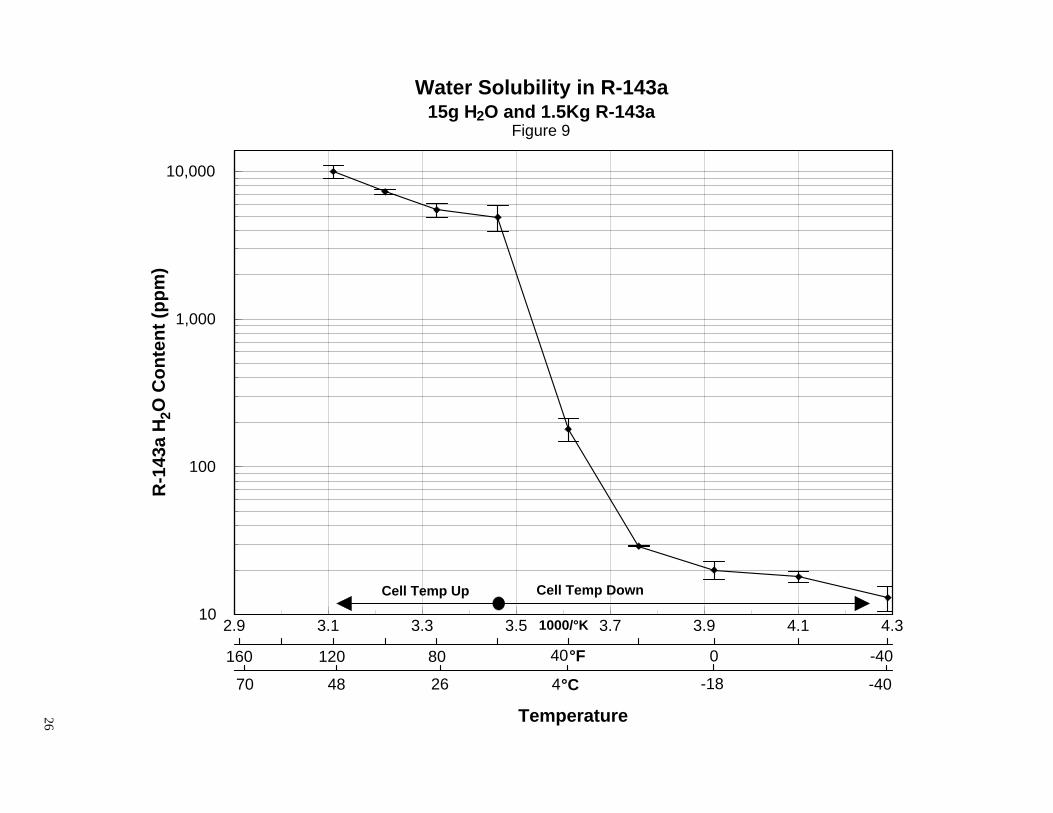
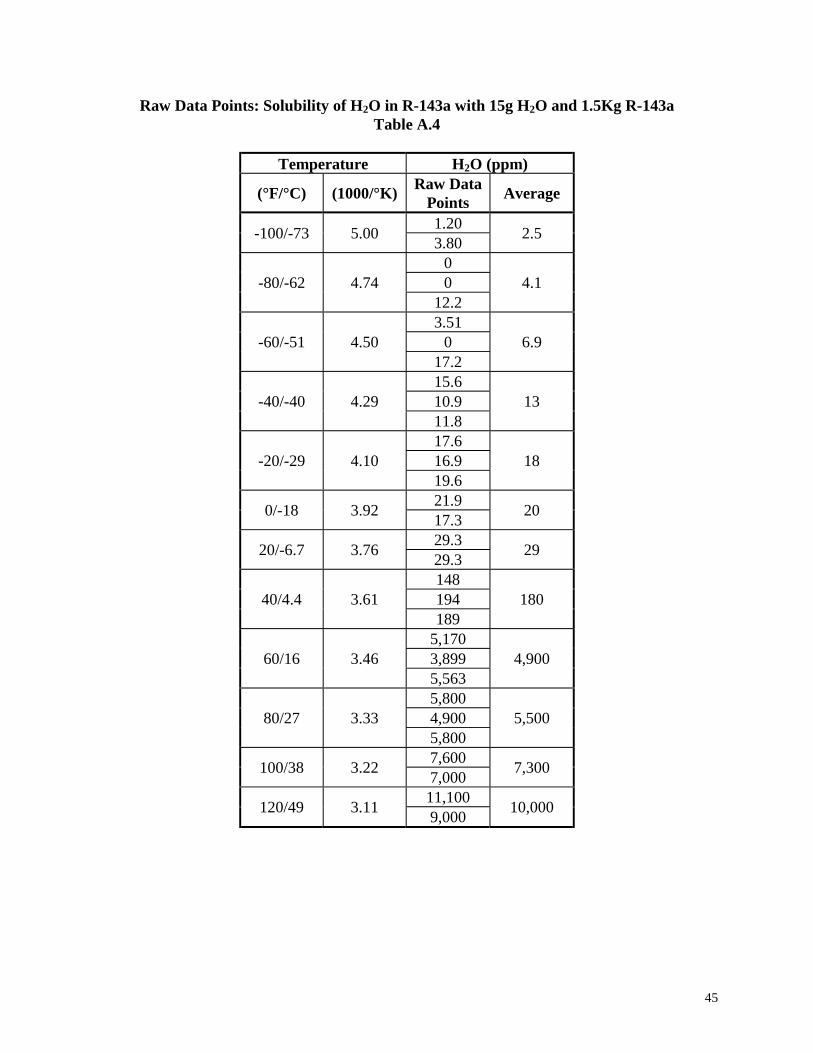
R-143a
R-143a measurements used the same temperature, sampling protocol, amount of water,
and test unit used with R-134a. Figure 9 clearly demonstrates the difference of solubility
between liquid water in refrigerant and clathrate hydrate in refrigerant when plotted using the log
profile. Again, a marked change in the slope is apparent at 60°F (16°C), signifying a phase
change from liquid water to clathrate hydrate, adhering to Gibbs Phase Rule. Water levels below
15 ppm at -40°F (-40°C) are advisable to avoid clathrate hydrate formation in the evaporating
low-pressure region of an operational system. (See also Appendix D, Picture 3)
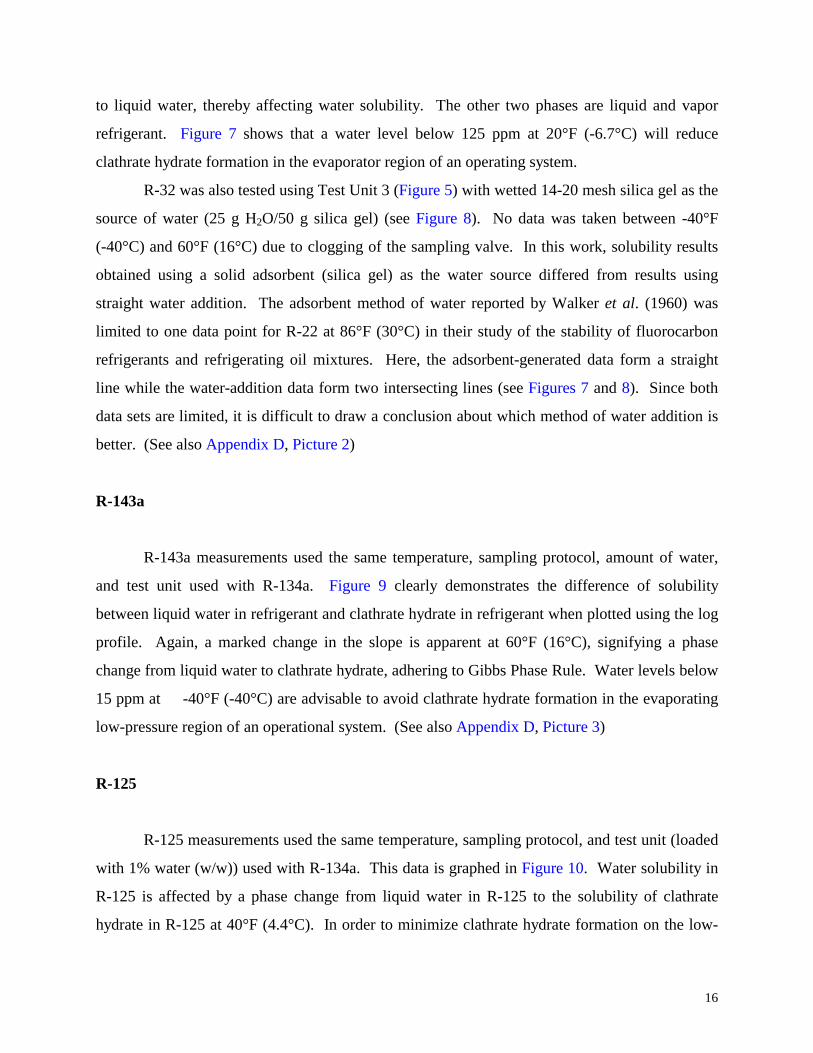
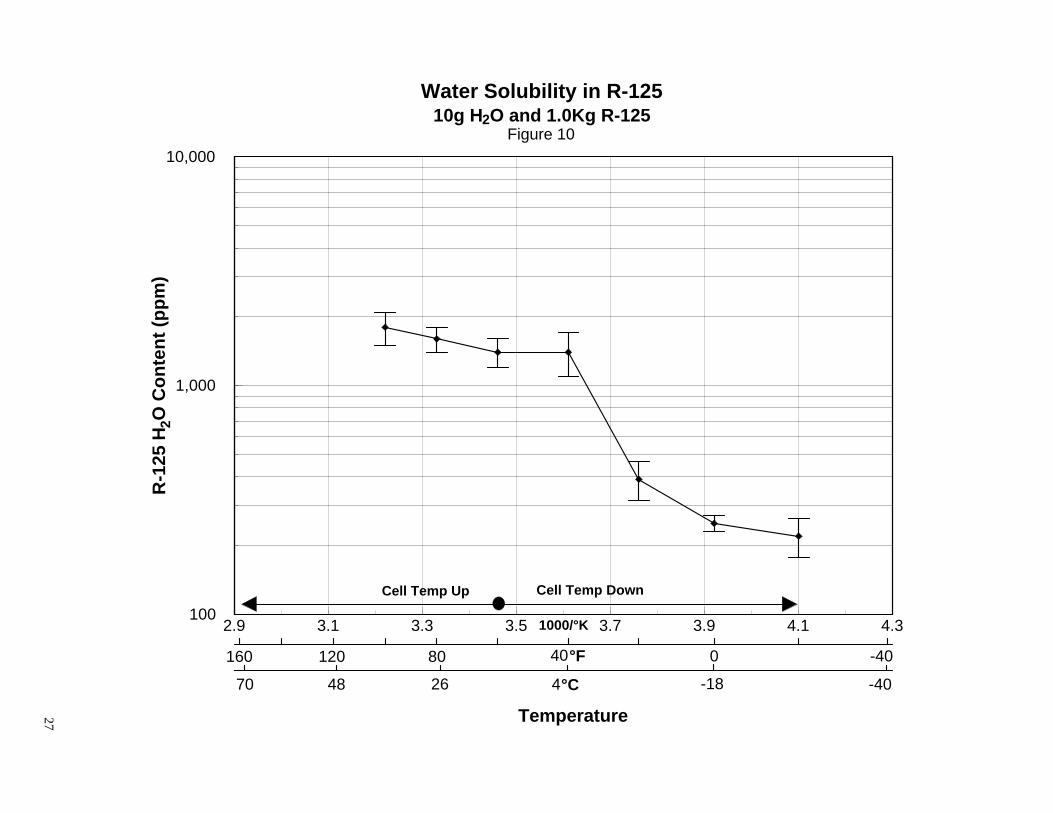
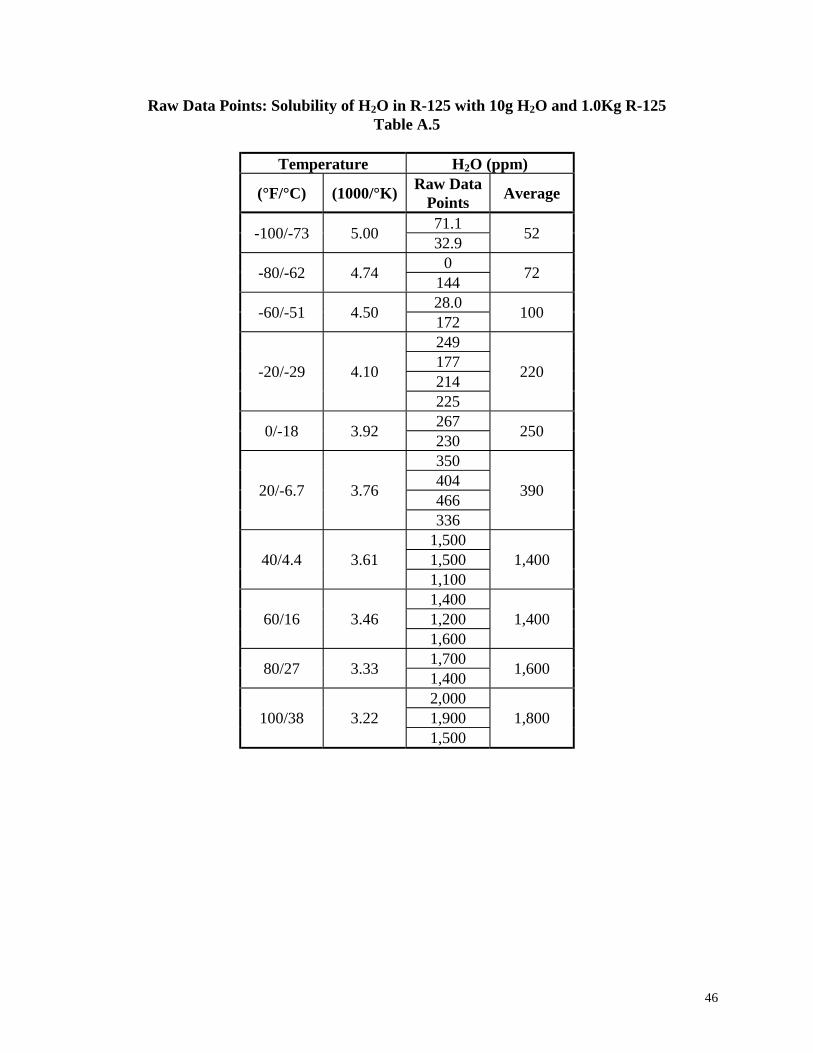
R-125
R-125 measurements used the same temperature, sampling protocol, and test unit (loaded
with 1% water (w/w)) used with R-134a. This data is graphed in Figure 10. Water solubility in
R-125 is affected by a phase change from liquid water in R-125 to the solubility of clathrate
hydrate in R-125 at 40°F (4.4°C). In order to minimize clathrate hydrate formation on the low-
17
pressure side of a system, water levels should be below 125 ppm at -20°F (-29°C). (See also
Appendix D, Picture 4)
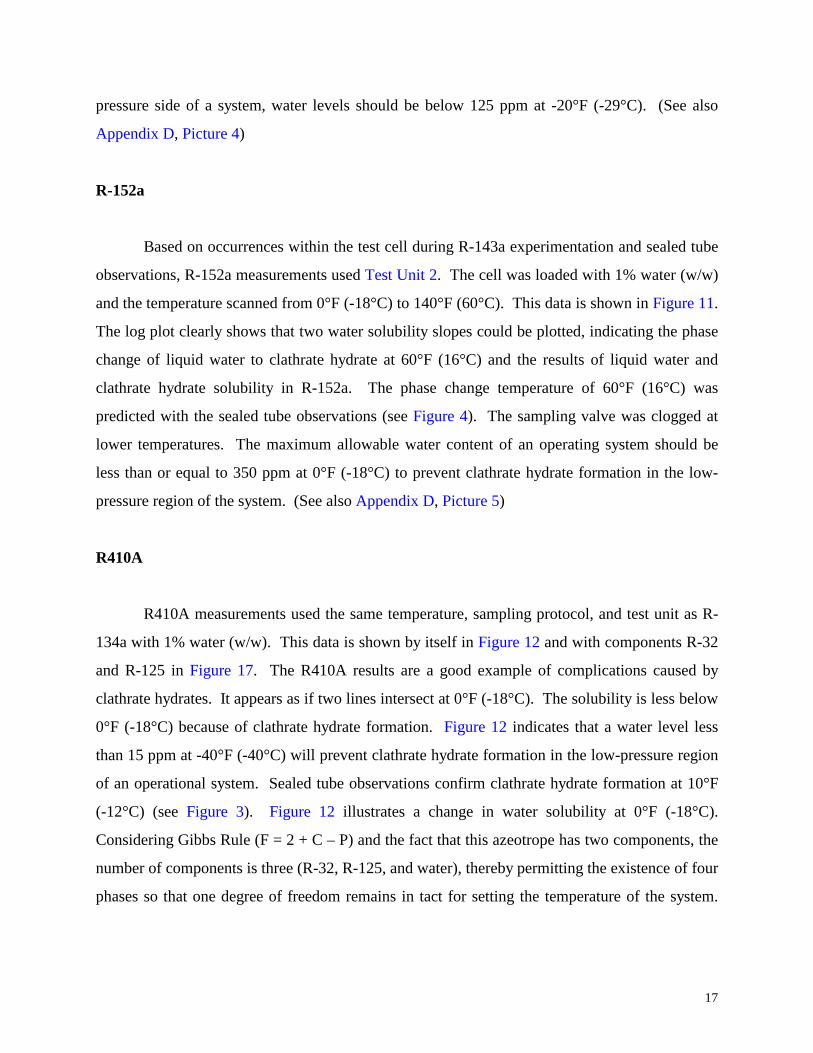
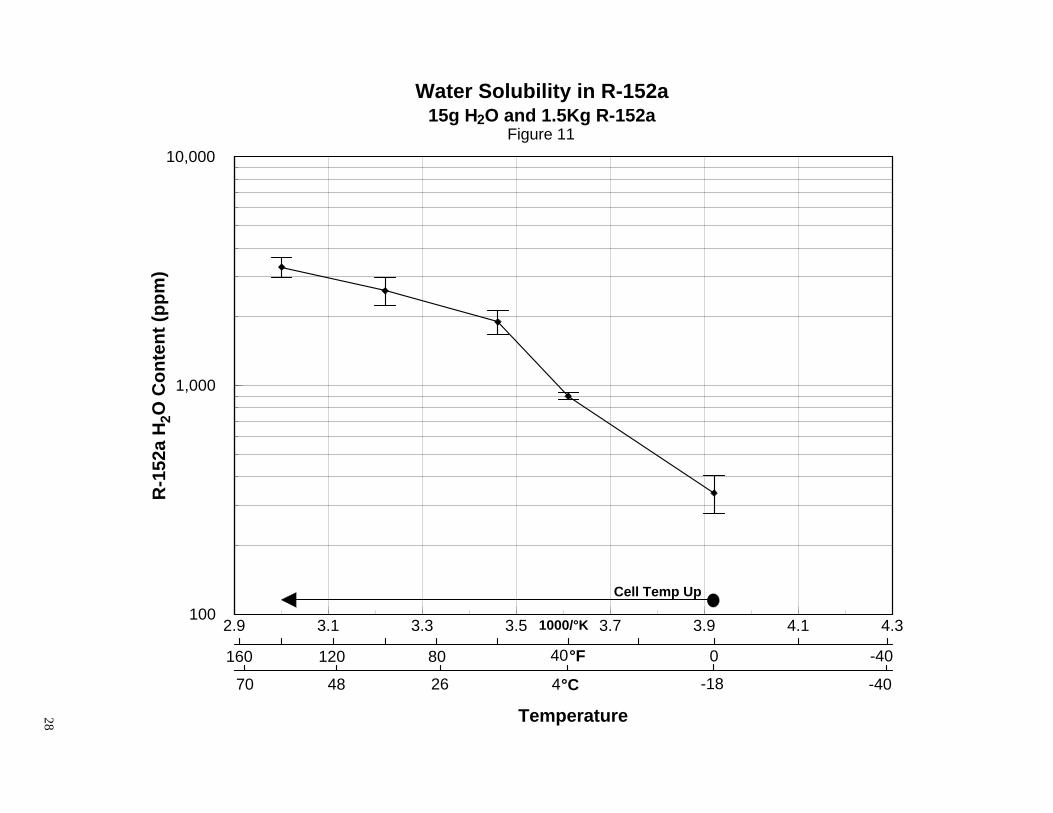
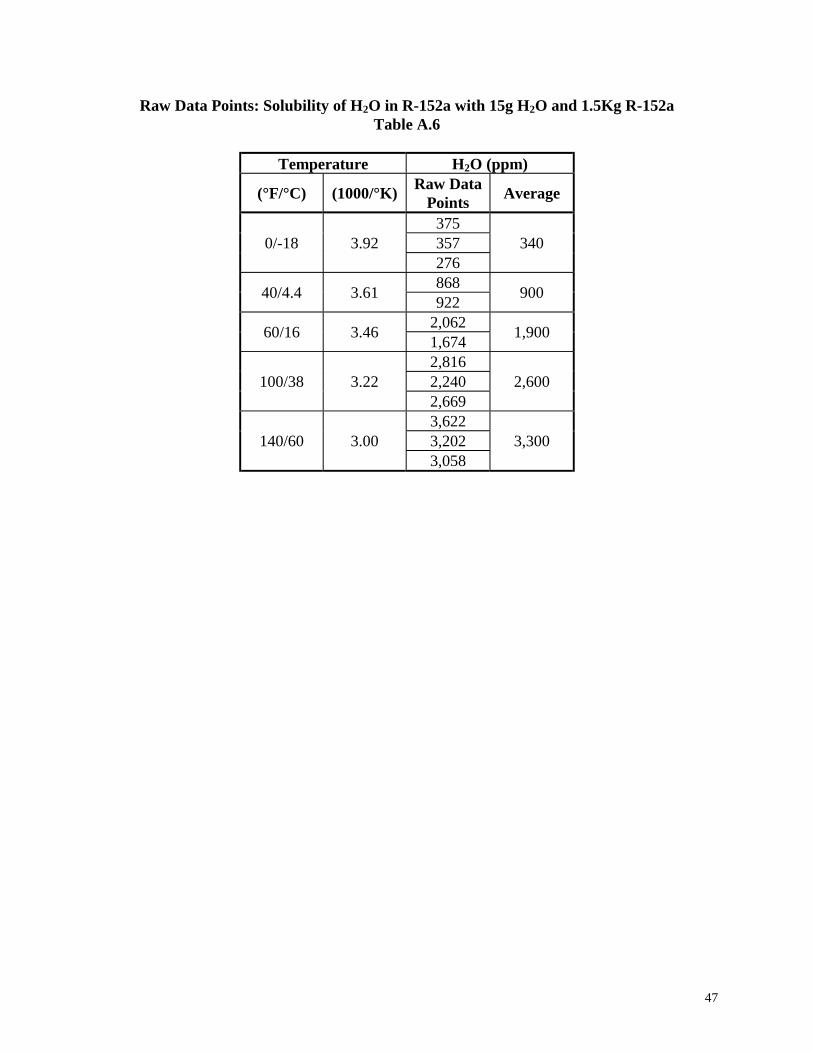
R-152a
Based on occurrences within the test cell during R-143a experimentation and sealed tube
observations, R-152a measurements used Test Unit 2. The cell was loaded with 1% water (w/w)
and the temperature scanned from 0°F (-18°C) to 140°F (60°C). This data is shown in Figure 11.
The log plot clearly shows that two water solubility slopes could be plotted, indicating the phase
change of liquid water to clathrate hydrate at 60°F (16°C) and the results of liquid water and
clathrate hydrate solubility in R-152a. The phase change temperature of 60°F (16°C) was
predicted with the sealed tube observations (see Figure 4). The sampling valve was clogged at
lower temperatures. The maximum allowable water content of an operating system should be
less than or equal to 350 ppm at 0°F (-18°C) to prevent clathrate hydrate formation in the low-
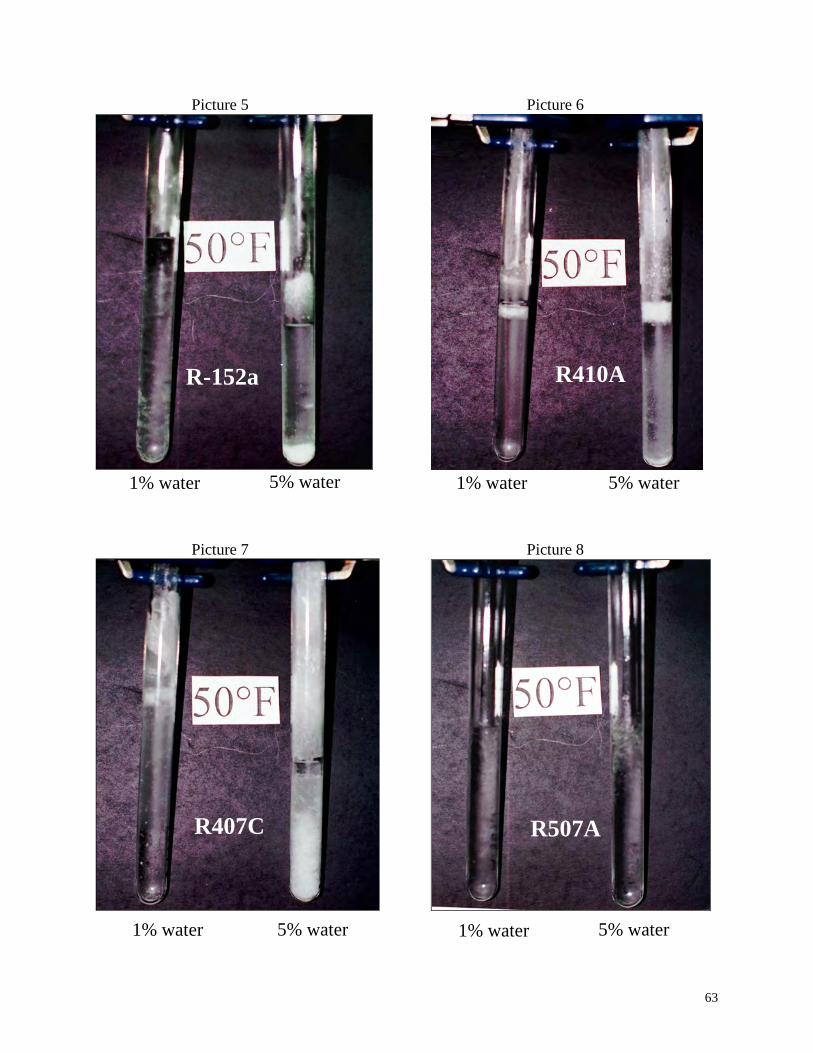
pressure region of the system. (See also Appendix D, Picture 5)
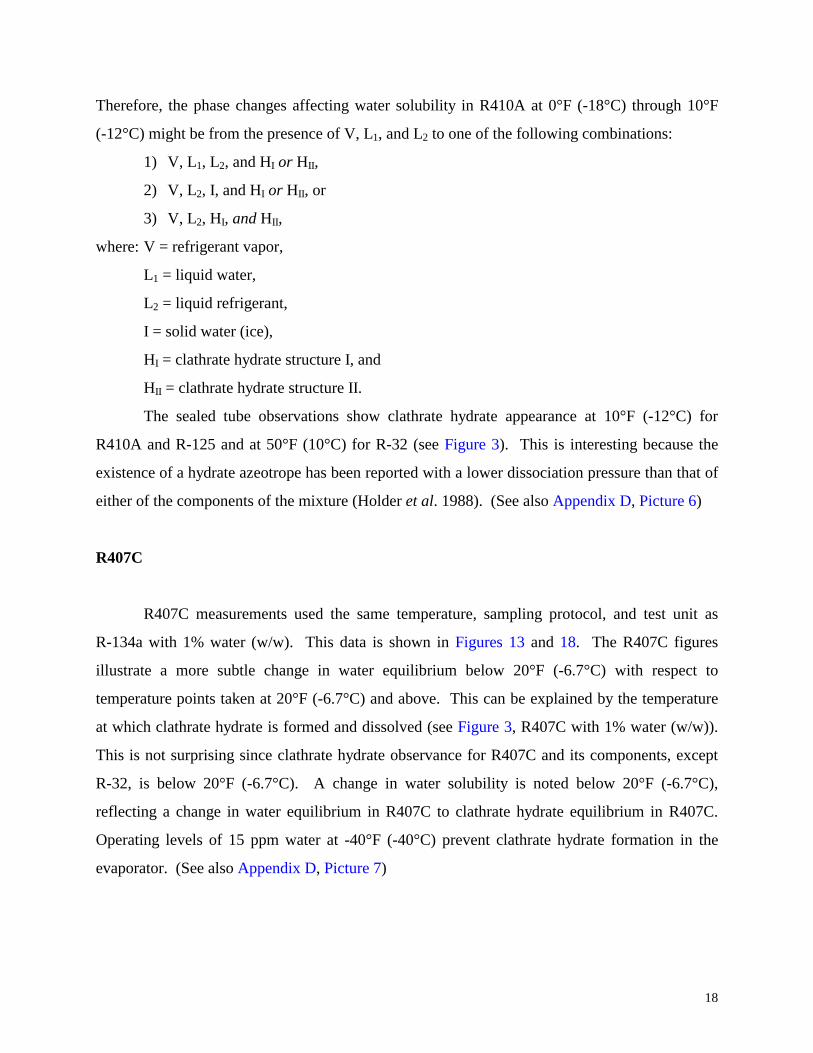
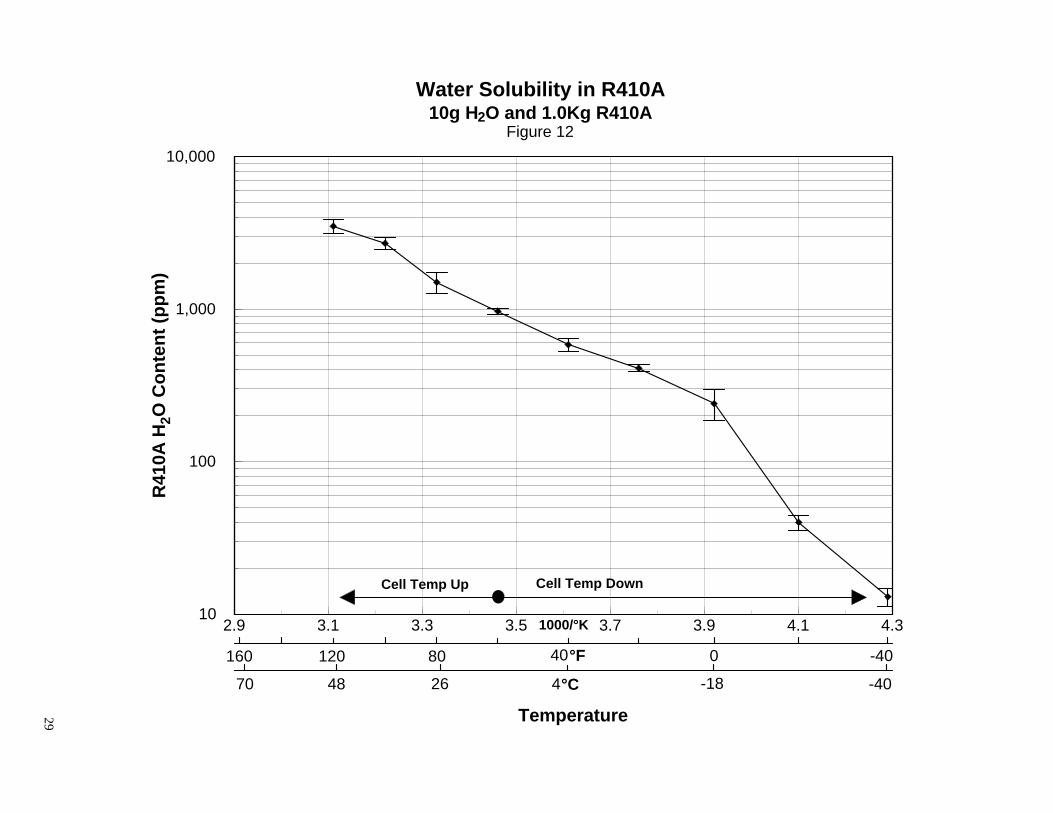
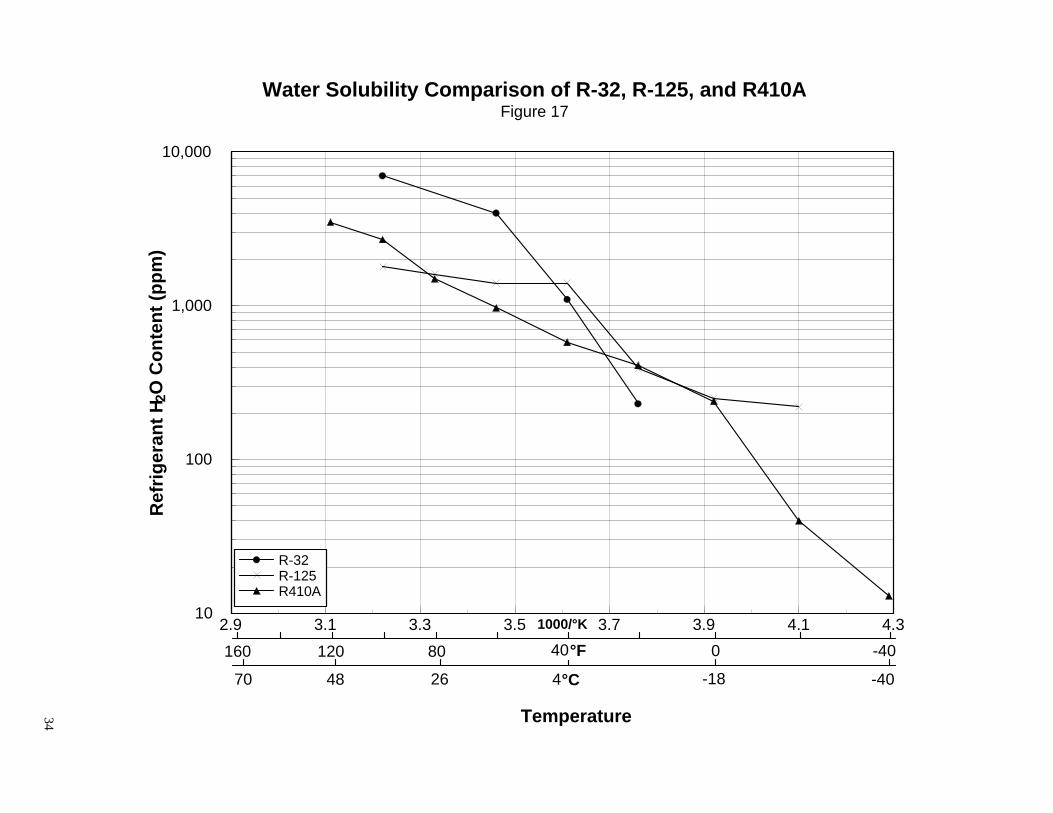
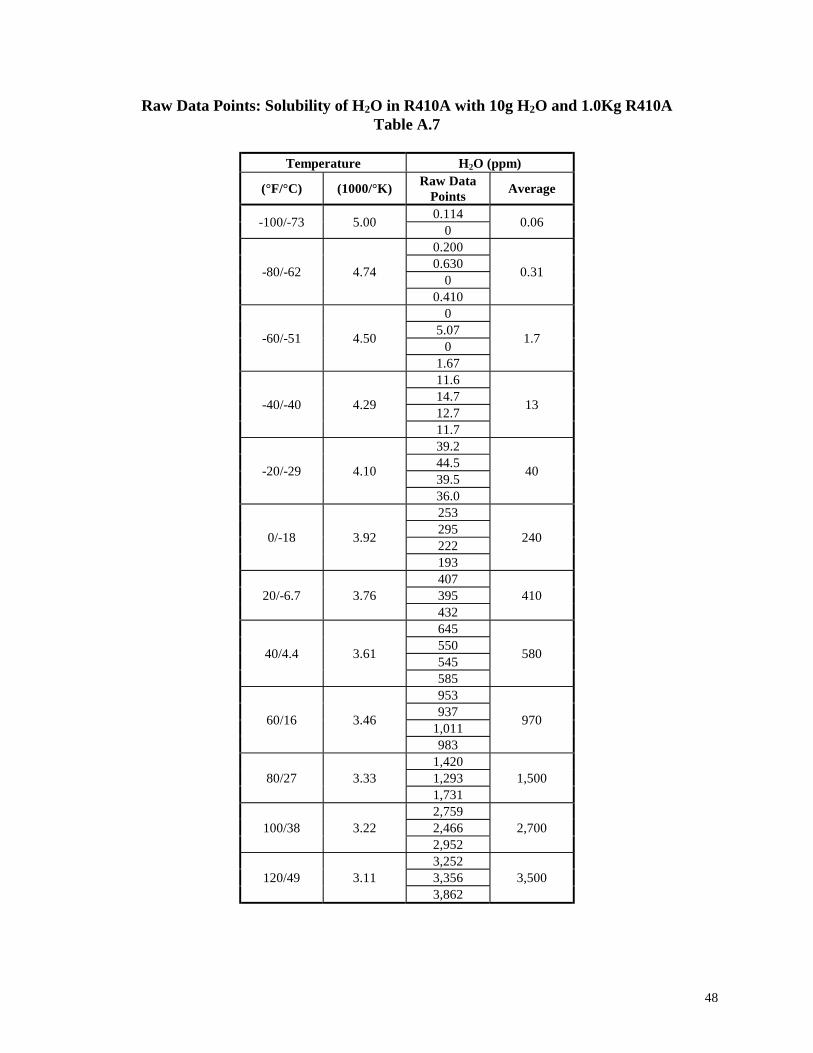
R410A
R410A measurements used the same temperature, sampling protocol, and test unit as R-
134a with 1% water (w/w). This data is shown by itself in Figure 12 and with components R-32
and R-125 in Figure 17. The R410A results are a good example of complications caused by
clathrate hydrates. It appears as if two lines intersect at 0°F (-18°C). The solubility is less below
0°F (-18°C) because of clathrate hydrate formation. Figure 12 indicates that a water level less
than 15 ppm at -40°F (-40°C) will prevent clathrate hydrate formation in the low-pressure region
of an operational system. Sealed tube observations confirm clathrate hydrate formation at 10°F
(-12°C) (see Figure 3). Figure 12 illustrates a change in water solubility at 0°F (-18°C).
Considering Gibbs Rule (F = 2 + C – P) and the fact that this azeotrope has two components, the
number of components is three (R-32, R-125, and water), thereby permitting the existence of four
phases so that one degree of freedom remains in tact for setting the temperature of the system.
18
Therefore, the phase changes affecting water solubility in R410A at 0°F (-18°C) through 10°F
(-12°C) might be from the presence of V, L1, and L2 to one of the following combinations:
1) V, L1, L2, and HI or HII,
2) V, L2, I, and HI or HII, or
3) V, L2, HI, and HII,
where: V = refrigerant vapor,
L1 = liquid water,
L2 = liquid refrigerant,
I = solid water (ice),
HI = clathrate hydrate structure I, and
HII = clathrate hydrate structure II.
The sealed tube observations show clathrate hydrate appearance at 10°F (-12°C) for
R410A and R-125 and at 50°F (10°C) for R-32 (see Figure 3). This is interesting because the
existence of a hydrate azeotrope has been reported with a lower dissociation pressure than that of
either of the components of the mixture (Holder et al. 1988). (See also Appendix D, Picture 6)
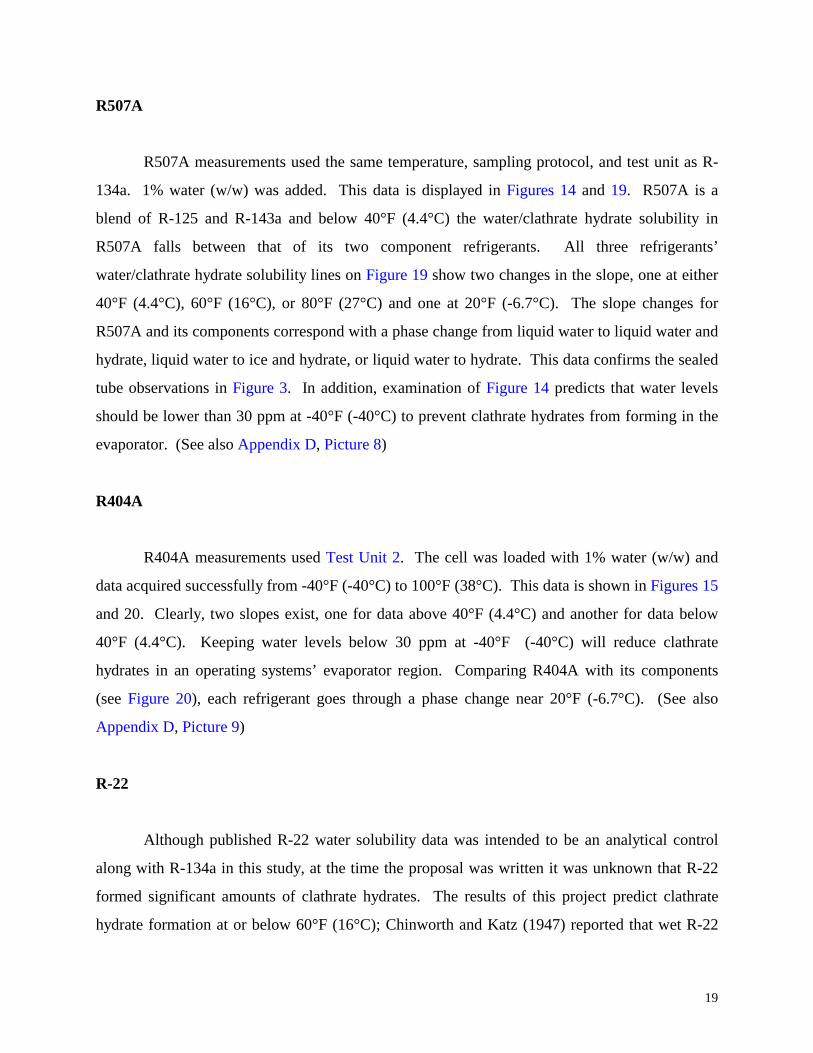
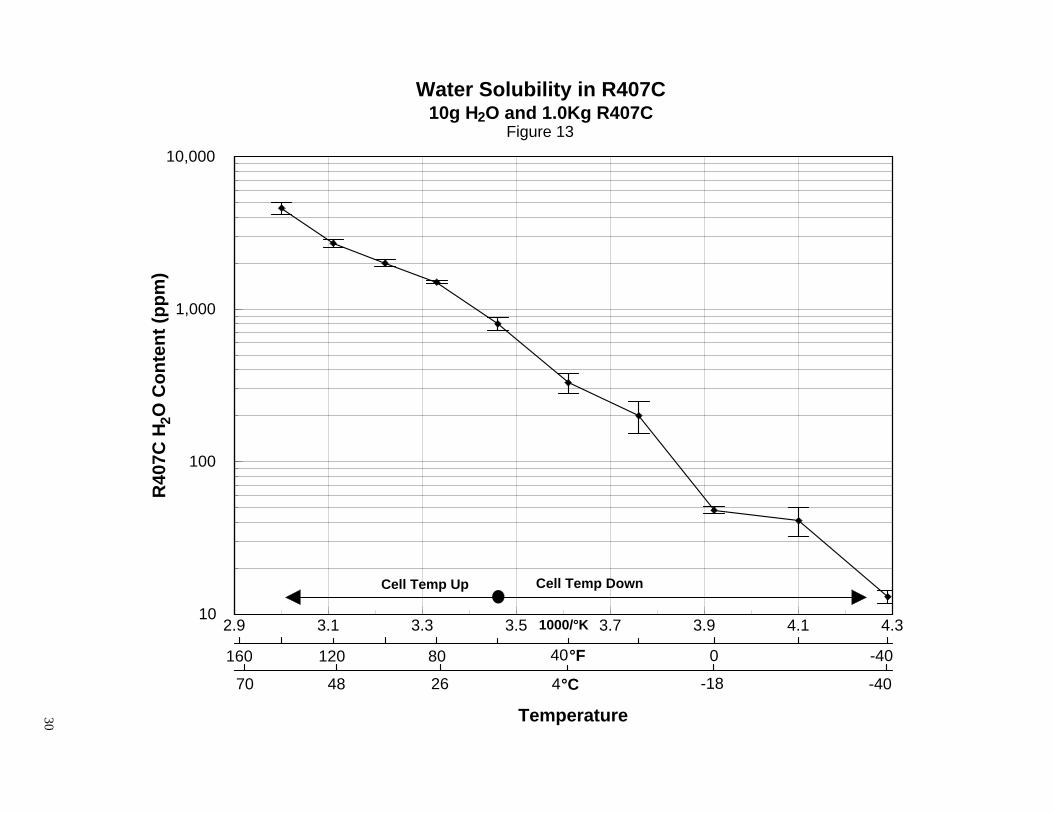
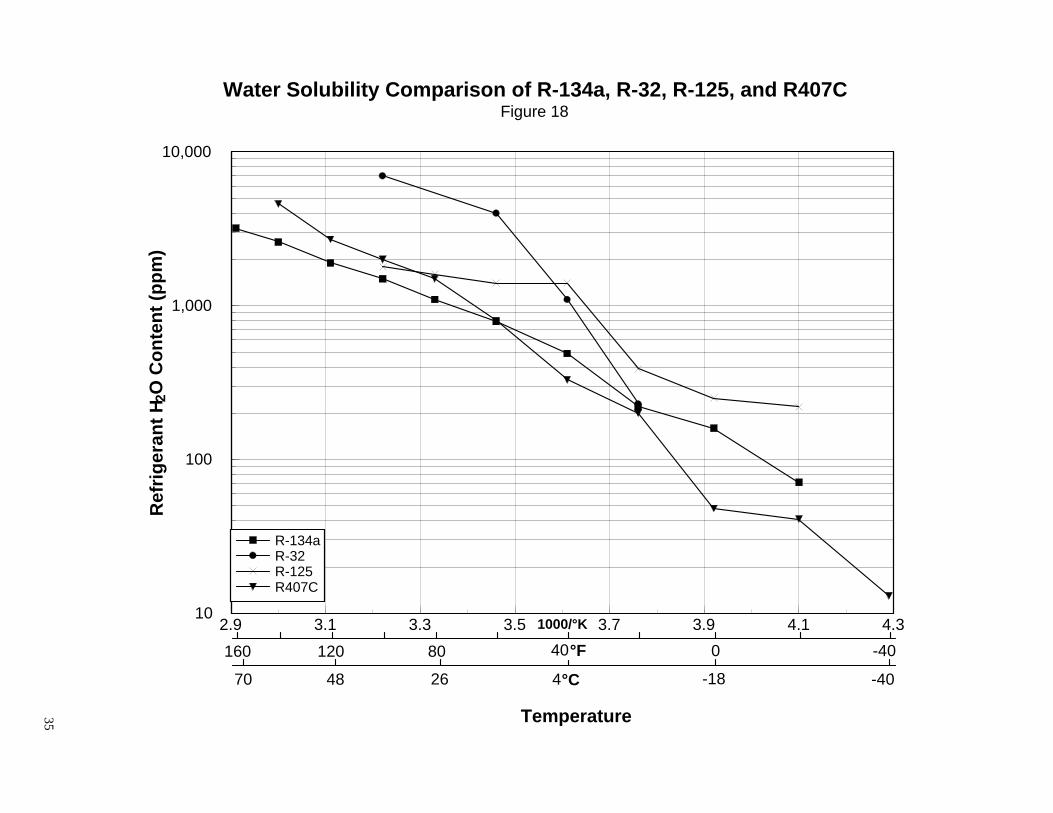
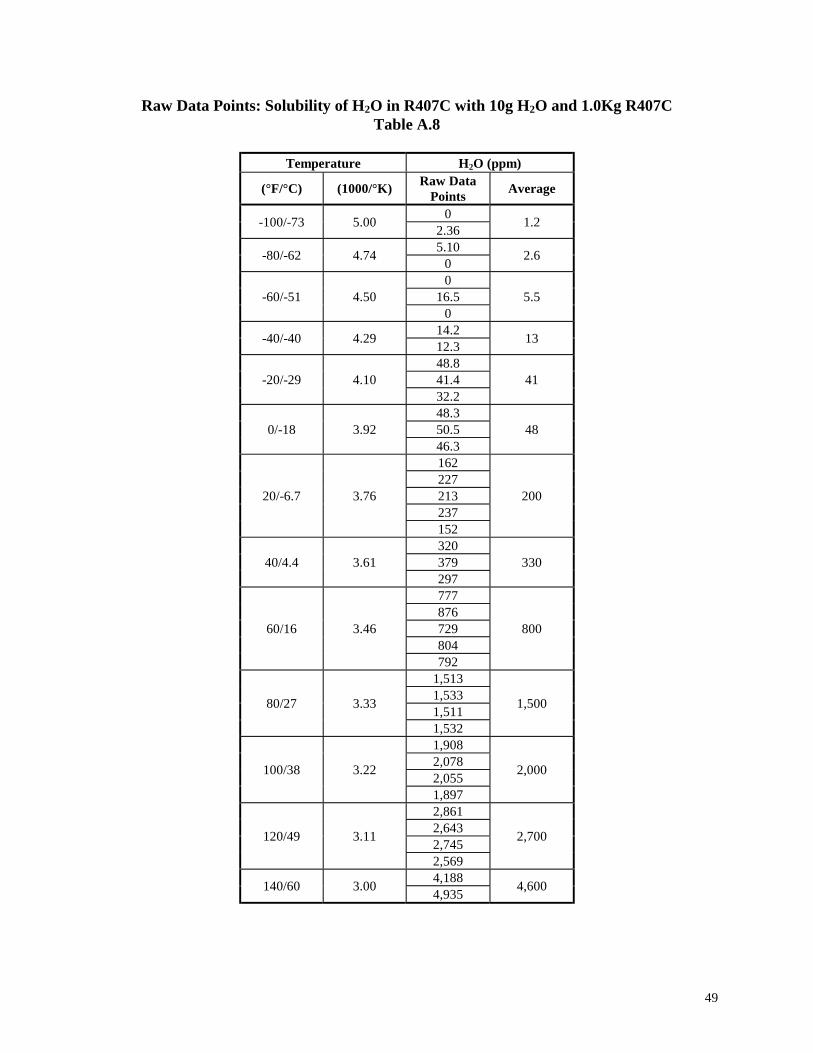
R407C
R407C measurements used the same temperature, sampling protocol, and test unit as
R-134a with 1% water (w/w). This data is shown in Figures 13 and 18. The R407C figures
illustrate a more subtle change in water equilibrium below 20°F (-6.7°C) with respect to
temperature points taken at 20°F (-6.7°C) and above. This can be explained by the temperature
at which clathrate hydrate is formed and dissolved (see Figure 3, R407C with 1% water (w/w)).
This is not surprising since clathrate hydrate observance for R407C and its components, except
R-32, is below 20°F (-6.7°C). A change in water solubility is noted below 20°F (-6.7°C),
reflecting a change in water equilibrium in R407C to clathrate hydrate equilibrium in R407C.
Operating levels of 15 ppm water at -40°F (-40°C) prevent clathrate hydrate formation in the
evaporator. (See also Appendix D, Picture 7)
19
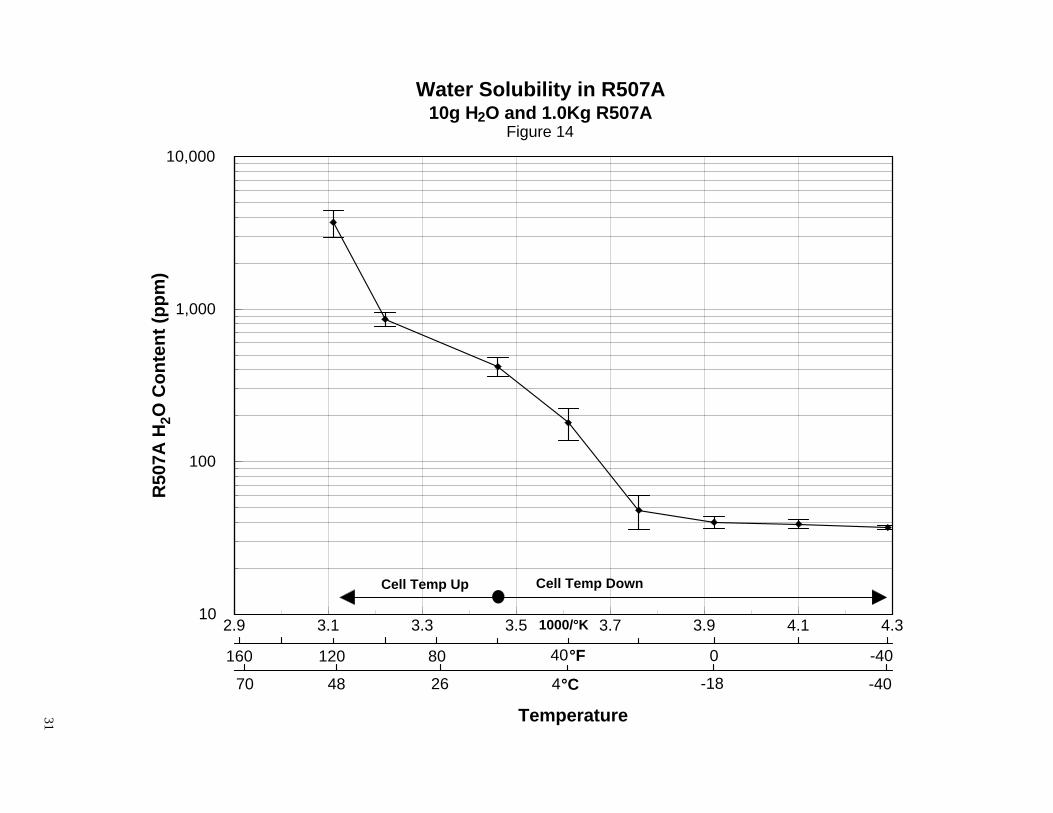
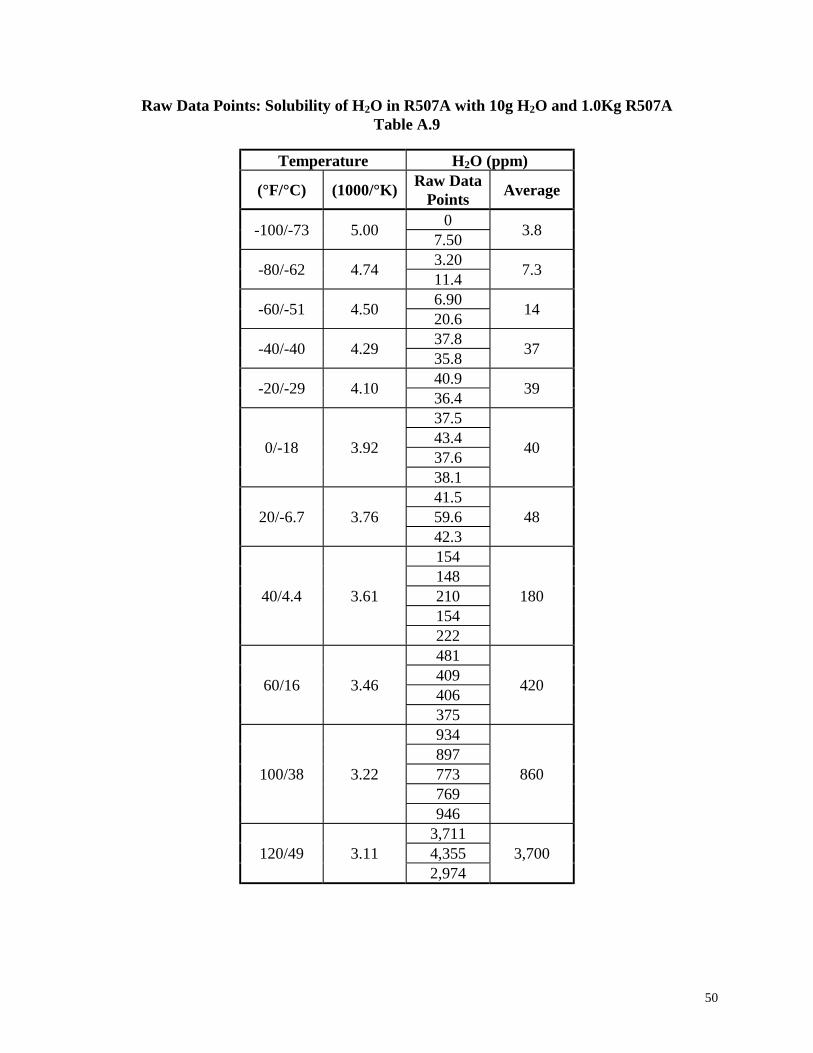
R507A
R507A measurements used the same temperature, sampling protocol, and test unit as R-
134a. 1% water (w/w) was added. This data is displayed in Figures 14 and 19. R507A is a
blend of R-125 and R-143a and below 40°F (4.4°C) the water/clathrate hydrate solubility in
R507A falls between that of its two component refrigerants. All three refrigerants’
water/clathrate hydrate solubility lines on Figure 19 show two changes in the slope, one at either
40°F (4.4°C), 60°F (16°C), or 80°F (27°C) and one at 20°F (-6.7°C). The slope changes for
R507A and its components correspond with a phase change from liquid water to liquid water and
hydrate, liquid water to ice and hydrate, or liquid water to hydrate. This data confirms the sealed
tube observations in Figure 3. In addition, examination of Figure 14 predicts that water levels
should be lower than 30 ppm at -40°F (-40°C) to prevent clathrate hydrates from forming in the
evaporator. (See also Appendix D, Picture 8)
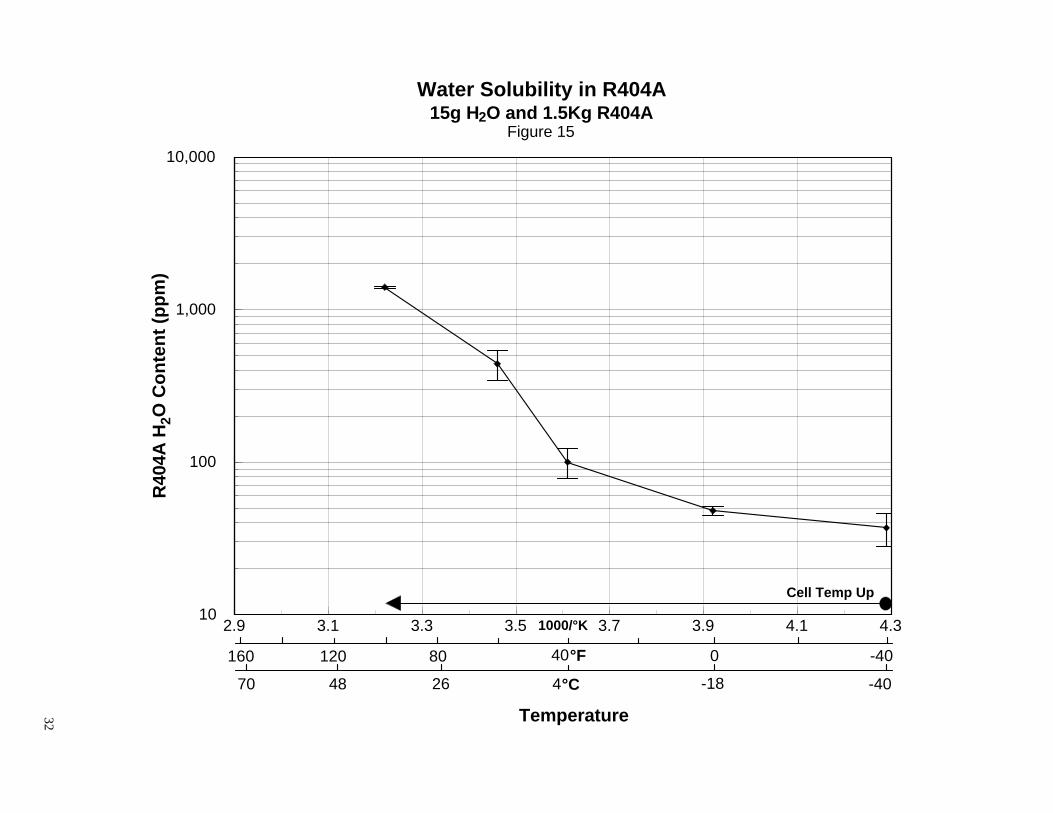
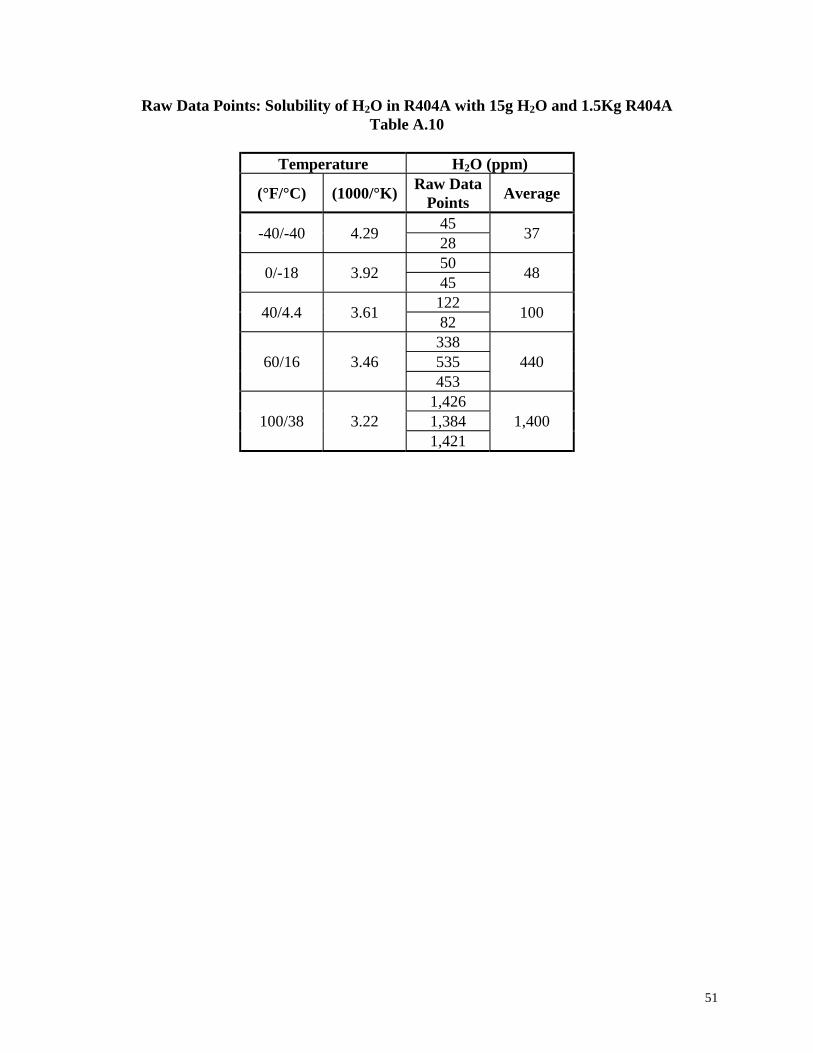
R404A
R404A measurements used Test Unit 2. The cell was loaded with 1% water (w/w) and
data acquired successfully from -40°F (-40°C) to 100°F (38°C). This data is shown in Figures 15
and 20. Clearly, two slopes exist, one for data above 40°F (4.4°C) and another for data below
40°F (4.4°C). Keeping water levels below 30 ppm at -40°F (-40°C) will reduce clathrate
hydrates in an operating systems’ evaporator region. Comparing R404A with its components
(see Figure 20), each refrigerant goes through a phase change near 20°F (-6.7°C). (See also
Appendix D, Picture 9)
R-22
Although published R-22 water solubility data was intended to be an analytical control
along with R-134a in this study, at the time the proposal was written it was unknown that R-22
formed significant amounts of clathrate hydrates. The results of this project predict clathrate
hydrate formation at or below 60°F (16°C); Chinworth and Katz (1947) reported that wet R-22
20
formed a solid hydrate at 64°F (18°C). Nevertheless, R-22 water solubility measurements were
attempted for comparison with published ASHRAE data (1994). The water solubility of R-22
was comparable to the reported ASHRAE value, 950 ppm vs. 970 ppm respectively, at 60°F
(16°C), but was vastly different at 80°F (27°C). Because R-22 forms flocculant clathrate
hydrates as readily as R-32 (see Appendix D, Pictures 2 and 10) and based on the difficulty
experienced during R-32 testing at lower temperatures, further R-22 testing was terminated.
R-23
Although liquid R-23 was to be tested in this project, no data points were attempted.
Raising the test unit to 80°F (27°C) and above with R-23 would have resulted in pressures
greater than 600psig, which exceeded safe limitations of the test apparatus. In addition, based on
previous testing, water solubility information obtained at temperatures of 60°F (16°C) or below
would have been misleading because of clathrate hydrate existence/interference. Because no
meaningful data could have been obtained without extensive reconstruction of the test cell, R-23
was eliminated from the project.
CONCLUSION
At lower temperatures, the amount of water in the test assembly is related to the amount
of clathrate hydrates formed, which interferes with the measurement of water and/or clathrate
hydrate solubility. The straight addition of water to the test system gives the analyst the most
precise method of controlling how much water is introduced. It is not advisable to exceed 2%
water (w/w) or to use less than 1% water (w/w). These amounts of water are in slight excess of
saturation so that maximum solubility is achieved at each temperature while the amount of
clathrate hydrate production is minimized at the lower temperatures (see Appendix D, 1% v. 5%
water (w/w) added).
The water solubility data reported by ASHRAE (1994) in Table 1, Solubility of Water in
the Liquid Phase of Certain Refrigerants, matches the data (excluding R-134a and R-123)
reported by DuPont in Bulletins B-43 (1982a) and M-5 (1982b) up to 100°F (38°C). More
21
importantly, Chinworth and Katz (1947) reported the formation of refrigerant clathrate hydrates
for R-11 (47°F/8.3°C), R-12 (52°F/11°C), and R-22 (62°F/17°C). This is further confirmed by
Briggs and Barduhn (1962). Some data supplied to the industry was correlated to experimental
data and may represent water solubility measured in the presence of clathrate hydrates. It is
questionable to conclude that straight-line water solubility exists based on the results of this
research. The more recent data for R-134a seems to have been partially obtained from an
ASHRAE research project (RP-602) using an NMR technique. The data reported in the
ASHRAE handbook was taken from a temperature range of -9.7°F (-23°C) to 98°F (37°C),
which is within the range of clathrate hydrate formation. Examining the water solubility range
below 0°F (-18°C) is pointless due to NMR crystal broad banding. Downing (1988) reports the
solubility of R-152a and R-23 at temperatures where both clathrate hydrates and liquid
conditions exist. However, he reports straight-line solubility curves in regions where clathrate
hydrates may exist.
The solubility of water is the concentration of water in solution in the immiscible
refrigerant-rich liquid phase in equilibrium with 1) a water rich liquid phase or 2) at or below
metastable temperatures, the solid clathrate hydrate phase. The solubility of water plotted as log
refrigerant water content (ppm) vs. temperature (1000/°K) may show a different slope in the
clathrate hydrate temperature region than in the non-clathrate hydrate temperature region because
of a phase change affecting water solubility. The solubility of liquid water in liquid refrigerant
above the clathrate hydrate formation temperature is independent of the overall water
concentration in the test cell. However, water content does indeed have a noticeable effect at the
lower temperatures when clathrate hydrates are formed. This is due to the varying amounts of
liquid water and/or clathrate hydrate formation. It is difficult to determine the impact blends and
azeotropes have on clathrate hydrate formation. By itself, one component of a blend may form
clathrate hydrates at an observed temperature. However, the presence of other components in a
blend or azeotrope may change the clathrate hydrate formation temperature.
When interpreting the results of this study on water and/or clathrate hydrate
equilibrium/solubility in a liquid refrigerant rich environment under isothermal conditions, the
impact of clathrate hydrates cannot be ignored. Although clathrate hydrates were not the focal
point of this research, their presence affected the level of equilibrium water solubility. The fact
22
that water was measured in temperature regions where clathrate hydrates exist is significant. The
water level measured can be attributed to clathrate hydrates since, recalling Gibbs Phase Rule
(F=2+C-P) for a pure refrigerant rich environment at a temperature supporting metastability and
nucleation, only three phases can exist: liquid and vapor refrigerant and clathrate hydrate. This
means that some clathrate hydrate was expelled with refrigerant during the sampling procedure,
representing the solubility of clathrate in refrigerant at that sampling temperature and
theoretically accounting for all the water in that sample’s result.
This research provides ASHRAE with data and relevant information regarding liquid
refrigerant properties in the presence of water. It also contributes a firm foundation for further
research to understand water solubility in refrigerants. The use of liquid water in a water
equilibrium isothermal situation with liquid refrigerant is a sound approach at a temperature
above clathrate hydrate formation. The water solubility data generated in this research compares
favorably with R-134a data taken by an NMR method (Thrasher et al. 1993) and data taken using
near infrared spectroscopy (Jackson et al. 1995).
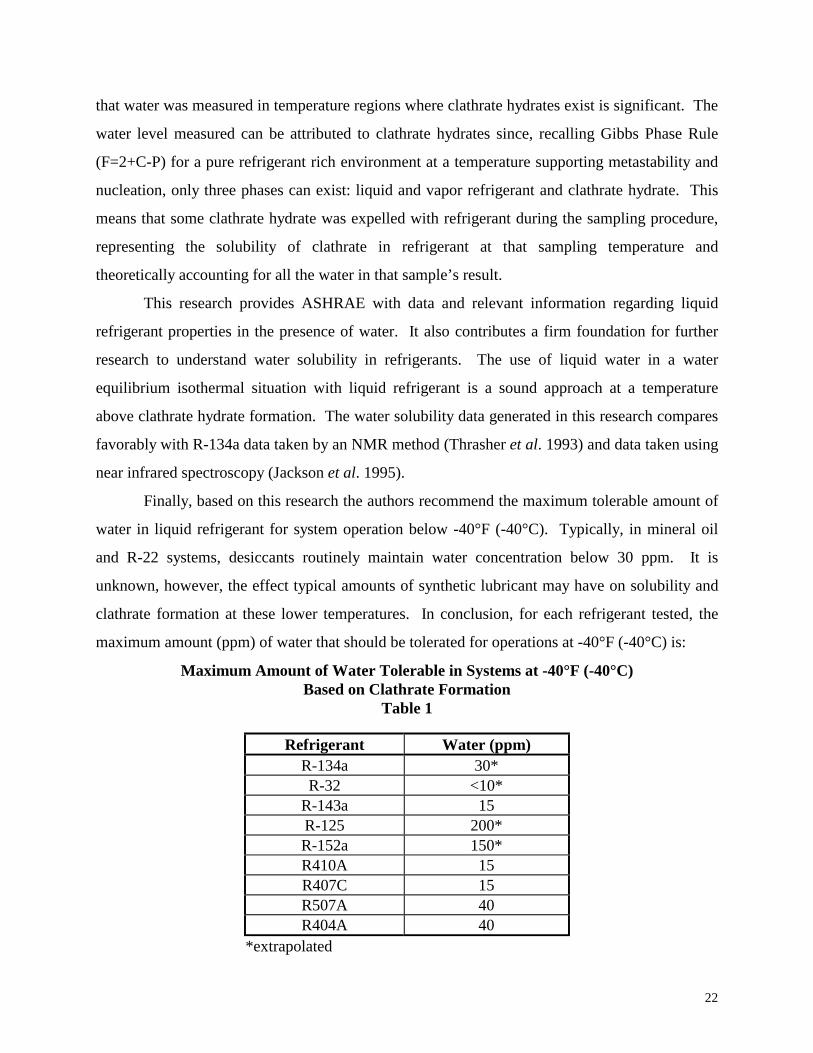
Finally, based on this research the authors recommend the maximum tolerable amount of
water in liquid refrigerant for system operation below -40°F (-40°C). Typically, in mineral oil
and R-22 systems, desiccants routinely maintain water concentration below 30 ppm. It is
unknown, however, the effect typical amounts of synthetic lubricant may have on solubility and
clathrate formation at these lower temperatures. In conclusion, for each refrigerant tested, the
maximum amount (ppm) of water that should be tolerated for operations at -40°F (-40°C) is:
Maximum Amount of Water Tolerable in Systems at -40°F (-40°C)Based on Clathrate Formation
Table 1
Refrigerant Water (ppm)R-134a 30*R-32 <10*
R-143a 15R-125 200*R-152a 150*R410A 15R407C 15R507A 40R404A 40
*extrapolated
23
2.9 3.1 3.3 3.5 3.7 3.9 4.1 4.31000/°K10
100
1,000
10,000R
-134
a H
2O
Co
nte
nt
(pp
m)
Water Solubility in R-134a8.0g H2O and 1.0Kg R-134a
Figure 6
160 120 80 40°F 0 -40
70 48 26 4°C -18 -40
Temperature
Cell Temp Up Cell Temp Down
23
24
2.9 3.1 3.3 3.5 3.7 3.9 4.1 4.31000/°K100
1,000
10,000R
-32
H2O
Co
nte
nt
(pp
m)
Water Solubility in R-3215g H2O and 1.5Kg R-32
Figure 7
160 120 80 40°F 0 -40
70 48 26 4°C -18 -40
Temperature
Warm to 80°F and cool to 60°F
24
25
2.9 3.1 3.3 3.5 3.7 3.9 4.1 4.31000/°K100
1,000
10,000R
-32
H2O
Co
nte
nt
(pp
m)
Water Solubility in R-3225g H2O in 50g 14-20 mesh Silica Gel and 1.5Kg R-32
Figure 8
160 120 80 40°F 0 -40
70 48 26 4°C -18 -40
Temperature
Cell Temp Up
25
26
2.9 3.1 3.3 3.5 3.7 3.9 4.1 4.31000/°K10
100
1,000
10,000R
-143
a H
2O
Co
nte
nt
(pp
m)
Water Solubility in R-143a15g H2O and 1.5Kg R-143a
Figure 9
160 120 80 40°F 0 -40
70 48 26 4°C -18 -40
Temperature
Cell Temp Up Cell Temp Down
26
27
2.9 3.1 3.3 3.5 3.7 3.9 4.1 4.31000/°K100
1,000
10,000R
-125
H2O
Co
nte
nt
(pp
m)
Water Solubility in R-12510g H2O and 1.0Kg R-125
Figure 10
160 120 80 40°F 0 -40
70 48 26 4°C -18 -40
Temperature
Cell Temp Up Cell Temp Down
27
28
2.9 3.1 3.3 3.5 3.7 3.9 4.1 4.31000/°K100
1,000
10,000R
-152
a H
2O
Co
nte
nt
(pp
m)
Water Solubility in R-152a15g H2O and 1.5Kg R-152a
Figure 11
160 120 80 40°F 0 -40
70 48 26 4°C -18 -40
Temperature
Cell Temp Up
28
29
2.9 3.1 3.3 3.5 3.7 3.9 4.1 4.31000/°K10
100
1,000
10,000R
410A
H2O
Co
nte
nt
(pp
m)
Water Solubility in R410A10g H2O and 1.0Kg R410A
Figure 12
160 120 80 40°F 0 -40
70 48 26 4°C -18 -40
Temperature
Cell Temp Up Cell Temp Down
29
30
2.9 3.1 3.3 3.5 3.7 3.9 4.1 4.31000/°K10
100
1,000
10,000R
407C
H2O
Co
nte
nt
(pp
m)
Water Solubility in R407C10g H2O and 1.0Kg R407C
Figure 13
160 120 80 40°F 0 -40
70 48 26 4°C -18 -40
Temperature
Cell Temp Up Cell Temp Down
30
31
2.9 3.1 3.3 3.5 3.7 3.9 4.1 4.31000/°K10
100
1,000
10,000R
507A
H2O
Co
nte
nt
(pp
m)
Water Solubility in R507A10g H2O and 1.0Kg R507A
Figure 14
160 120 80 40°F 0 -40
70 48 26 4°C -18 -40
Temperature
Cell Temp Up Cell Temp Down
31
32
2.9 3.1 3.3 3.5 3.7 3.9 4.1 4.31000/°K10
100
1,000
10,000R
404A
H2O
Co
nte
nt
(pp
m)
Water Solubility in R404A15g H2O and 1.5Kg R404A
Figure 15
160 120 80 40°F 0 -40
70 48 26 4°C -18 -40
Temperature
Cell Temp Up
32
33
2.9 3.1 3.3 3.5 3.7 3.9 4.1 4.31000/°K10
100
1,000
10,000R
efri
ger
ant
H2O
Co
nte
nt
(pp
m)
R-134aR-32R-32 (silica gel)R-143aR-125R-152a
-40040°F80120160
4870 26 4°C -18 -40
Temperature
Water Solubility Comparison of R-134a, R-32, R-143a, R-125, and R-152aFigure 16
33
34
2.9 3.1 3.3 3.5 3.7 3.9 4.1 4.31000/°K10
100
1,000
10,000R
efri
ger
ant
H2O
Co
nte
nt
(pp
m)
R-32R-125R410A
-40040°F80120160
4870 26 4°C -18 -40
Temperature
Water Solubility Comparison of R-32, R-125, and R410AFigure 17
34
35
2.9 3.1 3.3 3.5 3.7 3.9 4.1 4.31000/°K10
100
1,000
10,000R
efri
ger
ant
H2O
Co
nte
nt
(pp
m)
R-134aR-32R-125R407C
-40040°F80120160
4870 26 4°C -18 -40
Temperature
Water Solubility Comparison of R-134a, R-32, R-125, and R407CFigure 18
35
36
2.9 3.1 3.3 3.5 3.7 3.9 4.1 4.31000/°K10
100
1,000
10,000R
efri
ger
ant
H2O
Co
nte
nt
(pp
m)
R-143aR-125R507A
-40040°F80120160
4870 26 4°C -18 -40
Temperature
Water Solubility Comparison of R-143a, R-125, and R507AFigure 19
36
37
2.9 3.1 3.3 3.5 3.7 3.9 4.1 4.31000/°K10
100
1,000
10,000R
efri
ger
ant
H2O
Co
nte
nt
(pp
m)
R-134aR-143aR-125R404A
-40040°F80120160
4870 26 4°C -18 -40
Temperature
Water Solubility Comparison of R-134a, R-143a, R-125, and R404AFigure 20
37
38
REFERENCES
Akiya, T., T. Shimazaki, M. Oowa, M. Matsuo, and Y. Yoshida. 1997. Formation conditions of
clathrates between HFC alternative refrigerants and water. 13th Symposium on
Thermophysical Properties. Boulder, CO.
ASHRAE. 1994. Moisture and other contaminant control in refrigerant systems. 1994 ASHRAE
Handbook – Refrigeration Systems and Applications. Ch.6: 601-613. American Society of
Heating, Refrigerating, and Air-Conditioning Engineers, Inc.: Atlanta.
Briggs, F.A. and A.J. Barduhn. 1962. Fluorocarbons in the hydrate process. Advances in
Chemistry Series. Ch.14: 190-199. American Chemical Society.
Cavestri, R.C. and W.R. Schafer. 1999a. Equilibrium water capacity of desiccants in mixtures
of HFC refrigerants and appropriate lubricants. ASHRAE Transactions. 105(2): 60-65.
Cavestri, R.C. and W.R. Schafer. 1999b. Equilibrium point dryness and water capacity. ARTI
MCLR Project 670-54300. Final Report.
Cavestri, R.C. and D.L. Schooley. 1998. Test method for inorganic acid removal capacity of
desiccants used in liquid line filter driers. ASHRAE Transactions. 104(1B): 1335-1340.
Chinworth, H.E. and D.L. Katz. 1947. Refrigerant hydrates. Refrigerating Engineering. 54:
359-363.
Daniels, F., J.W. Williams, P. Bender, R.A. Alberty, and C.D. Cornwell. 1962. Experimental
Physical Chemistry. McGraw-Hill: New York.
Downing, R.C. 1988. Fluorocarbon Refrigerants Handbook. Prentice Hall: Englewood Cliffs,
NJ.
39
DuPont Co. Freon Products Division. 1982a. Solubility relationships between fluorocarbons
and H2O. Bulletin B-43.
DuPont Co. Freon Products Division. 1982b. Solubility of water in the liquid phase of the freon
products. Bulletin M-5.
Holder, G.D., S.P. Zetts, and N. Pradhan. 1988. Phase behavior in systems containing clathrate
hydrates. Reviews in Chem. E. 5(1-4): 1-70.
Jackson, K., L.E. Bowman, and J.L. Fulton. 1995. Water solubility measurements in
supercritical fluids and high-pressure liquids using near infrared spectroscopy. Anal. Chem.
67: 2368-2371.
Lederhos, J.P., A.P. Mehta, G.B. Nyberg, K.J. Warn, and E.D. Sloan. 1992. Structure H
clathrate hydrate equilibria of methane and adamantane. AIChE Journal. 38(7).
Mori, Y.H. and T. Mori. 1989. Formation of gas hydrate with CFC alternative R-134a. AIChE
Journal. 35(7).
Morrison, R.T. and R.N. Boyd. 1973. Organic Chemistry, 3d ed. Allyn and Bacon, Inc.:
Boston. Page 28.
Parrish, W.R., A.G. Pollin, and T.W. Schmidt. 1982. Properties of ethane-propane mixes, water
solubility and liquid densities. Proceedings of the 61st Annual Convention, Gas Processors
Association. Tulsa, OK.
Sloan, Jr., E.D. 1990. Clathrate hydrates of natural gases. Marcel Dekker, Inc.: New York.
Sturgis, J. 1996. Personal communication with the author.
40
Sugaya, M. and Y.H. Mori. 1996. Behavior of clathrate hydrate formation at the boundary of
liquid water and a fluorocarbon in liquid or vapor state. Chem. E. Science. 51(13): 3505-
3517.
Thrasher, J.S., R. Timkovich, H.P.S. Kumar, and S. L. Hathcock. 1993. Moisture solubility in
R-123 and R-134a. ASHRAE Transactions. 100(1): 346-357.
Walker, W.O., S. Rosen, S.L. Levy. 1960. A study of the factors influencing the stability of
mixtures of Refrigerant 22 and refrigerating oils. ASHRAE Transactions. 66: 445-464.
41
Appendix ARaw Data
42
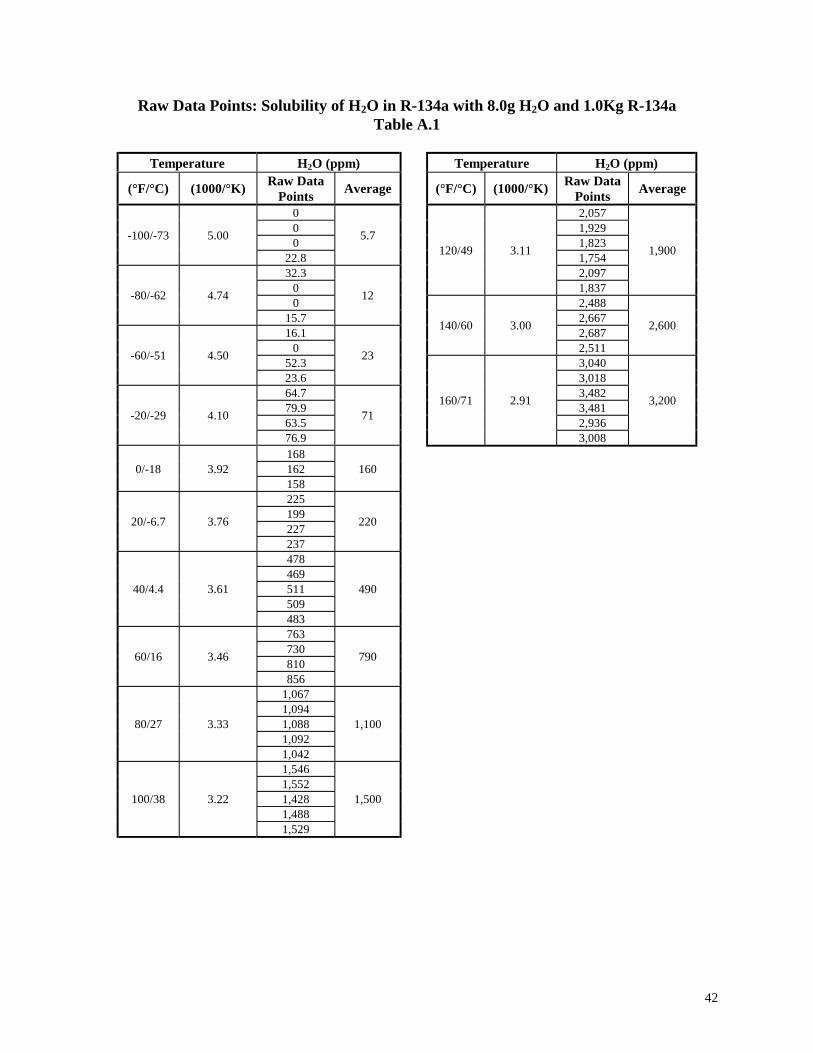
Raw Data Points: Solubility of H2O in R-134a with 8.0g H2O and 1.0Kg R-134aTable A.1
Temperature H2O (ppm) Temperature H2O (ppm)
(°F/°C) (1000/°K)Raw Data
PointsAverage (°F/°C) (1000/°K)
Raw DataPoints
Average
0 2,0570 1,9290 1,823
-100/-73 5.00
22.8
5.7
1,75432.3 2,097
0
120/49 3.11
1,837
1,900
0 2,488-80/-62 4.74
15.7
12
2,66716.1 2,687
0
140/60 3.00
2,511
2,600
52.3 3,040-60/-51 4.50
23.6
23
3,01864.7 3,48279.9 3,48163.5 2,936
-20/-29 4.10
76.9
71160/71 2.91
3,008
3,200
1681620/-18 3.92158
160
225199227
20/-6.7 3.76
237
220
478469511509
40/4.4 3.61
483
490
763730810
60/16 3.46
856
790
1,0671,0941,0881,092
80/27 3.33
1,042
1,100
1,5461,5521,4281,488
100/38 3.22
1,529
1,500
43
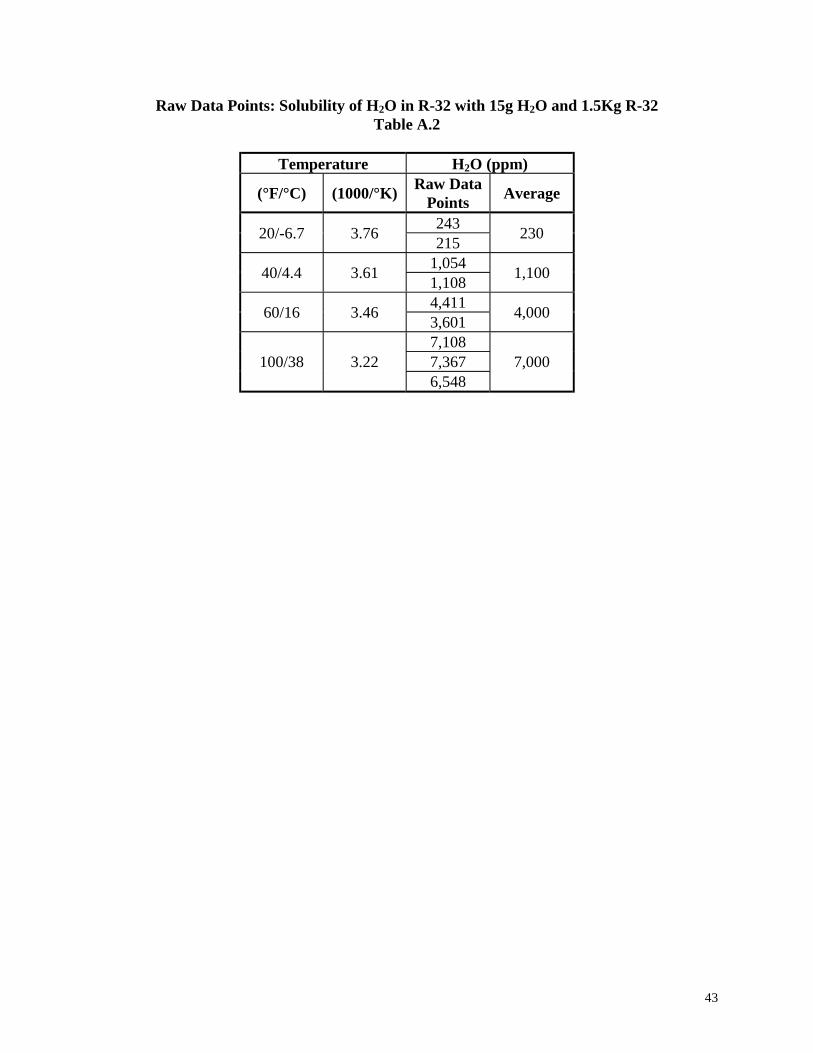
Raw Data Points: Solubility of H2O in R-32 with 15g H2O and 1.5Kg R-32Table A.2
Temperature H2O (ppm)
(°F/°C) (1000/°K)Raw Data
PointsAverage
24320/-6.7 3.76
215230
1,05440/4.4 3.61
1,1081,100
4,41160/16 3.46
3,6014,000
7,1087,367100/38 3.226,548
7,000
44
Raw Data Points: Solubility of H2O in R-32 with 25g H2O in 50g 14-20 mesh Silica Geland 1.5Kg R-32
Table A.3
Temperature H2O (ppm)
(°F/°C) (1000/°K)Raw Data
PointsAverage
479439-40/-40 4.29462
460
2,5202,39360/16 3.462,303
2,400
3,8833,15280/27 3.333,870
3,600
4,2714,289100/38 3.224,919
4,500
4,5194,5674,6454,720
120/49 3.11
4,804
4,700
45
Raw Data Points: Solubility of H2O in R-143a with 15g H2O and 1.5Kg R-143aTable A.4
Temperature H2O (ppm)
(°F/°C) (1000/°K)Raw Data
PointsAverage
1.20-100/-73 5.00
3.802.5
00-80/-62 4.74
12.24.1
3.510-60/-51 4.50
17.26.9
15.610.9-40/-40 4.2911.8
13
17.616.9-20/-29 4.1019.6
18
21.90/-18 3.92
17.320
29.320/-6.7 3.76
29.329
14819440/4.4 3.61189
180
5,1703,89960/16 3.465,563
4,900
5,8004,90080/27 3.335,800
5,500
7,600100/38 3.22
7,0007,300
11,100120/49 3.11
9,00010,000
46
Raw Data Points: Solubility of H2O in R-125 with 10g H2O and 1.0Kg R-125Table A.5
Temperature H2O (ppm)
(°F/°C) (1000/°K)Raw Data
PointsAverage
71.1-100/-73 5.00
32.952
0-80/-62 4.74
14472
28.0-60/-51 4.50
172100
249177214
-20/-29 4.10
225
220
2670/-18 3.92
230250
350404466
20/-6.7 3.76
336
390
1,5001,50040/4.4 3.611,100
1,400
1,4001,20060/16 3.461,600
1,400
1,70080/27 3.33
1,4001,600
2,0001,900100/38 3.221,500
1,800
47
Raw Data Points: Solubility of H2O in R-152a with 15g H2O and 1.5Kg R-152aTable A.6
Temperature H2O (ppm)
(°F/°C) (1000/°K)Raw Data
PointsAverage
3753570/-18 3.92276
340
86840/4.4 3.61
922900
2,06260/16 3.46
1,6741,900
2,8162,240100/38 3.222,669
2,600
3,6223,202140/60 3.003,058
3,300
48
Raw Data Points: Solubility of H2O in R410A with 10g H2O and 1.0Kg R410ATable A.7
Temperature H2O (ppm)
(°F/°C) (1000/°K)Raw Data
PointsAverage
0.114-100/-73 5.00
00.06
0.2000.630
0-80/-62 4.74
0.410
0.31
05.07
0-60/-51 4.50
1.67
1.7
11.614.712.7
-40/-40 4.29
11.7
13
39.244.539.5
-20/-29 4.10
36.0
40
253295222
0/-18 3.92
193
240
40739520/-6.7 3.76432
410
645550545
40/4.4 3.61
585
580
953937
1,01160/16 3.46
983
970
1,4201,29380/27 3.331,731
1,500
2,7592,466100/38 3.222,952
2,700
3,2523,356120/49 3.113,862
3,500
49
Raw Data Points: Solubility of H2O in R407C with 10g H2O and 1.0Kg R407CTable A.8
Temperature H2O (ppm)
(°F/°C) (1000/°K)Raw Data
PointsAverage
0-100/-73 5.00
2.361.2
5.10-80/-62 4.74
02.6
016.5-60/-51 4.50
05.5
14.2-40/-40 4.29
12.313
48.841.4-20/-29 4.1032.2
41
48.350.50/-18 3.9246.3
48
162227213237
20/-6.7 3.76
152
200
32037940/4.4 3.61297
330
777876729804
60/16 3.46
792
800
1,5131,5331,511
80/27 3.33
1,532
1,500
1,9082,0782,055
100/38 3.22
1,897
2,000
2,8612,6432,745
120/49 3.11
2,569
2,700
4,188140/60 3.00
4,9354,600
50
Raw Data Points: Solubility of H2O in R507A with 10g H2O and 1.0Kg R507ATable A.9
Temperature H2O (ppm)
(°F/°C) (1000/°K)Raw Data
PointsAverage
0-100/-73 5.00
7.503.8
3.20-80/-62 4.74
11.47.3
6.90-60/-51 4.50
20.614
37.8-40/-40 4.29
35.837
40.9-20/-29 4.10
36.439
37.543.437.6
0/-18 3.92
38.1
40
41.559.620/-6.7 3.7642.3
48
154148210154
40/4.4 3.61
222
180
481409406
60/16 3.46
375
420
934897773769
100/38 3.22
946
860
3,7114,355120/49 3.112,974
3,700
51
Raw Data Points: Solubility of H2O in R404A with 15g H2O and 1.5Kg R404ATable A.10
Temperature H2O (ppm)
(°F/°C) (1000/°K)Raw Data
PointsAverage
45-40/-40 4.29
2837
500/-18 3.92
4548
12240/4.4 3.61
82100
33853560/16 3.46453
440
1,4261,384100/38 3.221,421
1,400
52
Appendix BData Points (averaged)
53
Data Points (averaged): Solubility of H2O in R-134a with 8.0g H2O and 1.0Kg R-134aTable B.1
Temperature(°F/°C) (1000/°K)
H2O(ppm)
Error(ppm)
Error (ppm)/H2O (ppm)(%)
-100/-73 5.00 5.7 ±17 300-80/-62 4.74 12 ±20 170-60/-51 4.50 23 ±29 130-20/-29 4.10 71 ±8.9 130/-18 3.92 160 ±8.0 5.0
20/-6.7 3.76 220 ±21 1040/4.4 3.61 490 ±21 4.360/16 3.46 790 ±66 8.480/27 3.33 1,100 ±58 5.3100/38 3.22 1,500 ±72 4.8120/49 3.11 1,900 ±200 11140/60 3.00 2,600 ±110 4.2160/71 2.91 3,200 ±280 8.8
Data Points (averaged): Solubility of H2O in R-32 with 15g H2O and 1.5Kg R-32Table B.2
Temperature(°F/°C) (1000/°K)
H2O(ppm)
Error(ppm)
Error (ppm)/H2O (ppm)(%)
20/-6.7 3.76 230 ±15 6.540/4.4 3.61 1,100 ±46 4.260/16 3.46 4,000 ±410 9.8100/38 3.22 7,000 ±450 6.4
Data Points (averaged): Solubility of H2O in R-32 with 25g H2O in 50g 14-20 meshSilica Gel and 1.5Kg R-32
Table B.3
Temperature(°F/°C) (1000/°K)
H2O(ppm)
Error(ppm)
Error (ppm)/H2O (ppm)(%)
-40/-40 4.29 460 ±21 4.660/16 3.46 2,400 ±120 5.080/27 3.33 3,600 ±450 13100/38 3.22 4,500 ±420 9.3120/49 3.11 4,700 ±180 3.8
54
Data Points (averaged): Solubility of H2O in R-143a with 15g H2O and 1.5Kg R-143aTable B.4
Temperature(°F/°C) (1000/°K)
H2O(ppm)
Error(ppm)
Error (ppm)/H2O (ppm)(%)
-100/-73 5.00 2.5 ±1.3 52-80/-62 4.74 4.1 ±8.1 200-60/-51 4.50 6.9 ±10 140-40/-40 4.29 13 ±2.6 20-20/-29 4.10 18 ±1.6 8.90/-18 3.92 20 ±2.7 14
20/-6.7 3.76 29 ±0.3 1.040/4.4 3.61 180 ±32 1860/16 3.46 4,900 ±1,000 2080/27 3.33 5,500 ±600 11100/38 3.22 7,300 ±300 4.1120/49 3.11 10,000 ±1,000 10
Data Points (averaged): Solubility of H2O in R-125 with 10g H2O and 1.0Kg R-125Table B.5
Temperature(°F/°C) (1000/°K)
H2O(ppm)
Error(ppm)
Error (ppm)/H2O (ppm)(%)
-100/-73 5.00 52 ±19 37-80/-62 4.74 72 ±72 100-60/-51 4.50 100 ±72 72-20/-29 4.10 220 ±43 200/-18 3.92 250 ±20 8.0
20/-6.7 3.76 390 ±76 1940/4.4 3.61 1,400 ±300 2160/16 3.46 1,400 ±200 1480/27 3.33 1,600 ±200 13100/38 3.22 1,800 ±300 17
55
Data Points (averaged): Solubility of H2O in R-152a with 15g H2O and 1.5Kg R-152aTable B.6
Temperature(°F/°C) (1000/°K)
H2O(ppm)
Error(ppm)
Error (ppm)/H2O (ppm)(%)
0/-18 3.92 340 ±64 1940/4.4 3.61 900 ±32 3.660/16 3.46 1,900 ±230 12100/38 3.22 2,600 ±360 14140/60 3.00 3,300 ±320 9.7
Data Points (averaged): Solubility of H2O in R410A with 10g H2O and 1.0Kg R410ATable B.7
Temperature(°F/°C) (1000/°K)
H2O(ppm)
Error(ppm)
Error (ppm)/H2O (ppm)(%)
-100/-73 5.00 0.06 ±0.06 100-80/-62 4.74 0.31 ±0.32 97-60/-51 4.50 1.7 ±3.4 170-40/-40 4.29 13 ±1.7 13-20/-29 4.10 40 ±4.5 110/-18 3.92 240 ±55 23
20/-6.7 3.76 410 ±22 5.440/4.4 3.61 580 ±65 1160/16 3.46 970 ±41 4.280/27 3.33 1,500 ±230 15100/38 3.22 2,700 ±250 9.3120/49 3.11 3,500 ±360 10
56
Data Points (averaged): Solubility of H2O in R407C with 10g H2O and 1.0Kg R407CTable B.8
Temperature(°F/°C) (1000/°K)
H2O(ppm)
Error(ppm)
Error (ppm)/H2O (ppm)(%)
-100/-73 5.00 1.2 ±1.2 100
-80/-62 4.74 2.6 ±2.6 100
-60/-51 4.50 5.5 ±11 200
-40/-40 4.29 13 ±1.2 9.2
-20/-29 4.10 41 ±8.8 21
0/-18 3.92 48 ±2.5 5.2
20/-6.7 3.76 200 ±48 24
40/4.4 3.61 330 ±49 15
60/16 3.46 800 ±76 9.5
80/27 3.33 1,500 ±33 2.2
100/38 3.22 2,000 ±100 5.0
120/49 3.11 2,700 ±160 5.9
140/60 3.00 4,600 ±410 8.9
Data Points (averaged): Solubility of H2O in R507A with 10g H2O and 1.0Kg R507ATable B.9
Temperature(°F/°C) (1000/°K)
H2O(ppm)
Error(ppm)
Error (ppm)/H2O (ppm)(%)
-100/-73 5.00 3.8 ±3.8 100
-80/-62 4.74 7.3 ±4.1 56
-60/-51 4.50 14 ±7.1 51
-40/-40 4.29 37 ±1.2 3.2
-20/-29 4.10 39 ±2.6 6.7
0/-18 3.92 40 ±3.4 8.5
20/-6.7 3.76 48 ±12 25
40/4.4 3.61 180 ±42 23
60/16 3.46 420 ±61 15
100/38 3.22 860 ±91 11
120/49 3.11 3,700 ±730 20
57
Data Points (averaged): Solubility of H2O in R404A with 15g H2O and 1.5Kg R404ATable B.10
Temperature(°F/°C) (1000/°K)
H2O(ppm)
Error(ppm)
Error (ppm)/H2O (ppm)(%)
-40/-40 4.29 37 ±9 240/-18 3.92 48 ±3 6.340/4.4 3.61 100 ±22 2260/16 3.46 440 ±100 23100/38 3.22 1,400 ±26 1.9
58
Appendix CSealed Tube Analysis Method
Sealed tubes were prepared to observe the formation and disappearance of clathrate
hydrates in water and refrigerant as temperatures decreased from 80°F (27°C) to 0°F (-18°C) and
increased from 0°F (-18°C) to 80°F (27°C). Specific ratios of water and refrigerant were sealed
in heavy walled glass tubes labeled with ceramic marking ink on both ends. When labeling
tubes, the ink turns red as it is burned into the glass with a propane torch, then a cooler flame is
used to smooth the stress lines in the glass around the burned area.
The total weight of water and refrigerant in the specified ratio in the macro tubes should
be approximately 10g. The amount of water needed in each tube is calculated and added to the
tube using a 10µl syringe or a long Pasteur pipette. A four-place electronic balance is used for
weighing and the weights are recorded before and after water addition.
Oxygen and a MAPP gas torch form a thick-walled capillary in the glass above the water
in each tube, about 2½" from the top. A uniform glass wall thickness should be maintained
while constricting the tube. Didymium eye glasses assist in seeing the glass during this
manipulation.
To add refrigerant, first attach the constricted tube to the gas manifold. Submerge the
tube in liquid nitrogen in a thermos dewar. Evacuate the sample to <40mTorr and then close the
valve to the sample. Attach the refrigerant gas to the manifold with a charging hose and evacuate
the hose. Purge the manifold three times by adding refrigerant and evacuating it. The third
evacuation should be <60mTorr. Add refrigerant to the manifold so that the internal pressure is
800-900 mm Hg. Slowly open the tube valve to the manifold and allow the refrigerant gas to
condense as it contacts the cold tube. Control the amount of added refrigerant by observing the
manometer Hg fall. The difference in Hg levels can be related to the weight of condensed
refrigerant. Since the specific gravities of all refrigerants are different, a refrigerant constant,
which relates Hg pressure drop to refrigerant gas weight, must be determined before sample
tubes are charged with refrigerant. After sufficient refrigerant has been added, fill the dewar with
liquid nitrogen and evacuate the manifold to <40mTorr. Open the tube valve to eliminate non-
condensable gases (such as air) from the tube and evacuate to <40mTorr.
59
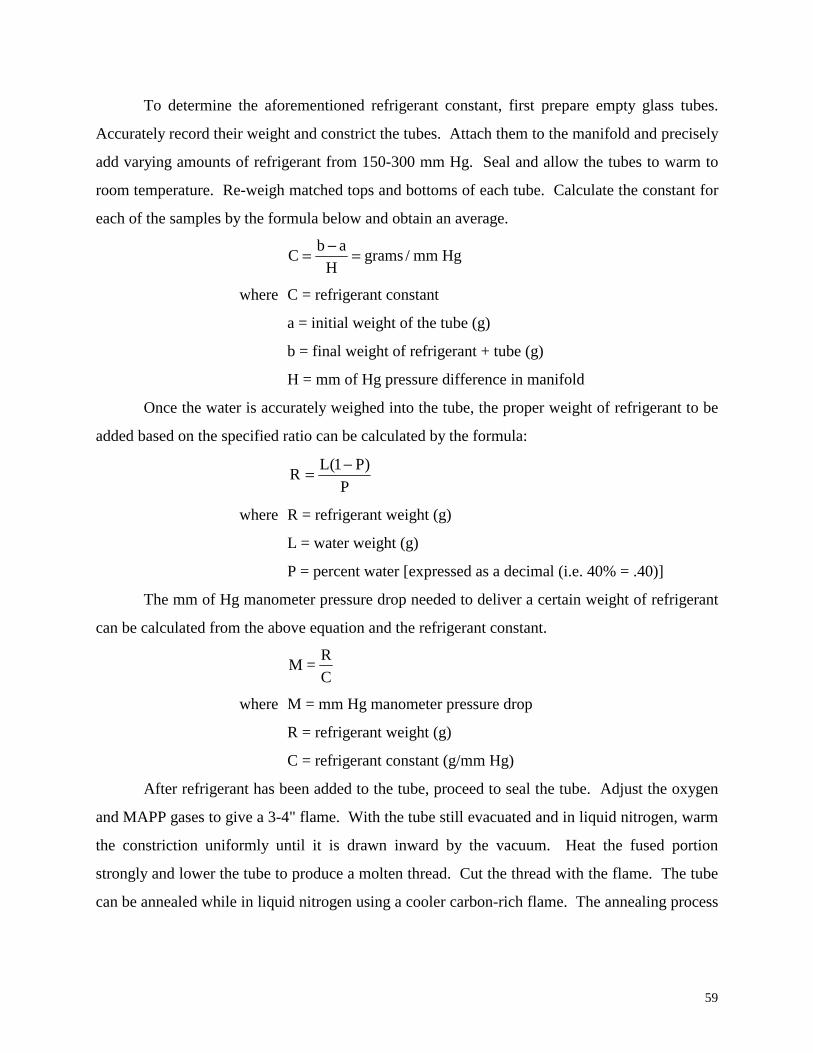
To determine the aforementioned refrigerant constant, first prepare empty glass tubes.
Accurately record their weight and constrict the tubes. Attach them to the manifold and precisely
add varying amounts of refrigerant from 150-300 mm Hg. Seal and allow the tubes to warm to
room temperature. Re-weigh matched tops and bottoms of each tube. Calculate the constant for
each of the samples by the formula below and obtain an average.
Cb a
Hgrams / mm Hg= − =
where C = refrigerant constant
a = initial weight of the tube (g)
b = final weight of refrigerant + tube (g)
H = mm of Hg pressure difference in manifold
Once the water is accurately weighed into the tube, the proper weight of refrigerant to be
added based on the specified ratio can be calculated by the formula:
P
)P1(LR
−=
where R = refrigerant weight (g)
L = water weight (g)
P = percent water [expressed as a decimal (i.e. 40% = .40)]
The mm of Hg manometer pressure drop needed to deliver a certain weight of refrigerant
can be calculated from the above equation and the refrigerant constant.
M =R
C
where M = mm Hg manometer pressure drop
R = refrigerant weight (g)
C = refrigerant constant (g/mm Hg)
After refrigerant has been added to the tube, proceed to seal the tube. Adjust the oxygen
and MAPP gases to give a 3-4" flame. With the tube still evacuated and in liquid nitrogen, warm
the constriction uniformly until it is drawn inward by the vacuum. Heat the fused portion
strongly and lower the tube to produce a molten thread. Cut the thread with the flame. The tube
can be annealed while in liquid nitrogen using a cooler carbon-rich flame. The annealing process
60
deposits carbon on the glass that must be wiped off later. Remove the tube from the liquid
nitrogen.
SAFETY NOTE: Once the tube has been sealed and brought to room temperature,
it is under high internal pressure and could explode at any time. When possible, keep it
behind a safety shield and wear safety glasses, heavy gloves, and a face shield.
Prior to heating in the oven, the two parts of the tube are matched and re-weighed so that
the actual weight of refrigerant added can be determined. Thus, the actual weight ratio of
water:refrigerant in the sealed tube can be calculated.
Carefully insert the sealed tube into a protective metal sleeve and cap it. Put it into a
122ºF (50ºC) oven for 2-3 hours as a safety check. Taking appropriate safety precautions inspect
the tube for hydrate formation going up and down in temperature from 0°F (-18°C) to 80°F
(27°C).
The photographs in Appendix D were taken with a blue filter, 200 speed film, and a 1/30
second shutter speed and developed by subtracting 2 densities and 1 cyan to compensate for low
light.
61
Appendix DPhotographic Evidence of Clathrate Hydrate Formation
Picture 1 Picture 2
Picture 3
R-134a
1% water r1% water
1% water
R-143a
R-32
5% water
Picture 4
1% waterr
R-125
5% wate
r
5% wate 5% wate62
Picture 5 Picture 6
Picture 7 Picture 8
1% water 1% water
1% water 1% water
rr
r
R407C
R-152a
R507A
R410A
5% wate
5% wate5% wate
5% water63
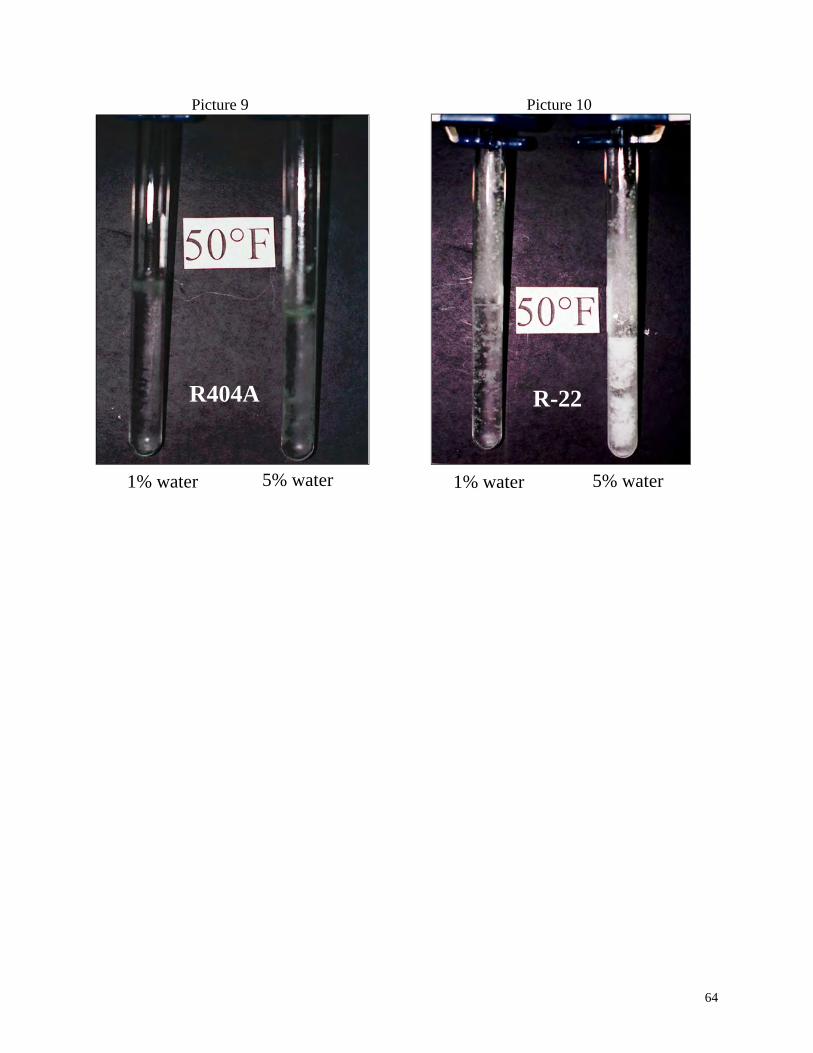
Picture 9 Picture 10
1% water1% water r
R-22
R-125
R407C
R404A
5% wate
5% water64