
Physical Sokoban: An augmented reality...
57
Physical Sokoban An augmented reality game Master’s thesis in Computer Science: Algorithms, Languages and Logic CHRISTOFFER ÖJELING Department of Computer Science and Engineering Chalmers University of Technology Gothenburg, Sweden 2016
Transcript of Physical Sokoban: An augmented reality...

Physical SokobanAn augmented reality gameMaster’s thesis in Computer Science: Algorithms, Languages and Logic
CHRISTOFFER ÖJELING
Department of Computer Science and Engineering
Chalmers University of Technology
Gothenburg, Sweden 2016
The Author grants to Chalmers University of Technology and University of Gothen-burg the non-exclusive right to publish the Work electronically and in a non-commercialpurpose make it accessible on the Internet.
The Author warrants that he/she is the author to the Work, and warrants that the Workdoes not contain text, pictures or other material that violates copyright law.
The Author shall, when transferring the rights of the Work to a third party (for examplea publisher or a company), acknowledge the third party about this agreement. If theAuthor has signed a copyright agreement with a third party regarding the Work, theAuthor warrants hereby that he/she has obtained any necessary permission from thisthird party to let Chalmers University of Technology and University of Gothenburg storethe Work electronically and make it accessible on the Internet.
Physical Sokoban: An augmented reality game
© CHRISTOFFER ÖJELING, September 2016.
This project was carried out at Know-Center GmbH, Graz, Austria, under supervisionof Viktoria Pammer-Schindler. Know-Center is a research company focusing on datascience.
At Chalmers Graham Kemp was the examiner and K V S Prasad the supervisor.
Chalmers University of TechnologyDepartment of Computer Science and EngineeringSE-412 96 GothenburgSwedenTelephone: +46 (0)31-772 1000
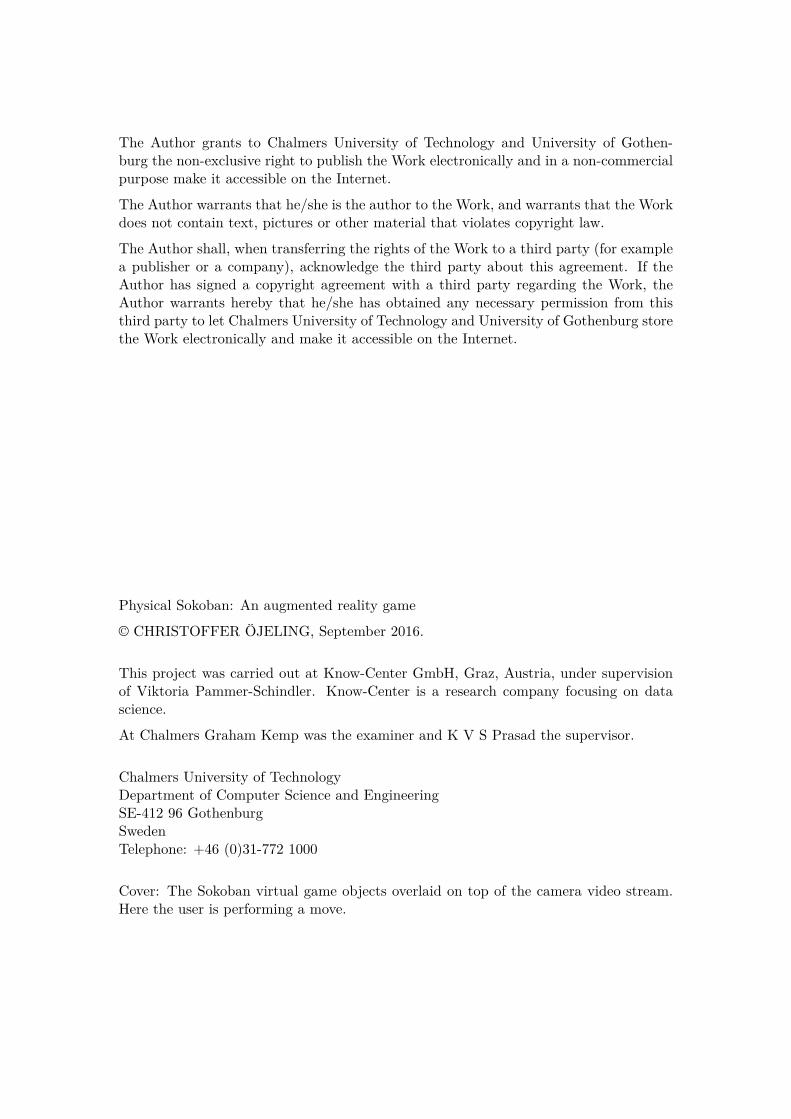
Cover: The Sokoban virtual game objects overlaid on top of the camera video stream.Here the user is performing a move.

Abstract
An augmented reality version of the classical puzzle game Sokobanwas developed. The user wears a virtual reality headset on their head.The game objects are virtually drawn on top of the video stream, andthe game controlled entirely by moving a physical object. This thesisaddresses the algorithmic and design requirements of such a game onlow cost and performance constrained devices like smartphones. Tothis end a new algorithm for accurately tracking the position of thephysical object in the video stream was developed.
While the game is designed to be enjoyable by healthy users, it ismade to in the future be used in rehabilitation — to aid patients withupper spinal cord injuries training grasping with their neuroprosthesis.To this end the game records various statistics about how the userplays — which in the future can be used to track and analyze patientprogress.
A user study carried out on healthy users indicates that the conceptshows promise. Out of 10 participants, 9 answered yes to “I would liketo play the game again”, rating their overall experience a mean of 7.2out of 10 (higher is better).

Acknowledgments
I first wish to extend my gratitude to Granit Luzhnica, whom Ihave worked closely with throughout the entire project, including co-authoring a paper. Eduardo Vaes for help with the marker detectionbenchmarks, paper writing and user studies. My supervisor ViktoriaPammer-Schindler for writing support with both the thesis and paper,the initial idea of the game and the first user study. Chalmers super-visor K V S Prasad who has given me great flexibility in my thesiswork. Furthermore I wish to thank all my colleagues at Know-Centerfor providing a very enjoyable environment to work in. In particularJörg Simon who has been responsible for ordering material and givenAndroid support.

Contents
1. Introduction 11.1. Aim and limitations . . . . . . . . . . . . . . . . . . . . . . . . . . . . . . 11.2. Thesis outline . . . . . . . . . . . . . . . . . . . . . . . . . . . . . . . . . . 2
2. Background 32.1. MoreGrasp . . . . . . . . . . . . . . . . . . . . . . . . . . . . . . . . . . . 32.2. Tangible games . . . . . . . . . . . . . . . . . . . . . . . . . . . . . . . . . 42.3. Sokoban . . . . . . . . . . . . . . . . . . . . . . . . . . . . . . . . . . . . . 5
3. The app 63.1. Gameplay . . . . . . . . . . . . . . . . . . . . . . . . . . . . . . . . . . . . 6
3.1.1. Controllers . . . . . . . . . . . . . . . . . . . . . . . . . . . . . . . 63.2. Interface . . . . . . . . . . . . . . . . . . . . . . . . . . . . . . . . . . . . . 7
3.2.1. Regular screen specifics . . . . . . . . . . . . . . . . . . . . . . . . 73.2.2. Cardboard specifics . . . . . . . . . . . . . . . . . . . . . . . . . . 73.2.3. Bluetooth keyboard . . . . . . . . . . . . . . . . . . . . . . . . . . 73.2.4. Exposure control . . . . . . . . . . . . . . . . . . . . . . . . . . . . 9
3.3. Data collection . . . . . . . . . . . . . . . . . . . . . . . . . . . . . . . . . 103.4. Camera calibration utility . . . . . . . . . . . . . . . . . . . . . . . . . . . 103.5. Implementation . . . . . . . . . . . . . . . . . . . . . . . . . . . . . . . . . 10
4. Marker detection and pose estimation 124.1. Related work . . . . . . . . . . . . . . . . . . . . . . . . . . . . . . . . . . 124.2. Theoretical Framework . . . . . . . . . . . . . . . . . . . . . . . . . . . . . 12
4.2.1. OpenCV . . . . . . . . . . . . . . . . . . . . . . . . . . . . . . . . . 134.2.2. Projective geometry . . . . . . . . . . . . . . . . . . . . . . . . . . 134.2.3. Camera Model . . . . . . . . . . . . . . . . . . . . . . . . . . . . . 144.2.4. Thresholding . . . . . . . . . . . . . . . . . . . . . . . . . . . . . . 164.2.5. RANSAC . . . . . . . . . . . . . . . . . . . . . . . . . . . . . . . . 174.2.6. Disjoint set . . . . . . . . . . . . . . . . . . . . . . . . . . . . . . . 174.2.7. NEON Instruction set . . . . . . . . . . . . . . . . . . . . . . . . . 18
4.3. Implementation . . . . . . . . . . . . . . . . . . . . . . . . . . . . . . . . . 184.3.1. Marker Detection . . . . . . . . . . . . . . . . . . . . . . . . . . . . 184.3.2. 3D pose estimation . . . . . . . . . . . . . . . . . . . . . . . . . . . 224.3.3. Bounding boxes for connected components . . . . . . . . . . . . . 234.3.4. Controller . . . . . . . . . . . . . . . . . . . . . . . . . . . . . . . . 26
i

4.4. Evaluation . . . . . . . . . . . . . . . . . . . . . . . . . . . . . . . . . . . . 274.4.1. Controller . . . . . . . . . . . . . . . . . . . . . . . . . . . . . . . . 274.4.2. Bounding boxes . . . . . . . . . . . . . . . . . . . . . . . . . . . . . 284.4.3. Neon Optimizations . . . . . . . . . . . . . . . . . . . . . . . . . . 29
4.5. Competing algorithms benchmark . . . . . . . . . . . . . . . . . . . . . . 294.5.1. Algorithms . . . . . . . . . . . . . . . . . . . . . . . . . . . . . . . 294.5.2. Performance test: marker detection & pose estimation . . . . . . . 304.5.3. Performance test: Marker detection . . . . . . . . . . . . . . . . . 314.5.4. Tracking performance . . . . . . . . . . . . . . . . . . . . . . . . . 31
4.6. Discussion . . . . . . . . . . . . . . . . . . . . . . . . . . . . . . . . . . . . 344.6.1. Future work . . . . . . . . . . . . . . . . . . . . . . . . . . . . . . . 34
5. User studies 365.1. Preliminary study: Think-aloud protocol . . . . . . . . . . . . . . . . . . . 36
5.1.1. Results . . . . . . . . . . . . . . . . . . . . . . . . . . . . . . . . . 365.1.2. Discussion . . . . . . . . . . . . . . . . . . . . . . . . . . . . . . . . 37
5.2. Final study: Game experience . . . . . . . . . . . . . . . . . . . . . . . . . 375.2.1. Purpose . . . . . . . . . . . . . . . . . . . . . . . . . . . . . . . . . 385.2.2. Sample . . . . . . . . . . . . . . . . . . . . . . . . . . . . . . . . . 385.2.3. Experiment process . . . . . . . . . . . . . . . . . . . . . . . . . . 385.2.4. Results . . . . . . . . . . . . . . . . . . . . . . . . . . . . . . . . . 395.2.5. Discussion . . . . . . . . . . . . . . . . . . . . . . . . . . . . . . . . 42
6. Conclusion 45
Bibliography 46
A. Log file 50
ii

1. Introduction
The European Union funded project MoreGrasp is currently researching a brain-computerinterface (BCI) to allow patients with upper spinal cord injuries to regain some abilityto grasp with their hands. It uses a cap which analyses brain patterns and classifiesthem into commands, such as “perform grasp”. A neuroprosthesis then stimulates therelevant muscles with electrical impulses.Since each brain is unique, the neuroprosthesis must be trained to recognize each pa-tient’s individual brain pattern. This is done by grasping objects over and over. Thisprocess is very long and tedious, making it hard to motivate the patient to perform therequired training. It is especially true as many patients have not only motor but alsocognitive impairments [1].In this thesis an augmented reality game which incorporates a lot of grasping is devel-oped. Augmented reality is a mixture of the real and digital world, where virtual objectsare overlaid on top the real world when viewed through a screen. The game developedis a version of the classical game Sokoban, a puzzle game where you push boxes on a2-dimensional grid. The game is played by grasping a physical object and placing it atdifferent locations. By using augmented reality, many different levels can be played usingthe same physical objects, providing variation and hopefully motivating the user to trainthe neuroprosthesis. At the same time data can be collected about the rehabilitationprogress which might provide useful insights in the future.
1.1. Aim and limitations
The aim of the thesis is to develop a game that can later be used in rehabilitation.However, the neuroprosthesis is in the research phase, and not functional today. Thegame will thus be tested on users without any physical disability — with the aim thatit should be enjoyable in its own regard, and not just for patients practicing grasping.A major constraint of the game is that it should be readily available without requiringexpensive hardware. It is thus developed to run on an Android mobile phone. Thisplaces significant performance constraints on the game. The second major issue is tomake the game accurate enough to be enjoyable — indeed, if game does not performthe actions the users wanted it will not be enjoyable or very useful for rehabilitation.These two constraints work against each other — the more accurate the game the morecomputing power it requires. A large part of the thesis, and the work performed, isabout the algorithms developed to satisfy both constraints sufficiently.
1

A secondary aim is to provide useful data about how the future patients interacts withthe game. It is thus developed to measure how the user moves the object, how fast itperforms certain tasks etc. While the thesis does not analyze this data, the plan is thatit can be extended and analyzed in the future.
1.2. Thesis outline
The thesis is divided in two independent parts:
1. The game design from a training and enjoyment perspective
2. Software development and algorithm design used to realize the game
In the chapter that follows (chap. 2) we explore the research question regarding aug-mented reality physical games, why Sokoban was chosen and its related work. Subse-quently in The App chapter (3), the game is explained from an end-user perspectivewithout technical details. The algorithmic part is separated into its own self-containedchapter (4) which outlines the algorithms invented, compares them to existing algo-rithms, and presents performance evaluations. The User Studies chapter (5) evaluatesthe user experience of the game.
2

2. Background
2.1. MoreGrasp
Know Center is part of the European Union funded project MoreGrasp.
The aim of the MoreGrasp project is to develop a non-invasive, multi-adaptive,multimodal user interface including a brain-computer interface (BCI) for in-tuitive control of a semi-autonomous motor and sensory grasp neuroprosthe-sis supporting individuals with high spinal cord injury in everyday activities.
— MoreGrasp.eu
MoreGrasp aims to equip spinal cord injured patients with a neuroprosthesis to enablethem to cooperate with their hands. The neuroprosthesis will contain a brain-computerinterface which is used to analyze the patient’s brain signals and recognize activity in-tentions like grasping. Low energy electrical impulses are then applied to the relevantmuscles, which perform the intended movement. The technique, called functional elec-trical stimulation (FES), effectively augments a damaged nervous system.
The brain-computer interface technology translates brain activity to machine-intelligiblepatterns. However the assignment of brain activity patterns are user-specific. Eachindividual must thus perform a lot of training, which often involves repeating the samemovement over and over. This process is very repetitive and tedious for the patient,especially as many patients have not only motor but also cognitive impairments [1].Such a group is often hard to motivate to perform the required training as the tasksmay seem pointless. “Gamifying” the training process has the potential to alleviatethese problems and motivate the patient, while collecting the necessary data if designedappropriately [1, 2].
Learning how to successfully grasp again is divided into two phases. At first, BCItraining and FES training is performed separately until the patient achieve satisfactoryresults with the neuroprosthesis. This process uses guided and supervised training. Afterthis the training consists of both parts combined. This game developed in this thesistargets the second phase. There are papers exploring BCI training games, like [1] and[3]. However these are digital games using BCI input directly. This project focuses on aphysical game which is not directly connected to the BCI cap, but trains it indirectly.
3

2.2. Tangible games1
In the past decades, interactions in virtual environments e.g. computer screens, tablet,phones, virtual reality (VR), augmented reality (AR), have become common and replaceda lot of interactions with real physical objects especially in digital games where VR andAR are getting more popular everyday. Digital games have the possibility to stimulatethe imagination of the user by presenting a virtual world of objects and characters. Inaddition, animations of characters and objects can be provided in order to enrich theexperience which would be almost impossible to stimulate in a tangible game. Moreover,digital games can provide levels and context switching very cheap and effortless way forthe user as opposed to the tangible games where changing levels, scene and objects firstrequires physical objects and then it requires user’s effort for setting up everything andso it they are less flexible in almost every aspects.
On the other hand physical interactions and touch play a essential role in enjoymentof life [5, 6]. Moreover, physical touch provides a feedback mechanism for regulatinginteraction. Therefore, tangible games provide a unique experience as the touching,grasping and physical interaction becomes part of the game. In addition, as interactionrequires physical activity, several researchers have have taken advantage of tangiblegames to perform some targeted physical activity beneficial for occupational therapyand rehabilitation [7, 8, 9].
Tangible user interfaces use direct manipulation of physical objects to interact withdigital environments. They aim to empower collaboration, learning and design by takingadvantage human ability for physical interaction [10].
Although, tangible interfaces are applied in different domains, in this section we will focuson tangible games. In [6], Cheock et al. presented a VR tangible game with the goalof preserving the physical and social interaction aspects of physical games. Althoughthe game was presented through a head mounted display, users still were required towalk around a large room and interact with physical objects. In a study of 40 students,the authors found the tangible game to be more enticing to users, and to promote morehuman-to-human interactions when compared to the same digital only game. Otherstudies have researched games with tangible interfaces with similar findings, namelythat games with tangible interfaces provide more engagement [11], social interaction [12]or that they accelerate learning [13] when compared to the same digital versions ofgames.
In occupational therapy, games with tangible interfaces are for instance after strokesto support rehabilitation of motor upper extremity movements [14, 8, 9], wrist flexionand extension[7] or postural control [8]. In most of these papers, authors use Wiimotebased Controllers [7, 8, 9] to capture physical movements or a CyberGrasp device [14]to provide resistive force feedback.
1This section is based on a paper co-authored by me[4].
4

Figure 2.1.: An implementation of Sokoban. The boxes are pushed one step at a time,horizontally or vertically, to any free adjacent square. The game is completedwhen all boxes are at a goal position square — here indicated by a red discin the center of the square.
2.3. Sokoban
Sokoban is a 2D puzzle game, in which the player pushes boxes on a board of squares.The goal is to push each box to any of the predefined goal positions on the game board,see fig. 2.1. The challenge lies in that the player can only push the boxes — not pullthem. They must thus be careful not to create deadlock situations where the boxes canno longer be pushed to a goal position. The levels can be designed to be of varyingdifficulty, some trivial while others provide quite a challenge. When a level has beencompleted the players can further challenge themselves by trying to complete it in theminimal amount of moves. Solving a level, and solving it in the minimal amount ofmoves has been shown to not only be in NP-hard, but in PSPACE [15].
The version of the game designed has the same gameplay mechanics as the originalversion. The difference lies in how the game is controlled and displayed to the player.In the original version the player controls the game with the 4 arrow keys, deciding inwhich direction to move the player. The level is normally displayed from a birds eyeperspective, such as fig. 2.1, allowing the player to see the full level at all times. Theversion developed is instead controlled by moving a physical object around in relationto a pattern on a flat surface. The level is virtually added on top of the pattern whenlooking at it through a screen, such as a smartphone or virtual reality glasses. It isrendered in 3D with the same perspective as the world, making it appear as if the levelis naturally a part of the real world for the player.
5

3. The app
In this chapter the gameplay mechanics and features of the game are explained, as wellas a brief overview of its implementation.
The Sokoban app consists of three programs, one to calibrate the camera, and two ver-sions of the game. The difference between the two game versions is solely how the gameis displayed to the user. The “regular screen”-version displays the game on the smart-phone’s screen directly, while the other version uses Google Cardboard1, a makeshiftdevice to turn a regular mobile phone to a virtual reality device. To play the Cardboardversion, the user puts their phone into a cardboard viewer, which is then placed on theirhead (see fig 3.1).
3.1. Gameplay
The game is controlled entirely by moving around a physical object, hereafter controller,see fig. 4.9. The controller is moved around in relation to the game board, which is aspecific pattern printed to a paper, put on a flat surface such as a table in front of theplayer. The game works like a state machine with state changes triggered by changes inthe position of the controller in relation to the game board. See fig 3.2 for an explanationof the game mechanics. For a video, see http://ojeling.net/thesis/sokoban.mp4.
If the player moves the object without first lifting it up, the game will go into the samestate as in the beginning of the level. This method of playing is motivated by encouragingthe player to practice grasping by letting go and grasping the object to perform eachmove.
3.1.1. Controllers
Three different controllers are available to use for the user. The controllers are customdesigned and 3D-printed. The basic design of the controller is motivated in section 4.3.4.Three variations of the controller are available to promote different grasps, see fig. 3.3.
1A Google Cardboard application is developed using the Cardboard SDK which takes care of theinternals so the game can be displayed is a combination of a Cardboard viewer and an SDK takingcare of cardboard specifics such as distorting the image for the lenses of the viewer. https://vr.google.com/cardboard
6
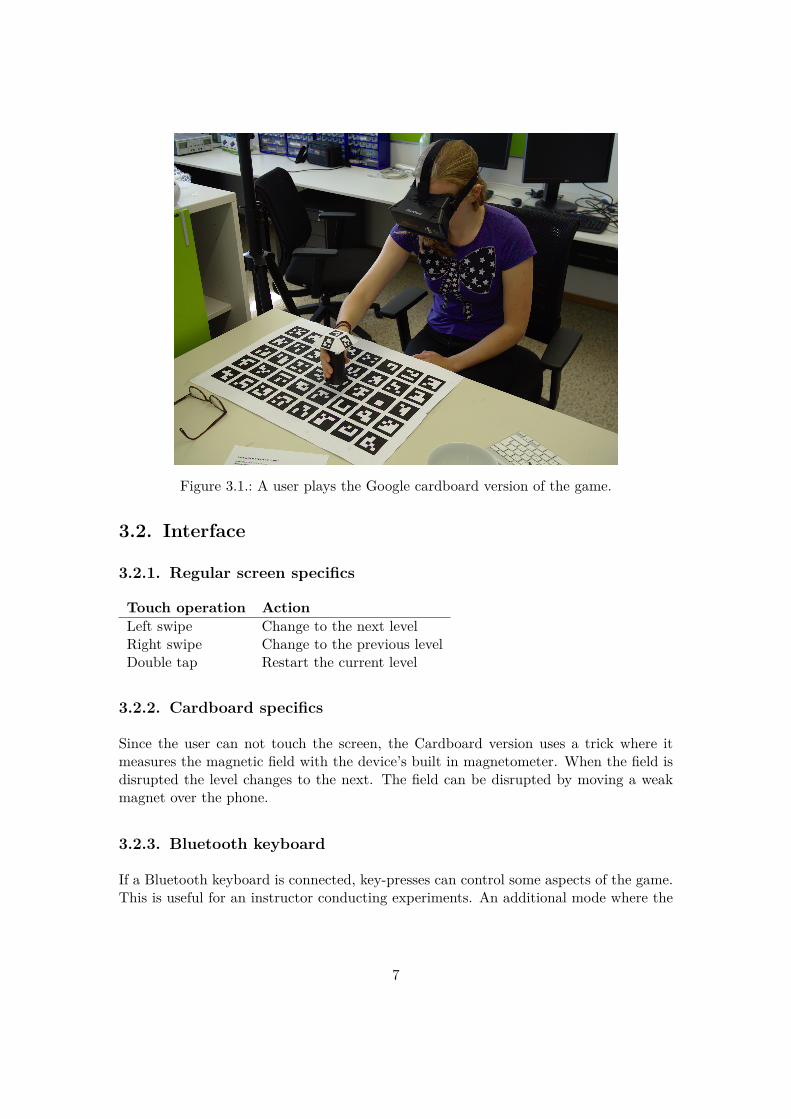
Figure 3.1.: A user plays the Google cardboard version of the game.
3.2. Interface
3.2.1. Regular screen specifics
Touch operation ActionLeft swipe Change to the next levelRight swipe Change to the previous levelDouble tap Restart the current level
3.2.2. Cardboard specifics
Since the user can not touch the screen, the Cardboard version uses a trick where itmeasures the magnetic field with the device’s built in magnetometer. When the field isdisrupted the level changes to the next. The field can be disrupted by moving a weakmagnet over the phone.
3.2.3. Bluetooth keyboard
If a Bluetooth keyboard is connected, key-presses can control some aspects of the game.This is useful for an instructor conducting experiments. An additional mode where the
7

(a) The initial state of the game. The player mustplace the controller on the square designated asthe starting position. This is indicated by theaugmented red outline of the controller.
(b) The controller is positioned at the starting po-sition. A move is initiated by lifting the con-troller orthogonally in relation to the gameboard.
(c) A move has been initiated. The squares theplayer can move the controller to is indicated bygreen circles. The boxes the player can push isindicated by green arrows. If the player placesthe controller on a box, it will be pushed onesquare further in the same direction.
(d) The move has been performed by putting thecontroller down on the box. Since the box waspushed to a goal position it is now has a star ison top of it.
(e) After multiple moves all boxes are at goal po-sitions. The starts starts spinning to indicatethis to the player.
Figure 3.2.: The Sokoban augmented reality game. Note that the renderings occlude thephysical controller and the player’s hand. Thus a virtual marker is renderedon top of the real marker.
8

Figure 3.3.: Three 3D-printed controllers for practicing different grasps. The keys areused for pinch grasps.
player is required to press space between each box move is included. This forces the userto let go of the controller between each move, thus ensuring grasp practice.
Key press Action1-9 Change the levelQ,W,E Change configurationShift Restart the current levelSpace Signal the game as explained above (if enabled)
The following game configurations are available:
Key press ActionQ Controller 1 used (default)W Controller 2 used, Space press requiredE Controller 3 used, Space press required
3.2.4. Exposure control
The exposure and ISO sensitivity of the camera must be set manually. This is done bytapping once on the regular screen version of the game, and adjusting the sliders until
9

it looks good. Afterwards the user can start the cardboard version, which will use thesame settings. If the lighting conditions are good the exposure time is recommended tobe between 1–5ms, to allow the user to move their head quickly without motion blurinterfering with marker detection.
3.3. Data collection
For each level played a log file is created on the Android device’s externally accessiblestorage. It consists of the 6 degrees of freedom of both the controller and game boardover time. It also stores events for all actions performed. See appendix A for furtherdetails.
3.4. Camera calibration utility
Before the game can be played the camera has to be calibrated once for each phone.In this mode the user takes several pictures from different angles of a printed referencechessboard pattern, see fig. 3.4. It works as follows:
1. Point the camera at the printed chessboard and tap the screen.2. After processing the frame, the corners of the chessboard pattern light up in blue
if a probable pattern is found, or the application returns to step 1.3. The user can either accept the pattern by tapping the screen once, or reject it by
swiping left. The user should accept the pattern if the corners of the chessboardare all lit up in blue.
4. Repeat step 1–3 for different angles. At least 10 times are recommended.5. Double tap the screen to compute and store calibration. Wait about 20 seconds
to ensure it is stored.
3.5. Implementation
The game is mostly implemented in C++ using the Android NDK2. Java code is used tointerface with the Android subsystems, such as fetching the camera frames and creatingthe OpenGL context. OpenGL ES 2.0 is used for 3D graphics, the camera2 android APIis used to control the camera exposure and sensitivity manually — it is indeed importantfor accurate marker detection that the motion blur is minimal, thus a low exposure timeis required. The application is multi-threaded and the algorithms parallel. See fig. 3.5 foran overview of the program. The marker detection part itself is described in chapter 4.The game does not use any additional frameworks, with the 3D engine being custommade.
2https://developer.android.com/ndk
10

Figure 3.4.: The calibration mode as it appears from within the application. The usercaptures many photos of the chessboard printout from different angles. Thecorners of the chessboard lit up in blue.
Camera frame reciever
Worker
Marker Detection
3D reconstruction
Worker
Marker Detection
3D reconstruction
Update game logicRender OpenGLAndroid input listener
Android Java
NDK C++
Thread
Figure 3.5.: The Sokoban program. It consists of several threads, with the marker de-tection subtask itself parallel.
11

4. Marker detection and pose estimation
In this chapter the algorithms for marker detection and pose estimation are explainedand evaluated. The layout of the game board and the controller are also explained.
4.1. Related work
In computer vision there are two conceptually different approaches to find the perspectiveand pose of preknown patterns in a scene. Natural feature tracking (NFT) or usingspecifically designed markers. With NFT any image can be tracked. It works by findinghigh frequency features in an image, such as corners, and computing certain statisticsabout them. The features of a reference image are matched to the features of anotherimage. If more than a threshold of them match and have consistent perspective, theperspective and pose of the reference image can be found in the scene. The otherapproach is to design special markers which are analyzed semantically. Typically thesemarkers are black and white to provide maximum contrast. Many of these markers canbe printed in a predefined grid, providing redundancy in case some are occluded.
The advantages with the latter approach is lower processing power required, betterresistance to different lighting conditions, motion blur and different distances of thecamera. The advantage of NFT is that any image can be used. The current de factostandard for NFT is Vuforia, a proprietary framework developed by Qualcomm. Formarker tracking two common open-source libraries are ARToolKit and Aruco. WhileNFT is considered to be theoretically slower, Vuforia has a large commercial backing, isheavily optimized and can process camera frames in real time on modern phones.
In this chapter a new algorithm for marker detection is developed, specialized to workwell for the use case of the Sokoban game.
4.2. Theoretical Framework
In this chapter existing technologies and frameworks, and how they relate to the thesis,are explained.
12

4.2.1. OpenCV
OpenCV1 is an open source library originally developed by Intel. Currently maintainedby the non profit foundation OpenCV.org, it is designed for computational efficientlyand aims mainly at real-time computer vision applications. The library provides thebasic building blocks for the marker detection algorithm.
4.2.2. Projective geometry
A projective transform maps a set of coordinates from one space to another, with theimportant property that lines maps to lines. Augmented reality is based heavily on themathematical properties of those transforms, from reconstructing the 3D scene from a2D image, and then render virtual 3D objects on top of the 2D image.
Homography transform
A homography transform establishes a mapping between two projective planes P2 → P2
[16]. A 2D point (x,y) in an image can be represented as (x1, x2, x3) where x = x1x3
andy = x2
x3. This is called a homogeneous coordinate. Given a 3× 3 matrix H, we can map
a set homogeneous coordinates from one plane to another:
s
u
v
1
=
u · sv · ss
= H
x
y
1
H can be computed unambiguously from 4 point-to-point correspondences between thetwo projective planes. It is important to note that the homography transform onlytransforms from one plane to another — it does not give out any information about the3-dimensional properties of the scene, such as the axis orthogonal to the plane.
A homography transform is computed once per marker in the image to transform theprojected marker to a top-view perspective. It is then possible to efficiently computehow much of each cell in the marker is colored, as the borders are axis parallel (seefig. 4.1).
Perspective projection
When the eye or a camera sensor views a scene, objects further away appear smaller —this is know as perspective. A perspective projection is a mapping from P3 → P2. Givena projection matrix K, and a coordinate in the world [x,y, z]T , its R2 projection [u, v]Tis defined as
1http://opencv.org
13
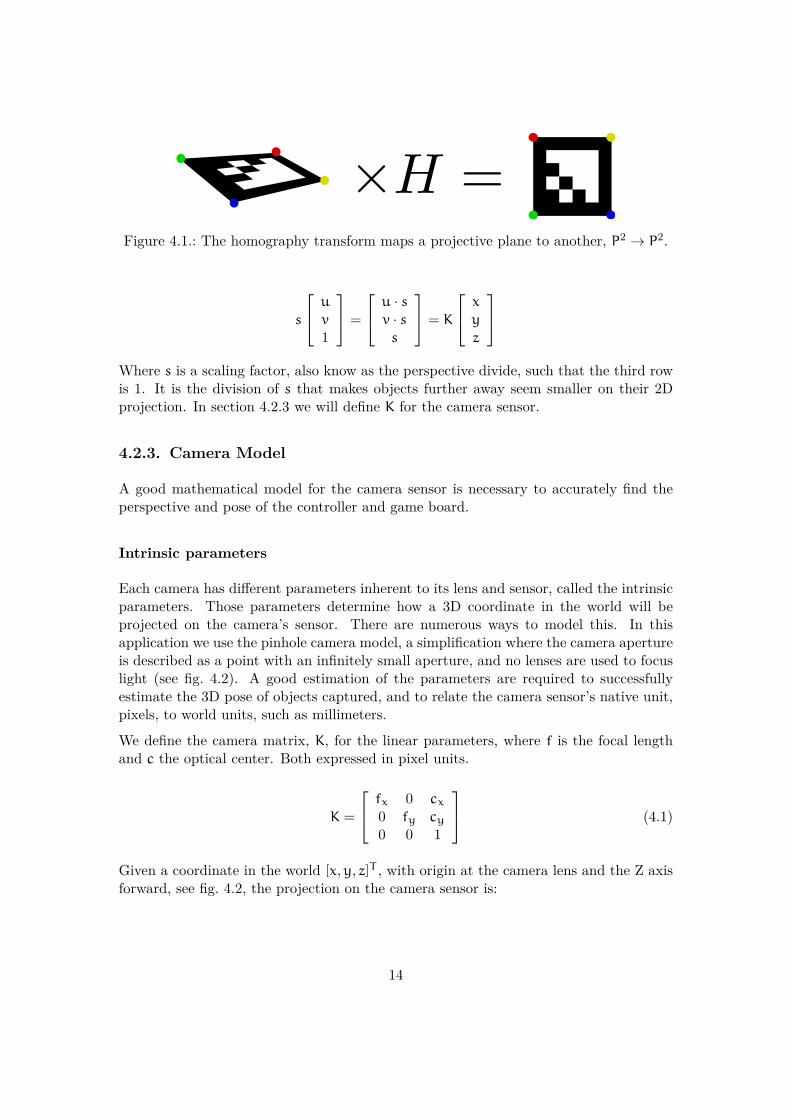
Figure 4.1.: The homography transform maps a projective plane to another, P2 → P2.
s
u
v
1
=
u · sv · ss
= K
x
y
z
Where s is a scaling factor, also know as the perspective divide, such that the third rowis 1. It is the division of s that makes objects further away seem smaller on their 2Dprojection. In section 4.2.3 we will define K for the camera sensor.
4.2.3. Camera Model
A good mathematical model for the camera sensor is necessary to accurately find theperspective and pose of the controller and game board.
Intrinsic parameters
Each camera has different parameters inherent to its lens and sensor, called the intrinsicparameters. Those parameters determine how a 3D coordinate in the world will beprojected on the camera’s sensor. There are numerous ways to model this. In thisapplication we use the pinhole camera model, a simplification where the camera apertureis described as a point with an infinitely small aperture, and no lenses are used to focuslight (see fig. 4.2). A good estimation of the parameters are required to successfullyestimate the 3D pose of objects captured, and to relate the camera sensor’s native unit,pixels, to world units, such as millimeters.
We define the camera matrix, K, for the linear parameters, where f is the focal lengthand c the optical center. Both expressed in pixel units.
K =
fx 0 cx0 fy cy0 0 1
(4.1)
Given a coordinate in the world [x,y, z]T , with origin at the camera lens and the Z axisforward, see fig. 4.2, the projection on the camera sensor is:
14

OV
Image sensor
X
YZ
fU
cu,v
x,y,z
Pinhole
Figure 4.2.: The pinhole camera model. Modified graphics. Original license public do-main.
s
u
v
1
= K
x
y
z
Where u, v is the coordinate in pixel units on the sensor, s is a scaling factor, also knowas the perspective divide, such that the third row is 1. It is the division of s that makesobjects further away seem smaller on their 2D projection[17].
Lens distortion
The pinhole camera model does not take into account the distortions from imperfectionsof the camera lens. This problem is especially significant on cheap camera lenses suchas those found on mobile phones. Another model is used to compensate for severaldistortion parameters, such as barrel and sheer distortion (see fig. 4.3).
Extrinsic parameters
The extrinsic parameters define a transformation P3 → P3. It consists of a rotationand a translation, which transforms from the object coordinate system to the cameracoordinate system. Intuitively it describes the 6 degrees of freedom of an object in the
15

Figure 4.3.: Cheap lenses such as the ones found in mobile phones often have significantbarrel distortion. An image can be undistorted if the distortion coefficientsfor the lens are known. On the left an exaggerated distorted image and onthe right its undistorted version.
scene. While the intrinsic parameters are calibrated once per sensor, the extrinsic arecomputed for each camera frame.
4.2.4. Thresholding
Thresholding classifies lightness intensities of a gray-scale image to to a binary image(black and white).
Global thresholding A global threshold is fast and simple, each pixel in the binarizedimage bi,j is set according to the following rule, where gi,j is the pixel value for a greyscaleimage:
bi,j =
{1 if gi,j > value0 otherwise
Otsu thresholding
Determining a good threshold value can be hard since the lightness of the image changesdepending on dynamic factors such as the amount of light in the room. If it is possibleto make the assumption that the image contains two distinct brightness levels — anoptimal threshold value can be computed so that the intra-class variance is minimized.This is called an Otsu threshold. The single threshold value is first computed andthen used as the threshold for the entire image. For thresholding a part of the imagecontaining a single marker, an Otsu threshold provides good results in practice withminimal computing power.
16

Adaptive thresholding
A camera image has some properties that makes it difficult to use a single threshold valuefor the entire image. Highlights and shadows make the absolute brightness throughoutthe image very uneven. An adaptive threshold uses a different threshold value for eachpixel. The threshold value for a pixel is computed by taking the mean of the pixels ofa square window of some size centered on that pixel. It is thus very good at detectingedges in the image. However, if the window size is too small it may result in a lot ofnoise, while if it is too big might miss detail and suffer from the same problem as aglobal threshold. Adaptive thresholding is significantly slower than global thresholding,as the image is convoluted to find the mean value for each window.
bi,j =
{1 if gi,j > meani,j0 otherwise
4.2.5. RANSAC
Random sample consensus — RANSAC— is an iterative method to estimate parametersfrom data that may contain a relatively large amount of outliers [18]. For the purposeof this application it works as follows:
1. A subset of the data is randomly selected and used to compute a 3D→2D trans-formation.
2. The transformation is used to re-project the entire data-set 3D→2D.3. For each point the Euclidean distance between its original coordinate and its re-
projection is computed. If it is lower than some threshold it is counted as aninlier
4. The above steps are repeated many times for different subsets of the data.5. The points from transformation which yielded the largest amount of inliers are
designated as good inlier points.6. All good inliers points are used to compute the final transformation.
RANSAC produces non-deterministic results, however with a sufficiently large amountof iterations the result works very well in practice.
4.2.6. Disjoint set
A disjoint set is a data structure that has a number of non-overlapping sets that partitionthe elements. Finding which set an element belongs to is O(1). Merging two sets isapproximately2 O(1) [19].
2Merging two sets is amortized O(α(n)) where α(·) is the inverse Ackermann function. It grows soslowly it is approximately O(1)
17

Figure 4.4.: RANSAC being used to fit a line to a set of points with a large amount ofoutliers. Only the points designated as inliers (blue) are used to computethe best fit. Modified graphics. Original author wikipedia.org user “Msm”.License: CC BY-SA 3.0.
4.2.7. NEON Instruction set
NEON3 is the ARM processor extension for SIMD — Simple Instruction Multiple Data.It performs simple arithmetic operations on multiple data in parallel. ContemporaryARM processors in smartphones have 128bit NEON instructions, allowing for example16x8bit data to be operated at once. A few performance critical functions have beenvectorized to take advantage of this. See section 4.4.3 for performance evaluations.
4.3. Implementation
For the controller and the game board, we wish to find their position in relation to thecamera sensor for each frame — in other words to find the extrinsic parameters (seesection 4.2.3). This is conceptually a two stage process:
1. The corners of the markers in the frame and their id:s are extracted.
2. A point to point correspondence between the observed corners and their supposedposition in relation to each other are used to compute the perspective and pose ofthe object.
4.3.1. Marker Detection
The marker detection algorithm finds and identifies corners of specific markers in animage. The markers consists of a black border with a 4x4 grid of cells inside. Squarecells are used as they can be identified efficiently with high accuracy, even in unfavorableangles and poor lightning conditions. An overview of the algorithm can be see in fig. 4.5.
3http://www.arm.com/products/processors/technologies/neon.php
18

Adaptive threshold
Find bounding boxes
Otsu threshold Variance too low
Compute contours
Find homography of biggest conotur
Select image pyramid based on bounding box area
In paralllel
Inverse transformeach contour
Compute area of intersection between each cell and the contours
Binarize each cell and find the ID of the marker by a loopup table
Inva
lidat
e M
arke
rBadcontour
Bad b
orders
No ID
foun
d
List of marker ID:s and corners
Figure 4.5.: The parallel marker detection algorithm

Blur andsubsample
Blur andsubsample
Blur andsubsample
Blur andsubsample
Original
1/2 resolution
1/4 resolution
1/8 resolution
1/16 resolution
Figure 4.6.: Image pyramids are used to speed up computation for the marker detection.Modified graphics. Original author wikipedia.org user “Cmglee”. License:CC BY-SA 3.0.
Initialization
The algorithm starts by computing image pyramids. Image pyramids down-sample theimage by halving both the width and height (see fig. 4.6). A specialized version usingthe NEON instruction set is used where the mean value of 4 pixels is used for each newpixel. Some image pyramid methods, including the one in OpenCV, uses a Gaussianwindow instead. This yields higher quality at the cost of more computing power. Testingshowed that the quality degradation is not a major concern for the algorithm.
Adaptive threshold
An adaptive threshold (see section 4.2.4) is performed on an appropriate image pyramid.The result is a binary image with the markers disjoint. The corners of the markers mightbe slightly offset from their real position. However this is not important as seen later.
20

Find bounding boxes for the connected components
A connected component analysis is performed on the binarized image, returning thebounding boxes of each connected component. Bounding boxes that are too small orhave odd shapes are discarded. Typically hundreds of valid bounding boxes are foundin a camera frame. Each bounding box contains a potential marker. The bounding boxalgorithm is described in detail in section 4.3.3.
Parallel marker identification
Each bounding box is checked for a valid marker. After this stage the corners of allvalid markers, and their ID:s are returned. The bounding boxes are checked in parallel,making the algorithm scale well on multi-core systems.
Pyramid selection and Otsu thresholding At first a suitable image pyramid isselected based on the height and width of the bounding box. An Otsu threshold iscomputed on the selected image-pyramid inside the bounding box. The use of imagepyramids are important as the next step, contour finding, is computationally expensive.If the variance between the two classes of lightness in the image is too low — meaningthe result is just noise — the marker is discarded.
Contour finding A contour finding algorithm is run on the binarized image. Thelargest contour is selected. If that contour is too small, does not have 4 corners or is notconvex the marker is discarded. A hierarchy of the contours are established, returninga tree of which contours are inside each other.
Homography transform Given the largest contour found in the previous step, thehomography transform is computed, see section 4.2.2. Each contour inside the largest istransformed to a top-eye perspective. This is done so each cell in the marker will be ina 1x1 wide space of arbitrary units. It is easy to compute the intersection of a cell withstraight edges and an arbitrary contour.
Contour intersection and area computation The marker consists of 6x6 cells, ofwhich the outer border is 1 cell wide, and the actual ID of the marker is encoded with4x4 cells. At first the area of intersection for all contours is computed for each cell.For the edge cells it is required that they are filled above a certain threshold, or themarker will be discarded. For the inner cells a majority vote is used. The area usedfor computation is offset by a small amount on each side of each cell, giving margin forimage artifacts and motion blur.
21

Camera Frame Reference position
Figure 4.7.: The marker coordinates and their respective ID:s have been identified in thecamera frame. The corner for each marker is associated with its referenceposition, which is used to find the perspective and pose of markers in thecamera frame.
Determination of Marker ID Since each marker consists of 4x4 cells, it can repre-sents 16 bits of information. A precomputed lookup table is used associate each patternto one of 256 ID:s. To recover the rotation of the marker, each ID is represented 4 times,giving 1024 valid bit-patterns. The markers are selected in such way that the Hammingdistance from each other is at least 2 bits. Thus one bit error is allowed per marker,meaning that 16K bit-patterns out of the 64K possible, 15%, will return a valid ID. Themarkers are identical to those of the Aruco library. The generation and motivation ofthe markers are described in [20, 21].
Precision and recall
The parameters of the algorithm are tuned to have a high recall rate, with a lowerprecision as a consequence. There are often some parts of the image being incorrectlyrecognized as markers. This is however not a great concern for the purpose of the game,as the pose estimation step uses robust inlier detection.
4.3.2. 3D pose estimation
Finding the transformation from a set of 2D-projected points to their original 3D coor-dinates is a well understood problem. First a mapping between the marker corners inthe image their known relative reference position in the 3D space is established usingthe marker IDs (see fig. 4.7). Next the rotation and the translation of the object isreconstructed using RANSAC as explained in section 4.2.5. The extrinsic parametershave been recovered.
22

4.3.3. Bounding boxes for connected components
Connected component analysis is used to detect regions of connected “filled pixels” ina binary image. 8-connectivity is used, meaning two pixels are connected if their edgesor corners touch. A minimal bounding box is the smallest axis parallel rectangular boxcontaining all pixels of a component. For the marker detection algorithm the boundingboxes are used to find areas of interest which are to be checked for markers.
The conventional algorithm to find bounding boxes first labels each pixel in the image,then goes through the labels pixel by pixel to update the left-, right-, top-, and bottom-most coordinate for each label [22]. In addition to requiring two passes, it also requiresO(nm) extra memory to store the labels of each pixel, where n,m is the height andwidth of the image.
A custom algorithm was developed exploiting that only the bounding boxes and notthe labels themselves are needed. This eliminates the need for the extra memory andmanages to compute the bounding boxes in one pass instead of two. In practice it isabout 3-5 times faster for a typical camera frame. See section 4.4.2 for performancemeasurements.
The algorithm scans the pixels in memory (row-major) order. It uses 2 data structuresto keep track of the bounding boxes:
1. The labels of the pixels in the row above the current.
2. A disjoint-set (see section 4.2.6) like data structure to efficiently keep track of andmerge bounding boxes.
The algorithm works as a state machine, it scans each row left to right until a filled pixelis occurs. Once it occurs it needs to be assigned a label. For the 23 combinations ofpixels in the row above, there are 3 cases for deciding which label it will be assigned:
Legend:Empty pixelFilled pixelIt does not matter if the pixel is filled or not
23

Non filled state
j+=1
bb.left = min(bb.left, j)bb.top = min(bb.top, i)bb.bottom = i
Filled state
j+=1
bb.right = max(bb.right, j)
i += 1; j=0
j>=width
j>=width
j+=1
j+=1
j+=1
j+=1
Donei>=height
i<height
Figure 4.8.: The state machine for the bounding box algorithm. i and j are the currentrow and column. bb is a reference to the bounding box associated with thecurrent pixel.
24

No pixels above are filled. A new label is generated and the pixel assigned it.
One, two or three continuous pixels above are filled. The pixel will be assigned the labelof the above pixels.
Two non-adjacent pixels above are filled. There might potentially be a conflict since thenew pixel may connect the labels for the two pixels above for the first time. If that isthe case the labels above and their bounding boxes need to be merged. The label forthe pixel will be the smallest of the two above.
State filled
When the state machine is in the “filled” state the current pixel will always be assignedthe label of the pixel west of it. Two out of the 23 cases may cause a label conflict andthus require a label and bounding box merging:
The value of the north-west pixel is not important, it was handled previously. Likewisethe north pixel was handled while processing the west pixel if it was filled. If both thenorth and the north-east pixel are filled, they will be the same label and will have beenhandled by the west pixel. However if the north pixel is not filled and the north-eastis filled, this may be the first time the labels of those pixels are connected. A merge isthus required.
Complexity analysis
Giving a binary image with n rows and m columns. Each pixel will be visited once,resulting in O(nm). For each pixel there might be a merge of labels, which is approx-
25

imately O(1) (see section 4.2.6). The final run-time is thus O(nm). This is the sametime complexity as the preexisting algorithm in OpenCV. However the advantage of thenew algorithm is that the bounding boxes are computed in one pass instead of two.The space requirement is lower since the labels for each pixel are not stored. Howeveras there might be O(nm) bounding boxes it has the same upper bound too. In practicethe number of bounding boxes is a lot lower than O(nm) though. With k boundingboxes, the space complexity improves to O(m + k), where m is the storage required tosave the previous row of pixels.
4.3.4. Controller
The design of the controller went through 3 prototypes. Initially a single flat markerwas placed on top of a cuboid made out of cardboard. This suffered from two problems:
Noise
The recovered perspective and pose of the object relative to the game board was verynoisy from certain angles, meaning that sometimes incorrect moves would be performed.It turned out that the axis orthogonal to the camera sensor, see the Z axis in fig. 4.2,was the worst. The noise is a natural consequence of the resolution of the image. Thisis especially true for narrow angles, which could be very unstable.
Theoretical limitations
The 3D pose of an object cannot be recovered unambiguously from only co-linear points— there are in fact 4 valid solutions [23]. By empirical testing it turned out that thepose would oscillate between two of these valid solutions, posing a serious challenge tothe playability of the game.
Solution
A hypothesis to solve the first two problem by making the marker 3-dimensional wastested by adding an additional marker to the side of the cuboid controller. This con-strained the axis perpendicular to the flat marker and solve the theoretical issue of theambiguous pose. The test proved successful. However as the controller is typically viewedfrom above while playing the additional marker would rarely be visible in practice.A custom 3D-printed controller was created, see fig. 4.9. The pattern on top of thecontroller is shaped as a frustum with 5 sides, each with a marker. From every positiontypically viewed in a gaming session there will be at least 3 markers visible. Thiseliminates both the noise- and theoretical problem completely. See section 4.4.1 for aquantitative evaluation.
26

(a) A rendering of the 3D model created inblender.
(b) The 3D printed physical controller with a pat-tern of Aruco markers added.
Figure 4.9.: The physical controller.
4.4. Evaluation
All tests are run on the Motorola Nexus 6, released in 2014.
4.4.1. Controller
In section 4.3.4 it was conjectured that the 3D configuration of markers improve theaccuracy of the perspective and pose recovery. The conclusion was motivated by iterativetesting based on moving the controller around and looking at the accuracy in real-time. Aquantitative test is performed to verify the assumption and to measure how much betterthe frustum configuration version is. A level of Sokoban is played as usual without takingany extra consideration to the test itself. The translation vector of the two recoveredposes of the controller are used. The rotation is not compared as it only affects thevisual experience and not the gameplay directly.
The first important metric is if the controller is found at all. Using the frustum con-figuration the controller is recovered for 99% of all frames, while for the single markerit is recovered 94% of the frames. This is a clear advantage for the frustum marker.However as the game is often viewed top-down the top marker is in view most of thetime, yielding a decent performance for it too. Note that the missing 1% for the frustumconfiguration is not necessarily the algorithm failing — the controller could simply beout of view.
The second metric is the accuracy of the controller. Using the frustum configuration as
27

Figure 4.10.: The two reconstructed controller paths using the frustum configuration(blue) and the single marker configuration (green). It can be seen that thesingle marker drifts compared to the frustum. Pixel units are used.
reference, we note that the average distance between the frustum and the single configu-ration is 157mm with a std. dev. of 44mm. This is a clear improvement of the accuracywhich can be felt while playing the game. Due to the properties of 3D reconstruction,the more markers used to reconstruct the pose the better the result. However we can notbe sure if the frustum configuration is the true reference position of the controller. Thetest should thus be seen as indicative and not an absolute measurement (see fig. 4.10).
4.4.2. Bounding boxes
This section compares the improved algorithm to find bounding boxes to the one includedwith OpenCV. Both algorithms return exactly the same results, so only the computationtime is measured. The test is performed by playing a level and running both versionson the same camera frame. It is thus ensured that a typical image is used and theperformance for the particular use case is relevant. 1000 camera frames are used tocompute the statistics. The algorithm is run on an image of size 960x540.
Algorithm average std. dev. median min maxOpenCV 23ms 3.8ms 27ms 17ms 39msCustom 6.9ms 2.0ms 6.0ms 3.9ms 18ms
The custom algorithm outperforms the one included in OpenCV by a factor of 3.3. Ithas also a lower standard deviation, which is an important as a spike in computationtime can cause noticeable lag for the player. Given the approximate 66ms available to
28
compute each frame for a smooth 30 frames per second frame rate4, the old versionspends 35% of the time computing the bounding boxes, while the new only spends 10%— making it a crucial part of the performance of the new marker detection algorithm.
Tested on a Sony Xperia Z1, with a 640x360 image size, the results are even better forthe custom algorithm, improving the time by a factor of 4.6 (11ms down to 2.4ms)
4.4.3. Neon Optimizations
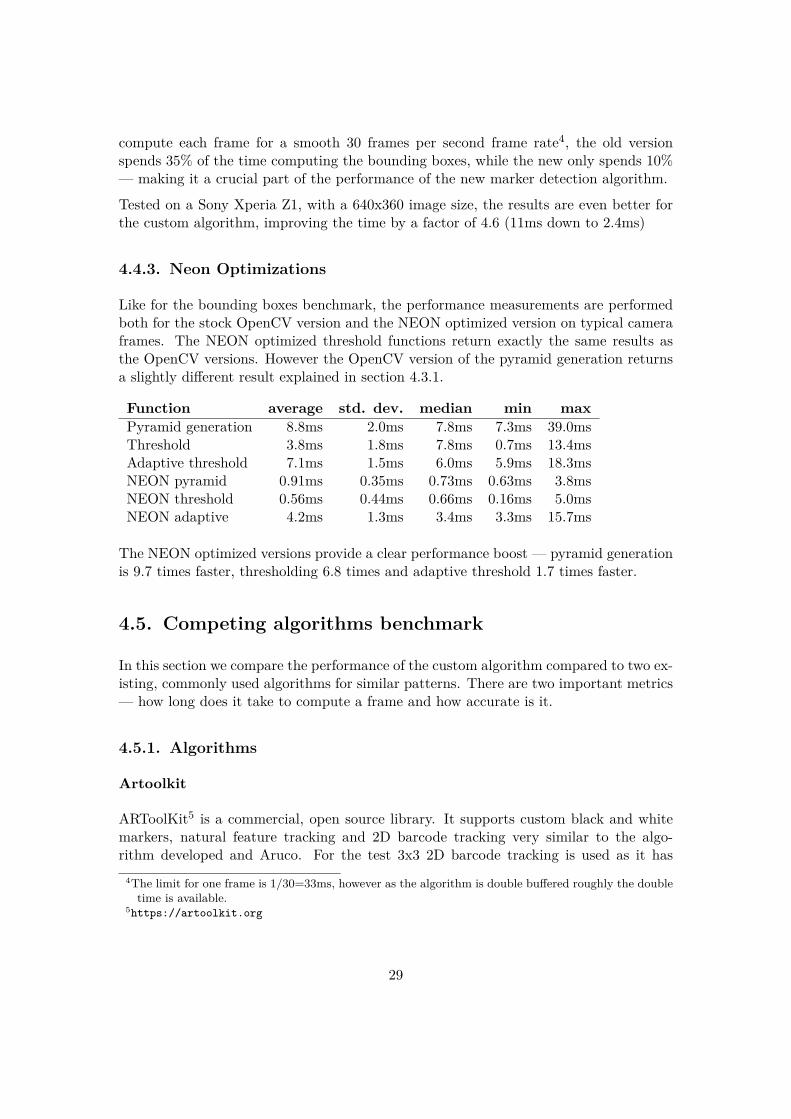
Like for the bounding boxes benchmark, the performance measurements are performedboth for the stock OpenCV version and the NEON optimized version on typical cameraframes. The NEON optimized threshold functions return exactly the same results asthe OpenCV versions. However the OpenCV version of the pyramid generation returnsa slightly different result explained in section 4.3.1.
Function average std. dev. median min maxPyramid generation 8.8ms 2.0ms 7.8ms 7.3ms 39.0msThreshold 3.8ms 1.8ms 7.8ms 0.7ms 13.4msAdaptive threshold 7.1ms 1.5ms 6.0ms 5.9ms 18.3msNEON pyramid 0.91ms 0.35ms 0.73ms 0.63ms 3.8msNEON threshold 0.56ms 0.44ms 0.66ms 0.16ms 5.0msNEON adaptive 4.2ms 1.3ms 3.4ms 3.3ms 15.7ms
The NEON optimized versions provide a clear performance boost — pyramid generationis 9.7 times faster, thresholding 6.8 times and adaptive threshold 1.7 times faster.
4.5. Competing algorithms benchmark
In this section we compare the performance of the custom algorithm compared to two ex-isting, commonly used algorithms for similar patterns. There are two important metrics— how long does it take to compute a frame and how accurate is it.
4.5.1. Algorithms
Artoolkit
ARToolKit5 is a commercial, open source library. It supports custom black and whitemarkers, natural feature tracking and 2D barcode tracking very similar to the algo-rithm developed and Aruco. For the test 3x3 2D barcode tracking is used as it has
4The limit for one frame is 1/30=33ms, however as the algorithm is double buffered roughly the doubletime is available.
5https://artoolkit.org
29

the best performance. The test is based on the example project “ARMulti” includedwith the default ArToolKit 5.3.2 distribution. The time is measured by seeing how longthe NativeInterface.arwUpdateAR() function call takes. The Artoolkit SDK is singlebuffered.
Aruco
Aruco6[20] is a minimal library included with OpenCV used for tracking 2D markers.OpenCV 3.1 is compiled with support for NEON and multi-threading. Given that thecustom algorithm is a drop in replacement for Aruco, and each frame is independentof previously computed frames, the code for double buffering designed for the customalgorithm is also used for Aruco. The time for the function calls detectMarkers andestimatePoseBoard are measured.
Custom algorithm
The same pattern as Aruco is used. The algorithm is designed to be double-buffered andparallel in itself — like Aruco each frame is independent of previously computed frames.
4.5.2. Performance test: marker detection & pose estimation
The marker detection algorithms are tested for three different number of markers, 12,24 and 48. The setup is as follows:
• A stream of 1920x1080 image frames• Camera set to automatic expose• Only the functions computing markers & pose measured - color conversion, OpenGL
etc are excluded• Hover the phone 30-40cm above the pattern of markers while moving the phone
slightly, always allowing all markers to be seen.• Run the computation for 1000 frames, 300 for Aruco due to overheating of the
phone causing a throttling of the CPU.• Test with a pattern of 12, 24 and 48 markers and measure performance. Each
marker is 2x2cm• Ideal lighting: Indoor with overcast weather, no glare or complicated shadows.• Motorola Nexus 6 2014 is used.• The doubled buffered performance is approximated by treating the measurements
as single buffered, then dividing it by two. The inverse of the throughput is thuswhat is actually measured.
6http://docs.opencv.org/3.1.0/d9/d6d/tutorial_table_of_content_aruco.html
30

Results
It is clear that Aruco performs far worse than the contenders (see fig. 4.11). Eventhough it is double buffered it performs worse than the single buffered alternatives. Thisis not surprising as the performance of Aruco motivated the development of the customalgorithm. Artoolkit performs slightly better than the single buffered custom algorithmfor 12 and 24 markers. The custom scales better for more markers and has a clearadvantage for 48 markers. The double-buffered custom algorithm outperforms everycontender with a high margin. Arguably the most important metric for performance ishow many frames takes too long to compute — causing lag. The camera frames arrive ata pace of 30 frames per second, giving the algorithms 33ms to compute the frame beforelag occurs. Given that the game uses 44 markers, the double-buffered custom algorithmis the only algorithm which never fails the 33ms target. A significant improvement overthe 82% failure rate of the second best (see fig. 4.11).
4.5.3. Performance test: Marker detection
Pose estimation can be a time consuming step. Artoolkit is compared to the customalgorithm for marker detection alone. Exactly the same setup as previously is used.Aruco is skipped, as it, like the custom algorithm, is based on OpenCV which usesthe same pose estimation step — however without the outlier rejection. This meansthat Aruco’s improvement will be at most as much as the custom algorithm, making itirrelevant to test given its low performance.
Results
Excluding the pose estimation lowers the computation time significantly (see fig 4.12).The custom double buffered version is still the clear winner. Artoolkit still has theadvantage for 12 and 24 markers, while the custom algorithm is better for 48. Thedifferent in both cases is however smaller than with the pose estimation.
4.5.4. Tracking performance
An important metric is responsive and accurate tracking performance — if the input tothe game is not accurate the game won’t be enjoyable to play. It is also hard to quantify.Since the algorithms uses different markers it is not possible to feed one video streamto both and compare them. A short subjective evaluation why the custom algorithm isbetter for this particular use case follows:
1. The parameters of the custom algorithm are tuned assuming multiple correct mark-ers in view. This means the sensitivity of the marker detection can be very high,
31

12 markers 24 markers 48 markers
10ms
20ms
30ms
40ms
50ms
60ms
70ms
80ms
90ms
100ms
99% 1% 1% 0% 98% 9% 13% 0% 100%82%
47%0%
Computation time per frame
Aruco, double bufferedArToolKitCustom, single bufferedCustom, double buffered33ms limit
Figure 4.11.: Box plot of performance. The bottom and top of the boxes represents thefirst and third quartiles, with the median bar inside the box — 50% ofthe time the algorithm will finish within the box. The whiskers show the2% percentile to the 98% percentile. 96% of the time the algorithm willfinish within the whiskers. The red line is the 33ms mark. A computationtime above this results in game lag. The accompanying red text is thepercentage of frames failing to meet the 33ms deadline.
32

12 markers 24 markers 48 markers
10ms
20ms
30ms
40msMarker computation time per frame
ArToolKitCustom, single bufferedCustom, double buffered
Figure 4.12.: Box plot of marker computation time. The plot uses the same graphics asfig 4.11.
33
giving the algorithm a high recall, at the cost of a lower precision. The pose esti-mation stage robustly invalidates outliers, meaning the false positive markers wontaffect the result.
2. With Artoolkit the tracking performance feels like it is “on ice”. The virtual objectslag behind the actual image stream. A possible explanation is that it fails to trackthe markers and interpolates between frames.
3. A major advantage compared to Artoolkit is that the custom algorithm uses thecamera2 API. This allows the exposure time to be very low, at around 3-4ms, elim-inating motion blur but increasing noise. Even for quick movements the algorithmtracks the markers very well. Due to its two pass nature the algorithm is verygood at handling noisy frames.
4.6. Discussion
The marker detection algorithm provides a solution to augmented reality games ondevices with constrained performance where 2D barcode markers can be used. Thecompeting algorithms lack the speed, accuracy or responsiveness to provide for an equallyenjoyable experience.
4.6.1. Future work
There are a lot of optimizations that can still be made to the algorithm, both for im-proving its speed and tracking performance.
Filtering A low-pass filter or ideally a Kalman filter could be added as a final step toavoid bad poses, and to interpolate when the markers cannot be found. Ideally sensorfusion with the gyroscope or accelerometer can be added to increase the accuracy. Thiswould still allow the algorithm to be double buffered as it would be a final step after thepose has been recovered.
Pose reconstruction The pose reconstruction algorithms are directly from OpenCVand take a significant fraction of the time of every frame, compare fig 4.11 and fig. 4.12.Specializing them to the particular use case might yield better performance
Marker identification The parallel marker identification step in the algorithm usesa few slow OpenCV functions such as findContours. It is likely that it is possible tomake a specialized version given the assumptions about the shape of the marker that isfaster. Instead of computing the inner contours, and then transforming them with thehomography transform, the borders of the marker cells in the original image could becomputed, and the pixels counted directly.
34

Low level optimizations While some functions are NEON optimized, there is likelyroom for optimizations decreasing memory allocations and improving memory accesspatterns.
35

5. User studies
While the game has been continuously tested by several participants throughout itsdevelopment, two formal user studies have been performed, one during development andone after the completion of the game.
5.1. Preliminary study: Think-aloud protocol
The first study was performed as soon as the first prototype was playable, roughlyhalf way through the thesis work. It uses the think-aloud protocol, where participantsare instructed to say whatever they think throughout the test. Each test started by ashort introduction of the game and how to play it. The players participated as partof their curriculum in user usability, and were already familiar with the think-aloudprotocol. Each participant played through at least two levels, one of which posed nological challenge and were used to get the participants familiar with the controller. Atthis stage there were two versions of the game (see fig. 5.1):
1. The regular phone version set up on a trip-pod with its camera capturing the gameboard from a favorable angle.
2. A version using the Epson Moverio BT-200 augmented reality glasses.
The participants played the game on the tripod for about 5 minutes each, and werethen given the option to try out the augmented reality glasses. 1 female and 5 malesparticipated in the study.
5.1.1. Results
All participants quickly figured out how to control the game. A session typically startedby the participants moving the controller around and seeing how the game reacted.Two participants initially didn’t get how a move was performed (see fig. 3.2c). At thistime the entire square was lit up green, with no indication that the squares had to beconnected to be able to go there. However they understood it without help after testingfor less then a minute. Some thought it was a bit unclear what the different colors ofthe overlay meant, and suggested clearer graphics. Participants noted the stutteringperformance of the game (about 8 frames per second at the time), but didn’t see it as abig problem for the short duration of the experiment.
36

Figure 5.1.: Evaluating different technologies: 1) Epson Moverio, 2) hand-held mobilephone and 3) head mounted display (cardboard)
The female participant was the only one who preferred the Epson Moverio glasses. Likelyas she was shorter and the tripod playing position was very awkward for her. Of the sixparticipants two had not played the classic Sokoban game before.
5.1.2. Discussion
The biggest outcome of the study was that playing it with a phone on a tripod or usingthe Epson Moverio glasses is not ideal. It is inconvenient to have the phone in a fixedposition on the tripod, especially if the participant is not tall. On the other hand itwas confusing to play with the Epson Moverio glasses, as the video feed was not alignedwith reality. Even if it is theoretically possible to align, it would be impractical since theslightest movement of the glasses in relation to the eyes requires a tedious realignmentprocess.
The study promoted the development of the Google Cardboard version and the newmarker detection algorithm. The graphics were also improved to be more intuitive.
5.2. Final study: Game experience
A game experience user study of the Cardboard version was carried out. The participantsplayed up to four levels of increasing difficulty. After each level a questionnaire relatedto the state of mind was filled in by the participants. The participants decided the
37

pace of the game, including how long they would like to play. They were allowed asmany restarts as they wished. After completing all levels or deciding to quit, a broaderquestionnaire was given about the general and augmented reality experience. Somequestions are modeled after the Game Experience Questionnaire (GEQ)[24], a set ofquestions that measures the emotional response.
5.2.1. Purpose
The purpose of the experiment is to investigate if the augmented reality version ofSokoban is enjoyable for healthy users without any disabilities. This includes to see ifthe augmented reality part introduces nausea or sickness, if the controller is accurateenough and the general enjoyment of the game. If this is the case it might show potentialfor use in rehabilitation in the future.
5.2.2. Sample
The participants were sampled from colleagues1 on an opt-in basis. The demographicsof the study is thus well educated, technical oriented people.10 people participated in the experiment, of which 5 male and 5 female. The demo-graphics were two younger than 19, six between 20–29, one 30–39 and one 40–49.Only one participant had played the original Sokoban game. 5 participants had neverplayed a virtual reality or augmented reality game, while 5 had played it up to a fewtimes.
5.2.3. Experiment process
1. The purpose and process of the experiment is explained. The participant signs aconsent form.
2. The participant answers demographic questions and their previous experience withSokoban and augmented reality games.
3. The Test level is demonstrated using the regular screen version. How to play thegame is explained.
4. The participant puts on the Google Cardboard and plays the Test level.5. The following is repeated for the levels Omega, Alpha, Star, TrickyThree in that
order (see fig. 5.2).a) The participant puts on the Google Cardboard and plays the level as many
times as they like. The participant may at any time request a restart of thelevel.
1Employees of Know-Center, a data science research company.
38

b) If the game performance suffers because of overheating, the phone is cooledwith a cool pack for 30 seconds.
c) When the participant completes the level or they request to stop, they takeoff the headset, and the “In-Game” module of the GEQ is presented for thatlevel.
d) Simultaneously the smartphone is cooled with a cool-pack.
6. After the experiment several questions are asked:
a) The Post-Game module of GEQ.
b) Augmented reality particulars.
c) Overall impressions.
d) Other free text comments.
7. The experiment is finished.
A session typically lasted between 30–50 minutes. See https://goo.gl/WgVHUI for thequestions asked and a summary of the responses. See https://goo.gl/WzfIh0 for theindividual responses.
5.2.4. Results
The survey indicates that the participants enjoyed the game. They rated The meanoverall experience 7.2 out of 10 (higher is better). 9 answered yes to “Would you like toplay the game again” (see fig 5.3).
The biggest complaint was that the smartphone overheated. This became more prob-lematic for the harder levels, as the participants required more playtime. For the hardestlevel, TrickyThree, it was not uncommon to take one or two short pauses to cool downthe phone.
Two participants rated their augmented reality sickness as “fairly”, while the medianwas “slightly”. The comfort of the headset was rated relatively high, at a median of“fairly”. The accuracy of the controller was generally perceived as high, with all but twoparticipants rating it at least “fairly”.
By inspecting the correlation2 (see fig. 5.4) between the overall experience and variousfactors we can recover interesting information.
2Pearson product-moment correlation coefficient is a measure of the linear correlation between twovariables X and Y, giving a value between +1 and −1 inclusive, where 1 is total positive correlation,0 is no correlation, and −1 is total negative correlation. — Wikipedia
39

(a) Test (b) Omega. All participants solved this level, every-one using 5 moves.
(c) Alpha. 9 participants solved this level, using onaverage 8.3 moves.
(d) Star. 8 participants solved this level, using onaverage 13 moves.
(e) TrickyThree. No participant solved this level.
Figure 5.2.: The levels played for the game experience study
40

positive
negative
tiredness
returning to realitynot at all
slightly
moderately
fairly
extremelyPost game GEQ
sickness
comfort
accuracy
Augmented reality
1 2 3 4 5 6 7 8 9 10
1
2
3
2
1 1
Very bad Very good
Overall score
Figure 5.3.: Post game impressions.
41

positive
negative
tiredness
returning to re
ality
Levels completed
AR sickness
AR comfort
AR accuracy
0.61 -0.47 -0.77 -0.26 0.25 -0.62 0.62 0.31
Figure 5.4.: Correlation with overall experience.
The most important factor was low tiredness, followed by low AR sickness (also know ascybersickness, motion sickness) and the comfort of the headset. There is a moderate cor-relation between positive emotions and inversely so for negative emotions (as computedby the GEQ).
The immersion (returning to reality), levels completed, and the AR accuracy did nothave a great correlation with the overall score. It should however be noted that therewas a great consensus in both the AR accuracy, see fig. 5.3, and the number of levelscompleted — 8 participants solved 3 out of 4 levels.
Per level results
While the test level and Omega were trivial and completed by all participants in theleast amount of moves, the other levels were increasingly challenging. All except oneparticipant completed Alpha, while Star was not completed by two. No participantcompleted TrickyThree. Participants experienced widely different emotions completingthe levels, as seen in fig 5.5. While all participants agree that the challenge increases forthe later levels, their reaction seemed to differ. Some expressed this positively where theybecame very engaged and tried hard to complete the level, while others felt frustratedand inadequate when they realized they got stuck yet again. The flow of the gameseemed to improve slightly as the levels got harder. While the negative emotions areconsistently relatively low, the competence and positive emotions vary widely.
5.2.5. Discussion
The experiment shows that healthy users enjoy the game. No usability problems fromthe first evaluation (see section 5.1) appeared. While playing the game though the EpsonMoverio eyewear and tripod solution were awkward, the Google cardboard headset wascomfortable enough for most participants.
After the session several participants requested more attempts for the final level outsidethe scope of the study — a strong indication they found the game engaging.
42

not at all
slightly
moderately
fairly
extremelychallenge competence flow
omegaalpha Star
TrickyThree
not at all
slightly
moderately
fairly
extremelynegative
omegaalpha Star
TrickyThree
positive
omegaalpha Star
TrickyThree
tension
Figure 5.5.: The in-game module GEQ as completed per level.
43

The biggest problem reported was the overheating of the smartphone, with several par-ticipants complaining about it. Fixing the overheating — either by improving the algo-rithms or finding better hardware — should be the primary aim for future work.
The augmented reality experience was mostly fine, with most participants rating theaccuracy as good enough, while not suffering from any nausea or other discomfort. Therewas one visibly nauseous participant, which might indicate that the game will never beplayable by the entire population. It should however be noted that the participant wasstill motivated to continue solving the levels, even if she was given the option to terminatethe experiment several times when displaying physical discomfort. This further indicatesthat the concept has potential.
44

6. Conclusion
The thesis successfully demonstrates that a physically controlled augmented reality gameis enjoyable for healthy users. Three technologies were tried for augmenting the game tothe user, a regular phone screen, smart-glasses (Epson Moverio) and Google Cardboard.The latter was shown to be the best option out of the three.
A new algorithm for marker detection is presented. With it the game can run at a con-tinuous 30 frames per second, a task no other tested algorithm managed. Combined withthe custom 3D-printed controller, the game satisfies both constraints for an enjoyableaugmented reality experience — accuracy and no lag.
The user studies concludes that the augmented reality parts and the game itself wereperceived positively by most users. The biggest complaint was the eventual performancedegradation due to the smartphone overheating.
A shortcoming of the user study is that it did not compare against the non-augmentedversion of Sokoban — which might be more enjoyable than the augmented version.While the non-augmented version is not relevant for rehabilitation, it would nonethelessbe interesting to compare it for healthy users.
Future work
Given the positive results of the user study, the next step would be a study on patientswith spinal cord injury to evaluate if the concept carries over to grasp training. Themost important focus for the application is to solve the overheating issue. Either byimproving the algorithm, using better hardware, or a combination of both. If betteraugmented reality glasses appears on the market, it may be of interest to port the gameto those devices.
45

Bibliography
[1] Viktoria Pammer et al. “Designing for Engaging BCI Training: A Jigsaw Puzzle”.In: Proceedings of the 2015 Annual Symposium on Computer-Human Interactionin Play. CHI PLAY ’15. London, United Kingdom: ACM, 2015, pp. 667–672. isbn:978-1-4503-3466-2. doi: 10.1145/2793107.2810290. url: http://doi.acm.org/10.1145/2793107.2810290 (cit. on pp. 1, 3).A digital game using a brain computer interface to control it.
[2] Johannes Breuer and Gary Bente. “Why so serious? On the relation of seriousgames and learning”. In: Eludamos. Journal for Computer Game Culture 4.1(2010), pp. 7–24. issn: 1866-6124. url: http : / / www . eludamos . org / index .php/eludamos/article/view/vol4no1-2/146 (cit. on p. 3).About the concept of games that combines fun with learning or some other usefultask.
[3] Damien Coyle, Jhonatan Garcia, Abdul R Satti, and T Martin McGinnity. “EEG-based continuous control of a game using a 3 channel motor imagery BCI: BCIgame”. In: Computational Intelligence, Cognitive Algorithms, Mind, and Brain(CCMB), 2011 IEEE Symposium on. Apr. 2011, pp. 1–7. doi: 10.1109/CCMB.2011.5952128 (cit. on p. 3).A digital game using a brain computer interface to control it.
[4] Granit Luzhnica, Christoffer Öjeling, Eduardo E. Veas, and Viktoria Pammer-Schindler. “Technical Concept and Technology Choices for Implementing a Tangi-ble Version of the Sokoban Game”. Poster paper to be presented at IEEE ISMAR2016, Merida, Mexico. 2016 (cit. on p. 4).
[5] John Bowlby. Attachment and loss. 1. Attachment. Attachment and Loss. BasicBooks, 1969. url: https://books.google.at/books?id=FYEuAAAAMAAJ (cit. onp. 4).
[6] Adrian David Cheok et al. “Touch-Space: Mixed Reality Game Space Based onUbiquitous, Tangible, and Social Computing”. In: Personal Ubiquitous Comput.6.5-6 (Jan. 2002), pp. 430–442. issn: 1617-4909. doi: 10.1007/s007790200047.url: http://dx.doi.org/10.1007/s007790200047 (cit. on p. 4).
[7] Jilyan Decker, Harmony Li, Dan Losowyj, and Vivek Prakash. “Wiihabilitation: Rehabilitation of Wrist Flexion and Extension Using a Wiimote-Based GameSystem”. In: Governor’s School of Engineering and Technology Research Journal(2009), pp. 92–98. url: http://www.osd.rutgers.edu/gs/09papers/Wii.pdf(cit. on p. 4).
46

[8] Eun Kyung Kim, Jong Ho Kang, Jang Sung Park, and Byung Ho Jung. “ClinicalFeasibility of Interactive Commercial Nintendo Gaming for Chronic Stroke Reha-bilitation”. In: Journal of Physical Therapy Science 24.9 (2012), pp. 901–903. issn:0915-5287. doi: 10.1589/jpts.24.901 (cit. on p. 4).
[9] Loh Yong Joo et al. “A feasibility study using interactive commercial off-the-shelfcomputer gaming in upper limb rehabilitation in patients after stroke”. In: Jour-nal of Rehabilitation Medicine 42.5 (2010), pp. 437–441. issn: 1650-1977. doi:10.2340/16501977-0528. url: http://jrm.medicaljournals.se/article/abstract/10.2340/16501977-0528 (cit. on p. 4).
[10] Hiroshi Ishii. “Tangible Bits: Beyond Pixels”. In: Proceedings of the 2nd Inter-national Conference on Tangible and Embedded Interaction. TEI ’08. Bonn, Ger-many: ACM, 2008, pp. xv–xxv. isbn: 978-1-60558-004-3. doi: 10.1145/1347390.1347392. url: http://doi.acm.org/10.1145/1347390.1347392 (cit. on p. 4).
[11] Lesley Xie, Alissa N. Antle, and Nima Motamedi. “Are Tangibles More Fun?:Comparing Children’s Enjoyment and Engagement Using Physical, Graphical andTangible User Interfaces”. In: Proceedings of the 2nd International Conferenceon Tangible and Embedded Interaction. TEI ’08. Bonn, Germany: ACM, 2008,pp. 191–198. isbn: 978-1-60558-004-3. doi: 10 . 1145 / 1347390 . 1347433. url:http://doi.acm.org/10.1145/1347390.1347433 (cit. on p. 4).
[12] Tamara M. Lackner, Kelly Dobson, Roy Rodenstein, and Luke Weisman. “Sen-sory Puzzles”. In: CHI ’99 Extended Abstracts on Human Factors in ComputingSystems. CHI EA ’99. Pittsburgh, Pennsylvania: ACM, 1999, pp. 270–271. isbn:1-58113-158-5. doi: 10.1145/632716.632882. url: http://doi.acm.org/10.1145/632716.632882 (cit. on p. 4).
[13] Nesra Yannier, Kenneth R. Koedinger, and Scott E. Hudson. “Learning fromMixed-Reality Games: Is Shaking a Tablet As Effective As Physical Observation?”In: Proceedings of the 33rd Annual ACM Conference on Human Factors in Com-puting Systems. CHI ’15. Seoul, Republic of Korea: ACM, 2015, pp. 1045–1054.isbn: 978-1-4503-3145-6. doi: 10.1145/2702123.2702397. url: http://doi.acm.org/10.1145/2702123.2702397 (cit. on p. 4).
[14] Harish Damodaran and Sergei Adamovich. “Examining the Manipulation of theDynamic Properties of Virtual Objects to Optimize Upper Extremity Rehabilita-tion Activities.” In: Proceedings of the 2010 IEEE 36th Annual Northeast Bioengi-neering Conference (NEBEC). IEEE. 2010, pp. 1–2. isbn: 9781424469246 (cit. onp. 4).
[15] Joseph Culberson. Sokoban is PSPACE-complete. 1999 (cit. on p. 5).[16] Elan Dubrofsky. Homography Estimation. 2009. url: https://www.cs.ubc.ca/
grads/resources/thesis/May09/Dubrofsky_Elan.pdf (cit. on p. 13).
Explaining the Homography transform.
47

[17] Tom Dalling. Explaining Homogeneous Coordinates & Projective Geometry. url:http://www.tomdalling.com/blog/modern-opengl/explaining-homogenous-coordinates-and-projective-geometry (cit. on p. 15).
Several concepts relating to projective geometry explained. Used for reconstructingthe perspective and rendering the augmented objects with OpenGL.
[18] Martin A. Fischler and Robert C. Bolles. “Random Sample Consensus: A Paradigmfor Model Fitting with Applications to Image Analysis and Automated Cartogra-phy”. In: Commun. ACM 24.6 (June 1981), pp. 381–395. issn: 0001-0782. doi:10.1145/358669.358692. url: http://doi.acm.org/10.1145/358669.358692(cit. on p. 17).
The RANSAC method of excluding outliers.[19] Bernard A. Galler and Michael J. Fisher. “An Improved Equivalence Algorithm”.
In: Commun. ACM 7.5 (May 1964), pp. 301–303. issn: 0001-0782. doi: 10.1145/364099.364331. url: http://doi.acm.org/10.1145/364099.364331 (cit. onp. 17).
The disjoint set data structure. Also know as union-find.[20] S. Garrido-Jurado, R. Muñoz-Salinas, F.J. Madrid-Cuevas, and M.J. Marín-Jiménez.
“Automatic generation and detection of highly reliable fiducial markers under oc-clusion”. In: Pattern Recognition 47.6 (2014), pp. 2280–2292. issn: 0031-3203.doi: http : / / dx . doi . org / 10 . 1016 / j . patcog . 2014 . 01 . 005. url: http ://www.sciencedirect.com/science/article/pii/S0031320314000235 (cit. onpp. 22, 30).
The first marker-detection algorithm used. Later replaced by a custom better per-forming algorithm.
[21] S. Garrido-Jurado, R. Muñoz-Salinas, F.J Madrid-Cuevas, and R. Medina-Carnicer.“Generation of fiducial marker dictionaries using mixed integer linear program-ming”. In: Pattern Recognition 51 (2016), pp. 481–491. issn: 0031-3203. doi:http://dx.doi.org/10.1016/j.patcog.2015.09.023. url: http://www.sciencedirect.com/science/article/pii/S0031320315003544 (cit. on p. 22).
The method used to generate the Aruco markers.[22] Linda G. Shapiro and George C. Stockman. Computer vision. Upper Saddle River,
NJ: Prentice Hall, 2001, pp. 69–73. isbn: 0-13-030796-3. url: http : / / opac .inria.fr/record=b1128947 (cit. on p. 23).
Conventional algorithm to find connected components in a binary image.[23] Ezio Malis et al. Deeper understanding of the homography decomposition for vision-
based control. INRIA Research Report #6303. 2007. url: https://hal.inria.fr/inria-00174036v3/document (cit. on p. 26).
48

[24] Wijnand IJsselsteijn, Yvonne de Kort, and Karolien Poels. “The Game ExperienceQuestionnaire: Development of a self-report measure to assess the psychological im-pact of digital games.” In: (). url: https://pure.tue.nl/ws/files/21666907/Game_Experience_Questionnaire_English.pdf (cit. on p. 38).
A standardized set of questions used to compute various scores for games used inthe second user study.
49

A. Log file
For each level played a a log file is created in the “sokoban” folder on the Android device’sexternally accessible storage. The log file consists of two parts, one metadata part andone part for the continuous information generated by the game. The log file begins withthe metadata part, ended by a blank line, after which the continuous part starts. Thename of the log file is the level played and the current date.
Metadata part
File entry ExplanationLevel: Alpha The level played.WxH: 8 5 Number of markers (width x height) of the game board.MarkerLengthPx: 200 The length of the game board marker and the spacing
between them. (in pixel units)MarkerSpacePx: 40VirtualSize: 200 The size of the virtual squares (in pixel units) One marker
unit is the size of the virtual size.PixelPerMM: 3.54333 Millimeter per pixel unit.LiftedThreshold: 500 Threshold for the controller to be considered in lifted state.
(in pixel units)RequireSignal: 0 1 If the user was required to press space after each move, 0
otherwise.
Data
The continuous part consists of one line per event. Each event consists of multiple values,separated by space.
• The first value is always number of microseconds since the start of the level.• The second value is a character deciding what’s in the next columns, see the table
belowCharacter ExplanationL <x> <y> The controller was lifted from position x, y.P <x> <y> The controller was put down at position x, y.M <x> <y> <x’> <y’> A box was moved from x ,y to x’,y’.C <n> The game was completed in n moves.X <v>×21 The translation and rotation of the game board, controller
and relative game board. See table below.
50

Where the values for the X entry are:Column Explanation0 Time since the start of the level (microseconds)1 X2 Time used to find the markers (microseconds)3 Time used to find the pose (microseconds)4–6 Rodrigues rotation vector for the controller (in pixel units)7–9 Translation vector for the controller (in pixel units)10-12 Rodrigues rotation vector for the game board (in pixel units)13-15 Translation vector for the game board (in pixel units)16 x position of the controller relative to the board (in marker
units)17 y position of the controller relative to the board (in marker
units)18 1 if the controller is in the lifted state, 0 if it is not.A Rodrigues vector is a way to unambiguously describe the 3 degrees of freedom of arotation. For further information see the Rodrigues function at http://docs.opencv.org/3.1.0/d9/d0c/group__calib3d.html.
51


![State of Augmented Reality, Virtual Reality and Mixed Reality · State of Augmented Reality, Virtual Reality and Mixed Reality [Microsoft Hololen] [Ready Player One] Augmented Reality](https://static.fdocuments.net/doc/165x107/5f82ab6da2d89130b90d78c7/state-of-augmented-reality-virtual-reality-and-mixed-reality-state-of-augmented.jpg)