Interim Report January- September 2009 Exel Composites Plc Vesa Korpimies, President and CEO.
15
-
Upload
penelope-gordon -
Category
Documents
-
view
217 -
download
0
Transcript of Interim Report January- September 2009 Exel Composites Plc Vesa Korpimies, President and CEO.


Interim Report January- September 2009
Exel Composites PlcVesa Korpimies, President and CEO

July - September 2009 in brief
• Net sales from continuing operations MEUR 15.9 (21.1), down by 15.9%
• Operating profit from continuing operations MEUR 1.2 (1.8), down by 30.6%. It represented 7.8 (8.5) % of net sales.
• Fully diluted earnings per share EUR 0.07 (0.07) of which continuing operations accounted for EUR 0.06 (0.03)

January - September 2009 in brief
• Net sales from continuing operations MEUR 53.8 (64.5), down by 16.6%
• Operating profit from continuing operations MEUR 5.6 (6.4), representing 10.5 (10.0) % of net sales
• Fully diluted earnings per share EUR 0.37 (-0.24) of which continuing operations accounted for EUR 0.35 (0.29)
• Net operative cash flow increased by 75% to MEUR 8.6 (4.9)• Return on capital employed improved to 18.4% (-4.0%)• Net gearing continued to improve from 123.9% (year end 2008) to
51.8%

Strategic actions in light of the financial crisis
• To weather the financial crisis Exel consolidated its position and prioritized cash flow and profitability– Divested non-core Sport business, long-term licensing agreements
– Streamlined operations and reduced the cost base
– Reduced operative working capital
– Improved gearing from 123.9% (year end 2008) to 51.8% in September 2009
• Exel is today a leaner and more focused group with less operational and financial risks

Key figures, continuing operations
Q3/2009
15.9
1.2
7.8
Net sales, M€
Operating profit, M€
as % of sales
Q3/2008
21.1
1.8
8.5
change, %
-24.5
-30.6
Q1-Q3/2009
53.8
5.6
10.5
2008
84.9
8.6
10.1
Q1-Q3/2008
64.5
6.4
10.0
Net sales
0
5
10
15
20
25
Q1/08 Q2/08 Q3/08 Q4//08 Q1/09 Q2/09 Q3/09
ME
UR
Operating profit
0
1
1
2
2
3
3
Q1/08 Q2/08 Q3/08 Q4/08 Q1/09 Q2/09 Q3/09
ME
UR

Consolidated financial performance July - September 2009
• Sales in almost all geographical markets decreased and the order intake was weak
• Sales to general industries, especially defense, improved due to new applications
• New applications also in the building, construction and infrastructure market segment
• New long-term agreements signed in the electrical industry
• The Federal Aviation Administration (FAA) listed Exel’s frangible safety approach masts as approved airport lighting equipment

Consolidated financial performance January - September 2009
• Net sales from continuing operations in January-September 2009 MEUR 53.8 (64.5), down by 16.6%
• Especially the machine industry, sports and leisure, paper industry and telecommunication markets affected by the recession
• Sales relatively better in Europe compared to the situation in Asia, which suffered from tough competition especially in China
• Operating profit from continuing operations in January-September 2009 MEUR 5.6 (6.4)
• The comprehensive rationalization program has restored profitability by reducing operational costs and streamlining the capital employed

Consolidated financial performance January -September 2009
• Net financial expenses from continuing operations MEUR 0.1 (1.9)
– Lower interest rates
– Lower debt
– Favorable currency exchange rates, especially the Australian dollar
• Profit before taxes from continuing operations MEUR 5.6 (4.6) and profit after taxes MEUR 4.1 (3.4)

Balance sheet, cash flow and financing:positive cash flow continued
• Cash flow from business operations MEUR 8.6 (4.9)
• Group’s liquid assets MEUR 8.8 (6.1) million
• Equity MEUR 22.7 (18.3)
• Equity ratio 38.8 (26.8)%
• Net gearing 51.8 (144.3)%
• Return on equity 29.9 (-18.0)%
• ROCE 18.4 (-4.0)%
• Equity per share EUR 1.91 (1.54)
Cash flow
-1
0
1
2
3
4
5
Q1/08 Q2/08 Q3/08 Q4/08 Q1/09 Q2/09 Q3/09
ME
UR

Net gearing and equity ratios continued to improve
Net gearing ratio Q3 2009 51.8% (144.3%)
Equity ratio Q3 2009 38.8% (26.8%)
0 %
20 %
40 %
60 %
80 %
100 %
120 %
140 %
160 %
180 %
200 %
Q1/07 Q2/07 Q3/07 Q4/07 Q1/08 Q2/08 Q3/08 Q4/08 Q1/09 Q2/09 Q3/09
0 %
5 %
10 %
15 %
20 %
25 %
30 %
35 %
40 %
45 %
Q1/07Q2/07Q3/07Q4/07Q1/08Q2/08Q3/08Q4/08Q1/09Q2/09Q3/09

Outlook• The challenging market conditions are expected to continue also during the rest of the year affecting net sales and profitability during the fourth quarter.
• Exel’s contingency plans are in place to address the risk of further market decline and we are prepared to take prompt actions if necessary.
• Even though the short-term market is challenging, the long-term growth opportunities still remain favorable. Exel will continue to have a strong focus to drive sales to current and new customers as well as to pursue bolt-on acquisition opportunities.
• Exel is a leading, international pultrusion Group with a strong financial position and well poised to consolidate its position in the pultrusion market.
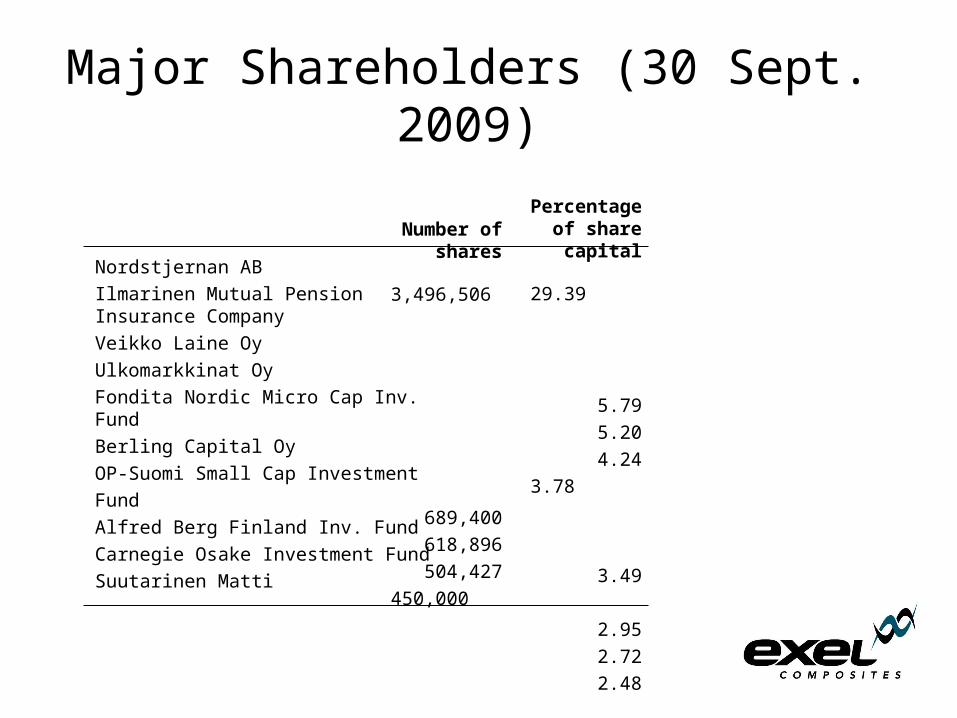
Major Shareholders (30 Sept. 2009)
Nordstjernan AB
Ilmarinen Mutual Pension Insurance Company
Veikko Laine Oy
Ulkomarkkinat Oy
Fondita Nordic Micro Cap Inv. Fund
Berling Capital Oy
OP-Suomi Small Cap Investment
Fund
Alfred Berg Finland Inv. Fund
Carnegie Osake Investment Fund
Suutarinen Matti
Number of shares
3,496,506
689,400
618,896
504,427
450,000
415,963
351,085
323,724
295,494
294,400
Percentage of share
capital
29.39
5.79
5.20
4.24
3.78
3.49
2.95
2.72
2.48
2.47

Exel share
1/2009 - 10/200926.9% (6.9%) of shares outstanding were traded in Q3 2009
The highest share quotation was EUR 6.20 (12.20) and the lowest EUR 2.37 (6.53)
The share price closed at EUR 5. 58 (6.93) and the market capitalization at the end of the review period was EUR 66.4 (82.4) million