
ING Property Trust November 2009 - Argosy
23
ING Property Trust Interim Results Presentation November 2009 ING Property Trust Interim results presentation November 2009
Transcript of ING Property Trust November 2009 - Argosy
ING Property TrustInterim Results Presentation
November 2009
ING Property TrustInterim results presentationNovember 2009
1
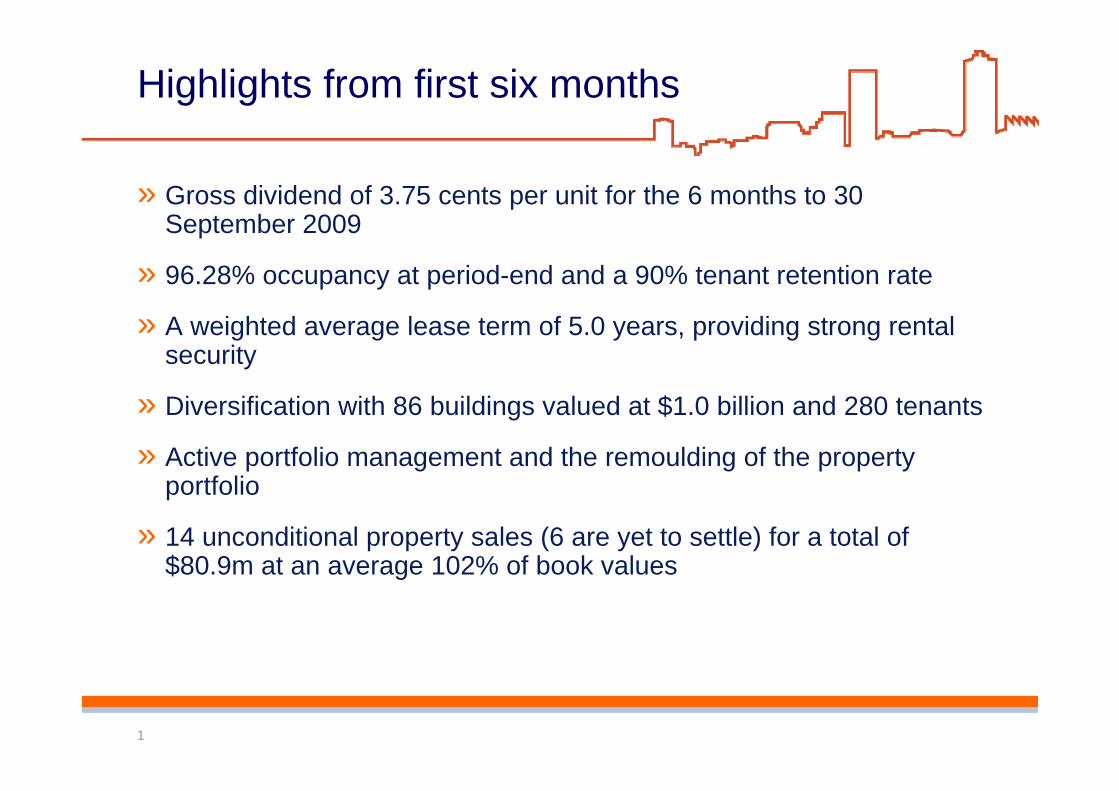
Highlights from first six months
» Gross dividend of 3.75 cents per unit for the 6 months to 30 September 2009
» 96.28% occupancy at period-end and a 90% tenant retention rate
» A weighted average lease term of 5.0 years, providing strong rental security
» Diversification with 86 buildings valued at $1.0 billion and 280 tenants
» Active portfolio management and the remoulding of the property portfolio
» 14 unconditional property sales (6 are yet to settle) for a total of $80.9m at an average 102% of book values
2
Trust basics
3
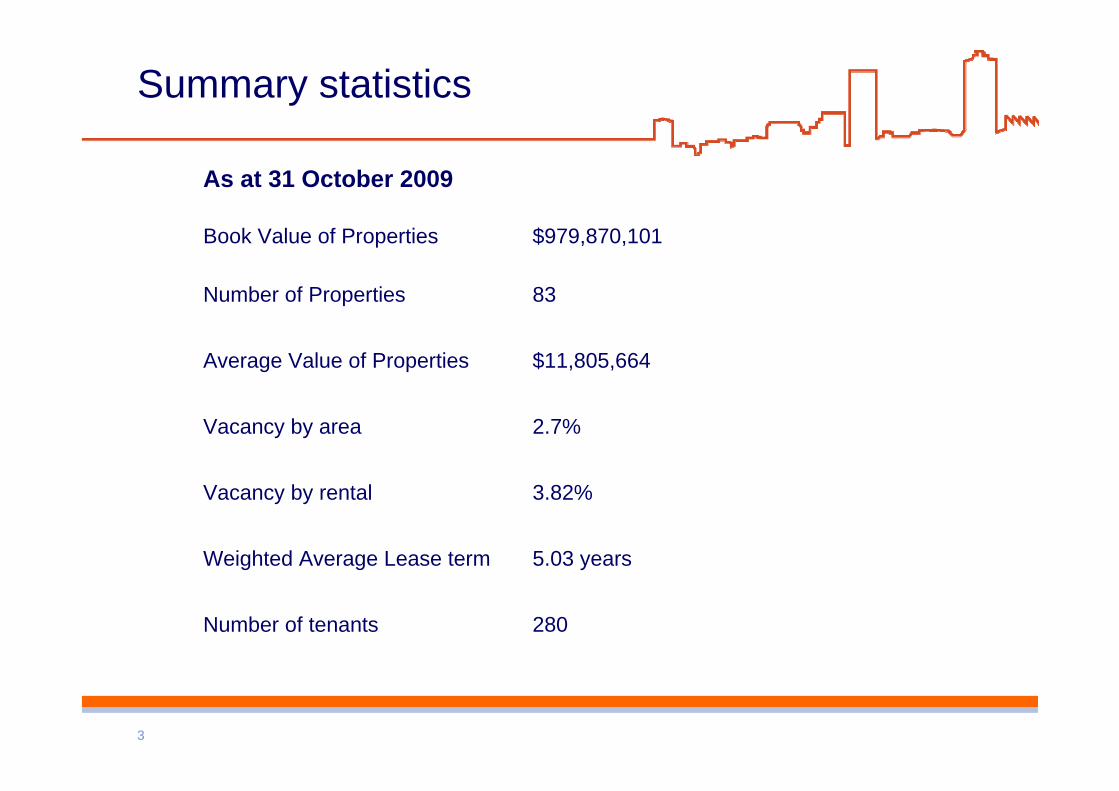
Summary statistics
280Number of tenants
5.03 yearsWeighted Average Lease term
3.82%Vacancy by rental
2.7%Vacancy by area
$11,805,664Average Value of Properties
83Number of Properties
$979,870,101Book Value of Properties
As at 31 October 2009
4
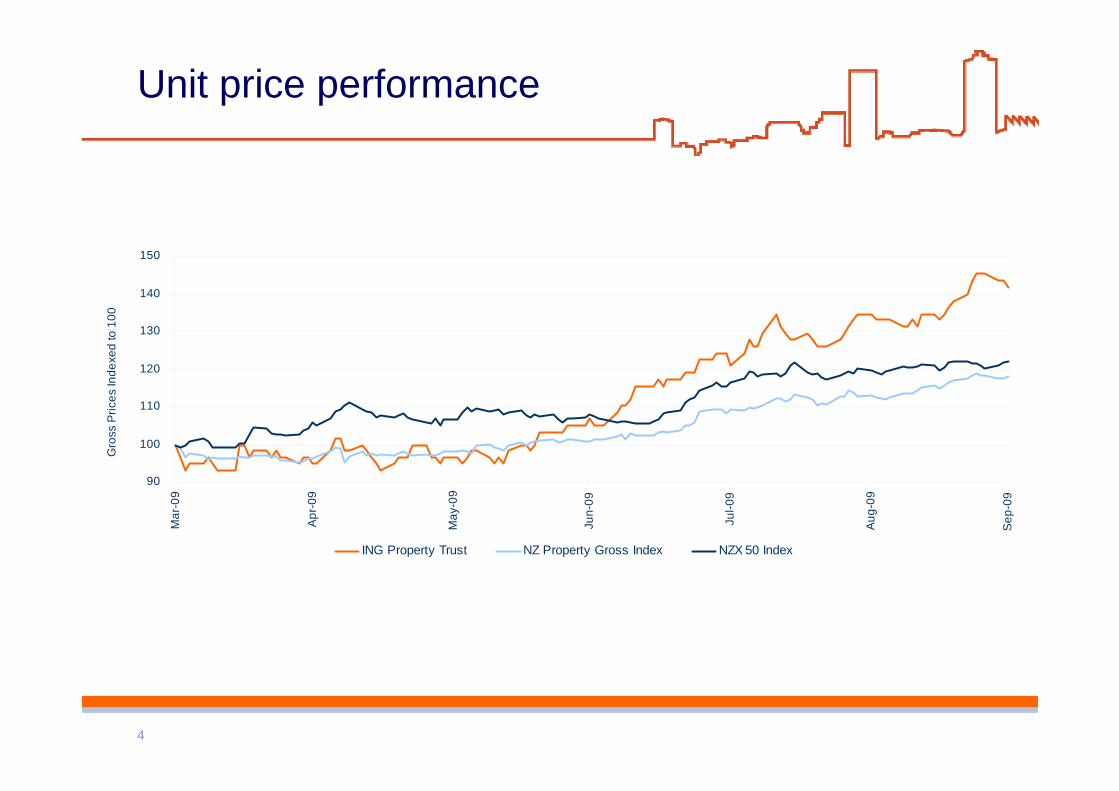
Unit price performance
90
100
110
120
130
140
150
Mar
-09
Apr
-09
May
-09
Jun-
09
Jul-0
9
Aug
-09
Sep
-09
Gro
ss P
rices
Inde
xed
to 1
00
ING Property Trust NZ Property Gross Index NZX 50 Index
5
Portfolio overview

6
Strategy
» Risk mitigation
» Debt Reduction
» Portfolio positioning for the future

7
Diversification
71%
10%
16%
3%
Auckland
Hamilton
Wellington
Regional
36%27%
37%
Office
Industrial
Retail
By sector By region
8
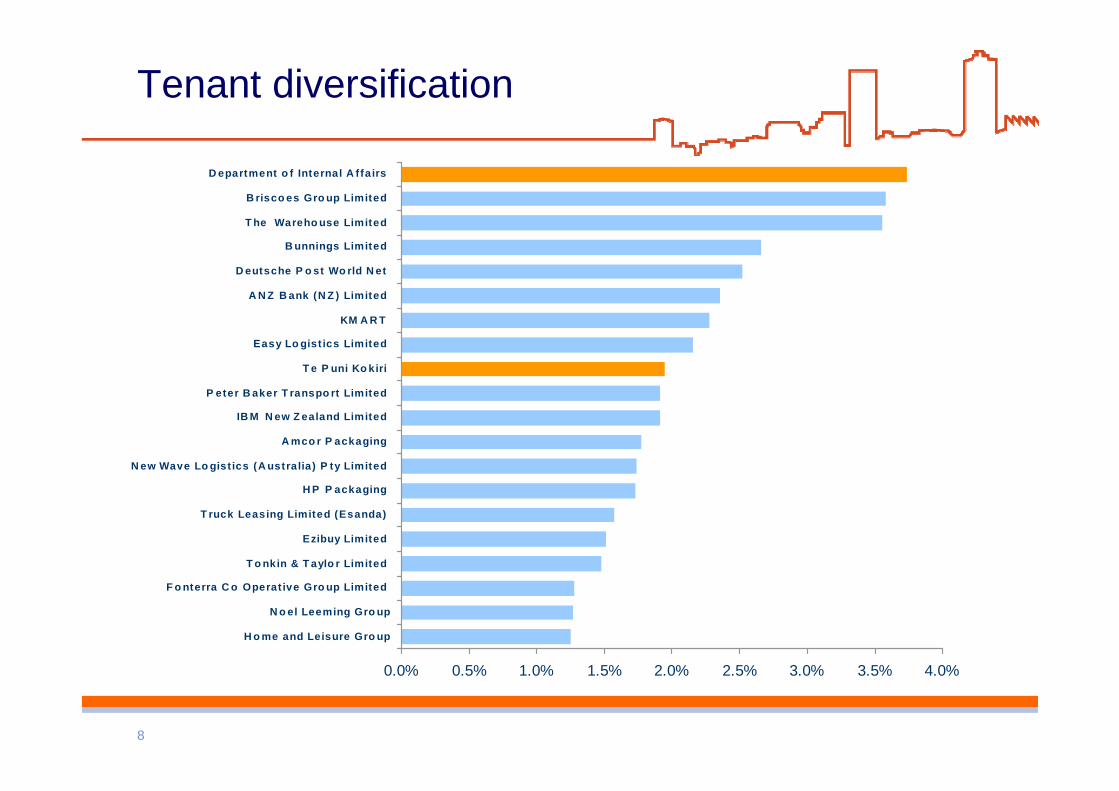
Tenant diversification
0.0% 0.5% 1.0% 1.5% 2.0% 2.5% 3.0% 3.5% 4.0%
H o me and Leisure Gro up
N o el Leeming Gro up
F o nterra C o Operat ive Gro up Limited
T o nkin & T aylo r Limited
Ezibuy Limited
T ruck Leasing Limited (Esanda)
H P P ackaging
N ew Wave Lo gist ics (A ustralia) P ty Limited
A mco r P ackaging
IB M N ew Z ealand Limited
P eter B aker T ranspo rt Limited
T e P uni Ko kiri
Easy Lo gist ics Limited
KM A R T
A N Z B ank (N Z ) Limited
D eutsche P o st Wo rld N et
B unnings Limited
T he Wareho use Limited
B risco es Gro up Limited
D epartment o f Internal A ffairs
9
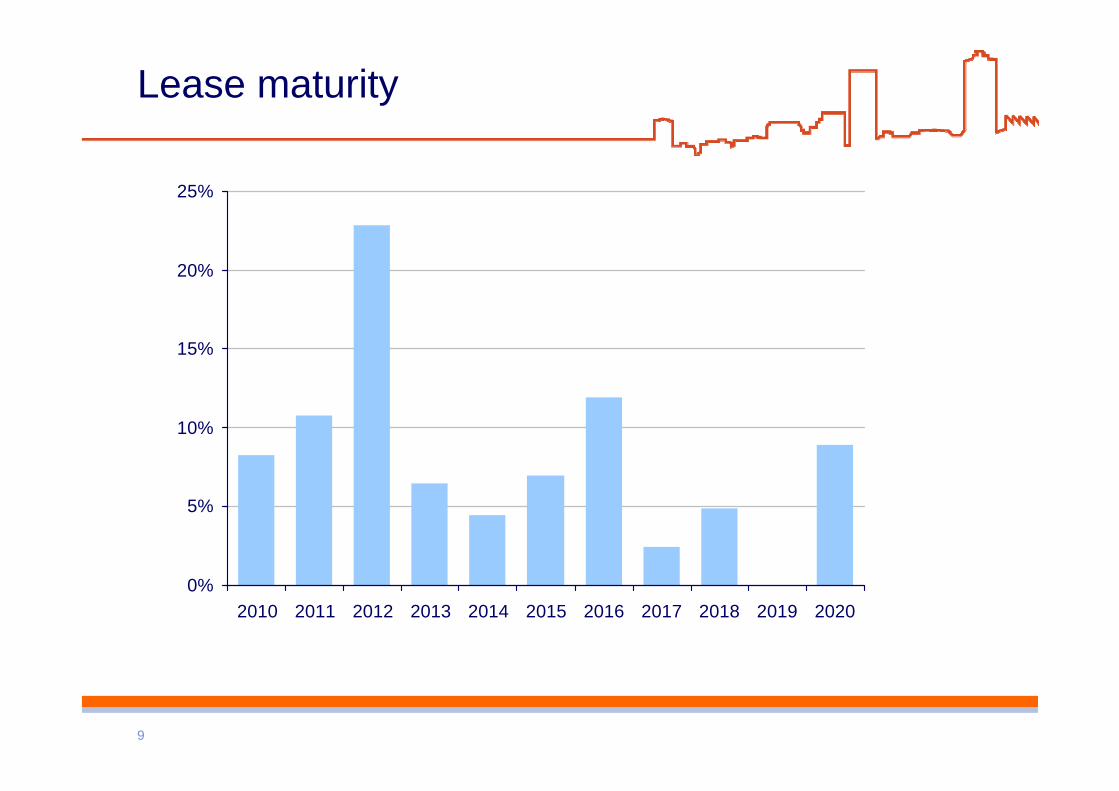
Lease maturity
0%
5%
10%
15%
20%
25%
2010 2011 2012 2013 2014 2015 2016 2017 2018 2019 2020

10
Property sales
102%$80,904,000$79,490,000
100%06 Dec 2009$13,700,000$13,700,000Croftfield Lane, Auckland
100%20 Jan 2010$4,050,000$4,050,000Khyber Pass Road (vacant)
100%20 Jan 2010$3,700,000$3,700,000Khyber Pass Road (vacant)
105%11 Jan 2010$2,000,000$1,900,00Maui Street, Hamilton (pending vacancy)
100%31 Mar 2010$6,850,000$6,850,000Port Hills Road, Christchurch
101%02 Nov 2009$1,750,000$1,730,000Maui Street, Hamilton (vacant)
100%30 Sep 2009$3,550,000$3,550,000Cryers Road, Auckland (pending vacancy)
103%11 Sep 2009$1,850,000$1,800.000Maui Street, Hamilton
100%21 Aug 2009$5,000,000$5,000,000Sir William Drive, East Auckland
99%31 Aug 2009$7,000,000$7,060,000Great South Road, Auckland (vacant)
112%03 Aug 2009$10,000,000$8,950,000Annie Huggan Grove, Wellington
100%31 Jul 2009$7,600,000$7,600,000London Street, Hamilton
100%01 Dec 2009$6,000,000$6,000,000Cavendish Drive, Manukau
103%19 Jun 2009$7,854,000$7,600,000College Hill, Auckland (pending vacancy)
Proportion of book value
Settlement date or expected settlement
dateSale PriceMarket value as
at 31/03/09Property

11
Positioning the portfolio for the future
» 18 new leases
» 27 lease extensions
» Sales of vacant property
» Sale of higher risk property

12
New lease to Dick Smith
» Eight year lease term
» Building upgrade at a cost of $2.15m
» Projected profit $700,000 at 8.5% cap
» Commences three months following vacation by Kmart

13
Valuations
» Sales show stability
» No requirement for interim valuation assessment
» Average size grants ability to transact in liquid part of the market
» There is a strong body of evidence to provide confidence in values
» Devaluation of Albany Block E assets

14
Manawatu Business Park
» Asset remains sound and activity is still a possibility
» Joint venture partner faces some challenges
» Good interest in the assets
» Agreement to sell $7m of investment property and $7.9m of vacantland

15
Financial overview

16
Financial performance
0.05(1.06)Post tax earnings per units (cents)$ 12.8m$(10.6m)$ 2.2m(Loss)/profit for the period - Comprehensive
$14.2m
-$ 0.1m
$13.6m
$ 1.5m
Revaluation losses – on investment property
- on construction
25.4%$18.0m$13.5mInterest expense
$ 1.9m$ 2.8m$ 0.9mCurrent taxation$ (6.8m)$ 5.7m$(1.1m)(Loss)/profit before income tax
$ 1.8m$ 7.3mLoss on derivatives
-6.3%$43.7m$40.9mNet rental income
$ 0.3m
$39.4m
HY09
$ (5.9m)
-12.7%
Change
$(5.6m)
$34.4m
HY10
(Loss)/profit for the period
Operating surplus (pre disposals, revals & tax)

17
Gross rental income
46.2
5.22.4
44.0
1.30.7
30.0
32.0
34.0
36.0
38.0
40.0
42.0
44.0
46.0
48.01H
09 G
ross
Ren
t
Sold
by
Mar
'09
Sold
by
Sept
'09
Ren
tin
crea
ses
E Bl
ock
1H10
Gro
ssR
ent
Dol
lars
(m)
In the period 30 September 2008 to 30 September 2009 there has been $150m of property sales settled. The following highlights the impact this has had on Gross Rental Income:

18
Interest rate management
» The Trust current interest rate hedge is 63% of its debt.» The interest rate paid (including margins and fees) in the first six
months of FY2010 was 6.36% (compared with 7.25% in 1H09).» The duration of the hedge portfolio is 4.3 years
Hedge expiry by year
17.0%
5.7% 7.6% 7.6%11.3%
17.0%
34.0%
0.0%
10.0%
20.0%
30.0%
2010 2011 2012 2013 2014 2015 2016

19
Distributable income
$(0.1m)$1.5mRevaluations losses/(gains) – construction$(0.4m)$0.1mInvestment disposal gains/(losses)
$1.8m$7.3mDerivative fair value adjustment$0.7m$0.7mManagement rights amortisation
4.28c4.13cGross distributable income per unit (cents)
$14.2m$13.6mRevaluations losses/(gains) – propertyAdjust for:
$21.9m$21.9mGross distributable income -$2.8m-$0.9mCurrent tax
$5.7m$(1.1m)(Loss)/profit before income tax
$19.0m$21.0mNet distributable income
3.73c3.95cNet distributable income per unit (cents)
HY09HY10

20
Financial position
5.7%42.0%39.6%Debt-to-total-assets ratio
23.9%$431.8m$404.9mBank debt
-17.7%$1,223.3m$1,006.9mTotal property value
-16.5%$673.1m$561.7mUnitholders’ funds
0.9%526.2m534.2mSecurities on issue
-19.7%131.7c105.8cNet asset backing per unit (cents)
HY09 ChangeHY10

21
Gearing
31 March 2009 to 30 September 2009
30
35
40
31 M
ar'0
9
Prop
erty
Sale
s
Cap
ex
Swap
Rev
al
30 S
ept'0
9
Unc
ondi
tiona
lsa
les
$40m
Addi
tiona
lSa
les
Gea
ring
%
Post 30 September 2009

22
Thank you