Hauchecorne a 20150707_1700_upmc_jussieu_-_amphi_astier
11
Update of stratospheric temperature interannual variability and trends from space sounders and ground-based lidars observations. Alain Hauchecorne 1 , Philippe Keckhut 1 , Chantal Claud 2 , Beatriz Funatsu 2,3 , Sergey Khaykin 1 , Guillaume Angot 1 , Pauline Maury 2 (1) LATMOS/IPSL, UVSQ, UPMC, CNRS, Guyancourt, France (2) LMD/IPSL, Ecole Polytechnique, ENS, UMC, CNRS (3) LETG-Rennes-COSTEL, Université de Rennes, CNRS
-
Upload
ingrid-le-ru -
Category
Science
-
view
163 -
download
0
Transcript of Hauchecorne a 20150707_1700_upmc_jussieu_-_amphi_astier

Update of stratospheric temperature interannual variability and trends from space
sounders and ground-based lidars observations.
Alain Hauchecorne1, Philippe Keckhut1, Chantal Claud2, Beatriz Funatsu2,3, Sergey Khaykin1, Guillaume
Angot1, Pauline Maury2
(1) LATMOS/IPSL, UVSQ, UPMC, CNRS, Guyancourt, France
(2) LMD/IPSL, Ecole Polytechnique, ENS, UMC, CNRS (3) LETG-Rennes-COSTEL, Université de Rennes, CNRS

IPCC-AR5 2014

AMSU data Advanced Microwave Sounding Unit On board NOAA, AQUA and MetOp satellites since 1998
NDACC Rayleigh lidar data • Observatoire de Haute-Provence,
OHP, 44N, 6E • Table Mountain, TMF, 34N, 118 • Mauna Loa, MLO, 19N, 156W
Les cookies assurent le bon fonctionnement de nos services. En utilisant ces derniers, vousacceptez l'utilisation des cookies.
En savoir plus OK
Page 2
Page 3
377 × 271 sat.ltu.se
Web Images Vidéos Actualités Maps Outils de recherchePlus SafeSearch
amsu Connexion
SSU Stratospheric Sounding Unit 1979-2006

ARISE 1 (2012-2014)
ARISE 2 (2015-2018)
Atmospheric dynamics Research InfraStructure in Europe Infrastructure Design Study funded by FP7 and H2020 programs, coord. Elisabeth Blanc, CEA
Project objective: Better understanding of the dynamics
of the troposphere-stratosphere-mesosphere exchanges
including contribution of gravity waves (GW) and planetary waves (PW).

Validation of ECMWF operational data at OHP Le Pichon et al., 2015
Impact of the 11-year solar cycle Li et al., 2011
MLO TMF OHP

January 2013 stratospheric warming
SSW
cooling
warming
Figure 1. Combined time series of GW Ep from Rayleigh lidar at OHP (44° N, 6° E) and
COSMIC (5° × 5° domain centered at OHP). White areas represent the missing data. a) Monthly-
mean Ep (color map) and zonal wind (solid contours - westerly winds of 30 and 80 m/s, dotted
contour - zero wind, dashed contour - easterly wind of 10 m/s). b) Weekly means of Ep from
COSMIC and lidar (color map) and monthly means of MERRA Ep (gray-scaled contours, denoting
0.2, 0.3, 0.5, 1, 2, 4, 6 uni ts of J kg-1
).
Figure 2. Same as Fig. 1b for the period October 2012 – April 2013.
a)
b)
Gravity wave potential energy lidar + COSMIC-RO
SSW
950 K
475 K
Infrasound signal
OHP Rayleigh lidar profile
Acc
epte
d A
rtic
le
Figure 10: COSMIC CPT temperature anomalies averaged over January 2008,
January 2010 and January 2013.
This article is protected by copyright. All rights reserved.
Evan et al., 2015 Tropical Temp anomaly

OHP
TMF
MLO

Rayleigh lidar vs AMSU temperature trend
Full period
Since 2012
MLO TMF OHP

Stratospheric temperature trend AMSU 2002-2014

Tropical stratospheric trend COSMIC –RO 2006-2014
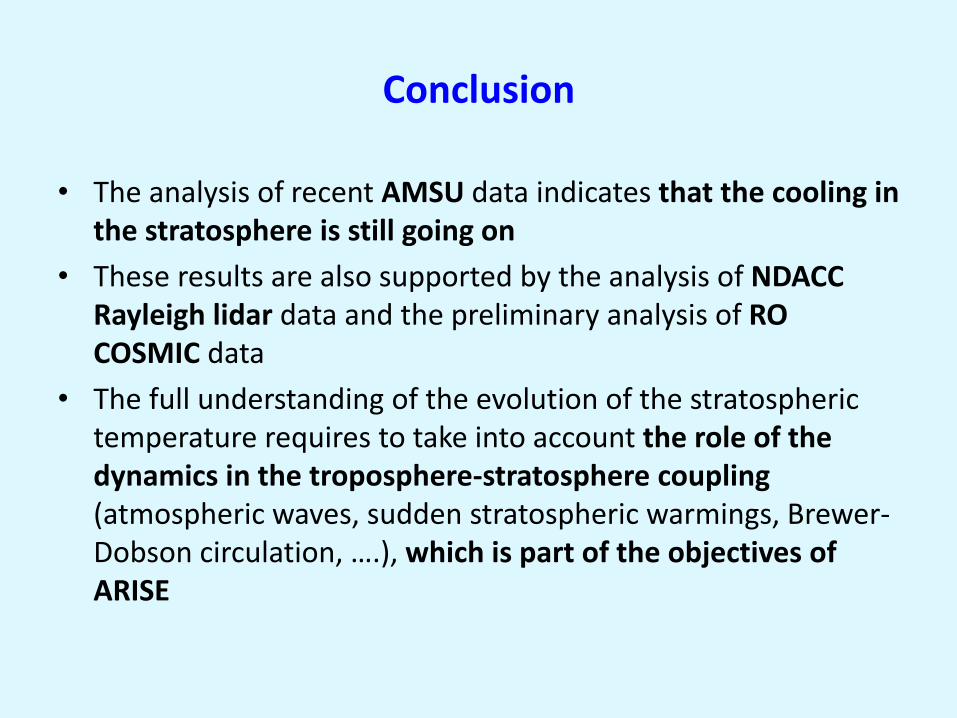
Conclusion
• The analysis of recent AMSU data indicates that the cooling in the stratosphere is still going on
• These results are also supported by the analysis of NDACC Rayleigh lidar data and the preliminary analysis of RO COSMIC data
• The full understanding of the evolution of the stratospheric temperature requires to take into account the role of the dynamics in the troposphere-stratosphere coupling (atmospheric waves, sudden stratospheric warmings, Brewer-Dobson circulation, ….), which is part of the objectives of ARISE