Zolina o 20150707_1700_upmc_jussieu_-_room_107
18
Olga Zolina Laboratoire de Glaciologie et Géophysique de l’Environnement Université Joseph Fourier, Grenoble, France P.P.Shirsov Institute of Oceanology RAS, Moscow, Russia Changes in continental water cycle and extreme events Outline: Hydroclimate extremes and extreme precipitation Precipitation extremes: definitions, measures and data requirements Absolute extremes: impacts on hydroclimate Precipitation timing: implications for hydroclimate extremes Scaling of extreme precipitation: data and model issues
-
Upload
ingrid-le-ru -
Category
Science
-
view
137 -
download
0
Transcript of Zolina o 20150707_1700_upmc_jussieu_-_room_107

Olga Zolina
Laboratoire de Glaciologie et Géophysique de l’Environnement Université Joseph Fourier, Grenoble, France
P.P.Shirsov Institute of Oceanology RAS, Moscow, Russia
Changes in continental water cycle and extreme events
Outline:
Hydroclimate extremes and extreme precipitation
Precipitation extremes: definitions, measures and data
requirements
Absolute extremes: impacts on hydroclimate
Precipitation timing: implications for hydroclimate extremes
Scaling of extreme precipitation: data and model issues

Impacts of extremes: summer 2010
H500 height 30.07.2010 – 10.08.2010
Polland, SE Germany, Czech Rep.
Central Russia
Pakistan

Convective precipitation
Stratiform precipitation
space scale & spatial resolution, kilometers 0.1 1 10 100 1000
0.01 0.01
0.1
1
10
100
tim
e s
ca
le &
te
mp
ora
l r
eso
luti
on
, h
ou
rs
Climate models
Reanalyses
Mesoscale models
Daily rain gauge data
HR (10-min to hourly station data)
50+ years
10-50 years
>1-10 years
Periods of availability
Radars
Reanalyses
Spatial data resolution
Convective precipitation
Space time scales and data availability
Satellites
Stratiform precipitation

0 10 20 30 40 50 60 70 80 90days
0
10
20
30
40
50
mm
/day
0
10
20
30
40
50
Absolute
extremes
Relative extremes
(extremeness)
Time-integrated
extremes
•Peaks over threshold •Indices •Percentiles of the theoretical PDFs
Contribution of the wettest
days to totals
Wet spell durations and associated intensities
Approaches for estimating precipitation extremes
Autumn, 2012
10
Absolute extremes Nenastnaja (altitude 1186m)
Distance between
stations is ~100km
Shira (altitude 468m)
Relative extremes:
Nenastnaja: 3 days, R95pTOT=12.7%
Shira: 0 days, R95pTOT=0%
95% for 1966-2012 =27.2 mm/day
95% for 1966-2012 =10.7 mm/day
4 days
total=7mm
intensity=1.7mm/day
Wet spells
12 days
total=85mm
intensity=7.1mm/day

Changes in precipitation total may not necessarily imply same changes in precipitation extremes
Trends in annual precipitation 1951-2010
CRU GHCN GPCC
IPCC, 2013
What is «more wet» in practice?
Higher precipitation total with no (or opposite) change in extremes
No (or downward) change in precipitation total with growing extremes
No change in precipitation totals and extremes with growing fraction of total due to extremes
No (or minor) change in precipitation total and extremes with more prolonged wet spells

Absolute precipitation extremes: observed changes in 95% percentile of precipitation
1951-2008
Zagreb
95th percentile
mean intensity
Changes in absolute extremes differ from those in totals
-
10
0
to
-7
-
7
to
-6
-
6
to
-5
-
5
to
-4
-
4
to
-3
-
3
to
-2
2
to
3
3
to
4
4
to
5
5
to
6
6
to
7
7
to
1
00
30
40
50
60
70
-10 0 10 20 30 40 50 60
-10 0 10 20 30 40 50 60
30
40
50
60
70
30
40
50
60
70
-10 0 10 20 30 40 50 60
-10 0 10 20 30 40 50 60
30
40
50
60
70
30
40
50
60
70
-10 0 10 20 30 40 50 60
-10 0 10 20 30 40 50 60
30
40
50
60
70
30
40
50
60
70
-10 0 10 20 30 40 50 60
-10 0 10 20 30 40 50 60
30
40
50
60
70
<-7
-7 -
-6
-6 -
-5
-5 -
-4
-4 -
-3
-3 -
-22
- 33
- 44
- 5 5 - 6
6 - 7 >7
(a) (b)
(c) (d)
WPOct-Mar
WPApr-Sep
DPOct-Mar
DPApr-Sep
% per decade
significant at 95% level
Zolina et al. 2005, Geophys. Res. Lett.
winter

Bonn-Friesdorf
December 1994 January 1994 February 1994
December 1967 January 1967 February 1967
Total precipitation = 211 mm
Number of wet days = 50 days
Number of wet periods = 7
Number of dry periods = 8
Longest wet period = 37 days
What is precipitation timing?
Russian Far East August-September 2013
Altai June 2014
0
4
8
12
16
20
24
mm
/day
0
4
8
12
16
20
24
mm
/day
Total precipitation = 224.5 mm
Number of wet days = 27 days
Number of wet periods = 15
Number of dry periods = 16
Longest wet period = 4 days

Changes in the duration of European wet periods
normalized occurrence anomalies
Net effect of the number of wet days (Monte-Carlo simulation of the growing
number of wet days, % per decade)
1% 2% 3%
0.17±0.10 0.31±0.19 0.47±0.25
It is not the effect of changing number of wet days!
long
spells
short
spells
95% level statistical significance
negative
positive
Maximum real increasing in the number
of wet days is 2.6% per decade
Mean real increasing in the duration of
wet spells is 4% per decade
Zolina et al. 2010, GRL

Red is for positive Green is for negative
Where changes in the duration of wet spells and dry spells have the same sign?
October-March April-September
Beads with a fixed number of stones
Zolina et al. 2013, J. Climate
wet day
dry period

Hydroclimate extremes: scaling
The peak appearance of the disastrous floods is typically highly localized extreme precipitation acts locally in space and in time this what makes it different from heavy precipitation
“extreme” depends on the scale
Sochi, Russia 25 June 2015
More than 240 mm dropped within 24 hours 120 mm were falling within 2-hour period

27 km
9 km
1 km
Scaling of extreme precipitation: flooding in Krymsk, Russia
0.8
1.6
2.5
3.3
4.2
5.0
5.8
6.6
7.5
8.3
mm
/5 m
inu
tes
Hourly precipitation for 6 and 7 July 2012 WRF real time simulation
Domain configuration Gelendgik 6-7 July 2012

Scaling of extreme precipitation
20-year seasonal return values ECHAM5 1982-2010
mm/day spatial length scale (°lat/lon)
20-y
r re
turn
val
ues
(m
m/d
ay)
Northern Europe DJF T213 L31 JJA T31 L19 JJA
ECHAM5 T213 L31 JJA EOBS JJA
Volosciuk et al. 2015
mm/day

High resolution precipitation climatology and extreme precipitation over Germany
Task: Long-term homogenized gridded daily precipitation for Germany for 1931 – 2012 with resolutions from 0.1° to 0.5°
Control and preprocessing of 7000+ daily long-term records Different objective analysis methods (KR, LP, GKA and more) Estimation of all sources of errors and uncertainties
STAMMEX-KR (1950-2008)
STAMMEX-KR (1950-2000)
STAMMEX-GCA (1950-2008)
E-OBS (1950-2008)
99% precipitation, 1951-2010 0.25°
STAMMEX-KR (1950-2008)
STAMMEX-KR (1950-2000)
STAMMEX-GCA (1950-2008)
E-OBS (1950-2008)
East German flood, August 2002
Zolina et al., 2014 BAMS

Conclusions
Most of Central and Northern Europe becomes wetter over changing climate, however: Extremes may not necessarily follow tendencies in precipitation totals
Precipitation timing is critically important for understanding the nature of hydroclimate extremes Europe exhibits lengthening of both wet and dry spells due to regrouping of wet days and longer wet spells associated with more abundant rainfalls
To establish more truth in understanding changes in continental water cycle close look on precipitation scaling problem is important for what we need: (i) Seamless (across the scales) modelling efforts from mesoscales to climate scales (ii) New (at least regional) data sets resolving precipitation on minute to hourly scales in time and several kilometers in space
This is a challenge for national metoffices, because many of them operate such networks, but do not make them openly available, thus putting populations of their own nations on risk.

Conclusions
20 km
20 km
European Climate Assessment & Dataset
public data
non-public data
Global Precipitation Measurement (GPM)


Seasonality in extreme precipitation trends
10 20 30 40 50 60 70 80 90 100
P r e c i p i t a t i o n c l a s s e s ( % )
-5
-4
-3
-2
-1
0
1
2
3
4
5
L i n
e a r t r
e n d ( %
)
10 20 30 40 50 60 70 80 90 100
P r e c i p i t a t i o n c l a s s e s ( % )
-5
-4
-3
-2
-1
0
1
2
3
4
5
L i n
e a r
t r e n d ( %
)
-
10
0
to
-7
-
7
to
-6
-
6
to
-5
-
5
to
-4
-
4
to
-3
-
3
to
-2
2
to
3
3
to
4
4
to
5
5
to
6
6
to
7
7
to
1
00
30
40
50
60
70
-10 0 10 20 30 40 50 60
-10 0 10 20 30 40 50 60
30
40
50
60
70
30
40
50
60
70
-10 0 10 20 30 40 50 60
-10 0 10 20 30 40 50 60
30
40
50
60
70
30
40
50
60
70
-10 0 10 20 30 40 50 60
-10 0 10 20 30 40 50 60
30
40
50
60
70
30
40
50
60
70
-10 0 10 20 30 40 50 60
-10 0 10 20 30 40 50 60
30
40
50
60
70
<-7
-7 -
-6
-6 -
-5
-5 -
-4
-4 -
-3
-3 -
-22
- 33
- 44
- 5 5 - 6
6 - 7 >7
(a) (b)
(c) (d)
WPOct-Mar
WPApr-Sep
DPOct-Mar
DPApr-Sep
winter summer
Zolina et al. 2008, J. Geophys. Res.
winter summer
Germany: strong seasonality
% per decade
Linear trends in absolute extreme precipitation
1951-2008
-
10
0
to
-7
-
7
to
-6
-
6
to
-5
-
5
to
-4
-
4
to
-3
-
3
to
-2
2
to
3
3
to
4
4
to
5
5
to
6
6
to
7
7
to
1
00
30
40
50
60
70
-10 0 10 20 30 40 50 60
-10 0 10 20 30 40 50 60
30
40
50
60
70
30
40
50
60
70
-10 0 10 20 30 40 50 60
-10 0 10 20 30 40 50 60
30
40
50
60
70
30
40
50
60
70
-10 0 10 20 30 40 50 60
-10 0 10 20 30 40 50 60
30
40
50
60
70
30
40
50
60
70
-10 0 10 20 30 40 50 60
-10 0 10 20 30 40 50 60
30
40
50
60
70
<-7
-7 -
-6
-6 -
-5
-5 -
-4
-4 -
-3
-3 -
-22
- 33
- 44
- 5 5 - 6
6 - 7 >7
(a) (b)
(c) (d)
WPOct-Mar
WPApr-Sep
DPOct-Mar
DPApr-Sep
% per decade
winter
summer
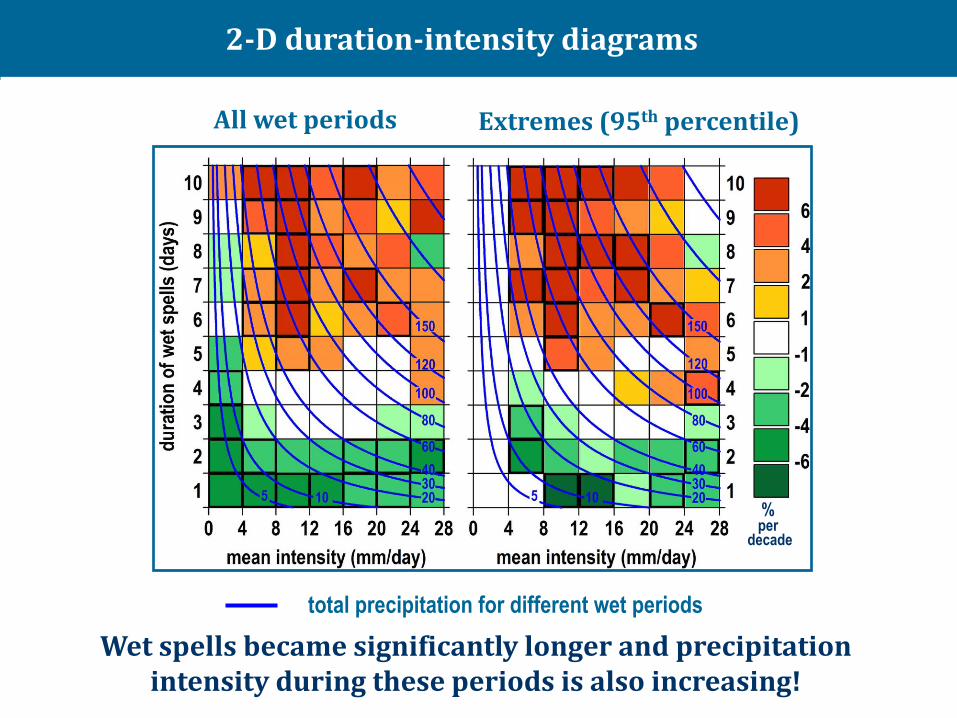
2-D duration-intensity diagrams
All wet periods Extremes (95th percentile)
% per
decade
total precipitation for different wet periods
Wet spells became significantly longer and precipitation intensity during these periods is also increasing!