Financial Statements 2018 - Rohm*4. MOSFET (Metal Oxide Semiconductor Field Effect Transistor) A...
42
Financial Statements 2018 ROHM Co., Ltd.
Transcript of Financial Statements 2018 - Rohm*4. MOSFET (Metal Oxide Semiconductor Field Effect Transistor) A...
Financial Statements 2018
ROHM Co., Ltd.

CONTENTS
Management Policies........................................ 1
Eleven-Year Summary ....................................... 10
Consolidated Balance Sheet.................................... 12
Consolidated Statement of Income ............................... 14
Consolidated Statement of Comprehensive Income...................... 15
Consolidated Statement of Changes in Equity.......................... 16
Consolidated Statement of Cash Flows.............................. 17
Notes to Consolidated Financial Statements........................... 18
Independent Auditors’ Report................................... 39

1
Management Policies
(1) ROHM’s Basic Management Policy
The ROHM Group believes that, in creating and improving our overall corporate value, promoting the development of innovative products
and high-quality manufacturing within our corporate business activities will both improve customer satisfaction and contribute to society.
Those results will in turn boost employee confidence and pride, and inspire new challenges. Moreover, the added-values created by these
business activities should be allocated in appropriate proportions to all constituents, including shareholders, employees, and stakeholders of
local communities, while retained earnings should be allotted to business investment and efforts to increase competitive strength. To pursue
this objective, it is also crucial to obtain the understanding and cooperation of all those with a stake in the company’s performance.
Therefore, since making the ROHM Group more attractive to stakeholders is one of the important missions of company management, these
activities are incorporated into operations throughout the ROHM Group and seriously undertaken for the CSV (Created Shared Value) they
deliver.
With these perspectives, the ROHM Group has committed itself to developing market-leading products. As a fundamental policy, the Group
pursues a stable supply of high quality, cost-competitive products in high volume through optimal utilization of its distinctive production
technologies that will help to maintain a leading position in the global semiconductor and electronic components market.
(2) Mid-to Long-term Corporate Strategies
<1> ROHM’s 4 Growth Solutions
①Analog Solutions
With car electronics evolving at lightning speed and IoT(*1) reaching new bounds, the ROHM Group will be developing advanced analog
solutions, such as high-performance power management ICs incorporated with digital control capabilities and multifunctional LED driver
ICs. We will also expand the reference business in and around the automotive and industrial equipment markets by cooperating with leading
processor manufacturers.
*1. IoT (Internet of Things)
A technological scenario in which all sorts of equipment and appliances connect to the internet and control each other by exchanging
information.
②Power Solutions
Because of the growing needs to conserve and more efficiently use energy, the ROHM Group had been developing and strengthening
lineups of SiC devices of smaller sizes and greatly reduced power loss compared to conventional Si semiconductors. These products have
been adopted for a variety of applications centered around the automotive and industrial equipment markets. We will, therefore, continue
promoting the best power solutions for customers by combining our core analog power technologies with high-performance power ICs,
driver ICs, IGBT(*2)s, power MOSFETs, etc.
*2. IGBT (Insulated Gate Bipolar Transistor)
A bipolar transistor (*3) that lessens the operating resistance by incorporating a MOSFET (*4) for the gate. Suited for high current
switching, IGBTs are often used for power control applications.
*3. Bipolar transistor
A 3-terminal semiconductor that structures N-type and P-type semiconductors into either P-N-P or N-P-N junctions. Bipolar transistors are
widely used in electronic devices for current amplification/switching and other signal processing tasks.
*4. MOSFET (Metal Oxide Semiconductor Field Effect Transistor)
A type of field-effect-transistor that enables faster switching with less power consumption than bipolar transistors, and is widely used in a
variety of electronic products.
③Sensor Solutions
The market for sensor-related devices is expanding on the increased use of detection technologies, therefore the ROHM Group will be
applying its production technologies and sensor control technologies to strengthening lineups of sensor-related devices such as MEMS
accelerometer sensor, ambient light sensor, geomagnetic sensor and thin film piezo devices(*5). Moreover, we will address the diversity of
IoT needs and other markets by combining these devices with wireless communication and control technologies.

2
Management Policies
*5. Thin firm piezo devices
Piezo devices convert applied pressure into voltage and vice-versa. They are used for sensors and other oscillation circuits.
④ Mobile Solutions
With smartphones trending towards increasingly higher functionality and wearable electronics markets growing, the ROHM Group will be
using the broad scope of technologies we have fostered as a semiconductor manufacturer to develop the world’s smallest devices, which will
include upgrading our lineups of products in our innovative RASMID ® series(*6) of components that deliver both dramatic miniaturization
and ultra-high dimensional precision of size.
*6. RASMID® (ROHM Advanced Smart Micro Device) Series
The smallest lineup of components in the world, developed utilizing breakthrough manufacturing methods for unprecedented miniaturization and ultra high dimensional precision (±10μm). <2> Enhancement Strategies for the Automotive, Industrial Equipment and New Markets The automotive market, which is seeing increased computerization, and the industrial equipment market, which continues to grow
at a steady pace, require a stable supply of high quality, high reliability products – all of which the ROHM Group can extremely provide. In the automotive and industrial equipment markets, ROHM aims to raise its sales by strengthening its production systems. Also, in the IoT and other markets where growth is expected, the ROHM Group will aggressively reclaim markets by making use of the semiconductor technologies that it has cultivated. <3> Sales Enhancement Strategy for Overseas Customers ROHM is strengthening sales activities to capture and keep overseas customers not only in Europe and the USA but also in Asia
and other emerging countries where markets are growing and globalizing rapidly. We are building systems to cover the full gamut of services from product configuration to development, sales and technical support, which will enable us to meet a wide range of needs of overseas customers and achieve our aim of increasing both sales and shares of overseas markets. <4> Production Innovation To stably grow our business over the mid- to long-term, the ROHM Group will be configuring its network of production sites to
quickly supply products all around the world. We will also be using RPS activities(*7) to reduce waste and enhance efficiency, and will be looking to strengthen cost competitiveness by shortening lead-times and further improving quality in all aspects of operations. Moreover, to make “Zero Defects” a reality, we will be developing technologies and investing in equipment needed to build a state-of-the-art quality management system. *7 RPS (ROHM Production System) activities A production system centered on improvement activities for integrating higher quality into products, shortening lead time and thoroughly eliminating waste in inventory and other operations at all Group plants. ROHM believes that establishing production systems of unparalleled efficiency and quality is essential for strengthening the Group’s earning structure.

3
(3) Status of Corporate Governance Corporate Governance System ① Status of Efforts to Improve the Internal Control System Enhancing our internal control system is one of the most important management topics. The ROHM Group is committed to maintaining
proper business processes throughout the entire group, thereby fulfilling our corporate social responsibility requirements. We will promote
our basic policies and conduct maintenance activities to build our internal control system while taking note of the following points.
1. System for ensuring that corporate Directors perform their duties in compliance with established laws, regulations, and our Articles of
Incorporation
(a) In order to promote further progress of globalization, ROHM Group will not only comply with laws and regulations but also support the
10 principles of the United Nations Global Compact for a wide range of problems in the areas of human rights, labor, the environment,
anti-corruption, etc. and to contributing to solve these social challenges (Sustainable Development Goals) through ROHM's products,
technology, and services. And ROHM will promote the management focusing on CSR confirmed “ISO26000,” the international standards
for social responsibility and complied with the Code of Conduct of the Responsible Business Alliance(RBA).
(b) Directors should perform their duties based on the in-house regulations such as “ROHM Group Business Conduct Guidelines” and the
Basic Rules of the Board of Directors and ensure the compliance with all applicable laws and regulations as well as the Articles of
Incorporation
(c) The Director or Directors who are highly informed in a specific field should be responsible for the duties related to such field, while all
Directors should hold discussions and monitor each other on a daily basis concerning the respective individual fields.
(d) Should a Director be found having committed an illegal act by another Director or a Company Auditor, it should be promptly reported to
the Board of Directors and the Board of Company Auditors.
(e) In addition to two Outside Directors, five Outside Company Auditors should regularly hold the meeting to exchange information and
opinions with each other and constantly check that Directors perform their duties in compliance with all applicable laws and regulations as
well as the Articles of Incorporation.
(f) The Compliance Hotline (the internal hotline system (including the case where the hotline system independent from the management is
set up at an outside law firm) and hotline system for suppliers) should be deployed to the entire ROHM Group including overseas entities
to discover any illegal conduct of a Director and to prevent recurrence thereof.
2. System to save and control information related to Directors’ performance of duties
(a) Decisions regarding Directors’ performance of their duties, such as the minutes of general shareholders meetings, the minutes of the
meetings of the Board of Directors, executive proposals, business plans for individual fiscal years, etc., should be saved in writing. The
documents should be saved and controlled in compliance with all applicable laws and regulations as well as all in-house regulations.
(b) The directions and notices provided to Group companies or in-house divisions concerned shall be issued via email or in writing as a rule.
The directions and notices shall be saved so as to be inspected at any time by Directors and Company Auditors.
(c) Information related to Directors’ performance of duties should be kept and controlled duly by relevant sections or divisions concerned,
and the leak and unjust use of such information must be prevented by giving internal notice and information security training to all
employees to ensure that they are fully aware of and comply with such rule.

4
Management Policies
3. Rules and other systems to control the risk of loss
(a) Under the CSR Committee chaired by the President himself, Committees of Quality, Corporate Safety and Health, Risk
Management/BCM, Compliance, Information Disclosure, Environmental Conservation, etc. should be established as company-wide
cross-sectional committees. These committees will appropriately respond to various management issues and risks in each responsible area
by taking necessary measures, giving directions and solving problems.
(b) The Risk Management/BCM Committee should be organized to identify, analyze and control major risks that may occur in the course of
the performance of business operations. In order to avoid or minimize the effect of unforeseeable circumstances such as sudden natural
disasters as much as possible and enable the survival of our business as a consequence, the Risk Management/BCM Committee will verify
the activities of each section in charge of risk management, establish a business continuity plan and take any and all possible preliminary
measures or preparations across ROHM Group.
(c) As a corporate effort to eradicate antisocial groups, a Risk Management Office should be established in the Department of General
Affairs. The Office should cooperate and exchange information with external specialist organizations such as the police department,
promote specific actions and perform them thoroughly, to eradicate antisocial groups. In-house regulations should be established to
eradicate antisocial groups and should be strictly observed. All ROHM Group employees should be informed by way of the “ROHM
Group Business Conduct Guidelines”, as distributed to all employees, or by other means, that they must take a firm stand against
antisocial groups. Further, the necessity of taking a firm stand against antisocial groups should be communicated to all employees through
various in-house training sessions.
4. System to ensure that Directors perform their duties efficiently
(a) The Board of Directors should consist of a small number of Directors authorized to execute business operations to realize prompt
executive decision-making.
(b) The Board of Directors should have Directors who are highly experienced in different fields. The Board should divide duties to the
Director in charge of that certain field and have him/her perform the specific duties of that field.
(c) Issues that may have a considerable influence on corporate management should be examined, analyzed and reported by in-house project
teams established separately for individual issues. Upon completion of such examination, prompt decisions should be made by way of a
meeting of Board of Directors or executive proposals, as appropriate, based on the Articles of Incorporation and in-house regulations.
(d) The in-house written standards of in-house control procedures regarding various managerial issues such as risk control and information
control should be strictly observed.
(e) To increase the competitiveness of ROHM Group and to ensure a fair amount of profits, business performance targets should be
established as part of annual profit-raising projects for the entire ROHM Group and individual divisions, and progress and achievement
status of such projects and targets should be controlled.

5
5. System to ensure that employees perform their duties in compliance with all applicable laws and regulations as well as the Articles of
Incorporation
(a) The Compliance Committee should be organized and across-the-group compliance actions should be taken by implementing the “ROHM
Group Business Conduct Guidelines”. A compliance system of the Group companies should be created based on the system of our
company, and a leader for each division should be nominated as a leader to raise the awareness of the importance of compliance and to
ensure the ongoing compliance of each division.
(b) To cope with proprietary laws and regulations in a proper manner, not only the CSR Committee but also the Corporate Safety and Health
Committee, Compliance Committee, Information Disclosure Committee, and Environmental Conservation Committee, should be
committed to such actions as checking the status of compliance for the entire Group and performing ongoing educational activities.
(c) Under the control of the Information Disclosure Committee, individual sections and divisions should properly control insider information
and educate employees in the interest of and raising awareness of the importance of strict information handling, to prevent insider trading.
(d) The Compliance Hotline (the internal hotline system (including the case where the hotline system independent from the management is
set up at an outside law firm) and hotline system for suppliers) should be deployed to the entire ROHM Group including overseas entities,
to uncover any illegal conduct of an employee and to prevent any recurrence thereof.
6. System to ensure compliance of the Group’s corporate operations
(a) ROHM Group shares the corporate mission and policy, which are the basis of the founding spirit of the Company, and carries out the
business activities with the concerted efforts as the Group in order to enhance the corporate values of the entire Group.
(b) Each Committee under the Company’s CSR Committee should supervise and control Group companies comprehensively to ensure
proper execution of duties in each responsible area.
(c) Written standards applicable to the entire ROHM Group should be established and implemented.
(d) The compliant business operations of Group companies should be monitored by appointing employees of the Company or another Group
company to Group companies’ Board of Directors or Company Auditors.
(e) A system should be operated that requires the Board of Directors’ resolution or an executive decision at the Company to settle critical
issues at the Group companies level and periodical reports to the Company’s relevant divisions from Group companies should be made,
thus enabling to control Group companies.
(f) An internal control system that includes the Company and significant Group companies should be established and reinforced through a
framework that ensures financial reporting compliance and through efforts to conform to the auditing system.
(g) The Company’s internal auditing division under the direct control of the President should perform internal audits to check each Group
company’s situations of execution of duties, compliance with all applicable laws and regulations as well as in-house regulations, risk
management, etc.
7. Employees hired upon the request of a Company Auditor to assist the Company Auditor’s duties, independence of the employees from
Directors and to ensure effectiveness of the Company Auditor’s instruction to such employees
(a) The Company should, upon Company Auditor’s request, appoint staff employees with proper capabilities.
(b) The staff of Company Auditors should be independent of duties related to the execution of corporate business. In the employment,
transfer and evaluation of performance of Company Auditors’ staff, opinions from the Board of Company Auditors shall be respected.

6
Management Policies
8. System for Directors and employees of the Company and its subsidiaries to report to Company Auditors, other systems for reporting to
Company Auditors and system for employees not to be treated disadvantageously by the reason of such reports
(a) Should a Director be found to have committed an illegal conduct in the performance of Directors’ duties, any neglect in the obligation of
being duly conscious as good Directors, or any fact that may damage the Company considerably, etc. by another Director, it should be
promptly reported to the Board of Company Auditors.
(b) The meetings of committees, not only the CSR Committee but also the Risk Management/BCM Committee, Compliance Committee, and
Information Disclosure Committee should be attended by full-time Company Auditors as observers, and individual committees should
make periodical reports on their activities to the Company Auditors by submitting meeting minutes or by other appropriate means.
(c) A system should be retained whereby the status and results of business operations can be properly reported to Company Auditors through
executive proposals and reports.
(d) Directors and employees of the Company and Group companies should promptly make a necessary report if they are asked by Company
Auditors to make a report of their business operations.
(e) A section in charge of the Compliance Hotline should make periodical reports on situations and results thereof to Company Auditors.
(f) Employees that have reported to Company Auditors shall not disadvantageously treated by the reason of such reports according to
applicable laws and regulations as well as in-house regulations.
9. Other systems to ensure that the audits by Company Auditors are performed effectively
(a) Concerning the status of the operation of the internal control system, Directors should report to the Board of Company Auditors where
requested.
(b) The internal audit division should strengthen the collaboration with the Company Auditors and report the results of audit periodically.
(c) All Company Auditors should be Outside Company Auditors. The Board of Company Auditors should be a strongly independent group
consisting of diversified experts, including legal specialists, accounting specialists, and those who used to work for financial institutions.
(d) Company Auditors should exchange opinions with Directors whenever necessary.
(e) The expenses that Company Auditors deem to be necessary when they perform their duties should be borne by the Company.
② Outline of the Status of the Operation of the Corporate System to Ensure Proper Operation ROHM Group is striving to build the internal control system and properly operate it based on the aforementioned basic policies. The outline
of the status of the operation of the internal control system during the fiscal year ended March 31, 2018 is as follows:
1. Compliance system
(a) ROHM Group not only makes all Directors and employees fully aware of the “ROHM Group Business Conduct Guidelines” as their
codes of conduct to comply with when they practice the mission and policy such as “Company Mission” and “Management Policy” but
also thoroughly ensures that they act according to such Guidelines.
(b) ROHM Group regularly holds the Compliance Committee in order to formulate a plan to reinforce the compliance system, implement
education by rank and by role in accordance with the plan, send the message from the top concerning the compliance with the “ROHM
Group Business Conduct Guidelines,” etc.
(c) ROHM Group operates the internal hotline system to prevent compliance violations, discover violations early, and take appropriate
measures. ROHM Group also regularly reports the status of the operation to the Board of Directors and Company Auditors.
2. Risk management system
ROHM Group holds the Risk Management/BCM Committee as needed to identify, analyze and control major risks that may occur in the
course of the performance of business operations. Also, in order to avoid or minimize the effect of unforeseeable circumstances such as
sudden natural disasters as much as possible and enable the survival of our business as a consequence, the Risk Management/BCM
Committee verifies the activities of each section in charge of risk management, establishes a business continuity plan (BCP) and takes any
and all possible preliminary measures or preparations across ROHM Group.

7
3. Subsidiary management system
(a) ROHM Group manages Group companies by operating the system that requires the approval of the Company’s Board of Directors and
final decision on executive proposals regarding important projects in Group companies, and also by each division of the Company
regularly receiving the report with respect to the status of its operation.
(b) Based on an annual plan, the Company’s internal auditing division under the direct control of the President performs internal audits to
check each Group company’s situations of execution of duties, compliance with all applicable laws and regulations as well as in-house
regulations, risk management, etc., and confirms the compliance of business. Also, the results of audits are periodically reported to
Directors and Company Auditors.
4. Directors’ performance of duties
(a) The regular Board of Directors is held according to the annual plan and the extraordinary Board of Directors is held where necessary to
resolve matters stipulated in laws and regulations or Articles of Incorporation as well as matters which are important for management and
to mutually supervise the performance of Directors’ duties.
(b) Matters to be delegated to each Director are made clear in the Basic Rules of the Board of Directors and in the in-house regulations to
ensure Directors’ efficient and agile performance of their duties.
(c) Information related to Directors’ performance of duties is properly kept and controlled duly according to the in-house regulations, and the
leak and unjust use of such information are prevented.
5. Company Auditors’ performance of duties
(a) Company Auditors attend not only the Board of Directors but also other important meetings such as the CSR Committee to offer opinions
as needed.
(b) Company Auditors visit each division of the Company and Group companies for auditing and confirm the legality and compliance of
business operations.
(c) Company Auditors regularly exchange information and opinions with Directors, accounting auditors and internal auditing divisions to
improve effectiveness of auditing.
③ Overview of Contents of Liability Limitation Agreement ROHM and its outside directors and outside auditors have entered into a liability limitation agreement, in accordance with the provisions of
Article 427-1 of the Companies Act of Japan and the Articles of Incorporation of the Company, regarding liability for damages as covered in
Article 423-1 of the same Act, stipulating minimum total liability as per the provisions of Article 425-1 of the same Act.
Status of Internal Audits and Auditor Audits The Corporate Auditors attend important meetings, such as the Board of Directors meetings, and audit the individual divisions of ROHM
and its affiliates at home and abroad along with the Internal Audit Department, by holding meetings with those in managerial positions,
inspecting documents and reports, and performing other activities. Through these audits, ROHM checks that the Directors are performing
their duties in compliance with existing laws, ROHM's internal control is well maintained and operated, in-house rules are well observed,
and that ROHM's assets are secured. Currently, there are 7 personnel in the Audit Office.
Corporate Auditors, the Internal Audit Department, and Accounting Auditors regularly hold report meetings, consistently maintain close
cooperation and coordination, and proactively exchange information and opinions. Sharing information obtained through individual audits
enhances the accuracy of audits and allows for constant improvements in operating processes.
The contents of audits are reported to ROHM’s Internal Audit Division as needed, and opinions are exchanged on matters that require
improvements regarding internal control.
The Auditors, Shinya Murao and Haruo Kitamura, are certified public accountants (CPA) that possess considerable knowledge of finance
and accounting.

8
Management Policies Status of Accounting Audits ROHM contracts Deloitte Touche Tohmatsu LLC to conduct accounting and internal control audits related to financial reporting, and
complies with both Japan’s Companies Act and the Financial Instruments and Exchange Act. ROHM has established an environment where
the auditing organization can perform audits from a fair, unbiased position as an independent third party. The following are the names of
certified public accountants (CPAs) who audited ROHM's accounts for the fiscal year ended March 31, 2018, the number of consecutive
years they have been engaged in auditing ROHM, and information on the assistants involved in the audits.
CPAs who have audited ROHM (Number of consecutive years they have been involved in ROHM audits)
Designated limited liability partners of Deloitte Touche Tohmatsu:
Yasuhiro Onishi (5 years), Tomoyuki Suzuk (1 year), Hiromi Ueda (1 year)
Major assistants in the audits
10 CPAs and 10 others
Outside Directors and Outside Auditors ① Number of Outside Directors and Outside Auditors, Interpersonal Relationships with Submitting Company Members,
Capital Relationships or Business Relationships, and Other Potential Conflicts of Interest ROHM appoints two Outside Directors to enhance mutual supervisory functions among Directors. Also, in order to strengthen and
enhance the functionality of the audit system with regards to the execution of management duties, all five Auditors are Outside Auditors. To
fully accomplish these objectives, ROHM believes that both Outside Directors and Outside Auditors should be highly independent.
It should be noted that outside directors and outside auditors own shares of Company stock but may not have conflicts of interest,
including interpersonal relationships, shareholding, capital relationships, and business relationships, that interfere with their independence.

9
② Criteria and Policy for Independence, and Functions and Roles of Outside Directors and Outside Auditors We strengthen our supervisory and audit functions by asking the Outside Directors and Outside Auditors to provide advice and
recommendations on company management, etc. from an independent standpoint and based on the wealth of experience and wide range of
insight cultivated from their careers, and by having them attend Board Meetings and other important meetings.
Our Company’s Auditors are all Outside Auditors and cooperation with these Outside Auditors in internal and accounting audits is
described in the above “Status of Internal Audits and Auditor Audits.” As for the relationship between the Outside Directors and audits,
status reports are made in writing by the Internal Audit Division to the Outside Directors on a monthly basis or as necessary.
Regarding the collaboration between the Outside Directors, Outside Auditors, and the Internal Control Division, the status of business
execution, progress of profit planning, etc. are reported in writing by the Internal Audit Division to the Outside Directors and Outside
Auditors monthly or whenever necessary.
The relationship between Auditor Audits, Internal Audits, and Accounting Auditor Audits is described in the “Status of Internal Audits and
Auditor Audits.”
With regard to the selection of outside directors and outside auditors, the Company determines their independence on the basis of the
provisions of the Company’s “Independence Standards for Outside Officers”.
The Company’s “Independence Standards for Outside Officers” are as follows:
<Independence Standards for Outside Officers>
The Company appoints only persons who do not fall into any of the following categories of persons as its Outside Officers.
1. A major shareholder1 of the Company or a person who executes the business of the Company2;
2. A person who executes the business of a company of which the Company is a major shareholder;
3. A major customer3 of the Group or a person who executes the business of that major customer;
4. An organization for whom the Group is a major customer4 or a person who executes the business of said organization;
5. A consultant, accounting expert or legal expert who, in addition to director's remuneration, receives money exceeding a certain amount or
other assets5 from the Group (or an organization that receives the said assets or a person who belongs to the said organization);
6. A person who receives donations or grants exceeding a certain amount6 from the Group (or an organization that receives the said grants
is, or a director of that organization or a person who executes the business of that organization);
7. A partner, member or employee of the accounting auditors of the Company;
8. A person who executes the business of a major lender of the Company7;
9. A person who fell into any of the categories described in 1 to 8 above in the last three years;
10. An organization to whom a director of the Group is transferred or a person who executes the business of said organization, or;
11. The spouse of an important person who executes the business of the Group8 or a relative of that person within the second degree of
relationship.
1 A major shareholder means a shareholder holding at least 10% of the total voting rights of the Company. 2 A person who executes business means a director, an executive officer, a member or an employee. 3 A major customer means a company whose payments account for over 2% of annual consolidated sales of the Company. 4 An organization for whom the Group is a major customer means a company with over 2% in annual sales coming from the Company. 5 A certain amount means ten million yen per year for an individual and over 2% of total revenue for an organization. 6 A certain amount means over ten million yen per year. 7 A major lender of the Company means a lender from which an amount exceeding 2% of total consolidated assets of the Company is
borrowed. 8 An important person who executes business means a director (excluding outside directors) or a person in the senior management position
of general manager or above.
10
Eleven-Year Summary
ROHM CO., LTD. and Consolidated Subsidiaries
Years Ended March 31
2008 2009 2010 2011
For the Year:
Net sales ....................................................... ¥ 373,406 ¥ 317,141 ¥ 335,641 ¥ 341,886
Cost of sales..................................................... 230,839 217,282 229,831 219,150
Selling, general and administrative expenses..................... 75,205 89,319 87,000 89,999
Operating income (loss).......................................... 67,362 10,540 18,810 32,737
Income (loss) before income taxes............................... 57,967 (25,520) 10,836 19,400
Income taxes.................................................... 26,007 (33,775) 4,001 9,524
Net income (loss) attributable to owners of the parent............. 31,932 9,837 7,134 9,633
Capital expenditures.............................................. 38,722 51,491 30,216 40,042
Depreciation and amortization.................................... 55,605 48,951 48,446 39,019
Per Share Information (in yen and U.S. dollars):
Basic net income (loss)........................................... ¥ 284.66 ¥ 89.76 ¥ 65.10 ¥ 88.07
Cash dividends applicable to the year............................. 230.00 130.00 130.00 130.00
At Year-End:
Current assets.................................................... ¥ 535,898 ¥ 464,187 ¥ 462,435 ¥ 436,247
Current liabilities................................................ 62,775 68,325 68,850 64,334
Equity............................................................ 755,873 709,841 707,719 668,779
Total assets....................................................... 870,972 809,185 807,340 759,989
Number of employees............................................ 20,539 22,034 21,005 21,560 Notes: 1. U.S. dollar amounts are provided solely for convenience at the rate of ¥106 to U.S. $1, the approximate exchange rate at March 31, 2018.
2. Certain reclassifications of previously reported amounts have been made to conform with the classifications in the 2018 financial statements. 3. Diluted net income per share for 2018, 2017, 2016, 2015, 2014, 2011, 2010, 2009 and 2008 is not disclosed because there were no outstanding potentially dilutive securities and
ROHM CO., LTD., was in a net loss position for the years ended March 31, 2013 and 2012. 4. Effective April 1, 2008, ROHM CO., LTD., and its consolidated subsidiaries applied new accounting standards as follows:
(1) Applied a new accounting standard for measurement of inventories. The effect of this change was to decrease “Operating Income” by ¥3,184 million and to increase “Loss before income taxes ” by ¥3,184 million for the year ended March 31, 2009.
(2) Applied a revised accounting standard for lease transactions. The effect of this change to the consolidated financial statements was immaterial for the year ended March 31, 2009. (3) Applied a new accounting standard for unification of accounting policies applied to foreign subsidiaries for the consolidated financial statements. The effect of this change to
the consolidated financial statements was immaterial for the year ended March 31, 2009. 5. Effective April 1, 2010, ROHM CO., LTD., and its consolidated subsidiaries applied a new accounting standard for asset retirement obligations. The effect of this change was to
decrease “Operating Income” by ¥73 million and “Income before income taxes” by ¥784 million for the year ended March 31, 2011.
11
Millions of Yen
Thousands of U.S. Dollars
2012 2013 2014 2015 2016 2017 2018 2018
¥ 304,653 ¥ 292,411 ¥ 331,088 ¥ 362,773 ¥ 352,398 ¥ 352,010 ¥ 397,107 $ 3,746,292
209,046 213,276 227,015 235,043 230,663 234,967 252,592 2,382,943
89,254 80,056 80,437 88,929 88,100 85,215 87,510 825,566
6,353 (921) 23,636 38,801 33,635 31,828 57,005 537,783
(2,697) (52,414) 40,179 55,240 31,537 32,378 46,513 438,802
13,374 10 8,056 9,898 5,835 5,928 9,248 87,245
(16,107) (52,464) 32,092 45,297 25,686 26,432 37,249 351,406
51,117 42,818 31,755 48,739 56,687 42,183 55,911 527,462
34,925 38,857 25,560 34,467 38,338 40,801 43,407 409,500
¥ (149.41) ¥ (486.63) ¥ 297.65 ¥ 420.16 ¥ 241.91 ¥ 249.88 ¥ 352.14 $ 3.32
60.00 30.00 50.00 130.00 130.00 130.00 240.00 2.26
¥ 434,457 ¥ 423,064 ¥ 461,746 ¥ 523,376 ¥ 473,570 ¥ 495,958 ¥ 513,540 $ 4,844,717
74,337 55,750 52,955 69,660 62,352 69,050 78,086 736,660
634,280 613,647 663,388 752,434 706,251 725,453 751,878 7,093,189
737,326 699,014 754,408 864,380 804,134 834,504 870,035 8,207,877
21,295 20,203 19,985 20,843 21,171 21,308 23,120
12
Consolidated Balance Sheet
ROHM CO., LTD. and Consolidated Subsidiaries
March 31, 2018
ASSETS
Millions of Yen
Thousands of U.S. Dollars
(Note 1)
2018 2017 2018
Current Assets:
Cash and cash equivalents (Note 14) ...................................... ¥ 243,974 ¥ 246,015 $ 2,301,642 Marketable securities (Notes 3 and 14) .................................... 16,467 3,883 155,349
Short-term investments (Notes 4 and 14) .................................. 45,381 57,601 428,123
Notes and accounts receivable (Note 14):
Trade............................................................... 90,611 81,792 854,820
Unconsolidated subsidiaries and associated companies.................. 91 1,010 858
Other............................................................... 2,810 2,753 26,509
Allowance for doubtful accounts...................................... (457) (542) (4,311)Inventories (Note 5) .................................................... 98,289 86,698 927,255
Deferred tax assets (Note 12) ............................................ 9,357 9,048 88,274
Refundable income taxes (Note 14) ...................................... 206 1,137 1,943
Prepaid expenses and other............................................... 6,811 6,563 64,255
Total current assets............................................... 513,540 495,958 4,844,717
Property, Plant and Equipment:
Land (Note 6) ......................................................... 66,810 66,961 630,283
Buildings and structures (Note 6) ........................................ 233,592 230,987 2,203,698
Machinery, equipment and vehicles (Notes 6 and 16) ....................... 544,650 516,449 5,138,207
Furniture and fixtures (Notes 6 and 16) ................................... 49,661 47,669 468,500
Construction in progress (Note 6) ........................................ 19,692 14,677 185,774
Total............................................................ 914,405 876,743 8,626,462
Accumulated depreciation............................................... (674,178) (645,472) (6,360,170)
Net property, plant and equipment................................. 240,227 231,271 2,266,292
Investments and Other Assets:
Investment securities (Notes 3 and 14) .................................... 93,935 80,404 886,179
Investments in and advances to unconsolidated subsidiaries
and associated companies (Note 14) .................................. 975 975 9,198
Asset for retirement benefits (Note 7) .................................... 2,074 1,436 19,566
Goodwill (Note 6)...................................................... 5,356
Other intangible assets (Note 6)........................................... 5,411 5,158 51,047
Deferred tax assets (Note 12) ............................................ 2,580 2,686 24,340
Other.................................................................. 11,905 11,666 112,311
Allowance for doubtful accounts......................................... (612) (406) (5,773)
Total investments and other assets.................................. 116,268 107,275 1,096,868
Total .............................................................................. ¥ 870,035 ¥ 834,504 $ 8,207,877
See notes to consolidated financial statements.

13
LIABILITIES AND EQUITY
Millions of Yen
Thousands of U.S. Dollars
(Note 1)
2018 2017 2018
Current Liabilities:
Notes and accounts payable (Note 14): Trade .............................................................. ¥ 18,692 ¥ 20,851 $ 176,340 Construction and other ............................................... 30,364 27,607 286,453
Income tax payable (Note 14) ............................................ 10,423 3,791 98,330
Deferred tax liabilities (Note 12) ......................................... 30 2 283
Accrued expenses ...................................................... 14,958 13,145 141,113
Other ................................................................. 3,619 3,654 34,141
Total current liabilities ........................................... 78,086 69,050 736,660
Long-term Liabilities:
Liability for retirement benefits (Note 7) .................................. 10,137 10,694 95,632
Deferred tax liabilities (Note 12) ......................................... 27,668 28,195 261,019
Other ................................................................. 2,266 1,112 21,377
Total long-term liabilities ......................................... 40,071 40,001 378,028
Commitments and Contingent Liabilities (Notes 15, 16 and 17)
Equity (Notes 9, 18 and 19):
Common stock―authorized, 300,000,000 shares
issued, 111,200,000 shares........................... 86,969 86,969 820,462
Capital surplus ........................................................ 102,404 102,404 966,075
Retained earnings ...................................................... 620,152 604,057 5,850,491
Treasury stock―at cost
5,425,837 shares in 2018 and 5,424,815 shares in 2017................... (47,788) (47,778) (450,830)
Accumulated other comprehensive income
Unrealized gain on available-for-sale securities (Note 3) ................. 33,932 25,439 320,113
Foreign currency translation adjustments ............................... (40,667) (40,942) (383,650)Accumulated adjustments for retirement benefits (Note 7) ................. (3,576) (5,163) (33,736)
Total ........................................................... 751,426 724,986 7,088,925
Noncontrolling interests................................................ 452 467 4,264
Total equity .................................................... 751,878 725,453 7,093,189
Total ..............................................................................¥ 870,035 ¥ 834,504 $ 8,207,877
14
Consolidated Statement of Income
ROHM CO., LTD. and Consolidated Subsidiaries
Year Ended March 31, 2018
Millions of Yen
Thousands of U.S. Dollars
(Note 1)
2018 2017 2016 2018
Net Sales.......................................................... ¥ 397,107 ¥ 352,010 ¥ 352,398 $ 3,746,292
Operating Cost and Expenses:
Cost of sales............................................... 252,592 234,967 230,663 2,382,943
Selling, general and administrative expenses (Notes 9 and 10) . 87,510 85,215 88,100 825,566
Total operating cost and expenses..................... 340,102 320,182 318,763 3,208,509
Operating Income................................................. 57,005 31,828 33,635 537,783
Other Income (Expenses):
Interest and dividend income................................. 3,861 4,053 2,861 36,424
Foreign currency exchange losses―net........................ (7,248) (766) (23) (68,377)
Gain on sales of property, plant and equipment................. 502 252 148 4,736
Loss on sales and disposal of property, plant and equipment........................................... (742) (619) (729) (7,000)
Loss on impairment of long-lived assets (Note 6) .............. (7,047) (2,455) (2,021) (66,481)
Loss on valuation of investment securities (Note 3)............. (82) (58) (4) (774)Loss on business liquidation (Note 11) ..................... (268) (1,867)Special severance benefit (Note 7) .......................... (332) (205) (113) (3,132)Loss on valuation of investments in unconsolidated
subsidiaries and associated companies..................... (24)
Provision for loss on business liquidation (Note 11) ........... (442)Loss on liquidation of subsidiaries............................ (60)
Other―net................................................. 596 640 152 5,623
Total other income (expenses)―net................. (10,492) 550 (2,098) (98,981)
Income before Income Taxes........................................ 46,513 32,378 31,537 438,802
Income Taxes (Note 12):
Current.................................................... 13,573 4,867 5,318 128,047
For prior periods............................................ 1,741
Deferred................................................... (4,325) (680) 517 (40,802)
Total income taxes.................................. 9,248 5,928 5,835 87,245
Net Income........................................................ 37,265 26,450 25,702 351,557
Net Income Attributable to Noncontrolling Interests................. (16) (18) (16) (151)
Net Income Attributable to Owners of the Parent................... ¥ 37,249 ¥ 26,432 ¥ 25,686 $ 351,406
Yen U.S. Dollars
Per Share Information (Note 2. (s)): Basic net income .......................................... ¥ 352.14 ¥ 249.88 ¥ 241.91 $ 3.32Cash dividends applicable to the year......................... 240.00 130.00 130.00 2.26
See notes to consolidated financial statements.
15
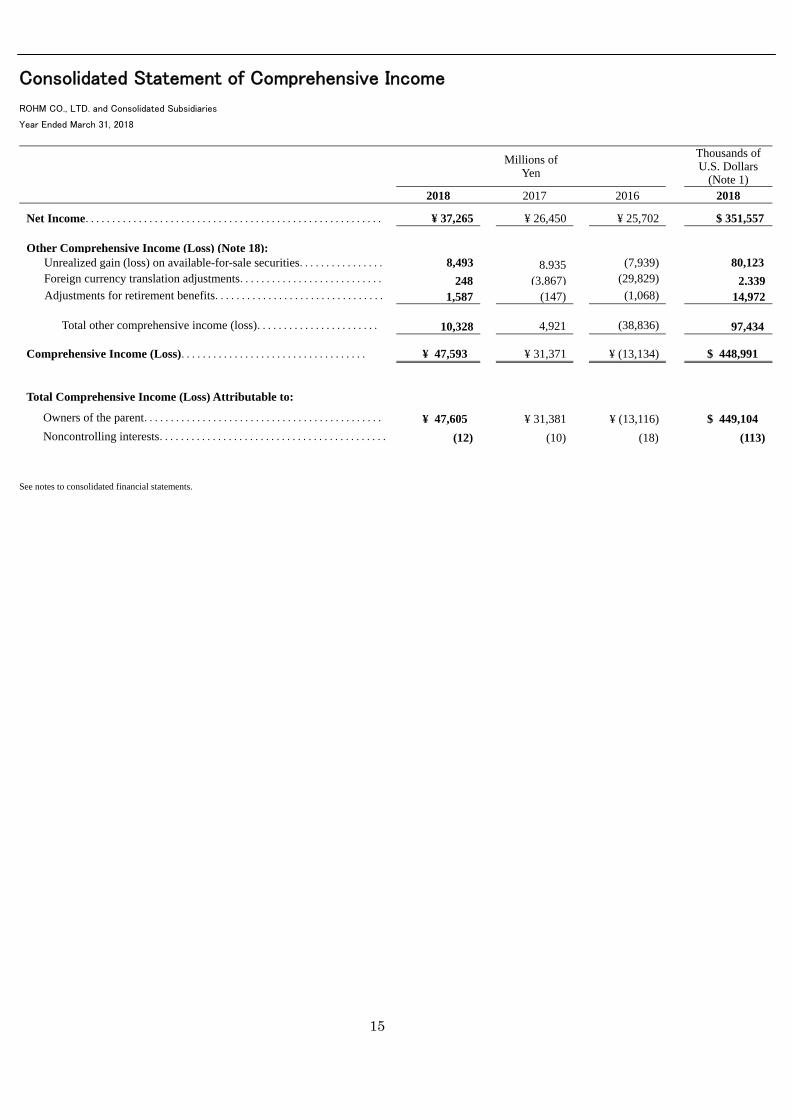
Consolidated Statement of Comprehensive Income
ROHM CO., LTD. and Consolidated Subsidiaries
Year Ended March 31, 2018
Millions of
Yen
Thousands ofU.S. Dollars
(Note 1) 2018 2017 2016 2018
Net Income........................................................ ¥ 37,265 ¥ 26,450 ¥ 25,702 $ 351,557
Other Comprehensive Income (Loss) (Note 18): Unrealized gain (loss) on available-for-sale securities................ 8,493 8,935 (7,939) 80,123Foreign currency translation adjustments........................... 248 (3,867) (29,829) 2,339Adjustments for retirement benefits................................ 1,587 (147) (1,068) 14,972
Total other comprehensive income (loss)....................... 10,328 4,921 (38,836) 97,434
Comprehensive Income (Loss)................................... ¥ 47,593 ¥ 31,371 ¥ (13,134) $ 448,991
Total Comprehensive Income (Loss) Attributable to:
Owners of the parent............................................. ¥ 47,605 ¥ 31,381 ¥ (13,116) $ 449,104
Noncontrolling interests........................................... (12) (10) (18) (113)
See notes to consolidated financial statements.

16
Consolidated Statement of Changes in Equity
ROHM CO., LTD. and Consolidated Subsidiaries
Year Ended March 31, 2018
Millions of Yen
Number of shares of
common stock outstanding
Common
stock
Capital
surplus
Retained
earnings
Treasury
stock
Accumulated other
comprehensive income
Total
Noncontrolling
interests
Total equity
Unrealized gain on
available-for-sale
securities
Foreign currency
translation
adjustments
Accumulated adjustments
for retirement benefits
Balance at April 1, 2015……… 107,803,201 ¥ 86,969 ¥ 102,404 ¥ 599,519 ¥ (50,141) ¥ 24,443 ¥ (7,309) ¥ (3,948) ¥ 751,937 ¥ 497 ¥ 752,434
Net income attributable to owners of the parent…………….……
25,686 25,686 25,686
Cash dividends, ¥150.00 per share (16,039) (16,039) (16,039)
Purchase of treasury stock…….. (2,026,944) (17,007) (17,007) (17,007)
Net change in the year………… (7,939) (29,795) (1,068) (38,802) (21) (38,823)
Balance at March 31, 2016………. 105,776,257 86,969 102,404 609,166 (67,148) 16,504 (37,104) (5,016) 705,775 476 706,251
Net income attributable to owners
of the parent…………….…… 26,432 26,432 26,432
Cash dividends, ¥115.00 per share (12,164) (12,164) (12,164)
Purchase of treasury stock…….. (1,090) (7) (7) (7)
Disposal of treasury stock…….. 18 (0) 0 0 0
Retirement of treasury stock…….. (19,377) 19,377
Transfer from retained earnings
to capital surplus…………….…… 19,377 (19,377)
Net change in the year………… 8,935 (3,838) (147) 4,950 (9) 4,941
Balance at March 31, 2017……… 105,775,185 86,969 102,404 604,057 (47,778) 25,439 (40,942) (5,163) 724,986 467 725,453
Net income attributable to owners
of the parent…………….…… 37,249 37,249 37,249
Cash dividends, ¥200.00 per share (21,154) (21,154) (21,154)
Purchase of treasury stock…….. (1,033) (10) (10) (10)
Disposal of treasury stock…….. 11 0 0 0
Net change in the year………… 8,493 275 1,587 10,355 (15) 10,340
Balance at March 31, 2018……… 105,774,163 ¥ 86,969 ¥102,404 ¥ 620,152 ¥ (47,788) ¥ 33,932 ¥ (40,667) ¥ (3,576) ¥ 751,426 ¥ 452 ¥ 751,878
Thousands of U.S. Dollars (Note 1)
Common
stock
Capital
surplus
Retained
earnings
Treasury
stock
Accumulated other
comprehensive income
Total
Noncontrolling
interests
Total equity
Unrealized
gain on available-for-sale
securities
Foreign currency
translation
adjustments
Accumulated adjustments
or retirement benefits
Balance at March 31, 2017………………… $ 820,462 $ 966,075 $ 5,698,651 $ (450,736) $ 239,991 $ (386,245) $ (48,708) $ 6,839,490 $ 4,406 $ 6,843,896Net income attributable to owners of
the parent…………….………… 351,406 351,406 351,406
Cash dividends, $ 1.89 per share… (199,566) (199,566) (199,566)
Purchase of treasury stock…… (94) (94) (94)
Disposal of treasury stock…….. 0 0 0
Net change in the year………… 80,122 2,595 14,972 97,689 (142) 97,547
Balance at March 31, 2018……………. $ 820,462 $ 966,075 $ 5,850,491 $ (450,830) $ 320,113 $ (383,650) $ (33,736) $ 7,088,925 $ 4,264 $ 7,093,189
See notes to consolidated financial statements.

17
Consolidated Statement of Cash Flows
ROHM CO., LTD. and Consolidated Subsidiaries
Year Ended March 31, 2018
Millions of
Yen
Thousands of U.S. Dollars
(Note 1)
2018 2017 2016 2018
Operating Activities:
Income before income taxes. . . . . . . . . . . . . . . . . . . . . . . . . . . . . . . . . . . . . . . . . . . . . . . . ¥ 46,513 ¥ 32,378 ¥ 31,537 $ 438,802 Adjustments for:
Income taxes – paid. . . . . . . . . . . . . . . . . . . . . . . . . . . . . . . . . . . . . . . . . . . . . . . . . . . . . . (6,153) (5,654) (8,852) (58,047)
Depreciation and amortization. . . . . . . . . . . . . . . . . . . . . . . . . . . . . . . . . . . . . . . . . . . 43,407 40,801 38,338 409,500
Amortization of goodwill. . . . . . . . . . . . . . . . . . . . . . . . . . . . . . . . . . . . . . . . . . . . . . . . . 392 386 246 3,698
Increase (decrease) in allowance for doubtful accounts . . . . . . . . . . . . . . . . . . . . . 148 651 (383) 1,396
Gain on sales of property, plant and equipment―net . . . . . . . . . . .. . . . . . . . . . . . . (424) (177) (14) (4,000)
Foreign currency exchange losses―net . . . . . . . . . . . . . . . . . . . . . . . . . . . . . . . . . . . 1,582 1,707 5,179 14,925
Increase in liability for retirement benefits . . . . . . . . . . . . . . . . . . . . . . . 496 665 618 4,679
Decrease (increase) in asset for retirement benefits . . . . . . . . . . . . . . . . . . . . . . 151 233 (526) 1,425
Loss on impairment of long-lived assets. . . . . . . . . . . . . . . . . . . . . . . . . . . . . . . . . . . 7,047 2,455 2,021 66,481
Loss on valuation of investment securities and investments in unconsolidated subsidiaries and associated companies. . . . . . . . . . . . . . . . . . . . . . . . . . . . . 82 82
4 774
Payments for business restructuring . . . . . . . . . . . . . . . . . . . .. . . . . . . . . . . . .. . . (9) (306) (85)
Changes in assets and liabilities:
(Increase) decrease in notes and accounts receivable – trade . . . . . . . . . . (9,434) (11,936) 5,300 (89,000)
(Increase) decrease in inventories . . . . . . . . . . . . . . . . . . . . . . . . . . . . . .. . . . . . . . (11,737) (251) 7,393 (110,726)
Increase (decrease) in notes and accounts payable – trade . . . . . . . . . . . . .. . . (1,430) 2,400 36 (13,491)
Increase (decrease) in accounts payable – other. . . . . . . . . . . . . . . . . . . .. . . . 513 572
(1,936) 4,840
Other―net. . . . . . . . . . . . . . . . . . . . . . . . . . . . . . . . . . . . . . . . . . . . . . . . . . . . . . . . . . . . . 3,583 3,391
(59) 33,801
Total adjustments. . . . . . . . . . . . . . . . . . . . . . . . . . . . . . . . . . . . . . . . . . . . . . . 28,214 35,019 47,365 266,170
Net cash provided by operating activities. . . . . . . . . . . . . . . . . . . . . . . . . . . . . 74,727 67,397 78,902 704,972
Investing Activities:
Decrease in time deposits―net . . . . . . . . . . . . . . . . . . . . . . . . . . . . . . . . . . . . . . . . . . . . . . 10,469 3,855 34,780 98,764
Purchases of marketable and investment securities. . . . . . . . . . . . . . . . . . . . . . . . . . . . . (19,363) (10,990) (6,173) (182,670)
Proceeds from sales and redemption of marketable and investment securities . . . . . 5,219 8,486 11,427 49,236
Purchases of property, plant and equipment. . . . . . . . . . . . . . . . . . . . . . . . . . . . . . . . . . . . (49,863) (39,602) (54,212) (470,406)
Proceeds from sales of property, plant and equipment. . . . . . . . . . . . . . . . . . . . . . . . . . . 1,006 563 900 9,491
Proceeds from transfer of business (Note 13). . . . . . . . . . . . . . . . . . . . . . . . . . . . . . . . . . . . 430 Purchase of shares of subsidiaries resulting in change in scope of consolidation,
net of cash acquired (Note 13) . . . . . . . . . . . . . . . . . . . . . . . . . . .. . . . . . . . .. . . . . . . .. . . (8,626)Other―net. . . . . . . . . . . . . . . . . . . . . . . . . . . . . . . . . . . . . . . . . . . . . . . . . . . . . . . . . . . . . . . . . (1,986) (1,484) (532) (18,736)
Net cash used in investing activities. . . . . . . . . . . . . . . . . . . . . . . . . . . . . .. . . . (54,518) (38,742) (22,436) (514,321)
Financing Activities:
Purchase of treasury stock. . . . . . . . . . . . . . . . . . . . . . . . . . . . . . . . . . . . . . . . . . . . . . . . . . . (11) (7) (17,007) (104)
Dividends paid. . . . . . . . . . . . . . . . . . . . . . . . . . . . . . . . . . . . . . . . . . . . . . . . . . . . . . . . . . . . . . (21,154) (12,164) (16,039) (199,566)
Other―net. . . . . . . . . . . . . . . . . . . . . . . . . . . . . . . . . . . . . . . . . . . . . . . . . . . . . . . . . . . . . . . . . (22) (3) (64) (208)
Net cash used in financing activities. . . . . . . . . . . . . . . . . . . . . . . . . . . . . . . . . (21,187) (12,174) (33,110) (199,878)
Foreign Currency Translation Adjustments on Cash and Cash Equivalents. . . . . . . . . . (1,063) (2,268) (14,222) (10,028)
Net Increase (Decrease) in Cash and Cash Equivalents. . . . . . . . . . . . . . . . . . . . . . . . . . . . . (2,041) 14,213 9,134 (19,255)
Cash and Cash Equivalents at Beginning of Year. . . . . . . . . . . . . . . . . . . . . . . . . . . . . . . . . . . 246,015 231,802 222,668 2,320,897
Cash and Cash Equivalents at End of Year. . . . . . . . . . . . . . . . . . . . . . . . . . . . . . . . . . . . . . . . . ¥ 243,974 ¥ 246,015 ¥ 231,802 $ 2,301,642
See notes to consolidated financial statements.
18
Notes to Consolidated Financial Statements ROHM CO., LTD. and Consolidated Subsidiaries
1. Basis of Presentation of Consolidated Financial Statements
The accompanying consolidated financial statements have been prepared in accordance with the provisions set forth in the Japanese Financial Instruments and Exchange Act and its related accounting regulations, and in accordance with accounting principles generally accepted in Japan (“Japanese GAAP”), which are different in certain respects as to application and disclosure requirements of International Financial Reporting Standards.
In preparing these consolidated financial statements, certain reclassifications and rearrangements have been made to the consolidated financial statements issued domestically in order to present them in a form which is more familiar to readers outside Japan.
In addition, certain reclassifications have been made to the previously reported amounts to conform with current classifications. The consolidated financial statements are stated in Japanese yen, the currency of the country in which ROHM CO., LTD. (the “Company”) is incorporated and operates. The translations of Japanese yen amounts into U.S. dollar amounts are included solely for the convenience of readers outside Japan and have been made at the rate of ¥106 to $1, the approximate rate of exchange at March 31, 2018. Such translations should not be construed as representations that the Japanese yen amounts could be converted into U.S. dollars at that or any other rate.
2. Summary of Significant Accounting Policies
(a) Consolidation The consolidated financial statements as of March 31, 2018, include the accounts of the Company and its 45 (44 in 2017) significant
subsidiaries (together, the “Group”). Under the control concept, those companies in which the Company, directly or indirectly, is able to exercise control over operations are
fully consolidated. Investments in unconsolidated subsidiaries and associated companies are stated at cost. If the equity method of accounting had been
applied to the investments in these companies, the effect on the accompanying consolidated financial statements would not be material. The excess of the cost of acquisition over the fair value of the net assets of an acquired subsidiary at the date of acquisition is being
amortized over reasonable periods (within 20 years). All significant intercompany balances and transactions have been eliminated in consolidation. All material unrealized profit included in
assets resulting from transactions within the Group is also eliminated. The fiscal year end date of 8 (7 in 2017) subsidiaries, including ROHM SEMICONDUCTOR CHINA CO., LTD., is December 31, which is
different from the consolidated balance sheet date of March 31. For those subsidiaries, the Group consolidated the financial statements as of the provisional closing date of March 31.
(b) Unification of Accounting Policies Applied to Foreign Subsidiaries for the Consolidated Financial Statements
Under Accounting Standards Board of Japan ("ASBJ") Practical Issues Task Force ("PITF") No. 18, "Practical Solution on Unification of Accounting Policies Applied to Foreign Subsidiaries for the Consolidated Financial Statements, "the accounting policies and procedures applied to a parent company and its subsidiaries for similar transactions and events under similar circumstances should in principle be unified for the preparation of the consolidated financial statements. However, financial statements prepared by foreign subsidiaries in accordance with either International Financial Reporting Standards or generally accepted accounting principles in the United States of America tentatively may be used for the consolidation process, except for the following items that should be adjusted in the consolidation process so that net income is accounted for in accordance with Japanese GAAP, unless they are not material: (a) amortization of goodwill; (b) scheduled amortization of actuarial gain or loss of pensions that has been recorded in equity through other comprehensive income; (c) expensing capitalized development costs of R&D; and (d) cancellation of the fair value model of accounting for property, plant and equipment and investment properties and incorporation of the cost model of accounting.
(c) Cash Equivalents
Cash equivalents are short-term investments that are readily convertible into cash and that are exposed to insignificant risk of changes in value. Cash equivalents include time deposits and certificates of deposit, all of which mature or become due within three months of the date of acquisition.
(d) Marketable and Investment Securities Marketable and investment securities are classified and accounted for, depending on management’s intent, as available-for-sale securities,
which are not classified as either trading securities or held-to-maturity debt securities, and are reported at fair value, with unrealized gains and losses, net of applicable taxes, reported in a separate component of equity.
The Group classifies all marketable and investment securities as available-for-sale securities. Nonmarketable available-for-sale securities are stated at cost, principally determined by the moving-average method. For other-than-temporary declines in fair value, investment securities are reduced to net realizable value by a charge to income.
19
(e) Allowance for Doubtful Accounts The allowance for doubtful accounts is stated in amounts considered to be appropriate based on the companies' past credit loss
experience and an evaluation of potential losses in the receivables outstanding. (f) Inventories
Inventories are mainly stated at the lower of cost, determined by the moving-average method for merchandise, finished products, work in process and raw materials and by the last purchase cost method for supplies, or net selling value.
(g) Property, Plant and Equipment
Property, plant and equipment are stated at cost. Depreciation of property, plant and equipment is computed principally by the declining-balance method based on the estimated useful lives of the assets while the straight-line method is applied to buildings of the Company and its consolidated domestic subsidiaries acquired after April 1, 1998. Leased equipment is depreciated by the straight-line method over the respective lease periods.
Estimated useful lives of the assets are principally as follows: Buildings and structures ………. 3 to 50 years Machinery, equipment and vehicles ....... 2 to 10 years
(h) Intangible Assets
Intangible assets are stated at cost less accumulated amortization, which is calculated by the straight-line method. (i) Long-lived Assets
The Group reviews its long-lived assets for impairment whenever events or changes in circumstance indicate the carrying amount of an asset or asset group may not be recoverable. An impairment loss is recognized if the carrying amount of an asset or asset group exceeds the sum of the undiscounted future cash flows expected to result from the continued use and eventual disposition of the asset or asset group. The impairment loss would be measured as the amount by which the carrying amount of the asset exceeds its recoverable amount, which is the higher of the discounted cash flows from the continued use and eventual disposition of the asset or the net selling price at disposition. (j) Retirement and Pension Plans
The Company and certain consolidated subsidiaries have defined benefit plans for employees, and account for the liability for retirement benefits based on the projected benefit obligations and plan assets at the balance sheet date. The projected benefit obligations are attributed to the respective periods on a benefit formula basis. Actuarial gains and losses and past service costs that are yet to be recognized in profit or loss are recognized within equity (accumulated other comprehensive income), after adjusting for tax effects and actuarial gains and losses are amortized on a straight-line basis over 10-13 years within the average remaining service period. Past service costs are amortized on a straight-line basis over 10-13 years within the average remaining service period. The discount rate is determined using a single weighted-average discount rate reflecting the estimated timing and amount of the benefit payment.
The Company and certain consolidated subsidiaries also have defined contribution pension plans.
(k) Asset Retirement Obligations An asset retirement obligation is recorded for a legal obligation imposed either by law or contract that results from the acquisition,
construction, development and normal operation of a tangible fixed asset and is associated with the retirement of such tangible fixed asset. The asset retirement obligation is recognized as the sum of the discounted cash flows required for the future asset retirement and is recorded in the period in which the obligation is incurred if a reasonable estimate can be made. If a reasonable estimate of the asset retirement obligation cannot be made in the period the asset retirement obligation is incurred, the liability should be recognized when a reasonable estimate of the asset retirement obligation can be made. Upon initial recognition of a liability for an asset retirement obligation, an asset retirement cost is capitalized by increasing the carrying amount of the related fixed asset by the amount of the liability. The asset retirement cost is subsequently allocated to expense through depreciation over the remaining useful life of the asset. Over time, the liability is accreted to its present value each period. Any subsequent revisions to the timing or the amount of the original estimate of undiscounted cash flows are reflected as an adjustment to the carrying amount of the liability and the capitalized amount of the related asset retirement cost.
(l) Research and Development Costs Research and development costs are charged to “Selling, general and administrative expenses” as incurred.
20
Notes to Consolidated Financial Statements ROHM CO., LTD. and Consolidated Subsidiaries
(m) Leases Finance lease transactions are capitalized to recognize lease assets and lease obligations in the balance sheet. In March 2007, the ASBJ issued ASBJ Statement No. 13, “Accounting Standard for Lease Transactions,” which revised the previous
accounting standard for lease transactions. Under the previous accounting standard, finance leases that were deemed to transfer ownership of the leased property to the lessee were
capitalized. However, other finance leases were permitted to be accounted for as operating lease transactions if certain “as if capitalized” information was disclosed in the note to the lessee’s financial statements. The revised accounting standard permits leases that existed at the transition date and do not transfer ownership of the leased property to the lessee to continue to be accounted for as operating lease transactions. The Company and certain domestic subsidiaries applied the revised accounting standard effective April 1, 2008. In addition, the
Company and certain domestic subsidiaries continue to account for leases that existed at the transition date and that do not transfer ownership of the leased property to the lessee as operating lease transactions. All other leases are accounted for as operating leases.
(n) Bonuses to Directors Board Members Bonuses to Directors Board members are accrued at the year-end to which such bonuses are attributable.
(o) Income Taxes The provision for income taxes is computed based on the pretax income included in the consolidated statement of income. The asset and
liability approach is used to recognize deferred tax assets and liabilities for the expected future tax consequences of temporary differences between the carrying amounts and the tax bases of assets and liabilities. Deferred taxes are measured by applying currently enacted tax laws to the temporary differences.
(p) Foreign Currency Transactions All short-term and long-term monetary receivables and payables denominated in foreign currencies are translated into Japanese yen at
exchange rates in effect at the balance sheet date. The foreign exchange gains and losses from translation are recognized in the consolidated statement of income.
(q) Foreign Currency Financial Statements The balance sheet accounts of consolidated foreign subsidiaries are translated into Japanese yen at the current exchange rates as of the balance
sheet date, except for equity, which is translated at the historical rate. Differences arising from such translation were shown as “Foreign currency translation adjustments” under accumulated other comprehensive income in a separate component of equity.
Revenue and expense accounts of consolidated foreign subsidiaries are translated into Japanese yen at the average exchange rates.
(r) Derivatives and Hedging Activities The Group uses derivative financial instruments to manage its exposures to fluctuations in foreign exchange. Foreign exchange forward
contracts are utilized by the Group to reduce foreign currency exchange risk. The Group does not enter into derivatives for trading or speculative purposes.
Derivative financial instruments and foreign currency transactions are classified and accounted for as follows: (1) all derivatives are recognized as either assets or liabilities and measured at fair value, and gains or losses on derivative transactions are recognized in the statement of income and (2) for derivatives used for hedging purposes, if derivatives qualify for hedge accounting because of high correlation and effectiveness between the hedging instruments and the hedged items, gains or losses on derivatives are deferred until maturity of the hedged transactions.
(s) Per Share Information
Basic net income per share is computed by dividing net income available to common shareholders by the weighted-average number of common shares outstanding for the period, retroactively adjusted for stock splits.
The average number of shares used to compute basic net income per share for the years ended March 31, 2018, 2017 and 2016 were 105,775 thousand shares, 105,776 thousand shares and 106,175 thousand shares, respectively.
Cash dividends per share presented in the accompanying consolidated statement of income are dividends applicable to the respective years, including dividends to be paid after the end of the year.
Diluted net income per share for 2018, 2017 and 2016 are not disclosed because there are no outstanding potentially dilutive securities.

21
(t) Accounting Standards for Business Combinations and Consolidated Financial Statements Business combinations are accounted for using the purchase method. Acquisition-related costs, such as advisory fees or professional fees,
are accounted for as expenses in the periods in which the costs are incurred. If the initial accounting for a business combination is incomplete by the end of the reporting period in which the business combination occurs, an acquirer shall report in its financial statements provisional amounts for the items for which the accounting is incomplete. During the measurement period, which shall not exceed one year from the acquisition, the acquirer shall retrospectively adjust the provisional amounts recognized at the acquisition date to reflect new information obtained about facts and circumstances that existed as of the acquisition date and that would have affected the measurement of the amounts recognized as of that date. Such adjustments shall be recognized as if the accounting for the business combination had been completed at the acquisition date. The acquirer recognizes any bargain purchase gain in profit or loss immediately on the acquisition date after reassessing and confirming that all of the assets acquired and all of the liabilities assumed have been identified after a review of the procedures used in the purchase price allocation. A parent's ownership interest in a subsidiary might change if the parent purchases or sells ownership interests in its subsidiary. The carrying amount of noncontrolling interest is adjusted to reflect the change in the parent's ownership interest in its subsidiary while the parent retains its controlling interest in its subsidiary. Any difference between the fair value of the consideration received or paid and the amount by which the noncontrolling interest is adjusted is accounted for as capital surplus as long as the parent retains control over its subsidiary.
(u) New Accounting Pronouncements
Revenue recognition―On March 30, 2018, the ASBJ issued ASBJ Statement No. 29, "Accounting Standard for Revenue Recognition," and ASBJ Guidance No. 30, "Implementation Guidance on Accounting Standard for Revenue Recognition. " The core principle of the standard and guidance is that an entity should recognize revenue to depict the transfer of promised goods or services to customers in an amount that reflects the consideration to which the entity expects to be entitled in exchange for those goods or services. An entity should recognize revenue in accordance with that core principle by applying the following steps:
Step 1: Identify the contracts with a customer Step 2: Identify the performance obligations in the contract Step 3: Determine the transaction price Step 4: Allocate the transaction price to the performance obligations in the contract Step 5: Recognize revenue when (or as) the entity satisfies a performance obligation The accounting standard and guidance are effective for annual periods beginning on or after April 1, 2021. Earlier application is permitted
for annual periods beginning on or after April 1, 2018. The Group expects to apply the accounting standard and guidance for annual periods beginning on or after April 1, 2021, and is in the
process of measuring the effects of applying the accounting standard and guidance in future applicable periods.
3. Marketable and Investment Securities
Marketable and investment securities as of March 31, 2018 and 2017, consisted of the following:
Millions of Yen Thousands of
U.S. Dollars
2018 2017 2018
Current:
Government and corporate bonds. . . . . . . . . . . . . . . . . . . . . . . . . . . . . . . . ¥ 15,868 ¥ 3,883 $ 149,698
Other. . . . . . . . . . . . . . . . . . . . . . . . . . . . . . . . . . . . . . . . . . . . . . . . . . . . . 599 5,651
Total. . . . . . . . . . . . . . . . . . . . . . . . . . .. . . . . . . . . . . . . . . .. . . . . . . . . . . ¥ 16,467 ¥ 3,883 $ 155,349
Millions of Yen Thousands of
U.S. Dollars
2018 2017 2018
Noncurrent:
Marketable equity securities. . . . . . . . . . . . . . . . . . . . . . . . . . . . . . . . . . . ¥ 70,274 ¥ 57,013 $ 662,962
Government and corporate bonds. . . . . . . . . . . . . . . . . . . . . . . . . . . . . . . 22,060 21,769 208,113
Other. . . . . . . . . . . . . . . . . . . . . . . . . . . . . . . . . . . . . . . . . . . . . . . . . . . . . 1,601 1,622 15,104
Total. . . . . . . . . . . . . . . . . . . . . . . . . . . . . . . . . . . . . . . . . . . . . . . . . . . . . ¥ 93,935 ¥ 80,404 $ 886,179

22
Notes to Consolidated Financial Statements ROHM CO., LTD. and its Consolidated Subsidiaries
The costs and aggregate fair values of marketable and investment securities at March 31, 2018 and 2017, were as follows:
Millions of Yen 2018
Securities classified as: Available-for-sale: Cost Unrealized Gains Unrealized losses Fair value
Equity securities. . . . . . . . . . . . . . . . . . . . . . . . . . . . . . . ¥ 22,434 ¥ 47,851 ¥ (11) ¥ 70,274
Debt securities. . . . . . . . . . . . . . . . . . . . . . . . . . . . . . . 38,171 573 (816) 37,928
Other. . . . . . . . . . . . . . . . . . . . . . . . . . . . . . . . . . . . . . . 1,529 292 (30) 1,791
Total. . . . . . . . . . . . . . . . . . . . . . . . . . . . . . . . . . . . ¥ 62,134 ¥ 48,716 ¥ (857) ¥ 109,993
Millions of Yen 2017
Securities classified as: Available-for-sale: Cost Unrealized gains Unrealized losses Fair value
Equity securities. . . . . . . . . . . . . . . . . . . . . . . . . . . . . . . ¥ 22,437 ¥ 34,648 ¥ (72) ¥ 57,013
Debt securities. . . . . . . . . . . . . . . . . . . . . . . . . . . . . . . . 24,687 1,266 (301) 25,652
Other . . . . . . . . .. . . . . . . . . . . . . . . . . . . . . . . . . . . . . . 938 226 (24) 1,140
Total. . . . . . . . . . . . . . . . . . . . . . . . . . . . . . . . . . . . ¥ 48,062 ¥ 36,140 ¥ (397) ¥ 83,805
Thousands of U.S. Dollars
2018
Securities classified as: Available-for-sale: Cost Unrealized gains Unrealized losses Fair value
Equity securities. . . . . . . . . . . . . . . . . . . . . . . . . . . . . . . $ 211,642 $ 451,424 $ (104) $ 662,96
Debt securities . . . . . . . . . . . . . . . . . . . . . . . . . . . . . . . . 360,103 5,406 (7,698) 357,811
Other. . . . . . . . . . . . . . . . . . . . . . . . . . . . . . . . . . . . . . . . 14,425 2,755 (283) 16,897
Total. . . . . . . . . . . . . . . . . . . . . . . . . . . . . . . . . . . .
$ 586,170 $ 459,585 $ (8,085)
$ 1,037,67
0
Any marketable and investment securities whose fair values cannot be readily determinable are not included in the table above.
The proceeds, realized gains and realized losses of the available-for-sale securities, which were sold during the years ended March 31, 2018, 2017 and 2016, were as follows:
Millions of Yen
2018
Available-for-sale: Proceeds Realized gains Realized losses
Equity securities. . . . . . . . . . . . . . . . . . . . . . . . . . . . . . . . . . . . . . . . . . . . . ¥ 0 ¥ 0
Total. . . . . . . . . . . . . . . . . . . . . . . . . . . . . . . . . . . . . . . . . . . . . . . . . . . ¥ 0 ¥ 0
Millions of Yen
2017
Available-for-sale: Proceeds Realized gains Realized losses
Equity securities. . . . . . . . . . . . . . . . . . . . . . . . . . . .. . . . . . . . . . . . . . . . . . . . . . ¥ 350 ¥ 177
Total. . . . . . . . . . . . . . . . . . . . . . . . . . . . . . . . . . . . . . . . . . . .. . . . . . . ¥ 350 ¥ 177
Millions of Yen
2016
Available-for-sale: Proceeds Realized gains Realized losses
Equity securities. . . . . . . . . . . . . . . . . . . . . . . . . . . . . . . . . . . . .. . . . . . . . . . . . . ¥ 45 ¥ 22 ¥ (0)
Total. . . . . . . . . . . . . . . . . . . . . . . . . . . . . . . . . . . . . . . . . . . .. . . . . . . ¥ 45 ¥ 22 ¥ (0)

23
The losses on valuation of available-for-sale securities for the years ended March 31, 2018, 2017 and 2016, were ¥82 million ($774
thousand), ¥58 million and ¥4 million, respectively.
4. Short-term Investments
Short-term investments at March 31, 2018 and 2017, consisted of time deposits.
5. Inventories
Inventories at March 31, 2018 and 2017, consisted of the following:
Millions of Yen Thousands of
U.S. Dollars 2018 2017 2018
Merchandise and finished products. . . . . . . . . . . . . . . . . . . . . . . . . . . . . . . . . . . . . . . ¥ 27,563 ¥ 23,198 $ 260,028
Work in process. . . . . . . . . . . . . . . . . . . . . . . . . . . . . . . . . . . . . . . . . . . . . . . . . . . . 41,644 38,699 392,868
Raw materials and supplies. . . . . . . . . . . . . . . . . . . . . . . . . . . . . . . . . . . . . . . . . . . . 29,082 24,801 274,359
Total. . . . . . . . . . . . . . . . . . . . . . . . . . . . . . . . . . . . . . . . . . . . . . . . . . . . . . . . . . ¥ 98,289 ¥ 86,698 $ 927,255
6. Long-lived Assets The Group reviewed its long-lived assets for impairment during the years ended March 31, 2018, 2017 and 2016. In recognizing
impairment loss on fixed assets, for operating assets, the Group identifies asset groups according to the units of management accounting for which revenue and expenditures are managed on a continuous basis, and for idle assets, each property is deemed an asset group. As a result, the Group recognized an impairment loss of ¥7,047 million ($66,481 thousand), ¥2,455 million and ¥2,021 million as other expense for the years ended March 31, 2018, 2017 and 2016, respectively.
The components of impairment loss for the year ended March 31, 2018 were as follows:
a) The Group recognized an impairment loss of ¥6,697 million ($63,179 thousand) for operating assets located in Ireland since the Group estimated that they likely generate profit less than expected at the time of the business acquisition. The carrying amounts of the relevant goodwill and other intangible assets were reduced to the recoverable amounts, which were based on third-party assessment.
b) The Group recognized an impairment loss of ¥350 million ($3,302 thousand) for idle assets located in Japan, the Philippines, Thailand and China, and determined that the idle assets were not likely to be used in the future. The carrying amounts of the relevant idle assets were written down to their recoverable amounts. The recoverable amounts were measured at their net selling prices, which were based on reasonable estimations in consideration of market value of the relevant assets.
The components of impairment loss for the year ended March 31, 2017 were as follows:
a) The Group recognized an impairment loss of ¥2,196 million for operating assets located in Japan and Thailand as the estimated future cash flows fell below the carrying amounts of some asset groups due to the deterioration of the revenue environment. The carrying amounts of the relevant operating assets were reduced to the recoverable amounts which were measured at their value in use, using a discount rate of 8.7% for computation of present value of future cash flows or measured at their net selling prices, which were based on a reasonable estimation in consideration of market value.
b) The Group recognized an impairment loss of ¥259 million for idle assets located in Japan, the Philippines, Thailand and China, and determined that the idle assets were not likely to be used in the future. The carrying amounts of the relevant idle assets were written down to their recoverable amounts. The recoverable amounts were measured at their net selling prices, which were based on reasonable estimations in consideration of market value of the relevant assets.
The components of impairment loss for the year ended March 31, 2016 were as follows:
a) The Group recognized an impairment loss of ¥1,670 million for operating assets located in Japan, China and the United States of America as the estimated future cash flows fell below the carrying amounts of some asset groups due to deterioration of the revenue environment. The carrying amounts of the relevant operating assets were reduced to the recoverable amounts which were measured at their value in use, using a discount rate of 9.2% for computation of present value of future cash flows or measured at their net selling prices, which were based on the appraised value.
Thousands of U.S. Dollars
2018
Available-for-sale:
Proceeds Realized
gains
Realized
lossesEquity securities. . . . . . . . . . . . . . . . . . . . . . . . . . . . . . . . . . . . . . . . . . . . . $ 0 $ 0
Total. . . . . . . . . . . . . . . . . . . . . . . . . . . . . . . . . . . . . . . . . . . .. . . . . . . $ 0 $ 0
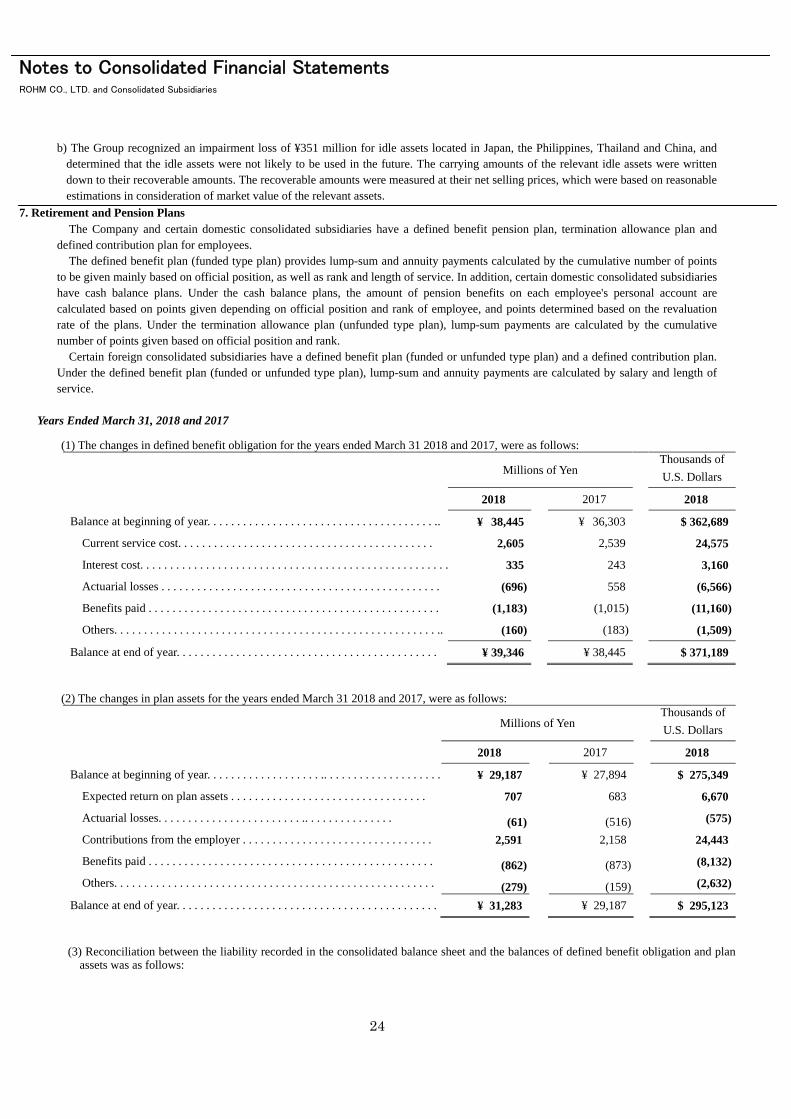
24
Notes to Consolidated Financial Statements ROHM CO., LTD. and Consolidated Subsidiaries
b) The Group recognized an impairment loss of ¥351 million for idle assets located in Japan, the Philippines, Thailand and China, and
determined that the idle assets were not likely to be used in the future. The carrying amounts of the relevant idle assets were written down to their recoverable amounts. The recoverable amounts were measured at their net selling prices, which were based on reasonable estimations in consideration of market value of the relevant assets.
7. Retirement and Pension Plans The Company and certain domestic consolidated subsidiaries have a defined benefit pension plan, termination allowance plan and
defined contribution plan for employees. The defined benefit plan (funded type plan) provides lump-sum and annuity payments calculated by the cumulative number of points
to be given mainly based on official position, as well as rank and length of service. In addition, certain domestic consolidated subsidiaries have cash balance plans. Under the cash balance plans, the amount of pension benefits on each employee's personal account are calculated based on points given depending on official position and rank of employee, and points determined based on the revaluation rate of the plans. Under the termination allowance plan (unfunded type plan), lump-sum payments are calculated by the cumulative number of points given based on official position and rank.
Certain foreign consolidated subsidiaries have a defined benefit plan (funded or unfunded type plan) and a defined contribution plan. Under the defined benefit plan (funded or unfunded type plan), lump-sum and annuity payments are calculated by salary and length of service.
Years Ended March 31, 2018 and 2017
(1) The changes in defined benefit obligation for the years ended March 31 2018 and 2017, were as follows:
Millions of Yen
Thousands of
U.S. Dollars
2018 2017 2018
Balance at beginning of year. . . . . . . . . . . . . . . . . . . . . . . . . . . . . . . . . . . . . . .. ¥ 38,445 ¥ 36,303 $ 362,689
Current service cost. . . . . . . . . . . . . . . . . . . . . . . . . . . . . . . . . . . . . . . . . . . 2,605 2,539 24,575
Interest cost. . . . . . . . . . . . . . . . . . . . . . . . . . . . . . . . . . . . . . . . . . . . . . . . . . . . 335 243 3,160
Actuarial losses . . . . . . . . . . . . . . . . . . . . . . . . . . . . . . . . . . . . . . . . . . . . . . . (696) 558 (6,566)
Benefits paid . . . . . . . . . . . . . . . . . . . . . . . . . . . . . . . . . . . . . . . . . . . . . . . . . (1,183) (1,015) (11,160)
Others. . . . . . . . . . . . . . . . . . . . . . . . . . . . . . . . . . . . . . . . . . . . . . . . . . . . . . .. (160) (183) (1,509)
Balance at end of year. . . . . . . . . . . . . . . . . . . . . . . . . . . . . . . . . . . . . . . . . . . . ¥ 39,346 ¥ 38,445 $ 371,189
(2) The changes in plan assets for the years ended March 31 2018 and 2017, were as follows:
Millions of Yen
Thousands of
U.S. Dollars
2018 2017 2018
Balance at beginning of year. . . . . . . . . . . . . . . . . . . .. . . . . . . . . . . . . . . . . . . . ¥ 29,187 ¥ 27,894 $ 275,349
Expected return on plan assets . . . . . . . . . . . . . . . . . . . . . . . . . . . . . . . . . 707 683 6,670
Actuarial losses. . . . . . . . . . . . . . . . . . . . . . . . .. . . . . . . . . . . . . . . (61) (516) (575)
Contributions from the employer . . . . . . . . . . . . . . . . . . . . . . . . . . . . . . . . 2,591 2,158 24,443
Benefits paid . . . . . . . . . . . . . . . . . . . . . . . . . . . . . . . . . . . . . . . . . . . . . . . . (862) (873) (8,132)
Others. . . . . . . . . . . . . . . . . . . . . . . . . . . . . . . . . . . . . . . . . . . . . . . . . . . . . . (279) (159) (2,632)
Balance at end of year. . . . . . . . . . . . . . . . . . . . . . . . . . . . . . . . . . . . . . . . . . . . ¥ 31,283 ¥ 29,187 $ 295,123
(3) Reconciliation between the liability recorded in the consolidated balance sheet and the balances of defined benefit obligation and plan assets was as follows:
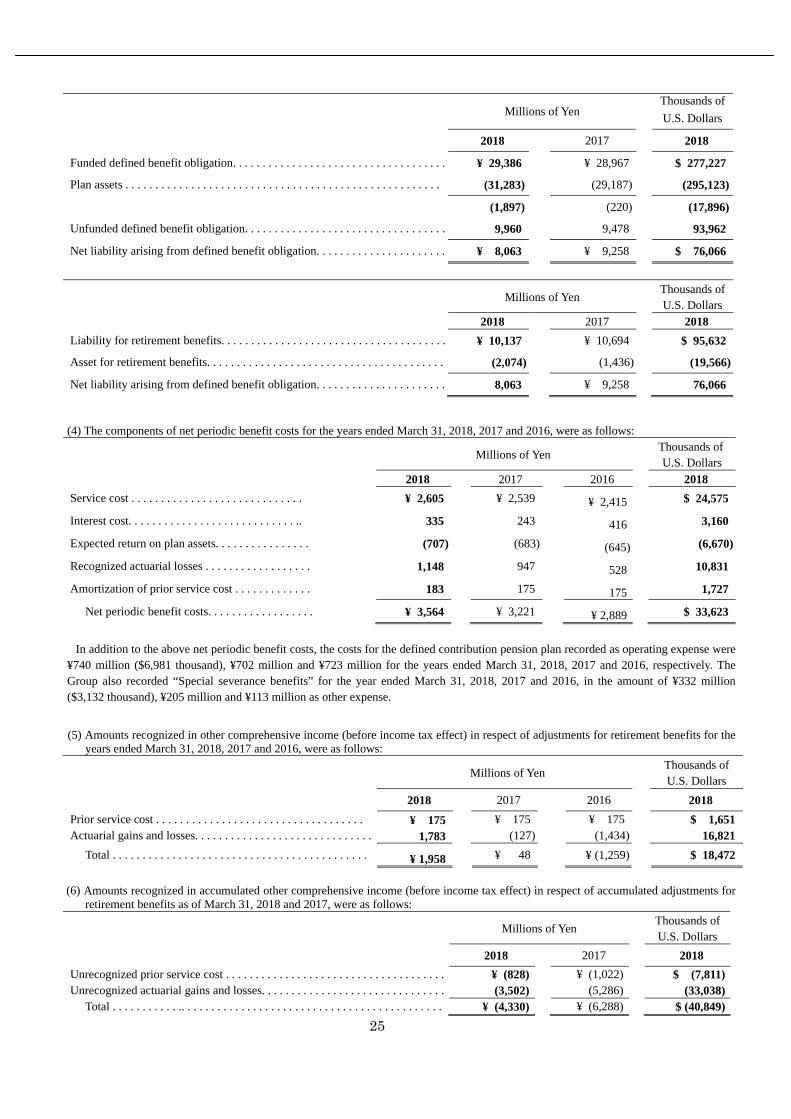
25
Millions of Yen
Thousands of
U.S. Dollars
2018 2017 2018
Funded defined benefit obligation. . . . . . . . . . . . . . . . . . . . . . . . . . . . . . . . . . . . ¥ 29,386 ¥ 28,967 $ 277,227
Plan assets . . . . . . . . . . . . . . . . . . . . . . . . . . . . . . . . . . . . . . . . . . . . . . . . . . . . . (31,283) (29,187) (295,123)
(1,897) (220) (17,896)
Unfunded defined benefit obligation. . . . . . . . . . . . . . . . . . . . . . . . . . . . . . . . . . 9,960 9,478 93,962
Net liability arising from defined benefit obligation. . . . . . . . . . . . . . . . . . . . . . ¥ 8,063 ¥ 9,258 $ 76,066
Millions of Yen
Thousands ofU.S. Dollars
2018 2017 2018
Liability for retirement benefits. . . . . . . . . . . . . . . . . . . . . . . . . . . . . . . . . . . . . . ¥ 10,137 ¥ 10,694 $ 95,632
Asset for retirement benefits. . . . . . . . . . . . . . . . . . . . . . . . . . . . . . . . . . . . . . . . (2,074) (1,436) (19,566)
Net liability arising from defined benefit obligation. . . . . . . . . . . . . . . . . . . . . . 8,063 ¥ 9,258 76,066
(4) The components of net periodic benefit costs for the years ended March 31, 2018, 2017 and 2016, were as follows:
Millions of Yen
Thousands of U.S. Dollars
2018 2017 2016 2018
Service cost . . . . . . . . . . . . . . . . . . . . . . . . . . . . . ¥ 2,605 ¥ 2,539 ¥ 2,415 $ 24,575
Interest cost. . . . . . . . . . . . . . . . . . . . . . . . . . . . .. 335 243 416 3,160
Expected return on plan assets. . . . . . . . . . . . . . . . (707) (683) (645) (6,670)
Recognized actuarial losses . . . . . . . . . . . . . . . . . . 1,148 947 528 10,831
Amortization of prior service cost . . . . . . . . . . . . . 183 175 175 1,727
Net periodic benefit costs. . . . . . . . . . . . . . . . . . ¥ 3,564 ¥ 3,221 ¥ 2,889 $ 33,623
In addition to the above net periodic benefit costs, the costs for the defined contribution pension plan recorded as operating expense were
¥740 million ($6,981 thousand), ¥702 million and ¥723 million for the years ended March 31, 2018, 2017 and 2016, respectively. The Group also recorded “Special severance benefits” for the year ended March 31, 2018, 2017 and 2016, in the amount of ¥332 million ($3,132 thousand), ¥205 million and ¥113 million as other expense.
(5) Amounts recognized in other comprehensive income (before income tax effect) in respect of adjustments for retirement benefits for the years ended March 31, 2018, 2017 and 2016, were as follows:
Millions of Yen
Thousands of U.S. Dollars
2018 2017 2016 2018
Prior service cost . . . . . . . . . . . . . . . . . . . . . . . . . . . . . . . . . . . ¥ 175 ¥ 175 ¥ 175 $ 1,651Actuarial gains and losses. . . . . . . . . . . . . . . . . . . . . . . . . . . . . . 1,783 (127) (1,434) 16,821
Total . . . . . . . . . . . . . . . . . . . . . . . . . . . . . . . . . . . . . . . . . . . ¥ 1,958 ¥ 48 ¥ (1,259) $ 18,472
(6) Amounts recognized in accumulated other comprehensive income (before income tax effect) in respect of accumulated adjustments for
retirement benefits as of March 31, 2018 and 2017, were as follows:
Millions of Yen
Thousands ofU.S. Dollars
2018 2017 2018
Unrecognized prior service cost . . . . . . . . . . . . . . . . . . . . . . . . . . . . . . . . . . . . . ¥ (828) ¥ (1,022) $ (7,811)Unrecognized actuarial gains and losses. . . . . . . . . . . . . . . . . . . . . . . . . . . . . . . (3,502) (5,286) (33,038)
Total . . . . . . . . . . . .. . . . . . . . . . . . . . . . . . . . . . . . . . . . . . . . . . . . . . . . . . . . ¥ (4,330) ¥ (6,288) $ (40,849)
26
Notes to Consolidated Financial Statements ROHM CO., LTD. and its Consolidated Subsidiaries
(7) Plan assets
(a) Components of plan assets
Plan assets consisted of the following:
2018 2017
Debt investments. . . . . . . . . . . . . . . . . . . . . . . . . . . . . . . . . . . . . . . . . . . . . . . . . . . . . . . . . . . . . . . . . 75% 78%Equity investments . . . . . . . . . . . . . . . . . . . . . . . . . . . . . . . . . . . . . . . . . . . . . . . . . . . . . . . . . . . . . . . 13% 11%Others. . . . . . . . . . . . .. . . . . . . . . . . . . . . . . . . . . . . . . . . . . . . . . . . . . . . . . . . . . . . . . . . . . . . . . . . . . 12% 11%
Total . . . . . . . . . . . .. . . . . . . . . . . . . . . . . . . . . . . . . . . . . . . . . . . . . . . . . . . . . . . . . . . . . . . . . . . . . . 100% 100%
(b) Method of determining the expected rate of return on plan assets The expected rate of return on plan assets is determined considering the long-term rates of return which are expected currently and in the future from the various components of the plan assets.
(8) Assumptions used for the years ended March 31, 2018, 2017 and 2016, were set forth as follows:
2018 2017 2016
Discount rate. . . . . . . . . . . . . . . . . . . . . . . . . . . . . . . . . . . . . . . . . . . . . . . . 0.1 - 0.4% 0.2 - 0.5% 0.1 - 0.4%Expected rate of return on plan assets. . . . . . . . . . . . . . . . . . . . . . . . . . . . . 2.0 - 3.0% 2.0 - 3.0% 2.0 - 3.0%
The salary increase rate is not reflected in calculation of the projected benefit obligations of the main retirement and pension plans. 8. Equity
Japanese companies are subject to the Companies Act of Japan (the “Companies Act”). The significant provisions in the Companies Act that affect financial and accounting matters are summarized below:
(a) Dividends
Under the Companies Act, companies can pay dividends at any time during the fiscal year in addition to the year-end dividend upon resolution at the general shareholders’ meeting. Additionally, for companies that meet certain criteria including (1) having a Board of Directors, (2) having independent auditors, (3) having an Audit & Supervisory Board, and (4) the term of service of the directors being prescribed as one year rather than the normal two-year term by its articles of incorporation, the Board of Directors may declare dividends (except for dividends-in-kind) at any time during the fiscal year if the company has prescribed so in its articles of incorporation. However, the Company does not meet all the above criteria.
Semiannual interim dividends may also be paid once a year upon resolution by the Board of Directors if the articles of incorporation of the company so stipulate. The Companies Act provides certain limitations on the amounts available for dividends or the purchase of treasury stock. The limitation is defined as the amount available for distribution to the shareholders, but the amount of net assets after dividends must be maintained at no less than ¥3 million.
(b) Increases / decreases and transfer of common stock, reserve and surplus
The Companies Act requires that an amount equal to 10% of dividends must be appropriated as a legal reserve (a component of retained earnings) or as additional paid-in capital (a component of capital surplus) depending on the equity account that was charged upon the payment of such dividends, until the aggregate amount of legal reserve and additional paid-in capital equals 25% of the common stock. Under the Companies Act, the total amount of additional paid-in capital and legal reserve may be reversed without limitation. The Companies Act also provides that common stock, legal reserve, additional paid-in capital, other capital surplus and retained earnings can be transferred among the accounts within equity under certain conditions upon resolution of the shareholders.
(c) Treasury stock and treasury stock acquisition rights
The Companies Act also provides for companies to purchase treasury stock and dispose of such treasury stock by resolution of the Board of Directors. The amount of treasury stock purchased cannot exceed the amount available for distribution to the shareholders which is determined by a specific formula. Under the Companies Act, stock acquisition rights are presented as a separate component of equity. The Companies Act also provides that companies can purchase both treasury stock acquisition rights and treasury stock. Such treasury stock acquisition rights are presented as a separate component of equity or deducted directly from stock acquisition rights.

27
9. Research and Development Costs
Research and development costs charged to income were ¥38,852 million ($366,528 thousand), ¥37,277 million and ¥40,868 million for the years ended March 31, 2018, 2017 and 2016, respectively.
10. Amortization of Goodwill
Amortization of goodwill was ¥392 million ($3,698 thousand), ¥386 million and ¥246 million for the years ended March 31, 2018, 2017 and 2016, respectively.
11. Loss on business liquidation and Provision for loss on business liquidation
“Loss on business liquidation” for the year ended March 31, 2017 was ¥156 million of loss from the business transfer and ¥112 million of other related losses in connection with the transfer of the lighting business to IRIS Ohyama Inc. on May 31, 2016.
“Loss on business liquidation” and “Provision for loss on business liquidation” for the year ended March 31, 2016 were the estimated amounts of expenses and losses related to the transfer of the lighting business to IRIS Ohyama Inc. on May 31, 2016 and the liquidation of ROHM MECHATECH (TIANJIN) CO., LTD., a wholly-owned subsidiary of ROHM CO., LTD. Loss on valuation of fixed assets described below is measured at the amount by which the balance of the carrying value of “Buildings and
structures” and “Intangible fixed assets” (excluding goodwill) exceeds the net realizable value, and disposal value.
Millions of Yen
2016
Transfer of lighting business Loss on valuation of inventories. . . . . . . . . . . . . . . . . . . . . . . . . . . . . ¥ 1,196
Loss on valuation of fixed assets. . . . . . . . . . . . . . . . . . . . . . . . . . . . 4
Loss on business liquidation total . . . . . . . . . . . . . . . . . . . . . . . . . ¥ 1,200
Provision for loss on business liquidation. . . . . . . . .. . . . . . . . . . . . . ¥ 424
Liquidation of subsidiary Loss on valuation of fixed assets. . . . . . . . . . . . . . . . . . . . . . . . . . . . ¥ 667
Loss on business liquidation total. . . . . . . . . . . . . . . . . . . . . . . . . . ¥ 667 Provision for loss on business liquidation. . . . . . . . . . . . . . . . . . . . . . ¥ 18
12. Income Taxes
The Company and its domestic consolidated subsidiaries are subject to Japanese national and local income taxes which, in the
aggregate, resulted in normal effective statutory tax rates of approximately 30.7% for the years ended March 31, 2018 and 2017, and
32.9% for the year ended March 31, 2016. Foreign consolidated subsidiaries are subject to income taxes of the countries in which they
operate.
The tax effects of significant temporary differences and tax loss carryforwards which resulted in deferred tax assets and liabilities at
March 31, 2018 and 2017, were as follows:
Millions of Yen Thousands of U.S. Dollars
2018 2017 2018
Deferred tax assets: Marketable and investment securities. . . . . . . . . . . . . . . . . . . . . . . . . . . . . . . . ¥ 532 ¥ 1,039 $ 5,019Inventories. . . . . . . . . . . . . . . . . . . . . . . . . . . . . . . . . . . . . . . . . . . . . . . . . . . . . 5,764 6,121 54,377
Depreciation and amortization . . . . . . . . . . . . . . . . . . . . . . . . . . . . . . . . . . . . . 3,326 3,158 31,377
Tax loss carryforwards. . . . . . . . . . . . . . . . . . . . . . . . . . . . . . . . . . . . . . . . . . . . 22,174 23,772 209,189
Accrued expenses. . . . . . . . . . . . . . . . . . . . . . . . . . . . . . . . . . . . . . . . . . . . . . . . 2,540 2,321 23,963
Liability for retirement benefits. . . . . . . . . . . . . . . . . . . . . . . . . . . . . . . . . . . . . 2,867 2,836 27,047
Loss on impairment of long-lived assets. . . . . . . . . . . . . . . . . . . . . . . . . . . . . . 5,155 5,740 48,632
Investments in subsidiaries and associated companies. . . . . . . . . . . . . . . . . . . 7,254 4,009 68,434
Other. . . . . . . . . . . . . . . . . . . . . . . . . . . . . . . . . . . . . . . . . . . . . . . . . . . . . . . . . . 2,371 2,075 22,368
Valuation allowance. . . . . . . . . . . . . . . . . . . . . . . . . . . . . . . . . . . . . . . . . . . . . . (33,525) (36,623) (316,273)
Total. . . . . . . . . . . . . . . . . . . . . . . . . . . . . . . . . . . . . . . . . . . . . . . . . . . . . . . 18,458 14,448 174,133

28
Notes to Consolidated Financial Statements ROHM CO., LTD. and Consolidated Subsidiaries
Millions of Yen
Thousands of
U.S. Dollars
2018 2017 2018
Deferred tax liabilities:
Undistributed earnings of foreign subsidiaries. . . . . . . . . . . . . . . . . . . . . . . . . (19,134) (19,305) (180,509)Asset for retirement benefits. . . . . . . . . . . . . . . . . . . . . . . . . . . . . . . . . . . . . . . (518) (441) (4,887)Depreciation and amortization. . . . . . . . . . . . . . . . . . . . . . . . . . . . . . . . . . . . . . (272) (403) (2,566)Net unrealized gain on available-for-sale securities . . . . . . . . . . . . . . . . . . . . . (13,915) (10,291) (131,274)Other. . . . . . . . . . . . . . . . . . . . . . . . . . . . . . . . . . . . . . . . . . . . . . . . . . . . . . . . . . (380) (471) (3,585)
Total. . . . . . . . . . . . . . . . . . . . . . . . . . . . . . . . . . . . . . . . . . . . . . . . . . . . . . . (34,219) (30,911) (322,821)
Net deferred tax liabilities. . . . . . . . . . . . . . . . . . . . . . . . . . . . . . . . . . . . . . . . . ¥ (15,761) ¥ (16,463) $ (148,688)
Deferred tax assets (liabilities) were included in the consolidated balance sheet as follows:
Millions of Yen Thousands of U.S. Dollars
2018 2017 2018
Current Assets―Deferred tax assets. . . . . . . . . . . . . . . . . . . . . . . . . . . . . . . . . . . . ¥ 9,357 ¥ 9,048 $ 88,274
Investments and Other Assets―Deferred tax assets. . . . . . . . . . . . . . . . . . . . . . . . . 2,580 2,686 24,340
Current Liabilities―Deferred tax liabilities. . . . . . . . . . . . . . . . . . . . . . . . . . . . . . . (30) (2) (283)
Long-term Liabilities―Deferred tax liabilities. . . . . . . . . . . . . . . . . . . . . . . . . . . . (27,668) (28,195) (261,019)
Net deferred tax liabilities. . . . . . . . . . . . . . . . . . . . . . . . . . . . . . . . . . ¥ (15,761) ¥ (16,463) $ (148,688)
As of March 31, 2018, the Company and certain consolidated subsidiaries had tax loss carryforwards of approximately ¥72,124 million ($680,415 thousand) available for reduction of future taxable income, the majority of which will expire from 2019 to 2038.
The reconciliation between the normal effective statutory tax rate and the actual effective tax rate reflected in the accompanying
consolidated statement of income for the years ended March 31, 2018, 2017 and 2016, was as follows:
2018 2017 2016
Normal effective statutory tax rate. . . . . . . . . . . . . . . . . . . . . . . . . . . . . . . . . . . . . . 30.7% 30.7% 32.9% Decrease in valuation allowance. . . . . . . . . . . . . . . . . . . . . . . . . . . . . . . . . . . . . . . . (6.4) (13.2) (16.5) Tax effect of investment in subsidiary. . . . . . . . . . . . . . . . . . . . . . . . . . . . . . . . . . . . (6.3) Tax credit for research and development expenses. . . . . . . . . . . . . . . . . . . . . . . . . . (3.4) (0.2) (1.6) Lower income tax rates applicable to income in certain foreign countries. . . . . . . . (0.6) (1.0) (11.0) Realization of expired tax loss carryforward of liquidated subsidiaries. . . . . . . . . (3.4) Difference of tax rate used for tax effect accounting . . . . . . . . . . . . . . . . . . . . . . . . 1.4 0.6 11.1 Loss on impairment of goodwill. . . . . . . . . . . . . . . . . . . . . . . . . . . . . . . . . . . . . . . 3.5 Income taxes for prior periods. . . . . . . . . . . . . . . . . . . . . . . . . . . . . . . . . . . . . . . . . 5.4 Other – net. . . . . . . . . . . . . . . . . . . . . . . . . . . . . . . . . . . . . . . . . . . . . . . . . . . . . . . . . 1.0 (0.6) 3.6
Actual effective tax rate. . . . . . . . . . . . . . . . . . . . . . . . . . . . . . . . . . . . . . . . . . . . . . 19.9% 18.3% 18.5%
On December 22, 2017, a tax amendment was enacted in the United States which changed the Federal tax rate for the subsidiaries in the United
States from 35% to 27% for the fiscal years beginning on or after January 1, 2018. The effect of this change to the consolidated financial
statements was immaterial.
Income taxes for prior periods were principally the additional tax paid according to a notice from the China Taxation Bureau related to the
transfer pricing taxation for the transactions between the Company and its subsidiaries (ROHM SEMICONDUCTOR CHINA CO., LTD.).
13. Supplemental Cash Flow Information
Major components of assets and liabilities of the business which were transferred during the year ended March 31, 2017: The summary of assets and liabilities of the lighting business which were transferred from the Company and its subsidiary, AGLED
Co Ltd., consideration and proceeds due to the business transfer was as follows:
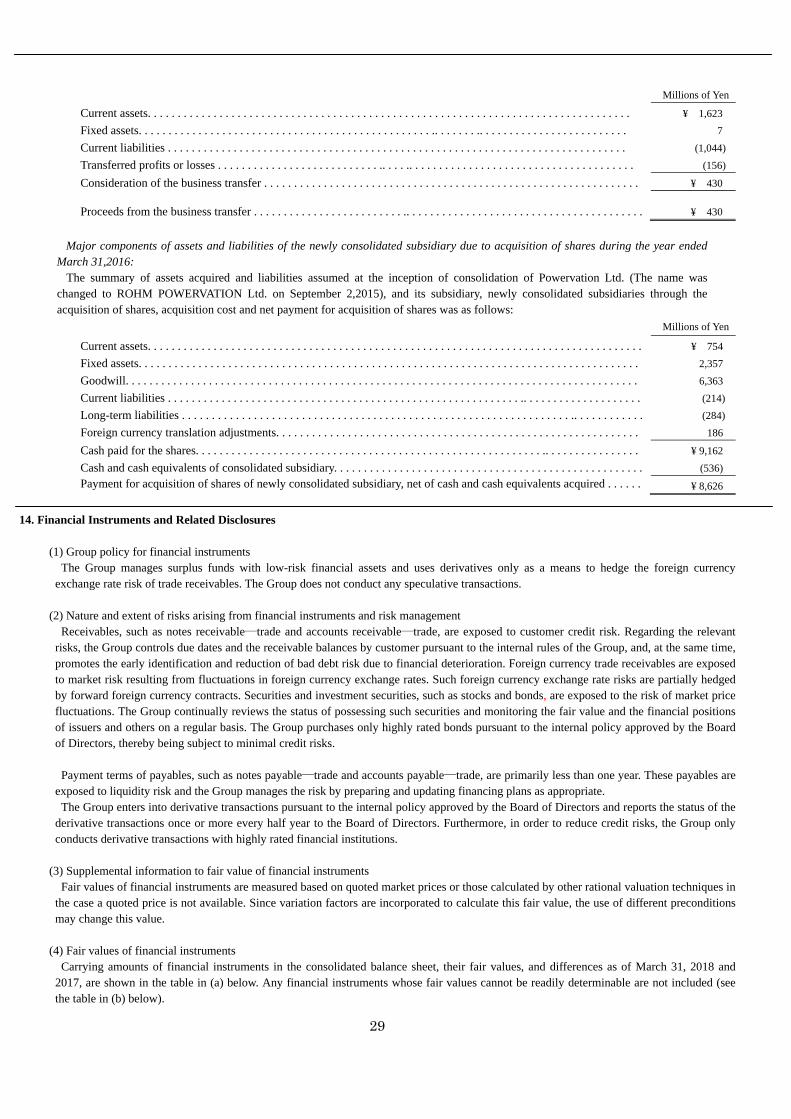
29
Millions of Yen
Current assets. . . . . . . . . . . . . . . . . . . . . . . . . . . . . . . . . . . . . . . . . . . . . . . . . . . . . . . . . . . . . . . . . . . . . . . . . . . . . . . . . ¥ 1,623
Fixed assets. . . . . . . . . . . . . . . . . . . . . . . . . . . . . . . . . . . . . . . . . . . . . . . . . .. . . . . . . .. . . . . . . . . . . . . . . . . . . . . . . . . 7
Current liabilities . . . . . . . . . . . . . . . . . . . . . . . . . . . . . . . . . . . . . . . . . . . . . . . . . . . . . . . . . . . . . . . . . . . . . . . . . . . . . (1,044)
Transferred profits or losses . . . . . . . . . . . . . . . . . . . . . . . . . . . .. . . . .. . . . . . . . . . . . . . . . . . . . . . . . . . . . . . . . . . . . . . (156)
Consideration of the business transfer . . . . . . . . . . . . . . . . . . . . . . . . . . . . . . . . . . . . . . . . . . . . . . . . . . . . . . . . . . . . . . . ¥ 430
Proceeds from the business transfer . . . . . . . . . . . . . . . . . . . . . . . . . .. . . . . . . . . . . . . . . . . . . . . . . . . . . . . . . . . . . . . . . . ¥ 430
Major components of assets and liabilities of the newly consolidated subsidiary due to acquisition of shares during the year ended
March 31,2016: The summary of assets acquired and liabilities assumed at the inception of consolidation of Powervation Ltd. (The name was
changed to ROHM POWERVATION Ltd. on September 2,2015), and its subsidiary, newly consolidated subsidiaries through the acquisition of shares, acquisition cost and net payment for acquisition of shares was as follows:
Millions of Yen
Current assets. . . . . . . . . . . . . . . . . . . . . . . . . . . . . . . . . . . . . . . . . . . . . . . . . . . . . . . . . . . . . . . . . . . . . . . . . . . . . . . . . . . ¥ 754
Fixed assets. . . . . . . . . . . . . . . . . . . . . . . . . . . . . . . . . . . . . . . . . . . . . . . . . . . . . . . . . . . . . . . . . . . . . . . . . . . . . . . . . . . . 2,357
Goodwill. . . . . . . . . . . . . . . . . . . . . . . . . . . . . . . . . . . . . . . . . . . . . . . . . . . . . . . . . . . . . . . . . . . . . . . . . . . . . . . . . . . . . . 6,363
Current liabilities . . . . . . . . . . . . . . . . . . . . . . . . . . . . . . . . . . . . . . . . . . . . . . . . . . . . . . . . . . . .. . . . . . . . . . . . . . . . . . . . (214)
Long-term liabilities . . . . . . . . . . . . . . . . . . . . . . . . . . . . . . . . . . . . . . . . . . . . . . . . . . . . . . . . . . . . . . . . . .. . . . . . . . . . . . (284)
Foreign currency translation adjustments. . . . . . . . . . . . . . . . . . . . . . . . . . . . . . . . . . . . . . . . . . . . . . . . . . . . . . . . . . . . . 186
Cash paid for the shares. . . . . . . . . . . . . . . . . . . . . . . . . . . . . . . . . . . . . . . . . . . . . . . . . . . . . . . . . . .. . . . . . . . . . . . . . . . ¥ 9,162
Cash and cash equivalents of consolidated subsidiary. . . . . . . . . . . . . . . . . . . . . . . . . . . . . . . . . . . . . . . . . . . . . . . . . . . . (536)
Payment for acquisition of shares of newly consolidated subsidiary, net of cash and cash equivalents acquired . . . . . . ¥ 8,626
14. Financial Instruments and Related Disclosures
(1) Group policy for financial instruments The Group manages surplus funds with low-risk financial assets and uses derivatives only as a means to hedge the foreign currency
exchange rate risk of trade receivables. The Group does not conduct any speculative transactions.
(2) Nature and extent of risks arising from financial instruments and risk management Receivables, such as notes receivable―trade and accounts receivable―trade, are exposed to customer credit risk. Regarding the relevant
risks, the Group controls due dates and the receivable balances by customer pursuant to the internal rules of the Group, and, at the same time, promotes the early identification and reduction of bad debt risk due to financial deterioration. Foreign currency trade receivables are exposed to market risk resulting from fluctuations in foreign currency exchange rates. Such foreign currency exchange rate risks are partially hedged by forward foreign currency contracts. Securities and investment securities, such as stocks and bonds, are exposed to the risk of market price fluctuations. The Group continually reviews the status of possessing such securities and monitoring the fair value and the financial positions of issuers and others on a regular basis. The Group purchases only highly rated bonds pursuant to the internal policy approved by the Board of Directors, thereby being subject to minimal credit risks. Payment terms of payables, such as notes payable―trade and accounts payable―trade, are primarily less than one year. These payables are
exposed to liquidity risk and the Group manages the risk by preparing and updating financing plans as appropriate. The Group enters into derivative transactions pursuant to the internal policy approved by the Board of Directors and reports the status of the
derivative transactions once or more every half year to the Board of Directors. Furthermore, in order to reduce credit risks, the Group only conducts derivative transactions with highly rated financial institutions.
(3) Supplemental information to fair value of financial instruments
Fair values of financial instruments are measured based on quoted market prices or those calculated by other rational valuation techniques in the case a quoted price is not available. Since variation factors are incorporated to calculate this fair value, the use of different preconditions may change this value.
(4) Fair values of financial instruments
Carrying amounts of financial instruments in the consolidated balance sheet, their fair values, and differences as of March 31, 2018 and 2017, are shown in the table in (a) below. Any financial instruments whose fair values cannot be readily determinable are not included (see the table in (b) below).

30
Notes to Consolidated Financial Statements ROHM CO., LTD. and Consolidated Subsidiaries
(a) Fair value of financial instruments
Millions of Yen
2018 Carrying amount Fair value
Unrealized gain/loss
Cash and cash equivalents. . . . . . . . . . . . . . . . . . . . . . . . . . . . . . . . . . . . . . . ¥ 243,974 ¥ 243,974 Marketable securities. . . . . . . . . . . . . . . . . . . . . . . . . . . . . . . . . . . . . . . . . . . 16,467 16,467 Short-term investments. . . . . . . . . . . . . . . . . . . . . . . . . . . . . . . . . . . . . . . . . . 45,381 45,381 Notes and accounts receivable – trade. . . . . . . . . . . . . . . . . . . . . . . . . . . . . . . 90,702
Allowance for doubtful receivable. . . . . . . . . . . . . . . . . . . . . . . . . . . . . . . . (457)
Notes and accounts receivable – trade net . . . . . . . . . . . . . . . . . . . . . . . . . . 90,245 90,245 Investment securities. . . . . . . . . . . . . . . . . . . . . . . . . . . . . . . . . . . . . . . . . . . . 93,526 93,526 Refundable income taxes. . . . . . . . . . . . . . . . . . . . . . . . . . . . . . . . . . . . . . . . 206 206
Total. . . . . . . . . . . . . . . . . . . . . . . . . . . . . . . . . . . . . . . . . . . . . . . . . . . . . . . . . ¥ 489,799 ¥ 489,799
Notes and accounts payable – trade. . . . . . . . . . . . . . . . . . . . . . . . . . . . . . . . . ¥ 18,692 ¥ 18,692 Notes and accounts payable – construction and other. . . . . . . . . . . . . . . . . . . 30,364 30,364 Income tax payable . . . . . . . . . . . . . . . . . . . . . . . . . . . . . . . . . . . . . . . . . . . . . 10,423 10,423
Total. . . . . . . . . . . . . . . . . . . . . . . . . . . . . . . . . . . . . . . . . . . . . . . . . . . . . . . . . ¥ 59,479 ¥ 59,479
Millions of Yen
2017 Carrying amount Fair value Unrealized gain/loss
Cash and cash equivalents. . . . . . . . . . . . . . . . . . . . . . . . . . . . . . . . . . . . . . . ¥ 246,015 ¥ 246,015 Marketable securities. . . . . . . . . . . . . . . . . . . . . . . . . . . . . . . . . . . . . . . . . . . 3,883 3,883 Short-term investments. . . . . . . . . . . . . . . . . . . . . . . . . . . . . . . . . . . . . . . . . . 57,601 57,601 Notes and accounts receivable – trade. . . . . . . . . . . . . . . . . . . . . . . . . . . . . . . 81,833
Allowance for doubtful receivable. . . . . . . . . . . . . . . . . . . . . . . . . . . . . . . . (542)
Notes and accounts receivable – trade net . . . . . . . . . . . . . . . . . . . . . . . . . . 81,291 81,291 Investment securities. . . . . . . . . . . . . . . . . . . . . . . . . . . . . . . . . . . . . . . . . . . . 79,922 79,922 Refundable income taxes. . . . . . . . . . . . . . . . . . . . . . . . . . . . . . . . . . . . . . . . 1,137 1,137
Total. . . . . . . . . . . . . . . . . . . . . . . . . . . . . . . . . . . . . . . . . . . . . . . . . . . . . . . . . ¥ 469,849 ¥ 469,849
Notes and accounts payable – trade. . . . . . . . . . . . . . . . . . . . . . . . . . . . . . . . . ¥ 20,851
¥ 20,851 Notes and accounts payable – construction and other. . . . . . . . . . . . . . . . . . . 27,607 27,607 Income tax payable . . . . . . . . . . . . . . . . . . . . . . . . . . . . . . . . . . . . . . . . . . . . . 3,791 3,791
Total. . . . . . . . . . . . . . . . . . . . . . . . . . . . . . . . . . . . . . . . . . . . . . . . . . . . . . . . . ¥ 52,249 ¥ 52,249
Thousands of U.S. Dollars
2018 Carrying amount Fair value
Unrealized gain/loss
Cash and cash equivalents. . . . . . . . . . . . . . . . . . . . . . . . . . . . . . . . . . . . . . . . $ 2,301,642 $ 2,301,642 Marketable securities. . . . . . . . . . . . . . . . . . . . . . . . . . . . . . . . . . . . . . . . . . . 155,349 155,349 Short-term investments. . . . . . . . . . . . . . . . . . . . . . . . . . . . . . . . . . . . . . . . . . 428,123 428,123 Notes and accounts receivable – trade. . . . . . . . . . . . . . . . . . . . . . . . . . . . . . 855,678
Allowance for doubtful receivable. . . . . . . . . . . . . . . . . . . . . . . . . . . . . . (4,311)
Notes and accounts receivable – trade net . . . . . . . . . . . . . . . . . . . . . . . 851,367 851,367 Investment securities. . . . . . . . . . . . . . . . . . . . . . . . . . . . . . . . . . . . . . . . . . . . 882,321 882,321 Refundable income taxes. . . . . . . . . . . . . . . . . . . . . . . . . . . . . . . . . . . . . . . . 1,943 1,943
Total. . . . . . . . . . . . . . . . . . . . . . . . . . . . . . . . . . . . . . . . . . . . . . . . . . . . . . . . . $ 4,620,745 $ 4,620,745 Notes and accounts payable – trade. . . . . . . . . . . . . . . . . . . . . . . . . . . . . . . . $ 176,340 $ 176,340
Notes and accounts payable – construction and other. . . . . . . . . . . . . . . . . . . 286,453 286,453 Income tax payable . . . . . . . . . . . . . . . . . . . . . . . . . . . . . . . . . . .. . . . . . . . . . 98,330 98,330
Total. . . . . . . . . . . . . . . . . . . . . . . . . . . . . . . . . . . . . . . . . . . . . . . . . . . . . . . . . $ 561,123 $ 561,123

31
Cash and cash equivalents, Short-term investments, Notes and accounts receivable―trade, and Refundable income taxes The carrying values of these assets approximate fair value because of their short maturities.
Marketable securities and Investment securities
The fair values of marketable securities and investment securities are measured at the quoted market price of the stock exchange for equity instruments, and at the quoted price obtained from the financial institution for certain debt instruments. The fair value information for the marketable and investment securities by classification is included in Note 3.
Notes and accounts payable―trade, Notes and accounts payable―construction and other, and Accrued income taxes
The carrying values of these liabilities approximate fair value because of their short maturities. Derivatives
Fair value information for derivatives is included in Note 15.
(b) Carrying amount of financial instruments whose fair values cannot be readily determinable Carrying amount Millions of Yen Thousands of
U.S. Dollars 2018 2017 2018Unlisted stock. . . . . . . . . . . . . . . . . . . . . . . . . . . . . . . . . . . . . . . . . . . . . . . . . ¥ 302 ¥ 365 $ 2,849Rights under limited partnership agreement for investment. . . . . . . . . . . . . . 107 117 1,009Investments in unconsolidated subsidiaries and associated companies. . . . . 680 680 6,415
(c) Maturity analysis for financial assets and securities with contractual maturities
Millions of Yen 2018 Due in one year
or lessDue after one yearthrough five years
Due after five years through ten years
Due after tenyears
Cash and cash equivalents. . . . . . . . . . . . . . ¥ 243,974 Marketable securities:
Government and local government bonds 128 Corporate bonds. . . . . . . . . . . . . . . . . . . . 15,854 Other. . . . . . . . . . . . . . . . . . . . . . . . . . . . . 599
Short-term investments. . . . . . . . . . . . . . . . . 45,381 Notes and accounts receivable – trade. . . . . 90,702 Investment securities:
Government and local government bonds ¥ 11 Corporate bonds. . . . . . . . . . . . . . . . . . . 20,326 ¥ 1,966
Refundable income taxes. . . . . . . . . . . . . . . 206 Total. . . . . . . . . . . . . . . . . . . . . . . . . . . . . . . ¥ 396,844 ¥ 20,337 ¥ 1,966
Millions of Yen 2017 Due in one year
or lessDue after one yearthrough five years
Due after five years through ten years
Due after tenyears
Cash and cash equivalents. . . . . . . . . . . . . . ¥ 246,015 Marketable securities:
Government and local government bonds 1 Corporate bonds. . . . . . . . . . . . . . . . . . . . 3,827
Short-term investments. . . . . . . . . . . . . . . . . 57,601 Notes and accounts receivable – trade. . . . . 81,833 Investment securities:
Corporate bonds. . . . . . . . . . . . . . . . . . . ¥ 19,325 ¥ 2,622 Other. . . . . . . . . . . . . . . . . . . . . . . . . . . . . ¥ 1,140
Refundable income taxes. . . . . . . . . . . . . . . 1,137 Total. . . . . . . . . . . . . . . . . . . . . . . . . . . . . . . ¥ 390,414 ¥ 19,325 ¥ 2,622 ¥ 1,140
32
Notes to Consolidated Financial Statements ROHM CO., LTD. and Consolidated Subsidiaries
Thousands of U.S. Dollars 2018 Due in one year
or lessDue after one yearthrough five years
Due after five years through ten years
Due after tenyears
Cash and cash equivalents. . . . . . . . . . . . . . $ 2,301,642 Marketable securities:
Government and local government bonds 1,208 Corporate bonds. . . . . . . . . . . . . . . . . . . 149,565 Other. . . . . . . . . . . . . . . . . . . . . . . . . . . . . 5,651
Short-term investments. . . . . . . . . . . . . . . . . 428,123 Notes and accounts receivable – trade. . . . . 855,679 Investment securities:
Government and local government bonds $ 104 Corporate bonds. . . . . . . . . . . . . . . . . . . . 191,754 $ 18,547
Refundable income taxes. . . . . . . . . . . . . . . 1,943 Total. . . . . . . . . . . . . . . . . . . . . . . . . . . . . . . $ 3,743,811 $ 191,858 $ 18,547
15. Derivatives
The Group enters into foreign exchange forward contracts to hedge foreign currency exchange rate risk associated with certain assets denominated in foreign currencies. All derivative transactions are entered into to hedge foreign currency exposures incorporated within the Group’s business. Accordingly,
market risk in these derivatives is generally offset by opposite movements in the value of the hedged assets. The Group does not hold or issue derivatives for trading purposes.
Because the counterparties to these derivatives are limited to major international financial institutions, the Group does not anticipate any losses arising from credit risk. Derivative transactions entered into by the Group have been made in accordance with internal policies which regulate the authorization and
credit limit amount.
Derivative transactions to which hedge accounting is not applied
Millions of Yen 2018 Contract
amountContract amount
due after one yearFair
value
Unrealizedgain/loss
Foreign currency forward contracts:
Selling U.S.$ . . . . . . . . . . . . . . . . ¥ 11,826 ¥ 68 ¥ 68
Millions of Yen 2017 Contract
amountContract amount
due after one yearFair
value
Unrealizedgain/loss
Foreign currency forward contracts:
Selling U.S.$ . . . . . . . . . . . . . . . . ¥ 8,530 ¥ 131 ¥ 131
Thousands of U.S. Dollars 2018 Contract
amountContract amount
due after one yearFair
value
Unrealizedgain/loss
Foreign currency forward contracts:
Selling U.S.$ . . . . . . . . . . . . . . . . $ 111,566 $ 642 $ 642
16. Leases
The Company and certain consolidated subsidiaries lease certain machinery, computer equipment and other assets. Total lease payments under finance leases were ¥19 million ($179 thousand), ¥12 million and ¥12 million for the years ended March 31, 2018, 2017 and 2016, respectively.
33
Obligations under finance leases and future minimum payments under noncancelable operating leases were as follows: Millions of Yen Thousands of U.S. Dollars 2018 2017 2018
Finance leases Operating
leasesFinanceleases
Operatingleases Finance
leases Operating
leasesDue within one year. . . ¥ 17 ¥ 999 ¥ 17 ¥ 978 $ 160 $ 9,424Due after one year. . . . 15 1,463 17 971 142 13,802Total. . . . . . . . . . . . . . . ¥ 32 ¥ 2,462 ¥ 34 ¥ 1,949 $ 302 $ 23,226
17. Contingent Liabilities
The Group was contingently liable for guarantees of housing loans of employees amounting to ¥48 million ($453 thousand) at March 31,
2018.
18. Comprehensive Income (Loss)
For the years ended March 31, 2018, 2017 and 2016
The components of other comprehensive income for the years ended March 31, 2018, 2017 and 2016, were as follows:
Millions of Yen
Thousands of U.S. Dollars
2018 2017 2016 2018
Unrealized gain (loss) on available-for-sale securities:
Gains arising during the year. . . . . . . . . . . . . . . . . . . . . . . . . . . ¥ 12,127 ¥ 12,797 ¥ (12,093) $ 114,406
Reclassification adjustments to profit or loss. . . . . . . . . . . . . . . (4) (104) 18 (38)
Amount before income tax effect. . . . . . . . . . . . . . . . . . . . . . . 12,123 12,693 (12,075) 114,368
Income tax effect . . . . . . . . . . . . . . . . . . . . . . . . . . . . . . . . . . . . (3,630) (3,758) 4,136 (34,245)
Total . . . . . . . . . . . . . . . . . . . . . . . . . . . . . . . . . . . . . . . . . . . . . . ¥ 8,493 ¥ 8,935 ¥ (7,939) $ 80,123
Foreign currency translation adjustments:
Adjustments arising during the year. . . . . . . . . . . . . . . . . . . . . . ¥ (47) ¥ (3,867) ¥ (29,790) $ (443)
Reclassification adjustments to profit or loss. . . . . . . . . . . . . . . (58)
Amount before income tax effect. . . . . . . . . . . . . . . . . . . . . . . . (47) (3,867) (29,848) (443)
Income tax effect . . . . . . . . . . . . . . . . . . . . . . . . . . . . . . . . . . . . 295 19 2,782
Total . . . . . . . . . . . . . . . . . . . . . . . . . . . . . . . . . . . . . . . . . . . . ¥ 248 ¥ (3,867) ¥ (29,829) $ 2,339
Adjustments for retirement benefits:
Adjustments arising during the year. . . . . . . . . . . . . . . . . . . . . . ¥ 628 ¥ (1,074) ¥ (1,962) $ 5,925
Reclassification adjustments to profit or loss. . . . . . . . . . . . . . . 1,330 1,122 703 12,547
Amount before income tax effect. . . . . . . . . . . . . . . . . . . . . . . . 1,958 48 (1,259) 18,472
Income tax effect . . . . . . . . . . . . . . . . . . . . . . . . . . . . . . . . .. . . . (371) (195) 191 (3,500)
Total. . . . . . . . . . . . . . . . . . . . . . . . . . . . . . . . . . . . . . . . . . . . . . . ¥ 1,587 ¥ (147) ¥ (1,068) $ 14,972
Total other comprehensive income (loss). . . . . . . . . . . . . . . . . . . . ¥ 10,328 ¥ 4,921 ¥ (38,836) $ 97,434
19. Subsequent Event
Appropriation of retained earnings The following appropriation of retained earnings at March 31, 2018, was approved at the Company’s general shareholders’ meeting held on
June 28, 2018.
Millions of Yen Thousands of U.S. Dollars
Year-end cash dividends, ¥120.00 ($1.13) per share . . . . . . . . . . . . . . . . . . . . . . . . . . ¥ 12,693 $ 119,745 20. Segment Information
Under ASBJ Statement No. 17 “Accounting Standard for Segment Information Disclosures,” and ASBJ Guidance No. 20 “Guidance on Accounting Standard for Segment Information Disclosures,” an entity is required to report financial and descriptive information about its reportable segments. Reportable segments are operating segments or aggregations of operating segments that meet specified criteria.

34
Notes to Consolidated Financial Statements ROHM CO., LTD. and Consolidated Subsidiaries
Operating segments are components of an entity about which separate financial information is available and such information is evaluated regularly by the chief operating decisionmaker in deciding how to allocate resources and in assessing performance. Generally, segment information is required to be reported on the same basis as is used internally for evaluating operating segment performance and deciding how to allocate resources to operating segments.
(a) Description of reportable segments
The Group’s reportable segments are those for which separate financial information is available and regular evaluation by the Company’s Board of Directors is being performed in order to decide how resources are allocated among the Group.
The Group is a comprehensive manufacturer of electronic components, and sets up operational divisions by individual product category at its headquarters. Each operational division draws up comprehensive production plans and business strategies for both domestic and overseas operations, and develops global production activities. Therefore, from a management standpoint, the Group places great importance on monitoring profits and losses by operating segments organized as operational divisions of individual product categories. For this reason, the Group aggregates operating segments in consideration of characteristics of the products that each operational division manufactures and similarities of production processes, and has three reportable segments “ICs”, “Discrete semiconductor devices” and “Modules.” In the ICs segment, products such as analog ICs, logic ICs, memory ICs and MEMS are manufactured.
Products manufactured in the Discrete semiconductor devices segment include diodes, transistors, light-emitting diodes, and laser diodes. Products manufactured in the Modules segment include print-heads, optical modules, and power modules.
(b) Methods of measurement for the amounts of sales, profit (loss), assets and other items for each reportable segment
The accounting policies of each reportable segment are basically consistent with those disclosed in Note 2, “Summary of Significant
Accounting Policies.”
Operating income is applied in “Segment profit.” “Intersegment sales or transfers” are calculated based on the market price.
Although assets of common divisions, such as sales and administrative divisions, are included in “Reconciliations,” depreciation and amortization expense of these assets are allocated to each operating segment according to in-house criteria to calculate the profit of each segment.
(c) Information about sales, profit (loss), assets and other items is as follows:
Millions of Yen
2018
Reportable segments
Sales: ICs
Discrete
semiconductor devices
Modules Total
Other
Total Reconcili-
ations
Consoli-
dated
Sales to external customers. . . ¥ 183,431 ¥ 149,915 ¥ 41,830 ¥ 375,176 ¥ 21,931 ¥ 397,107 ¥ 397,107
Intersegment sales or transfers 2,875 9,218 91 12,184 53 12,237 ¥ (12,237)
Total. . . . . . . . . . . . . . . 186,306 159,133 41,921 387,360 21,984 409,344 (12,237) 397,107
Segment profit . . . . . . . . . . . . 20,182 32,193 3,794 56,169 2,968 59,137 (2,132) 57,005
Segment assets. . . . . . . . . . . . 122,043 103,058 18,581 243,682 15,151 258,833 611,202 870,035
Other
Depreciation and amortization. 20,293 18,638 3,725 42,656 1,598 44,254 (847) 43,407
Amortization of goodwill. . . . 392 392 392 392
Increase in property, plant and
equipment and intangible assets 25,078
23,149 1,185 49,412 4,407
53,819
2,092 55,911

35
Millions of Yen
2017
Reportable segments
Sales: ICs
Discrete
semiconductor devices
Modules Total
Other
Total Reconcili-
ations
Consoli-
dated
Sales to external customers. . . . . ¥ 161,195 ¥ 130,036 ¥ 39,609 ¥ 330,840 ¥ 21,170 ¥ 352,010 ¥ 352,010
Intersegment sales or transfers . . . 2,723 6,474 32 9,229 79 9,308 ¥ (9,308)
Total. . . . . . . . . . . . . . . . . 163,918 136,510 39,641 340,069 21,249 361,318 (9,308) 352,010
Segment profit . . . . . . . . . . . . . . 9,064 20,917 1,793 31,774 1,498 33,272 (1,444) 31,828
Segment assets. . . . . . . . . . . . . . 118,318 91,516 21,629 231,463 13,121 244,584 589,920 834,504
Other
Depreciation and amortization. . . 18,421 17,039 3,747 39,207 2,393 41,600 (799) 40,801
Amortization of goodwill. . . . . . 386 386 386 386
Increase in property, plant and
equipment and intangible assets. . 16,485
17,705 2,709 36,899 1,926
38,825
3,358 42,183
Millions of Yen
2016
Reportable segments
Sales: ICs
Discrete
semiconductor devices
Modules Total
Other
Total Reconcili-
ations
Consoli-
dated
Sales to external customers. . . ¥ 164,081 ¥ 126,436 ¥ 36,371 ¥ 326,888 ¥ 25,510 ¥ 352,398 ¥ 352,398
Intersegment sales or transfers 2,549 3,583 94 6,226 51 6,277 ¥ (6,277)
Total. . . . . . . . . . . . . . . 166,630 130,019 36,465 333,114 25,561 358,675 (6,277) 352,398
Segment profit . . . . . . .. . . . . 7,661 21,505 4,594 33,760 262 34,022 (387) 33,635
Segment assets. . . . . . . . . . . . 121,216 92,589 20,507 234,312 16,780 251,092 553,042 804,134
Other
Depreciation and amortization. 17,526 16,677 2,322 36,525 2,820 39,345 (1,007) 38,338
Amortization of goodwill. . . . 246 246 246 246
Increase in property, plant and
equipment and intangible assets 20,974
21,992 4,696 47,662 1,315
48,977
7,710 56,687
Thousands of U.S. Dollars
2018
Reportable segments
Sales: ICs
Discrete
semiconductor devices
Modules Total
Other
Total Reconcili-
ations
Consoli-
dated
Sales to external customers. . . $1,730,481 $1,414,292 $394,623 $3,539,396 $206,896 $3,746,292
$3,746,292
Intersegment sales or transfers 27,123 86,963 858 114,944 500 115,444 $ (115,444)
Total. . . . . . . . . . . . . . 1,757,604 1,501,255 395,481 3,654,340 207,396 3,861,736 (115,444) 3,746,292
Segment profit . . . . . . .. . . . . 190,396 303,708 35,792 529,896 28,000 557,896 (20,113) 537,783
Segment assets. . . . . . . . . . . 1,151,349 972,245 175,293 2,298,887 142,934 2,441,821 5,766,056 8,207,877
Other
Depreciation and amortization. 191,443 175,830 35,142 402,415 15,076 417,491 (7,991) 409,500
Amortization of goodwill. . . 3,698 3,698 3,698 3,698
Increase in property, plant and
equipment and intangible assets 236,585
218,387 11,179 466,151 41,575
507,726
19,736 527,462
“Other” includes operating segments that are not included in the reportable segments, consisting of business in resistors and tantalum capacitors.

36
Notes to Consolidated Financial Statements ROHM CO., LTD. and Consolidated Subsidiaries
“Reconciliations” were as follows:
(1) The adjusted amount of the segment profit for the year ended March 31, 2018, ¥(2,132) million ($(20,113) thousand), mainly includes general and administrative expenses of ¥(806) million ($(7,604) thousand) not attributable to the operating segments, and the settlement adjustment of ¥(1,326) million ($(12,509) thousand) not allocated to the operating segments (such as periodic pension cost). The adjusted amount of the segment profit for the year ended March 31, 2017, ¥(1,444) million, mainly includes general and administrative expenses of ¥(778) million not attributable to the operating segments, and the settlement adjustment of ¥(666) million not allocated to the operating segments (such as periodic pension cost). The adjusted amount of the segment profit for the year ended March 31, 2016, ¥(387) million, mainly includes general and administrative expenses of ¥(960) million not attributable to the operating segments, and the settlement adjustment of ¥573 million not allocated to the operating segments (such as periodic pension cost).
(2) The adjusted amount of the segment assets for the year ended March 31, 2018, ¥611,202 million ($5,766,056 thousand), mainly includes corporate assets of ¥613,146 million ($5,784,396 thousand) not allocated to the operating segments, and the adjustments of fixed asset of ¥(1,944) million ($(18,340) thousand). Corporate assets not attributable to the operating segments mainly consist of cash and cash equivalents of ¥243,974 million ($2,301,642 thousand), land of ¥93,935 million ($886,179 thousand), and notes and accounts receivable-trade of ¥90,702 million ($855,679 thousand). The adjusted amount of the segment assets for the year ended March 31, 2017, ¥589,920 million, mainly includes corporate assets of ¥592,093 million not allocated to the operating segments, and the adjustments of fixed asset of ¥(2,173) million. Corporate assets not attributable to the operating segments mainly consist of cash and cash equivalents of ¥246,015 million, investment securities of ¥80,404 million, and notes and accounts receivable-trade of ¥81,833 million. The adjusted amount of the segment assets for the year ended March 31, 2016, ¥553,042 million, mainly includes corporate assets of ¥555,521 million not allocated to the operating segments, and the adjustments of fixed asset of ¥(2,479) million. Corporate assets not attributable to the operating segments mainly consist of cash and cash equivalents of ¥231,802 million, notes and accounts receivable-trade of ¥70,336 million, and land of ¥66,161 million.
(3) The adjusted amount of depreciation and amortization relates to the settlement adjustment not allocated to the operating segments (such as unrealized profit or loss on fixed assets).
(4) The adjusted amount of increase in property, plant and equipment and intangible fixed assets relates to common divisions, such as
sales and administrative divisions.
(d) Relevant information
For the years ended March 31, 2018, 2017 and 2016
(1) Information about products and services
The classification of products and services has been omitted as it is identical to the segment classification.
(2) Information about geographical areas
(i) Sales
Millions of Yen
2018
Japan China Other Total
¥ 125,505 ¥ 123,990 ¥ 147,612 ¥ 397,107
Millions of Yen
2017
Japan China Other Total
¥ 106,226 ¥ 115,647 ¥ 130,137 ¥ 352,010
Millions of Yen
2016
Japan China Other Total
¥ 97,854 ¥ 115,790 ¥ 138,644 ¥ 352,398

37
Thousands of U.S. Dollars
2018
Japan China Other Total
$ 1,184,009 $ 1,169,717 $ 1,392,566 $ 3,746,292 Sales are classified by country or region based on the location of customers.
(ii) Property, plant and equipment
(3) Information about major customers
Since there are no customers who accounted for more than 10% of sales to external customers in the consolidated statement of income,
the information has been omitted.
(e) Information regarding loss on impairment of long-lived assets of reportable segments
Millions of Yen
2018
Reportable segments
Other
Reconciliati
ons Consolidated
Loss on impairment of
long-lived assets. . . . . . . . .
ICs Discrete
semiconductordevices
Modules Total
¥ 6,916 ¥ 108 ¥ 19 ¥ 7,043 ¥ 4 ¥ 7,047
Millions of Yen
2017
Reportable segments
Other
Reconciliati
ons Consolidated
Loss on impairment of
long-lived assets. . . . . . . . .
ICs Discrete
semiconductordevices
Modules Total
¥ 100 ¥ 22 ¥ 122 ¥ 2,196 ¥ 137 ¥ 2,455
Millions of Yen
2016
Reportable segments
Other
Reconciliati
ons Consolidated
Loss on impairment of
long-lived assets. . . . . . . . .
ICs Discrete
semiconductordevices
Modules Total
¥ 1,196 ¥ 598 ¥ 1,794 ¥ 3 ¥ 224 ¥ 2,021
Millions of Yen
2018
Japan China Thailand Philippines Other Total
¥ 146,469 ¥ 18,964 ¥ 28,430 ¥ 25,759 ¥ 20,605 ¥ 240,227
Millions of Yen
2017
Japan China Thailand Philippines Other Total
¥ 141,229 ¥ 19,973 ¥ 27,895 ¥ 24,018 ¥ 18,156 ¥ 231,271
Thousands of U.S. Dollars
2018
Japan China Thailand Philippines Other Total
$ 1,381,783 $ 178,906 $ 268,208 $ 243,009 $ 194,386 $ 2,266,292
38
Notes to Consolidated Financial Statements ROHM CO., LTD. and Consolidated Subsidiaries
Thousands of U.S. Dollars
2018
Reportable segments
Other Reconciliati
ons Consolidated
Loss on impairment of
long-lived assets. . . . . . . . .
ICs Discrete
semiconductordevices
Modules Total
$ 65,245 $ 1,019 $ 179 $ 66,443 $ 38 $ 66,481
The amount under “Other” for the years ended March 31, 2018, 2017 and 2016, is mainly for impairment loss on tantalum capacitors.
(f) Information regarding amortization of goodwill and carrying amount of reportable segments
For the years ended March 31, 2018
There is no relevant information about the carrying amount of goodwill. Amortization of goodwill has been omitted as similar information
is disclosed in “(c) Information about sales, profit (loss), assets and other items.”
For the years ended March 31, 2017
Amortization of goodwill has been omitted as similar information is disclosed in “(c) Information about sales, profit (loss), assets and other
items.”
(g) Information regarding profit for negative goodwill of reportable segments
There is no relevant information for the years ended March 31, 2018, 2017 and 2016.
Millions of Yen
2017Reportable segments
Other Reconciliatio
ns
ConsolidatedICs
Discrete semiconductor
devices Modules Total
Goodwill at March 31, 2017 . . . ¥ 5,356 ¥ 5,356 ¥ 5,356
www.rohm.com