
Faculty Perceptions and Readership Patterns of Finance Journals: a
24
1 Faculty Perceptions and Readership Patterns of Finance Journals: a Global View Elisabeth Oltheten University of Illinois at Urbana-Champaign Champaign, Illinois, USA [email protected] Vasilis Theoharakis Athens Laboratory of Business Administration (ALBA) Athens, Greece [email protected] Nickolaos G. Travlos Athens Laboratory of Business Administration (ALBA) Athens, Greece [email protected] and Cardiff Business School Cardiff, Wales, U.K. March 19, 2003 The authors would like to acknowledge Mike Jones, Nikos Milonas, Mary Skordia, Nikos Tessaromatis, Jason Xiao and Stefanos Zarkos for their helpful comments. Nickolaos Travlos acknowledges financial support from the Kitty Kyriacopoulos Chair in Finance.
Transcript of Faculty Perceptions and Readership Patterns of Finance Journals: a

1
Faculty Perceptions and Readership Patterns of Finance Journals: a Global View
Elisabeth Oltheten University of Illinois at Urbana-Champaign
Champaign, Illinois, USA [email protected]
Vasilis Theoharakis Athens Laboratory of Business Administration (ALBA)
Athens, Greece [email protected]
Nickolaos G. Travlos Athens Laboratory of Business Administration (ALBA)
Athens, Greece [email protected]
and Cardiff Business School
Cardiff, Wales, U.K.
March 19, 2003
The authors would like to acknowledge Mike Jones, Nikos Milonas, Mary Skordia, Nikos
Tessaromatis, Jason Xiao and Stefanos Zarkos for their helpful comments. Nickolaos Travlos
acknowledges financial support from the Kitty Kyriacopoulos Chair in Finance.
2
ABSTRACT
With an increased pressure to publish in internationally highly regarded journals, faculty evaluations
frequently depend on journal rankings. Nonetheless, debates about journal rankings frequently arise
since they do not take into account the underlying diversity of the finance research community.
Therefore this study examines how contextual factors such as a researcher’s geographical origin,
research interests, seniority and journal affiliation may influence their journal quality perceptions
and readership patterns. Our analysis is based on a worldwide sample of 862 finance academics
where the perceived journal quality is measured across a number of dimensions, including journal
familiarity, average rank position, percent of respondents who classify a journal as top tier, and
readership. The results support that while there is remarkable consistency in identifying the top
journals, for the remaining journals a significant variation on journal quality perceptions exists
based on a researcher’s geographic origin, research interests, seniority and journal affiliation.

3
Journal quality is frequently used by faculty and university administrators as a surrogate measure
of research output quality (Alexander and Mabry 1994). In Finance, as in any other discipline,
journal ratings play a crucial role in faculty promotions, tenure decisions, and in determining salary
raises and related incentive schemes and awards1. Leading business schools, as determined by the
US News & World Report’s rankings, tend to have a stronger research orientation (Borokhovich,
Bricker, Brunarski, and Simkins 1995) and journal ratings are taken under serious consideration in
the quality evaluation of finance departments by U.S. accreditation teams and by the U.K. Research
Assessment Exercise. But it is not possible to explore the relationship between faculty publication
records and both business school reputation and faculty salaries unless there is general agreement on
the relative influence of each journal (Borokhovich, Bricker, and Simkins 2000). Prior research in
Finance has measured journal influence primarily based on citations data (Alexander and Mabry
1994, Borokhovich, Bricker and Simkins 1994, Borokhovich, Bricker and Simkins 2000, Fishe
1998, Mabry and Sharplin 1985, Zivney and Reichenstein 1994). However, as indicated by
Alexander and Mabry (1994), the use of citations for journal rankings has some drawbacks. This
study takes a different approach by examining the relative journal quality perceptions of finance
faculty around the globe2.
In addition to providing a journal assessment based quality perceptions, the main benefit of this
study stems from its ability to examine the diversity in opinion across various segments of the
finance research community. Such a detailed segmentation of the field is useful because finance
consists of several specializations, each representing different backgrounds and expertise. Therefore,
this underlying diversity frequently leads to debates about the relative importance and quality of
published research. Furthermore, this study contributes to the literature in three areas: global
dimension, sample size, and methodology. The global dimension is essential since the existing
literature focuses primarily on U.S. academics despite the fact that there is substantial research
evidence to support the view that academics from different regions of the world have different
research approaches (Collin et al, 1996). Our sample size allows us to consider the views of a large
fraction of the global population of finance faculty and to compare the perceptions of respondents
from different geographic regions, or with different research interests, different levels of seniority,
and different journal affiliations. The sample itself is not limited to chairpersons, as in Coe and
Weinstock (1983) and Borde, Cheney and Madura (1999), but includes all faculty ranks, allowing us
to capture a broader “market” view of journal quality. Finally, the methodology uses five metrics to

4
examine perceived quality: a) journal familiarity, b) average rank position, c) weighted-by-
familiarity average rank position (index), d) percent of respondents who classify a journal as a top
tier and e) readership. Thus, our methodology not only examines the multidimensional nature of
journal quality but also presents a measure of actual journal “consumption”, readership, which has
not been explored by previous studies.
Our analysis of 862 survey responses by finance academics worldwide demonstrates that no
major variations exist in the perceptions of the top three finance journals. The Journal of Finance
consistently ranks as the top journal across all metrics. On the contrary, journal quality perceptions
for journals other than the top three exhibit significant differences across geographical regions,
research interests, and level of seniority. Furthermore, respondents significantly favor journals with
which they are affiliated. These differences in perceptions are confirmed by an ordered PROBIT
model that accounts for a respondent’s geographical origin, research interest, level of seniority, and
journal affiliation. While we find a high correlation between our worldwide perception-based
measures with previous citation based rankings, the correlation between our rankings and those
based on the Social Science Citation Index (SSCI) are much lower.
The findings of this study are useful in that they: i) demonstrate that significant differences
across various segments of the finance faculty do exist, ii) assist authors, junior faculty in particular,
across the world in their search for a research outlet, iii) provide some helpful insights to
departments and schools in their tenure and promotion decisions, and iv) facilitate journal editors in
their view of their journal’s standing and positioning. The remainder of this paper is organized as
follows: Section I presents a review of the literature. Section II describes data sources and the
methodology applied. Section III presents the empirical findings, and Section 4 offers our summary
and conclusions.
I. Literature Review
The literature on finance journal quality is extensive with citations being the dominant approach
for measuring the relative importance and influence of finance journals. Mabry and Sharplin (1985)
ranked journals based on the citations received by the Journal of Finance (JF), Journal of Financial
Economics (JFE), Journal of Financial and Quantitative Analysis (JFQA) and the Journal of Money,
Credit and Banking (JMCB). Alexander and Mabry (1994) use JF, JFE, JFQA and Review of
5
Financial Studies (RFS) as the “top journals” for their source of citations. In order to achieve a
broader representation of the finance literature and by using a similar methodology, Zivney and
Reichenstein (1994) expand the number of journals used as the source of citations to eighteen. More
recently, Chan, Fok and Pan (2000) in their citations based ranking further expanded the source of
journals used to fifty-nine. Citations-based approaches have also been used to examine journal
communication and influence (Borokhovich, Bricker and Simkins 1994), to assess the research
productivity of individuals and institutions (Chung, Cox and Mitchell 2001), and to determine the
research standards for full professors of Finance in top and lower ranked finance departments (Fishe
1998). Further, researchers have been ranked based on their contribution of articles in leading
journals (Borokhovich et al 1995, Borokhovich and Chung 2000, Heck and Cooley 1988,
Klemkosky and Tutle 1977, Niemi 1987, Schweser 1977, Zivney and Bertin 1992).
Although citations based rankings are believed to be objective, they may suffer from some
inherent biases such as self-citing (Alexander and Mabry 1994). Another issue with citation-based
studies is that they represent an aggregate measure of influence for the overall finance community
and cannot identify the perspective of individuals that might have different research interest areas or
originate from different geographic locations. This could be particularly important since a split in
research cultures and traditions between European and American academics has been found in
management research (Collin et al 1996). As a remedy to these problems, researchers have used
perceptual ranking surveys. For example, Coe and Weinstock (1983) and Borde, Cheney and
Madura (1999) have analyzed the perceptions of department chairpersons of AACSB US business
schools. However, while understanding the opinion of chairpersons is useful, as they are an
influential but relatively small group, their opinion does not accurately reflect the larger body of
active researchers (Alexander and Mabry 1994). Further, perception based ranking studies have been
criticized to suffer from inherent bias such as self-serving and pre-disposition bias of respondents
towards different journals (Jobber and Simpson 1988, Todorov and Glanzel 1988), deriving from the
fact that the ranking of journals can affect one’s academic standing (Luukhonen 1992). Nonetheless,
this study is based on the premise that researchers for any number of reasons may have a different
perspective (that others may have described as “bias”) with regards to the assessment of journal
quality. Therefore, we disaggregate the international finance research community into segments and
test for differences in journal quality perceptions. This is an effort that no previous study has
systematically undertaken for the purpose of identifying perceptual differences based on the
6
geographical origin, research interest area, seniority or affiliation of a large worldwide sample of
finance academics. Further, in an era where research dissemination and impact is measured by web
site downloads (Pinkowitz 2002), journal readership, as a measure of “actual” research
consumption, has not been explored. Finally, we compare our derived perceptual based measures
with other measures based on citations.
II. Data & Methodology
Due to the high penetration of e-mail/internet among finance faculty, an online survey was
constructed. We collected a total of 2,784 finance faculty names and emails from: i) the Worldwide
Directory of Finance Faculty sponsored by the Ohio State University Department of Finance and the
American Finance Association (http://www.cob.ohio-state.edu/fin/findir/), ii) the European
Financial Management Association website (http://www.efmaefm.org/) and iii) the webpages of
finance departments of business schools worldwide (Bradshaw 2000). Emails inviting participants to
our online survey were sent followed by a reminder about a month after the initial message. From
the original 2,784 emails, 448 “bounced”. In total we received 862 useable responses corresponding
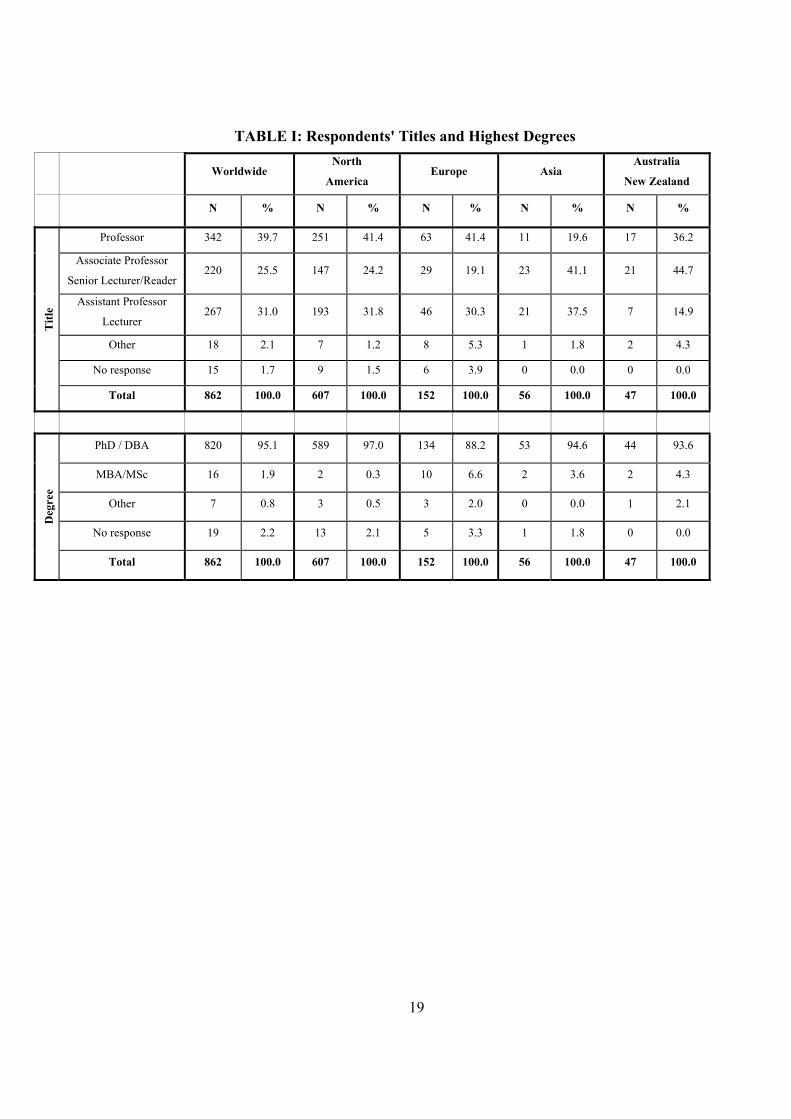
to an overall useable response rate of 36.9 percent. The majority of the respondents (Table I) are
from North America (607, representing 70.4% of our sample), 152 from Europe (17.6%), 56 from
Asia (6.5%), and 47 from Australia and New Zealand (5.5%). While 65% of our respondents hold
the rank of associate professor/senior lecturer and above, 95% hold a Ph.D. or equivalent (97% in
North America versus 88% in Europe).
Insert Table I here
In our survey, we requested from respondents to rank as top tier up to ten of the most rigorous
and prestigious finance journals, based on their contribution to the finance discipline, and up to ten
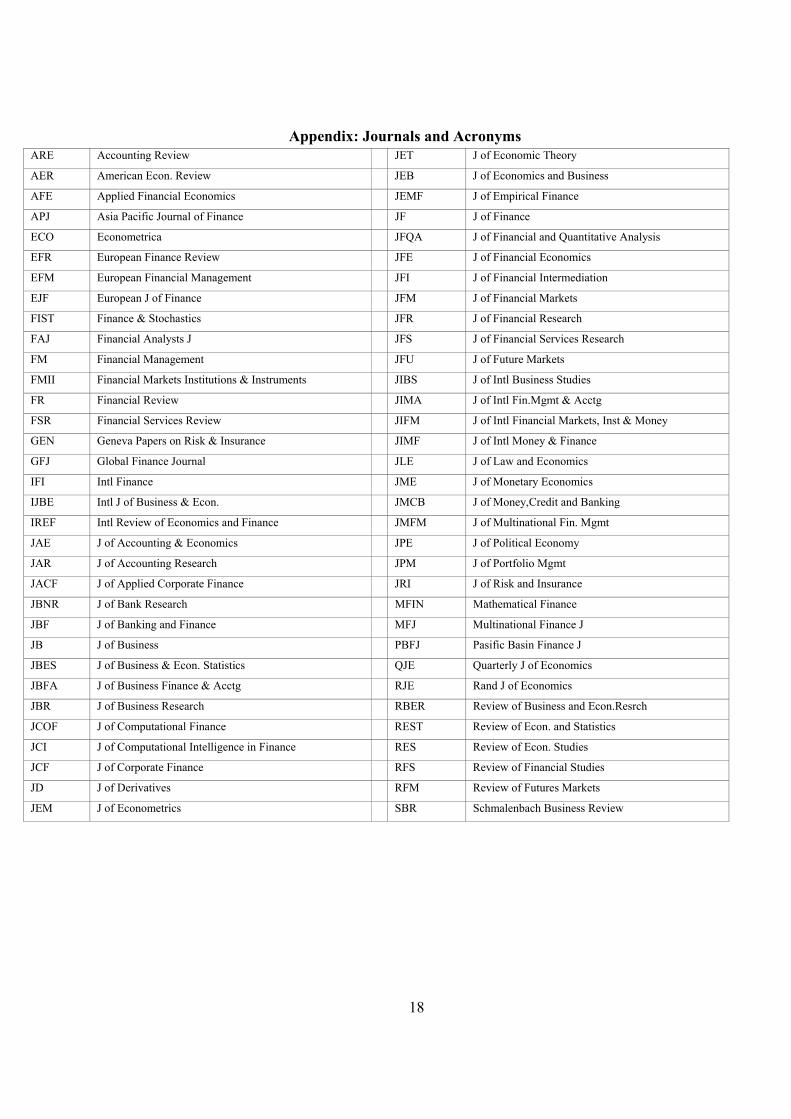
additional journals as second tier. While respondents could write-in any journal they wished, 66
journals (Appendix A) were placed on a pull-down menu. These journals were selected based on the
results of previous studies, personal communications with faculty from various universities and
survey pre-testing. We also requested from respondents to provide up to five journals that they
regularly read, their research interest area, the number of papers they have published and in which
journals, and their participation in editorial boards.
7
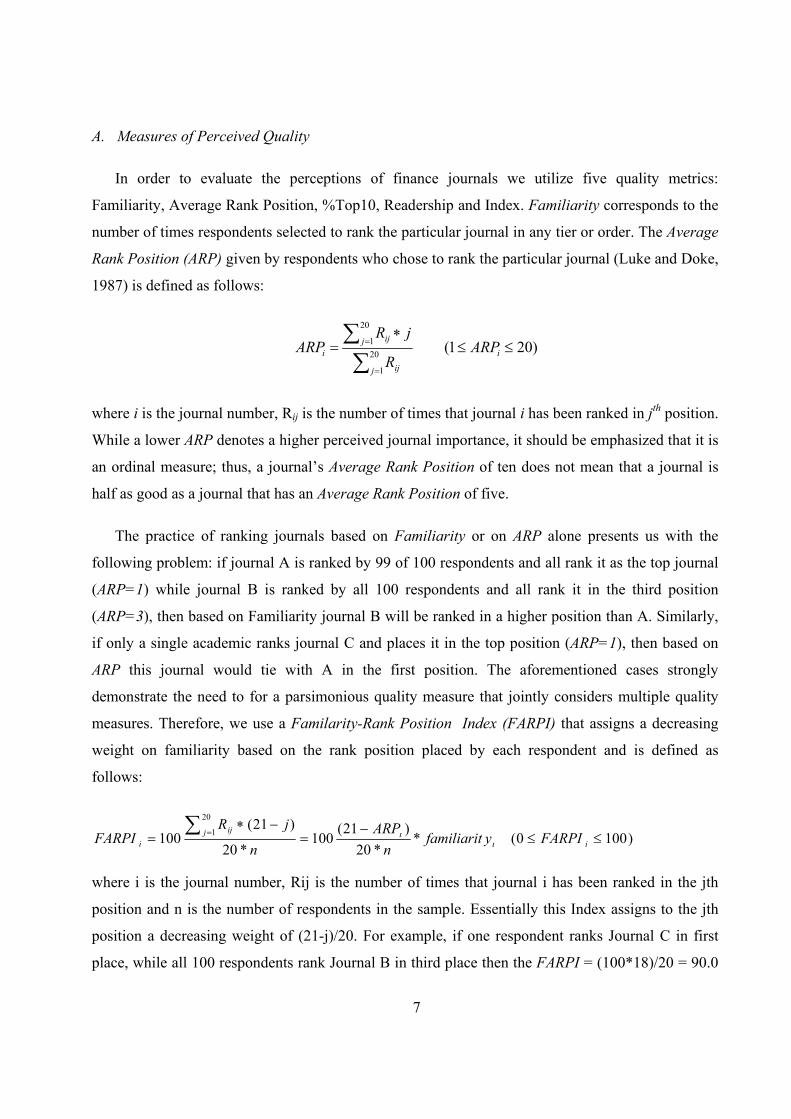
A. Measures of Perceived Quality
In order to evaluate the perceptions of finance journals we utilize five quality metrics:
Familiarity, Average Rank Position, %Top10, Readership and Index. Familiarity corresponds to the
number of times respondents selected to rank the particular journal in any tier or order. The Average
Rank Position (ARP) given by respondents who chose to rank the particular journal (Luke and Doke,
1987) is defined as follows:
)201(20
1
20
1 ≤≤∗
=∑∑
=
=i
j ij
j iji ARP
R
jRARP
where i is the journal number, Rij is the number of times that journal i has been ranked in jth position.
While a lower ARP denotes a higher perceived journal importance, it should be emphasized that it is
an ordinal measure; thus, a journal’s Average Rank Position of ten does not mean that a journal is
half as good as a journal that has an Average Rank Position of five.
The practice of ranking journals based on Familiarity or on ARP alone presents us with the
following problem: if journal A is ranked by 99 of 100 respondents and all rank it as the top journal
(ARP=1) while journal B is ranked by all 100 respondents and all rank it in the third position
(ARP=3), then based on Familiarity journal B will be ranked in a higher position than A. Similarly,
if only a single academic ranks journal C and places it in the top position (ARP=1), then based on
ARP this journal would tie with A in the first position. The aforementioned cases strongly
demonstrate the need to for a parsimonious quality measure that jointly considers multiple quality
measures. Therefore, we use a Familarity-Rank Position Index (FARPI) that assigns a decreasing
weight on familiarity based on the rank position placed by each respondent and is defined as
follows:
)1000(**20
)21(100
*20
)21(100
20
1 ≤≤−
=−∗
=∑ =
ij ij
i FARPIyfamiliaritn
ARPn
jRFARPI ι
ι
where i is the journal number, Rij is the number of times that journal i has been ranked in the jth
position and n is the number of respondents in the sample. Essentially this Index assigns to the jth
position a decreasing weight of (21-j)/20. For example, if one respondent ranks Journal C in first
place, while all 100 respondents rank Journal B in third place then the FARPI = (100*18)/20 = 90.0
8
of Journal B would outrank the FARPI = (1*19)/20 = 0.95 of Journal C and thus demonstrating the
greater influence and prestige of Journal B. Similarly, if 99 respondents rank Journal A in first place
then the FARPI = (99*20)/20 = 99.0 of Journal A would more accurately capture the greater
influence and prestige of Journal A3.
Since respondents were asked to rank up to ten top tier journals and then proceed to rank the
remaining journals, we introduce another metric of perceived importance: the percentage of
respondents who ranked the journal as top tier (%Top10). This is a relevant measure because in most
tenure and promotion reviews, a certain number of ‘A’ journal publications are required. Finally,
Readership refers to the percentage of respondents who listed the journal among the ones they
regularly read. While we list journals based on the FARPI, we believe that no single criterion fully
captures quality perceptions and readers should examine each journal individually in the proper
context and across the metrics provided.
III. Empirical Findings
The breadth of the Finance discipline is illustrated by the sheer number and diversity of Journals
ranked in the top twenty. One hundred forty-three different journals were ranked somewhere in the
top 20 by at least one respondent, although only 59 were mentioned by more than twenty
respondents, and 40 by more than 100 respondents. The top 40 journals and their relative measures
are reported in Table II for Worldwide, North American, and European respondents while in Table
III the top 30 journals are reported for respondents from Asia and Australia/New Zealand. The tables
present journals ranked by FARPI. Our choice of ranking journals by FARPI stems from the fact that
its correlation coefficients with the other metrics are much higher than the correlation coefficients of
each one of the other metrics with the remaining ones. This implies that FARPI is a representative
measure of journal quality.
Insert Table II here
The Journal of Finance (JF) clearly dominates the field regardless of the ranking criteria used.
The Journal of Financial Economics (JFE) and the Review of Financial Studies (RFS) are perceived
as rounding out the top three journals worldwide across all metrics. We also observe the top
economic journals, that is The American Economic Review (AER), the Journal of Political
Economy (JPE), and Econometrica (ECO), are included among the top ten sources of finance

9
literature. The Journal of Business (JB), Journal of Banking and Finance (JBF), and Financial
Management (FM) were also perceived in the top ten with JBF knocking JB out of fifth place only
in Europe.
The Journal of Finance is also the most frequently read journal across all geographic areas with
almost 92% of worldwide respondents indicating that they read JF regularly. Only in Australia/New
Zealand readership falls to 83.70%. Although the top ranked journals also tend to be the most
frequently read journals, there are some notable exceptions4. For example, the Journal of Applied
Corporate Finance (JACF), ranked 30th worldwide with an average rank position of 13.4, is read
regularly by 10.4% of respondents, placing it 14th in terms of readership. On the other hand, the
Journal of Economic Theory (JET) is ranked 18th overall with an average rank position of 9.4, but is
read regularly by only 3.6% of respondents worldwide.
Insert Table III here
A Identifying Perceptual Differences
To formally evaluate whether statistically significant differences in journal quality perceptions
exist, an ordered PROBIT model was utilized where journal rankings were expressed as a function
of contextual factors such as geographic location, research area, seniority and journal affiliation. The
estimated equation is expressed in the following form:
RPi = a0 + b1EURi +b2 ASIAi + b3AUSTR/NZi
+ b4CORPFINi + b5INVDERi + b6FIi + b7 IFMi
+ b8SENi + b9AFFi +ei
where RPi represents rank position of journal i and takes the values 1, 2…20, 21, with 1 representing
top first ranking, 20 representing lowest ranking and 21 denoting that the journal was not included in
the top twenty journals. In this model, dummy variables (taking the value of 1) are used for
geographical regions that indicated if the respondent is located in Europe (EUR), Asia (ASIA) or
Australia/New Zealand (AUSTR/NZ). North America is captured by the constant term. Therefore,
the coefficients for the various regions measure the difference in the probabilities associated with
journal ranking between North American survey respondents and European, Asian and Australian &
New Zealander respondents, respectively. Dummy variables are also used to capture ranking
10
differences according to respondents’ research interests. We used four dummy variables (taking the
value of 1) that indicated if the respondent was interested in Corporate Finance (CORPFIN),
Investments and Derivatives (INVDER) Financial Institutions (FI), or International Finance,
Institutions and Markets (IFM). Similarly, the SEN dummy variable (taking the value of 1),
indicates if a senior faculty member (Senior Lecturer, Reader, Associate Professor, Professor).
Finally, the dummy variable AFF is used to capture journal affiliation, as that is expressed through
the editorial board membership or authorship of a faculty member.
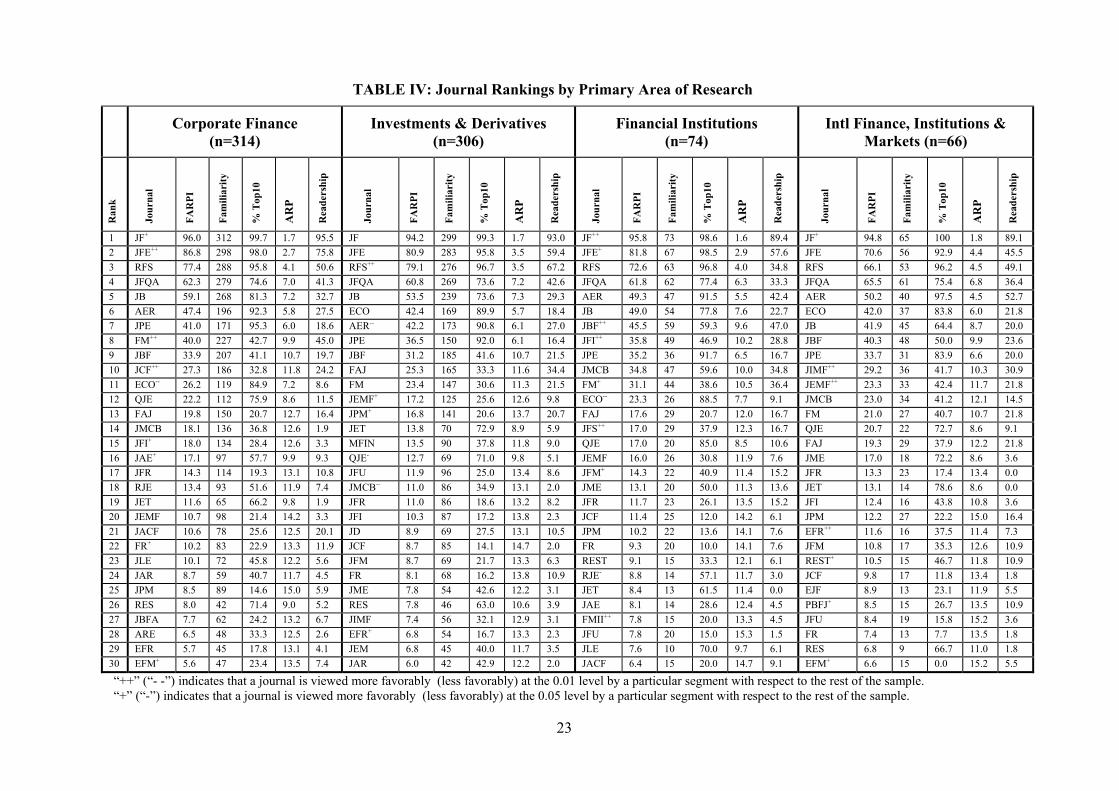
The superscripts attached next to the journal symbols in Tables II, III, and IV denote the cases where
the relevant dummy variables were found to be statistically significant. A sign of “++” (“- -”)
indicates that a journal is viewed more favorably (less favorably) at the 0.01 level by a particular
segment with respect to the rest of the sample. Similarly, a sign of “+” (“-”) indicates that a journal
is viewed more favorably (less favorably) at the 0.05 level by a particular segment with respect to
the rest of the sample.
B. Differences based on Geographic Origin
As it can be seen from Table II, thirty-five out of forty journals are common in the list of the top
40 journals in North America and Europe. However, nineteen out of the forty top European journals
are perceived differently in a statistically significant manner in Europe. In particular, thirteen out of
forty journals are viewed more favorably in Europe than in North America. Naturally, some
European based journals, such as the Journal of Banking and Finance (JBF), Journal of Business,
Finance and Accounting (JBFA), Journal of Empirical Finance (JEMF), European Financial Review
(EFR), European Financial Management Journal (EFM), European Journal of Finance (EJF),
Applied Financial Economics (AFE) and Geneva Papers on Risk and Insurance (GEN) are perceived
more favorably in Europe relative to North America. In Europe we note that the Journal of Business
(JB), American Economic Review (AER), Journal of Political Economy (JPE), Financial
Management (FM), Journal of Financial Research (JFR) and Financial Review (FR) are viewed less
favorably relative to North America. Interestingly enough, the Journal of Finance (JF) and the
Review of Financial Studies (RFS) are highly appreciated in Europe. At the same time, North
American respondents include in their list of the forty most influential journals several European
based journals which suggests that North American academics, contrary to frequent allegations, do
appreciate research published in non-US based journals.
11
The majority of the thirty most influential journals in Asia are included in the list of most
influential journals in North America and Europe while only one Asia based journal, Pacific Basin
Finance Journal (PBFJ), is included in the thirty most influential Asian journals that they clearly
favor. With 59.6% of our Asian respondents having received their highest degree from the US, they
appear to have similar preferences as their North American colleagues. Nonetheless, similarly with
Europeans, Asians view more favorably the Journal of Banking and Finance (JBF), the Journal of
Empirical Finance (JEMF), the Journal of International Money and Finance (JIMF), and the Journal
of Business, Finance and Accounting (JBFA). In Australia/New Zealand eleven out of thirty
journals are perceived more favorably than in North America. Four of these journals are based in
Europe (EJF, EFR, JBF, JEMF) and two in Asia (APJ, PBFJ). In addition, three journals, the Journal
of Finance (JF), Journal of Political Economy (JPE), and Journal of Financial Intermediation (JFI),
are considered less influential in Australia/New Zealand than in North America.
Readership also shows some distinctive local patterns. For example, the Pacific Basin Finance
Journal (PBFJ) is much more widely read in Asia and in Australia/New Zealand than in Europe or
North America. Similarly, European Financial Management (EFM) is read much more in Europe
than in any other region. The overall conclusion drawn from analyzing the regional differences of
journal quality perceptions is that although there is worldwide agreement on the very top journals
(Journal of Finance, Journal of Financial Economics and Review of Financial Studies) significant
differences exist regarding the perceived quality of some regional journals.
C. Differences by Primary Area of Research
Table IV presents journal quality perceptions of the four most popular research areas: Corporate
Finance, Investments and Derivatives, Financial Institutions, and International Finance, Institutions
and Markets. Corporate Finance (314 respondents), is the most popular followed by Investments and
Derivatives (306 respondents). Quality perceptions are once again remarkably homogeneous for the
top journals. In particular, the Journal of Finance (JF) clearly dominates across all primary areas of
research regardless of the metric used. The Journal of Financial Economics (JFE) is rated second by
most metrics used. The Review of Financial Studies (RFS) and the Journal of Financial and
Qualitative Analysis (JFQA) rank third and fourth, respectively, according to the majority of metrics
used. Based on the ordinal PROBIT analysis, the Journal of Finance (JF) is perceived more
favorably, relative to the rest of the population, in three out of four research areas, that is in
12
Corporate Finance, Financial Institutions, and International Finance and Institutions and Markets.
The Journal of Financial Economics (JFE) is perceived more favorably in Corporate Finance and in
Financial Institutions relative to the rest of the population.
Insert Table IV here
Researchers in Corporate Finance perceive more favorably the Journal of Finance (JF), Journal
of Financial Economics (JFE), Financial Management (FM), Journal of Corporate Finance (JCF),
Journal of Financial Intermediation (JFI), Journal of Accounting and Economics (JAE), Financial
Review (FR) and European Financial Management (EFM). To the contrary, Econometrica (ECO) is
perceived less favorably by academics in this research area. Researchers interested in Investments
and Derivatives perceived more favorably the Review of Financial Studies (RFS), Journal of
Empirical Finance (JEMF), Journal of Portfolio Management (JPM), and European Financial
Review (EFR), while they perceive less favorably the American Economic Review (AER), the
Quarterly Journal of Economics (QJE) and the Journal of Money Credit and Banking (JMCB).
Researchers interested in Financial Institutions perceive more favorably the Journal of Finance (JF),
Journal of Financial Economics (JFE), Journal of Banking and Finance (JBF), Journal of Financial
Intermediation (JFI), Financial Management (FM), Journal of Financial Services (JFS), Journal of
Financial Markets, (JFM) and Financial Markets Institutions and Instruments (FMII). On the
contrary they perceive Econometrica (ECO) less favorably. Researchers in International Finance,
Institutions and Markets perceive more favorably the Journal of Finance (JF), Journal of
International Money and Finance (JIMF), Journal of Empirical Finance (JEMF), European Financial
Review (EFR), Review of Economics and Statistics (REST) Pacific Basin Finance Journal (PBFJ)
and European Financial Management (EFM).
Overall, although there is once again consistency in identifying the top three journals across
research areas, we find that each research area is associated with its own cluster of specialized
journals.
D. Differences by Seniority Level
The perceptions of thirteen journals (out of the top forty worldwide) differ depending on the
level of seniority5. In particular, senior faculty members perceive less favorably Econometrica
(ECO), European Financial Review (EFR), Journal of Business and Economics Statistics (JBES),
13
Journal of Econometrics (JEM), Journal of Economic Theory (JET), Journal of Political Economy
(JPE), Quarterly Journal of Economics (QJE), Review of Economics and Statistics (RES), Review
of Financial Studies (RFS) and Rand Journal of Economics (RJE). On the other hand, senior faculty
members perceive favorably the Financial Management (FM), the Journal of Applied Corporate
Finance (JACF) and the Journal of Financial Research (JFR). It seems that senior finance faculty
members appreciate more than their junior colleagues journals which publish review articles and
address the practical aspects of the discipline.
E. Differences based on Affiliation
It has been frequently hypothesized that journal quality perceptions of researchers affiliated with
a journal are biased in favor for the particular journal. In order to test for this hypothesis a dummy
variable was included in our ordinal PROBIT model where a respondent was considered to be
affiliated with a journal if they had published in the journal or participated on the journal’s editorial
board. Indeed we found that although we controlled for a researcher’s research interest area,
geographical origin and seniority being affiliated with a journal leads to significantly more favorable
perceptions for all of our forty worldwide leading journals6. However, it should be noted that as our
ordinal PROBIT does not test for causality, it is just as likely that respondents affiliate themselves
with a journal because they think it is rigorous and influential as it is likely that they think the
journal is rigorous and influential because they are affiliated with it.
F. Perceptions versus Citations
Finally, we compare our perceptual rankings with the Social Sciences Citation Index (SSCI)
reported by the 2001 Journal Citation Report and those reported by Chan, Fok and Pan (2000). The
Journal Citation Report limitations are immediately apparent since it tracks only 28 out of the top 40
Journals of our worldwide ranking, while the Chan, Fok and Pan (2000) study has 37 out of our top
40 journals. The correlation coefficient between our index and the SSCI Impact Factor is low (0.43)
in comparison to the significant (0.87) correlation coefficient with the citations based impact factor
of Chan et al. (2000). Therefore, it appears that the arguments of previous studies against the use of
the SSCI because it does not focus on citations found in the finance literature, is confirmed by its
low correlation with our perceptions based ranking (Alexander and Mabry 1994).
14
IV. Conclusions
The journals where finance faculty publish play a crucial role in determining both business
school reputation and finance faculty salaries. Thus, there is a strong need to identify which journals
are influential. While prior research in Finance measured journal influence primarily on citations
data, such an approach cannot distinguish between the different perspectives that might exist in the
research community. Therefore, this study takes a different approach by focusing on the perceptions
about relative journal quality of the finance faculty globally. In addition to considering the views of
a large fraction of the global population, this study also compares responses from different
geographic regions, research areas, seniority level, and affiliation. Furthermore, by using five
metrics we examine the multidimensional nature of journal quality and we present readership as a
measure of actual journal “consumption”, an aspect that has not been previously explored. Finally,
this study compares the perceptions-based rankings of this study to the citations based rankings of
prior studies.
The major findings of this study based on 862 survey responses of finance faculty worldwide
can be summarized as follows: First, the Journal of Finance ranks consistently as the very top
journal using all five metrics, regardless of geographic region, research area, seniority level, or
affiliation. Second, unlike in other disciplines (Theoharakis and Hirst 2002), no major variation
exists in the ranking of the top three Finance Journals: the Journal of Finance, Journal of Financial
Economics, and Review of Financial Studies, across respondents’ geographic regions, seniority
levels, research areas, and journal affiliation. Third, although there is a remarkably homogeneous
perception regarding the quality and influence of the top journals, respondents from each research
area favor their own cluster of journals. Fourth, there is a significant difference in perceived journal
quality across different levels of seniority. Fifth, while the above conclusions are examined after
controlling for any journal affiliation bias, thus addressing the self-selection and predisposition bias
associated with survey based methodologies, indeed we do find that respondents affiliated with a
journal have a consistently more favorable view for the journal. Sixth, the comparison of the
perception based rankings of this study to those based on the SSCI Impact Factor is low, lending
support to the arguments presented in prior studies against the use of the SSCI for the rankings of
finance journals.

15
Our results demonstrate that diversity in journal quality perceptions do exist raising a
warning against monolithic research evaluation practices that do not account for the underlying
differences of the research community. In addition to demonstrating this diversity, our findings are
important for at least three reasons: First, we demonstrate the importance of a broader range of
journals and therefore assist faculty members across the world in their search for the appropriate
research outlet. Second, they provide useful insights to departments and schools in their promotion
and tenure decisions. Third, they assist journal editors in viewing their journal’s standing and
position. Finally, while only a small number of journals enjoy a significant number of regular
readers, readership data provided us with an additional dimension for assessing journals.

16
REFERENCES
Alexander, John C. Jr. and Rodney H. Mabry, 1994, Relative Significance of Journals, Authors, and Articles Cited in Financial Research, Journal of Finance 49, 697-712.
Borde, Stephen F, John M. Cheney, and Jeff Madura, 1999, A Note on Perceptions of Finance Journal Quality, Review of Quantitative Finance and Accounting 12, 89-96.
Borokhovich, Kenneth A., Robert J. Bricker, Kelly R. Brunarski, and Betty J. Simkins, 1995, Finance Research Productivity and Influence, Journal of Finance 50, 1691-1717.
Borokhovich, Kenneth A., Robert J. Bricker, Kelly R. Brunarski, and Betty J. Simkins, 1998, The Institutional and Geographic Distribution of Authorship in Finance Research, Financial Practice and Education 8, 41-50.
Borokhovich, Kenneth A., Robert J. Bricker, and Betty J. Simkins, 1994, Journal Communication and Influence in Financial Research, Journal of Finance 49, 713-725.
Borokhovich, Kenneth A., Robert J. Bricker, and Betty J. Simkins, 2000, Analysis of Finance Journal Impact Factors, Journal of Finance 55, 1457-1469.
Borokhovich, Kenneth A. and Richard Chung, 2000, Financial Research: Evidence from Recent Graduates of Doctoral Programs, Financial Practice and Education 10, 85-92
Bradshaw, D., 2000, FT MBA 2000. Financial Times, January 24. Chan, Kam C., Robert C.W. Fok, and Ming-Shiun Pan, 2000, Citation-Based Finance Journal
Rankings: An Update, Financial Practice and Education 10, 132-141. Chung, Kee H., Raymond A.K. Cox, and John B. Mitchell, 2001, Citation Patterns in the Finance
Literature, Financial Management, 99-118. Coe, Robert K. and Irwin Weinstock, 1983, Evaluating the Finance Journals: The Department
Chairperson’s Perspective, Journal of Financial Research 6, 435-349. Collin, Sven-Olof, Johansson, Ulf, Svensson, Katarina, Ulvenblad, Per-Ola, 1996, Market
Segmentation in Scientific Publications: Research Patterns in American vs. European Management Journals, British Journal of Management 7, 141-154.
Fishe, Raymond P.R., 1998, What are the research standards for Full Professor of Finance?, Journal of Finance 53, 1053-1079.
Heck, J. Louis, and Philip L. Cooley, 1988, Most frequent contributors in the finance literature, Financial Management 17, 100-108.
Heck, J. Louis, Philip L. Cooley, and Carl M. Hubbard, 1986, Contributing Authors and Institutions to the Journal of Finance: 1946-1985, Journal of Finance 41, 1129-1140.
Jobber, David and Simpson, Paul, 1988, A Citation Analysis of Selected Marketing Journals, International Journal of Research in Marketing 5, 137-142.
Klemkosky, Robert C. and Donald Tuttle, 1977, The Institutional Source and Concentration of Financial Research, Journal of Finance 32, 901-907.
Luke, R.H., and E.R. Doke, 1987, Marketing Journal Hierarchies: Faculty Perceptions 1986-87. Journal of the Academy of Marketing Science 15, 74-7.
Luukhonen, Terttu, 1992, Is Scientists' Behaviour Reward-Seeking?, Scientometrics 24, 297-319.
17
Mabry, Rodney H. and Arthur D. Sharplin, 1985, The Relative Importance of Journals used in Finance Research, Journal of Financial Research 8, 287-296.
Neimi, Albert W. Jr., 1987, Institutional Contributions to the Leading Finance Journals, 1975 through 1986: A Note, Journal of Finance 42, 1389-1397.
Social Sciences Citation Index Journal Citation Report (IJCR), 2001, Institute for Scientific Information, 2002.
Pinkowitz, Lee, 2002, Research Dissemination an Impact: Evidence from Web Site Downloads, Journal of Finance 57, 485-499.
Schweser, Carl, 1977, The Doctoral Origins of Contributors to the Journal of Finance from 1964 through 1975, Journal of Finance 32, 908-910.
Swidler, Steve and Elizabeth Goldreyer, 1998, The Value of a Finance Journal Publication, Journal of Finance 53, 351-363.
Theoharakis, Vasilis and Hirst Andrew, 2002, Perceptual Differences of Marketing Journals: A Worldwide Perspective, Marketing Letters 13, 389-402.
Todorov, R., Glanzel, W., 1988, Journal Citation Measures: A Concise Review, Journal of Information Science 14, 47-56.
Zivney, Terry L. and William J. Bertin, 1992, Publish or Perish: What the Competition is Really Doing, Journal of Finance 47, 295-329.
Zivney, Terry L. and William Reichenstein, 1994, The Pecking Order in Finance Journals, Financial Practice and Education 4, 77-87.
18
Appendix: Journals and Acronyms ARE Accounting Review JET J of Economic Theory
AER American Econ. Review JEB J of Economics and Business
AFE Applied Financial Economics JEMF J of Empirical Finance
APJ Asia Pacific Journal of Finance JF J of Finance
ECO Econometrica JFQA J of Financial and Quantitative Analysis
EFR European Finance Review JFE J of Financial Economics
EFM European Financial Management JFI J of Financial Intermediation
EJF European J of Finance JFM J of Financial Markets
FIST Finance & Stochastics JFR J of Financial Research
FAJ Financial Analysts J JFS J of Financial Services Research
FM Financial Management JFU J of Future Markets
FMII Financial Markets Institutions & Instruments JIBS J of Intl Business Studies
FR Financial Review JIMA J of Intl Fin.Mgmt & Acctg
FSR Financial Services Review JIFM J of Intl Financial Markets, Inst & Money
GEN Geneva Papers on Risk & Insurance JIMF J of Intl Money & Finance
GFJ Global Finance Journal JLE J of Law and Economics
IFI Intl Finance JME J of Monetary Economics
IJBE Intl J of Business & Econ. JMCB J of Money,Credit and Banking
IREF Intl Review of Economics and Finance JMFM J of Multinational Fin. Mgmt
JAE J of Accounting & Economics JPE J of Political Economy
JAR J of Accounting Research JPM J of Portfolio Mgmt
JACF J of Applied Corporate Finance JRI J of Risk and Insurance
JBNR J of Bank Research MFIN Mathematical Finance
JBF J of Banking and Finance MFJ Multinational Finance J
JB J of Business PBFJ Pasific Basin Finance J
JBES J of Business & Econ. Statistics QJE Quarterly J of Economics
JBFA J of Business Finance & Acctg RJE Rand J of Economics
JBR J of Business Research RBER Review of Business and Econ.Resrch
JCOF J of Computational Finance REST Review of Econ. and Statistics
JCI J of Computational Intelligence in Finance RES Review of Econ. Studies
JCF J of Corporate Finance RFS Review of Financial Studies
JD J of Derivatives RFM Review of Futures Markets
JEM J of Econometrics SBR Schmalenbach Business Review
19
TABLE I: Respondents' Titles and Highest Degrees
Worldwide North
America Europe Asia
Australia
New Zealand
N % N % N % N % N %
Professor 342 39.7 251 41.4 63 41.4 11 19.6 17 36.2
Associate Professor
Senior Lecturer/Reader 220 25.5 147 24.2 29 19.1 23 41.1 21 44.7
Assistant Professor
Lecturer 267 31.0 193 31.8 46 30.3 21 37.5 7 14.9
Other 18 2.1 7 1.2 8 5.3 1 1.8 2 4.3
No response 15 1.7 9 1.5 6 3.9 0 0.0 0 0.0
Titl
e
Total 862 100.0 607 100.0 152 100.0 56 100.0 47 100.0
PhD / DBA 820 95.1 589 97.0 134 88.2 53 94.6 44 93.6
MBA/MSc 16 1.9 2 0.3 10 6.6 2 3.6 2 4.3
Other 7 0.8 3 0.5 3 2.0 0 0.0 1 2.1
No response 19 2.2 13 2.1 5 3.3 1 1.8 0 0.0
Deg
ree
Total 862 100.0 607 100.0 152 100.0 56 100.0 47 100.0

20
TABLE II: Worldwide, North American and European Journal Rankings Worldwide (n=862) North America (n=607) Europe (n=152)
Ran
k
Jour
nal
FAR
PI
Fam
iliar
ity
% T
o10
AR
P
Rea
ders
hip
Jour
nal
FAR
PI
Fam
iliar
ity
% T
op10
AR
P
Rea
ders
hip
Jour
nal
FAR
PI
Fam
iliar
ity
% T
op10
AR
P
Rea
ders
hip
1 JF 95.0 850 99.5 1.7 91.7 JF 95.1 599 99.7 1.7 92.7 JF++ 96.0 151 98.7 1.7 90.5
2 JFE 81.3 792 96.5 3.3 62.5 JFE 82.1 561 96.4 3.2 63.3 JFE 76.6 136 94.9 3.9 53.2
3 RFS 75.3 756 96.6 3.8 53.6 RFS 75.2 531 96.6 3.8 52.9 RFS+ 75.6 134 96.3 3.8 61.1
4 JFQA 61.3 755 74.6 7.0 39.8 JFQA 60.8 530 72.8 7.1 39.1 JFQA 58.9 131 75.6 7.3 36.5
5 JB 53.6 678 76.5 7.4 28.3 JB 56.5 496 77.2 7.2 32.3 JBF++ 44.6 117 52.1 9.4 39.7
6 AER 46.2 523 91.2 5.8 32.0 AER 49.8 395 92.9 5.7 33.7 JB-- 41.4 105 66.7 9.0 13.5
7 JPE 38.1 440 93.0 6.1 18.4 JPE 41.3 333 93.1 6.0 19.5 ECO 40.7 81 92.6 5.7 25.4
8 ECO 34.9 405 88.4 6.1 15.2 ECO 34.5 284 87.3 6.3 13.2 AER-- 35.4 75 81.3 6.7 32.5
9 JBF 33.9 556 44.2 10.5 23.3 FM 32.1 371 38.3 10.5 35.1 JPE-- 28.7 60 90.0 6.5 18.3
10 FM 29.5 483 39.3 10.5 32.0 JBF 29.2 354 40.4 11.0 16.2 JEMF++ 25.5 77 41.6 10.9 20.6
11 FAJ 21.4 419 27.2 12.2 23.3 FAJ 21.7 299 25.4 12.2 20.3 FM-- 20.0 55 49.1 9.9 20.6
12 JMCB 18.0 350 41.4 12.1 7.2 JMCB 19.2 261 41.0 12.1 6.1 EFR++ 18.7 69 26.1 12.8 14.3
13 QJE 17.7 252 74.6 8.9 9.0 QJE 18.4 189 72.0 9.2 8.9 JMCB 17.6 58 43.1 11.8 12.7
14 JCF 15.8 338 24.0 12.9 10.9 JFI 16.6 233 28.8 12.4 5.9 FAJ 17.6 64 28.1 12.7 24.6
15 JFI 15.7 310 30.0 12.3 5.4 JCF 14.7 225 21.3 13.0 10.7 JCF 15.7 55 32.7 12.3 12.7
16 JEMF 14.9 313 28.1 12.8 8.0 JFR 13.6 202 22.3 12.9 11.2 QJE 15.3 37 75.7 8.4 11.9
17 JFR 12.5 270 21.1 13.0 9.6 JET 13.1 137 70.8 9.4 2.6 MFIN++ 15.1 44 50.0 10.6 9.5
18 JET 12.3 184 69.6 9.4 3.6 JPM 11.8 220 14.5 14.5 10.5 JFI 13.9 42 45.2 10.9 6.3
19 JPM 12.2 312 18.3 14.3 12.2 JEMF 11.0 177 22.6 13.4 4.3 EFM++ 13.1 51 15.7 13.2 19.0
20 JAE 10.2 169 50.3 10.6 5.8 JAE 10.3 123 48.8 10.8 5.5 JBFA++ 12.0 44 27.3 12.7 12.7
21 JME 8.5 157 45.9 11.6 4.0 FR 9.7 157 17.8 13.5 11.4 JIMF++ 11.8 42 31.0 12.5 4.8
22 FR 8.5 199 16.6 13.6 10.1 JME 9.0 113 47.8 11.4 3.9 JPM 11.7 51 27.5 14.0 14.3
23 RJE 8.3 163 47.2 12.3 4.3 RJE 8.8 128 43.8 12.6 4.3 JET 11.3 30 63.3 9.6 9.5
24 JFU 8.2 214 18.2 14.4 4.3 JFM 8.0 127 22.0 13.3 4.3 EJF++ 10.4 35 31.4 12.0 11.9
25 RES 8.2 128 67.2 10.0 4.6 RES 8.0 85 69.4 9.6 3.7 RES 10.0 29 62.1 10.5 11.1
26 JFM 7.9 177 23.2 13.3 4.8 JAR 7.3 107 33.6 12.7 3.7 RJE 8.8 27 55.6 11.1 4.0
27 MFIN 7.8 165 32.1 12.8 4.0 JLE 7.3 103 44.7 12.4 4.7 JFU 8.7 37 29.7 13.9 5.6
28 JIMF 7.7 161 31.1 12.8 4.3 JFU 6.9 135 12.6 14.8 2.8 JME 8.2 26 50.0 11.5 6.3
29 JAR 6.7 131 38.9 12.1 3.3 JACF 6.7 109 17.4 13.5 10.7 FIST++ 7.9 20 55.0 9.1 7.1
30 JACF 6.6 149 20.1 13.4 10.4 MFIN 6.0 98 24.5 13.5 2.4 JD 7.3 25 44.0 12.1 7.1
31 EFR 6.5 137 21.2 12.9 3.3 REST 6.0 89 39.3 12.8 2.8 JAE 7.1 22 36.4 11.1 6.3
32 JLE 6.4 130 43.8 12.5 3.6 JIMF 5.6 90 25.6 13.5 3.7 AFE++ 6.7 24 33.3 12.5 8.7
33 JD 5.6 138 21.0 14.0 5.0 ARE 5.5 79 34.2 12.6 3.0 JFR- 6.1 26 19.2 13.9 3.2
34 JBFA 5.5 138 18.1 14.1 4.4 JRI 5.3 85 32.9 13.5 3.4 JFM 5.7 24 16.7 13.8 5.6
35 ARE 5.4 103 38.8 11.9 3.7 JD 5.0 93 15.1 14.5 3.7 JACF 5.5 17 47.1 11.2 7.1
36 REST 5.3 114 37.7 13.0 2.9 JEM 5.0 62 43.5 11.3 2.6 JEM 5.2 17 41.2 11.6 4.8
37 JEM 4.7 86 41.9 11.5 2.8 JFS 4.5 88 13.6 14.9 2.8 GEN+ 5.1 20 10.0 13.2 0.8
38 JRI 4.7 112 29.5 13.8 3.0 EFR 3.6 56 16.1 13.2 1.0 ARE 4.3 12 50.0 10.1 5.6
39 EFM 4.5 106 17.0 13.7 5.0 JBES 3.2 46 30.4 12.4 1.8 FR- 4.2 17 17.6 13.5 2.4
40 PBFJ 4.4 129 14.0 15.2 6.6 JBFA 3.1 63 12.7 15.0 1.0 JLE 4.1 15 40.0 12.6 0.8

21
“++” (“- -”) indicates that a journal is viewed more favorably (less favorably) at the 0.01 level by a particular segment with respect to the rest of the sample. “+” (“-”) indicates that a journal is viewed more favorably (less favorably) at the 0.05 level by a particular segment with respect to the rest of the sample.

22
TABLE III: Asian and Australian/New Zealand Journal Rankings
Asia (n=56) Australia/New Zealand (n=47)
Ran
k
Jour
nal
FAR
PI
Fam
iliar
ity
% T
op10
AR
P
Rea
ders
hip
Jour
nal
FAR
PI
Fam
iliar
ity
% T
op10
AR
P
Rea
ders
hip
1 JF 95.4 55 100 1.6 91.3 JF- 89.8 45 100 2.2 83.7
2 JFE++ 89.6 55 98.2 2.8 80.4 JFE 77.0 40 100 2.9 60.5
3 RFS 81.2 52 96.2 3.5 63.0 RFS 68.9 39 97.4 4.4 30.2
4 JFQA+ 67.9 52 80.8 6.4 43.5 JFQA++ 67.7 42 85.7 5.9 53.5
5 JB 58.5 46 87.0 6.8 28.3 JB 49.0 31 83.9 6.1 23.3
6 AER 47.2 35 88.6 5.9 21.7 JBF++ 45.9 35 60.0 8.7 39.5
7 JBF++ 46.8 50 42.0 10.5 41.3 AER 32.8 18 100 3.9 20.9
8 JPE 40.3 31 96.8 6.5 10.9 FAJ++ 32.3 28 46.4 10.1 37.2
9 ECO 34.6 26 92.3 6.1 10.9 JPE- 25.0 16 93.8 6.3 14.0
10 FM 31.7 37 32.4 11.4 37.0 FM 24.0 20 45.0 9.7 23.3
11 JCF++ 25.4 38 21.1 13.5 6.5 PBFJ++ 21.8 25 28.0 12.8 46.5
12 JEMF++ 23.3 34 26.5 13.3 8.7 ECO 21.8 14 78.6 6.4 14.0
13 QJE 20.4 16 100 6.8 8.7 JEMF++ 20.6 25 28.0 13.2 14.0
14 FAJ 19.6 28 25.0 13.1 39.1 JFU++ 18.9 20 35.0 12.1 11.6
15 JFI 18.8 26 23.1 12.9 0.0 JCF 18.4 20 35.0 12.4 14.0
16 JAE++ 17.5 16 75.0 8.8 4.3 JIMF 14.1 12 66.7 9.9 7.0
17 JFR++ 17.4 26 23.1 13.5 6.5 JPM 13.8 16 37.5 12.9 11.6
18 JPM 16.6 25 20.0 13.6 26.1 QJE 13.7 10 80.0 8.1 2.3
19 JFM++ 15.0 19 42.1 12.2 13.0 JFR 13.1 16 6.3 13.3 11.6
20 JIMF++ 13.9 17 35.3 11.8 6.5 JMCB 11.7 14 42.9 13.1 9.3
21 JFU+ 12.8 22 18.2 14.5 10.9 JBFA++ 10.9 12 25.0 12.5 9.3
22 PBFJ++ 11.8 28 7.1 16.3 28.3 EJF++ 10.7 10 40.0 10.9 7.0
23 JMCB 11.5 17 41.2 13.4 2.2 JAE 10.0 8 62.5 9.3 9.3
24 JAR 10.8 11 63.6 10.0 2.2 JET 9.5 7 71.4 8.3 0.0
25 MFIN 10.3 14 42.9 12.8 6.5 APJ++ 8.9 10 20.0 12.6 7.0
26 JBFA++ 9.8 19 10.5 15.2 15.2 AFE++ 8.7 13 7.7 14.7 11.6
27 ARE 9.7 9 66.7 8.9 8.7 EFR+ 8.2 7 28.6 10.0 0.0
28 JET 9.6 10 70.0 10.3 2.2 FR 8.1 9 22.2 12.6 11.6
29 JD 8.4 12 25.0 13.2 10.9 JACF 7.2 11 9.1 14.8 11.6
30 FR 8.4 16 0.0 15.1 15.2 JFI- - 7.0 9 11.1 13.7 2.3 “++” (“- -”) indicates that a journal is viewed more favorably (less favorably) at the 0.01 level by a particular segment with respect to the rest of the sample. “+” (“-”) indicates that a journal is viewed more favorably (less favorably) at the 0.05 level by a particular segment with respect to the rest of the sample.
23
TABLE IV: Journal Rankings by Primary Area of Research
Corporate Finance (n=314)
Investments & Derivatives (n=306)
Financial Institutions (n=74)
Intl Finance, Institutions & Markets (n=66)
Ran
k
Jour
nal
FAR
PI
Fam
iliar
ity
% T
op10
AR
P
Rea
ders
hip
Jour
nal
FAR
PI
Fam
iliar
ity
% T
op10
AR
P
Rea
ders
hip
Jour
nal
FAR
PI
Fam
iliar
ity
% T
op10
AR
P
Rea
ders
hip
Jour
nal
FAR
PI
Fam
iliar
ity
% T
op10
AR
P
Rea
ders
hip
1 JF+ 96.0 312 99.7 1.7 95.5 JF 94.2 299 99.3 1.7 93.0 JF++ 95.8 73 98.6 1.6 89.4 JF+ 94.8 65 100 1.8 89.1 2 JFE++ 86.8 298 98.0 2.7 75.8 JFE 80.9 283 95.8 3.5 59.4 JFE+ 81.8 67 98.5 2.9 57.6 JFE 70.6 56 92.9 4.4 45.5 3 RFS 77.4 288 95.8 4.1 50.6 RFS++ 79.1 276 96.7 3.5 67.2 RFS 72.6 63 96.8 4.0 34.8 RFS 66.1 53 96.2 4.5 49.1 4 JFQA 62.3 279 74.6 7.0 41.3 JFQA 60.8 269 73.6 7.2 42.6 JFQA 61.8 62 77.4 6.3 33.3 JFQA 65.5 61 75.4 6.8 36.4 5 JB 59.1 268 81.3 7.2 32.7 JB 53.5 239 73.6 7.3 29.3 AER 49.3 47 91.5 5.5 42.4 AER 50.2 40 97.5 4.5 52.7 6 AER 47.4 196 92.3 5.8 27.5 ECO 42.4 169 89.9 5.7 18.4 JB 49.0 54 77.8 7.6 22.7 ECO 42.0 37 83.8 6.0 21.8 7 JPE 41.0 171 95.3 6.0 18.6 AER-- 42.2 173 90.8 6.1 27.0 JBF++ 45.5 59 59.3 9.6 47.0 JB 41.9 45 64.4 8.7 20.0 8 FM++ 40.0 227 42.7 9.9 45.0 JPE 36.5 150 92.0 6.1 16.4 JFI++ 35.8 49 46.9 10.2 28.8 JBF 40.3 48 50.0 9.9 23.6 9 JBF 33.9 207 41.1 10.7 19.7 JBF 31.2 185 41.6 10.7 21.5 JPE 35.2 36 91.7 6.5 16.7 JPE 33.7 31 83.9 6.6 20.0 10 JCF++ 27.3 186 32.8 11.8 24.2 FAJ 25.3 165 33.3 11.6 34.4 JMCB 34.8 47 59.6 10.0 34.8 JIMF++ 29.2 36 41.7 10.3 30.9 11 ECO-- 26.2 119 84.9 7.2 8.6 FM 23.4 147 30.6 11.3 21.5 FM+ 31.1 44 38.6 10.5 36.4 JEMF++ 23.3 33 42.4 11.7 21.8 12 QJE 22.2 112 75.9 8.6 11.5 JEMF+ 17.2 125 25.6 12.6 9.8 ECO-- 23.3 26 88.5 7.7 9.1 JMCB 23.0 34 41.2 12.1 14.5 13 FAJ 19.8 150 20.7 12.7 16.4 JPM+ 16.8 141 20.6 13.7 20.7 FAJ 17.6 29 20.7 12.0 16.7 FM 21.0 27 40.7 10.7 21.8 14 JMCB 18.1 136 36.8 12.6 1.9 JET 13.8 70 72.9 8.9 5.9 JFS++ 17.0 29 37.9 12.3 16.7 QJE 20.7 22 72.7 8.6 9.1 15 JFI+ 18.0 134 28.4 12.6 3.3 MFIN 13.5 90 37.8 11.8 9.0 QJE 17.0 20 85.0 8.5 10.6 FAJ 19.3 29 37.9 12.2 21.8 16 JAE+ 17.1 97 57.7 9.9 9.3 QJE- 12.7 69 71.0 9.8 5.1 JEMF 16.0 26 30.8 11.9 7.6 JME 17.0 18 72.2 8.6 3.6 17 JFR 14.3 114 19.3 13.1 10.8 JFU 11.9 96 25.0 13.4 8.6 JFM+ 14.3 22 40.9 11.4 15.2 JFR 13.3 23 17.4 13.4 0.0 18 RJE 13.4 93 51.6 11.9 7.4 JMCB-- 11.0 86 34.9 13.1 2.0 JME 13.1 20 50.0 11.3 13.6 JET 13.1 14 78.6 8.6 0.0 19 JET 11.6 65 66.2 9.8 1.9 JFR 11.0 86 18.6 13.2 8.2 JFR 11.7 23 26.1 13.5 15.2 JFI 12.4 16 43.8 10.8 3.6 20 JEMF 10.7 98 21.4 14.2 3.3 JFI 10.3 87 17.2 13.8 2.3 JCF 11.4 25 12.0 14.2 6.1 JPM 12.2 27 22.2 15.0 16.4 21 JACF 10.6 78 25.6 12.5 20.1 JD 8.9 69 27.5 13.1 10.5 JPM 10.2 22 13.6 14.1 7.6 EFR++ 11.6 16 37.5 11.4 7.3 22 FR+ 10.2 83 22.9 13.3 11.9 JCF 8.7 85 14.1 14.7 2.0 FR 9.3 20 10.0 14.1 7.6 JFM 10.8 17 35.3 12.6 10.9 23 JLE 10.1 72 45.8 12.2 5.6 JFM 8.7 69 21.7 13.3 6.3 REST 9.1 15 33.3 12.1 6.1 REST+ 10.5 15 46.7 11.8 10.9 24 JAR 8.7 59 40.7 11.7 4.5 FR 8.1 68 16.2 13.8 10.9 RJE- 8.8 14 57.1 11.7 3.0 JCF 9.8 17 11.8 13.4 1.8 25 JPM 8.5 89 14.6 15.0 5.9 JME 7.8 54 42.6 12.2 3.1 JET 8.4 13 61.5 11.4 0.0 EJF 8.9 13 23.1 11.9 5.5 26 RES 8.0 42 71.4 9.0 5.2 RES 7.8 46 63.0 10.6 3.9 JAE 8.1 14 28.6 12.4 4.5 PBFJ+ 8.5 15 26.7 13.5 10.9 27 JBFA 7.7 62 24.2 13.2 6.7 JIMF 7.4 56 32.1 12.9 3.1 FMII++ 7.8 15 20.0 13.3 4.5 JFU 8.4 19 15.8 15.2 3.6 28 ARE 6.5 48 33.3 12.5 2.6 EFR+ 6.8 54 16.7 13.3 2.3 JFU 7.8 20 15.0 15.3 1.5 FR 7.4 13 7.7 13.5 1.8 29 EFR 5.7 45 17.8 13.1 4.1 JEM 6.8 45 40.0 11.7 3.5 JLE 7.6 10 70.0 9.7 6.1 RES 6.8 9 66.7 11.0 1.8 30 EFM+ 5.6 47 23.4 13.5 7.4 JAR 6.0 42 42.9 12.2 2.0 JACF 6.4 15 20.0 14.7 9.1 EFM+ 6.6 15 0.0 15.2 5.5
“++” (“- -”) indicates that a journal is viewed more favorably (less favorably) at the 0.01 level by a particular segment with respect to the rest of the sample. “+” (“-”) indicates that a journal is viewed more favorably (less favorably) at the 0.05 level by a particular segment with respect to the rest of the sample.

24
1 For example, Swidler and Goldreyer (1998) demonstrate that finance faculty salaries are
mostly influenced by articles published in the most influential finance journals.
2 Borde, Cheney, and Madura (1999) have used a similar approach by examining the opinions
of finance department chairpersons of 125 AACSB US accredited schools.
3 The FARPI has been used in subsequent research on the perceived quality of journals in
Marketing (Theoharakis and Hirst, 2002).
4 The Spearman rank correlation coefficient between the worldwide ranking based on FARPI
and readership is 0.823 (significant at the 1% level), indicating that the journals perceived as
more influential are also more widely read. A similar pattern was revealed in each geographic
region with the Spearman rank correlation coefficient between FARPI and readership being
significant at the 1% level.
5 The results are not reported here, but they are available from the authors.
6 The results are available from the authors.