Dr. S. Velmurugan Principal Scientist, Traffic Engineering ... · Major Issues on the Delhi BRTS...
72
Critical Evaluation of Bus Rapid Transit System (BRTS) Corridor Performance in Delhi At the CSIR - Central Road Research Institute, Colloquium Dr. S. Velmurugan Principal Scientist, Traffic Engineering and Safety Division
Transcript of Dr. S. Velmurugan Principal Scientist, Traffic Engineering ... · Major Issues on the Delhi BRTS...
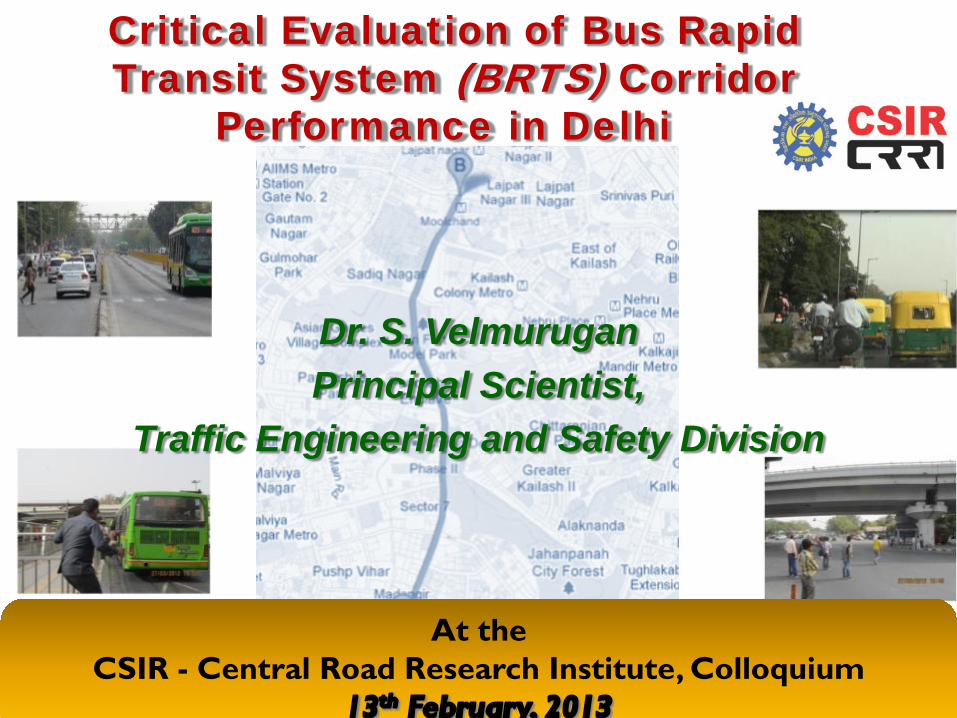
Critical Evaluation of Bus Rapid Transit System (BRTS) Corridor
Performance in Delhi
At the CSIR - Central Road Research Institute, Colloquium
Dr. S. Velmurugan Principal Scientist,
Traffic Engineering and Safety Division

Presentation by Dr.S..Velmurugan at CSIR-CRRI Colloquium on behalf of Entire Study Team
Study Steered by
Director, Dr.S.Gangopadhyay - CSIR-Central Road Research Institute
STUDY TEAM
Principal Investigators
Dr.S. Velmurugan (Project Leader) Dr.K. Ravinder: Passenger Flow Study (In-Charge) Dr.E.Madhu: Micro Simulation Study (In-Charge) Dr. J. Nataraju: Passenger Hour Study (In Charge) Dr. Ch. Ravi Sekhar: BRTS Comparison Study (In-Charge) Sh. P.V. Pradeep Kumar: Fuel Consumption Study (In-Charge) Dr. Ravindra Kumar: Speed and Delay Field Study (In-Charge) Sh.S.K. Ummat: Field Logistics
Field Survey Personnel
Sh. S.P.Gautam Sh. Anil Kumar Sh. S.K. Biswas Sh. Devender Kumar
Sh. Avinash Secretarial
Sh. Daleep K.Mutreja Sh. Ashok Gauba
Ms. Pushpa Jaitley
http://crridom.gov.in/content/evaluating-bus-rapid-transit-brt-corridor-performance-amebedkar-nagar-mool-chand

Presentation by Dr.S..Velmurugan at CSIR-CRRI Colloquium on behalf of Entire Study Team
Focus of the Presentation Definition of Bus Rapid Transit System (BRTS) Type of BRTS & A Brief on various BRTS around the world USA, Latin America, Europe, Australia, Asia and India Performance Evaluation Parameter deployed for BRTS
Major Issues on the Delhi BRTS Objectives of the Study Scope of the Study Study Methodology Simulation of Pilot Corridor in Delhi ‘with’ and ‘without’ BRTS Experimental Trial Run: Comparison with normal BRT in Delhi Major Inferences Delhi and Ahmedabad BRTS - A Comparison Recommendation - Short and Long Term for Delhi BRTS
Presentation by Dr.S..Velmurugan at CSIR-CRRI Colloquium on behalf of Entire Study Team
Definition of BRTS
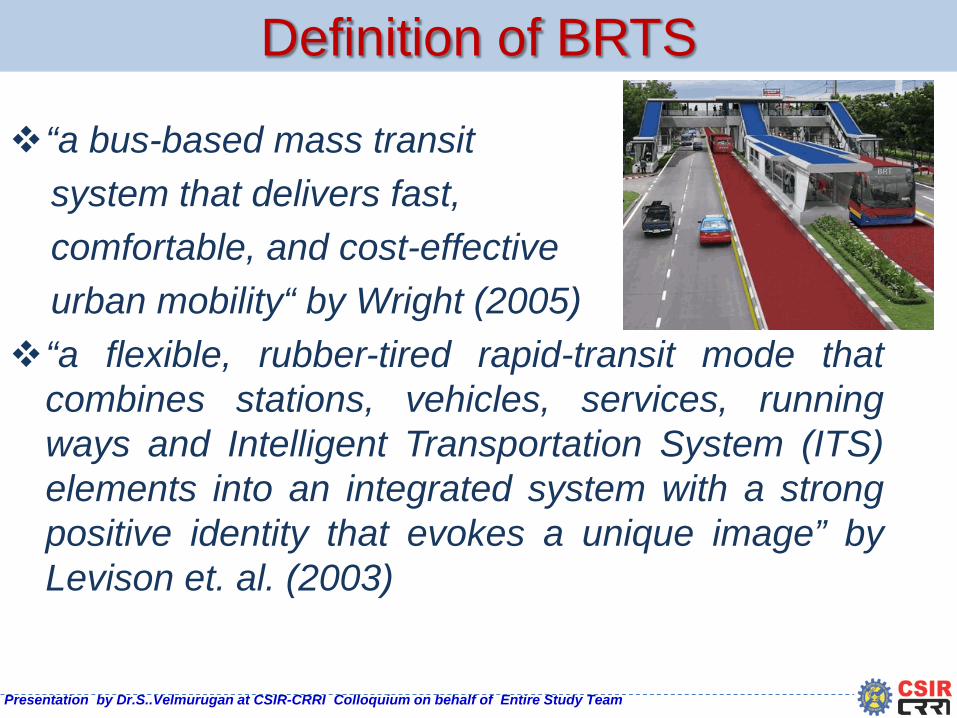
“a bus-based mass transit system that delivers fast, comfortable, and cost-effective urban mobility“ by Wright (2005) “a flexible, rubber-tired rapid-transit mode that
combines stations, vehicles, services, running ways and Intelligent Transportation System (ITS) elements into an integrated system with a strong positive identity that evokes a unique image” by Levison et. al. (2003)

Presentation by Dr.S..Velmurugan at CSIR-CRRI Colloquium on behalf of Entire Study Team
Types of BRTS
BRT SYSTEM
CLOSED SYTEM
OPEN SYSTEM

A Brief on Various Bus Rapid Transit
Systems (BRTS) Around The World

Presentation by Dr.S..Velmurugan at CSIR-CRRI Colloquium on behalf of Entire Study Team
BRTS in USA First to introduce BRT concept in 1937 in the city of
Chicago 1970’s Latin American countries started implementing
BRT systems USA started building the BRT prototypes in this period In 1977 Pittsburgh, Pennsylvania implemented first
BRT system Later on many systems were developed in USA. Percentage increase in speeds in the Cleveland and
Eugene is as high as 34% and 30.4% Average time savings in different BRT corridors in
USA is varying from 6 to 31 minutes with Los Angeles BRT with the maximum time saving of 31 minutes.

Presentation by Dr.S..Velmurugan at CSIR-CRRI Colloquium on behalf of Entire Study Team
Salient Features of BRTS in USA (Cont…)

Presentation by Dr.S..Velmurugan at CSIR-CRRI Colloquium on behalf of Entire Study Team
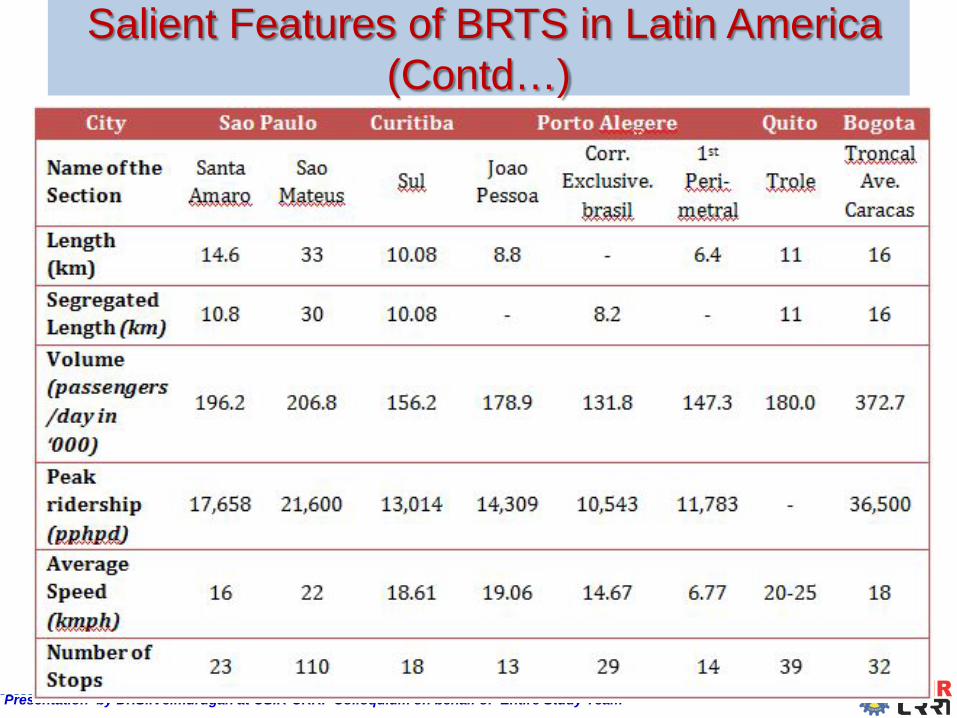
BRTS in Latin America Known for successful implementation of BRTS In Bogotá BRT travel time savings improved by
35% Reduced fatal car accidents by 93% and reduced
air pollution by 40% Ridership of 17,000 pphpd to 40,000 pphpd is
observed in the BRT corridors of this region Commercial average speeds ranging from 15 to
32 kmph TransMilenio’s double width bus way on Troncal
Avenida Caracas even accommodates 35,000 Passengers Per Hour Per Direction (PPHPD)
Presentation by Dr.S..Velmurugan at CSIR-CRRI Colloquium on behalf of Entire Study Team
Salient Features of BRTS in Latin America (Contd…)

Presentation by Dr.S..Velmurugan at CSIR-CRRI Colloquium on behalf of Entire Study Team
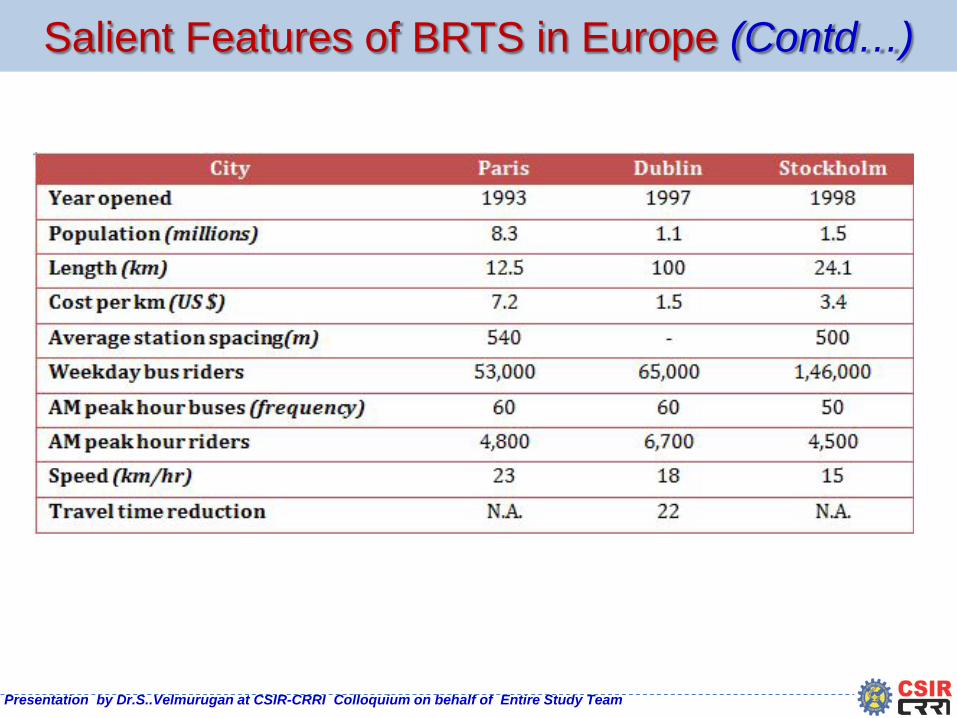
BRTS in Europe This region is developed part of the world and are
very particular of environment sensitive BRTS is a solution since it reduces air pollution Weekday riders in Dublin and Stockholm very high
ranging from 50,000 to 1,46,000. BRT lanes are also used as HOV lanes in
Barcelona. Demand for BRT systems in Europe is low
because of presence of already good transportation systems.
Presentation by Dr.S..Velmurugan at CSIR-CRRI Colloquium on behalf of Entire Study Team
Salient Features of BRTS in Europe (Contd…)

Presentation by Dr.S..Velmurugan at CSIR-CRRI Colloquium on behalf of Entire Study Team
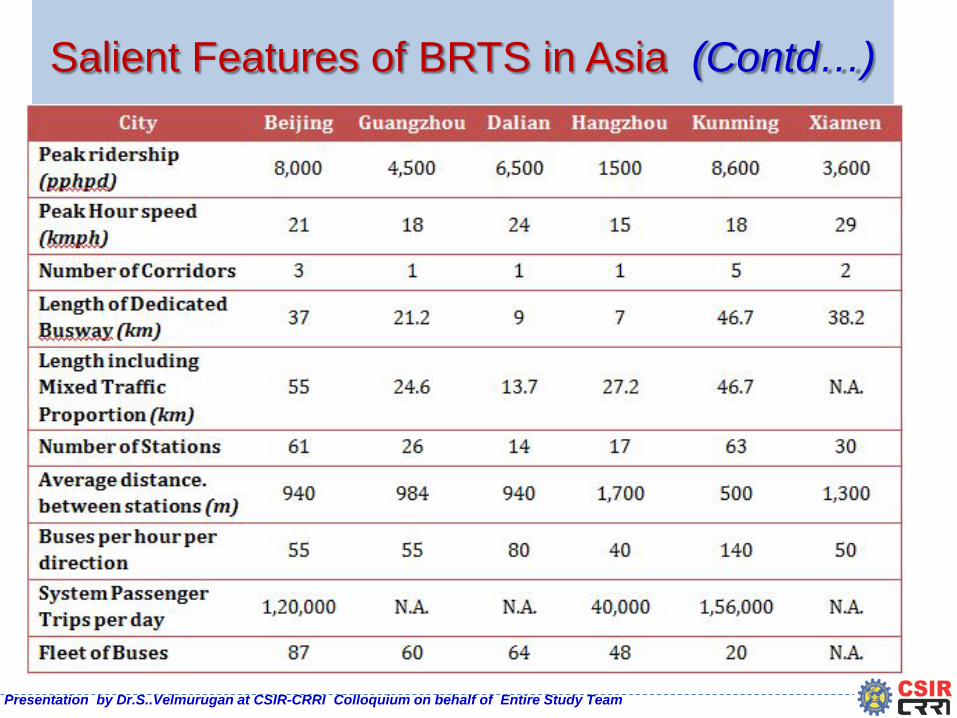
BRTS in Asia Scenario is similar to developing nations of Latin
America. Maximum urban population prefer public transport
mainly bus. In Indonesia total public transport trips constituted of
49.7% Pollution and environmental hazards is also one of the
prominent problem in Asian countries The Guangzhou BRT system has won the 2011
sustainable transport award. Its ridership is as high as 29,000 pphpd, highest in
Asia Due to urban sprawl in Asian cities it is difficult to
identify high demand corridors in the urban areas and suburban areas
Presentation by Dr.S..Velmurugan at CSIR-CRRI Colloquium on behalf of Entire Study Team
Salient Features of BRTS in Asia (Contd…)

Presentation by Dr.S..Velmurugan at CSIR-CRRI Colloquium on behalf of Entire Study Team
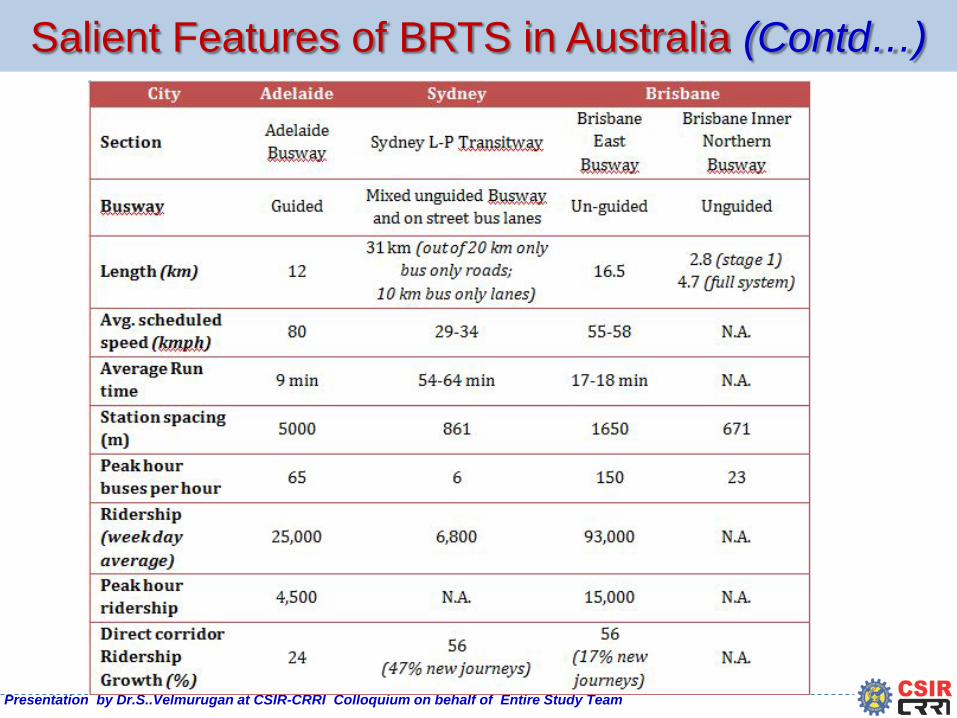
BRTS in Australia Implemented its first BRT in 1986 at Adelaide Average speed in Australian BRT corridors is
around 60kmph Australian BRT systems are very strong in
infrastructural facilities They are generally expressway type of BRT
systems. Adelaide BRT constitutes 25 bridges, and 8
tunnels.
Presentation by Dr.S..Velmurugan at CSIR-CRRI Colloquium on behalf of Entire Study Team
Salient Features of BRTS in Australia (Contd…)

Presentation by Dr.S..Velmurugan at CSIR-CRRI Colloquium on behalf of Entire Study Team
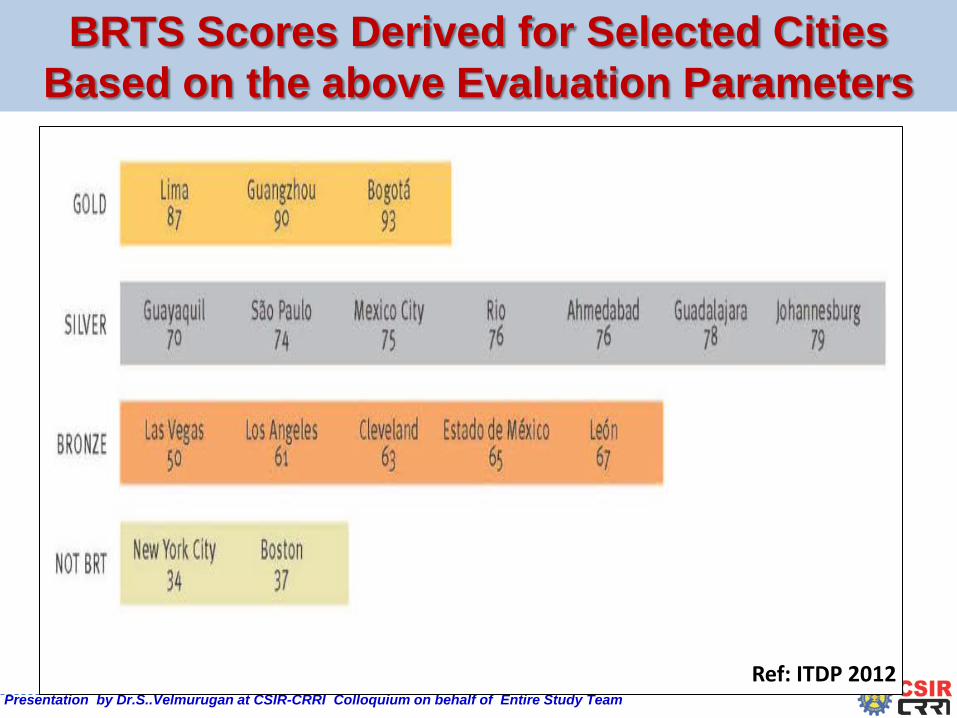
BRTS in India Currently operational in Ahmedabad and Delhi Started in Pune but they later discontinued ITDP has given a score of 76 out of 100 for
Ahmedabad BRTS and falls under silver category 8 More BRT corridors coming up in different cities
of India under JNNURM Ahmedabad is a closed system while Delhi BRT is
an open system Peak Ridership of Delhi BRT is 12,500 PPHPD
(CRRI, 2012) and given a rating of 24 out of 100 Present ridership in Ahmedabad BRTS is around
3000 PPHPD expected to reach 20,000 PPHPD

Presentation by Dr.S..Velmurugan at CSIR-CRRI Colloquium on behalf of Entire Study Team
Salient Features of BRTS in India (Contd…)
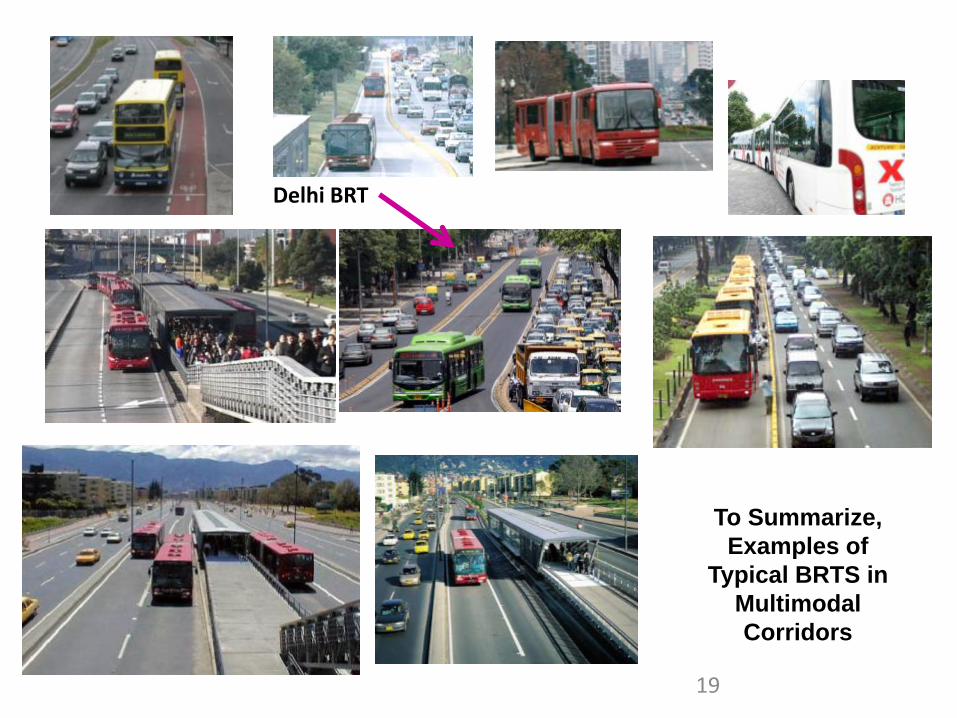
To Summarize, Examples of
Typical BRTS in Multimodal Corridors
19
Delhi BRT
Presentation by Dr.S..Velmurugan at CSIR-CRRI Colloquium on behalf of Entire Study Team
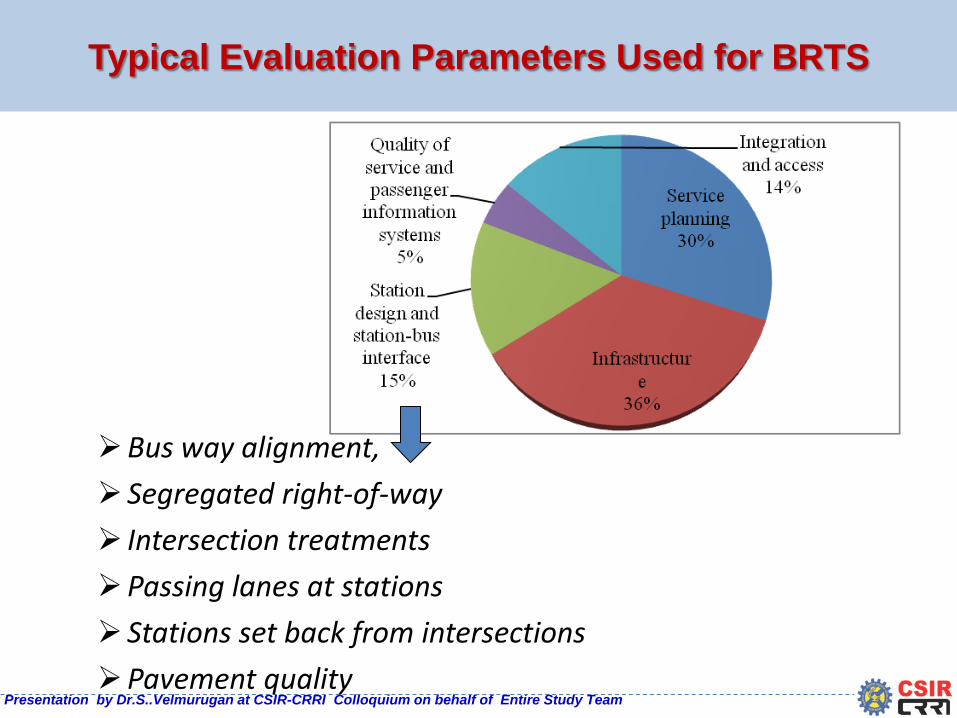
Typical Evaluation Parameters Used for BRTS
Bus way alignment, Segregated right-of-way Intersection treatments Passing lanes at stations Stations set back from intersections Pavement quality
Presentation by Dr.S..Velmurugan at CSIR-CRRI Colloquium on behalf of Entire Study Team
BRTS Scores Derived for Selected Cities Based on the above Evaluation Parameters
Ref: ITDP 2012
Presentation by Dr.S..Velmurugan at CSIR-CRRI Colloquium on behalf of Entire Study Team
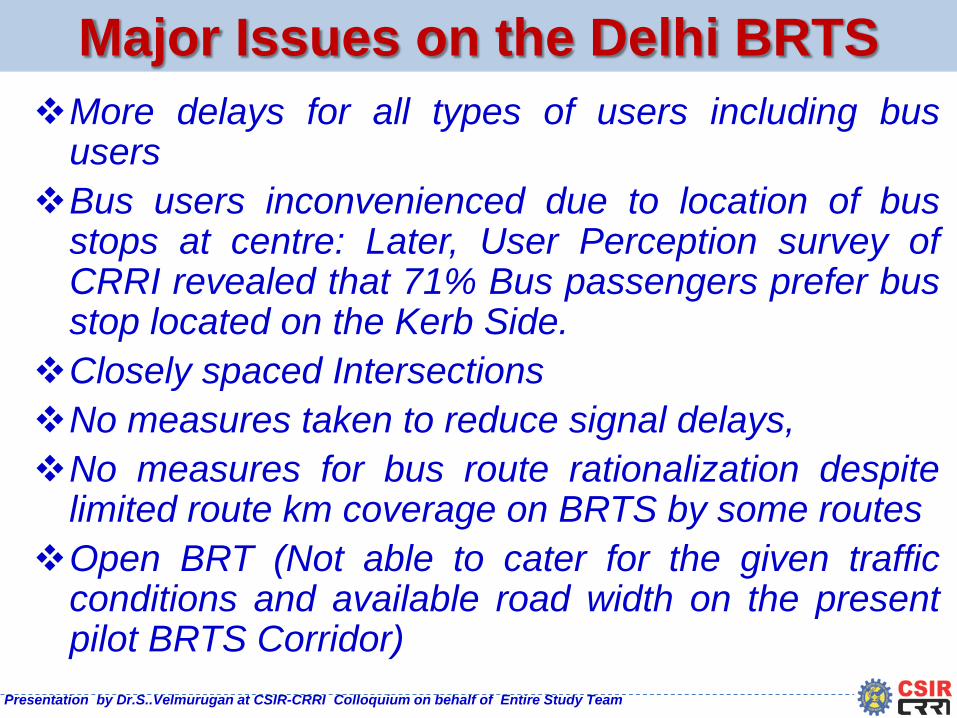
Major Issues on the Delhi BRTS More delays for all types of users including bus
users Bus users inconvenienced due to location of bus
stops at centre: Later, User Perception survey of CRRI revealed that 71% Bus passengers prefer bus stop located on the Kerb Side.
Closely spaced Intersections No measures taken to reduce signal delays, No measures for bus route rationalization despite
limited route km coverage on BRTS by some routes Open BRT (Not able to cater for the given traffic
conditions and available road width on the present pilot BRTS Corridor)
Presentation by Dr.S..Velmurugan at CSIR-CRRI Colloquium on behalf of Entire Study Team
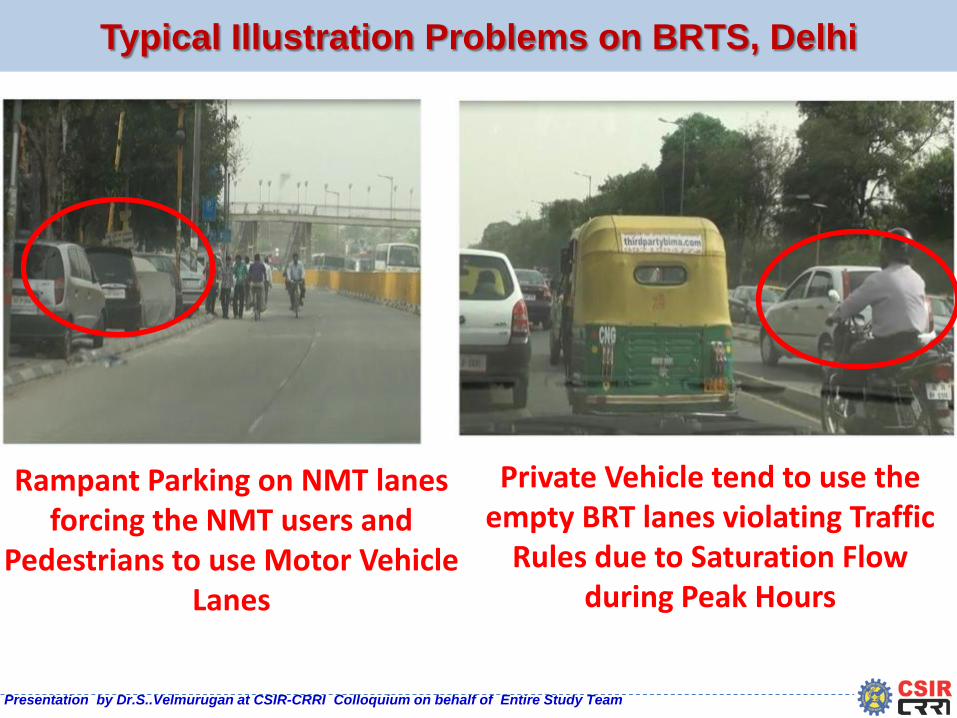
Typical Illustration Problems on BRTS, Delhi
Rampant Parking on NMT lanes forcing the NMT users and
Pedestrians to use Motor Vehicle Lanes
Private Vehicle tend to use the empty BRT lanes violating Traffic
Rules due to Saturation Flow during Peak Hours

Presentation by Dr.S..Velmurugan at CSIR-CRRI Colloquium on behalf of Entire Study Team
Typical Illustration Problems on BRTS, Delhi (Contd..)
Kerb separation of BRT and MV Lane BROKEN along the highly
Populated Madangir resulting in more violations
Unused carriageway on BRT lane near Madangir Pedestrian
Crossing
Presentation by Dr.S..Velmurugan at CSIR-CRRI Colloquium on behalf of Entire Study Team
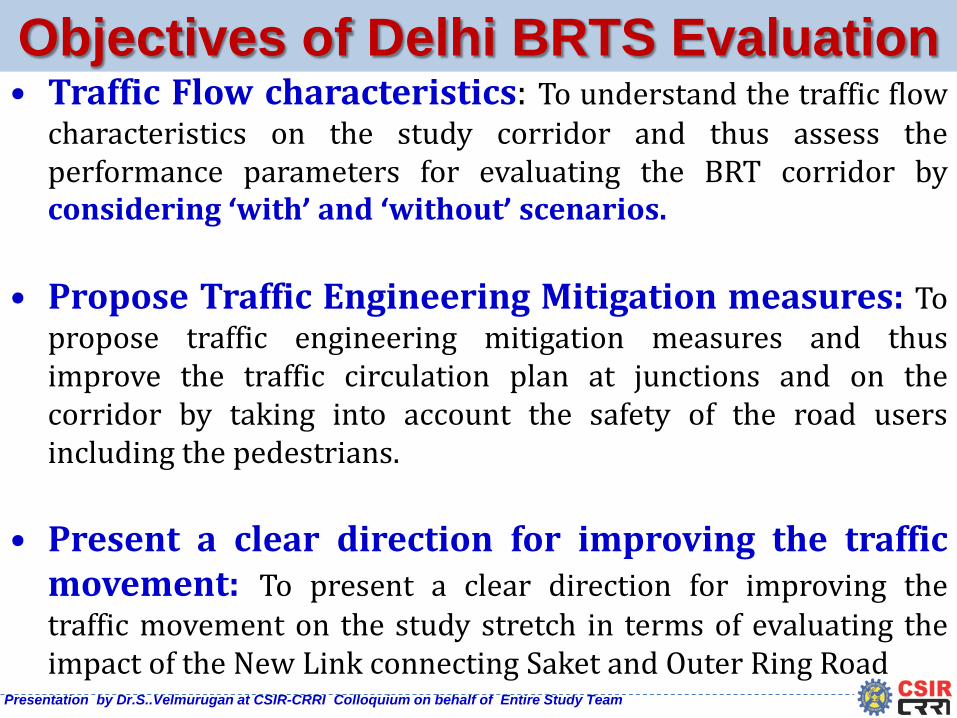
Objectives of Delhi BRTS Evaluation • Traffic Flow characteristics: To understand the traffic flow
characteristics on the study corridor and thus assess the performance parameters for evaluating the BRT corridor by considering ‘with’ and ‘without’ scenarios.
• Propose Traffic Engineering Mitigation measures: To propose traffic engineering mitigation measures and thus improve the traffic circulation plan at junctions and on the corridor by taking into account the safety of the road users including the pedestrians.
• Present a clear direction for improving the traffic movement: To present a clear direction for improving the traffic movement on the study stretch in terms of evaluating the impact of the New Link connecting Saket and Outer Ring Road

Presentation by Dr.S..Velmurugan at CSIR-CRRI Colloquium on behalf of Entire Study Team
Scope of the Delhi BRTS Evaluation • Classified Turning Volume Surveys - 6 Intersections: 3 days • Queue Length & Saturation Flow Studies at all the
Junctions • Pedestrian Volume Counts during the Morning & Evening
Peak Hours • Occupancy surveys covering all the modes for 16 hours • On-street parking surveys on the study corridor for 16 hrs • Speed and Delay studies - BRTS and adjoining non - BRTS • Fuel Consumption Studies (FCS) covering only Petrol and
Diesel Driven Cars - due to paucity of time and non-availability of instrumentation system for CNG Bus.
• Spot speed studies at mid-blocks on the study corridor

Presentation by Dr.S..Velmurugan at CSIR-CRRI Colloquium on behalf of Entire Study Team
• Opinion Surveys: A crisp interview was carried out to understand the satisfaction level of all types of commuters travelling on the study corridor covering a minimum of 5 per cent stratified random sample covering bus commuters, car travellers, two wheeler riders, auto rickshaw users, cyclists and pedestrians.
• Efficacy analysis of allowing other vehicles to ply on the BRT lane on experimental basis carried out for eight days as per the Honourable High Court Order of Delhi.
• Simulation of Scenarios ‘without’ and ‘with’ BRTS on the study corridor.
Scope of the Delhi BRTS Evaluation (Contd..)
Presentation by Dr.S..Velmurugan at CSIR-CRRI Colloquium on behalf of Entire Study Team
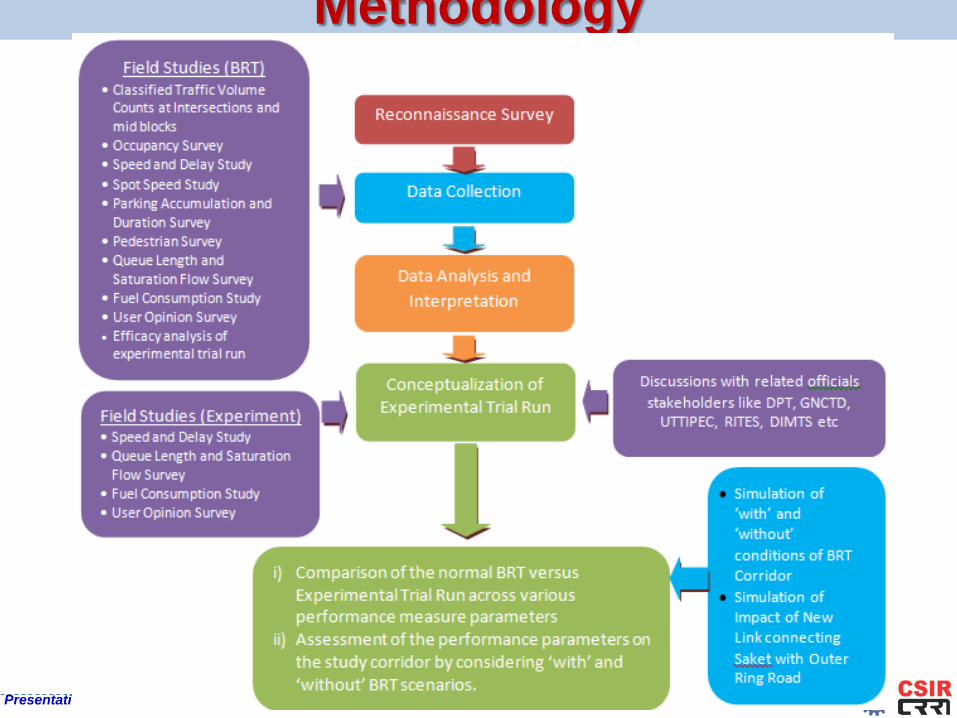
Methodology

Presentation by Dr.S..Velmurugan at CSIR-CRRI Colloquium on behalf of Entire Study Team
Map of the Pilot BRTS Corridor
Ambedkar Nagar Jn.
Pushpa Bhawan Jn.
Sheikh Sarai Jn.
Chirag Delhi Jn.
Siri Fort Jn.
GK - I Crossing Jn.
Mool Chand Jn.
Proposed New Link connecting Saket and Outer Ring Road as Per UTTIPEC Proposal
Presentation by Dr.S..Velmurugan at CSIR-CRRI Colloquium on behalf of Entire Study Team
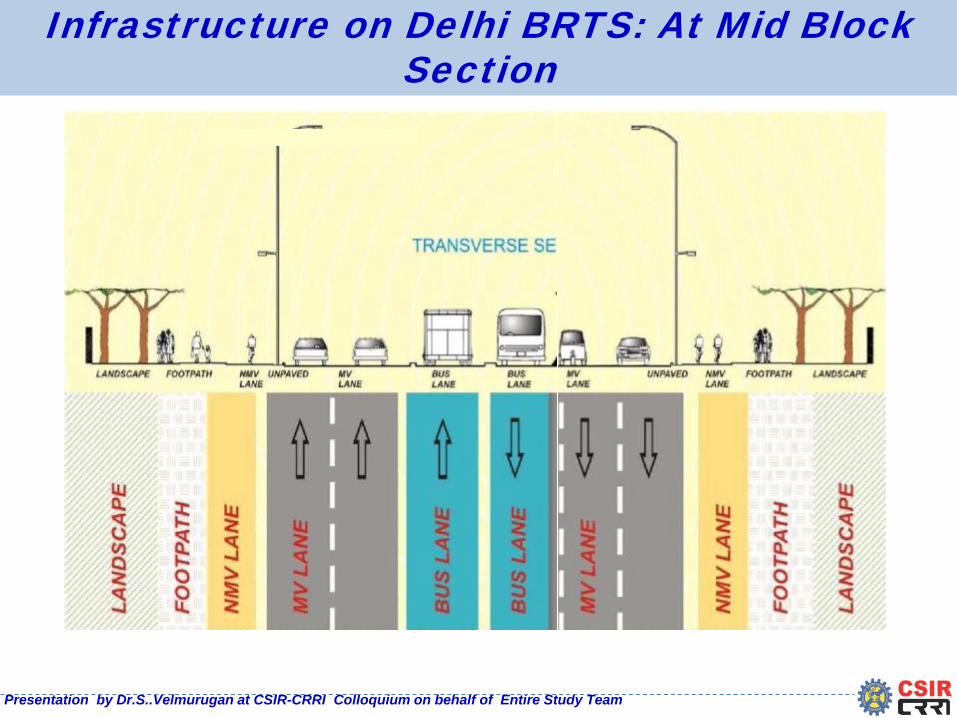
Infrastructure on Delhi BRTS: At Mid Block Section

Presentation by Dr.S..Velmurugan at CSIR-CRRI Colloquium on behalf of Entire Study Team
Infrastructure on Delhi BRTS: At-Grade Intersections

Presentation by Dr.S..Velmurugan at CSIR-CRRI Colloquium on behalf of Entire Study Team
Section-wise Passenger Flows observed on Delhi BRTS Corridor (6:00 AM to 10:00 PM)
Name of the Section Cars Two
Wheelers Autos Buses SMVs Total
Up Direction: Ambedkar Nagar to Mool Chand Ambedkar Nagar- Pushpa Bhawan
18858 14326 6005 65610 3150 1,07,949
Pushpa Bhawan - Sheikh Sarai 37774 30910 11453 74857 4208 1,59,202 Sheikh Sarai - Chirag Delhi 49420 32158 13291 90633 3851 1,89,352 Chirag Delhi - Siri Fort 42611 31373 8967 78420 3004 1,64,375 Siri Fort – GK I Crossing 32627 28776 9075 47728 2264 1,20,471 Down Direction: Mool Chand to Ambedkar Nagar Pushpa Bhawan -Ambedkar Nagar
28645 20889 5083 40879 2871 98,366
Sheikh Sarai -Pushpa Bhawan 32345 22200 10736 53271 5680 1,24,232 Chirag Delhi-Sheik Sarai 63679 35037 15439 84100 3571 2,01,825 Siri Fort-Chirag Delhi 41349 28628 13409 50901 2188 1,36,475 GK I Crossing-Siri Fort 31940 21911 10255 38156 1568 1,03,830
Bus Passenger Flows: 39 % - 60 %
Presentation by Dr.S..Velmurugan at CSIR-CRRI Colloquium on behalf of Entire Study Team
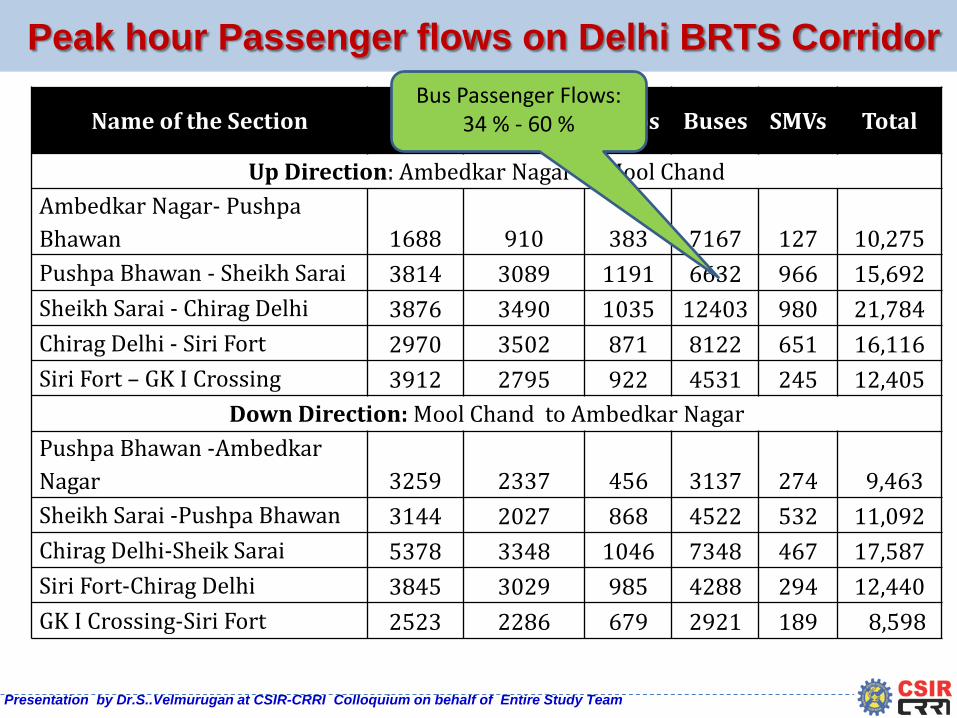
Peak hour Passenger flows on Delhi BRTS Corridor
Name of the Section Cars
Two Wheelers
Autos Buses SMVs Total
Up Direction: Ambedkar Nagar to Mool Chand Ambedkar Nagar- Pushpa Bhawan 1688 910 383 7167 127 10,275 Pushpa Bhawan - Sheikh Sarai 3814 3089 1191 6632 966 15,692 Sheikh Sarai - Chirag Delhi 3876 3490 1035 12403 980 21,784 Chirag Delhi - Siri Fort 2970 3502 871 8122 651 16,116 Siri Fort – GK I Crossing 3912 2795 922 4531 245 12,405
Down Direction: Mool Chand to Ambedkar Nagar Pushpa Bhawan -Ambedkar Nagar 3259 2337 456 3137 274 9,463 Sheikh Sarai -Pushpa Bhawan 3144 2027 868 4522 532 11,092 Chirag Delhi-Sheik Sarai 5378 3348 1046 7348 467 17,587 Siri Fort-Chirag Delhi 3845 3029 985 4288 294 12,440 GK I Crossing-Siri Fort 2523 2286 679 2921 189 8,598
Bus Passenger Flows: 34 % - 60 %
Presentation by Dr.S..Velmurugan at CSIR-CRRI Colloquium on behalf of Entire Study Team
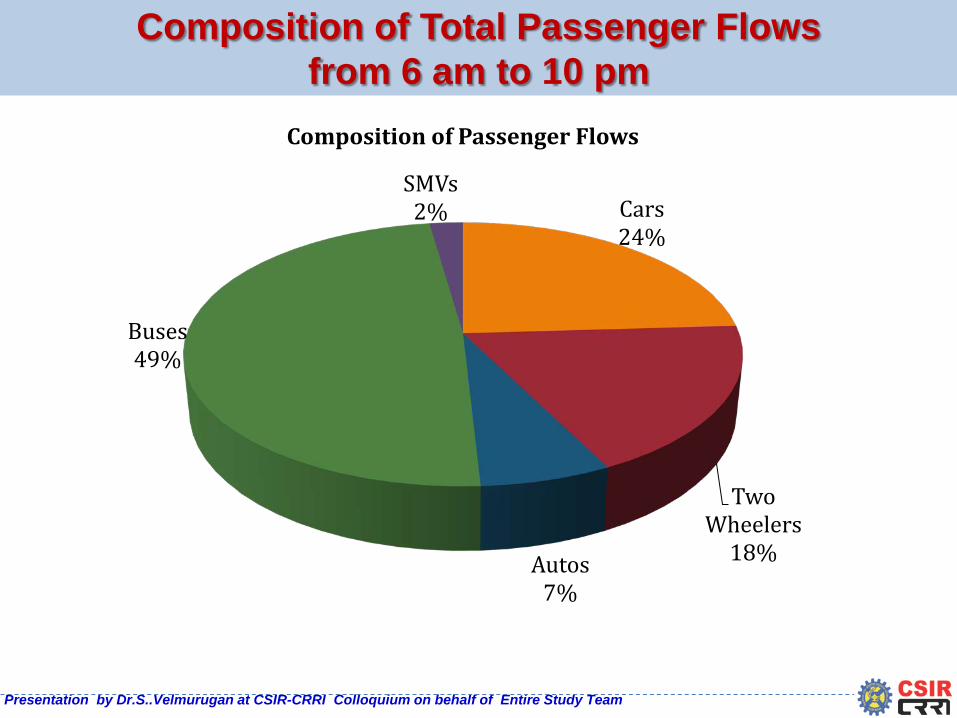
Composition of Total Passenger Flows from 6 am to 10 pm
Cars 24%
Two Wheelers
18% Autos 7%
Buses 49%
SMVs 2%
Composition of Passenger Flows

Presentation by Dr.S..Velmurugan at CSIR-CRRI Colloquium on behalf of Entire Study Team
Simulation of Vehicular Movements using VISSIM - ‘with’ and ‘without’ BRTS
Observed Journey Speeds
Projected Traffic for 2015
Development of Microscopic Traffic Simulation Model in VISSIM Software
Evaluation of different Options: (i) Experimental Trial Run (ii) No BRT (iii) BAU 2015 (iv) New Link between Press Enclave
Road and Outer Ring Road
Preparation of Input Parameters for Microscopic Simulation
Data Collection and Analysis (Traffic flows and turning
movement flows at each of the intersection on BRT Corridor)
Estimate Output: Journey Speed and Network Performance Indicators
Comparison of Journey Speeds and Network Performance Indicators from
different Options
i. Traffic Flows ii. Vehicle Speeds iii. Driver Characteristics iv. Vehicle
Characteristics v. Road Network
Calibration and Validation of Simulation model

Development of Base Network in VISSIM
• Developed Basic Model in VISSIM in this Study.
• Affect of Random seed was also taken on board.
• VISSIM is a stochastic microscopic simulation tool, to achieve close results, an average of 7 run results were averaged and used in the study.

Vehicle Inputs Given in VISSIM at Different Intersections

Routing Decisions
Typical Routing Decisions for Press Enclave Intersection

Inputs Given in VISSIM
Vehicle Composition at Chirag Delhi Intersection

Signal Phasing and Cycle Length Inputs Given in VISSIM
Typical Signal Program at Chirag Delhi Intersection

3-D View of Delhi BRTS Network Simulation of Chirag Delhi Intersection under Normal BRT Operations
Presentation by Dr.S..Velmurugan at CSIR-CRRI Colloquium on behalf of Entire Study Team
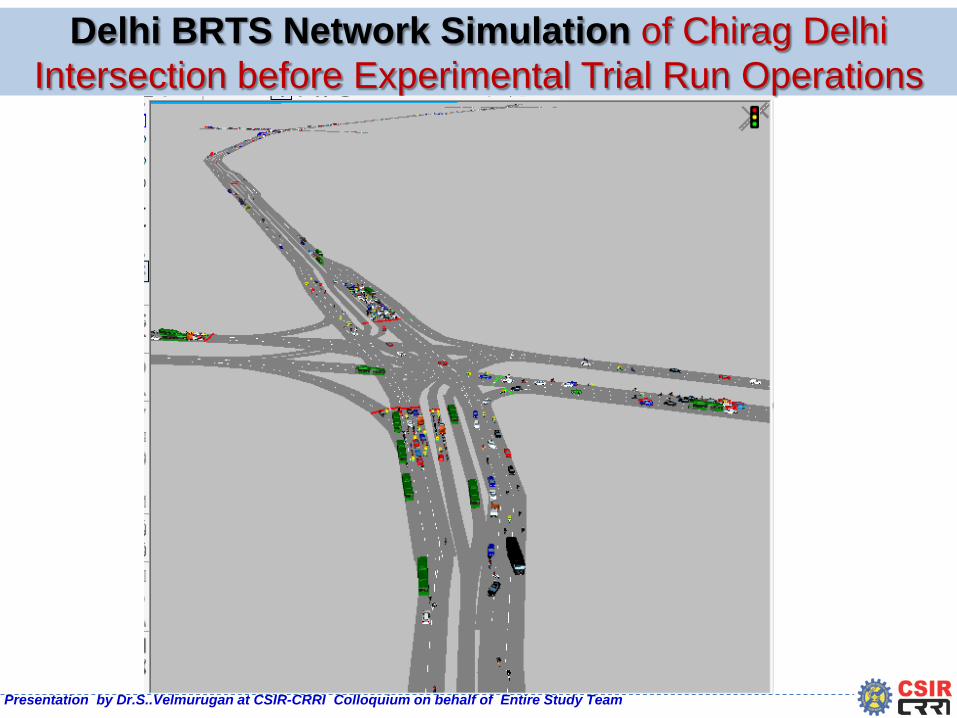
Delhi BRTS Network Simulation of Chirag Delhi Intersection before Experimental Trial Run Operations

Presentation by Dr.S..Velmurugan at CSIR-CRRI Colloquium on behalf of Entire Study Team
EXPERIMENTAL TRIAL RUN ON BRT CORRIDOR (TYPICAL TRAFFIC ARRANGEMENT IN VOGUE DURING ‘NORMAL’ BRT VS. TRIAL RUN)
Traffic Advisories in the form of pamphlet distribution (60,000 nos on the BRT Corridor) as well as advertisement in leading Newspapers
Signal phases alteration from 6/7/8 phases to a maximum 4 or 5 phases in each cycle Installation of Median Markers/ Reflectors Metal Barricades tied with Traffic Cones to prohibit the Right Turning Traffic from using the
opposite lanes Lane dividers were placed (Bollards) New Sign boards were installed
Presentation by Dr.S..Velmurugan at CSIR-CRRI Colloquium on behalf of Entire Study Team
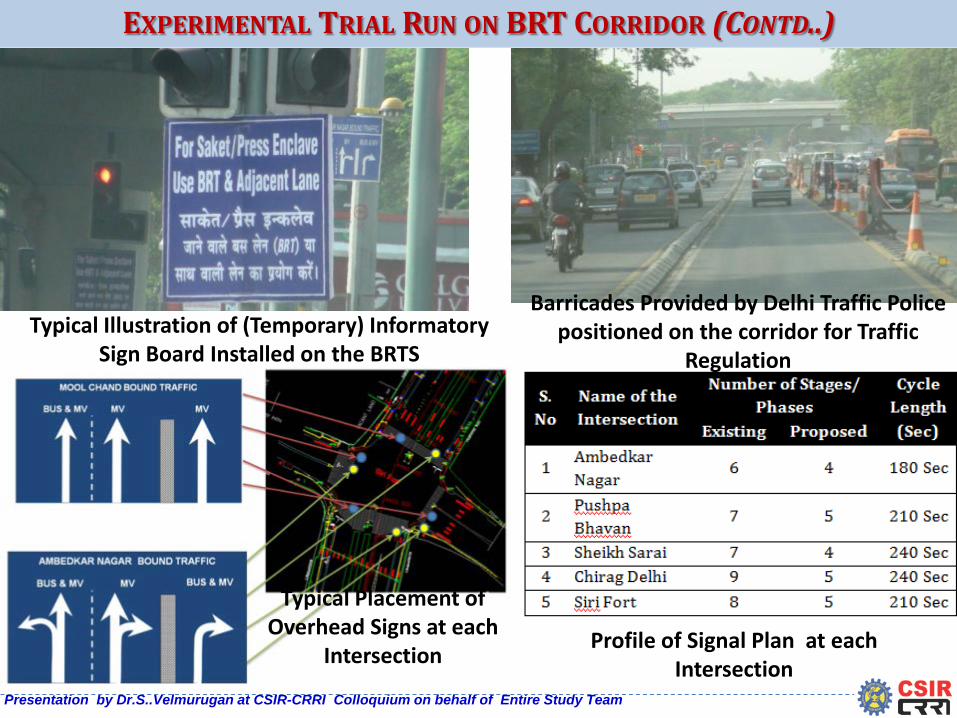
EXPERIMENTAL TRIAL RUN ON BRT CORRIDOR (CONTD..)
Typical Illustration of (Temporary) Informatory Sign Board Installed on the BRTS
Barricades Provided by Delhi Traffic Police positioned on the corridor for Traffic
Regulation
Typical Placement of Overhead Signs at each
Intersection Profile of Signal Plan at each
Intersection

Presentation by Dr.S..Velmurugan at CSIR-CRRI Colloquium on behalf of Entire Study Team
EXPERIMENTAL TRIAL RUN ON BRT CORRIDOR (CONTD..)
Temporary Informatory Sign Board Installed on the Delhi BRTS
Temporary Regulatory Measures Installed on the Delhi BRTS
Temporary Flexible Bollards installation under Progress on the Delhi BRTS
Effective Utilization of the available Road Space during the Experimental Trial Run
Presentation by Dr.S..Velmurugan at CSIR-CRRI Colloquium on behalf of Entire Study Team
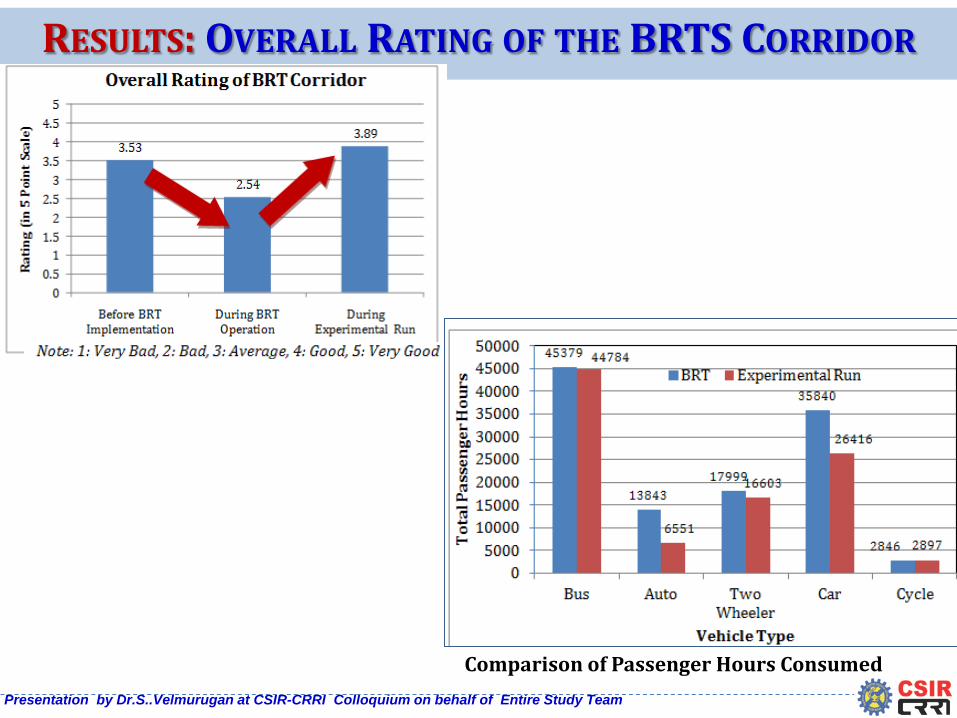
RESULTS: OVERALL RATING OF THE BRTS CORRIDOR
Comparison of Passenger Hours Consumed

Presentation by Dr.S..Velmurugan at CSIR-CRRI Colloquium on behalf of Entire Study Team
RESULTS (CONTD..)
• User Perception survey of CRRI revealed that 71% Bus passengers prefer bus stop located on the Kerb Side.

Presentation by Dr.S..Velmurugan at CSIR-CRRI Colloquium on behalf of Entire Study Team
Fuel Consumption from Petrol Driven Cars during normal BRT Operations Vs. Experimental Trial Run
Direction
Petrol Driven Cars
Journey time
(seconds)
Journey speed
(kmph)
Time in idling
(seconds)
Fuel loss in idling (ml)
Fuel loss in idling (%)
Time in idling (%)
Total fuel consumed
(ml)
During normal BRT Operation Upward 1567 13.4 781 114 25 33 461
Downward 1469 14.3 627 92 19 30 471 During Experimental Run
Upward 1233 17.0 480 72 17 28 432 Downward 1084 19.3 343 60 14 24 433

Presentation by Dr.S..Velmurugan at CSIR-CRRI Colloquium on behalf of Entire Study Team
Fuel Consumption from Diesel Driven Cars during normal BRT Operations Vs. Experimental Trial Run
Direction
Diesel Driven Vehicles
Journey time
(seconds)
Journey speed
(kmph)
Time in idling
(seconds)
Fuel loss in idling
(ml)
Fuel loss in idling
(%)
Time in idling (%)
During normal BRT Operation
Upward 1601 13.6 816 140 23 34
Downward 1347 15.7 519 87 14 28
During Experimental Run
Upward 1186 17.6 461 77 12 28
Downward 998 20.9 279 47 7 22
Presentation by Dr.S..Velmurugan at CSIR-CRRI Colloquium on behalf of Entire Study Team
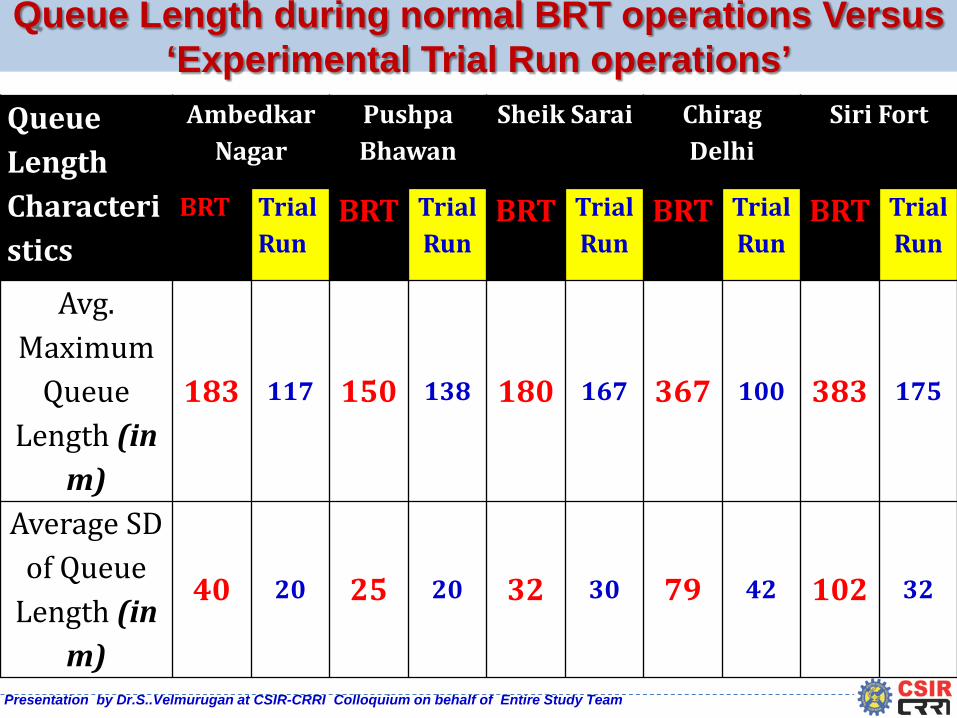
Queue Length during normal BRT operations Versus ‘Experimental Trial Run operations’
Queue Length Characteristics
Ambedkar Nagar
Pushpa Bhawan
Sheik Sarai Chirag Delhi
Siri Fort
BRT Trial Run
BRT Trial Run
BRT Trial Run
BRT Trial Run
BRT Trial Run
Avg. Maximum
Queue Length (in
m)
183 117 150 138 180 167 367 100 383 175
Average SD of Queue
Length (in m)
40 20 25 20 32 30 79 42 102 32

Presentation by Dr.S..Velmurugan at CSIR-CRRI Colloquium on behalf of Entire Study Team
MAJOR INFERENCES
• The evaluation of passenger hours in terms of monetary values revealed that there is a loss of Rs. 87.91 crores in a year during ‘normal BRT’ operation compared to ‘Experimental Trial Run’.
• The value of fuel loss due to BRTS corridor is around 2.48 crores per annum. This estimated monetary loss comprises of cars alone; Considering the other vehicles, this loss could be much higher which could not be estimated due to the aforesaid reasons earlier.

Presentation by Dr.S..Velmurugan at CSIR-CRRI Colloquium on behalf of Entire Study Team
EXPERIMENTAL TRIAL RUN (CONTD..) - NEWS COVERAGE

Presentation by Dr.S..Velmurugan at CSIR-CRRI Colloquium on behalf of Entire Study Team
Delhi and Ahmedabad BRTS - A Comparison
Presentation by Dr.S..Velmurugan at CSIR-CRRI Colloquium on behalf of Entire Study Team
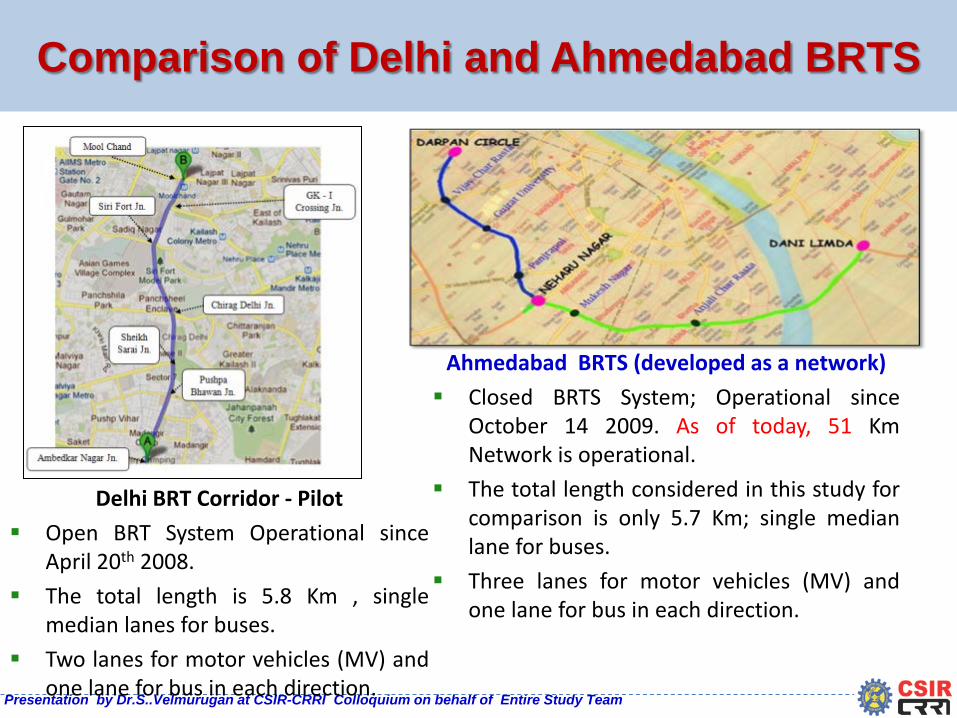
Comparison of Delhi and Ahmedabad BRTS
Delhi BRT Corridor - Pilot Open BRT System Operational since
April 20th 2008. The total length is 5.8 Km , single
median lanes for buses. Two lanes for motor vehicles (MV) and
one lane for bus in each direction.
Ahmedabad BRTS (developed as a network) Closed BRTS System; Operational since
October 14 2009. As of today, 51 Km Network is operational.
The total length considered in this study for comparison is only 5.7 Km; single median lane for buses.
Three lanes for motor vehicles (MV) and one lane for bus in each direction.
Presentation by Dr.S..Velmurugan at CSIR-CRRI Colloquium on behalf of Entire Study Team
Comparison of Delhi and Ahmedabad BRTS (Contd…)
Delhi BRT corridor
Traffic Volume Data Directional Volume count at
Intersections (16 Hours)
Speed and Delay Data Probe Vehicle method by fitting
Global Positioning System (GPS)
Ahmedabad BRT corridor
Traffic Volume Data Directional Volume count at
Intersections (16 Hours)
Speed and Delay Data Probe Vehicle method by fitting
Global Positioning System (GPS)
Presentation by Dr.S..Velmurugan at CSIR-CRRI Colloquium on behalf of Entire Study Team
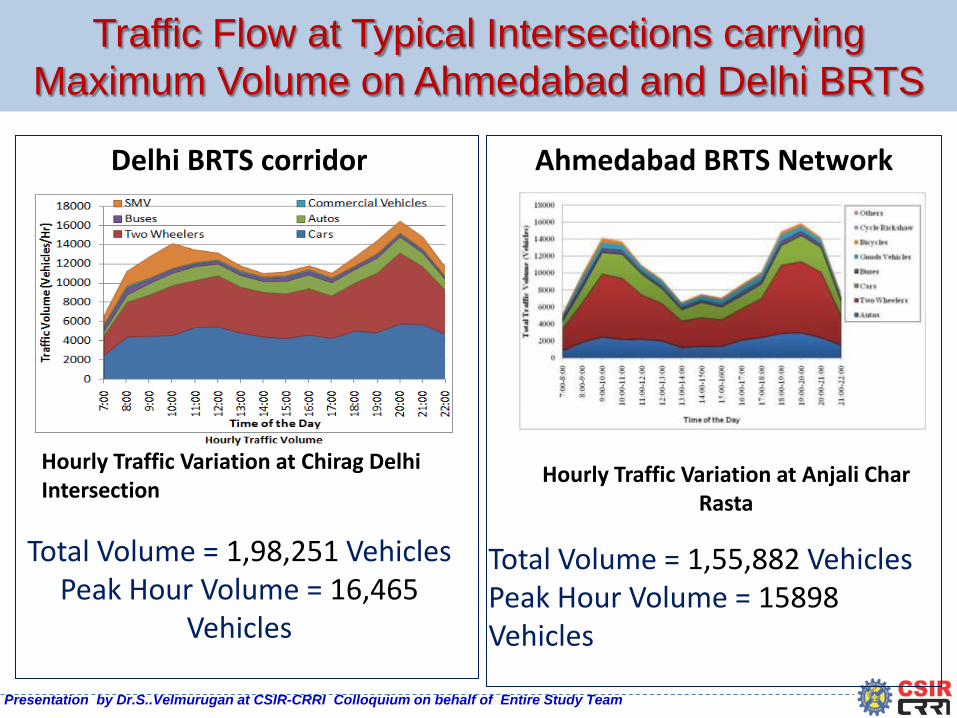
Traffic Flow at Typical Intersections carrying Maximum Volume on Ahmedabad and Delhi BRTS
Delhi BRTS corridor
Ahmedabad BRTS Network
Hourly Traffic Variation at Chirag Delhi Intersection
Hourly Traffic Variation at Anjali Char Rasta
Total Volume = 1,55,882 Vehicles Peak Hour Volume = 15898 Vehicles
Total Volume = 1,98,251 Vehicles Peak Hour Volume = 16,465
Vehicles

Presentation by Dr.S..Velmurugan at CSIR-CRRI Colloquium on behalf of Entire Study Team
Traffic Composition
Delhi BRT corridor
Ahmedabad BRTS
Traffic Composition at Chirag Delhi Intersection
Traffic Composition at Anjali Char Rasta

Presentation by Dr.S..Velmurugan at CSIR-CRRI Colloquium on behalf of Entire Study Team
Comparison of Traffic Volume and Composition on BRTS and Non-BRTS Corridors in Delhi
BRT corridor
Non - BRT corridor
Traffic Composition at Chirag Delhi Traffic Composition at Aurobindo Marg (Near Yusuf Sarai)

Presentation by Dr.S..Velmurugan at CSIR-CRRI Colloquium on behalf of Entire Study Team
BRT corridor
Non - BRT corridor
Comparison of Traffic Composition on BRTS and Non-BRTS Corridors in Ahmedabad
Presentation by Dr.S..Velmurugan at CSIR-CRRI Colloquium on behalf of Entire Study Team
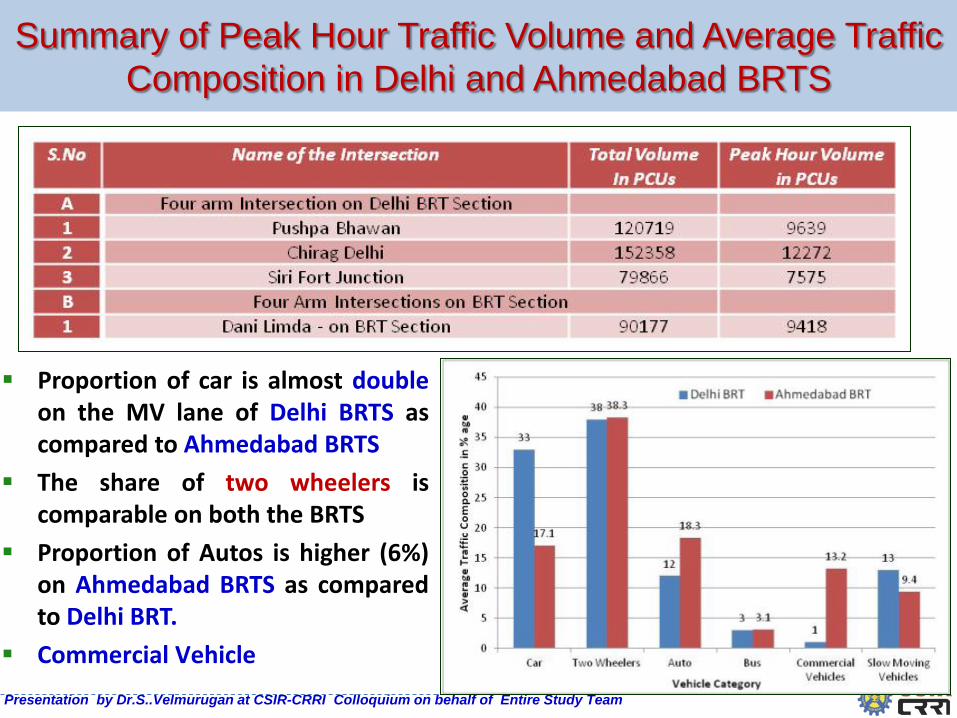
Summary of Peak Hour Traffic Volume and Average Traffic Composition in Delhi and Ahmedabad BRTS
Proportion of car is almost double on the MV lane of Delhi BRTS as compared to Ahmedabad BRTS
The share of two wheelers is comparable on both the BRTS
Proportion of Autos is higher (6%) on Ahmedabad BRTS as compared to Delhi BRT.
Commercial Vehicle

Presentation by Dr.S..Velmurugan at CSIR-CRRI Colloquium on behalf of Entire Study Team
Comparison of Speed and Delay Studies on Delhi and Ahmedabad BRTS
The Travel time of Cars on MV lane: The travel time is virtually same on both Delhi and Ahmedabad BRT before
the start of morning peak (i.e. 8 am) which is about 12 - 13 minutes. However, during the evening peak hours, very high travel time was
observed on Delhi BRT corridor extending up to 33.0 minutes. This is to a large extent due to the insufficient road width available on MV
Lane (7-8 m) as against the 10 m width available for each direction of travel before BRTS in April 2008.
The Travel time of Buses on BRT corridor: Commercial travel speeds of buses are higher by about 10 kmph on
Ahmedabad BRTS as compared to Delhi BRTS. Though the bus composition is about 3% of total traffic in both the cases, the
observed average speed of Buses on Ahmedabad BRT section varies between 22 to 25 Kmph (CEPT, Ahmedabad) which is much higher than that of Delhi BRTS (12-15 Kmph)

Presentation by Dr.S..Velmurugan at CSIR-CRRI Colloquium on behalf of Entire Study Team
Short Term Recommendations proposed based on CRRI study by retaining BRTS in Delhi
Redesign of Signal Phasing It was noted all the 4 armed intersections are provided 6 or 7 phases (at times) on the entire BRT corridor which includes 2 exclusive phases for BRT lane Buses. This issue can be efficiently addressed by providing the green phase for BRT lane (Straight) and MV lane (Straight) simultaneously on both directions of travel. This shall be followed by opening of the green phase for the BRT lane right and MV lane right directions simultaneously. The present U-Turning maneuver occurring at each of the approaches from the MV lane need to be accommodated appropriately in the phasing by making permitted U-Turns.

Summary of Signal Phasing and Cycle Length on Delhi BRTS before and after CSIR-CRRI
Name of the Intersection
Signal Cycle Pattern in Vogue before CSIR-CRRI study
Present Cycle Length in Vogue since
September 2012 after Redesign Proposal of
CSIR-CRRI Number of Phases*
Cycle
Length (sec)
Number of Phases**
Ambedkar Nagar 6 210 4
Pushp Bhawan 7 180 5
Sheik Sarai 7 165 3
Chirag Delhi 9 240 5
Siri Fort 8 225 5
* Including All red phase ** Without All red Phase
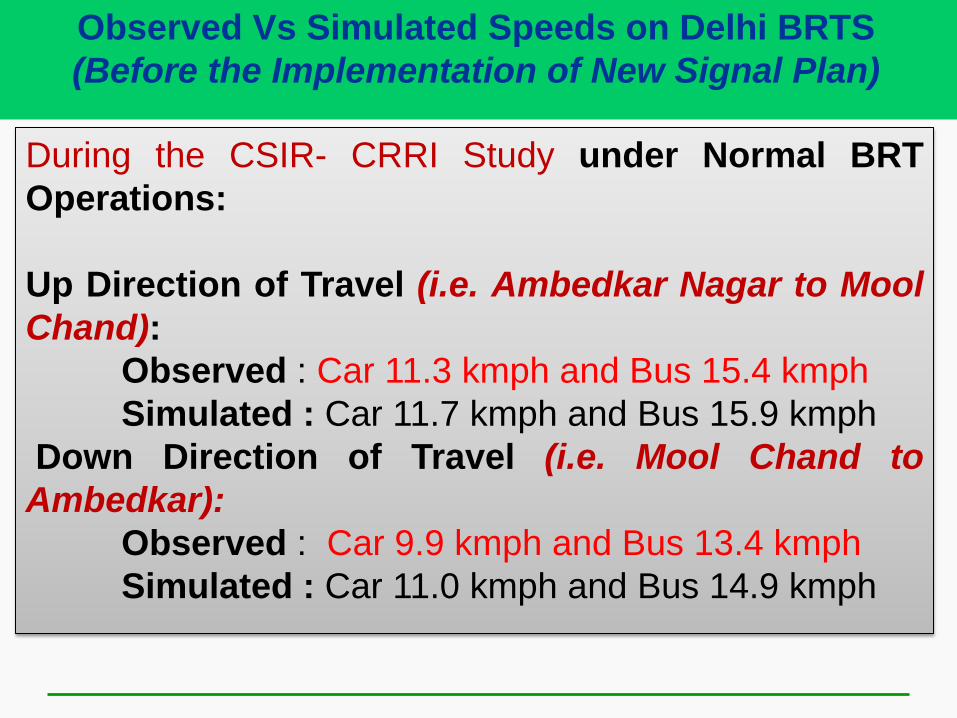
Observed Vs Simulated Speeds on Delhi BRTS (Before the Implementation of New Signal Plan)
During the CSIR- CRRI Study under Normal BRT Operations: Up Direction of Travel (i.e. Ambedkar Nagar to Mool Chand): Observed : Car 11.3 kmph and Bus 15.4 kmph Simulated : Car 11.7 kmph and Bus 15.9 kmph Down Direction of Travel (i.e. Mool Chand to Ambedkar): Observed : Car 9.9 kmph and Bus 13.4 kmph Simulated : Car 11.0 kmph and Bus 14.9 kmph
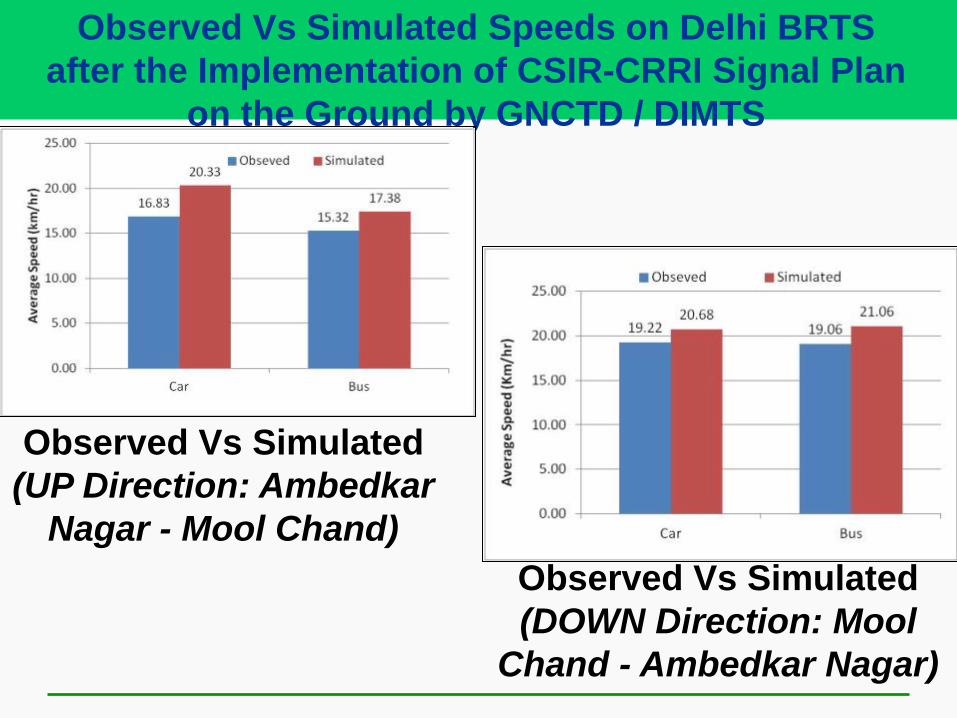
Observed Vs Simulated Speeds on Delhi BRTS after the Implementation of CSIR-CRRI Signal Plan
on the Ground by GNCTD / DIMTS
Observed Vs Simulated (UP Direction: Ambedkar
Nagar - Mool Chand) Observed Vs Simulated (DOWN Direction: Mool
Chand - Ambedkar Nagar)
Presentation by Dr.S..Velmurugan at CSIR-CRRI Colloquium on behalf of Entire Study Team
Short Term Recommendations proposed based on CRRI study by retaining BRTS in Delhi (Contd…)
Pedestrian Facilities Since all the six intersections located on the study corridor
exhibit huge quantum of pedestrian flows and hence they have crossed the limit of hazardous index. Considering the above, it is essential to provide at least to start with the facility for exclusive signal phasing at the intersections (‘All Red for Pedestrians’ Phase).
This measure is not implemented on the ground despite the Signal Head (named as Intelligent Signalling System ISS one of the best instrumentation in the world) is having this simple provision.
Secondly, wherever feasible, grade separated facility in the form of Foot Over Bridge / Subway need to be constructed. Of course in case of intersections like Chirag Delhi Intersection, the topology of the intersections itself makes the provision of grade separated facility a difficult task.

Presentation by Dr.S..Velmurugan at CSIR-CRRI Colloquium on behalf of Entire Study Team
Short Term Recommendations proposed based on CRRI study by retaining BRTS in Delhi (Contd…)
Parking Regulation It was observed that on-street parking is a common
phenomenon typically witnessed on the road stretch which is causing so much interference traffic on the MV lane on both directions of travel.
Incidentally parking study results revealed that 90 % of the parkers are short term parkers and they park their vehicles on main carriageway itself and thereby encroaching the main carriageway.
Since this is more of an enforcement issue, it can be strictly controlled through law enforcement.
Signs and Markings
Presentation by Dr.S..Velmurugan at CSIR-CRRI Colloquium on behalf of Entire Study Team
Short Term Recommendations proposed based on CRRI study by retaining BRTS in Delhi (Contd…)
Route Rationalization and Scheduling The maximum quantum of public transport passenger
loads on the study corridor is observed on the section between Sheikh Sarai - Chirag Delhi and vice versa direction as well of the corridor.
This is to a large extent contributed by two bus routes (i.e. Route Number 534 and 534-A) entering the study corridor at Sheikh Sarai and exiting at Chirag Delhi though it was found that the average number of passengers boarding / alighting from the above two bus routes is only 4 - 5 passengers per bus.

Presentation by Dr.S..Velmurugan at CSIR-CRRI Colloquium on behalf of Entire Study Team
Long Term Recommendations proposed by UTTIPEC by retaining BRTS
Provision of Extra Lane between (Sheikh Sarai to Chirag Delhi)
Provision of Grade separated Facilities required for MV lane traffic
New Link (between Press Enclave Marg and Outer Ring Road) by 2015. - Evaluation of the Option performed through Simulation
Presentation by Dr.S..Velmurugan at CSIR-CRRI Colloquium on behalf of Entire Study Team
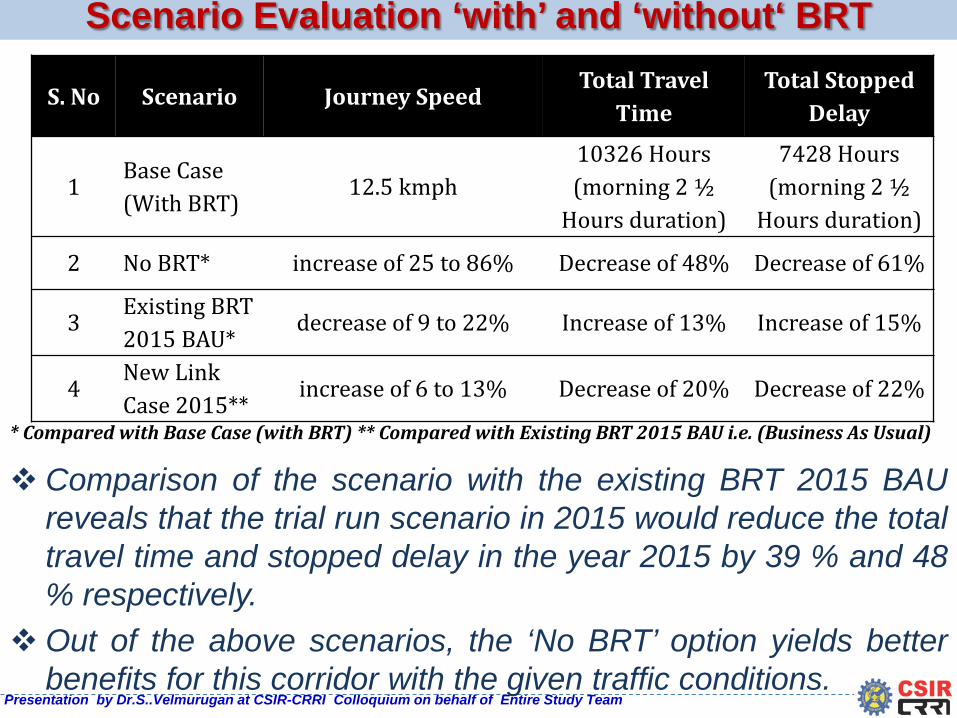
Scenario Evaluation ‘with’ and ‘without‘ BRT
Comparison of the scenario with the existing BRT 2015 BAU reveals that the trial run scenario in 2015 would reduce the total travel time and stopped delay in the year 2015 by 39 % and 48 % respectively.
Out of the above scenarios, the ‘No BRT’ option yields better benefits for this corridor with the given traffic conditions.
S. No Scenario Journey Speed Total Travel
Time Total Stopped
Delay
1 Base Case (With BRT)
12.5 kmph 10326 Hours (morning 2 ½
Hours duration)
7428 Hours (morning 2 ½
Hours duration)
2 No BRT* increase of 25 to 86% Decrease of 48% Decrease of 61%
3 Existing BRT 2015 BAU*
decrease of 9 to 22% Increase of 13% Increase of 15%
4 New Link Case 2015**
increase of 6 to 13% Decrease of 20% Decrease of 22%
* Compared with Base Case (with BRT) ** Compared with Existing BRT 2015 BAU i.e. (Business As Usual)

Limitations of VISSIM Model
• Not possible to accurately replicate the behaviour
of the individual Indian driver behaviour.
• The network is unable to accommodate the total
input volume.
• Not possible to accurately replicate the lane
change behaviour before the intersections.