Creative People and Places Profiling and Mapping 2014-2016 ... · Audience Spectrum is a population...
48
Creative People and Places Profiling and Mapping 2014-2016 National Report Daniel Cowley, Research Manager & Lorna Wooldridge, Research Assistant March 2017
Transcript of Creative People and Places Profiling and Mapping 2014-2016 ... · Audience Spectrum is a population...

Creative People and Places
Profiling and Mapping
2014-2016 National Report
Daniel Cowley, Research Manager
&
Lorna Wooldridge, Research Assistant
March 2017

© The Audience Agency 2017 1
Contents
Executive summary ..................................................................................... 2
About this report ........................................................................................ 4
Notes on the data ...................................................................................... 4
Geo-demographic profiling ........................................................................... 6
How to read the tables ............................................................................... 6
Mapping and location analysis ....................................................................... 7
Overall Findings .......................................................................................... 8
Audience Spectrum profile ........................................................................... 8
Mosaic profile ........................................................................................... 9
Social grade ........................................................................................... 10
Geographic spread of visitors ...................................................................... 10
Profiling .................................................................................................. 11
Audience Spectrum .................................................................................. 11
Mosaic Group profile ................................................................................ 13
Mosaic types .......................................................................................... 15
Social grade analysis .................................................................................. 17
Social grade ........................................................................................... 17
Geographic distribution .............................................................................. 19
Proportion of participants resident within project places .................................... 19
Distance analysis ..................................................................................... 21
Top postal sectors ................................................................................... 23
Mapping .................................................................................................. 25
All CPP project places............................................................................... 25
Participants by postal sector ....................................................................... 26
Household penetration by postal sector ......................................................... 30
Previous analysis by event type .................................................................... 34
Background ............................................................................................ 34
Summary of key findings ............................................................................ 35
Appendices .............................................................................................. 37
i. Audience Spectrum segment descriptions .................................................... 37
ii. Mosaic group and type descriptions ........................................................... 40

© The Audience Agency 2017 2
Executive summary
In its first three years, the Creative
People and Places (CPP) programme
attracted 1.3 million participants. Based
on over 98,000 postcodes from 20 of the
21 Places, this report describes the
characteristics of participants – their geo-
demographic profile, social grade, and
where they lived.
Audience Spectrum profile
Across the CPP programme, 91% of
participants belonged to one of the
medium or lower engaged Audience
Spectrum segments, compared with 77%
of the English population. This over-
representation was largely down to
strong over-representation of the lower
engaged segments, which accounted for
48% of participants and 36% of the
population.
The three most prominent Audience
Spectrums segments were Trips and
Treats, Facebook Families and
Dormitory Dependables, with 55% of all
participants belonging to one of these
three groups.
The most underrepresented segment
amongst CPP participants was
Metroculturals, a high engagement
segment. Although Metroculturals
account for 4% of England’s population,
only 1% of all CPP national participants
belonged to this segment.
Mosaic profile
The three most prominent Mosaic groups
amongst CPP participants were Aspiring
Homemakers, Family Basics and
Transient Renters; 34% of all
participants belonged to one of these
three groups.
The most under-represented groups were
City Prosperity, Prestige Positions, groups
which tend to be wealthier and more
urban.
Looking in slightly more detail by
segmenting participants into Mosaic
types, the five most prominent were
Affordable Fringe, Renting a Room, Low
Income Workers, Families with Needs
and Make Do and Move On. Over a fifth
of all participants fell into one of these
five types, and all were found in much
larger proportions amongst CPP
participants than in the wider population.
Social grade
Modelling based on Mosaic types suggests
that across all CPP projects
approximately 53% of participants
belonged to the C2, D or E social grade.
This is higher than is seen across England,
where 47% fall of households into the C2,
D or E social grade.
Those in social grade D were most
strongly over-represented amongst CPP
participants, and those in group A the
most under-represented.

© The Audience Agency 2017 3
Location
Although participants were found right
across the UK, they came predominantly
from those areas where CPP projects
were taking place: around three
quarters lived in the project area of the
event they attended.
Although the ‘average’ Place saw 72% of
its participants come from the project
area, there was a relatively large range
found amongst the places. Nine out of
ten participants in the most ‘local’
project lived within that project’s area,
whereas
the least ‘local’ project attracted just
over half from elsewhere.
The local nature of participants is also
seen when analysing drive times: half of
participants lived within 10 minutes (or a
3 mile drive time) of the event they
attended. On average, a participant
lived a 22 minute drive from the event(s)
they attended, or 10 miles as the crow
files.
Daniel Cowley, Research Manager
March 2017

© The Audience Agency 2017 4
About this report
This report describes who the Creative People and Places programme reached in its
first three years – 2014, 2015 and 2016.
The analysis in this report is based on postcodes provided by 20 (of the total 21) Creative
People and Places projects, for all events that took place between January 2014 and
December 2016. Postcodes were collected from project participants, i.e. people who took
part in project activities or attended project events.
Reports are also available for each year individually, and a report investigating the
participant profile for different types of events is also available, based on data collected
at events in 2015. A summary of the key findings of this research is included from page 34
of this report.
The analysis has been carried out by the Research Team at The Audience Agency. For
more information on this report please contact [email protected].
A spreadsheet containing the full analysis tables is available alongside this report – please
contact [email protected].
Notes on the data
A total sample of 98,527 UK postcodes were provided across 20 projects. Of these, 94,830
postcodes were matched to an Audience Spectrum segment and 95,273 were matched to a
Mosaic group and type.
In this report, ‘National participant profile’ refers to all CPP project participants from
2014 to 2016, where the audience size of each CPP project is taken into account and
the results weighted accordingly (i.e. projects which had more participants are more
prominent in the profiles, regardless of the number of postcodes provided). All data is
weighted according to the audience size reported by each project manager (up to end of
December 2016), which totalled 1,342,473 participants across the 20 projects for which
data was provided.
For comparison, an ‘Average Place participants profile’ is also given, which refers to the
average profile seen across all CPP projects, for those places that provided participant
postcodes. This provides a ‘flattened’ version of the profile, where all Places are given
equal weighting, regardless of their total audience size, and therefore describes what the
‘average’ CPP project looked like from 2014 to 2016.

© The Audience Agency 2017 5
A full breakdown of audience size and number of valid UK postcodes by CPP project
follows:
Project name Project area
Total
audience size
2014-16
Total
postcodes,
2014-16
Appetite Stoke-on-Trent 337,407 17,830
bait South East Northumberland 120,123 5,486
Creative Barking & Dagenham Barking and Dagenham 38,140 4,056
Creative Black Country Black Country 25,727 641
Creative Scene North Kirklees 75,874 1,506
East Durham Creates East Durham 28,634 4,110
First Art Derbyshire 74,846 4,363
Heart of Glass St Helen’s 121,074 22,773
HOME Slough 3,688 170
Hounslow Creative People & Places Hounslow 111,650 793
Ideas Test Swale and Medway 27,383 2,924
LeftCoast Blackpool and Wyre 84,743 3,370
Corby Made in Corby 25,231 5,926
Market Place Fenland and Forest Heath 35,210 1,321
Peterborough Presents… Peterborough 17,860 1,375
Revoluton Arts Luton 5,727 538
Right Up Our Street Doncaster 90,203 10,556
Super Slow Way Pennine Lancashire 8,592 2,297
The Culture Spring South Tyneside and North Sunderland 31,756 4,178
Transported Boston and South Holland 78,605 4,314
All Places combined 1,342,473 98,527
Place Average 67,124 4,926

© The Audience Agency 2017 6
Geo-demographic profiling
Geo-demographic profiling classifies people into different ‘types’ depending on where
they live, and can be used to understand the lifestyles, preferences and motivations of a
group of attenders.
Audience Spectrum is a population profiling tool which describes attendance,
participation and engagement with the arts, museums and heritage, as well as behaviours,
attitudes and preferences towards such organisations. It is specifically designed to meet
the needs of small and large scale, ticketed and non-ticketed organisations from across
the cultural sector.
Audience Spectrum assigns one of ten segments to each UK household, based on likely
engagement with and preferences towards arts, museums and heritage. These segments
are also grouped into three engagement levels – High, Medium and Lower engagement –
which summarise broadly their propensity to engage in the arts and culture. To find out
more and to view the pen portraits for each segment visit:
www.theaudienceagency.org/audience-spectrum
Mosaic combines a wide range of information from over 400 sources to create a summary
of the likely characteristics of each UK household. Households are assigned to a ‘group’, of
which there are 15 in Mosaic, which describes their likely socio-economic and cultural
behaviour. Each group is then broken down into a total of 66 ‘types’ so that each
household has a further, more detailed categorisation.
Mosaic is used across a number of business sectors and is also an effective tool when
applied to the arts. It is particularly useful for:
Understanding your audiences beyond their engagement with culture
Identifying hot-spots and understanding cold-spots
Targeting to postcode and household level
Selecting promotional/advertising media and marketing messages
How to read the tables
The profiling tables in this report show the size of each segment, group or type within the
participant profile and compares this to the size of that segment, group or type within the
base population (in this case, all households in England). Percentages are provided to show
the proportion that each segment, group or type makes up of the total.

© The Audience Agency 2017 7
The index figures show whether each is over- or under-represented in the participant
profile compared to the base population. An index of 100 occurs where the proportion of a
group in the sample exactly matches the size of that group within the base population.
An index over 100 indicates this group is over-represented in the participant profile
compared to the population of the base area. Indexes of 120 or over are highlighted, with
the index being coloured red. An index of less than 100 indicates this group is under-
represented in the participant profile compared to the population. Indexes of 80 or under
and highlighted with the index being coloured blue.
Mapping and location analysis
The maps in this report show the distribution of the national CPP audience. It should be
noted that the maps are created from the postcode given at the time of attending (most
likely a home postcode) and not necessarily where the person has travelled from that day
(for example, they may have commuted from a location closer to the event).
Count maps show which postcode sectors contain the highest and lowest numbers of
participants. All postcode sectors which contain at least one participant from any of the
CPP projects are ranked (from highest to lowest) according to the total number of
participants found within each postal sector, and are grouped into bands. Each band
breaks down the number of participants into set bands.
Penetration maps show which postcode sectors contain the highest and lowest
proportions of participants as a percentage of the overall number of households in that
postal sector. Those with the highest proportions (i.e. the highest penetration) are shaded
darkest, and those with the lowest are shaded lightest. Any areas shown in white contain
no participants.
A summary of the top ten postcodes in terms of counts and penetration can be found from
page 21. The full data that sits behind these maps can be found in the accompanying
spreadsheet.
Finally, postcodes have been analysed to describe the percentage of participants from
within and without each project area, and the average drive time/distance between
participants’ home and the events they attended.
© The Audience Agency 2017 8
Overall Findings
Audience Spectrum profile
Across all CPP project activity between January 2014 and December 2016, 48% of
participants belonged to one of the lower engaged Audience Spectrum segments, 42% one
of the medium engaged segments and 9% one of the higher engaged segments. This
compares to 36% lower, 41% medium and 23% higher in the England population. Amongst
CPP participants, 14% more were from lower and medium engaged segments than are
present in the English population as a whole.
The three most prominent Audience Spectrums segments across the CPP participants were
Trips and Treats, Facebook Families and Dormitory Dependables. 55% of all participants
belong to one of these three groups.
Trips & Treats: Suburban households, often with children, whose cultural activities
usually are part of a day out or treat (Medium engagement)
Facebook Families: Harder pressed suburban and semi-urban households for whom
arts and culture plays a small role (Lower engagement)
Dormitory Dependables: Regular but not frequent cultural attenders living in city
suburbs and small towns (Medium engagement)
Both Trips & Treats and Facebook Families were over-represented when compared to
England, each accounting for 21% of CPP participants compared with 15% and 10% of
England’s population respectively. This means the Facebook Families group, a lower
engagement segment, was both prominent and strongly over-represented amongst CPP
participants. Dormitory Dependables, on the other hand, was slightly underrepresented:
whilst being a fairly prominent segment amongst participants (13%) a larger proportion is
found in the population as a whole (15%).
Whilst less prominent amongst participants, Up Our Street and Kaleidoscope Creativity,
two other lower engaged groups, were also over-represented when compared to England.
Heydays, the last of the lower-engaged segments, was slightly smaller in the participant
profile (5%) than in England as a whole (7%).
The most underrepresented segment amongst CPP participants was Metroculturals, a high
engagement segment. This segment accounted for 1% of all CPP national participants, but
makes up 4% of England’s population.
© The Audience Agency 2017 9
Mosaic profile
Mosaic groups
The three most prominent Mosaic groups amongst CPP participants were Aspiring
Homemakers, Family Basics and Transient Renters. 34% of all participants belonged to
one of these three groups.
Aspiring Homemakers: Younger households settling down in housing priced within
their means.
Family Basics: Families with limited resources who have to budget to make ends
meet.
Transient Renters: Single people privately renting low cost homes for the short
term.
As well as being the most prominent in terms of size, these three Mosaic groups were also
all over-represented amongst participants when compared to England as a whole. Whilst
not as prominent, the those of the Mosaic group Modest Traditions was notably over-
represented, accounting for 7% of CPP participants and 5% of households in England.
The most under-represented groups amongst participants were City Prosperity, Prestige
Positions, Country Living and Rental Hubs, collectively representing 25% of England
households, but only accounting for 11% of CPP participants.
Mosaic types
The ten most prominent Mosaic types amongst CPP were Affordable Fringe, Renting a
Room, Low Income Workers, Families with Needs, Make Do and Move On, Childcare
Squeeze, Seasoned Survivors, Modern Parents, Bungalow Haven and Classic Grandparents.
Altogether, 36% of participants fell into one of these ten types, with the top five types
alone accounting for over a fifth of all participants.
Affordable Fringe: Settled families with children owning modest, 3-bed semis in
areas where there’s more house for less money (in the Aspiring Homemakers group)
Renting a Room: Transient renters of low cost accommodation often within
subdivided older properties (in the Transient Renters group)
Low Income Workers: Older social renters settled in low value homes in
communities where employment is harder to find (in the Municipal Challenge group)
Families with Needs: Families with many children living in areas of high deprivation
and who need support (in the Family Basics group)

© The Audience Agency 2017 10
Make Do and Move On: Yet to settle younger singles and couples making interim
homes in low cost properties (in the Transient Renters group)
Nine of the top 10 Mosaic types were over-represented amongst CPP participants when
compared with English households, except Bungalow Haven which was very slightly under-
represented.
Social grade
Modelling based on Mosaic types suggests that across all CPP projects approximately 53%
of participants belonged to the C2, D or E social grade. This is 7% higher than is seen
across all households in England, where 47% fall into the C2, D or E social grade.
Those in social grade D were most strongly over-represented, accounting for 18% of
participants compared with 16% of households in England, and those in social grade A the
most under-represented, accounting for 3% of participants and 4% of households.
Geographic spread of visitors
Although participants were found right across the UK, they came predominantly from
those areas where CPP projects were taking place, with 72% of participants living in the
project area of the event(s) they attended. Although the ‘average’ place saw 73% of its
participants come from the project area area, there was a relatively large range found
amongst the places, with the most ‘local’ seeing 93% resident in the project area, and the
least ‘local’ attracting 53% of their participants from outside the project area.
The areas with the highest number of participants were Stoke-on-Trent, St Helens, South
East Northumberland and Hounslow due to the scale of the projects in these places – each
of which had over 100,000 participants across the three years.
The local nature of participants is also seen when analysing drive times: half of
participants lived within 10 minutes (or a 3 mile drive time) of the event they attended.
On average, a participant lived a 22 minute drive from the event(s) they attended, or 10
miles as the crow files.

© The Audience Agency 2017 11
Profiling
Audience Spectrum
Segment name National participant
profile 2014-16
Average Place
participant profile
2014-16
England
(households)
Index
(National Participant
Profile vs. England)
Metroculturals 1% 1% 4% 20
Commuterland Culturebuffs 5% 6% 10% 47
Experience Seekers 4% 5% 8% 47
Dormitory Dependables 13% 13% 15% 91
Trips & Treats 21% 19% 15% 137
Home & Heritage 8% 8% 11% 72
Up Our Street 12% 11% 10% 114
Facebook Families 21% 19% 10% 218
Kaleidoscope Creativity 10% 13% 9% 108
Heydays 5% 5% 7% 81
Base 94,830 94,830 23,193,748 -

© The Audience Agency 2017 12
Audience Spectrum: Participants compared to England households
Please note: On all profiling charts the data label is rounded to the nearest percentage whereas the bars show the actual (un-rounded) value.
1%
5%
4%
13%
21%
8%
12%
21%
10%
5%
1%
6%
5%
13%
19%
8%
11%
19%
13%
5%
4%
10%
8%
15% 15%
11%
10%
10%
9%
7%
0%
5%
10%
15%
20%
25%
Metroculturals CommuterlandCulturebuffs
ExperienceSeekers
DormitoryDependables
Trips & Treats Home &Heritage
Up Our Street FacebookFamilies
KaleidoscopeCreativity
Heydays
Higher engagement Medium engagement Lower engagement
National participant profile 2014 - 2016
Average place participant profile 2014 - 2016
England (households)

© The Audience Agency 2017 13
Mosaic Group profile
Group name National participant
profile 2014-16
Average Place
participant profile
2014-16
England
(households)
Index
(National Participant
Profile vs. England)
A City Prosperity 1% 1% 5% 17
B Prestige Positions 3% 4% 7% 50
C Country Living 3% 3% 6% 48
D Rural Reality 5% 6% 6% 96
E Senior Security 8% 8% 9% 93
F Suburban Stability 8% 7% 6% 136
G Domestic Success 7% 7% 8% 88
H Aspiring Homemakers 12% 11% 9% 125
I Family Basics 11% 11% 7% 144
J Transient Renters 11% 11% 7% 168
K Municipal Challenge 8% 6% 6% 124
L Vintage Value 6% 6% 7% 95
M Modest Traditions 7% 6% 5% 152
N Urban Cohesion 6% 9% 6% 103
O Rental Hubs 4% 5% 8% 51
Base 95,273 95,273 22,722,241 -

© The Audience Agency 2017 14
Mosaic groups: participants compared to England households
1%
3%
3%
5%
8% 8%
7%
12%
11%
11%
8%
6%
7%
6%
4%
1%
4%
3%
6%
8%
7%
7%
11%
11%
11%
6%
6%
6%
9%
5%
5%
7%
6%
6%
9%
6%
8%
9%
7%
7%
6%
7%
5%
6%
8%
0%
2%
4%
6%
8%
10%
12%
14%
National participant profile 2014 - 2016
Average place participant profile 2014 - 2016
England (households)

© The Audience Agency 2017 15
Mosaic types
The following table shows the top 10 Mosaic types in National Participant Profile. A table
showing the full Mosaic type profile is available in the accompanying spreadsheet.
Type name
National
participant
profile 2014-16
Average Place
profile 2014-16
England
(households)
Index
(National
Participant
Profile vs.
England)
H31 Affordable Fringe 6% 4% 3% 205
J43 Renting a Room 5% 4% 2% 223
K48 Low Income Workers 4% 3% 2% 240
I39 Families with Needs 4% 3% 2% 147
J40 Make Do and Move On 3% 3% 1% 230
I38 Childcare Squeeze 3% 3% 2% 208
L53 Seasoned Survivors 3% 2% 1% 254
G28 Modern Parents 3% 2% 2% 153
E19 Bungalow Haven 3% 3% 3% 90
E20 Classic Grandparents 3% 2% 2% 140
Base 95,273 95,273 22,722,241 -

© The Audience Agency 2017 16
Top 10 Mosaic types: participants compared to England households
6%
5%
4%
4%
3%
3%
3%
3%
3%
3%
4%
4%
3%
3%
3%
3%
2% 2%
3%
2%
3%
2%
2%
2%
1% 2%
1%
2%
3%
2%
0%
1%
2%
3%
4%
5%
6%National participant profile 2014 - 2016
Average place participant profile 2014 - 2016
England (households)

© The Audience Agency 2017 17
Social grade analysis
Social grade is an occupation-based system of demographic classification, which groups
the population on the basis of the head of the household’s occupation. Although
superseded by the National Statistics Socio-economic Classification (NS-SEC), it can be
useful in expressing the socio-economic status of a population via widely recognised
categories. Broadly, the six social grades are:
A – Professional occupations
B – Managerial and technical occupations
C1 – Skilled non-manual occupations
C2 – Skilled manual occupations
D – Semi-skilled and unskilled manual occupations
E – Casual workers, pensioners and those who depend on the welfare state for their
income
Each Mosaic type has an index which describes how likely an individual of this type is to
belong to each of the socio-economic groups A, B, C1, C2, D and E. Therefore, we can use
Mosaic as proxy for social grade. However it should be noted that this analysis should only
be taken as being indicative of the likely profile of CPP participants.
Social grade
Social grade
National
participant profile
2014-16
Average place
profile 2014-16
England
(households)
Index
(National
participant profile
vs. England)
A 3% 3% 4% 69
B 19% 19% 22% 83
C1 26% 25% 27% 96
C2 24% 24% 22% 111
D 18% 18% 16% 117
E 10% 10% 9% 115
Base 95,273 95,273 22,722,241 -

© The Audience Agency 2017 18
3%
19%
26%
24%
18%
10%
3%
19%
25%
24%
18%
10%
4%
22%
27%
22%
16%
9%
0%
5%
10%
15%
20%
25%
30%
A B C1 C2 D E
National participant profile 2014 - 2016 Average participant profile 2014 - 2016
England population

© The Audience Agency 2017 19
Geographic distribution
Proportion of participants resident within project places
Each participant postcode was analysed to determine whether the participant lived within
the project area for the event(s) they were attending, or elsewhere.
Note: This analysis does not include those who participated by watching online streams of
Project content.
93%
90%
88%
88%
84%
84%
83%
80%
80%
79%
77%
73%
68%
66%
64%
59%
57%
55%
47%
47%
72%
73%
7%
10%
12%
12%
16%
16%
17%
20%
20%
21%
23%
27%
32%
34%
36%
41%
43%
45%
53%
53%
28%
27%
Heart of Glass
Transported
East Durham Creates
Creative Black Country
Ideas Test
Right Up Our Street
Hounslow Creative People & Places
Creative Scene
Creative Barking and Dagenham
Made in Corby
Super Slow Way
Peterborough Presents
Revoluton
Market Place
Appetite
LeftCoast
HOME
The Cultural Spring
First Art
bait
All Participants
Place Average
% inside project area % outside project area

© The Audience Agency 2017 20
Project Area Participants Valid postcodes Inside project area Outside project area
Heart of Glass St Helens 121,074 22,618 93% 7%
Transported Boston and South Holland 78,605 4,280 90% 10%
East Durham Creates East Durham 28,634 3,711 88% 12%
Creative Black Country Black Country 25,727 633 88% 12%
Ideas Test Swale and Medway 27,383 2,889 84% 16%
Right Up Our Street Doncaster 90,203 10,556 84% 16%
Hounslow Creative People & Places Hounslow 111,650 730 83% 17%
Creative Scene North Kirklees 75,874 1,492 80% 20%
Creative Barking and Dagenham Barking and Dagenham 38,140 3,829 80% 20%
Made in Corby Corby 25,231 5,672 79% 21%
Super Slow Way Pennine Lancashire 8,592 2,179 77% 23%
Peterborough Presents Peterborough 17,860 1,347 73% 27%
Revoluton Luton 5,727 526 68% 32%
Market Place Fenland and Forest Heath 35,210 1,321 66% 34%
Appetite Stoke 337,407 17,754 64% 36%
LeftCoast Blackpool and Wyre 84,743 3,318 59% 41%
HOME Slough 3,688 157 57% 43%
The Cultural Spring North Sunderland and South Shields 31,756 4,115 55% 45%
First Art Derbyshire 57,846 2,514 47% 53%
Bait South East Northumberland 120,123 5,357 47% 53%
All Participants 1,325,473 - 72% 28%
Place Average 66,274 4,750 73% 27%
Base 1,325,473 94,998 - -

© The Audience Agency 2017 21
Distance analysis
This analysis looks at how far participants lived from the event(s) they attended in 2015
and 20161. The mean describes the average distance/time, and the median describes the
distance/drive time within which 50% of participants lived.
Measure
National participant profile
2014–16
Average Place participant
profile 2014-16
Mean Median Mean Median
Drive time (minutes) 21.5 10 17.4 9
Drive distance (miles) 13.6 3 10.4 3
Straight distance 10.3 2 7.9 2
1 No event location data was available for activity in 2014
21.5
13.6
10.310
32
0
5
10
15
20
25
Drive time (minutes) Drive distance (miles) Straight distance (miles)
National participant profile Mean
Median

© The Audience Agency 2017 22
17.4
10.4
7.99
32
0
5
10
15
20
Drive time (minutes) Drive distance (miles) Straight distance (miles)
Average Place participants profile Mean
Median

© The Audience Agency 2017 23
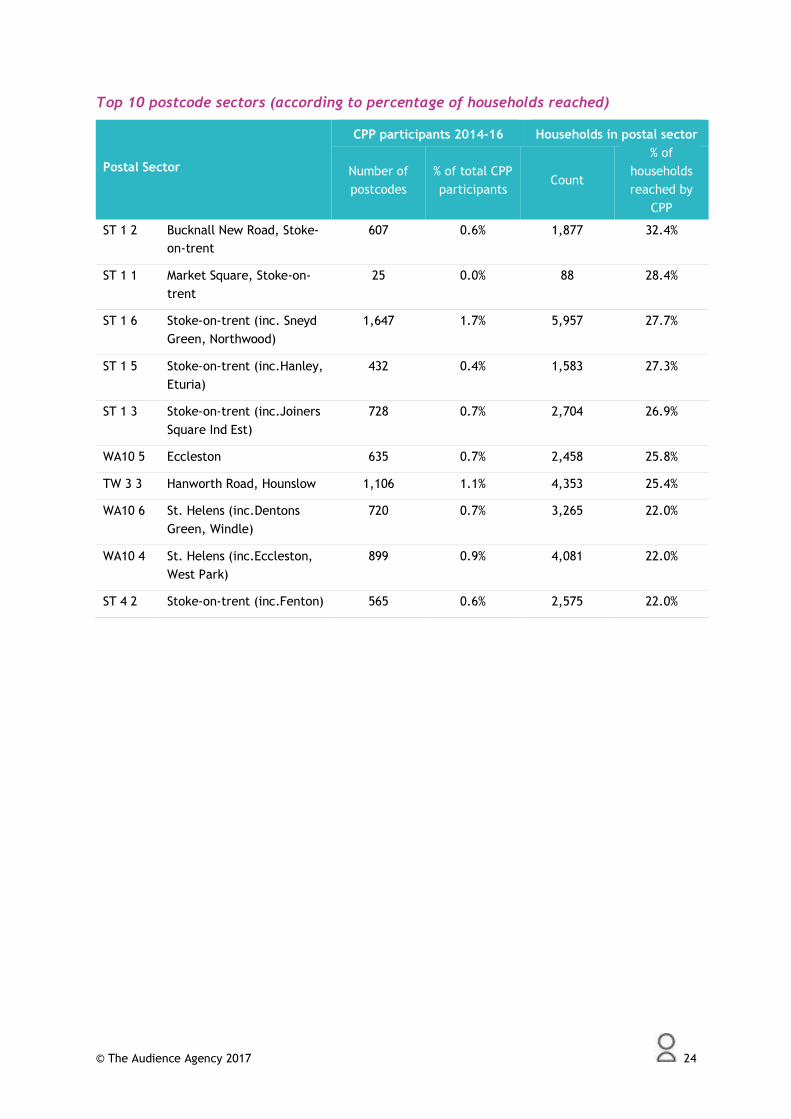
Top postal sectors
Over the next two pages, tables are provided to show the postal sectors which rank
highest in terms of the proportion of total number of CPP participants that they contain,
and how this compares to the number of households in that postal sector. Postal sectors
which are covered by projects with larger numbers of participants will therefore be
more prominent in these tables.
A breakdown of participants and household penetration for all postal sectors in which at
least one CPP participant lived is given on the accompanying spreadsheet.
Top 10 postcode sectors (according to number of participants)
Postal Sector
CPP participants 2014-16 Households in postal sector
Number of
postcodes
% of total CPP
participants Count
% of
households
reached by
CPP
ST 1 6 Stoke-on-trent (inc. Sneyd
Green, Northwood)
1,647 1.7% 5,957 27.7%
WA11 0 Haydock 1,147 1.2% 6,755 17.0%
TW 3 3 Hanworth Road, Hounslow 1,106 1.1% 4,353 25.4%
WA11 9 St. Helens (inc. Haydock) 1,064 1.1% 5,000 21.3%
WA10 4 St. Helens (inc. Eccleston,
West Park)
899 0.9% 4,081 22.0%
RM 6 5 Romford (inc. Little Heath,
Chadwell Heath)
880 0.9% 4,288 20.5%
DN11 0 New Rossington, Rossington 850 0.9% 5,623 15.1%
ST 6 6 Biddulph Road, Stoke-on-
trent
758 0.8% 5,559 13.6%
ST 1 3 Stoke-on-trent (inc. Joiners
Square Ind Est)
728 0.7% 2,704 26.9%
ST 6 8 Stoke-on-trent (inc. Brown
Edge, Ball Green)
726 0.7% 5,481 13.3%
© The Audience Agency 2017 24
Top 10 postcode sectors (according to percentage of households reached)
Postal Sector
CPP participants 2014-16 Households in postal sector
Number of
postcodes
% of total CPP
participants Count
% of
households
reached by
CPP
ST 1 2 Bucknall New Road, Stoke-
on-trent
607 0.6% 1,877 32.4%
ST 1 1 Market Square, Stoke-on-
trent
25 0.0% 88 28.4%
ST 1 6 Stoke-on-trent (inc. Sneyd
Green, Northwood)
1,647 1.7% 5,957 27.7%
ST 1 5 Stoke-on-trent (inc.Hanley,
Eturia)
432 0.4% 1,583 27.3%
ST 1 3 Stoke-on-trent (inc.Joiners
Square Ind Est)
728 0.7% 2,704 26.9%
WA10 5 Eccleston 635 0.7% 2,458 25.8%
TW 3 3 Hanworth Road, Hounslow 1,106 1.1% 4,353 25.4%
WA10 6 St. Helens (inc.Dentons
Green, Windle)
720 0.7% 3,265 22.0%
WA10 4 St. Helens (inc.Eccleston,
West Park)
899 0.9% 4,081 22.0%
ST 4 2 Stoke-on-trent (inc.Fenton) 565 0.6% 2,575 22.0%

© The Audience Agency 2017 25
Mapping
All CPP project places

© The Audience Agency 2017 26
Participants by postal sector
UK

© The Audience Agency 2017 27
North East

© The Audience Agency 2017 28
North West and Midlands

© The Audience Agency 2017 29
South and East

© The Audience Agency 2017 30
Household penetration by postal sector
UK

© The Audience Agency 2017 31
North East

© The Audience Agency 2017 32
North West and Midlands

© The Audience Agency 2017 33
South and East

© The Audience Agency 2017 34
Previous analysis by event type
Background
An additional piece of analysis was carried out on the 2015 data. This analysis categorised
events according to their characteristics to allow us to see the participant profiles for
events of different broad types, and understand the event preferences of different
participant segments. The characteristics we investigated were:
Event time – morning, afternoon, evening or all day events
Location type – indoor arts venue, indoor non-arts venue or outdoor events
Participation – contained participation or not
Entry cost – free or paid-for events
Area type – urban, sparse/fringe or rural event location
Event date – weekday or weekend events
Audience size – very small, small, medium, large or very large events
Artform – combined arts, dance, digital, film, museum/galley, music, outdoor arts,
theatre, visual arts or other artform events
The analysis was based on postcodes provided by 19 (of the total 21) Creative People and
Places projects, for all events that took place between January and December 2015.
A summary of the key findings follows; the full report looks at the participant profile of
each of the above event types, with a summary of notable findings followed by the
participant profile of reach of the above event types. Please contact
[email protected] for more information.

© The Audience Agency 2017 35
Summary of key findings
Audience Spectrum profile
Across the CPP programme in 2015, participants from lower engaged segments tended to
make up a larger proportion of participants than those from the medium or higher
engaged segments.
When we compare the proportions of those in each engagement level across different
types of events, we see that lower engaged segments had a preference for events that:
Took place in the afternoon
Were outdoors
Contained participation
Were free
Took place in urban areas
Had a small to medium number of participants (between 20 and 299)
Were outdoor arts-based
More than any other type of event, medium engaged segments were more often found at
events that:
Took place in the morning
Were in an indoor arts venue
Did not involve participation
Were in rural areas
Were on a weekday
Had a very large number of participants (over 1,000)
Were theatre-based
More than any other type of event, higher engaged segments were more often found at
events that:
Took place over the course of the whole day
Were in an indoor arts venue
Did not involve participation
Were paid-for
Were in rural areas
Were on a weekend
Had a large number of participants (between 300 and 999)
Were combined arts or digital-based

© The Audience Agency 2017 36
Geographic analysis
The majority of participants lived in urban areas - regardless of where an event took
place, it tended to attract mostly urban participants. For example, 52% of participants at
events in rural areas lived in urban areas, compared with 32% who lived in rural areas.
Events in urban areas were overwhelmingly attended by those resident in urban areas,
with just 10% of participants for these events living in sparse/fringe or rural areas.
Rural and sparse/fringe events had the widest reach in terms of drive time and distance
travelled. This means participants from rural and sparse/fringe areas tended to travel
further to attend the events they did than participants from urban areas.
© The Audience Agency 2017 37
Appendices
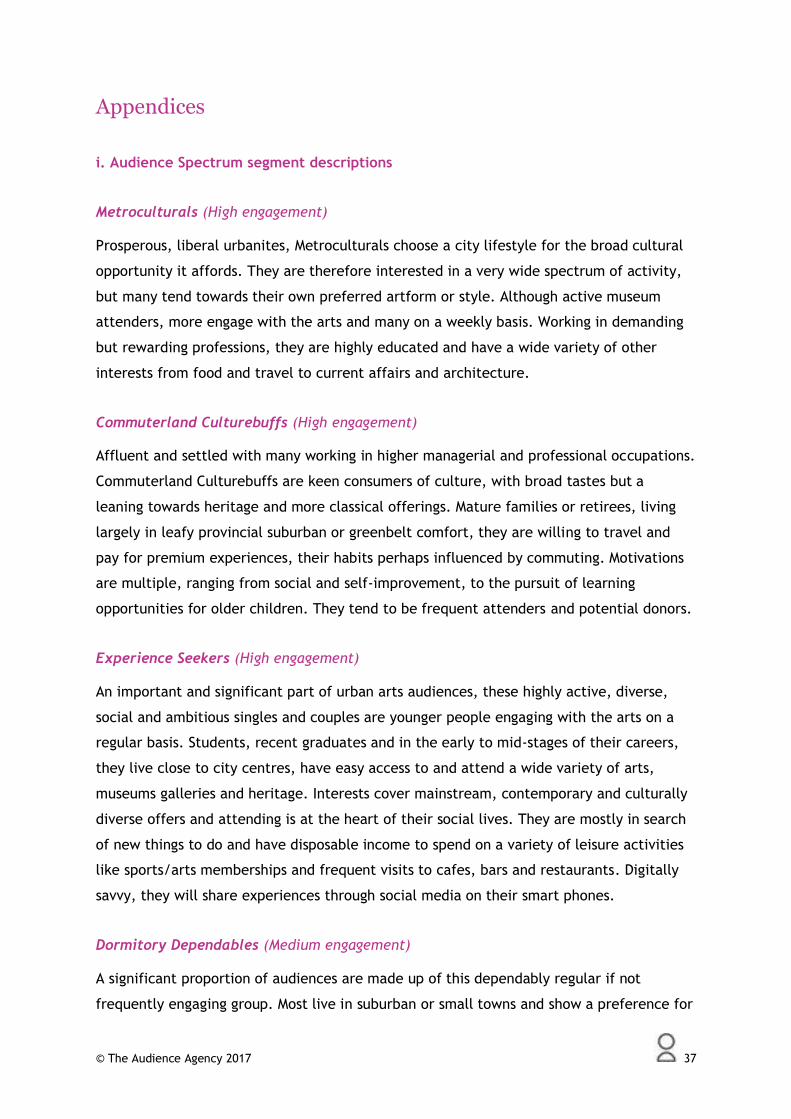
i. Audience Spectrum segment descriptions
Metroculturals (High engagement)
Prosperous, liberal urbanites, Metroculturals choose a city lifestyle for the broad cultural
opportunity it affords. They are therefore interested in a very wide spectrum of activity,
but many tend towards their own preferred artform or style. Although active museum
attenders, more engage with the arts and many on a weekly basis. Working in demanding
but rewarding professions, they are highly educated and have a wide variety of other
interests from food and travel to current affairs and architecture.
Commuterland Culturebuffs (High engagement)
Affluent and settled with many working in higher managerial and professional occupations.
Commuterland Culturebuffs are keen consumers of culture, with broad tastes but a
leaning towards heritage and more classical offerings. Mature families or retirees, living
largely in leafy provincial suburban or greenbelt comfort, they are willing to travel and
pay for premium experiences, their habits perhaps influenced by commuting. Motivations
are multiple, ranging from social and self-improvement, to the pursuit of learning
opportunities for older children. They tend to be frequent attenders and potential donors.
Experience Seekers (High engagement)
An important and significant part of urban arts audiences, these highly active, diverse,
social and ambitious singles and couples are younger people engaging with the arts on a
regular basis. Students, recent graduates and in the early to mid-stages of their careers,
they live close to city centres, have easy access to and attend a wide variety of arts,
museums galleries and heritage. Interests cover mainstream, contemporary and culturally
diverse offers and attending is at the heart of their social lives. They are mostly in search
of new things to do and have disposable income to spend on a variety of leisure activities
like sports/arts memberships and frequent visits to cafes, bars and restaurants. Digitally
savvy, they will share experiences through social media on their smart phones.
Dormitory Dependables (Medium engagement)
A significant proportion of audiences are made up of this dependably regular if not
frequently engaging group. Most live in suburban or small towns and show a preference for

© The Audience Agency 2017 38
heritage activities, alongside popular and more traditional, mainstream arts. Many are
thriving well off mature couples or busy older families; lifestage coupled with more
limited access to an extensive cultural offer mean that culture is more an occasional treat
or family outing than an integral part of their lifestyle. © The Audience Agency 2013 4
Trips & Treats (Medium engagement)
While this group may not view arts and culture as a passion, they are reasonably active
despite being particularly busy with a wide range of leisure interests. Comfortably off and
living in the heart of suburbia their children range in ages, and include young people still
living at home. With a strong preference for mainstream arts and popular culture like
musicals and familiar drama, mixed in with days out to museums and heritage sites, this
group are led by their children’s interests and strongly influenced by friends and family.
Home & Heritage (Medium engagement)
Conservative in their tastes, this more mature group appreciates all things traditional: a
large proportion are National Trust members, while classical music and amateur dramatics
are comparatively popular. While this is not a highly engaged group – partly because they
are largely to be found in rural areas and small towns – they do engage with the cultural
activity available to them in their locality. They look for activities to match their needs
and interests, such as accessible day-time activities or content exploring historical events.
Up Our Street (Low engagement)
Living reasonably comfortable and stable lives, Up Our Street engage with popular arts and
entertainment and museums, and are also visitors of heritage sites. Many are older and
have some health issues, living on average or below average household incomes, so access
in all its forms can be an issue. Modest in their habits and in their means, value for money
and low-risk are important factors in leisure decision making.
Facebook Families (Low engagement)
Arts and culture play a very small role in the lives of this younger, cash-strapped group
living in suburban and semi-urban areas of high unemployment. They are the least likely to
think themselves as arty, while less than a third believe that the arts is important.
Nevertheless, they do go out as families: cinema, live music, eating out and pantomime.
Kaleidoscope Creativity (Low engagement)

© The Audience Agency 2017 39
Characterised by low levels of cultural engagement despite living in and around city areas
where plenty of opportunities are within easy reach. A great mix of people comprise this
segment with a wide range of ages, living circumstances, resources and cultural
backgrounds all living cheek-by-jowl. Low incomes and unemployment can present barriers
to accessing some cultural provision. Nevertheless, two thirds do engage with more
popular and accessible culture annually, some of this in the local community and outside
the mainstream. Free, local events like outdoor arts, festivals and carnivals may appeal,
and so might popular offerings like musicals and music events. © The Audience Agency 2013 5
Heydays (Low engagement)
Heydays are the group least likely to attend arts or cultural events, believing that the arts
are no longer as important or relevant to them as perhaps they once were. Many live in
sheltered or specially adapted accommodation for older people, and are excluded from
many activities due to a raft of health, access and resource barriers. If they do engage this
is likely to be participatory such as craft and knitting, painting, reading and writing
activities organised by their sheltered housing, church group or community library.
© The Audience Agency 2017 40
ii. Mosaic group and type descriptions
A City Prosperity
City Prosperity work in high status positions. Commanding substantial salaries they are
able to afford expensive urban homes. They live and work predominantly in London, with
many found in and around the City or in locations a short commute away. Well-educated,
confident and ambitious, this elite group is able to enjoy their wealth and the advantages
of living in a world-class capital to the full.
A01 World-Class Wealth: Global high flyers and families of privilege living luxurious
lifestyles in London's most exclusive boroughs
A02 Uptown Elite: High status households owning elegant homes in accessible inner
suburbs where they enjoy city life in comfort
A03 Penthouse Chic: City suits renting premium-priced flats in prestige central locations
where they work hard and play hard
A04 Metro High-Flyers: Ambitious 20 and 30-somethings renting expensive apartments in
highly commutable areas of major cities
B Prestige Positions
Prestige Positions are affluent married couples whose successful careers have afforded
them financial security and a spacious home in a prestigious and established residential
area. While some are mature empty-nesters or elderly retired couples, others are still
supporting their teenage or older children.
B05 Premium Fortunes: Influential families with substantial income established in
distinctive, expansive homes in wealthy enclaves
B06 Diamond Days: Retired residents in sizeable homes whose finances are secured by
significant assets and generous pensions
B07: Alpha Families: High-achieving families living fast-track lives, advancing careers,
finances and their school-age kids' development
B08: Bank of Mum and Dad: Well-off families in upmarket suburban homes where grown-
up children benefit from continued financial support
B09: Empty-Nest Adventure: Mature couples in comfortable detached houses who have
the means to enjoy their empty-nest status

© The Audience Agency 2017 41
C Country Living
Country Living are well-off homeowners who live in the countryside often beyond easy
commuting reach of major towns and cities. Some people are landowners or farmers,
others run small businesses from home, some are retired and others commute distances to
professional jobs.
C10 Wealthy Landowners: Prosperous owners of country houses including the rural upper
class, successful farmers and second-home owners
C11 Rural Vogue: Country-loving families pursuing a rural idyll in comfortable village
homes while commuting some distance to work
C12 Scattered Homesteads: Older households appreciating rural calm in stand-alone
houses within agricultural landscapes
C13 Village Retirement: Retirees enjoying pleasant village locations with amenities to
service their social and practical needs
D Rural Reality
Rural Reality are people who live in rural communities and generally own their relatively
low cost homes. Their moderate incomes come mostly from employment with local firms
or from running their own small business.
D14 Satellite Settlers: Mature households living in expanding developments around larger
villages with good transport links
D15 Local Focus: Rural families in affordable village homes who are reliant on the local
economy for jobs
D16 Outlying Seniors: Pensioners living in inexpensive housing in out of the way locations
D17 Far-Flung Outposts: Inter-dependent households living in the most remote
communities with long travel times to larger towns
E Senior Security
Senior Security are elderly singles and couples who are still living independently in
comfortable homes that they own. Property equity gives them a reassuring level of
financial security. This group includes people who have remained in family homes after
their children have left, and those who have chosen to downsize to live among others of
similar ages and lifestyles.

© The Audience Agency 2017 42
E18 Legacy Elders: Time-honoured elders now mostly living alone in comfortable
suburban homes on final salary pensions
E19 Bungalow Haven: Peace-seeking seniors appreciating the calm of bungalow estates
designed for the elderly
E20 Classic Grandparents: Lifelong couples in standard suburban homes enjoying
retirement through grandchildren and gardening
E21 Solo Retirees: Senior singles whose reduced incomes are satisfactory in their
affordable but pleasant owned homes
F Suburban Stability
Suburban Stability are typically mature couples or families, some enjoying recent empty-
nest status and others with older children still at home. They live in mid-range family
homes in traditional suburbs where they have been settled for many years.
F22 Boomerang Boarders: Long-term couples with mid-range incomes whose adult
children have returned to the shelter of the family home
F23 Family Ties: Active families with teens and adult children whose prolonged support is
eating up household resources
F24 Fledgling Free: Pre-retirement couples with respectable incomes enjoying greater
space and spare cash since children left home
F25 Dependable Me: Single mature owners settled in traditional suburban semis working
in intermediate occupations
G Domestic Success
Domestic Success are high-earning families who live affluent lifestyles in upmarket homes
situated in sought after residential neighbourhoods. Their busy lives revolve around their
children and successful careers in higher managerial and professional roles.
G26 Cafés and Catchments: Affluent families with growing children living in upmarket
housing in city environs
G27 Thriving Independence: Well-qualified older singles with incomes from successful
professional careers in good quality housing
G28 Modern Parents: Busy couples in modern detached homes juggling the demands of
school-age children and careers

© The Audience Agency 2017 43
G29 Mid-Career Convention: Professional families with children in traditional mid-range
suburbs where neighbours are often older
H Aspiring Homemakers
Aspiring Homemakers are younger households who have, often, only recently set up home.
They usually own their homes in private suburbs, which they have chosen to fit their
budget.
H30 Primary Ambitions: Forward-thinking younger families who sought affordable homes
in good suburbs which they may now be out-growing
H31 Affordable Fringe: Settled families with children owning modest, 3-bed semis in
areas where there's more house for less money
H32 First-Rung Futures: Pre-family newcomers who have bought value homes with space
to grow in affordable but pleasant areas
H33 Contemporary Starts: Fashion-conscious young singles and partners setting up home
in developments attractive to their peers
H34 New Foundations: Occupants of brand new homes who are often younger singles or
couples with children
H35 Flying Solo: Bright young singles on starter salaries choosing to rent homes in family
suburbs
I Family Basics
Family Basics are families with children who have limited budgets and can struggle to
make ends meet. Their homes are low cost and are often found in areas with fewer
employment options.
I36 Solid Economy: Stable families with children renting better quality homes from social
landlords
I37 Budget Generations: Families supporting both adult and younger children where
expenditure can exceed income
I38 Childcare Squeeze: Younger families with children who own a budget home and are
striving to cover all expenses
I39 Families with Needs: Families with many children living in areas of high deprivation
and who need support

© The Audience Agency 2017 44
J Transient Renters
Transient Renters are single people who pay modest rents for low cost homes. Mainly
younger people, they are highly transient, often living in a property for only a short length
of time before moving on.
J40 Make Do & Move On: Yet to settle younger singles and couples making interim homes
in low cost properties
J41 Disconnected Youth: Young people endeavouring to gain employment footholds while
renting cheap flats and terraces
J42 Midlife Stopgap: Maturing singles in employment who are renting short-term
affordable homes
J43 Renting a Room: Transient renters of low cost accommodation often within
subdivided older properties
K Municipal Challenge
Municipal Challenge are long-term social renters living in low-value multi-storey flats in
urban locations, or small terraces on outlying estates. These are challenged
neighbourhoods with limited employment options and correspondingly low household
incomes.
K44 Inner City Stalwarts: Long-term renters of inner city social flats who have witnessed
many changes
K45 Crowded Kaleidoscope: Multi-cultural households with children renting social flats in
over-crowded conditions
K46 High Rise Residents: Renters of social flats in high rise blocks where levels of need
are significant
K47 Streetwise Singles: Hard-pressed singles in low cost social flats searching for
opportunities
K48 Low Income Workers: Older social renters settled in low value homes in communities
where employment is harder to find
L Vintage Value
Vintage Value are elderly people who mostly live alone, either in social or private housing,
often built with the elderly in mind. Levels of independence vary, but with health needs
growing and incomes declining, many require an increasing amount of support.

© The Audience Agency 2017 45
L49 Dependent Greys: Ageing social renters with high levels of need in centrally located
developments of small units
L50 Pocket Pensions: Penny-wise elderly singles renting in developments of compact
social homes
L51 Aided Elderly: Supported elders in specialised accommodation including retirement
homes and complexes of small homes
L52 Estate Veterans: Longstanding elderly renters of social homes who have seen
neighbours change to a mix of owners and renters
L53 Seasoned Survivors: Deep-rooted single elderly owners of low value properties whose
modest home equity provides some security
M Modest Traditions
Modest Traditions are older people living in inexpensive homes that they own, often with
the mortgage nearly paid off. Both incomes and qualifications are modest, but most enjoy
a reasonable standard of living. They are long-settled residents having lived in their
neighbourhoods for many years.
M54 Down-to-Earth Owners: Ageing couples who have owned their inexpensive home for
many years while working in routine jobs
M55 Offspring Overspill: Lower income owners whose adult children are still striving to
gain independence meaning space is limited
M56 Self Supporters: Hard-working mature singles who own budget terraces manageable
within their modest wage
N Urban Cohesion
Urban Cohesion are settled extended families and older people who live in multi-cultural
city suburbs. Most have bought their own homes and have been settled in these
neighbourhoods for many years, enjoying the sense of community they feel there.
N57 Community Elders: Established older households owning city homes in diverse
neighbourhoods
N58 Cultural Comfort: Thriving families with good incomes in multi-cultural urban
communities
N59 Asian Heritage: Large extended families in neighbourhoods with a strong South Asian
tradition

© The Audience Agency 2017 46
N60 Ageing Access: Older residents owning small inner suburban properties with good
access to amenities
O Rental Hubs
Rental Hubs contains predominantly young, single people in their 20s and 30s who live in
urban locations and rent their homes from private landlords while in the early stages of
their careers, or pursuing studies.
O61 Career Builders: Motivated singles and couples in their 20s and 30s progressing in
their field of work from commutable properties
O62 Central Pulse: Entertainment-seeking youngsters renting city centre flats in vibrant
locations close to jobs and night life
O63 Flexible Workforce: Self-starting young renters ready to move to follow worthwhile
incomes from service sector jobs
O64 Bus-Route Renters: Singles renting affordable private flats away from central
amenities and often on main roads
O65 Learners & Earners: Inhabitants of the university fringe where students and older
residents mix in cosmopolitan locations
O66 Student Scene: Students living in high density accommodation close to universities
and educational centres

© The Audience Agency 2017 47
Contacts
London Office
2nd Floor, Rich Mix
35-47 Bethnal Green Road
London E1 6LA
T 020 7407 4625
Manchester Office
Green Fish Resource Centre
46–50 Oldham Street
Northern Quarter
Manchester M4 1LE
T 0161 234 2955
www.theaudienceagency.org
Registered in England & Wales 8117915
Registered Charity No. 1149979
This report is based on mapping and profiling tools provided by Experian.
The information contained within this report is not intended to be used as the sole basis for any business
decision, and is based upon data which is provided by third parties, the accuracy and/or completeness of
which it would not be possible and/or economically viable for Experian to guarantee. Experian’s services also
involve models and techniques based on statistical analysis, probability and predictive behaviour. Accordingly,
Experian is not able to accept any liability for any inaccuracy, incompleteness or other error in this report.