A TROPICAL-LIKE CYCLONE IN THE EXTRATROPICS
60
Available at: http://www. ictp.trieste. it/~pub_of f IC/98/7 United Nations Educational Scientific and Cultural Organization and International Atomic Energy Agency THE ABDUS SALAM INTERNATIONAL CENTRE FOR THEORETICAL PHYSICS A TROPICAL-LIKE CYCLONE IN THE EXTRATROPICS 1 Oreste Reale 2 The Abdus Salam International Centre for Theoretical Physics, Trieste, Italy and Robert Atlas 3 Data Assimilation Office, Laboratory for Atmospheres, NASA Goddard Space Flight Center, Greenbelt, MD 20771, Code 910.4, USA. MIRAMARE - TRIESTE February 1998 Submitted to Weather and Forecasting. 2 E-mail: [email protected] 3 E-mail: [email protected] 1
Transcript of A TROPICAL-LIKE CYCLONE IN THE EXTRATROPICS

Available at: http://www. ictp.trieste. it/~pub_of f IC/98/7
United Nations Educational Scientific and Cultural Organizationand
International Atomic Energy Agency
THE ABDUS SALAM INTERNATIONAL CENTRE FOR THEORETICAL PHYSICS
A TROPICAL-LIKE CYCLONE IN THE EXTRATROPICS1
Oreste Reale2
The Abdus Salam International Centre for Theoretical Physics,Trieste, Italy
and
Robert Atlas3
Data Assimilation Office, Laboratory for Atmospheres,NASA Goddard Space Flight Center,
Greenbelt, MD 20771, Code 910.4, USA.
MIRAMARE - TRIESTE
February 1998
Submitted to Weather and Forecasting.2E-mail: [email protected]: [email protected]
1

Abstract
Between 4 and 9 October 1996 two sub-synoptic scale cyclones developed over the
western-central Mediterranean, causing floods, strong winds and severe damage. Satellite
imagery revealed two intensely convective vortices during this period with a spiral struc-
ture, the second of which also displayed a well defined eye. The corresponding NCEP
analyses, although limited by 1° resolution, also displayed the "signature" of two tropical-
like cyclones. These features were particularly evident in the second event (7-9 October
1996) and included small-scale, alignment between the cutoffs at all levels with the sea
level pressure minimum, and a warm core from the surface to the tropopause.The wind
speed vertical sections in the meridional and zonal directions corresponding to the eye
revealed a virtually motionless column of air. The causative mechanism detected for the
October 1996 events is barotropic instability (produced by very strong horizontal shear
in the mid-troposphere), enhanced by low-level convergence and upper-lever divergence
and latent heat release through intense cumulus convection. These findings suggest the
need for a new category in the classification of Mediterranean cyclones.
Numerical model and subjective forecasts for the 7-9 October storm were examined as
a part of this study. The NCEP medium range forecast (MRF) model correctly predicted
a vortex, with the signature of a tropical-like cyclone, 48 hour in advance. A limited area
model (DALAM) operationally used in Italy, using initial conditions (IC) derived from
ECMWF analyses, predicted the development of an impressive hurricane-like cyclone, 48
hours in advance. However, the cyclone's position is less precise than predicted by the
NCEP MRF, despite the higher resolution of DALAM. Moreover, the DALAM perfor-
mance seems to deteriorate with each later run, probably due to the weak representation
of the cyclone in the IC given to DALAM at these times.

1 Introduction
The differences between tropical and mid-latitude cyclones, in terms of scale, vertical
structure, causes and intensity are well known. Tropical cyclones need a large scale low-
level convergent and upper-level divergent environment, high values of low-level vorticity,
lack of vertical shear, presence of horizontal shear and therefore conditions favorable
for barotropic instability (McBride and Zehr, 1982). They depend strongly upon latent
and sensible heat fluxes from the ocean (Charney and Eliassen, 1964), since their main
source of energy is latent heat release through cumulus convection (Kuo, 1965) and air-
sea interaction (Emanuel, 1986; Rotunno and Emanuel, 1986). They have a scale on
the order of hundreds of km, provide precipitation rates of the order of hundreds of
mmdr1 and generate winds greater than 32ms"1. Their satellite image reveal an "eye"
and an axisymmetric shape. Their vertical structure displays cylindrical isotachs around
the eye, with rapidly increasing velocities from the wind-less center, and a warm core,
symmetrically centered over the surface pressure minimum, from the lower levels up to
the tropopause (Anthes, 1982).
In contrast, mid-latitude cyclones grow because of baroclinic instability, i.e. merid-
ional gradient of temperature, which is related to vertical shear (Charney, 1947; Holton,
1992; Bluestein, 1992). Their scale is on the order of thousands of km. They provide
precipitation rates on the order of tens of mmdr1 and produce surface winds of the order
of 10ms"1. Their satellite images do not usually have an eye, and display asymmetries.
Their vertical structure reveals a "tilt" between the upper level troughs or cutoffs and
the surface low. Their thermal structure is asymmetrical, with cold advection generally
to the north and to the west of the surface low, and warm advection to the south and to
the east.
Baroclinic events however, display a great deal of variety, and at times intense baro-
clinic oceanic cyclones reveal some similarities with tropical storms. These can include
the "eye", strong winds, heavy precipitation, and a significant influence of latent and
sensible heat fluxes from the sea (Bosart, 1981; Atlas, 1987).
A third generic type of cyclone is the polar low, which has been referred to by Emanuel
and Rotunno (1989) as an "Arctic hurricane". These intensively convective cyclones can-
not be explained by dry baroclinic instability alone, and latent heat release plays a major
role in their development (Businger and Reed, 1989; Sardie and Warner, 1983). Differ-
ences and similarities between polar lows and tropical cyclones are stressed by Rasmussen
(1989).
The purpose of this paper is to show the existence of another category of cyclones,
in which the similarities with tropical storms are very large. These are generated in
the mid-latitudes by barotropic instability. They grow because of latent heat release

through cumulus convection. They acquire most of the features of a tropical hurricane,
and maintain distinctive differences with polar lows. These cyclones have been observed
over the Mediterranean Sea.
The theories of cyclogenesis over the Mediterranean Sea have been dominated primar-
ily by baroclinic instability. In particular, the interaction of a large scale baroclinic wave
with an orographic obstacle like the Alps, has been demonstrated to be the cause of the
so-called Alpine-Mediterranean cyclogenesis (Buzzi and Tibaldi, 1978; Speranza et al.,
1985; Buzzi et al., 1986), which is a specific case of "baroclinic lee cyclogenesis". The
well-established theory of the Alpine-Mediterranean cyclogenesis explains how a smaller-
scale, orographically induced baroclinic lee-cyclone can be generated on the lee of the
Alps, in response to a larger-scale cyclone on the Atlantic. The secondary cyclone over
the Mediterranean often moves southeastward and increases its scale a from few hundred
km to 500-1000 km.
A common cyclone of this type is frequently referred as a "Genoa" cyclone, although
similar cyclonic events also take place elsewhere in the Mediterranean: the lee of the
Pirenees, the Atlas Range, the Taurus mountains, provides interesting examples of baro-
clinic lee-cyclogenesis. The dynamic cause of the Mediterranean cyclogenesis has been
studied from observational (Buzzi and Tibaldi, 1978), theoretical (Speranza et al., 1985;
Buzzi et al., 1986) and modeling perspectives (Tibaldi et al., 1980; Tibaldi and Buzzi,
1983; Tosi et al., 1983; Buzzi et al., 1994). Classifications have been made by Alpert et
al, (1990) and by Alpert and Neeman (1992). Furthermore, the role played by air-sea
fluxes from the Mediterranean and latent heat release in amplifying the cyclone growth
has been evaluated by several authors. In general, the role of air-sea fluxes is considered
marginal or even negligible with relative to the role played by baroclinic instability (Buzzi
and Tibaldi, 1978). More recently, Alpert et al., (1996) investigated the roles of convec-
tion, sensible heat and heat fluxes in Alpine cyclogenesis, by splitting their contributions.
Although their results distinguish between various phases of cyclonic life, they agree that
topographical blocking is the dominant factor (at least in the first and most rapid phase)
of the cyclone deepening.
The above theory of Mediterranean lee cyclogenesis, although largely applicable, does
not completely cover all of the different types of events that occur over the Mediterranean
basin. In fact, at almost the same time as the (baroclinic instability) theory of Mediter-
ranean lee-cyclogenesis was taking shape, a different kind of sub-synoptic cyclone, with
similarities to tropical cyclones and polar lows was observed.
Sub-synoptic scale vortices over the Mediterranean, with similarity to hurricanes, were
first discussed in the early '80s (Billing et al., 1983; Ernst and Matson, 1983). The
initial claim was the discovery of a "Mediterranean tropical storm" (Ernst and Matson,
1983). Later, Mayengon (1984) spoke more generically about "warm core cyclones in
the Mediterranean", and Rasmussen and Zick (1987) pointed out their similarity with
polar lows. Businger and Reed (1989), in their classification of polar lows, considered the
Mediterranean warm-core cyclones as a particular case of polar low: the so-called cold-low
type. But Blier and Ma (1996), continued to refer to Mediterranean Sea tropical storms.
The event of 14-15 January 1995, that they studied, is noteworthy for its exceptionally
well-defined eye structure and for the winds recorded (up to 38ms"1, measured in a ship
during an oceanographic cruise; data from Deutsche Wetterdienst, Germany).
The crucial aspect that the above authors agreed upon with regard to this type of
cyclone was the very marginal the role of baroclinic instability, in direct contrast to the
theory of Mediterranean lee-cyclogenesis. Rasmussen and Zick (1987) concluded their
case study of the 27 September - 1 October 1983 event by stating: "It is unlikely that
baroclinic instability plays any role for the formation and continued existence of the
vortex. Convection on the other hand is an important factor and the large amount of
CAPE indicates that some kind of CISK may be the driving mechanism." Previously,
Buzzi and Tibaldi's (1978) study of the 3 April 1973 baroclinic lee-cyclone concluded
with: "latent heat plays an unimportant role in the initiation of the cyclone, although
it may modify its characteristics in subsequent stages." More recently, Craig and Gray
(1996), in their article on CISK or WISHE, refer to "intensely convective polar lows and
Mediterranean cyclones, which resemble tropical cyclones and are believed to intensify by
the same process", thereby implying that convective Mediterranean cyclones are somehow
different from polar lows.
In the past, the lack of observational data was the main reason for warm-core meso-
cyclones not being detected in the Mediterranean. Even in the '80s, when they were
discovered, the case studies were based almost entirely on surface data and satellite im-
agery. The amount of dynamic evaluations with this kind of information was of course
quite limited. However, the increased resolution of current gridded data now allows the
detection and analysis of these systems in a way that was not possible before. The poor
forecasting of late summer or early fall severe rain events over Italy accentuate the need
for studies of this type and for improved understanding of these cyclones. These rain
events tend to be very local and with extreme intensity, up to 500 mm in 12 hours, (e.g.,
the November 1994 flood over northwestern Italy and the June 1996 flood over Tuscany).
The first task of this paper is to analyze the intense sub-synoptic scale cyclone that
occurred on 7-9 October 1996, and to demonstrate its similarities with tropical cyclones.
In contrast with earlier studies, this investigation will make use of model analyses, as
well as, satellite imagery, and based on these data the vertical structure and causative
mechanism for the storm will be described.
The second task is to organize the large, somewhat self- contradictory set of infor-
mation on Mediterranean cyclones, and to attempt a new classification of Mediterranean
4
cyclones on the basis of the scale, the role played by air-sea fluxes and the causative
mechanisms. It will be shown that at least three substantially different categories of cy-
clones can exist, and that not all of the sub-synoptic vortices can be thought as "cold-low
type" polar lows. According to the role of latent heat and the triggering mechanisms, we
propose to define a new category of events occurring on the Mediterranean: "Tropical-
like Cyclones" (TLCs), to be added to the already known Mediterranean Polar Lows
(PLs), Cold Small Scale Cyclones CSCs (Alpert and Neeman, 1992) and Mediterranean
Baroclinic Lee Cyclones (BLCs).
We will stress a difference between the first two categories: in late summer or early
autumn, when the Sea Surface Temperature (SST) is still quite high, there are periods
with little baroclinic activity, and quite large latent heat release. In some circumstances,
some powerful vortices, that look like hurricanes, can occasionally develop in this kind
of environment and acquire a surprising intensity. An important source of energy is
barotropic instability; the storm development appears as an organization process of a
rotating ensemble of convective clusters over the warm water, in which latent heat release
and cumulus convection play a major role.
Mediterranean PLs appear to have a different initiation and development, although the
outcome, from the satellite perspective, appears similar. Most of the observed PLs start as
occluded baroclinic cyclones of the Mediterranean BLC type, and the reinvigoration of the
system appears to be linked with a very powerful cold-anomaly in the mid-troposphere.
During the storm development, a contraction in scale is observed, and a creation of a
smaller scale warm core appears, nested into a larger scale cold anomaly.
Finally, we will stress that when these vortices occur near or within larger scale baro-
clinic systems, they may not reach full intensity or develop the eye structure, or even very
strong winds. Nevertheless, some of the features of tropical storms like the small scale,
the lack of vertical shear and the high precipitation rates (of the order of 100 mmd~l)
still can appear. On 4-6 October 1 996 a meso-cyclone of this kind preceded the one ana-
lyzed in this case study and caused floods and serious damages over Sicily and southern
Italy. Even if not fully developed, these systems can cause exceptional precipitation rates
although their hazard is often not recognized by operational forecasting. This special case
can be considered as hybrid "baroclinic-tropical" systems.
2 The events of 4-6 and 7-9 October 1996
2.1 The satellite imagery
On October 4th, the NOAA satellite provides a picture of a meso-cyclonic vortex, with a
spiral cloud structure, between Sicily and Tunisia (Figure ??a). The vortex moves towards
Sicily and looses its symmetrical structure on the 5th. This image differs substantially

from the ones relative to orographically induced baroclinic systems, much more frequently
detected in the Mediterranean.
On October 7th, the METEOSAT image provides a picture of another meso-cyclonic
vortex, with a clear and perfectly recognizable "eye" (Figure ??b), to the west of Sardinia
(Italy). These images, is even more different from the one of a baroclinic lee cyclone.
Larger scale cloudiness, associated with a previous baroclinic event, affects most of
Italy at this time. The sequence of pictures however, reveals that the rotation rate of the
small vortex, whose diameter does not exceed 300 km, is much faster than the cloudiness
over the northern part of Italy. This cyclone tracks eastward, towards the northern part
of Sardinia, and hits the northern part of the island in the evening. During the night, the
system temporarily looses its cyclonic structure and eye, apparently because of the lack
of energy source provided by the warm sea and because of the drag provided by Sardinia.
However, in the morning of the 8th, the system regains its cyclonic structure, and the
eye reappears (Figure ??c). At this stage, the very different speed of the cumulonimbus
clouds, associated with the small vortex, and the predominantly stratus-type cloudiness
on a larger scale, affecting northern Italy, allows a clear separation of the two systems:
i.e., an intensely rotating meso-cyclonic vortex, nested into a slower cyclonically moving
synoptic scale cloud system. Maintaining its structure, small scale and the eye (with a
diameter of about 10-40 km), the cyclone tracks eastward on the sea and hits the Aeolian
islands (to the north of Sicily), with very strong winds and heavy precipitation, during the
night between the 8th and the 9th. The damage described by the media (local authorities
of the island asked for support for natural calamity) and local unofficial measurements,
reasonably suggest that the wind speed might have reached 30-40 ms~l. Afterwards, the
vortex moves over the Calabrian peninsula (southern Italy), which is characterized by a
steep orography, and high precipitation rates were recorded. The system that appears on
the lee of the Calabrian mountains on the 10th, no longer has its vortex structure and
only unorganized convective clusters appear in the satellite imagery.
2.2 The synoptic situation
The first fifteen days of October 1996 were dynamically very active over the Mediter-
ranean, because of a sequence of baroclinic waves, orographically induced cyclones and
meso-cyclonic vortices developing on the western and central part of the Mediterranean
Sea. Floods and strong winds occurred in several locations of Italy. The synoptic situ-
ation is here briefly discussed, using the National Center for Environmental Predictions
(NCEP) Observed Initial Conditions (OIC).
The sea level pressure (slp) map (Figure ??a) and the geopotential at 500 hPa (Fig-
ure ??b) of Oct 2nd 12 UTC display a baroclinic wave from the Atlantic crossing the

Alps. At this time a cyclone, similar to that described by Buzzi and Tibaldi (1978), forms
in the lee of the Alps. At 00 UTC of October 3rd, a 500 hPa cut-off low is isolated over
northern Italy (Figure ??d). On October 3rd, at 12 UTC, the cyclone apparently dissi-
pated: Figure ??e shows a large trough in the slp over the south of Italy, while Figure ??f
displays an apparently filling 500 hPa cutoff aloft.
At that point, the Alpine-Mediterranean cyclonic event was at its end, but a change
occurred with respect to the expected evolution. The cyclone described by Buzzi and
Tibaldi (1978), occurred in the month of April, a time of the year in which latent heat
release from the sea is relatively small. In this case however, the fluxes from the Mediter-
ranean Sea were quite strong, and were able to play a major role in rejuvenating the
system through latent heat release and cumulus convection.
Figure ??a shows a small-scale cyclone close to the Lybian coast on the 4th at 00 UTC,
and a 500 hPa cutoff (Figure ??b) in a position that would suggest a rapid baroclinic
development and an increase in scale.
The intense convection however, is taking place in a relatively small area compared to
the size of Mediterranean baroclinic cyclones. Twelve hours later, on October 4th, at 12
UTC, (Figure ??c, the cyclone is tracking northward with no increase in scale; moreover,
the minimum of slp is aligned with the 500 hPa minimum (Figure ??d), with no tilt.
This stage corresponded to a more compact area of intense convection, close to Sicily,
(recall Figure ??a), where few hours later heavy thunderstorms and floods were reported.
Interestingly, the gradual alignment of the center of the 500 hPa cutoff with the center of
the surface minimum is associated with deepening of the surface pressure minimum rather
than filling, which is typical of occluding cyclones. As the deepening and gradual increase
in symmetry continued, the cyclone became more similar to a sub-synoptic vortex, nested
into a weak larger scale depression than to a baroclinic cyclone described by the alpine
theory.
On October 5th, 12 UTC, the cutoff at 500 hPa is directly aligned with the minimum
at the surface (Figures ??e and ??f); the area of intense convection is very compact and
the meso-cyclone has a warm core at 200 hPa (not shown here). The intense convective
vortex produced floods in Sicily and Calabria (southern Italy) and gusts of wind up to 30
ms~l in Calabria.
The system presents some similarities with the growth and evolution of polar lows,
which frequently start as meso-cyclones within the inner core of old occlusions (Businger
and Reed, 1989; Bluestein, 1992). On the other hand, the vortex is substantially different
from baroclinic Mediterranean cyclones: at a phase close to the occlusion, the rejuvenation
of the system is not caused by baroclinicity but by convection. This process acts to reduce
the scale of the cyclone, which becomes a quasi-barotropic system, with no tilt between
the minimum values of geopotential at the various levels. It is important to stress that

the gradual increase in symmetry and scale reduction are coupled with the gradual fall in
sea level pressure.
The cyclone that was observed on the following days is dynamically similar, but much
more spectacular. On the 6th of October at 00 UTC, another baroclinic wave crossed
the Alps (Figures ??a and ??b) and a 500 hPa cutoff generated a Genoa cyclone over
northwestern Italy in perfect agreement with the orographic-baroclinic theory.
On the sea level pressure map (Figure ??a), the remnant of the meso-cyclonic vortex
over southeastern Italy, is at a dissipating stage. It is interesting to note two very dif-
ferent cyclones at a close distance to each other: the purely baroclinic lee-cyclone over
northwestern Italy, and the intensively convective over southeastern Italy; These are both
nested into a larger scale, weak cyclonic environment. At 500 hPa (Figure ??b), the
minimum over south-eastern Italy is still linked with the convective vortex, whereas the
cutoff over France is linked with the lee cyclone, and a larger-scale trough encloses both
features.
Within the framework of Alpine-Mediterranean cyclogenesis, it would be reasonable
to expect an increase in scale and a baroclinic development, but this is not the case. On
the 6th, 12 UTC, the lee cyclone, is larger in scale, but rapidly dissipates. The large
and weak trough over most of Italy is associated with the last stage of existence of the
less than fully developed lee cyclone that appeared 12 hours earlier over the Genua Gulf
(Figure ??c). A very weakly baroclinic environment is left by the occluded cyclone and
dominates most of the central-northern Mediterranean.
But another sub-synoptic scale cyclone begins to develop (Figure ??c) close to the
Algerian coast, triggering intense convection.
At 00 UTC on October 7th (Figure ??e), a small cyclone is located to the west of
Sardinia . It is interesting to note that the diameter of the 1008 hPa closed isobar is
smaller than 12 hours earlier, while the center of the cyclone is deeper. This process of
reduction of scale and intensification continued. At 12 UTC, October 7th, the diameter
of the 1008 hPA isobar is unchanged, but the central pressure is 999 hPa (Figure ??a).
It should be noted that this is a gridded value and the 1 degree resolution of the NCEP
analysis cannot fully resolve the meso-cyclonic feature. At this time, the cyclone appears
with an eye (Figure ??b), and is characterized by deep convection and by a rotation
speed much larger than its surrounding environment. As such it is likely that the central
pressure is substantially deeper than the value of 999 hPa in the analyses.
The surface cyclone is aligned perfectly with the 500 hPa cutoff, and with all other
cutoffs up to the tropopause, (Figure ??b). It will be shown later that a warm anomaly is
centered with the axis of the system at all levels, but is particularly evident at 200 hPa. At
00 UTC of October 8th, the system reaches its maturity (Figure ??c). This is confirmed
by the analysis of the vertical structure in the next section. In the following hours, the

cyclone hits the northern part of Sardinia, and temporarily looses its eye, due to both
increased frictional drag and lack of the energy source provided by the warm sea. After
crossing the island, on October 8 at 12 UTC, the cyclone again acquires an eye (Figure ??c)
and retains its interesting structure, tracking east-ward (Figures ??e and ??a). The end
of the event occurs when the cyclone crosses Calabria. At this time it looses its phase
with the upper level 500 hPa minimum, and the surface center enters a negative vorticity
advection regime, leading to rapid dissipation on October 10th (Figures ??e and ??f).
3 Vertical structure
The presence of an eye in the satellite picture does not allow for unique infererences about
the three-dimensional structure of the cyclone. Very intense baroclinic oceanic cyclones
can have an "eye-like" features, and look similar to tropical cyclones (Bluestein, 1992),
because of the seclusion of clear, dry air. The famous "President's Day Snowstorm"
(Bosart, 1981; Atlas, 1987) is example of such a storm.
In order to classify the October 7-9 1996 cyclone, its three-dimensional structure must
be investigated. In the absence of adequate observations, model analyses can be used
as an approximation to the atmospheric structure. In this study, the NCEP operational
analyses are used for this purpose. Although limited by the 1 degree horizontal resolution
, they display a number of significant features associated with this cyclone. These include:
• negligible baroclinicity and negligible vertical shear on the scale of the vortex
• perfect alignment between the geopotential minima at all levels and the sea level
pressure minimum
• a virtually wind-less column of air centered over the sea level pressure minimum,
extending from the lower levels up to the tropopause
• a warm anomaly in the upper-troposphere, perfectly centered over the corresponding
sea level pressure minimum, and nested into a larger scale mid-tropospheric cold
anomaly.
All these features begin to be evident on 7 Oct 12 UTC, become clearer on 8 Oct 00
UTC, persist until 9 Oct 12 UTC, and disappear on Oct 10th, when the cyclone crosses
the Calabrian mountains. The anomalous structure of the cyclone is evident in meridional
and zonal vertical cross-sections.
Figure ?? displays the wind velocity and temperature structure across the center of the
cyclone on 7 Oct 12 UTC. The cross sections are taken at 40° N and 6° E, corresponding
to the surface minimum (Figure ??a) position. An almost vertical cylinder of wind speed
9
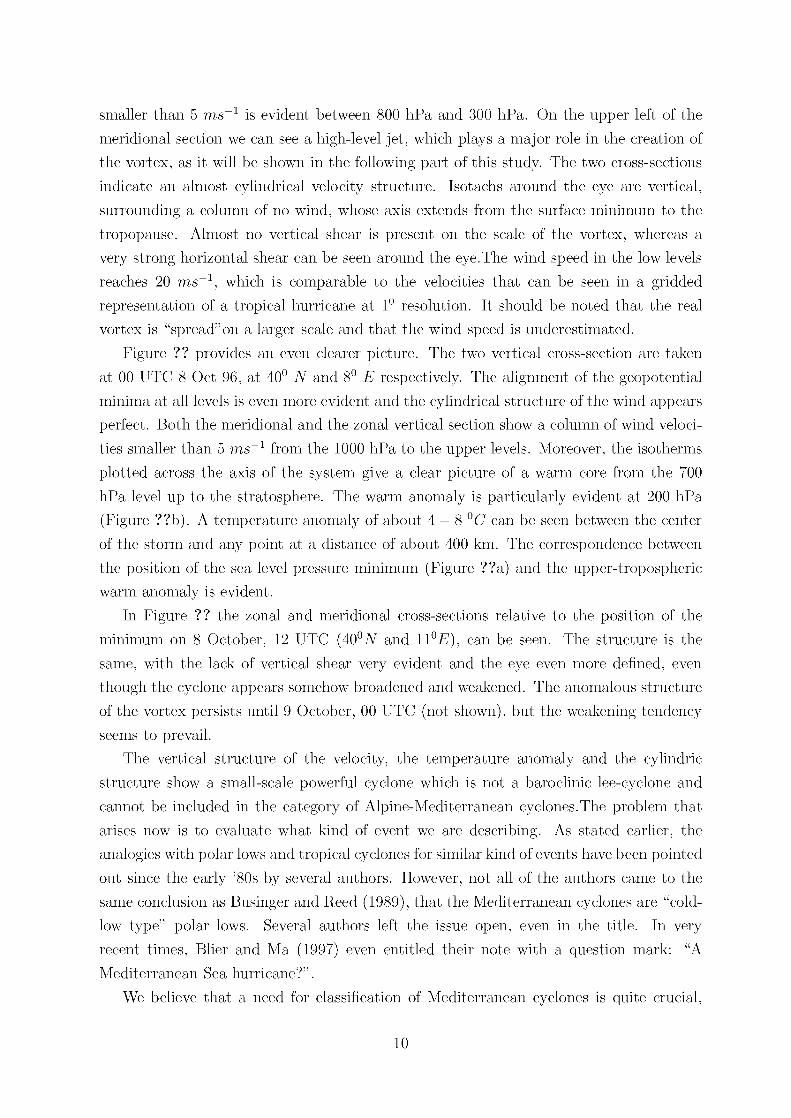
smaller than 5 ms l is evident between 800 hPa and 300 hPa. On the upper left of the
meridional section we can see a high-level jet, which plays a major role in the creation of
the vortex, as it will be shown in the following part of this study. The two cross-sections
indicate an almost cylindrical velocity structure. Isotachs around the eye are vertical,
surrounding a column of no wind, whose axis extends from the surface minimum to the
tropopause. Almost no vertical shear is present on the scale of the vortex, whereas a
very strong horizontal shear can be seen around the eye.The wind speed in the low levels
reaches 20 ms"1 , which is comparable to the velocities that can be seen in a gridded
representation of a tropical hurricane at 1° resolution. It should be noted that the real
vortex is "spread" on a larger scale and that the wind speed is underestimated.
Figure ?? provides an even clearer picture. The two vertical cross-section are taken
at 00 UTC 8 Oct 96, at 40° N and 8° E respectively. The alignment of the geopotential
minima at all levels is even more evident and the cylindrical structure of the wind appears
perfect. Both the meridional and the zonal vertical section show a column of wind veloci-
ties smaller than 5 ms~l from the 1000 hPa to the upper levels. Moreover, the isotherms
plotted across the axis of the system give a clear picture of a warm core from the 700
hPa level up to the stratosphere. The warm anomaly is particularly evident at 200 hPa
(Figure ??b). A temperature anomaly of about 4 — 8 °C can be seen between the center
of the storm and any point at a distance of about 400 km. The correspondence between
the position of the sea level pressure minimum (Figure ??a) and the upper-tropospheric
warm anomaly is evident.
In Figure ?? the zonal and meridional cross-sections relative to the position of the
minimum on 8 October, 12 UTC (40°N and 110E), can be seen. The structure is the
same, with the lack of vertical shear very evident and the eye even more defined, even
though the cyclone appears somehow broadened and weakened. The anomalous structure
of the vortex persists until 9 October, 00 UTC (not shown), but the weakening tendency
seems to prevail.
The vertical structure of the velocity, the temperature anomaly and the cylindric
structure show a small-scale powerful cyclone which is not a baroclinic lee-cyclone and
cannot be included in the category of Alpine-Mediterranean cyclones.The problem that
arises now is to evaluate what kind of event we are describing. As stated earlier, the
analogies with polar lows and tropical cyclones for similar kind of events have been pointed
out since the early '80s by several authors. However, not all of the authors came to the
same conclusion as Businger and Reed (1989), that the Mediterranean cyclones are "cold-
low type" polar lows. Several authors left the issue open, even in the title. In very
recent times, Blier and Ma (1997) even entitled their note with a question mark: "A
Mediterranean Sea hurricane?".
We believe that a need for classification of Mediterranean cyclones is quite crucial,
10

even if requires a new category. To this end, it is important to understand the mechanism
of initiation, as well as the structure of the event.
4 Causes and mechanisms
The initiation for this kind of cyclogenesis is quite different from any other cyclonic event
that occurrs over the Mediterranean. However, the similarities with tropical cyclones
become even more robust by looking at the causative mechanism.
Similar to tropical cyclones, the onset for the 6-9 October event must be searched in
the large scale low-level convergent and upper-level divergent environments, the absence of
baroclinicity and therefore of vertical shear during the storm development, and the pres-
ence of very strong horizontal shear into the mid-troposphere. Some weak baroclinicity
exists only in the 24 hours that precede the onset of the storm.
Figure ?? provides a clear picture of an intensifying low-level convergent and upper
lever divergent environment, at the onset of the storm. Between 00 UTC and 12 UTC
of October 6, the low-level convergent area becomes narrower and more intense, whereas
the upper-level divergent environment becomes broader and more intense as well. Both
of these patterns are in the most suitable position for the cyclone development.
In good correspondence with the maximum low-level convergence on 12 UTC 6 Oct, a
small scale, anomalously intense 850 hPa vorticity maximum can be seen in Figure ??a.
Another vorticity maximum operates from 500 hPa to the tropopause; the 300 hPa vor-
ticity on 00 12 UTC 6 October can be seen on Figure ??b. At 12 UTC 7 October, the
low level vorticity maximum has been intensifying and it appears centered and symmetric
with the position of the slp minimum (Figure ??c). The 300 hPa vorticity maximum is
advected towards the area in which the storm is developing (Figure ??d). The storm
appears to be the result of the cooperative interaction between upper-level and low-level
vorticity, with some similarities to hurricane "Diana" (Bosart and Bartlo, 1991), particu-
larly in the way in which a previously existing cold-dome is destroyed by the creation of
the warm-core.
By 00 UTC 8 October 1996, when the storm had acquired "tropical" features, the
vorticity in the lower levels has strongly increased, whereas in the upper levels it has been
reduced (Figures ??e and ??f). Moreover, the low-level vorticity maximum is of small-
size but intense, appearing perfectly symmetric with the surface low minimum (recall
Figure ??a). At this time, the 300 hPa vorticity maximum has taken the shape of a much
broad "ring" surrounding the cyclone with a 2° radius.
Vorticity cross-sections, centered over the developing surface low, reveal even more
clearly the existence of two vorticity maxima. On 12 UTC 6 October 1996, an upper level
300 hPa maximum appears on the zonal vertical section, taken at 40°N (Figure ??a). The
11
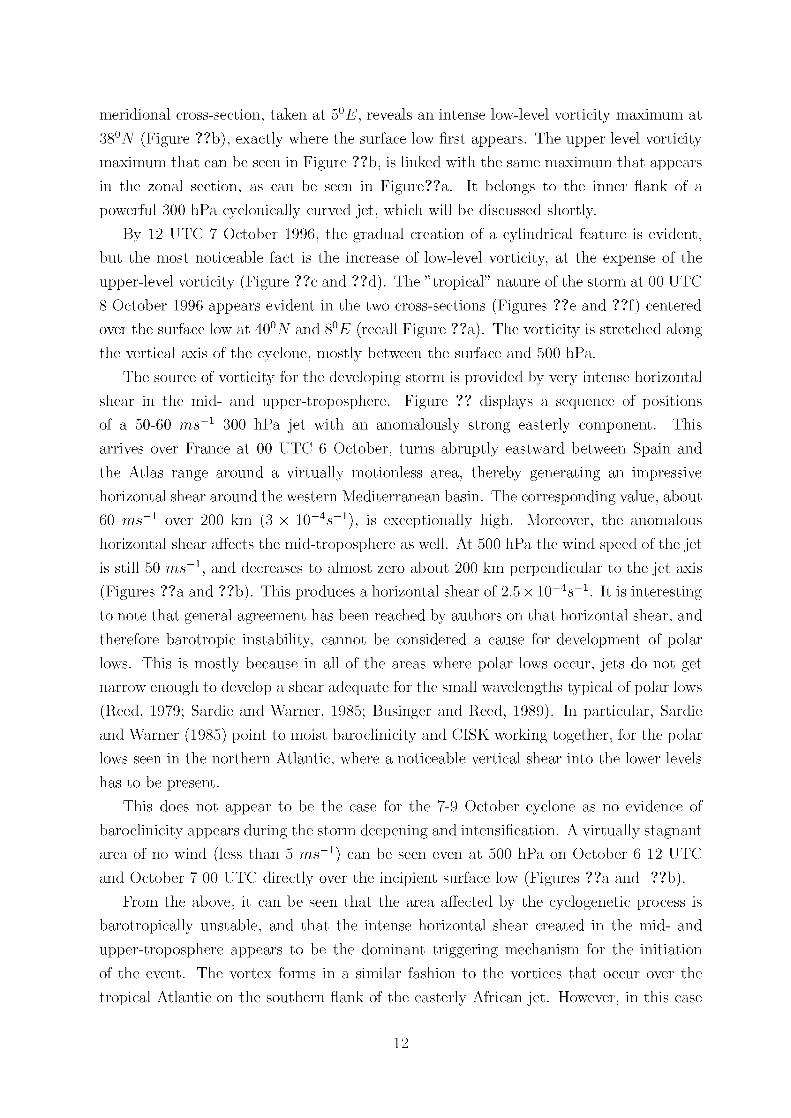
meridional cross-section, taken at 5°E, reveals an intense low-level vorticity maximum at
38°N (Figure ??b), exactly where the surface low first appears. The upper level vorticity
maximum that can be seen in Figure ??b, is linked with the same maximum that appears
in the zonal section, as can be seen in Figure??a. It belongs to the inner flank of a
powerful 300 hPa cyclonically curved jet, which will be discussed shortly.
By 12 UTC 7 October 1996, the gradual creation of a cylindrical feature is evident,
but the most noticeable fact is the increase of low-level vorticity, at the expense of the
upper-level vorticity (Figure ??c and ??d). The "tropical" nature of the storm at 00 UTC
8 October 1996 appears evident in the two cross-sections (Figures ??e and ??f) centered
over the surface low at 40°N and 8°E (recall Figure ??a). The vorticity is stretched along
the vertical axis of the cyclone, mostly between the surface and 500 hPa.
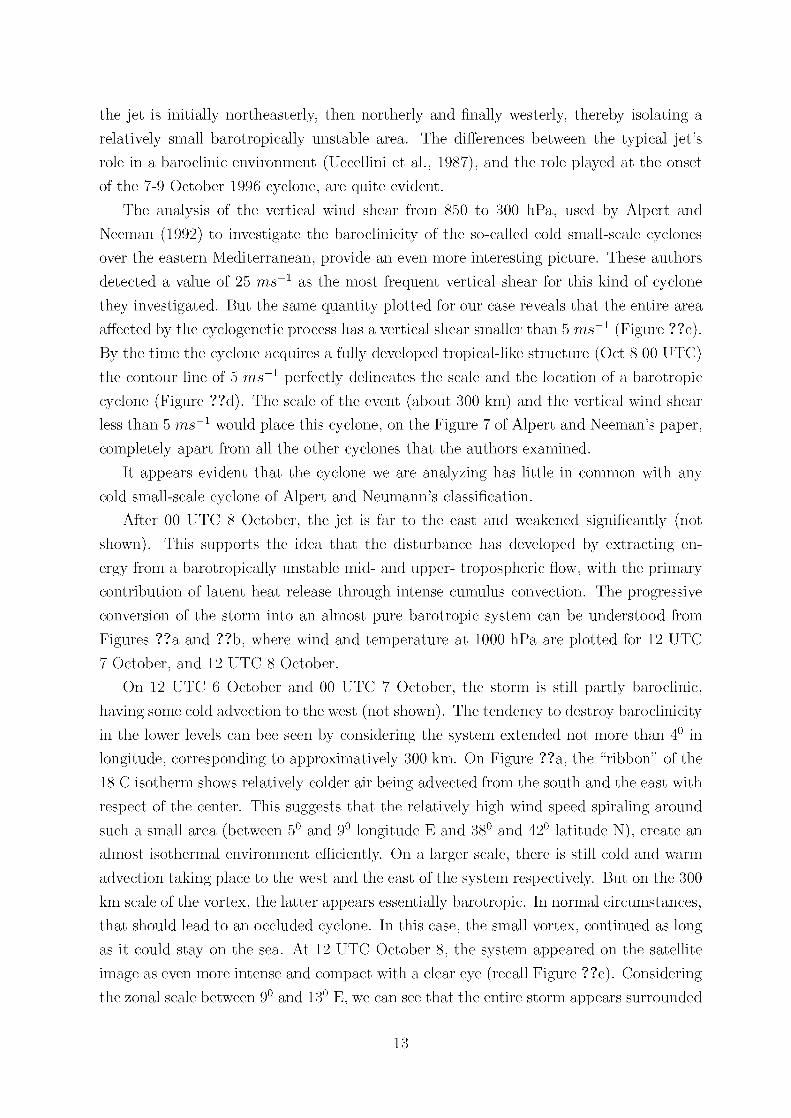
The source of vorticity for the developing storm is provided by very intense horizontal
shear in the mid- and upper-troposphere. Figure ?? displays a sequence of positions
of a 50-60 ms~l 300 hPa jet with an anomalously strong easterly component. This
arrives over France at 00 UTC 6 October, turns abruptly eastward between Spain and
the Atlas range around a virtually motionless area, thereby generating an impressive
horizontal shear around the western Mediterranean basin. The corresponding value, about
60 ms~l over 200 km (3 x lO"4^"1), is exceptionally high. Moreover, the anomalous
horizontal shear affects the mid-troposphere as well. At 500 hPa the wind speed of the jet
is still 50 ms"1 , and decreases to almost zero about 200 km perpendicular to the jet axis
(Figures ??a and ??b). This produces a horizontal shear of 2.5 x lO"4^"1. It is interesting
to note that general agreement has been reached by authors on that horizontal shear, and
therefore barotropic instability, cannot be considered a cause for development of polar
lows. This is mostly because in all of the areas where polar lows occur, jets do not get
narrow enough to develop a shear adequate for the small wavelengths typical of polar lows
(Reed, 1979; Sardie and Warner, 1985; Businger and Reed, 1989). In particular, Sardie
and Warner (1985) point to moist baroclinicity and CISK working together, for the polar
lows seen in the northern Atlantic, where a noticeable vertical shear into the lower levels
has to be present.
This does not appear to be the case for the 7-9 October cyclone as no evidence of
baroclinicity appears during the storm deepening and intensification. A virtually stagnant
area of no wind (less than 5 ms"1) can be seen even at 500 hPa on October 6 12 UTC
and October 7 00 UTC directly over the incipient surface low (Figures ??a and ??b).
From the above, it can be seen that the area affected by the cyclogenetic process is
barotropically unstable, and that the intense horizontal shear created in the mid- and
upper-troposphere appears to be the dominant triggering mechanism for the initiation
of the event. The vortex forms in a similar fashion to the vortices that occur over the
tropical Atlantic on the southern flank of the easterly African jet. However, in this case
12
the jet is initially northeasterly, then northerly and finally westerly, thereby isolating a
relatively small barotropically unstable area. The differences between the typical jet's
role in a baroclinic environment (Uccellini et al., 1987), and the role played at the onset
of the 7-9 October 1996 cyclone, are quite evident.
The analysis of the vertical wind shear from 850 to 300 hPa, used by Alpert and
Neeman (1992) to investigate the baroclinicity of the so-called cold small-scale cyclones
over the eastern Mediterranean, provide an even more interesting picture. These authors
detected a value of 25 ms~l as the most frequent vertical shear for this kind of cyclone
they investigated. But the same quantity plotted for our case reveals that the entire area
affected by the cyclogenetic process has a vertical shear smaller than 5 ms~l (Figure ??c).
By the time the cyclone acquires a fully developed tropical-like structure (Oct 8 00 UTC)
the contour line of 5 ms~l perfectly delineates the scale and the location of a barotropic
cyclone (Figure ??d). The scale of the event (about 300 km) and the vertical wind shear
less than 5 ms~l would place this cyclone, on the Figure 7 of Alpert and Neeman's paper,
completely apart from all the other cyclones that the authors examined.
It appears evident that the cyclone we are analyzing has little in common with any
cold small-scale cyclone of Alpert and Neumann's classification.
After 00 UTC 8 October, the jet is far to the east and weakened significantly (not
shown). This supports the idea that the disturbance has developed by extracting en-
ergy from a barotropically unstable mid- and upper- tropospheric flow, with the primary
contribution of latent heat release through intense cumulus convection. The progressive
conversion of the storm into an almost pure barotropic system can be understood from
Figures ??a and ??b, where wind and temperature at 1000 hPa are plotted for 12 UTC
7 October, and 12 UTC 8 October.
On 12 UTC 6 October and 00 UTC 7 October, the storm is still partly baroclinic,
having some cold advection to the west (not shown). The tendency to destroy baroclinicity
in the lower levels can bee seen by considering the system extended not more than 4° in
longitude, corresponding to approximatively 300 km. On Figure ??a, the "ribbon" of the
18 C isotherm shows relatively colder air being advected from the south and the east with
respect of the center. This suggests that the relatively high wind speed spiraling around
such a small area (between 5° and 9° longitude E and 38° and 42° latitude N), create an
almost isothermal environment efficiently. On a larger scale, there is still cold and warm
advection taking place to the west and the east of the system respectively. But on the 300
km scale of the vortex, the latter appears essentially barotropic. In normal circumstances,
that should lead to an occluded cyclone. In this case, the small vortex, continued as long
as it could stay on the sea. At 12 UTC October 8, the system appeared on the satellite
image as even more intense and compact with a clear eye (recall Figure ??c). Considering
the zonal scale between 9° and 13° E, we can see that the entire storm appears surrounded
13
by the 19°C isotherm (Figure ??b), which delineates a warm core even in the lowest levels.
The difference with the situation at 12 UTC 7 October (Figure ??a), when the storm scale
can be defined between 5° and 9° E, is very clear. Furthermore, it is important to stress
that the winds and temperatures shown are not station data but 1° resolution gridded
data. The entire storm is much more compact and intense that what can be seen from
the gridded analyses; nevertheless its broadened thermal structure can still be inferred by
these data.
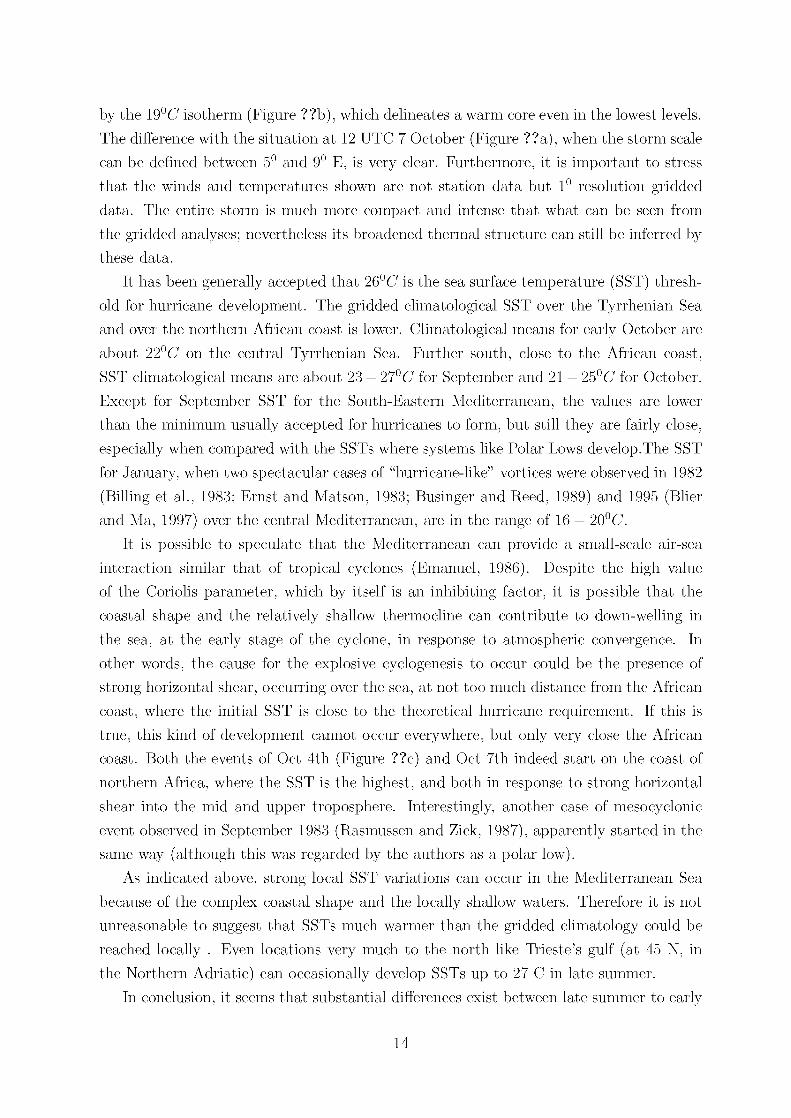
It has been generally accepted that 26°C is the sea surface temperature (SST) thresh-
old for hurricane development. The gridded climatological SST over the Tyrrhenian Sea
and over the northern African coast is lower. Climatological means for early October are
about 22°C on the central Tyrrhenian Sea. Further south, close to the African coast,
SST climatological means are about 23 — 27°C for September and 21 — 25°C for October.
Except for September SST for the South-Eastern Mediterranean, the values are lower
than the minimum usually accepted for hurricanes to form, but still they are fairly close,
especially when compared with the SSTs where systems like Polar Lows develop.The SST
for January, when two spectacular cases of "hurricane-like" vortices were observed in 1982
(Billing et al., 1983; Ernst and Matson, 1983; Businger and Reed, 1989) and 1995 (Blier
and Ma, 1997) over the central Mediterranean, are in the range of 16 — 20°C.
It is possible to speculate that the Mediterranean can provide a small-scale air-sea
interaction similar that of tropical cyclones (Emanuel, 1986). Despite the high value
of the Coriolis parameter, which by itself is an inhibiting factor, it is possible that the
coastal shape and the relatively shallow thermocline can contribute to down-welling in
the sea, at the early stage of the cyclone, in response to atmospheric convergence. In
other words, the cause for the explosive cyclogenesis to occur could be the presence of
strong horizontal shear, occurring over the sea, at not too much distance from the African
coast, where the initial SST is close to the theoretical hurricane requirement. If this is
true, this kind of development cannot occur everywhere, but only very close the African
coast. Both the events of Oct 4th (Figure ??c) and Oct 7th indeed start on the coast of
northern Africa, where the SST is the highest, and both in response to strong horizontal
shear into the mid and upper troposphere. Interestingly, another case of mesocyclonic
event observed in September 1983 (Rasmussen and Zick, 1987), apparently started in the
same way (although this was regarded by the authors as a polar low).
As indicated above, strong local SST variations can occur in the Mediterranean Sea
because of the complex coastal shape and the locally shallow waters. Therefore it is not
unreasonable to suggest that SSTs much warmer than the gridded climatology could be
reached locally . Even locations very much to the north like Trieste's gulf (at 45 N, in
the Northern Adriatic) can occasionally develop SSTs up to 27 C in late summer.
In conclusion, it seems that substantial differences exist between late summer to early
14

fall cases and the mesocyclonic vortices occurring in January over the Mediterranean.
Beyond the strong differences in SST, the January events appear to start at the occluding
stage of a dissipating old cyclone. Therefore, Tropical-like cyclone development can occur
when strong barotropic shear develops in the mid- and upper-troposphere over the coast
of northern Africa in late summer or early autumn, in correspondence to high values of
low-level vorticity and low-level convergence. Once formed, the cyclone can grow and
reach near steady-state, while traveling over the relatively cooler waters of the northern
Mediterranean. This evolution appears different from the one suggested for mid-winter
systems that appear similar to Polar Lows.
5 Towards a classification of Mediterranean cyclones
The Mediterranean Sea is an environment favorable to several different kinds of cyclogene-
sis. The frequent occurrence of baroclinic lee cyclones (BLCs), the presence of tropical-like
cyclones (TLCs), the presence of polar lows (PLs), and the so-called Cold Small Scale
Cyclones (CSCs) identified by Alpert and Neeman (1992) over the eastern Mediterranean,
require a classification of the possible events occurring in the Mediterranean.This goal was
attempted by Alpert et al. (1990) using ECMWF 2.5° resolution data and an objective
method to define, select and track the cyclones. Their approach appears useful for the
baroclinic lee cyclogenesis of the kind described in Buzzi and Tibaldi (1978) and for baro-
clinic cyclones in general, but not for all the cyclones. For the scales involved in the 4-6
October 1996 and 7-9 October 1996 cyclones, and for the cyclones described in Billing
et al., (1983), Ernst and Matson, (1983), Mayengon (1984), Rasmussen and Zick (1987),
Blier and Ma, (1997), the 2.5° resolution data are too coarse. Therefore, a classification
of all Mediterranean cyclone has not been done yet. This task would require a data set
which is still not available: i.e., several years at 0.25° or 0.5° resolution data. However,
the NCEP 1° data do reveal much more information than the data available only few
years before.
From the information already available, at least 4 categories of cyclones have been dis-
tinguished : tropical-like cyclones, polar lows, cold small-scale cyclones, and lee-cyclones.
We summarize here the criteria that could be used to distinguish the cyclone of this study
from the others:
• role of baroclinic instability: it is crucial for BLCs, important for CSCs, not impor-
tant in PLs, and it might represent an inhibiting factor in TLCs
• scale: TLCs and PLs are smaller than CSCs, and CSCs are smaller than BLCs. All
those cyclones except BLCs intensify with a scale reduction
• core: TLCs and PLs have a warm-core, BLCs and CSCs do not
15
• role of air-sea fluxes: it is unimportant in BLCs; it is dominant in CSCs, crucial in
PLs and BLCs
• symmetry: BLCs are not symmetric, CSCs can display some sort of symmetry, PLs
and TLCs are very symmetric
• eye: BLCs and CSCs do not have an eye and might occasionally display a comma-
cloud, PLs always have a comma-cloud and occasionally an eye, TLCs seem to
always have an eye
• cutoffs' alignment and intensification: BLCs trend towards occlusion and eventual
dissipation when the 500 hPa cutoff is on the vertical of the surface minimum, TLCs
and PLs intensify when the alignment occurs
• SSTs: TLCs arise with SSTs ranging from 23°C to 27°C; PLs develop with SSTs
ranging from 12°C to 18°C; CSCs and BLCs do not have any SST requirement
• role of barotropic instability: unimportant in all cyclones except TLCs
It should be noted that two or more of these cyclones can coexist at a short distance,
be nested one into the other (like PLs and TLCs into dissipating BLCs), or they can
transform from one into another (BLCs into PLs).
An intriguing observation is that some events, like the 4-6 October 1996 one, do not
reach a full development, do not provide a very clear hurricane-like satellite picture (recall
Figure ??a), but nevertheless can develop 30ms"1 winds and extreme precipitation rates.
The Mediterranean is filled with severe flood cases, with precipitation rates of the order of
SOOmmd"1. Most of the related case studies do not attempt to go beyond the baroclinic
theory to explain the events. It is possible that intensely convective vortices, nested and
easily confused with a larger scale baroclinic environment, have been escaping forecasters'
and analysts' eyes because of lack of observational data, poor resolution and to an extent
a mid-latitude view of the events.
6 Forecast
6.1 NCEP MRF forecast
6.1.1 The 00 UTC 6 October 1996 MRF run
On 6 October 1996, the 00 UTC Medium Range Forecast (MRF) run predicts the devel-
opment of a hurricane-like storm over the western Mediterranean for 7-9 October.
The initial conditions for sea level pressure and 500 hPa geopotential over the area of
interest are shown in Figure ??. The 12 hour forecast displays a deepening surface low
16
close to the Algerian coast (Figure ??a). In the following 24 hours, an intense development
takes place in the MRF, and by 12 UTC 7 October 1996, (36 hours forecast) well-defined
hurricane-like features appear between the Balearic Islands and Sardinia (Figure ??c).
The predicted cyclone is characterized by perfect alignment of upper level cutoffs with
the surface center, lack of vertical shear, warm core: the "signature" of a tropical-like
event, within the limitations of the 1° resolution data. The cyclone seems weakened by
the drag over Sardinia (Figure ??), but it nevertheless tracks eastward maintaining its
tropical-like structure. It can be found mostly unchanged in the 60 hour forecast on 12
UTC 8 October (not shown) and in the 72 hour forecast for 00 UTC 9 October 1996
(Figure ??c).
The zonal and meridional vertical cross-sections of wind and temperature for the 00
UTC 8 October (48 hours forecast) display a cyclone (Figure ??) which is substantially
similar to the corresponding analyses in Figure ??. The position of the storm center
(40°N and 8°E) is the same in the analyses and in the forecast; moreover, the presence
of a low-speed core and the lack of vertical shear on the vortex scale is well predicted by
the model.
The comparison with the corresponding analyses for 12 UTC 7 October 1996 (Fig-
ures ??a and ??b), 00 UTC 8 October 1996 (Figures ??c and ??d), 12 UTC 8 October
1996 (Figures ??a and ??b) and 00 UTC 9 October (Figures ??c and ??d) reveals a very
good performance of the NCEP model.
In particular:
• the anomalous structure of the storm is correctly captured since its beginning, on
12 UTC 7 October 1996.
• the position of the storm when the it hits Sardinia (00 UTC 8 October 1996) is
perfect (40°N and 8°E) in the 48 hours forecast
• the 60 and 72 hour forecast show a storm with correct structure, but not in the
correct place. Specifically, the storm center in the forecast for 00 UTC 9 October
is about 2° more to the west than the analysis as the model underestimates the
eastward progression of the storm between 60 and 72 hours. This may be due to an
overestimate of the drag exerted by Sardinia.
6.1.2 The 00 UTC 7 October 1996 MRF run
The initial conditions for the following MRF run, 00 UTC 7 October 1996, are shown
in Figure ??. The forecast substantially confirms the one obtained by the run initialized
on the day before. The 24 hour forecast correctly places the storm over eastern Sardinia
(Figure ??a), but again the model seems to delay the storm's return towards the sea. At
17

12 UTC 8 October 1996 (the 36 hour forecast) the storm is about 2° more to the east
than predicted. The same 2° error is detected on 00 UTC 9 October 1996 (Figure ??c,
cfr. with Figure ??c).
While no forecast of a subsynoptic scale event can be based on the MRF alone, the
signature of a hurricane-like cyclone in the Mediterranean is clearly detected in both 00
UTC 6 October and 00 UTC 7 October 1996 MRF runs. These predictions could have
been used successfully by forecasters. However, the MRF runs were not used operationally
in Italy.
6.2 ECMWF based LAM forecast
6.2.1 The 00 UTC 6 October 1996 DALAM run
The Ufficio Centrale di Ecologia Agraria (UCEA) operationally runs in Rome a Limited
Area Model, the Data Assimilation Limited Area Model (DALAM), initialized and forced
by ECMWF initial and boundary conditions. The Italian national weather service and
several Italian regional weather services base their forecast predominantly on DALAM.
The model, mentioned in Perini et al., (1995), is essentially the same model documented
extensively in Buzzi et al., (1994), as BOLAM. DALAM's resolution is 30 km. In spite
of the very good performances obtained by DALAM (and BOLAM) over Mediterranean
baroclinic lee-cyclogenesis (Buzzi et al., 1994), some problems occurred for this particular
case, and the storm was reproduced convincingly in one run only.
The earliest model's run, initialized on 00 UTC 6 October 1996, did capture excep-
tionally well the anomalous intensity and dynamics of the storm, by reproducing a cyclone
with the same vertical structure described in section 3, but much more intense and with
a smaller scale. In the following runs, initialized at 00 UTC 7 October 1996 and 00 UTC
8 October 1996, the performance deteriorates, and in both runs the 24 hour forecast is
surprisingly worse than the 48 hours forecast. The main reason is in the initial conditions
derived from the ECMWF analysis. At each initialization, the cyclone is systematically
and severely under-deepened, thus weakening the storm development. Overall, the NCEP
MRF forecast, in spite of its much coarser resolution (1 degree versus 30 km), is compa-
rable, if not better, from the track perspective.
In Figure ?? the initial conditions for the 00 UTC 6 October 1996 run are shown. By
comparing them with the NCEP IC used for the MRF initialization (Figure ??), it can be
seen that (among other probably less important differences) the NCEP analysis displays
a reversed trough elongated from south to north at 4° E , over northern Algeria. This
trough, which is in the exact position where the cyclone appears12 hours later, cannot
be seen in the DALAM IC. In the 12 hour forecast for 12 UTC 6 October, a surface low
appears on the northern Algerian coast in agreement with the NCEP analyses and MRF
18

forecast (Figure ??a).
Interestingly, the cyclone is deeper in the MRF than in DALAM by about 6 hPa. How-
ever, in the following 24 hours, an explosive deepening takes place in DALAM, and at 12
UTC 7 October 1996 the predicted surface low is 987 hPA (Figure ??c, 36 hour forecast).
The surface minimum is aligned with the 500 hPa minimum and its exceptional depth,
together with the smallness of its scale, provides a clear picture of a hurricane-like cyclone.
It is very important to note that both models were capable of building-up a hurricane-like
system with no bogusing of any kind. In addition, no aircraft measurements were taken
through the storm, and the central pressure was not measured. The tropical-like structure
comes exclusively from the model dynamics and from the thermal forcing. However, the
difference in the initial conditions between the MRF and DALAM does have an effect.
Comparing the position of the center as it appears in the forecast, with the position of the
eye, which is clearly detectablein the satellite picture (and in the corresponding NCEP
analysis), it can be seen that DALAM predicts the storm approximatively 1° more to the
south of its actual position.
Dynamically, the storm appears much more intense and smaller in scale than in the
MRF, thus providing an even more convincing description of a hurricane-like cyclone.
This is consistent with DALAM's higher resolution and more sophisticated physics.
However, the storm position is not predicted as well as it would be reasonable to
expect from a 30 km resolution model. In the 48 hours forecast (Figure ??a) the intensity
of the storm is unquestionable (the surface low is 989 hPa), but its center is about 2° to
the E of the NCEP analyses. This particular situation has some forecasting implications,
since in the DALAM forecast the cyclone is located to the east of Sardinia, whereas in
the satellite image and the NCEP analysis (cfr. Figure ??c) it is located to the west of
the island. Thus, the 48 hour forecast based on the MRF provides a less intense but more
better located storm (cfr. Figure ??a).
DALAM's forecast for the subsequent 24 hours, keeps the cyclone pressure minimum
less than 990 hPa, but does not allow any progress eastward. The cyclone center oscillates
only in latitude from 40.5° (Figure ??c, 60 hour forecast) to 39.5° (72 hour forecast, not
shown). Therefore, the difference between the position after 72 hours of integration and
the NCEP analyses of 00 UTC 9 October 1996 becomes larger. The NCEP analysis and
the satellite picture indicate that the storm was located about 2° more to the east than
what predicted by DALAM. However, the MRF has the same problem after 72 hours of
integration. The predicted center position for 00 9 October, based on the run initialized
at the 00 UTC 6 October, is about 2° more to the west of the observation. This is
approximatively the same as the error of DALAM.
Overall, the DALAM forecast based on the run initialized at 00 UTC 6 October 1996
is reasonably good. Although the position calculated for 00 UTC 8 October 1997 (the
19

48 hour forecast, Figure ??a) is less correct than the position calculated from the MRF
(Figure ??a), the cyclone's anomalous tropical-like dynamics is very well predicted. The
model displays a hurricane-like cyclone with an impressive vertical structure, much more
evident than the one displayed by the MRF. The 60 hour forecast for 12 UTC 8 October
1996 zonal vertical section of wind and temperature, centered at 40.7°N displays a very
clear sub-synoptic hurricane-like vortex (Figure ??). The wind below 850 hPa and above
200 hPa was not saved, but the wind-less center and the axisymmetric structure is very
evident. The warm core is much more pronounced and sharp than in the NCEP forecast,
and extends from 925 hPa (1000 hPa temperature was not saved) to the tropopause. The
scale of the cyclone is confined between 9°E and 13°E, in agreement with the satellite
imagery. The meridional section is even more impressive, with vertical isotachs perfectly
straight around the wind-less center, and a pronounced warm core at all levels.
In conclusion, a subjective forecast based upon DALAM's 00 UTC 6 October run only
would be sufficient to cause warnings of a hurricane-like storm developing on the western
Mediterranean. Unfortunately, this good performance of DALAM was affected by the
following far less impressive runs.
6.2.2 The 00 UTC 7 October 1996 DALAM run
There is a striking difference between the previous day's 24 hour forecast and the 00
UTC 7 October 1996 observed initial conditions (Figure ??). The surface low in the
IC appears "flat" and its center is 6 hPa less deep than the value predicted for the 00
UTC 7 October 1996 in the 24 hour forecast initialized on 00 UTC 6 October 1996. A
forecaster would obviously trust the analysis more than the forecast, but in this case
this approach does not appear to be correct, especially when considering that the NCEP
analyses for 00 UTC 7 October 1996 show a much deeper center: 999 hPa, 7 hPa less
than the DALAM. The satellite image and the intensity of the events, reasonably suggest
that the 24 hour DALAM forecast for the 00 UTC 7 October 1996 is closer to reality than
the corresponding ECMWF derived analysis.
This is particularly noteworthy when considering the coarser resolution of the NCEP
IC: 1° versus 30 km for the LAM. The DALAM initial conditions are obtained from the
ECMWF IC by simple interpolation; it thus appears that the cyclone is smoothed in the
ECMWF analyses.
In spite of the smoothing performed on the cyclone by the initialization, the forecast
based on the 00 UTC 7 October 1996 run still shows an intense deepening (Figure ??),
although less dramatic than the previous run. After 36 hours of integration (Figure ??a),
DALAM again develops a fairly intense storm, with a 993 hPa center pressure in the
right position, and perfectly aligned with the 500 hPa cutoff. The 72 hours integration
displays a minimum which is about 1,5° more to the west of the NCEP analysis. From
20

the forecasters' perspective, the 00 UTC 7 October 1996 run essentially delays in time the
onset of the event and reduces its intensity. Furthermore, the slow speed of the cyclone
detected in the previous run is also present in this prediction.
6.2.3 The 00 UTC 8 and 9 October 1996 DALAM runs
These predictions are similar to the run from 00 UTC 7 October. Specifically, the IC
for 00 UTC 8 October 1996 shows a central pressure of 1003 hPa, which is 6 hPa higher
than the 24 hours forecast and about 12 hPa less deep than the corresponding 48 hours
integration started on October 6. Moreover, the NCEP analysis again displays a deeper
cyclone. This can again be seen on 00 UTC 9 October 1996, where the 30 km resolution
IC for DALAM derived from ECMWF shows a cyclone which is less deep than the NCEP
analyses at 1° resolution. The difference between the corresponding 72, 48 and 24 hours
forecast is 14 hPa, 12 and 8 hPa.
Overall, the initial representation for the anomalous cyclone in DALAM appears to
be the primary cause of the poor predictions. The structure of the storm from satellite
imagery, the systematic difference between NCEP and DALAM analyses, and the damage
that occurred indicate that the representation of the cyclone as given in the 7,8 and
9 October DALAM IC is not realistic. The intense deepening occurring in each run
indicates that the problem is not in the model. The 6 October 1996 run, in which the
differences in initial conditions between DALAM and NCEP are not evident, shows an
impressive "hurricane-like" structure developing in the right place and tracking eastward.
The vertical structure, the intensity, the eye-wall, are much more realistic than in the
MRF. But in the following runs, the smoothed IC provided to DALAM adversely affect
its performance, making it worse than the MRF.
As a final consideration, it should be also noted that that regional forecasters did not
approach the event correctly even from the subjective perspective. The "bias" towards
the mid-latitude type of event is such that the onset of a small-scale tropical-like cyclone
coming from the African coast and then abruptly tracking eastward appeared to be neither
expected nor conceived as a possible scenario.
7 Conclusions
This paper began with a review of the so-called Mediterranean cyclones, which are baro-
clinic in structure, initiation and evolution. As already stressed by many authors, a
different category of events has also been detected in the Mediterranean; these being sub-
synoptic scale vortices, that appear as tropical cyclones in satellite images. In the late
1980's several authors indicated that these events may not be tropical in character, but
instead may be polar lows.
21

In this case study we attempted to demonstrate that the similarity of the meso-cyclone
detected on 7-9 October 1996 over the western Mediterranean with a tropical cyclone, is
larger than what was shown in other studies. As indicated in our study, this similarity
does not only involve scale, satellite imagery, precipitation rates and wind strength, but
also the vertical structure and the cyclogenetic process.
The crucial role played by barotropic instability in the generation of the event is the
key factor that allows us to distinguish the 7-9 October 1996 cyclone from polar lows.
Polar lows, which occur in the Mediterranean on a regular basis in winter, develop due to
a cooperative interaction of baroclinic instability and air-sea fluxes.
Barotropic instability has been generally accepted as unimportant in the formation of
polar lows. However, it is a critical requirement for tropical disturbances to develop into
tropical storms and eventually hurricanes.
In the tropics barotropic instability develops on the southern flank of an easterly
tropical jet, whereas in this case it develops on the inner loop of sub-tropical jet. It
appears that this is the first case in which a cyclone with this kind of initiation is detected.
The 7-9 October cyclone should be considered as a separate category of subsynoptic
scale events, between that of polar lows and tropical cyclones. It is likely that several
other vortices detected in the Mediterranean by the end of the summer or in early autumn,
belong to the same category. Furthermore, the frequent occurrence in the Mediterranean
of catastrophic and quite unexplained meteorological events could be related to the de-
velopment of tropical-like cyclones. The reason why they have not been considered in
the past is probably due to the low-resolution of observations and analyses, a theoretical
bias toward baroclinic instability, and the intrinsic difficulty of separating these small and
intense systems from larger scale and less intense baroclinic events. Specifically, a large
majority of tropical-like cyclones in the Mediterranean develop in an environment which
could partly hide them. These storms, of which the 4-6 October 1996 cyclone is an exam-
ple, develop in proximity of, or even nested into baroclinic systems, and typically do not
reach full maturity. Nevertheless, they have enough energy to produce locally devastating
floods and severe weather. Acknowledging the Mediterranean as a potential source of
tropical-like storms would provide an important benefit to operational forecasting.
22

AcknowledgmentsThe study is sponsored by CNR grant 970080PF42, and was made possible by contract
NAS-5-32484. We wish to thank Drs. L. Bosart and J.C. Jusem for their helpful sugges-
tions. We thank Dr. P. Alpert for his valuable comments. We also want to thank Prof.
C. Ratto, for an invitation at the Centro Meteo-Idrologico Regione Liguria (CMIRL,
Genoa, Italy), where the DALAM output was made available and analyzed. Archived
NCEP data were provided by the Center for Ocean Land Atmosphere Studies (COLA,
MD). The NOAA satellite image is a courtesy of the Dundee Satellite Receiving Sta-
tion, Dundee University, Scotland. The METEOSAT images (courtesy EUMETSAT) are
provided by the University of Nottingham, UK.
References
[1] Anthes, R. A., 1982: Tropical Cyclones. Their evolution, structure and effects. Amer-
ican Meteorological Society, 208 pp.
[2] Alpert, P., B. U. Neeman and Y. Shay-El, 1990: Climatological analysis of Mediter-
ranean cyclones using ECMWF data. Tellus, 42 A, 65-77.
[3] Alpert, P. and B. U. Neeman, 1992: Cold small-scale cyclones over the eastern
Mediterranean. Tellus, 44A, 173-179.
[4] Alpert, P., M. Tsidulko, S. Krichak and U. Stein, 1996: A multi-stage evolution of
an ALPEX cyclone. Tellus, 48 A, 209-220.
[5] Atlas, R., 1987: The role of oceanic fluxes and initial data in the numerical prediction
of an intense coastal cyclone. Dyn. Atmos. Oceans, 10, 359-388.
[6] Billing, H., I Haupt and W. Tonn, 1983: Evolution of a hurricane-like cyclone in the
Mediterranean Sea. Beitr. Phys. Atmos., 56, 508-510.
[7] Blier, W. and Q. Ma, 1996: Mediterranean Sea tropical storms? Preprints, 15th
Conference on Weather Analysis and Forecasting, Norfolk, Virginia. American Me-
teorological Society, 616-620.
[8] Blier, W. and Q. Ma, 1997: A Mediterranean Sea Hurricane? UCLA Tropical Mete-
orology Project Newsletter, 12, 15a.8
[9] Bluestein, H. B., 1992: Synoptic-Dynamic Meteorology in Midlatitudes. Vol II: Ob-
servations and Theory of Weather Systems. Oxford, 594 pp.
[10] Bosart, H., 1981: The President's Day snowstorm of 18-19 February 1979: a subsyn-
optic scale event. Mon. Wea. Rev., 109 1542-1566.
23

[11] Bosart, H. and J. A. Bartlo, 1991: Tropical Storm Formation in a Baroclinic Envi-
ronment. Mon. Wea. Rev. 119, 1979-2013.
[12] Buzzi, A. and S. Tibaldi, 1978: Cyclogenesis on the lee of the Alps: a case study. Q.
J. R. Met. Soc. 104, 271-87.
[13] Buzzi, A. and A. Speranza, 1986: A theory of deep cyclogenesis in the lee of the Alps.
Part II: Effects of finite topographic slope and height. J. Atmos. Sci., 43, 2826-2837.
[14] Buzzi, A., M. Fantini, P. Malguzzi and F. Nerozzi, 1994: Validation of a Limited
Area Model in Cases of Mediterranean Cyclogenesis: Surface Fields and Precipitation
Scores. Met. Atmos. Phys. 53, 137-153.
[15] Carlson, T.N., 1991: Mid-latitude weather systems. Harper Collins, 507 pp.
[16] Charney, J. G., 1947: The dynamics of long waves in a baroclinic westerly current.
J. Meteorol., 4, 135-163.
[17] Charney, J. G. and Eliassen, 1964: On the growth of the hurricane depression. J.
Atmos. Sci., 45, 1709-1720.
[18] Cray, G. and S. Gray, 1996: CISK or WISHE as the Mechanism for Tropical Cyclone
Intensification, 1996: Journal of the Atmospheric Sciences, 53, 3258-3539.
[19] Emanuel, K. A., 1986: An air-sea interaction theory for Tropical cyclones. Part I:
Steady state maintenance. J.Atmos.Sci, 43, 585-604.
[20] Emanuel, K. A., 1988: Toward a general theory of hurricanes. American Scientist
76, 370-379.
[21] Emanuel, K. A. and R. Rotunno, 1989: Polar Lows as arctic hurricanes. Tellus, 41A,
1-17.
[22] Ernst, J. A. and M. Matson, 1983: A Mediterranean tropical storm? Weather, 38,
332-337.
[23] Holton, J., 1992: An Introduction to Dynamic Meteorology. Third Edition. Ac. Press,
511 pp.
[24] Kuo, H. L., 1965: On the formation and intensification of tropical cyclones through
latent heat release by cumulus convection. J. Atmos. Sci., 22, 48-63.
[25] Mc Ginley, J., (1982). Diagnosis of Alpine lee cyclogenesis. Mon. Wea. Rev., 110,
1271-87.
24

[26] Perini, L., A. Brunetti and D. Vento, (1995): Il modello ad area limitata del Ministero
delle Risorse Agricole, Alimentari e Forestali. Aer, 11, 21-22.
[27] Rasmussen, E. and C. Zick, 1987: A subsynoptic vortex over the Mediterranean with
some resemblance to polar lows. Tellus, 39 A, 408-425.
[28] Rasmussen, E. and C. Zick, 1989: A comparative study of tropical cyclones and polar
lows. Polar and Arctic Lows, 47-80.
[29] Reed, R. J., 1989: Cyclogenesis in polar air streams. Mon. Wea. Rev. 107, 38-52.
[30] Rotunno, R. and K. Emanuel, 1986: An Air-Sea Interaction Theory for Tropical
Cyclones: Part II: Eviolutionary Study Using a Nonhydrostatic Axisymmetric Nu-
merical Model. J. Atmos. Sci., 44, 542-561.
[31] Sardie, J. M. and T. T. Warner, 1983: on the mechanism for the devlopment of polar
lows. J. Atmos. Sci. 40, 869-881.
[32] Sardie, J. M. and T. T. Warner, 1985: A numerical study of the development mech-
anism of polar lows. Tellus, 37, 869-881.
[33] Smith, R. K., 1997: On the theory of CISK. Q. J. Roy. Met. Soc., 123, 407-418.
[34] Speranza, A., A. Buzzi, A. Trevisan and P. Malguzzi, 1985: A theory of deep cycloge-
nesis in the lee of the Alps. Part I. Modification of baroclinic instability by localized
topography. J. Atmos. Sci., 42, 1521-1535.
[35] Tibaldi, S., A. Buzzi and P. Malguzzi, 1980: Orographically induced cyclogenesis:
analysis of numerical experiments. Mon. Wea. Rev. 108, 1302-1314.
[36] Tibaldi, S. and A. Buzzi, 1983: Effects of orography on Mediterranean lee cyclogen-
esis and its relationship to European blocking. Tellus, 35 A, 269-286.
[37] Tosi, E., M. Fantini and A. Trevisan, 1983: Numerical experiments on orographic
cyclogenesis: relationships between the development of the lee cyclone and the basic
flow characteristics. Mon. Wea. Rev. 111, 799-814.
Uccellini, L.W., R. A. Petersen, K. F. Brill, P. J. Kocin and J. J. Tuccillo, 1987:
Synergistis interactions between an upper-level jet streak and diabatic processes that
influence the development of a low-level jet and a secondary coastal cyclone. Mon.
Wea. Rev., 115, 2227-2261.
25

Figure 1: NOAA Satellite image in the infrared bandwidth (a). Courtesy of DundeeSatellite Receiving Station, Dundee University, Scotland. The meso-cyclonic vortex canbe seen between Sicily and Tunisia. The cyclone will reach Sicily in the subsequent hours,loosing its spiral structure, but producing severe damages.METEOSAT satellite images in the infrared bandwidth (b) and (c). Courtesy of EU-METSAT, through University of Nottingham, UK. 11:30 UTC 07 Oct 1996 (b): the eyecan be seen between Sardinia and the Balearic Islands. The meso-cyclonic vortex rotatesat a much faster speed than the cloudiness over Italy. 15:00 UTC 08 Oct 1996 (c): thecyclone crossed Sardinia and its eye can be seen to the west of Sardinia. The cyclone andthe eye went through a reduction in scale. The meso-cyclone appears now isolated fromthe larger scale cloudiness over northern Italy and the western Mediterranean.
Figure 2: Sea Level Pressure (hPa) and 500 hPa Geopotential (m) on Oct 2 12 UTC (a,b),on Oct 3 00 UTC (c,d) and on Oct 3 12 UTC (e,f)
Figure 3: Sea Level Pressure (hPa) and 500 hPa Geopotential (m) on Oct 4 00 UTC (a,b),on Oct 4 12 UTC (c,d) and on Oct 5 12 UTC (e,f)
Figure 4: Sea Level Pressure (hPa) and 500 hPa Geopotential (m) on Oct 6 00 UTC (a,b),on Oct 6 12 UTC (c,d) and on Oct 7 00 UTC (e,f)
Figure 5: Sea Level Pressure (hPa) and 500 hPa Geopotential (m) on Oct 7 12 UTC (a,b),on Oct 8 00 UTC (c,d) and on Oct 8 12 UTC (e,f)
Figure 6: Sea Level Pressure (hPa) and 500 hPa Geopotential (m) on Oct 9 00 UTC (a,b),on Oct 9 12 UTC (c,d) and on Oct 10 00 UTC (e,f)
Figure 7: Vertical section of wind (ms"1) and temperature (°C) at 40°N (left) and at6°E (right) at 12 UTC 7 Oct
Figure 8: Vertical section of wind (ms"1) and temperature (°C) at 40°N (left) and at8°E (right) at 00 UTC 8 Oct
Figure 9: Sea level pressure (hPa) and 200 hPa Temperature (°C) at 00 UTC 8 October1996
Figure 10: Vertical section of wind (ms"1) and temperature (°C) at 40°N (left) and at11° E (right) at 12 UTC 8 Oct.
26
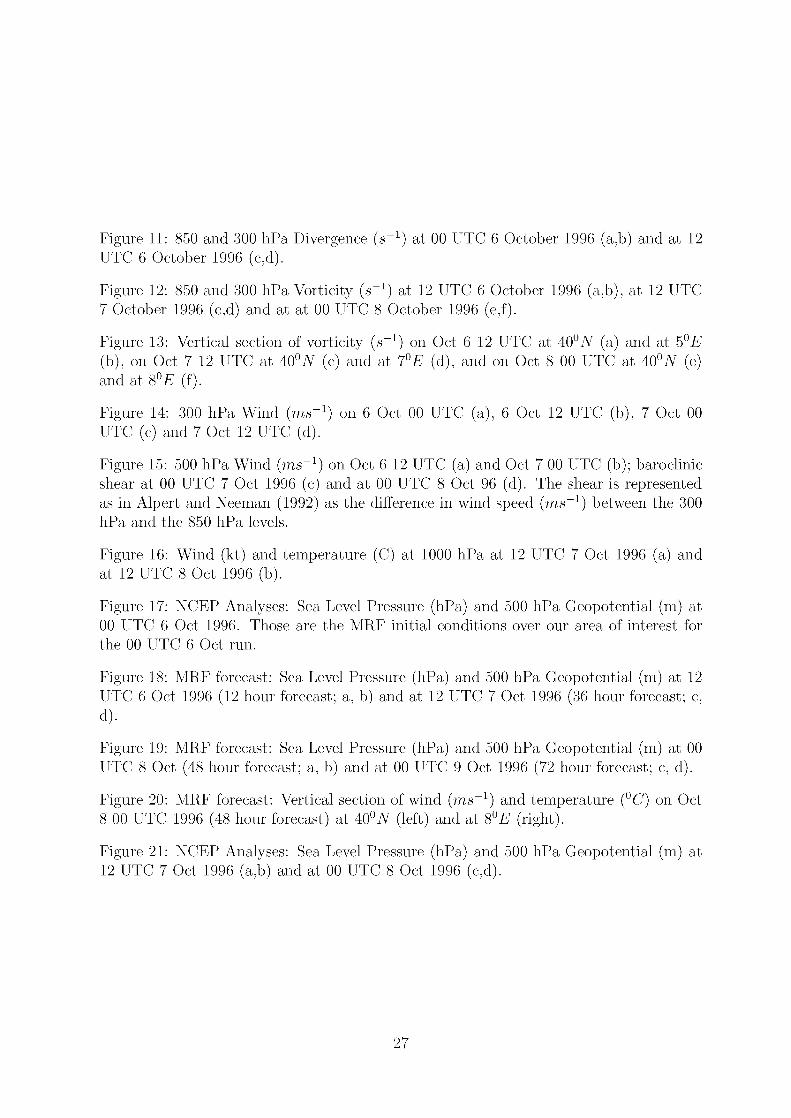
Figure 11: 850 and 300 hPa Divergence (s~l) at 00 UTC 6 October 1996 (a,b) and at 12UTC 6 October 1996 (c,d).
Figure 12: 850 and 300 hPa Vorticity (s~l) at 12 UTC 6 October 1996 (a,b), at 12 UTC7 October 1996 (c,d) and at at 00 UTC 8 October 1996 (e,f).
Figure 13: Vertical section of vorticity (s~l) on Oct 6 12 UTC at 40°N (a) and at 5°E(b), on Oct 7 12 UTC at 40°N (c) and at 7°E (d), and on Oct 8 00 UTC at 40°N (e)and at 8°E (f).
Figure 14: 300 hPa Wind (ms"1) on 6 Oct 00 UTC (a), 6 Oct 12 UTC (b), 7 Oct 00UTC (c) and 7 Oct 12 UTC (d).
Figure 15: 500 hPa Wind (ms"1) on Oct 6 12 UTC (a) and Oct 7 00 UTC (b); baroclinicshear at 00 UTC 7 Oct 1996 (c) and at 00 UTC 8 Oct 96 (d). The shear is representedas in Alpert and Neeman (1992) as the difference in wind speed (ms~l) between the 300hPa and the 850 hPa levels.
Figure 16: Wind (kt) and temperature (C) at 1000 hPa at 12 UTC 7 Oct 1996 (a) andat 12 UTC 8 Oct 1996 (b).
Figure 17: NCEP Analyses: Sea Level Pressure (hPa) and 500 hPa Geopotential (m) at00 UTC 6 Oct 1996. Those are the MRF initial conditions over our area of interest forthe 00 UTC 6 Oct run.
Figure 18: MRF forecast: Sea Level Pressure (hPa) and 500 hPa Geopotential (m) at 12UTC 6 Oct 1996 (12 hour forecast; a, b) and at 12 UTC 7 Oct 1996 (36 hour forecast; c,d).
Figure 19: MRF forecast: Sea Level Pressure (hPa) and 500 hPa Geopotential (m) at 00UTC 8 Oct (48 hour forecast; a, b) and at 00 UTC 9 Oct 1996 (72 hour forecast; c, d).
Figure 20: MRF forecast: Vertical section of wind (ms~l) and temperature (°C) on Oct8 00 UTC 1996 (48 hour forecast) at 40°N (left) and at 8°E (right).
Figure 21: NCEP Analyses: Sea Level Pressure (hPa) and 500 hPa Geopotential (m) at12 UTC 7 Oct 1996 (a,b) and at 00 UTC 8 Oct 1996 (c,d).
27

Figure 22: NCEP Analyses: Sea Level Pressure (hPa) and 500 hPa Geopotential (m) at12 UTC 8 Oct 1996 (a,b) and at 00 UTC 9 Oct 1996 (c,d).
Figure 23: NCEP Analyses: Sea Level Pressure (hPa) and 500 hPa Geopotential (m) 00UTC 7 Oct 1996. Those are the MRF initial conditions over our area of interest for the00 UTC 7 Oct run.
Figure 24: MRF forecast: Sea Level Pressure (hPa) and 500 hPa Geopotential (m) at 00UTC 8 Oct 1996 (24 hour forecast; a, b) and at 00 UTC 9 Oct 1996 (48 hour forecast; c,d)
Figure 25: DALAM Initial Conditions, derived from ECMWF Analyses, over our area ofinterest, for the 00 UTC 6 Oct run. Sea Level Pressure (hPa) and 500 hPa Geopotential(m) at 00 UTC 6 Oct 1996.
Figure 26: DALAM forecast: Sea Level Pressure (hPa) and 500 hPa Geopotential (m) at12 UTC 6 Oct 1996 (12 hour forecast; a, b) and at 12 UTC 7 Oct 1996 (36 hour forecast;c, d)
Figure 27: DALAM forecast: Sea Level Pressure (hPa) and 500 hPa Geopotential (m) at00 UTC 8 Oct 1996 (48 hour forecast) and at 12 UTC 8 Oct 1996 (60 hour forecast)
Figure 28: DALAM forecast: Vertical section of wind (ms"1) and temperature (°C) on 8Oct 12 UTC (60 hour forecast) at 40.7°N (left) and at 10.7°E (right).
Figure 29: DALAM Initial Conditions, derived from ECMWF Analyses, over our area ofinterest, for the 00 UTC 7 Oct run. Sea Level Pressure (hPa) and 500 hPa Geopotential(m) at 00 UTC 7 Oct 1996
Figure 30: DALAM forecast: Sea Level Pressure (hPa) and 500 hPa Geopotential (m) at12 UTC 8 Oct 1996 (36 hour forecast; a, b) and at 12 UTC 9 Oct 1996 (48 hour forecast;c, d)
28

46N
007 8 Oct 96
a2W 2E 4E 6E 8E 10E 12E 14E 16E 18E 20E
4 6 N T
45N-'
44N-
43N-'
42N-'
41 N -
40N-'1
39N-
38N-
37N-_
36N-
35N-.
34N-
007 8 Oct 96
:_-—55—-_ "•""-- — 7 "v^ ^" \
ulUu.j.Eiiji.
-50-:— -1/ !
/ ;T.T "~..{. /- - -54
4W 2W 0 2E 4E 6E 8E 10E 12E 14E 16E 18E 20E
Fig 9

007 8 Oct96 at 40 007 8 Oct96 at 8 E
200
300-
400-
500-
600-
700-
800-
900-
1000
.-50 i
I
--
n-
,.-.—_5--.
2W 0 2E 4E 6E 8E 10E 12E14E16E18E20E 34 36 38 40 42
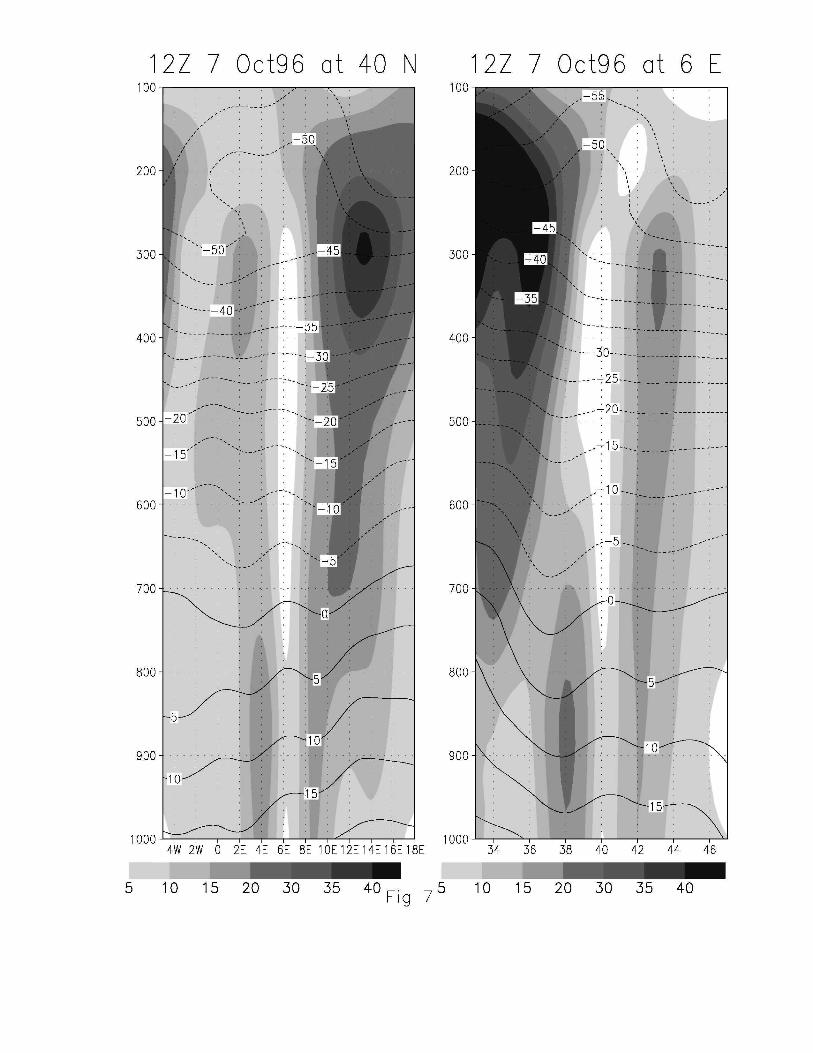
127 7 Oct96 at 40 N 127 7 Oct96 at 6 E100-1- : : : : " ^ ^ : : 1 100"
200
300
400-
500
600-
700-
800-
900-
1000
200
300
400
500-
600-
700-
800-
900-
4W 2W 0 2E 4E 6E 8E 10E 12E 14E 1 6E 18E1000
34 36 38 40 42 44 46
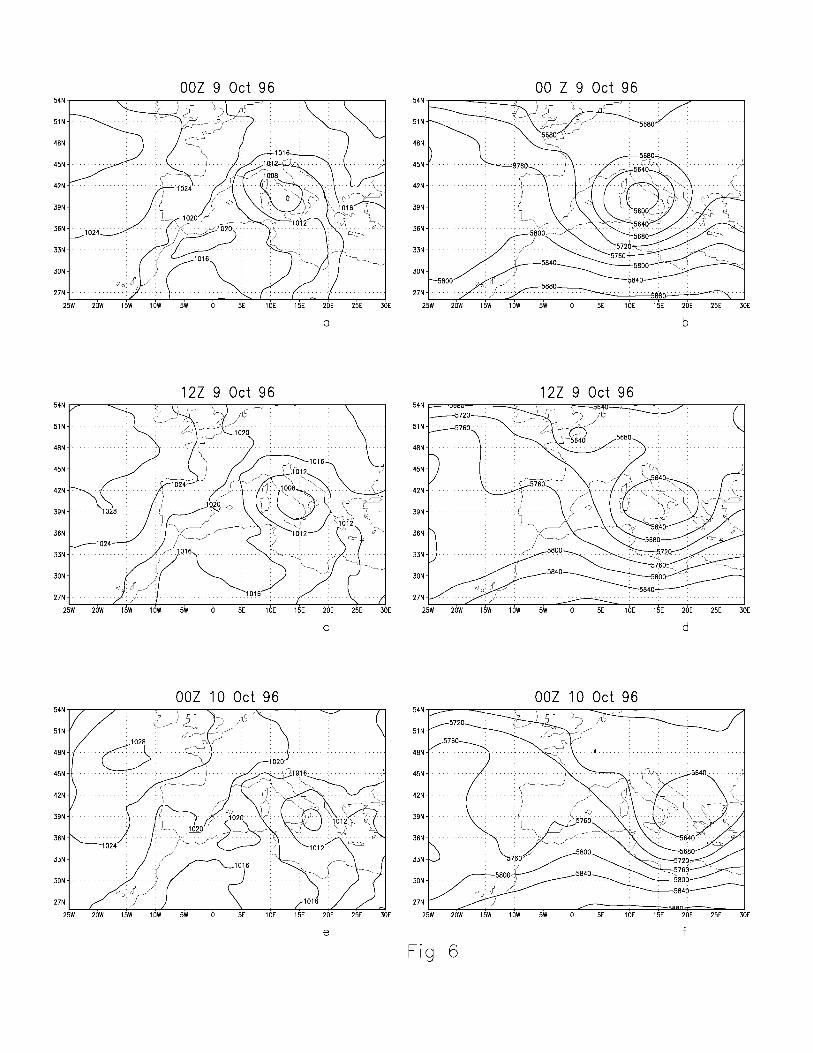
OOZ 9 Oct 96 00 Z 9 Oct 96
25W 20W
12Z 9 Oct 96 12Z 9 Oct
OOZ 10 Oct 96 OOZ 10 Oct 96
15W 10W 5W 5E 10E 15E 20E 25E 30E 25W 20W 15W 10W 5W
Fig 6

12Z 7 Oct 96 12Z 7 Oct 96
5E 1OE 15E 20E 25E 30E
OOZ 8 Oct 96 OOZ 8 Oct 96
25W 2OW 15W
12Z 8 Oct 96 12Z 8 Oct 96
Fig 5

OOZ 6 Oct 96 00 Z 6 Oct 96
10E 15E 20E 25E
12Z 6 Oct 96 12 Z 6 Oct 96
25W 20W 15W 10W 5W
OOZ 7 Oct 96 OOZ 7 Oct
25W 20W 15W 10W 5W
Fig 4

OOZ 4 Oct 96 00 Z 4 Oct 96
15E 20E 25E 30E
12Z 4 Oct 96 12 Z 4 Oct
25W 20W 15W 10W 5W
12Z 5 Oct 96 12Z 5 Oct 96
25W 20W 15W 10W 5W 25W 20W 15W 10W 5W 15E 20E 25E 30E
Fig 3

12 Z 8 Oct 96 DALAM 36H FC 12 Z 8 Oct 96 DALAM 36H FC
00 Z 9 Oct 96 DALAM 48H FC 00 Z 9 Oct 96 DALAM 48H FC
2E 4E 6E 8E 10E 12E H E 16E 18E
Fig 30

12 Z 2 Oct 96 12 Z 2 Oct 96
25W 2OW 151N 10W 5E 1OE 15E 20E 25E 30E
00 Z 3 Oct 00 Z 3 Oct 96
25W 20W 15W 10W
2 7 N -
25W 20W 15W 10W
12Z 3 Oct 96 12Z 3 Oct 96
25W 20W 151K 10W 5W 5E 10E 15E 20E 25E 30E 25W 20W 151K 10W 5W 5E 10E 15E 20E 25E 30E
Fig 2
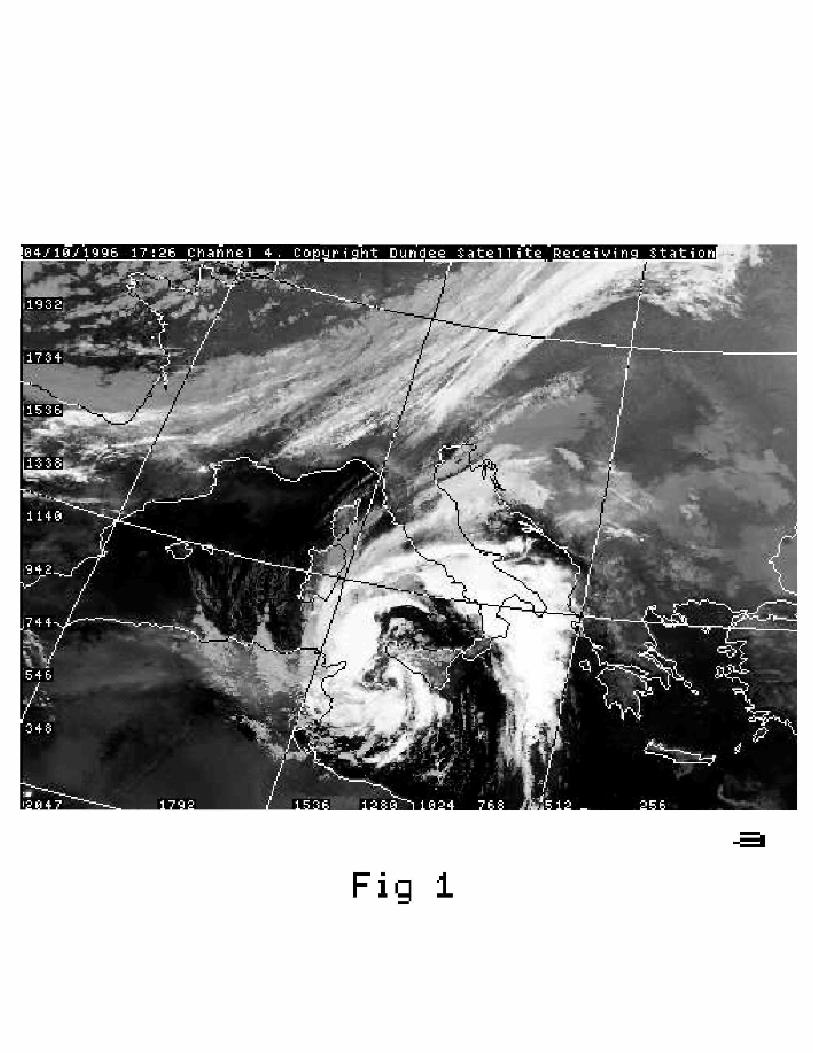
Fig 1
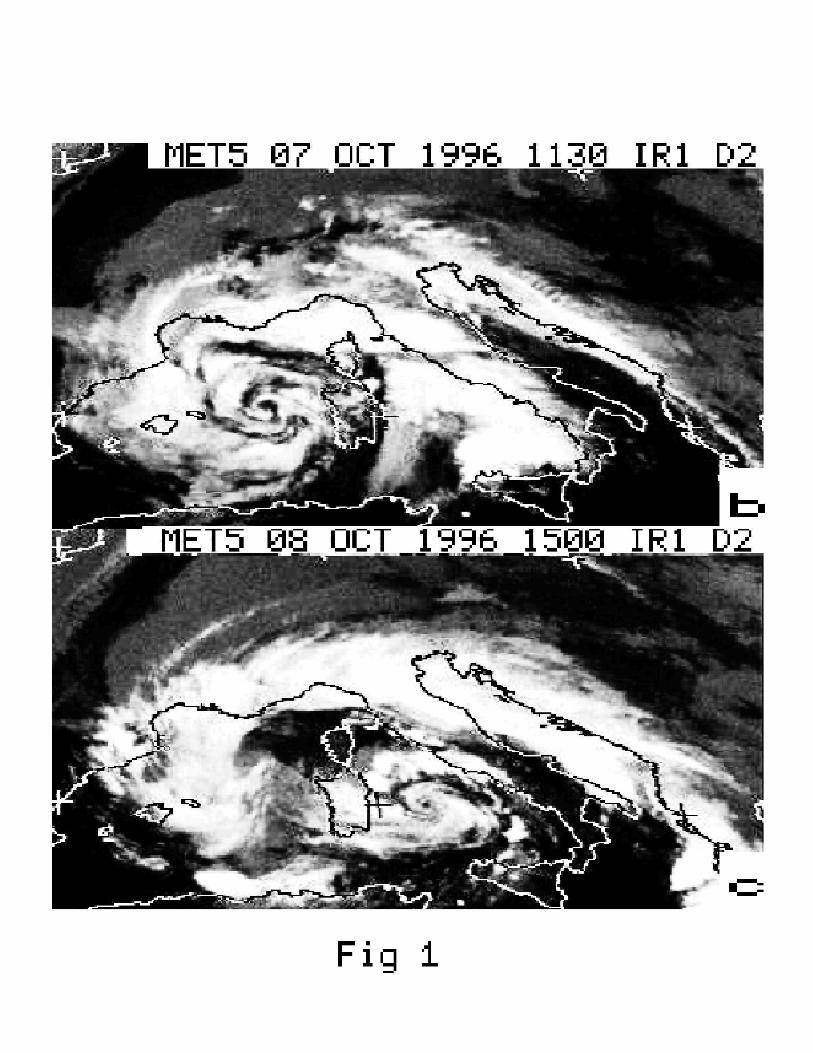
NET5 07 OCT 1996 1130 IRl D2
NET5 03 OCT 1996 1
Fig 1

OOZ 8 Oct 96 MRF 48H FC OOZ 8 Oct 96 MRF 48H FC
OOZ 9 Oct 96 MRF 72H FC OOZ 9 Oct 96 MRF 72H FC
Fig 19
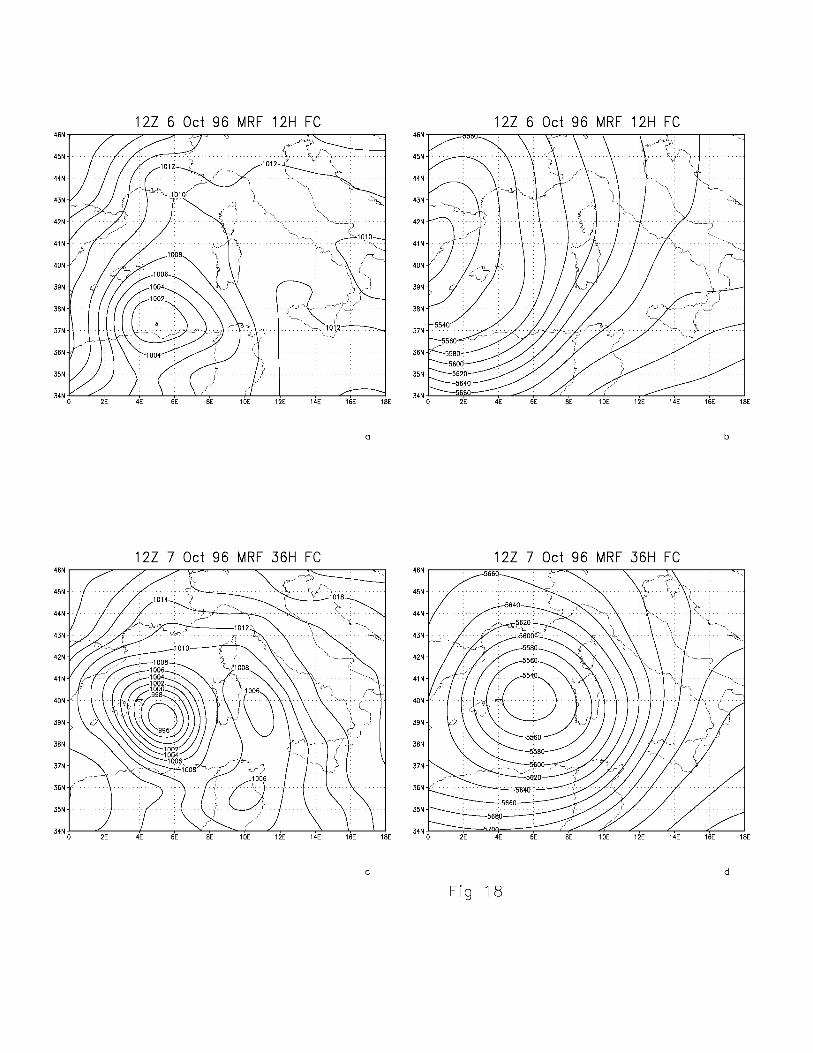
12Z 6 Oct 96 MRF 12H FC 12Z 6 Oct 96 MRF 12H FC
12Z 7 Oct 96 MRF 36H FC 12Z 7 Oct 96 MRF 36H FC
8E 1OE 12E H E 16E 18E
Fig 18

007 6 Oct 96 NCEP AN46N
2E 4E 6E 8E 10E 12E 14E 16E 18E
46N-
007 6 Oct 96 NCEP AN
0E 12E 14E 16E34N -577D
0 2E 4E 6E 8E
b
Fig 17

127 7 Oct 9644N
43N-
41
a36N
E 2E 3E 4E 5E 6E 7E 8E 9E 10E 11E 12E 13E 14E 15E
127 8 Oct 9644N
43N-
E 2E 3E 4E 5E 6E 7E 8E 9E 10E 11E 12E 13E 14E 15E
37N-
36N
Fig 16

12Z 6 Oct 96 500 hpa wind OOZ 7 Oct 96 500 hpa wind
20W 15W 10W 5V» 5E 10E 15E 20E
10 20 30 40 50 60 10 20 30 40 50 60
OOZ 7 Oct 96 300-850 hpa wind shear OOZ 8 Oct 96 300-850 hpa wind shear
20W 15W 10W 5E 10E 15E 20E 25E
10 20 30 40 50 60 10 20 30 40 50 60
Fig 15

OOZ 6 Oct 96 300 hpa wind 12Z 6 Oct 96 300 hpa wind
10 20 30 40 50 60 10 20 30 40 50 60
OOZ 7 Oct 96 300 hpa wind 12Z 7 Oct 96 300 hpa wind
20W 15W 10W 15W 10W 5W 0 5E 10E 15E 20E 25E
10 20 30 40 50 60 10 20 30 40 50 60
Fig 14

12Z 6 Oct 96 vort at 40 N 12Z 6 Oct 96 vort at 5
15W 10W 5W 5E 10E 15E 20E 25E
-5e-05 0 5e-05 O.OOO1 0.00015 0.0002
28N 30N 32N 34N 36N 38N 40N 42N 44N 46N
-5e-05 0 5e-05 0.0001 0.00015 0.0002
12Z 7 Oct 96 vort at 40 N 12Z 7 Oct 96 vort at 7 E
10E 15E 20E 25E 28N 30N 32N 34N 36N 38N 40N 42N 44N 46N 48N 50N
-5e-05 0 5e-05 0.0001 0.00015 0.0002 -5e-05 0 5e-05 0.0001 0.00015 0.0002
OOZ 8 Oct 96 vort at 40 N OOZ 8 Oct 96 vort at 8 E
-5e-05 0 5e-05 0.00010.00015 0.0002Fiq 13
28N 30N 32N 34N 36N 38N 40N 42N 44N 46N 48N 50N 52N
-5e-05 0 5e-05 0.0001 0.00015 0.0002

12Z 6 Oct 96 850 hPa vort 12Z 6 Oct 96 300 hPa vort
-5e-05 0 5e-05 0.00010.00015 0.0002 -5e-05 0 5e-05 0.0001 0.00015 0.0002
12Z 7 Oct 96 850 hPa vort 12Z 7 Oct 96 300 hPa vort
-5e-05 0 5e-05 0.00010.00015 0.0002 -5e-05 0 5e-05 0.0001 0.00015 0.0002
00Z 8 Oct 96 850 hPa vort 00Z 8 Oct 96 300 hPa vort
1OW 8W RW 4W 9W^^^r^^^9^^^4^^^R^^^a^^^in^^^^F i4E
-5e-05 0 5e-05 0.00010.00015 0.0002 e Fig 12
10W 8W RW 4W 9 W ^ ^ r ^ ^ 9 T
-5e-05 0 5e-05 0.0001 0.00015 0.0002
HE
f
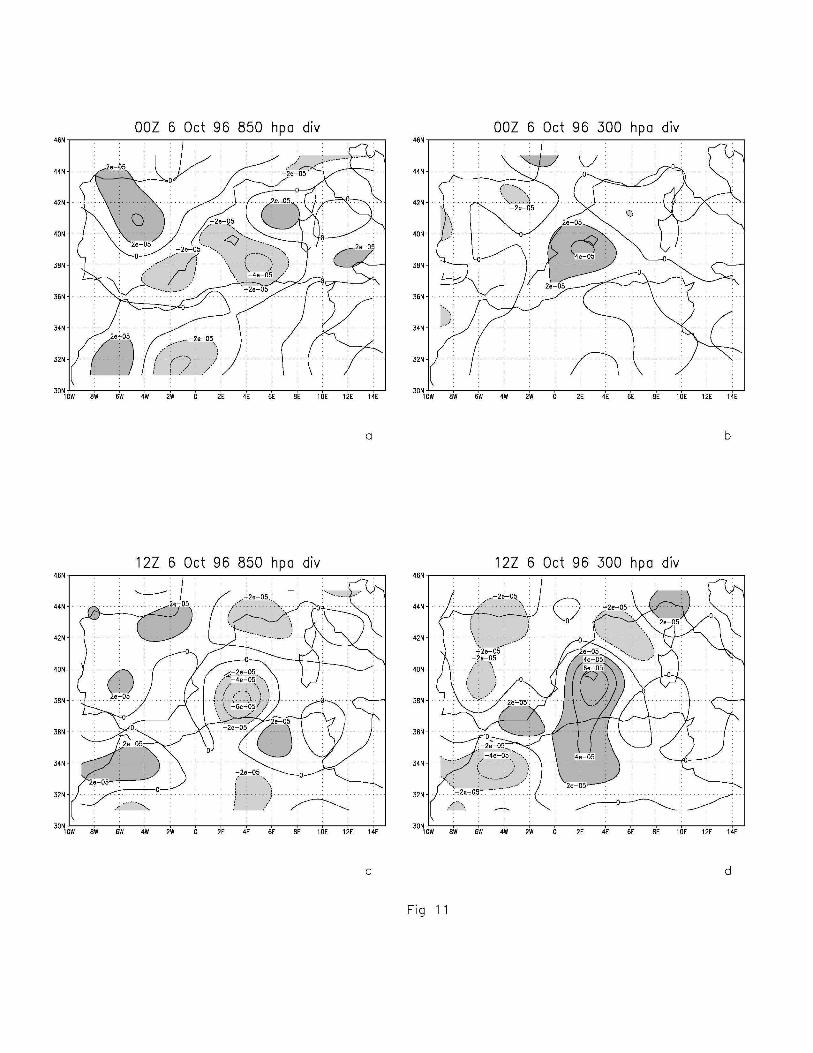
OOZ 6 Oct 96 850 hpa div OOZ 6 Oct 96 300 hpa div
OW 8W 6W 4W 2V» 0 2E 4E 6E 8E 10E 12E 14E OW 8W 6W 4W 2V» 0 2E 4E 6E 8E 10E 12E 14E
12Z 6 Oct 96 850 hpa div 12Z 6 Oct 96 300 hpa div
10W 8W 6W 4W 2W 0 2E 4E 6E 8E 10E 12E 14E 10W 8W 6W 4W 2W 0 2E 4E 6E 8E 10E 12E 14E
Fig 1 1
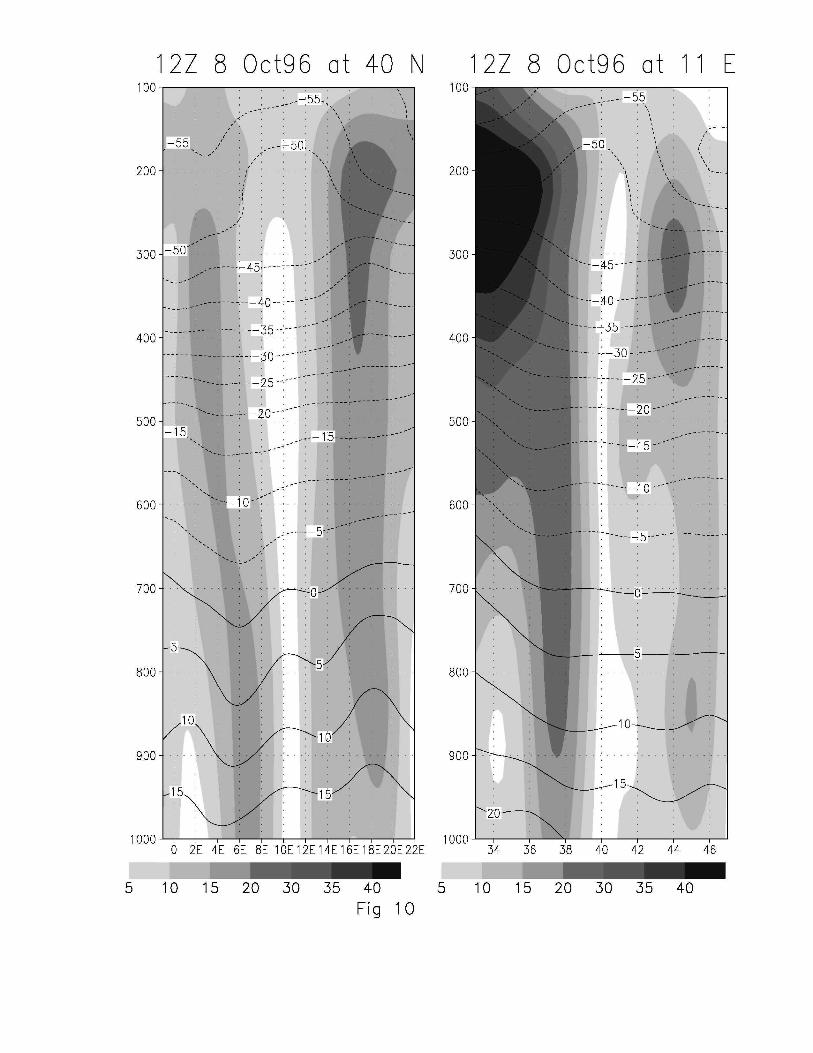
12Z 8 Oct96 at 40100
.-55. , / ! ! , - - 5 0 .
200-
300-
400-
500-
600-
700-
800-
900-
-\
- 4 0 -
- 3 5 -
- 3 0 -
-25-
-20 -
-15
1-iO-'-'
. 5--'
1000
12Z 8 Oct96 at 11 E
200
300
400-
500-
600- S
700-
800-
900-
0 2E 4E 6E 8E 10E12E14E16E18E20E22E1000
,-—--55
-50
T- 45—-TT
':"-—40— -:- \
r~ : 35——"
j :—30-:--I : 25-
- 2 0 -
I1-15|
10—'
34 36 38 40 42 44 46
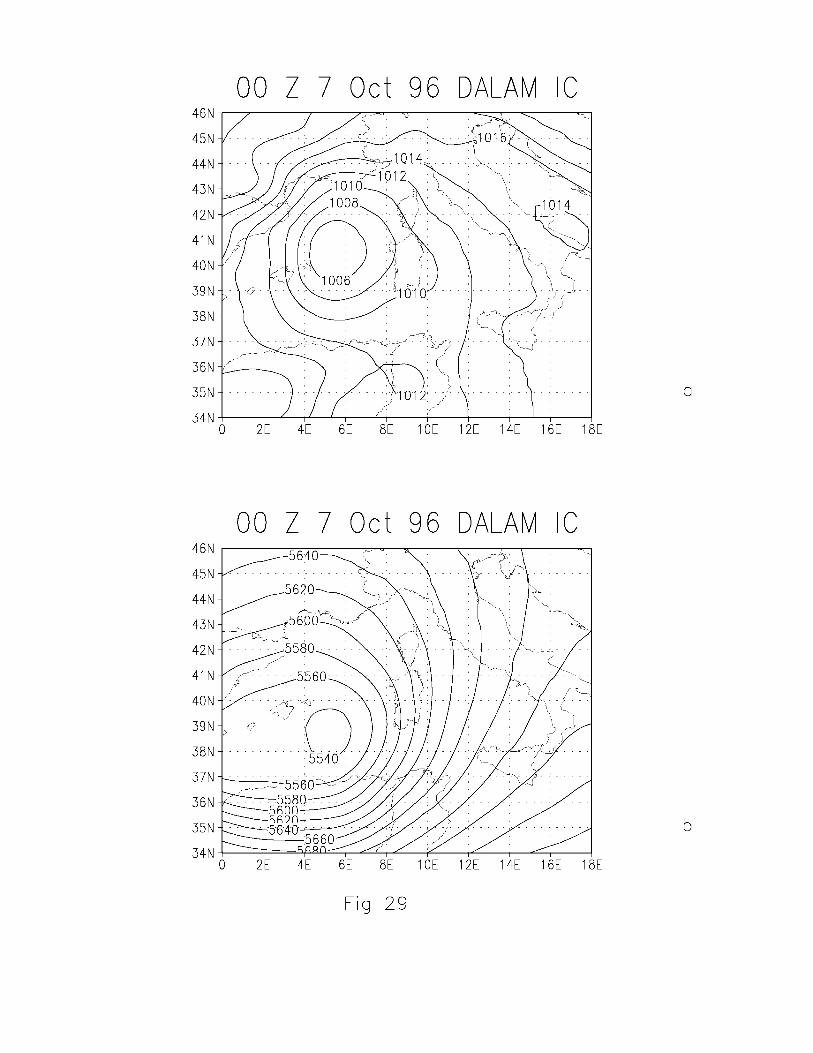
00 Z 7 Oct 96 DALAM IC46N
0 2E 4E 6E 8E 10E 12E 14E 16E 18E
00 Z 7 Oct 96 DALAM IC
b
2E 4E 6E 8E 10E 12E 14E 16E 18E
"ig 29
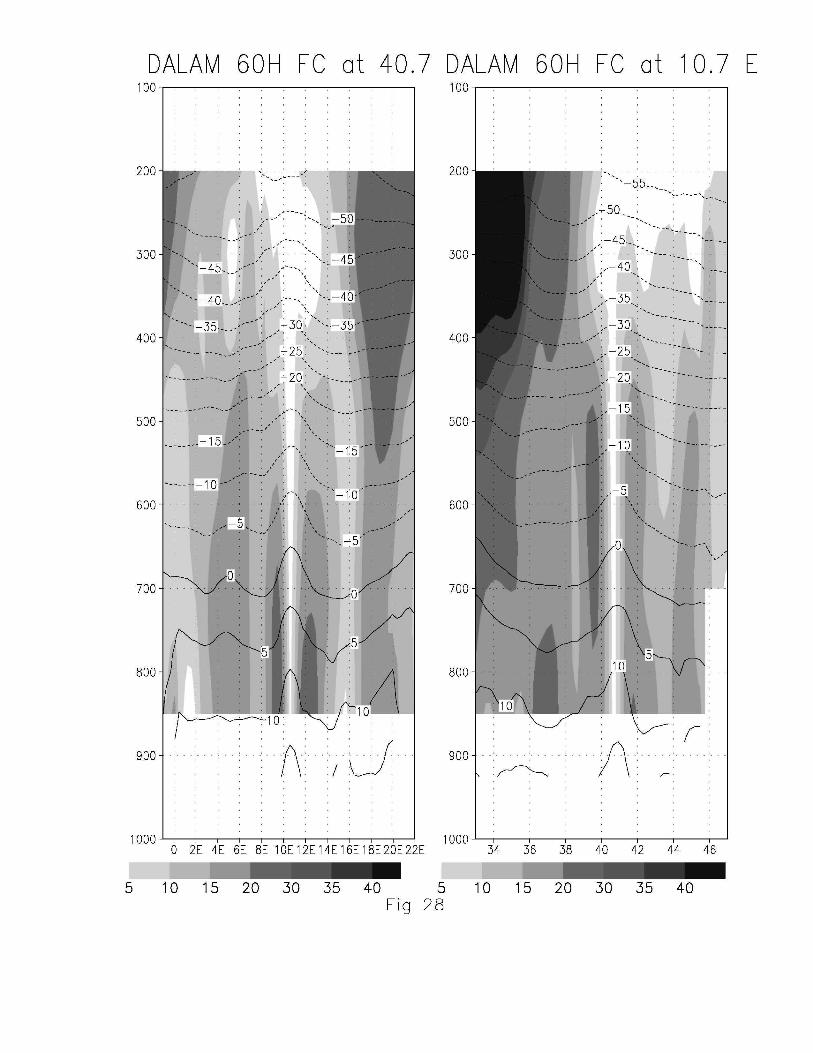
DALAM 60H FC at 40.7 DALAM 60H FC at 10.7 E100-I- : : : : : : : : : : 1 100 "
200- 200
300 4 >-~
1 - 4 0 - . - : - " '
400-
500-
600-
700-
-25! N—.•
-20 : x - - - - . ; -
- : — - 1 0 MI- iol
800 A l l10'
900-
1000
300
400
500-
600-
700
800-
900-
10000 2E 4E 6E 8E 10E12E14E16E18E20E22E 34 36 38 40 42 44 46
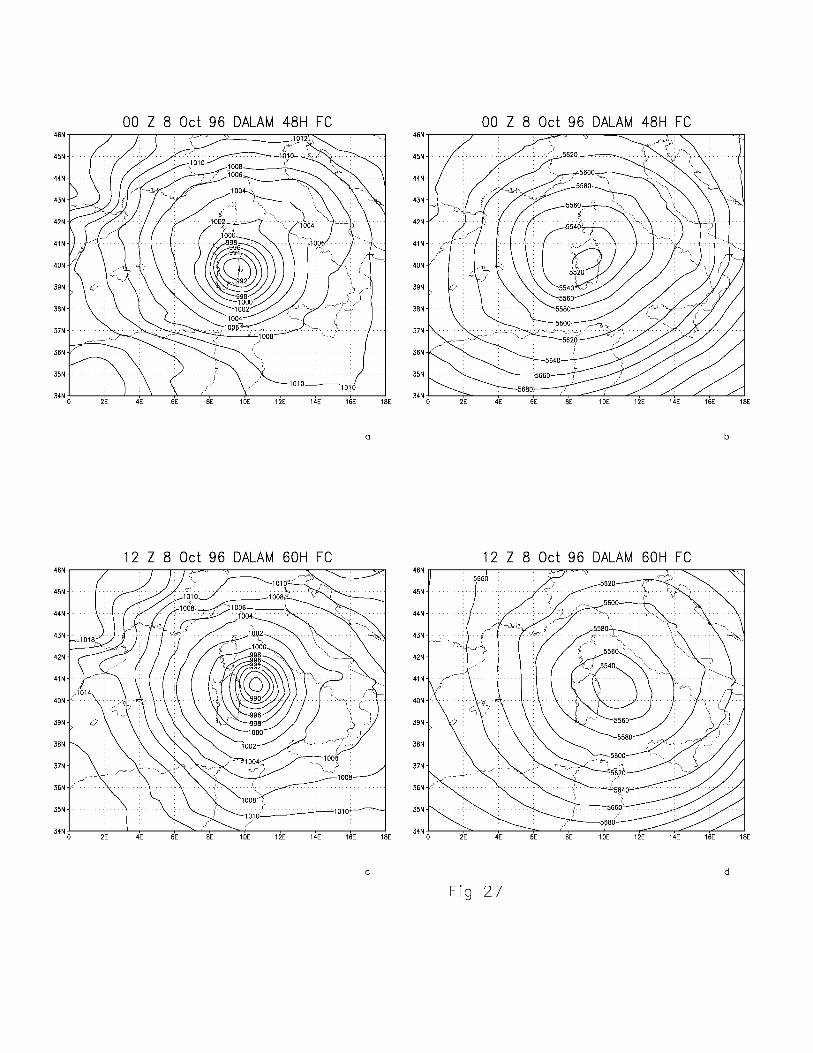
00 Z 8 Oct 96 DALAM 48H FC 00 Z 8 Oct 96 DALAM 48H FC
12 Z 8 Oct 96 DALAM 60H FC 12 Z 8 Oct 96 DALAM 60H FC
Fig 2 7
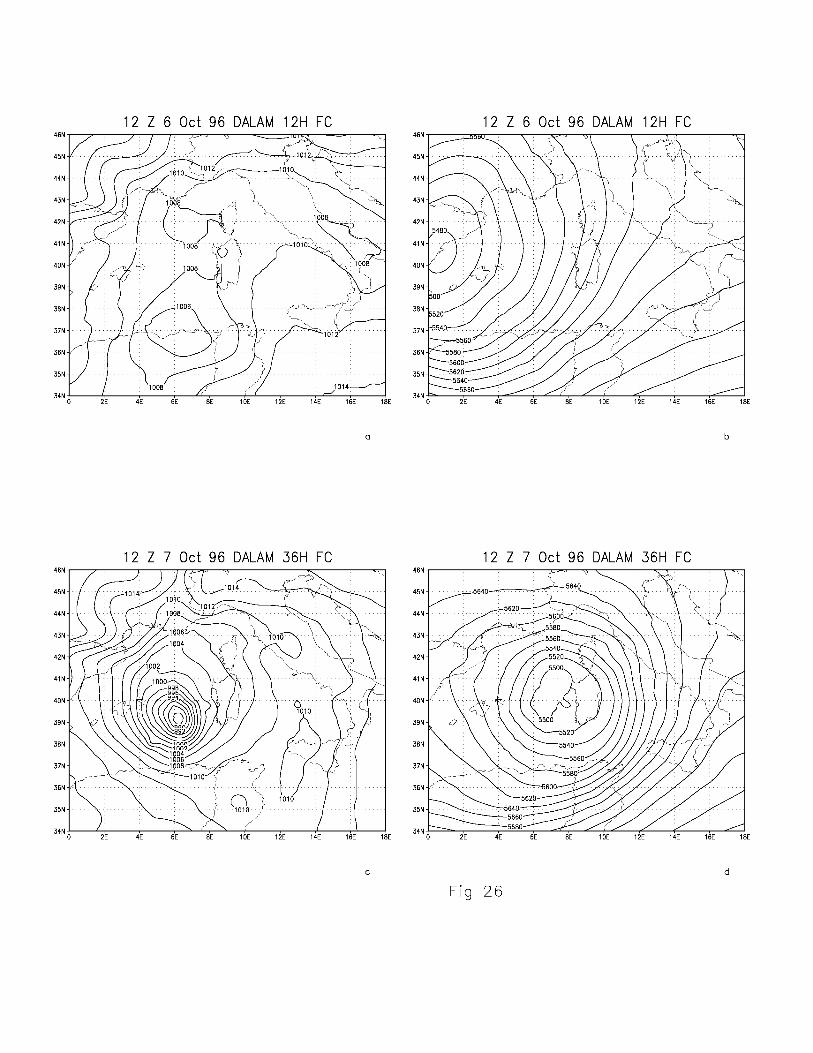
12 Z 6 Oct 96 DALAM 12H FC 12 Z 6 Oct 96 DALAM 12H FC
12 Z 7 Oct 96 DALAM 36H FC 12 Z 7 Oct 96 DALAM 36H FC
2E 4E 6E 8E 1OE 12E H E 16E 18E
Fig 26

00 Z 6 Oct 96 DALAM IC46N
2E 4E 6E 8E 10E 12E 14E 16E 18E
00 Z 6 Oct 96 DALAM IC46N-
34N
b
2E 4E 6E 8E 10E 12E 14E 16E 18E
"ig 25

OOZ 8 Oct 96 MRF 24H FC OOZ 8 Oct 96 MRF 24H FC
OOZ 9 Oct 96 MRF 48H FC OOZ 9 Oct 96 MRF 48H FC
4E 6E 8E 1OE 12E HE 16E 2E 4E 6E 8E 1OE 12E HE 16E 18E
Fig 24
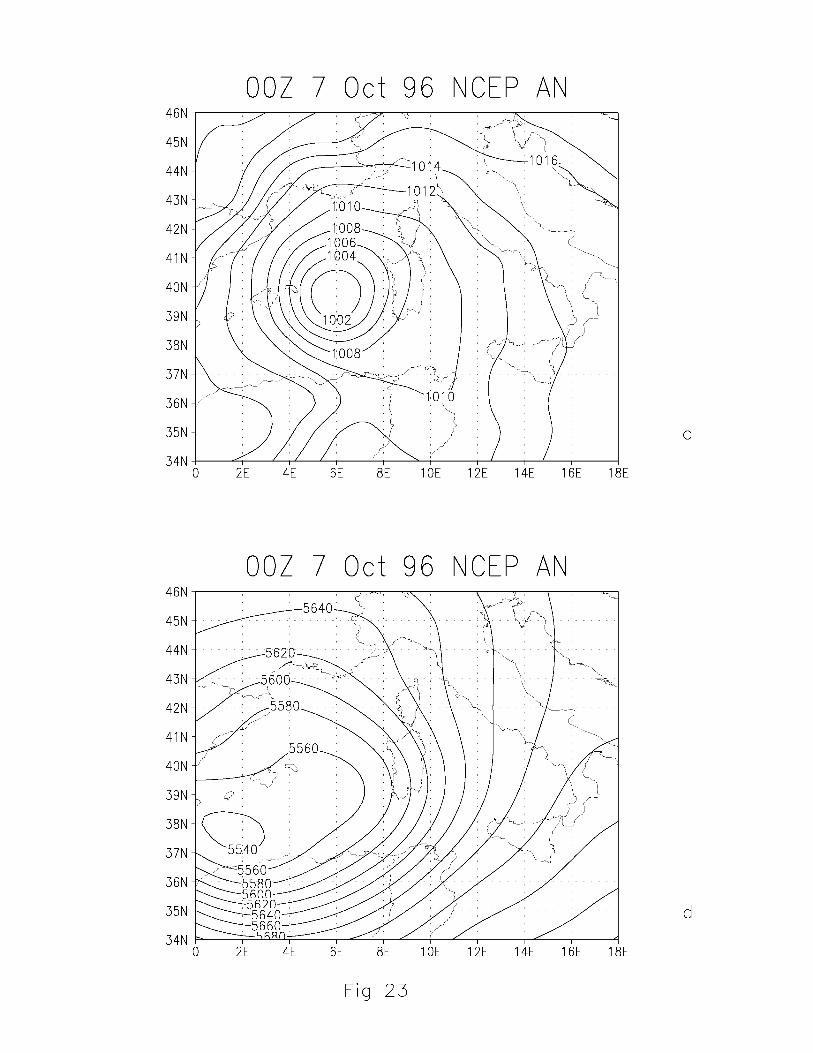
007 7 Oct 96 NCEP AN
c
0 2E 4E 6E 8E 10E 12E 14E 16E
007 7 Oct 96 NCEP AN46N-
45N-
44N-
43N-
42N-
41 N
40N-
39N-
38N-
37N-
36N-
35N-
34N-
556055805ROO-56?n
56405660SR80
d
2E 4E 6E 8E 10E 12E 14E 16E 18E
Fig 23
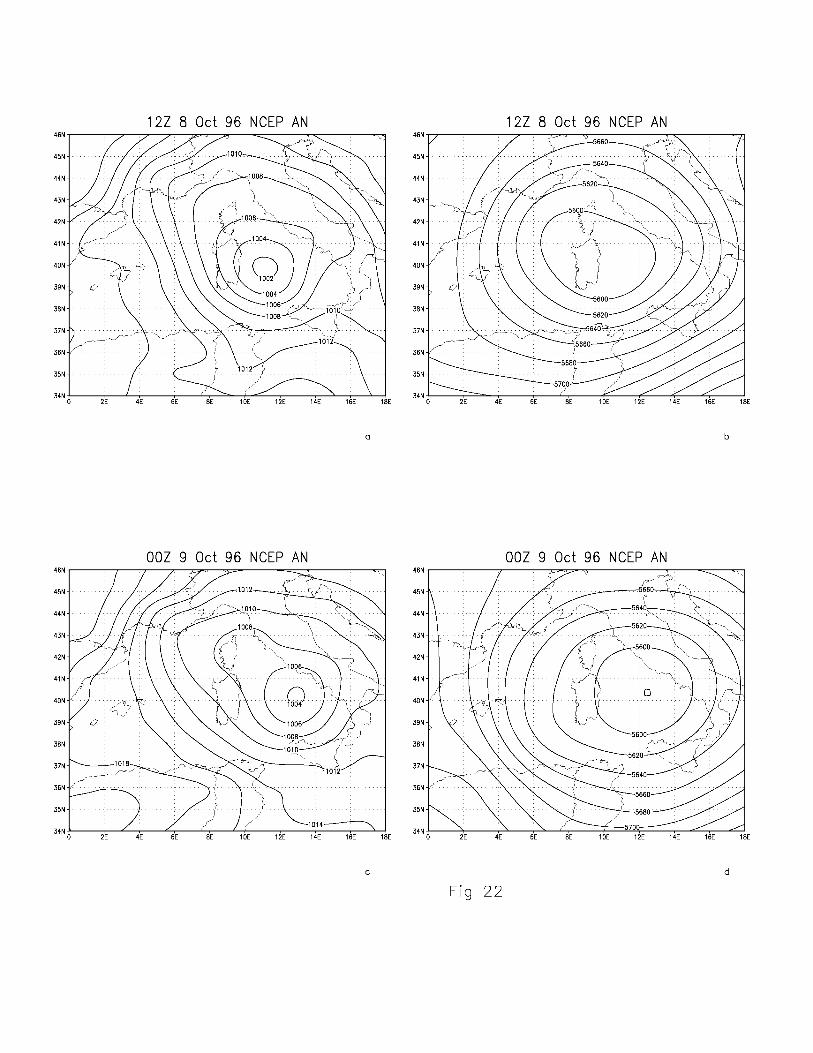
12Z 8 Oct 96 NCEP AN 12Z 8 Oct 96 NCEP AN
OOZ 9 Oct 96 NCEP AN OOZ 9 Oct 96 NCEP AN
2E 4E 6E 8E 1OE 12E HE 2E 4E 6E 8E 1OE 12E H E 16E 18E
Fig 22

12Z 7 Oct 96 NCEP AN 12Z 7 Oct 96 NCEP AN
2E 4E 6E 8E 1OE 12E HE 16E 18E
OOZ 8 Oct 96 NCEP AN OOZ 8 Oct 96 NCEP AN
2E 4E 6E 8E 1OE 12E HE 16E 18E
Fig 21

MRF 48H FC at 40 N MRF 48H FC at 8 E100-1- : : : : : : : : : : 1 100
200
300
400-
500
600-
700-
800-
900-
1000
200-
300-
400-
500-
600-
700-
800-
900-
2W 0 2E 4E 6E 8E 10E12E14E16E18E1000
— : —35-,..
: 30-—.
34 36 38 40 42 44 46