TROPICAL CYCLONE GENESIS
127
, . . NSF GRANT , G,A - 325 8 9 X 3 TR OPICAL CYCLONE GENESIS
Transcript of TROPICAL CYCLONE GENESIS

, . .
NSF GRANT , G,A - 325 8 9 X 3
TROPICAL CYCLONE GENESIS

TROPICAL CYCLONE GENESIS
by
William M. Gray
Preparation of this report
has been financially supported by
National Science Foundation Grant GA-32589X3
Department of Atmospheric Science
Colorado State University
Fort Collins, Colorado
March, 1975
Atmospheric Science Paper No. 234

ABSTRACT
A new global observational and theoretical study of tropical cyclone
genesis is made. This is an extension of the author's previous study
(Gray, 1968) on this subject. Cyclone initial genesis locations have
been stratified by season for the 20-year period of 1952-1971. Wind,
temperature and moisture information are averaged by season and by
5-degree latitude-longitude Marsden squares. It is observationally
shown and physical reasons are given why seasonal cyclone genesis fre-
quency is related to the product of the seasonally averaged parameters
of: 1) low level relative vorticity, 2) Coriolis parameter, 3) inverse
of the vertical shear of the horizontal wind from lower to upper tropo-
sphere, 4) ocean's thermal energy to 60 meters' depth, 5) moist stability
from the surface to 500 mb, and 6) middle troposphere relative humidity.
A seasonal forecast potential of cyclone genesis frequency is derived.
This forecast potential very well specifies the location and frequency
of global cyclone genesis. A general theory on cyclone frequency is
advanced.
i LIBRARIES
cQtOItADO ~T ATE UN!V!'!<SITY fort (:011 ins, Coioredo 80~23

1.
2.
3.
4.
5.
6.
INTRODUCTION • • •
Numerical Modeling • Definitions. Conclusion • •
TABLE OF CONTENTS
CYCLONE ORIGIN STATISTICS.
PHYSICAL REQUIREMENTS OF CYCLONE GENESIS • ~ • •
Page
1
3 5 7
9
17
Enthalpy Increase through Release of Latent Heat 17 Cloud Cluster Characteristics. • . • • • • • • • 20 Nature of the Cloud Cluster's Upper Tropospheric Warming. 22 Cyclone Genesis Hypothesis • • 24 Cluster Ventilation. • • 25 Summary. • • • • • • • • • 27
SIX PRIMARY GENESIS PAlUU1ETERS • • .30
4.1 Role of Low Level Relative Vorticity. 31
4.2 Role of Earth's Rotation. • • • • • • 37
4.3 Role of Tropospheric Vertical Wind Shear and Upper Level Ventilation. • • • • 40
4.4 Role of Ocean Thermal Energy. 46
4.5 Role of Surface to Middle Troposphere 8 Gradient •• 52 e
4.6 Role of Middle Troposphere Humidity •••
SPECIFICATION OF SEASONAL GENESIS FREQUENCY.
Relation of Seasonal Wind Fields and Sea Surface Tempera-ture'to Cyclone Genesis ••••••••••••••••
Spatial and Seasonal Variations of Genesis Parameters. • • Dynamic Potential. . • • • • Thermal Potential. • • • • • • • Verification • Conclusion . • • • • • Application of Daily Forecasting •
DISCUSSION • •
Daily Values of the Seasonal Genesis Parameter Daily Correlation of Parameters. • • • • • • •
ii
53
57
59 62 63 63 65 65 05
100
101 104

TABLE OF CONTENTS (cont'd)
ACKNOWLEDGEMENTS ••
REFERENCES
APPENDIX • . . . . . . Data Sources for Various Calculations • Final Note to Reader •••••••••
BIBLIOGRAPHY OF GENERAL TROPICAL DATA SOURCES.
iii
Page
109
110
116
116 118
120

1. INTRODUCTION
One of the most challenging subjects in meteorology is that of
understanding why and how tropical cyclones form. A consensus of opinion
on the environmental conditions and the physical mechanisms which bring
about tropical cyclone formation is not present. Among meteorologists
who have studied this subject there exist a wide variety of opinions.
Yanai (1964) has previously made an attempt to summarize some of the pre
vailing opinions and physics on this subject up until that date. A con
sensus of opinions is lacking. Each researcher appears to emphasize and
discuss different onset and development criteria, yet the basic physical
processes which accompany the development of these warm-core cyclones
must be very similar. This lack of general agreement, while partly due
to semantical differences, is primarily due to fragmentary observational
evidence and lack of a solid physical basis for understanding the early
transformation of the tropical disturbance to a closed cyclone extending
through the depth of the troposphere.
Since tropical cyclones form over tropical oceans where upper air
observations are rare, definitive descriptions of the genesis character
istics of 'individual' tropical cyclones are grossly deficient. In
order to obtain enough observations to understand cyclogenesis we are
obliged to composite, or average, many cases of genesis together. If
the physical processes of genesis are basically similar for all cyclones
(as we believe) then some meaningful insights may be gained. At present
we have no physical or observational reasons for thinking otherwise.
This paper attempts to establish a physical basis for understand
ing the processes of cyclone genesis and the variations in the seasonal
climatology of genesis location and frequency. This is accomplished
1

2
through an integration of our present observational information and
through consideration of the likely relevant physical processes.
The first part of this paper presents statistical information on
the seasonal frequency of tropical cyclone genesiS and discusses what
the author believes are the major physical requirements of genesis. The
second part shows how these hypothesized requirements are specified by
an index formed from the product of six seasonally averaged meteorologic
al parameters. The last part of the paper shows how well the product
of these seasonally averaged parameters is related to cyclone genesis
location and frequency. A seasonal cyclone forecast index is proposed.
A theory of cyclone genesis frequency is advanced.
It will be shown that the feature of hurricane formation which is
least understood is that of how the weak precursor cyclone extending
through most· of the troposphere is formed from a disturbance with little
initial vorticity. This very early stage in the hurricane formation
process will be termed 'cyclone genesis'. By contrast the question of
'cyclone intensification' or growth of an already formed tropospheric
cyclone is much better understood. Extensive numerical modeling of
'cyclone intensification' has already been accomplished with reasonable
success. This latter topic is not the subject of this paper. This
paper addresses only the question of initial cyclone formation. It is
important to make this distinction. Very few tropical disturbances or
cloud clusters develop closed circulations which extend through the
troposphere. The vortex or closed circulation which is sometimes asso
ciated with a tropical disturbance is typically confined to a shallow
layer. No significant net tropospheric warming or surface pressure fall
occurs. On the other hand, a weak cyclone which extends throughout the

3
troposphere possesses a weak upper tropospheric warming and a small sur
face pressure decrease. This type of deep tropospheric vortex or cyclone
is nearly as rare as the hurricane. Hurricanes form only from these
latter types of systems.
Numerical Modeling. In the last decade extensive efforts have
gone into the numerical modeling of tropical cyclone intensification.
These modeling efforts have been primarily directed towards obtaining
realistic simulations of tropical cyclone growth rates from already ex
isting cyclones whose inner 100-200 km radius vorticity is of an order
of magnitude larger than that of the typical pre-cyclone cloud cluster
as described by Williams and Gray (1973), see Table 1. These modeling
efforts have shed light on the role of frictional convergence, condensa
tion heating, ocean energy exchange, etc. to the growth process. Al
though very laudable advancements have been made by the models in
increasing our knowledge of such physical processes, these numerical
modeling efforts have not dealt with the crucial question of specifying
how the tropical cyclone from which they start the calculations is it
self formed. Cyclones of the strengths and vertical depths initially
assumed by most of the modelers are rare.
Should not the primary question of cyclone genesis be that of
ascertaining how a vortex with maximum winds of 5-10 m/sec at radii of
100-200 km and extending through most of the troposphere is able to
form from a pre-cyclone cluster? In the author's view this is a much
more difficult physical question than understanding the later cyclone
intensification processes. Once a circular cyclone of the strength
assumed by the modelers has formed, the horizontal energy dispersion
processes (to be discussed) are greatly reduced and energy can readily

4
Table 1
Summary of Recent Numerical MOdeling Papers on Hurricane Development
and Their Assumed Initial Cyclone Strengths
Modelers Assumed Initial Max- Vortex Vorticity Type of imum Wind Velocity Inside the Ra- Vortex and Radial of Max- dius of Maximum imum Wind Winds (10-6sec-l}
Kuo 10 m/sec, 141 km 142 Synunetrical (1965)
Yamasaki 4.7m/sec, 100 km 94 Symmetrical (1968)
Ooyama 10 m/sec, 50 km 400 Symmetrical (1969)
Miller 10 m/sec, 200 km 100 Real Vortex (1969)
Rosenthal 7 m/sec, 250 km 56 Symmetrical (1970)
Sundquist 15 m/sec, 200 km 150 Symmetrical (1970)
Carrier 21 m/sec, 50 km 840 Symmetrical (1971)
Anthes, et ale 18 m/sec, 240 km 150 A-symmetrical (1971a,197lb)
Anthes 18 m/sec, 240 km 150 A-symmetrical (1972)
Mathur 15 m/sec, 200 km 150 A-symmetrical (1972)
Harrison 1\.10 m/sec, * 1\.120 km 1\.170 A-symmetrical (1973)
Kurihara and Tuleya 12 m/sec, 200 km 120 Symmetrical (1974)
Ceselski 17 m/sec, 1\.100-150 km 1\.200 Real Vortex (1974)
Typical pre-cyclone cloud cluster 1\.10-15
* Estimated from initial height field

5
accumulate within the central region. The frictionally forced conver-
gence processes of the boundary layer produce momentum. vapor, and energy
import into the cyclone center. Further intensification should take
1 place. Thus, intensification of an already developed cyclone is no
great physical mystery. About two-thirds of all cyclones of the strength
assumed by the intensification modelers (Table 1) reach hurricane
strength. The processes responsible for formation of the initial
cyclone from which the modelers start their integrations, however, is
much less understood. Very few cloud clusters grow into tropical cyclones
which extend through most of the troposphere. In a study of six years
of satellite-observed Atlantic tropical weather systems, Frank and
Hebert (1974) indicate that only 50 of 608, or 8 percent, of these
systems become named or developed cyclones. These ratios are not much
different in the other oceans.
Definitions. Meteorologists will often see or infer closed circu-
lations or vortices at various levels associated with different classes
of tropical weather systems (Asp liden, et al., 1966; Frank, 1969, 1970a,
1970b, 1971, 1972, 1973; Frank and Johnson, 1969; Riehl, 1954; Sadler,
1967a, 1967b, 1974a; Yanai, 1961, 1968). In this paper these closed
1 It is of interest to note that of all the cyclone modelers Rosenthal (1970) assumed the weakest vortex. His vortex grew very slowly for the first 3-4 days as the water vapor content of the middle levels slowly increased. After the water vapor contents reached values typical of those of the pre-cyclone cloud cluster (Ruprecht and Gray, 1974), a rapid and unstable growth occurred. Rosenthal started with moisture contents of Jordan's (1958) mean tropical atmosphere. Thus, the lack of rapid growth of the Rosentahl model in the first 3-4 days was not due to a lack of any innate vortex instability but most likely due to the unrealistically low water vapor content with which he started. The Jordan mean summer time tropical atmosphere gives 700 to 500 mb relative humitidies of 56 and 46 percent, respectively. Ruprecht and Gray's observations of pre-cyclone cloud clusters show that the relative humidities at these levels are rather 78 and 76 percent.

6
circulations are not considered to be tropical cyclones unless they can
be detected through an appreciable depth of the troposphere. This is
rare. Seldom do tropical closed circulations extend through more than
half of the troposphere. When this does happen, a hurricane typically
results.
This paper will distinguish between vortices and cyclones as follows!
1. Tropical vortex. Any closed circulation at any level whose in
ner 100-200 km relative vorticity is less than 100 x 10-6sec-1
and whose vertical depth is less than half of the troposphere.
rTez vortices, middle level easterly wave vortices, and vortices
which result from traveling waves superimposed on a zonal
current, etc. all fall into this category_
2. Tropical cyclone. A closed circulation warm-core system of at
least 50 diameter which extends vertically through most of the
troposphere with little vertical slope and whose relative
vorticity at lower levels and inner 100-200 km radius is greater
-6 -1 than 100 x 10 sec • This requires horizontal wind speeds at
100 and 200 km to be 5 m/sec and 10 m/sec. This is the strength
of the typical cyclone from which the numerical models begin
their intensification calculations.
Tropical cyclones which extend through most of the troposphere and
which have 5-10 m/sec winds at radii of but 100-200 km are not just a
natural result of the vorticity or shear configuration across a strong
doldrum equatorial trough within the rTeZ region - see Fig. 1. Even
though these cyclones' natural genesis location is just on the poleward
side of or within the doldrum equatorial trough (see Gray, 1968 and
Sadler, 1967a) the wind shears across such troughs are much weaker than

7
950 mb 200mb
• • ~ ~
200N 200N • • ~ ~
CYCLCH: RA[lJS ~ ....-
IOOKm 200Km l:::2: tt rco-[)Q()fu"It I80UGH 0 0 • • ~
lOON ," ,"" "" looN
• • /' /' /'
I I I • Eq.
i i I
( ( I 0 3 6 Eq. MlSEC
Fig. 1. Comparison of 100 and 200 km radii closed circulations (center) with typical gradient level (left) and 200 rnb flow patterns (right) surrounding a doldrum equatorial trough on whose poleward side tropical cyclones typically originate.
those of the early stage tropical cyclone from which the numerical mo-
delers begin their intensification calculations. In addition, these
wind shears across the equatorial trough are seldom present above the
400-500 mb levels. Upper tropospheric flow above the ITCZ is typically
from the east (right side of Fig. 1). When non-cyclone upper tropo-
spheric vortices occur they seldom are associated with low level vortices.
Conclusion. To understand the formation of deep tropospheric cy-
clones with maximum winds at 100-200 km radius~ one must hypothesize
a genesis meChanism which is able to greatly accentuate the naturally
occurring low level vorticity along the equatorial trough and vertically
stack this vorticity through most of the troposphere. The doldrum
trough and weak large-scale vortices confined to shallow vertical layers
are present nearly every day in the tropics. The tropical cyclone with
5-10 m/sec maximum winds at 100-200 km radius and extending through
most of the troposphere is a rare phenomenon. Something unusual must

8
take place near the doldrum trough (or in the trade wind current) in
order for a cyclone system to be formed. The doldrum equatorial trough
does not naturally give us these cyclones. Although the tropical vor
tex is common~ the tropical cyclone (as here defined) is nearly as rare
as the hurricane. The greatest difficulty in understanding hurricane
formation is not that of cyclone intensification but rather that of
initial cyclone genesis.

2. CYCLONE ORIGIN STATISTICS
The dots on Figs. 2 - 6 show cyclone origin points by season for
all tropical cyclone formations during the 20-year period of 1952-1971.
These initial cyclone origin points were obtained from the author's
tropical cyclone data files with recent updating and checking from the
U. S. Navy tropical cyclone data tapes (see Appendix). Information is
less reliable before the early 1950's. A longer data sample would
likely not change or improve these statistics. Figure 7 portrays the
regions of cyclone genesis and gives information on regional genesis
frequency per 20 years. Table 2 stratifies the genesis information by
region and season, and gives 20- and I-year frequencies. Most of
these nearly 2000 disturbance formations (~ 100 per year) produced
cyclones with sustained winds of ~ 20 m/sec or greater.
The dots show the first reported detection point of intensifying
disturbances which later became developed cyclones with maximum sus-
tained winds of at least 20-25 m/sec. About two-thirds of these cyclones
reached hurricane intensity - having maximum sustained winds greater
than ~ 33 m/sec. These dots can be taken as the approximate location
where the developing disturbance system first became a cyclone (as de
fined in this paper). In some cases the observations were ~ 12-36 hours
too late to detect this initial cyclone genesis location and the origin
points represent an already formed cyclone. In other cases the initial
points shown are those 12-36 hours prior to the time of cyclone origin.
These initial cyclone location errors are of opposite sign. In the
20-year average it is believed that these initial cyclone origin errors
largely cancel each other and that the statistics shown are representative.
9
I"%j ..... OQ
N
I"%j ... Q'Q . W .
--l
40-
2.(]"
a-
2QO
40- I -,-, xVI 40° ~~>r
tml!£
.,. ~ ~' ~ 40- ~~~~~~~~~~~~~~~~~~~~~ J~~~r • 3Ql' «1"
'lJ1' ,~" '"''"'" :;""~~""1NC 20- ' .. ~ :611'-~. ~,~~"~~"~ 'lJ1' 6
~ E ··~··a·tl; ~ • ~: . :,:~, ':,' ,' ..• ', -::'. "l: "'::':':':"!~:'::'" 'lJ1' " ~;. '.: '.~: • '.' 20°
4(J' I xV I 40° ,~<~ I «1"
r' o
t-:r:j 1-1'
OQ
~
t-:r:j 1-1-
OQ
~ ..a- fU t!D' 100" 12()- 140" 160· 180" 16()0 140" 120" IO()O 00- fD" 4C1' 'gw C1' 'lD' 6()ON1 . . I I I
~){ I ~v ~~ I
~ I I I
I ~16()ON
JUL - AUG - SEP '1fi V 1. " CYCLONE ORIGIN LOCATIONSF
40"1 #J 40° w.~r ~4C1'
~.r: ~i,rs:':d 20° ' .. 'lD'
==:w;"~~- .... = ~. . ~.: ... ' -:. ~~::'~~g: :~~ :; > '.' .. C1' Eq C1'
:~~ ~ ~I 20· 'lD'
9JO
~iF 1«1' I 40°
'<1
~ 6O"N
«>- ~ A...r., , " 4QO ~<"<"<"<"~~~~<"«<<"<"~~<w: I~~f4" I ~1 «1'
..,. • .,. 20° '.. 'lI1'
V1 ••• ; •••• ~:,~:.: •• ~~:::.;.::::: •• : •• \ .e l :~£ .:.: ::;- ~:l :.: ::.: -:.: ~.
~ ~ C1'
'lJJ8 20" 20"
«1' I -, --, LVI 4QO H~)g:= I «1'
I-'" .......

4f? ~--------------~----------------------~--------~----------'L~~~F41----40° 6SSS6F= I ~

13
Table 2
Number of Cyclone Genesis Cases per 20 Years and 1 Year by Season and
by Genesis Area. Percentage of Genesis by Season and Area Also Shown.
No. per 20 Year No per .
Jan-tiar Apr-Jtm Jul-Sept Oct-Dec Regional Year Percent
N. Atlantic 0 11 169 54 234/12% 'V12 & West Indies
Eastern 0 38 154 36 228/11% 'VII Pacific
Western 29 81 234 249 593/30% 'V30 N. Pacific
North Indian 6 66 116 99 287/15% 'V14 Ocean
South Indian 171 24 0 79 274/14% 'V14 Ocean
North & West 117 15 0 12 144/7% 'V 7 Australia
South 126 46 0 41 213/11% 'VII Pacific
No. per 449 281 673 570 1973 99 20 Year
Seasonal 23% 14% 34% 29% 100% Percent
No. per "'22 'V14 'V34 'V29 99 Year

14
It is to be noted that:
1. o Cyclones do not form within 4-5 of the equator. Genesis is
especially favored in the latitude belts of 5-150 (see Fig. 8).
Genesis does not occur poleward of 220 latitude in the
Southern Hemisphere. In the Northern Hemisphere genesis
occurs at latitudes as high as ~ 350•
2. Two-thirds of all cyclones form in the Eastern Hemisphere.
(see Fig. 9). Regions centered around 900 E, l400 E and 1050 W
longitude are especially favored for genesis.
3. Although the majority of tropical cyclones form in the summer,
genesis is possible in all seasons in the Western North Pacific.
This region has nearly one-third of all the globe's tropical
cyclones.
4. There are two seasons per year of cyclone formation in the
North Indian Ocean between 5-150 latitude.
5. The Southeast Pacific and South Atlantic are devoid of
cyclones.
6. Cyclone genesis is especially favored near the usual location
of the ITCZ (Sadler, 1967a; Fett, 1968).
As previously discussed (Gray, 1968) about 80-85 percent of the
tropical cyclones originate in or just on the poleward side of the
Inter-Tropical Convergence Zone (ITCZ). Most of the remainder (~ 15
percent) form in the trade winds at a considerable distance from the
ITCZ but usually in association with an upper tropospheric trough to
their northwest (Sadler, 1967a, 1967b, 1974a). A few hybrid-type of warm-
core cyclone systems (~ 1-2 percent) develop in sub-tropical latitudes
along stagnant frontal zones. This latter type of cyclone is very

15
400 u5 0:: >-0
300 C\J
0:: W a... ~ « 200 -1
~ 0:: W a... 100 c5 Z
o
4,0 ~o I Eq
SOUTH LATITUDE
Fig. 8. Seasonal and annual distribution of tropical cyclone origin by latitude.
atypical and not part of the discussion of this paper. The author's
previous paper (op.cit.) has more statistical information on cyclone
genesis.

16
I I I
~~ ~-M~ gooW
I I
(/) I 0:: « I w >-
~~ gooE 180° 900 W
@
~ I
APR-~
~ a:: w 0-
W I 0 ::l 40 900 E 1000 9(?W t- I (!) I z g 20 A-SEP
th a:: ~ 0 Z 0
t: 180° 900 W
~ OCT-DEC I :::E 0:: f( W
~ b
60
~ 40 AN\IUAL d Z
20
0 I I I I ~o r I I I
roo 600 100° 140° 140° 100° 60° 20°
EAST LONGITUDE WEST LONGITUDE
Fig. 9. Seasonal and annual distribution of tropical cyclone origin by longitude.

3. PHYSICAL REQUIREMENTS OF CYCLONE GENESIS
Over broad areas of the tropics where cyclones form, horizontal
temperature gradients are practically non-existent. To understand tro-
pical cyclone genesis one must understand how the tropical disturbance
2 or tropical cloud cluster is occasionally able to induce an upper tro-
posphere enthalpy increase and then concentrate this enthalpy increase
over a small area of ~ 200-300 km width. This upper tropospheric en-
thalpy increase (or warming) produces thickness increase and (with the
top of the system near 100 rob) small surface pressure decreases. Obser-
vations of early cyclone development show that this required enthalpy
increase first takes place in the layers between 500-300 mb (Lopez, 1968;
Yanai, 1961, 1963; Zipser, 1964) and is of the typical magnitude in-
dicated in Fig. 10. This upper-tropospheric enthalpy increase is lacking
in disturbances which do not develop into cyclones. It appears that the
primary question of genesis rests with understanding how this upper tro-
pospheric enthalpy increase (or warming) occurs and how it is concentra-
ted and accumulated over the westward moving disturbance. This initial
concentrated warming typically occurs on the side of the cloud cluster
(LaSeur, 1962; Fett, 1964; Lopez, 1968), not at its center.
Enthalpy Increase through Release of Latent Heat. As has been pre-
viously discussed by Lopez (1973a), Gray (1973) and Yanai et al. (1973),
precipitating cumulus clouds do not directly warm the immediate environ-
ment in which they exist. In fact, it appears that cumulus convection
cools the area directly around the clouds by evaporation of liquid water
2In this paper the terms 'disturbance' and 'cloud cluster' (defined in GARP conference, 1968) are used synonymously. These clusters may be considered as being the 'pre-existing' disturbance from which Riehl (1954) states all tropical cyclones develop.
17

18
as the clouds die and mix with their environment. Cloud re-evaporation
of liquid water is especially large in the lower troposphere.
Cumulus condensation heat goes primarily into potential energy
which is exported to the regions surrounding the cumulus. Some of the
compensating sinking motion for the cumulus comes in the environment not
far removed from the cumulus. Other portions of this compensating
sinking occur in the surrounding clear regions and/or in the distant
anticyclones where the adiabatic sinking balances the atmosphere's ra-
diational losses. For the upper tropospheric enthalpy in or near the
disturbance to increase, it is necessary that a portion of the mass
compensation for the upward cumulonimbus (Cb) transport occur in
the local environment. In addition, it is necessary that this sinking-
warming not be totally lost through the horizontal energy dispersion
processes of ventilation and divergence.
WARMING (Oe)
Fig. 10. Vertical distribution of the typical warming which is required to form a tropical cyclone.

19
This upper tropospheric warming can only be produced as a consequence
of the compressional sinking motion of the downward return flow of the Cb
convection. Because the gradient of potential temperature (0) with pres-
sure in the tropical cloud cluster is nearly linear (see Fig. 11), equal
amounts of mass subsidence at any pressure level produce equal increases
of enthalpy. The vertical variation of specific humidity (q) with pressure
within the typical cloud cluster is not linear, however. Equal units of
mass subsidence produce greater drying in the lower troposphere. If this
vapor loss due to sinking drying is entirely replaced by evaporation of
liquid water, then a vertical variation in net tropospheric warming re-
suIts. Assuming 100 mb/day sinking motion at all levels, Fig. 12 por-
trays the vertical distribution of net warming (curves Wand C) which
would result from a combination of sinking warming (curve W) and evap-
orational cooling (curve C). The sinking-warming is larger than the
2
3
~ E 4
N
Q 5 w
~ 6 ~ w 7 ~
8
9
0 I I I I ~ 320 340 ~o oK
I i I gm/Kg 0 Q 20
Fig. 11. Vertical distribution of potential temperature (0) and specific humidity (q) which is present in the typical tropical cloud cluster.

20
.p ~ 2 ctY~
'1) 3 0 ! E ~~.
Q 4
~ <$ w 5 f.-
~ 6 ~~ ~ 6)
(J) 7 ~~ ! w ~«)
~ 8# 9~
10
I I I I I b I i J I ·10 -8 -6 -4 -2 2 4 6 8
TEMP. CHANGE (OC) PEA 100mb SINKING
Fig. 12. Portrayal of the sinking warming (W) and evaporational cooling (C) which would result from IOn rob sinking and if the resulting sinking drying were totally made up for by evaporation. The W + C curve is an addition of the two curves.
required evaporational cooling in the upper troposphere. In the lower
troposphere, however, evaporational cooling is dominant. Thus, one
should not be surprised that the middle and upper troposphere are the
favored levels for Cb induced enthalpy increase.
Some of the cloud cluster's enthalpy gain relative to its surround-
ings is due to the reduced net radiation loss of the cluster produced by
its extensive layered cloud structure. This inhibits cluster long wave
radiational loss (Cox, 1968, 1971, 1973). Although radiation is an
important influence in distinguishing between the energy budget of the
cloud cluster and its environment, it cannot be (because of their similar
layered cloud structure) invoked as a primary factor in distinguishing
between clusters which grow into cyclones and those which do not.
Cloud Cluster Characteristics. A significant portion of the mass
transported upward by cumulus in a typical tropical cloud cluster does
not leave the cluster but rather sinks locally within the cluster. This
up-moist and down-dry recycling circulation is typical of most tropical

21
cloud clusters. Figure 13 portrays the typical 40 cloud cluster average
up-moist (wm) and down-dry (wd) vertical circulation which is required for
moisture and energy balance. W portrays the upward mean cluster circu1a-
tion. See the reports by Gray (1973), Ruprecht and Gray (1974) and Lopez
(1973a) for more discussion of this cloud cluster vertical circulation.
At lower levels the magnitude of this vertical recycling circulation
(Wm and wd) is substantially larger than that of the mean upward circula
tion. This vertical mass recycling pattern is typical of both the pre-
cyclone and the non-developing cloud clusters.
As previously discussed by the author (op.cit., 1973) the vapor re-
placement for the cloud cluster sinking drying motion does not all come
from evaporational cooling. Much of the vapor replacement for this sink-
iug drying comes from direct vapor transport from the cumulus as they
mix with their environment and as they die. Figure 14 shows the vertical
variation of the required vapor replacement of the typical 40 cloud c1us-
ter and the parts of this sinking drying made up by evaporation and
direct vapor diffusion from the cumulus.. Most of the vapor replacement
in the lower levels comes from direct transfer from the cumulus.
Fig .. 13.
2
~ :3
g 4
l.IJ 5 0:: ::::> 6 en en 7 l.IJ
e: 8
9
10
I -400
i -200
j
o
(J(mb/DAY)
I 200
I 400
Up-moist, down-dry and mean mass circulatton occurring in the typical 40 tropical cloud cluster.

Fig. 14.
22
2
t 3
g 4
~ 5
6 (f) 7
~ 8
9
10
i I i i i 0 4 8 12 16
gnlKg PER DAY
Vertical distribution of required rate of water vapor replacement in the typical 40 wide cloud cluster to keep the cluster vapor content constant with the sinking drying motion as specified in Fig. 13. That portion of the vapor replacement accomplished by evaporation and that portion by direct transfer from cumulus clouds is also shown.
o Figure 15 contrasts the 4 divergence pattern (see Williams and
Gray, 1973) of the pre-cyclone cloud cluster and the non-developing cloud
cluster. Note that these divergence patterns are very similar. The
magnitude of their up-moist and down-dry vertical recycling circulations
are also very similar. To explain the differences in cloud cluster
cyclone genesis potential, one must look to other distinguishing cloud
cluster features besides the mean divergence and vertical mass recycling
fields. Cloud cluster rainfall is not well correlated with cluster cy-
clone genesis potential. Clusters which produce massive amounts of rain-
fall often do not form into cyclones, while other clusters with lesser
amounts of precipitation do.
Nature of the Cloud Cluster's Upper Tropospheric Warming. Figure
16 portrays the hypothesized warming and cooling processes which are
acting in the typical 40 pre-cyclone and non-developing cloud clusters
in the absence of any horizontal energy advection or dispersion pro-
cesses. There is no difference in the net vertical divergence of energy

I
2
:g :3
g
~ 5
6
~ 7
8
9
10 i i
-I() -5
23
AlEfW£ f«)N-[£VEt..CPN; a...0lD a...usTER
i o i 5
IlVERCENCE (lO"'sec-I)
i I 15 20
Fig. 15. Comparison of the vertical distribution of the average divergence occurring in the 40 wide pre-cyclone cloud cluster with
o the 4 wide non-developing cloud cluster.
2
:c 3 E g 4 w
5 0::: :::> en en 6 w 8: 7
8
9
10
~
I I I I j I i -12 -8 -4 0 4 8 12
RATE OF TEWPERATURE CHANGE (OC/~y)
rt)
l.. (J) LLI > ~ l5 t-
~
I I i -2 0 2
NET RATE OF TEMP. CHANGE
(oC/~Y)
Fig. 16. Vertical distribution of typical 40 wide cloud cluster rate of temperature change due to sinking warming, evaporation cooling, and radiation (left) and the residual of these heating mechanisms (right).

24
flux between these two systems. As shown on the right diagram of this
figure~ a small net accumulation of enthalpy is taking place in the
upper troposphere of both systems. At upper levels the sinking warming
(curve 1) is slightly greater than the sum of the evaporational (2) and
radiational cooling (3) curves. This enthalpy gain~ however~ will not
lead to cyclone genesis if the cluster's upper level horizontal energy
dispersion processes are very large. This is the usual situation. En
thalpy gain is usually cancelled out by horizontal dispersion and cluster
growth to a cyclone does not occur. Thus, the primary determinant for
cluster growth appears not to be the existence of an upper tropospheric
cluster heating source but rather the presence of environmental conditions
which allow the accumulation of this energy.
Cyclone Genesis Hypothesis. The author believes that the primary
determinant for cloud cluster growth to cyclone strength rests with the
characteristics of the upper tropospheric energy dispersion processes.
Only rarely do the upper level wind conditions relative to a moving cloud
cluster act to inhibit horizontal dispersion of energy and thereby allow
an upper level enthalpy accumulation within a moving system.
By horizontal energy dispersion the author means: 1) divergence,
and 2) advection or ventilation. As the divergence profiles of the pre
cyclone and non-developing cloud clusters (Fig. 15) are about the same,
the horizontal energy losses from divergence cannot be a distinguishing
feature of cluster growth. In addition, the magnitudes of the cluster
divergences between 300-500 rob where the major warming occurs are not
1arge~ being near zero around 400 mb. Thus, the horizontal energy losses
due to divergence are not felt to be the primary distinguishing factor to

25
growth. Cloud cluster upper level advection or ventilation appears, on
the other hand, to be fundamental in specifying cluster cyclone formation
potential.
Cluster Ventilation. As previously discussed, over 85% of all tro-
pical cyclones form within or just on the poleward side of a Doldrum
Equatorial Trough or ITCZ. As shown in the north-south vertical cross-
section of zonal wind in Fig. 17, this is an especially favorable place
(location C) for small tropospheric vertical wind shear (also see third
profile from the left of the lower diagram) and for 200-500 mb wind and
cloud cluster velocity to be very stmilar. Designators A, Band D cor
respond to the typical locations of Monsoon, GATE3 and trade wind cloud
clusters relative to the Doldrum Equatorial Trough. These locations
are places where the cluster 200-500 mb wind typically blows at a velocity
considerably different than that of the cluster itself. Thus, the ven-
tilation, or blow-through component of the zonal wind past these clusters
is typically large. The lower diagram of this figure shows the typical
vertical shear of the zonal wind (U) and the vertical distribution of
the zonal wind component (U - Ud) relative to the typical moving (Ud)
cloud cluster at these four locations. Most oceanic cloud clusters
move at velocities of 6-8 m/sec (Chang, 1970; Wallace, 1970). All ex-
cept the monsoon clusters move toward the west. The horizontal energy
dispersion rates or ventilation rates between 200-500 mb for profiles
A, Band D are much greater than for profile C.
In all but the pre-cyclone clusters the environmental air between
200-500 rob is blowing through the cluster in a time interval of but
3GARP Atlantic Tropical Experiment conducted off West Africa between June and September in 1974.

o
2
4
6
8
10
Eq.
I I
t wr.ps
I
26
i IO"N
lATITlOE
I ,. I I E
WN)S I I
t 2O"N
o TRADE WN)
CLUSTER
i+ o
Fig. 17. North-south cross-sections of the typical locations of various classes of tropical cloud clusters relative to the doldrum equatorial trough and the usual zonal winds present with these systems (top diagram). The bottom diagram portrays the vertical distribution of typical zonal wind velocity (U) occurring with different A to D types of cloud clusters whose general location is specified in the top diagram. The usual zonal cluster velocity is designated Ud and the difference in cloud cluster and environmental wind velocity at any level is given by (U - Ud).

27
10-20 hours. The cloud cluster induced warming (Fig. 10) which is
occurring is advected or ventilated out of the cluster. An upper level
energy accumulation cannot occur. In the pre-cyclone cluster, on the
other hand, the 200-500 mb motion of the air is very close to that of
the cloud cluster motion and upper level energy accumulation can occur.
In general, it is only cloud clusters with this type of vertical wind
profile which produce tropical cyclones. Figure 18 shows the vertical
profile of the average zonal wind in the Western North Pacific pre
cyclone and non-developing cloud clusters. Note that the 200-500 mb
zonal wind for the pre-cyclone clusters is very close to the westward
velocity of the cloud cluster (data from Williams and Gray, 1973).
Once a closed circulation has been formed in the 200-500 mb levels,
the direct flow of air or ventilation through the cluster is stopped.
The enthalpy increase within the upper levels can be contained and con
centrated. Cyclone intensification should, and in most cases does follow.
Table 3 compares the vorticity, central pressure decrease for gra
dient wind balance, and the central 200-500 rob mean temperature increases
of four cluster systems of different intensity. Note the very much
higher vorticity, central pressure drop, and 200-500 rob core warming of .
the weak cyclone in comparison with the typical cloud cluster and how
little upper tropospheric central warming (i.e. lOC) is required for
initial cyclone genesis. The typical cloud cluster possesses almost no
upper tropospheric warming or surface pressure decrease.
Summary. The forming of tropical cyclones whose circulation ex
tends through most of the troposphere is a most difficult task for the
tropical atmosphere to perform. It is seldom accomplished. The crucial
problem in understanding cyclone genesis processes is that of

28
Table 3
Comparison of Inner 200 km Radius Parameter Averages of Cluster Systems of
Various Intensity
Average 40 Wide Cloud Cluster
Pre-Cyclone Cluster at Beginning of Genesis
Weak Tropical Cyclone Typical of Initial Condition Assumed by Hurricane Genesis Modelers ('V Maximum Winds of 10 m/sec at 200 km Radius)
Usual Developed Hurricane (Winds of 30 m/sec at 200 km Radius)
Average Vorticity in Lower Troposphere
-6 -1 10 sec
10
15
100
300
Minimum Pressure Decrease at Cluster Center to Satisfy Gradient Wind Balance
mb
0 .. 2
0.3
2.5
50 .. 0
200-500 mb Relative Warming at Cluster Center
0.1
0.1
1.0
'VIS. 0

29
understanding how the 200-500 rob levels can increase their enthalpy.
It appears that this can be accomplished only if the upper tropospheric
environmental winds and the disturbance from which the cyclone forms
move with very much the same direction and velocity.
I
-:G' 2
NE 3 ---Pre-cyclone cluster
g 4
1&1 5 - - - - Non-devefoping cluster
a: o 0 0 0 0 0 Cluster motion ~ 6 en en 7 1&1 a: 8 Go
9 10
iii i -10 -S 0 10
u(m/s)
Fig. 18. Vertical variation of the zonal wind velocity in the western North Pacific cloud clusters between 5-20oN latitude and the typical westward propagation of these cloud clusters. Note that the 200-500 rob zonal velocity of the pre-cyclone cluster is very close to that of the cluster westerly movement.

4. SIX PRIMARY GENESIS PARAMETERS
The author (Gray, 1968) has previously discussed the important
role which large magnitude low level relative vorticity and small mag-
nitude vertical shear of the horizontal wind play in determining regions
of high tropical cyclone genesis frequency. Genesis also requires other
favorable conditions to be present. A number of authors (Riehl, 1954,
and much personal communication, 1957-1962; Fisher, 1958; Malkus and
Riehl, 1960; Miller, 1964; Leipper, 1967; Perlroth, 1967, 1969; Leipper
and Volgenau, 1972) have previously discussed the very important role
which sea surface temperature and high magnitude ocean thermal energy
play in tropical cyclone existence. The necessary role of thermal
buoyancy from the surface to middle levels for Cb convection has been
discussed by Palmen (1948, 1957) and a number of other researchers.
Other authors such as Dunn (1940, 1951) have observed the lack of tro-
pical cyclone development near the equator and have hypothesized the im-
portance of the earth's rotation in the genesis process.
In addition to these important genesis requirements the author has
also observed the high frequency of cyclone genesis in regions where
the seasonal values of middle level humidity are high (to be discussed).
The author believes that seasonal tropical cyclone frequency can
be directly related to a combination of six physical parameters which
will henceforth be referred to as primary genesis parameters. These
parameters are:
1. Low level relative vorticity (~) r
2. Coriolis Parameter (f)
3. The inverse of the vertical shear (Sz) of the horizontal wind between the lower and upper troposphere or 1/5 • z
30
31
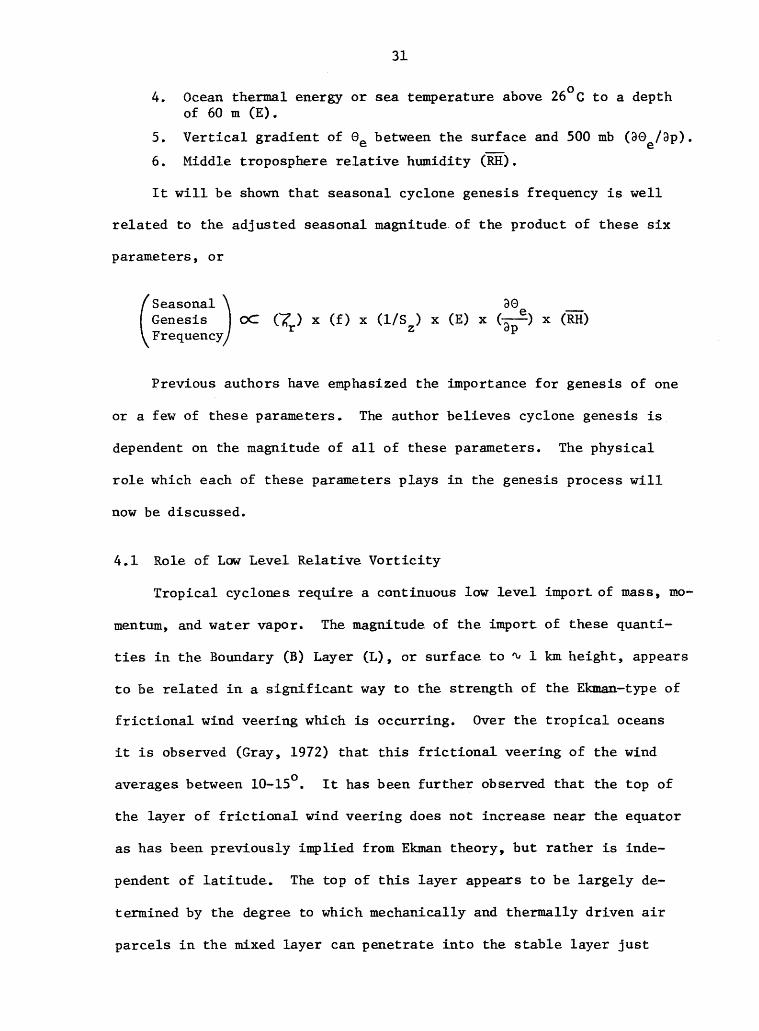
4. o Ocean thermal energy or sea temperature above 26 C to a depth of 60 m (E).
5.
6.
Vertical gradient of 0e between the surface and 500 mb (a6e /ap).
Middle troposphere relative humidity (RH).
It will be shown that seasonal cyclone genesis frequency is well
related to the adjusted seasonal magnitude. of the product of these six
parameters, or
(
seaSonal) Genesis Frequency
(RR)
Previous authors have emphasized the importance for genesis of one
or a few of these parameters. The author believes cyclone genesis is
dependent on the magnitude of all of these parameters. The physical
role which each of these parameters plays in the genesis process will
now be discussed.
4.1 Role of Low Level Relative Vorticity
Tropical cyclones require a continuous low level import. of m.ass, 00-
mentum, and water vapor. The magnitude of the import of these quanti-
ties in the Boundary (B) Layer (L), or surface to ~ 1 km height, appears
to be related in a significant way to the strength of the Ekman-type of
frictional wind veering which is occurring. Over the tropical oceans
it is observed (Gray, 1972) that this frictional veering of the wind
o averages between 10-15. It has been further observed that the top of
the layer of frictional wind veering does not increase near the equator
as has been previously implied from Ekman theory, but rather is inde-
pendent of latitude. The top of this layer appears to be largely de-
termined by the degree to which mechanically and thermally driven air
parcels in the mixed layer can penetrate into the stable layer just

32
above. Over the tropical oceans the top of the veering level averages
about 1-1.5 km while the top of the mixed layer is about 0.5 km.
Figures 19 and 20 portray vertical differences of observed oceanic
wind veering and ageostrophic wind component vs. latitude from 5 km height
to the surface. Note that most of the change in wind direction and
component of the wind relative to the 5 km level occurs in the lowest km.
The wind component perpendicular to the 5 km level wind is assumed to be
the ageostrophic wind component or V. In a very large average like this a
WIND VEERING RELATIVE TO THE 5 km WIND
No. of Obs. I 427 I 5168 I 8011 124,390 117.438144321 324 I
Eq.
Fig. 19. Latitudinal distribution of the average of upper level oceanic wind direction veering at various levels relative to the 5 km average wind direction. The number of rawin and pibal observations in each latitude belt is shown at the bottom.

1.6
1.2
0.8 m/sec
0.4
-0.4
Eq.
427
33
WIND COMPONENT .l TO THE 5 km WIND
No. of Obs.
10· 20· 300 40· 500 600 P LATITUDE
Fig. 20. ~atitudinal distribution of the average of upper level oceanic wind components perpendicular to the average 5 km wind.
the thermal wind component is negligible (see Gray, op.cit. for more
discussion) and there should then be no appreciable vertical variation
in pressure gradient with height. The height of the top of this wind
veering (~ l-l~ km) does not change with latitude.
Figure 21 is a vertical profile of average wind direction changes
and average wind components relative to the 5 km level for all ship upper
wind data between the equator and 170 latitude. First km frictional
veering is about 10-120• The Boundary Layer (B.L.) over the tropical
oceans will thus be taken to be ~ l-l~ km thick. Although local 1-5
hour variations in the height of the B.L. with individual rain shower
systems is very large and much beyond the range shown here, the cloud

34
5 ALL SHIP DATA (4227Cases) Eq. - 170 Lot.
600 Veering Angle ( a ) and 4 Wind Component ( voJ
J. to 5 km Wind
3 700 Ht.
(km) (mb)
2 800
900
0.5
Sfc 1000
2.0 Va (m /sec)
1.0 0 -LO I I I I I I
20· 15· 10· 5· 0 -5· -10· a - Degrees
Fig. 21. Vertical profile of the changes of ship rawin and pibal determined upper level wind veering and wind components perpendicular to the 5 km level wind.
cluster scale average veerings and ageostrophic frictional wind components
are believed to be characteristic of those shown in these figures.
The average of the first km cross-isobaric or ageostrophic wind
velocity (V ) is about 15 percent of the average B.L. total wind or a
(V t) • Thus :. Va .,::$ 1/7 V t ' or in terms of the zonal (u) and meridional
(v) wind components
u = - 1/7 v a
v = 1/7 ~ a
(1)

35
Thus, the B.L. frictional convergence can be directly related to the
B.L. average relative vorticity (If r) as
(BeL. Frictional) =
Convergence (2)
This type of frictionally driven convergence has been discussed by
Charney and Eliassen (1949, 1964) and has been employed by many of the
numerical modelers in simulating tropical cyclone growth. The associa-
tion of surrounding low level vorticity with tropical cyclone frequency
and cyclone dissipation over tropical water has also been discussed in
project reports by Sartor (1968) and Wachtmann (1968).
Significance of Frictional Convergence. It is observed that the
actual B.L. convergence in the pre-cyclone cloud cluster is not 15 per-
cent of the cluster's relative vorticity but rather 40-50 percent (see
Williams and Gray, 1973). Thus, the direct frictionally induced con-
vergence contributes only a quarter to a third of the net B.L. cluster
convergence. Of what importance, then, is this frictional convergence?
The author believes that the frictional convergence acts as the
required 'pump primer' for extra non-frictional cumulus and Cb induced
convergence. The frictional convergence insures that a continual supply
of mass, momentum, and water vapor be provided at low levels to bring
about and maintain cumulus convection which feeds back and adds more
to the B.L. and upper level convergence. Were the B.L. frictional con-
vergence not present, the extra convergence from the cumulus
probably could not be maintained. The B.L. frictional convergence is
thus viewed as a necessary ingredient for extra cumulus induced
convergence.

36
Vorticity and theCISK4 GettesiSHypothesiS. It is obvious from
the above discussion and the previous discussion on the 40 wide cluster
vertical mass recycling that the boundary layer induced convergence
from frictional wind veering plays only a small direct role in main-
tenance of the tropical cluster's lower tropospheric mass profile. The
mass recycling profile of Fig. 13 shows how much extra mass is going
into and leaving the boundary layer beyond what can be specified by the
mean convergence profile of Fig. 15. The convergence above cloud base
feeds mainly into cumulus downdrafts which penetrate into the B.L. and
produce the extra B.L. mass convergence necessary to force updrafts of
1-3 m/sec over 1-3 percent of the cluster area. The mean B.L. mass
convergence is far too weak to produce updrafts of this number and
magnitude by itself. Nevertheless, this does not negate the fundamen-
tal role of the B.L. frictional convergence mechanism. The B.L. fric-
tional mechanism should be viewed not as a direct cumulus-producing
process, for in this it is obviously too weak, but instead as a required
ingredient for extra cumulus feedback response.
It is well observed that tropical cyclones form only in regions
of large positive low level vorticity. The larger this low level
vorticity, the greater appears the potential for cyclone genesis.
Conclusion. Other conditions being favorable and remaining con-
stant, tropical cyclone genesis should be directly related to the
magnitude of low level tropospheric relative vorticity.
4 Conditional Instability of the Second Kind as defined by Charney and
Eliassen (1964).

37
4.2 Role of Earth's Rotation (i.e. Coriolis Parameter)
Cyclones do not form within 4_50 of the equator. The influence of
the earth's rotation would thus appear to be of primary importance. A
number of previous researchers have stressed this relationship. Except
for places where strong meridional flow and import of momentum from
higher latitudes is occurring, winds on the equator are very weak. Geo-
strophic considerations dictate that pressure gradients near the equator
be very weak.
Near the equator it is impossible to sustain a balance between cross-
isobaric momentum acceleration and the planetary Boundary Layer (B.L.)
frictional momentum loss when winds are higher than 3-5 m/sec. Assuming
geostrophic conditions above the B.L., the ratio of the magnitude of B.L.
kinetic energy generation (f V V) to frictional disSipation (V aLxz) g a gpa;-
can be written as
where
f
p
L xz
f V V g a - aT v xz
g paz
is the geostrophic wind velocity in the B.L.
is the average ageostrophic or cross-isobaric wind velocity through the B.L.
is the Corio lis parameter
is density, assumed constant through the B.L.
is the usual stress representation in the B.L.
(3)
To keep the above ratio equal to one at low latitudes, only very
small B.L. wind speeds are permitted. This is because dissipation is
independent of f.. B.L. momentum generation, on the other hand, is
directly related to the pressure gradient which, except in highly
curved flow, is a function of the Coriolis parameter.

38
Assuming the surface stress, L , is given by the usual formula xz 2 0 -3
CD p Vs (where CD is a drag coefficient of the magnitude 1.3 x 10 ,
p is density, and Vs is the wind at 10 m height or ship deck level) and
that this stress approaches zero at 1 kIn height (i.e., AZ = 1 km -
consistent with previous discussion), we can obtain an expression for
the ratio of the momentum generation to the momentum dissipation, thus
f V V g a
V aT xz
g- paz
= f V
a C v2 D s az
Assuming that V through the boundary layer averages 1/7 Vs (see a
previous section) we obtain the final ratio
=
where K is a constant.
For this expression to be constant V must be very small s
(4)
near the equator. The bottom curve of Fig. 22 shows the latitude
variation of maximum V or V which is possible for B'.L. momentum s.
maintenance when no momentum importation from higher levels or
horizontal advection is allowed. These winds are very weak indeed.
Even when the pressure gradient acceleration (-aVP) due to flow cur-
vature is allowed for, maintenance of high wind speeds near the equator
is not possible without importation of momentum. Figure 22 also shows
curves of maximum B.L. wind speeds vs. latitude which can be sustained
for pressure gradients equivalent to various ratios of gradient wind
to geostrophic wind. Even when pressure gradients equivalent to
curvature acceleration of 5 to 10 times that of geostrophic acceleration
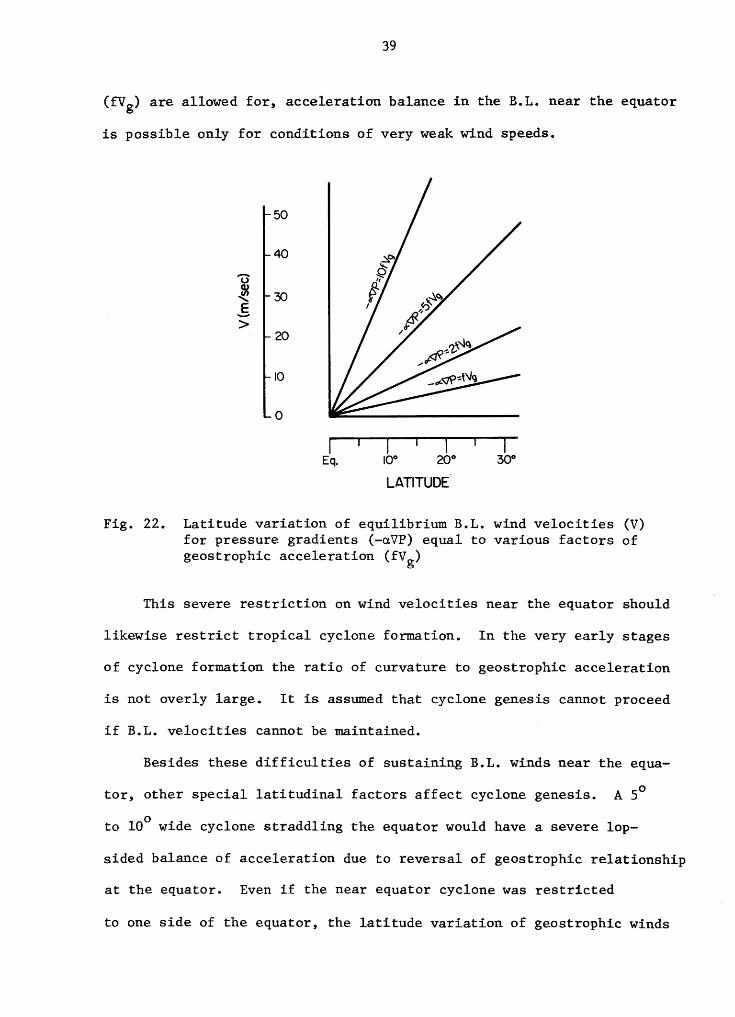
39
CfVg} are allowed for, acceleration balance in the B.L. near the equator
is possible only for conditions of very weak wind speeds.
50
40
> 20
10
o
I Eq.
LATITUDE
Fig. 22. Latitude variation of equilibrium B.L. wind velocities (V) for pressure gradients (-aVP) equal to various factors of geostrophic acceleration (fVg)
This severe restriction on wind velocities near the equator should
likewise restrict tropical cyclone formation. In the very early stages
of cyclone formation the ratio of curvature to geostrophic acceleration
is not overly large. It is assumed that cyclone genesis cannot proceed
if B.L. velocities cannot be maintained.
Besides these difficulties of sustaining B.L. winds near the equa-
tor, other special latitudinal factors affect cyclone genesis. A SO
to 100 wide cyclone straddling the equator would have a severe lop-
sided balance of acceleration due to reversal of geostrophic relationship
at the equator. Even if the near equator cyclone was restricted
to one side of the equator, the latitude variation of geostrophic winds

40
would, in the early stages of cyclone growth, create a large latitudinal
imbalance of accelerations.
Conclusion. Boundary Layer dissipation is independent of latitude.
Momentum generation, on the other hand, is latitude related. Cyclone
intensification cannot occur if B.L. winds cannot be maintained. Other
conditions b~ing favorable and remaining constant, tropical cyclone
genesis should be directly related to the strength of the Corio lis
parameter.
4.3 Role of Tropospheric Vertical Wind Shear and Upper Level Ventilation.
As previously discussed by the author (Gray, 1968) the observation
al evidence clearly shows that tropical cyclones form under conditions
of minimum vertical shear of the horizontal wind between the lower and
upper troposphere. Because the primary cloud cluster enthalpy gain for
cyclogenesis comes between the 200 and 500 mb levels, it is the hori
zontal winds at the upper levels which are most important in determining
whether a cloud cluster will be able to accumulate enthalpy. As shown
in Fig. 17 the individual level cluster winds ( V) may be quite differ
ent than that of the cluster or disturbance velocity( Vd). The magni
tude of ( V - Vd) determines the extent to which the cumulus induced
upper level warming is advected, or ventilated away from the disturbance.
If this cloud cluster relative motion is small as in the third diagram
from the left of Fig. 17, an upper level enthalpy increase can occur.
This will lead to gradual surface pressure decreases and cyclone forma
tion. Once a cyclone has formed, the environmental motion relative to
the system becomes very small and further enthalpy gain can be readily
accomplished. If, however, the upper tropospheric flow relative to the

41
motion of the disturbance is large as is shown in the other three pro-
files of Fig. 17~ then 200-500 mb ventilation of enthalpy out of the
cluster is too rapid to permit concentration and accumulation. Pres-
sure falls will not occur.
Disturbance Ventilation and Enthalpy Accumulation. Let Iv - Vdl p
represent the flow of the environmental wind through the cloud cluster
at any level p. This is a measure of the non-divergent advection or
ventilation of the disturbance. Enthalpy accumulation is a function
of Iv - Vdl p and the diameter (D) of the cluster heating function.
Cluster mean ventilation (Ven.) at any level p may be expressed as
(5)
and the Heating Retention Factor (H.R.F.) due to ventilation at any
level p as
(H.R.F.) = p (6)
where ~t represents the interval of time over which the calculation
is made. Stability of calculations require that ( V - vdl6t / 2D be
leas than 1/2. This factor varies from 0 to 1.
Let Hp be the rate of sensible temperature accumulation ~~ at
any pressure level p in the cluster due to warming processes or the
cluster heating function. The net temperature accumulation with time
from t to t at any level is represented by T - T and is given by o x x 0

where
42
t=t (T - T ) L x
(H) (H.R.F.) bot = x 0 p t=t p p
0
[1 _ (I V t=t
(~!7p - Vdl
(T - T ) L x = 2D P x 0 P t=t 0
T = the final temoerature at time t x ... x
T o = the initial temperature at time t
o
or (7)
~t) ] b.t
By assuming various values H, D, and I V - Vd l one can calculate
typical rates of enthalpy accumulation and see how these are related
to D and Iv - V d I· Table 4 portrays how various values of I V - V d I and D influence the accumulation of enthalpy at an individual level
over a period of three days if the heating function (H) is assumed to p
o be 1 C/day over the whole period. Note the large influence which ven-
tilation has on reducing the disturbance enthalpy accumulation. If
the heating occurs over a large area, the inhibiting influence of
Iv - Vdl is much reduced. Compare the temperature increase in
Table 4 for heating widths of 100 and 250 km with the temperature
increase shown in Fig. 23 for an assumed width of 400 km. Thus, a
cloud cluster with a very narrow heating area (or small value of D)
is much less able to accumulate enthalpy.
If the assumed vertical enthalpy increase or heating rate of
Fig. 10 is applied to clusters with various intensities of ventilation,
the vertical distributions of temperature accumulation for a heating
function of 250 km width are as portrayed in Fig. 24. The left diagram
shows the temperature accumulation which would result if ventilation at
all levels were zero. The center diagram shows the temperature accumu-
lation which results with only weak ventilation and the diagram on the

43
Table 4
Accumulated Temperature Increase (oC) vs. Time for Different Values of
Disturbance I' - Vdl and D and for a Heating Rate of IOC/day. Warming
Values Were Calculated From Eq. 7.
For Disturbance Warming of 100 km Diameter
Time (t)
t 12 Hours 1 Day 2 Days 3 Days 0
0 0 0.5 1.0 2.0 3.0
5 0 0.3 0.4 0.4 0.4
1 0 0 0.1 0.2 0.2 0.2
1 5 0 0.1 0.1 0.1 0.1
For Disturbance Warming of 250 km Diameter
Time (t)
t 12 Hours 1 Day 2 Days 3 Days 0
0 0 0.5 1.0 2.0 3.0
5 0 0.3 0.6 0.8 0.8
10 0 0.2 0.4 0.5 0.5
15 0 0.2 0.3 0.4 0.4
20 0 0.1 0.2 0.2 0.2

Fig. 23.
u ~ 3 w en « w a:: (,)
~ 2 a.= ~ w t-o W
~ ...J :J ~ :J (,) (,)
« o I o
44
DAYS
I 2
I 3
Individual level rate of temperature accumulation in a cloud cluster with a 400 km wide (or D) lOC/day heating function for various magnitudes of I V - Vd l .
right the enthalpy accumulation which results with the usual cloud
cluster. In the first case surface pressure falls of 4-5 mb would
occur in three days. In the second case pressure falls of 1-2 mb occur
after three days. In the third case the surface pressure decrease
after three days is only ~ 0.1 mh. In the first case a cyclone rapidly
forms. In the second case a cyclone slowly forms. This is typical of
the usual genesis situation. No cyclone formation is possible in the
third case. Lopez (1968) has previously analyzed two cloud cluster
cases of cyclone growth and non-growth and indicated differences in
heating rates approximately equivalent to the two cases on the right
of this figure.
Figure 25 portrays the author's idea of the realized heating dif-
ferences between the developing and non-developing cloud cluster. The
differences in realized net warming between the two systems are due
primarily to upper level ventilation differences and not to heating
function differences. Thus, the pre-cyclone cloud cluster and the

45
WITH AVERAGE CLUSTER VENTLATON
2
~ 4 Dt\YS 3 DAYS g
~ 6 en
~ 8
10
i i i i 1 i i i I -I 0 2 1 0 2 -I 0 2
WARMNG(OC)
Fig. 24. Rate of temperature accumulation and resulting surface pressure decreases for 250 km wide cloud clusters with identical heating function of Fig. 10. but with different magnitudes of ventilation.
PRE-CYCLONE
2
~ 3
4 C\I
g 5
~ 6 ~
~ t ~ 7 ~ ti
~ d
~ I-8 z
ti w >
9 ~
10
T'TT I I -I 0 I -I 0
WARfvI\JG (OC)
ClUSTER
I-
~
I I I -I 0 I
I\ET TE~
CHANGE °C
NON-DEVELOANG ClUSTER
I I I I -I 0 -I 0
I I I -I 0 I
I\ET TEMP.
CHANGE °C
Fig. 25. Portrayal of how ventilation differences between cloud clusters can determine the magnitude of upper level warming and whether the cluster will grow into a cyclone or not.

46
usual cloud cluster can have very similar mean divergence profiles (as
in Fig. 15) and similar rainfall rates, but, due to ventilation dif
ferences, their intensification potentials can be very different.
Riehl (personal communications - 1957-1962) has often remarked on th~
lack of direct association of disturbance rainfall and disturbance
intensification potential.
These ventilation differences can, in general, be well represented
by the vertical shear of horizontal wind between the lower and upper
troposphere. The tropical forecast offices in Miami (Simpson, 1971)
and Guam (Atkinson, 1973) are presently using tropospheric vertical
wind shear as a primary factor in forecasting cyclone genesis. Cyclones
do not form when the 950 to 200 mb vertical wind shears are greater than
about 10 m/sec or when the 200-500 mb wind velocities relative to the
cloud cluster motion are larger than about 5 m/sec. Simpson and Riehl
(1958) have earlier commented on the possible importance of middle
tropospheric ventilation as a constraint on hurricane development and
maintenance. Holton (1971) has also indicated a large influence of
vertical shear on the heating pattern of tropical wave disturbances.
Conclusion. Other conditions being favorable and remaining con
stant cyclone genesis potential should be inversely related to the
magnitude of the cloud cluster ventilation between 500 and 200 mb.
This ventilation can be rather accurately expressed in terms of the
vertical shear of the horizontal wind between 950 and 200 mb.
4.4 Role of Ocean Thermal Energy
As previously discussed by Jordan (1964), Landis and Leipper (1968),
Leipper (1967), Leipper and Jensen (1971), Leipper and Volgenau (1972),

47
Heffernan (1972), and Per1roth (1967, 1969), tropical cyclones can have
a profound influence on the temperature of the ocean over which they
travel. The altered ocean temperature, in turn, can feed back and alter
the character of the cyclone.
Leipper and his research group have in4icated that the inner
2 region of the average hurricane consumes about 4000 ca1/cm per day of
ocean sensible and latent heat energy_ In their study of the hurricane
boundary layer Malkus and Riehl (1960) put this value at ~ 3100 cal/cm2
per day over the inner 90 km radius of the storm. Whitaker's (1967)
2 calculations for Hurricane Betsy indicate a value of about 3700 ca1/cm
per day. This large surface energy requirement of the hurricane pre-
cludes its existence over land or over the ocean if these transfers
should somehow be suppressed. Brand (1971) has discussed how typhoons
can weaken when they cross the track of a previous typhoon which has
produced a cooler sea surface temperature due to upwelling. Garstang
(1967) has presented observational evidence on the way in which the
sea transfers sensible and latent heat to the air above it.
The tropical cyclone not only gains energy from the ocean but its
cyclonic wind circulation causes oceanic upwelling near the storm's
center. The wind circulation produces a cyclonic ocean circulation
which is not balanced by an equivalent upward and outward slope of
water surface. The reduced air pressure at the storm's center may even
cause a slight rising of the inner core ocean surface. Oceanic diver-
gence is developed as a consequence. Upwelling occurs within and
around the cyclone center (Black and Mallinger, 1971) as a result of
this oceanic divergence. If the ocean has only shallow warm water,
then a coldwater upwelling will occur and the ocean will not be able

48
to transfer its required energy to the air. Surface air temperature
will decrease. The potential moist instability of the inner cyclone
area will also be much reduced. OtBrien and Reid (1967) and O'Brien
(1967) have provided numerical confirmation of these central hurricane
upwelling physical arguments. Leipper and his research colleagues have
provided observational arguments.
Figure 26 shows the influence of reduced surface air temperature
on surface values of e for a constant relative humidity of 85 percent. e
A very substantial decrease in the e gradient between the surface and e
600 mb is noted for surface temperature decreases of only 2-30 C. Sur-
face temperatures less than 260 C do not permit sufficient thermal
buoyancy to sustain Cb convection. Palm~n (1948, 1957) has earlier
demonstrated a well d~fined cut-off of tropical cyclone activity with
the 26~oC ocean isotherm. Middle tropospheric values of e undergo e
much less daily, seasonal, and geographic variation than do surface ae
e values. Thus, potential moist buoyancy (ap-) between the surface and
middle layers is primarily influenced by the change of sea surface
temperature.
Ocean Thermal Potential. Leipper and Perlroth have indicated that
the influence of hurricanes on the ocean underneath them can extend down
to about 60 meters. Given the well established criteria of surface air
temperature being above 26°C, then following Leipper and Jensen (1971)
and Leipper and Volgenau (1972), an ocean thermal energy potential (E)
in units of calories/cm2 can be defined to be the sum of the ocean
o thermal energy above 26 C down to a depth of 60 meters, or

:a E
N Q -w a: ::> (/) (/) w ~
2
3
4
5
6
7
8
9
10
I 3400
49
I 36QO
I 37QO
Fig. 26. Portrayal of how oceanic surface temperature changes can influence the 0e gradient between the surface and 600 nth under assumed constant surface humidity of 85 percent. Solid arrow portrays the path of undiluted moist ascent from a boundary layer 0e value of 354°K to the level of maximum typhoon outflow.
OCEAN SURFACE Sfc
30
/
TEMPERATURE V& DEPTH Fig. 27. Cross section view of the typical ocean temperature decrease
with depth and how the ocean thermal energy (E) is defined (hatched) following Leipper and Volgenau (1972) as the area to the right of the 260 C isotherm to a depth of 60 meters.


52
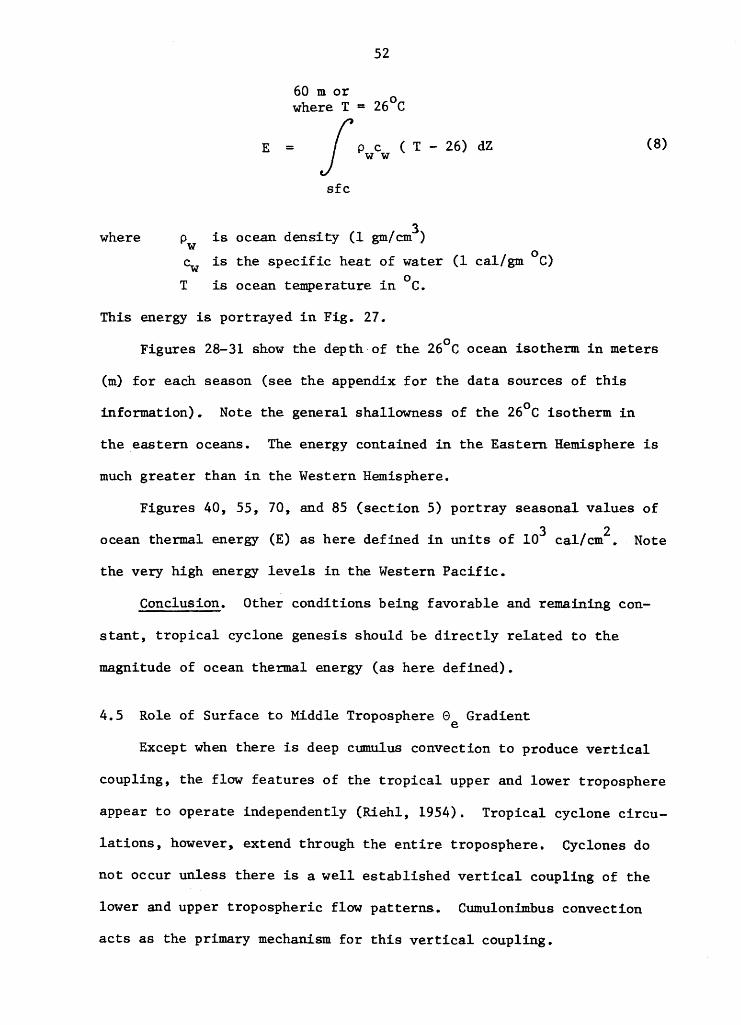
60 m or 0 where T = 26 C
E = I Pwcw ( T - 26) dZ (8)
sfc
where Pw is ocean density (1 gm/cm3) 0
Cw is the specific heat of water (1 cal/gm C)
T is ocean temperature in °C.
This energy is portrayed in Fig. 27.
Figures 28-31 show the depth of the 260 C ocean isotherm in meters
(m) for eaCh season (see the appendix for the data sources of this
information). Note the general shallowness of the 26°C isotherm in
the eastern oceans. The energy contained in the Eastern Hemisphere is
much greater than in the Western Hemisphere.
Figures 40, 55, 70, and 85 (section 5) portray seasonal values of
ocean thermal energy (E) as here defined in units of 103 cal/cm2• Note
the very high energy levels in the Western Pacific.
Conclusion. Other conditions being favorable and remaining con-
stant, tropical cyclone genesis should be directly related to the
magnitude of ocean thermal energy (as here defined).
4.5 Role of Surface to Middle Troposphere e Gradient e
Except when there is deep cumulus convection to produce vertical
coupling, the flow features of the tropical upper and lower troposphere
appear to operate independently (Riehl, 1954). Tropical cyclone circu-
lations, however~ extend through the entire troposphere. Cyclones do
not occur unless there is a well established vertical coupling of the
lower and upper tropospheric flow patterns. Cumulonimbus convection
acts as the primary mechanism for this vertical coupling.

53
Cb convection requires substantial (lOoK or more) decrease of ge
between the boundary layer and the middle troposphere (lowest values of
9 are typically at 600 mb, see Fig. 26). A number of other researchers e
such as Aspliden (1971) have discussed the characteristics of the
(9 - e ) differences over the tropical oceans with different esfc e600mb
types of convection. For convenience and following the author's previous
paper (Gray, 1968) 9 gradients are taken between the surface and 500 mb e
These values typically range between 15-200 K. Figures 41, 56, 71, and
86 give seasonal values of this parameter plus 5 units over all the
oceans. Except in sub-tropical latitudes in winter, the values of this
parameter are usually adequate for cyclone development. Daily para-
meter deviations are small and typically not well related to cyclone
genesis potential.
Conclusion. Other conditions being favorable and remaining con-
stant, cyclone genesis should be directly related to the moist buoyancy
potential or the magnitude of the boundary layer to middle troposphere
difference of 0. This buoyancy is well specified by the 9 difference e e
between the surface and the 500 rob level.
4.6 Role of Middle Troposphere Humidity
It is observed that tropical cyclones fonn only in regions where
the seasonally averaged values of middle level humidity are high.
Cyclones do not form where seasonal values of middle level humidity
are low.
Other factors being equal, an environment of high middle level
humidity is more conducive to deep cumulus convection and greater
vertical coupling of the troposphere than is a dry middle level
environment. High middle level humidity is also conducive to high
cloud precipitation efficiency.

54
It must be remembered that in cyclone genesis situations the oceanic
boundary layer does not experience a diurnal warming cycle as is present
over land and that tropospheric vertical wind shears are small. These
conditions preclude squall line development and intense buoyant up-and
downdraft activity that is possible where large diurnal heating cycles
and strong tropospheric wind shears are present. Although deep and intense
Cb convection occurs over middle latitude land areas in conditions of low
middle level relative humidity, Cb convection does not typically occur
over ocean regions when middle level humidity is less than 50-60 percent.
Over tropical oceans high middle level vapor content appears to be a
strong enhancer rather than an inhibitor of deep cumulus convection.
To better understand the influence of middle level humidity on Cb
parcel buoyancy, Table 5 has been prepared. This table compares the
temperature of a parcel lifted moist adlabatically from 850 to 250 rob
under assumed entrainment rates of 0, 10, and 20 percent per 100 mb
in two environments whose humidity above 850 mb is different by 25 per
cent. An initial parcel buoyancy of 1.70 at 850 mb is assumed for both
environments. Parcels entrain air with the humidity values of the
environment listed at the left of this table. The large influence of
middle. level humidity differences of only 25 percent in reducing up
draft parcel buoyancy when entrainment is occurring is evident.
High middle level humidity also leads to increased precipitation
efficiency and the greater likelihood of enthalpy increase. Lopez's
(1973b) model of the cumulus life cycle indicates a direct relationship
between cumulus induced precipitation at the ground and upper level
relative humidity. When upper level humidity is low, much of the
cumulus induced condensation does not fall to the ground, but is

55
Table 5
Influence of Middle Troposphere Humidity on Parcel Buoyancy for Different
Values of Entrainment from 850 mb.
Pressure Level (mb)
850
750
650
550
450
350
250
Cumulus Parcel Temperature Minus Environment Temperature (OC)
Relative Humidity No Entrainment For Environ- For Environ-(percent) ment Entrain- ment Entrain-
ment of 10% ment of 20% per 100 mb per 100 mb
$-I $-/ >. >. >. Q.) Q.) 4-1 >. 4-1 >. 4-1 >-. 4-1 4-1 .,.; 4-1 .,.; 4-1 .,.; 4-1 til til "'C .,.; "'C .,.; "'C .,.; ::s >. ::s ~~ .,.; "'C .,.; "'C .,.; "'C r-f4-1 r-f4-l1J') ~ .,.; ~ .,.; § .,.; C,).,.; u·~ N ~ ~ ~ "'C "'C I%: I%: I%: ,....f"'; M .,..j til I%: I%: I%: ~ § m S til $-I $-I $-I
t) ::; Q.) Q.) f..f Q.) $-I Q.) $-I -,..j I%: ~I%:M .;, Q.) ..c Q.)
~ Q.) ~ ~ ~ bO ~ ~ >. >-. .,.; .,.; .,.; 0
E-4 E-I I%: ....::I I%: ....::I I%: ....::I
80 55 1.7 1.7 1.7 1.7 1.7 1.7
78 53 2.2 2.2 1.5 0.8 0.6 -1.1
76 51 3.0 3.0 1.7 0.4 0.2 -2.7
74 49 3.8 3.8 2.0 0.2 0.1 -3.7
72 47 4.2 4.2 2.0 -0.1 0 -4.6
70 45 4.0 4.0 1.6 -0.5 -0.7 -5.6
65 40 4 .. 0 4.0 1.5 -0.7 -0.9 -6.0

56
re-evaporated. This produces upper level cooling which can act to
suppress rather than enhance the increase of enthalpy.
It will thus be assumed that cyclone genesis is directly related to
the average of 500 and 700 mb relative humidity. Figure 32 shows how
seasonal values of middle level humidity are related to a humidity
parameter which is assumed to be associated with cyclone genesis. This
humidity parameter varies from 0 to 1. Cyclone development is not pos-
sible if seasonal 500-700 rob humidity is less than 40 percent. This
factor increases linearly to 1 for seasonal 700-500 mb humidity equal to
or greater than 70 percent or
RH - 40 Humidity Parameter = 30 if RH is between 40 and 70% •
This parameter is one for seasonal humidity above 70 percent and zero
for seasonal humidities less than 40 percent. Figures 42, 57, 72, and
87 show the average seasonal values of 500-700 mb humidity.
Conclusion. Other conditions being favorable and remaining con-
stant, tropical cyclone genesis frequency should be directly related to
seasonal values of middle tropospheric humidity. The relationship be-
tween middle level moisture and cyclone genesis is expressed by the
above humidity parameter.
j iii 20 40 60 80
500 a 700mb MEAN RELATIVE tf..M)TY
1.0 --------------,.._--
0.8 R H. R.H. FWWIETER
0.6 >70% 1.0 64% 0.8
0.4 55% 0.5
0.2 46% Q.2
<40% 0 0
Fig. 32. Relationship between average 500 to 700 mb seasonal relative humidity and the Humidity Parameter.

5. SPECIFICATION OF SEASONAL GENESIS FREQUENCY
It is hypothesized that tropical cyclone formation will be most
frequent in the regions and in the seasons when the product of the six
primary genesis parameters just discussed are a maximum. Seasonal Genesis
Frequency should be determined by the product of:
wher.e ~ hr
f
lIS
E 8B
e 8p
RH
z
88 (~) (f) (l/S ) x (E) (~) (RH) r z 8p
= Relative vorticity at top of planetary boundary layer or N 950 mb
= Coriolis parameter
= II 1 8 Vh/dp! or the inverse of the absolute value of the vertical shear of the horizontal wind between 950 and 200 mb
= Ocean thermal energy above 260 C to 60 m depth
= Vertical gradient of 8 between the surface and 500 rob e
= Mean relative humidity between the levels of 500-700 mb
Zero and negative values of the above parameters indicate no genesis
potential.
There is some difficulty with using these seasonal values directly.
Seasonal values are not always a close measure of what the daily parameter
values can be. Thus, the seasonal relative vorticity in the Western
Atlantic is slightly negative. The above seasonally determined genesis
potential would not predict cyclone genesis in a region where it ob
viously occurs. When the seasonal values of 18 Vh / 8p\ are small, un
reasonably large values of lIs are obtained, which are not representa-z
tive of the average of the daily values. Similarly the seasonal values of
57

58
ae lap between the surface and 500 mb could be zero or negative, but e
individual time period values can be positive.
To cover the range of possible daily deviations of three of these
parameters arbitrary units were added to the seasonal values to simulate
in an approximate sense what the average of the positive daily deviations
of these values could be. Thus, five units of 10-6sec-1 vorticity were
o added to all the seasonally measured values of this parameter and 5 K
was added to all the seasonal values of ae lap. To prevent unreasonably e
large values of the genesis frequency when la Vh/ap I approaches zero,
and also to assure that the seasonal average of la vh/ap \ is more rep
resentative of the seasonal average of the daily values, 3 m/sec was
arbitrarily added to all the seasonal vertical shear values. The min-
imum value of the vertical shear parameter is thus 3 units.
A Seasonal Genesis Parameter is now defined as
where
( Vortici t y) Parameter
(Coriolis '\ Parameter)
(Vertical Shear) Parameter )
(Ocean Energy) Parameter
(9)
== ('t. + 5), where -::J is determined in units of r nr 10-6sec-l.
= f or 2Qsinf, where Q is the rotation rate of
the earth and~ denotes latitude.
= 1/(Sz+3) where Sz = la vh/apl is determined
in units of mlsec per 750 mba
fSfC
p c (T - 260) oZ, where p and c are the 60 m w w w w
== E or

(MOist Stability) =
(Humidity) Parameter
59
density and specific heat capacity of water. T
is expressed in °C. T - 260 =zero if T ~ 260 C.
E is expressed in units of 103 cal/cm2•
ae lap + 5, where a·e lap is in units of oK per e e 500 mb.
RH - 40 30 or (RR - 40)/30 where RH is the mean
relative humidity between 500 and 700 mb. Para
meter is zero for RH < 40, and 1 for RH > 70.
Table 6 summarizes these parameters and their role in cyclone gen-
esis. This Seasonal Genesis Parameter (SGP) may also be thought of in
the form of
Genesis (
seaSonal) = (Dynamic Potential) x (Thermal Potential)
Parameter
where
Dynamic Potential =
Thermal Potential
(f) (~ + 5) [l/(S + 3)] r z
(E) (ae lap + 5) (RR Parameter) e
(10)
(11)
(12)
D . p . 1 . d·· f (10-11 -2 I ynam1C ·otent1a 1S expresse 1n un1ts 0 sec per m sec per
750 mb), and Thermal Potential in units of (105 cal/cm2 oK per 500 mb).
Thermal Potential may also be thought of as the potential for Cb convection.
Figures 33 to 92 have been arranged to portray all parameters in
sequence by season where January-March is portrayed by Figs. 33-47,
April-June by Figs. 48-62, July-September by Figs. 63-77 and October-
December by Figs. 78-92.
Relation of Seasonal Wind Fields and Sea Surface Temperature to
Cyclone Genesis. To understand cyclone genesis one must have knowledge
of how the lower (~ 950 mb) and upper (~ 200 mb) tropospheric wind
fields and the sea surface temperature (SST) fields are related to

Table 6
Summary of Primary Genesis Parameters
Parameter
1. Vorticity Parameter -- (~ + 5) at ~950 mb r
where l is in units of lO-6sec-1 r
2. Coriolis Parameter -- or f
3. Vertical Shear Parameter -- 1/(Sz + 3) where -1
lIS is in units of (m/sec) 750 mb z
4. Ocean Energy Parameter -- or E
5. MOist Stability Parameter
to 500 mb
as (~) from surface ap
6. Humidity Parameter -- RH between 500 and 700 mb
Favorable Condition
Large
Large
Large
Large
Large
Large
Genesis Role
Produce necessary low level mass, moisture, and momentum convergence through Ekmantype boundary layer friction
Allow for pressure gradient and sustaining of boundary layer winds against frictional dissipation
Allow condensation warming to be concentrated over moving disturbance; i.e. inhibit 200-500 mb ventilation energy
Maintain surface Se values in conditions of strong winds, upwelling, and large sea to air energy transfers
Permit Cb cumulus convection
Allow for deep cumulus convection and high rainfall efficiency
0"\ o

61
places and frequency of formation. To better acquaint the reader with
the seasonal averages of these features, Figs. 33-36, 48-51, 63-66 and
78-81 have been constructed (see the appendix for the data sources).
Note that seasonal genesis is most prevalent in association with the
Doldrum Equatorial Troughs and where the seasonal 200 rob wind is var
iable or weakly from the east.
The strong correlation between cyclone genesis and upper tropo
spheric easterly winds is well established. A study of 10 years of
U. S. Navy Fleet Weather Central, J.oint Typhoon Warning Center (Guam),
Annual Typhoon reports by the author has shown that the Guam analysis
of 200 rob winds as best they could be determined over incipient dis
turbances which later became typhoons were from the NE, E, or SE in
123 out of 158 cases. Cyclones seldom form in regions where the upper
tropospheric wind is from the west. Genesis is also inhibited off
South India in July-September when the upper tropospheric easterly
winds are too strongly from the east.
Genesis is also frequent in latitudes of 5-100 in the Hemisphere
opposite the Doldrum Trough such as in the Western North Pacific from
January to March and in the South Indian and South Pacific Oceans from
April to June. At these latitudes winter and autumn trade wind strengths
decrease sharply equatorwards and low level cyclonic shear is present
on both sides of the equator. As discussed by Hubert, Kreuger, and
Winston (1969), this can give the appearance of a double inter-tropical
convergence zone. Thus, winter time tropical cyclone genesis should
not be unexpected at some low latitude locations. The 260 C SST iso
therm well specifies the poleward limit of cyclone genesis.

62
Spatial and Seasonal Variations of GenesiS Parameters. Figures
37-38, 52-53, 67-68 and 82-83 portray the observationally determined
seasonal average values of the vorticity and vertical shear parameters.
The places of highest seasonal values of vorticity are usually places
where doldrum equatorial troughs or Inter-Tropical Convergence Zones
(ITCZ) are located. These are very favorable locations for cyclone
genesis. Ramage (1974) has recently given more statistics on the
relation of the ITCZ and cyclone genesis. Vorticity is naturally high
on the equatorial or cyclonic side of the trade winds at latitudes of
5--150• In the subtropical high pressure regions the values of ~r
-6 -1 (in 10 sec ) + 5 units are near zero or negative. The absence of
doldrum equatorial troughs in the eastern South Pacific and South
Atlantic is one important factor precluding development in those areas.
The author has previously presented observational information (Gray,
1968) to show that genesis is favored just to the poleward side of the
equatorial trough. Here the low-level cyclonic wind shear and vorticity
are at a maximum.
The vertical shear la Vh/apt in m/sec per 750 rob + 3 units is gen
erally a minimum in the areas just to the poleward side of the doldrum
equatorial troughs. Note how the vertical shear is a minimum in the
5_150 latitude belts in the spring and autumn, but is larger near the
equator following the summer solstice when geneSis occurs at higher
latitudes. Vertical shears are always large in the Southern Hemisphere
poleward of 20-220• Cyclone genesis is not possible at latitudes pole
ward of 22? in this Hemisphere. By contrast, in the western ocean areas
of the Northern Hemisphere cyclone genesis can occur in summer at
latitudes as high as 34 0 to 36°. It is no accident that in the eastern

63
South Pacific and in the South Atlantic where cyclones do not form,
tropospheric vertical shears are large.
Dynamic Potential. Seasonal values of the dynamic potential or
[(~ + 5) (f) lieS + 3)] in units of 10-11sec-2 per m/sec per 750 mb r z
are portrayed in Figs. 39, 54, 69 and 84. A rather good general rela-
tionship between high values of this potential and the location and fre-
quency of seasonal cyclone genesis is noted. But the direct association
of dynamic potential with seasonal cyclone genesis has some important
failings:
1) the highest magnitudes of dynamic potential do not always correspond with highest cyclone frequency,
2) genesis is predicted in a number of poleward latitudes where it does not occur,
3) genesis is predicted in summer in the eastern North Atlantic where it does not occur,
4) trade winds are stronger in winter, horizontal shear and vorticity are generally higher. Vertical shear at latitudes of 5-100 is no larger than in summer. One would expect more frequent cyclone genesis in winter than summer, especially in the western North Pacific. This is not the case.
Cyclone frequency is related to more than dynamic influences.
Thermal and cumulus buoyancy considerations also play an important role.
Thermal Potential. Figures 40-42, 50-52, 70-72 and 85-87 give
seasonal values of the ocean thermal energy (E), moist stability (ae lap e
+ 5)~ and 500-700 mb relative humidity. The product of these three para-
meters may be considered as the thermal potential, or the potential for
Cb convection.
Observe the large gradients of ocean thermal energy and the very
high values in the Western Pacific. Note also that in the eastern North
Atlantic the ocean thermal energy is not high in June-September. This
is believed to be the primary reason why tropical cyclones do not form
in this region despite the relatively high value of vorticity and low

64
values of vertical shear. This was first noted by Perlroth (1969). The
sharp cut-off of ocean thermal energy at latitudes of ~ 200 in the
Southern Hemisphere and ~ 25-350 in the Northern Hemisphere precludes
genesis at higher latitudes.
The moist stability parameter (de lap + 5) is generally large at e
all oceanic locations except in the sub-tropical latitudes in winter.
Cyclone genesis will not generally occur when the magnitude of this
parameter is less than 10. When above 10, variations of this parameter
do not greatly affect spatial and seasonal variations of genesis. The
seasonal variation of the 10 line rather well specifies the poleward
extent of cyclone genesis.
By contrast with the values of ae Idp, the seasonal values of the e
humidity parameter are very important in specifying the spatial and
seasonal frequency of cyclone genesis. Cyclones do not form in regions
where the seasonal 500 to 700 mb relative humidity is less than 40 per-
cent. The humidity parameter is a major factor in specifying differ-
ences in winter and summer cyclone frequency at low latitudes. Low
humidity is also a primary factor in explaining the lack of cyclone
genesis in the eastern South Pacific, South Atlantic, and in the South
Indian Ocean poleward of 200 latitude.
Seasonal values of the product of ocean energy parameter, moist
stability parameter, and humidity parameter are presented in Figs. 43,
58, 73, and 88. Isolines are expressed in units of 105 cal/cm2 oK per
500 mh. Note the higher values of this thermal or cumulonimbus poten-
tial in the western Pacific and in the Eastern Hemisphere in general.
It is zero over large areas of the Western Hemisphere oceans. The dy-
namic potential, on the other hand, does not show such a large Eastern

65
Hemisphere dominance. Figure 9 shows that Eastern Hemisphere cyclone
frequency is more than double that of the Western Hemisphere. Thus,
it must be the very high thermal potentials of the Eastern Hemisphere
which cause that Hemisphere's higher genesis frequency.
Verification. Figures 44-46, 59-61, 74-76, and 89-91 portray
seasonal values of the Dynamic Potential and Thermal Potential, and
their product, which is defined as the Seasonal Genesis Parameter. This
has units of -8 0 -1-3 1.5 x 10 cal K sec cm When expressed in these units
this gives just the right value required to specify seasonal cyclone
o genesis frequency in number per 5 latitude-longitude square per 20 years.
Hereafter the Seasonal Genesis Frequency will be expressed in these
latter units. A comparison of Figs. 46 and 47, 61 and 62, 76 and 77
and 91 and 92 shows how closely this seasonal Genesis Parameter spe-
cifies the actual number of seasonal cyclone genesis occurrences in
number per 50 latitude-longitude per 20 years.
Figures 93-94 show the combined four season average of the genesis
parameter and observed genesis frequency, also in number per 50 square
per 20 years. Again the correspondence between our defined genesis
parameter and the observed genesis frequency is very close.
Conclusion. The very close correspondence between predicted and
observed seasonal cyclone frequency lends support to the earlier argu-
ments concerning the relevant physical genesis parameters. It was not
expected that the agreement between predicted and observed genesis
frequencies would be this close.
Application to Daily Forecasting. It is hoped that these seasonal
genesis statistics can be adapted for use on a daily basis at the
various government offices responsible for tropical cyclone monitoring.

66
As the satellite and jet aircraft wind measurements become more frequent
and accurate, better daily measurements of low level vorticity and tro
pospheric vertical shear will be obtained. This should lead to improve
ment in the daily measurement of the genesis potential and also, hope
fully, in the improved forecasting of individual cyclone genesis.

h:j 1'-" oq . w w
2.()IE ~ ~ ! !
&O-N I !~ 7? ~v "'<;zyff~w~d% V/AOM: IJ ~I
«>"
GRADIENT LEVEL(-950mb ) SMOOTHED WIND FIELD AX? J\i== ..........: I~""""""" ~~~~- :=;tIP, f{{(I' I~ IIU
'D ~~~ J W$~~ :, ~ === I 20 ,--=-----~ ~~~. --- :;;»'~~ 2!1'
C1' ;==;, acc:: 7'tn ac:: 6fffffffff;fh;cp < MfjJ:i C1'
~ ~?!k "" "-" '""""""~)jf$'~ I g,.r= =' "" " ~~ --- --. ,.. ~ 2C7 '" "' "'- b/- 1 ,,~ , ~ '"'
IIU I" 7 6 ) --, xVI 40" :f ,. J I ff55F'~ =:;;;ttPtC I IIIU
fQN2f(E 11" V 0/ &¥C: "TV ~ >7 T' -tnAv '1V.z,rffuP///AiY/hA ! V//U\ T T -,- .- .. w~fl
SMOOTHED 200mb WIND FIELD
«>"
? ~--~~~~~~~~~~~~ w ,t:-..
C1'
Jt1" ~wam~V:tJf:d::::-----==-:::'" ====~~Ff_~a.~-::::;:;7f--?/J· , -r: ='-~~ ~ W$'~~ er~ {4x / T /' ______ ~~ ~ ~
4C1' I 00 ~ t I eo £ • / I M 12'fJ I ~ r;;1"'= ==----~ ..e=:
0'\ .......


t'%j ......
OQ . ~ 0'\
t'%j ......
OQ . ~
"
2O"E WNr-
JAN - FEB - MAR
SEASONAL }~ ~ GENESIS _ DYNAMIC THERMAL PARAMETER OTENTIAL OTEN
«)It • ~l' ~ 40- ~~~~~~~~~ "~ I~ 40'" no. per 50 LAT.-LONG. per 2 . 1 Xl0-8 ca 1 0K sec-I un 5
~
'lD' 20- ... 2D'
r1' r1'
~ 2D'
40'" I - f LV I 40" HS~ I .,.
2O"E &O-N, ~=. ( ' j'l' ()2;nv 1:oo;;;;;;;';;;; ....... ;;';;J 'p;;x Ii: 0:»>2:',
«7 01 ~, A 40- \s~ssss~s~~ssss~ss~ss~ I~"r • ~ • .,.
.,~~ ~~~ 20- -"6 ~ 'fYl/=:3b-= ... ~'lD'
r1' r1'
~ 2!:1'
.,. I - f - f LVI 40° ~~S~6F= I'"
" ~

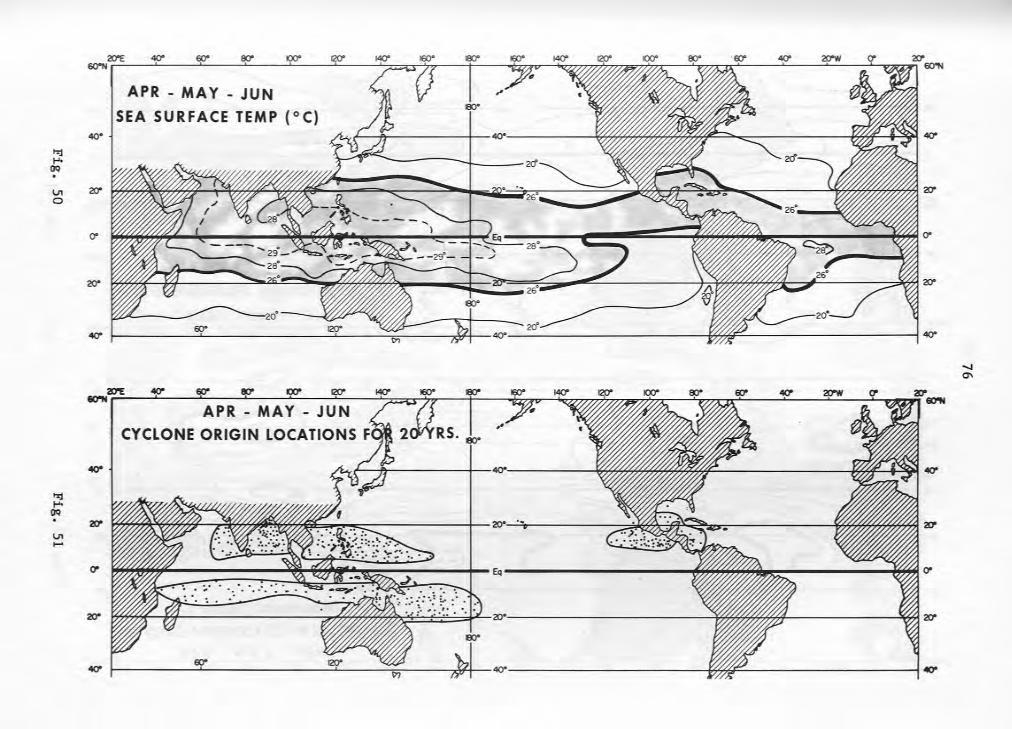
I"rj ~.
OQ
Vl o
I"rj ~.
O'Q . Vl .-
2QOE -,- -,- -,- " . ., k:Z7AV bQ77777/7~777b.Sif'77>7:l '1>77:1\ (1 I "'/RANi 600 N I :z=::c " '.I
APR - MAY - JUN
SEA SURFACE TEMP (OC) 40° 1;...., l A 40° 16~~~~~~7~~577~~~~77~r==' oc:;;;:: J55W" t ~, 4QO
2.(r ~SSS"Sst~», sEW -) ~~-' --, . ?F.0___ -: 1';4;.~~ '~ff§~ 2.(r
0- 0-
20° ;,BJ" . c-: ) A 'fjfJ?jJ?jJ?~ ~j 2QO
4Q01 tn IS"'.! I 40° WAF 14QO
......
'" 2O"E 4QO
fI:1' tD' 10()- I2Q- 140" 160" lao- 160° 140" 12QO 100" eoO flU 4QO
'i!!:rW CJl 'g eo-N I
, , , , , , ;::c;::::;::u >'7 I W/lV btvJ7J 7J7'7J7bii17J 77 x:
, Jl"77X 1:1
, , , t "£2» , fJOIN
APR - MAY - JUN CYCLONE ORIGIN LOCATIONS F~ __ Le. __ "
~j <r6.;;3 40°
~ ~~140-
2CJl ~~~~ ;z?!??Y~¥W~", n .~ 20° " .. 0 ~?'~. ¥'7f?MM7Y~ 'g
CJl Eq ((~~((~((((~ilI U~"ICJl
2()8 20°
~ ~: 180°
4QOE' so- hi , 40°


I"lj t-'-
OQ . VI '-J
I"lj j-I.
OQ . VI 00
6O-N~ ., '~ 77 ltivtv b\u:;7777757772dY77:i7A '-V77A rx -,- CiA>2M'
40- 1 ttldy .. C"@!>,,,,"ft'WAOO""'''. 1\ 40V
'" '655555555555555555"5559' J~~~r • ~l 40-
'ZtY 2fJ'
0- 0-
20- 2fJ'
4Q- I -', lL~1 40° ~757~ I 40-
2O"E 40- fo- W:!' 00- 120" 140" 160° ISOO 160° 140" 120" 100" EK)0 f1J" 40" __ 6CYN I ' , ! ! , !;:c::::;:u >1 I WA v ~///7~/7/A¥////AO: ' f///CVl ! ! ! thO» I
40- ~ 1 __ _ !.L _ '11"\5,.. __ I I _ 2 nil .A..J.._ AI 40- ~~~~~~~~~~~~~~~~~~~~ J~~~ i ~l 40-
2!1' 2fJ'
0- 0-
~ 2!1'
4Q- 1 -. -I rls'l 40° t;~~~ 140-
00 o


~ ~.
OQ
0'\ ~
hj ~.
()'Q
0'\ N
fQN2f"E I' ,., ,... ,... ;~ 'i~ '>;;0 T ·~v· b\v.r/T//fr/7/APY///7;c -ff'77/Lt\' f/JIaAI
4()It .J -' - - - - A . I • . .". !f < « , ( < < < < ( < < < < < < < , < ~ 'f 11 ".~
2!:1' VU///h W/h"/m W///////¥/////h«': ?no ... ~ ~~~~~~~~~~~ ~
'il~\iZit~~~~~l~
C1' Eq C1'
~ 20- 2!:1'
fiIJ" ~ ~ I .4/10
6t)-N2f"E .,- ,- I "'- ',- ~_ \ --,;'7 "1- rb7A>V bV7777777'};;;;a;>;;';;J 'P;;A '1 9k2».
«>- ~ A:..v J . A 40° \~~~~~~~~~~~~~~~~~~~~sc= J~~~r 9 "'Qt' ~
2!:1' t~~~~~4~~~~~~q _I XS'~S'~~(4'~s'S's'~s'~ :::=owoluooc:: 20° ...
6 > <l&s''Ai . ~' ":S\?'''''J .. ~~s'~s's'~~s's's's'~~~~ 2!:1'
C1' Eq
• ~]: 2()0 20°
~ I -r ._, xVI 40° tf55F I ~
00 N


2O"E 6O'"Nr JUL - AUG - SEP
EA SURFACE TEMP (O C)
40° ~ ~.C~ 40° ~~o;.. ~40-~ t-J.
oq . 'l!1" ~V~~~1ll~~cav~' ~'<""'~::!5~t>4@" .... · •. ="'2~v 'X"~~ ~~~.w.~;~";,:{;~t&: ll.<26~ 'l!1" {;;~mJtJi ~<&, ~ 4@~45 :::~*8~~~ '":; :}:;*llWr&%r;:~::~';? :t' ~~:<: ... :::~:':~ $:{.%~~;:::::;:::;:' .;.::;,:,,: .. :~ .. ~ ,., '~~. ' .>.::}~:;.:;::::; J .{,!'2;:;::~:;:;;::::::·:fL....... i;;: 8~:?,:~:::~~'-,· -,::,;:::;::;/- '-·.;tHi . "
0'1 lT1
0- 0-
20° 'l!1"
60° ,?<~ 140-40- 40°
00 +='-
2O"E 40- so- f!IY IQ()O 120- 14()O 160° 100" 160° 14()O 12QO 100" 00° so- 40- 2QOW 0- 'l!1" 6O'"N1 I , , , ,
~){ I ~v ~h£ ,
~ , , , , t?1t1160'"N
JUL - AUG - SEP .. V I " CYCLONE ORIGIN LOCATIONS F 20 YRS. I8O
°
~~ ~ P 40° ~~~~~~~~~~~~~~~~~~~~ J,{{~ t ~~ 40-
h:j I"Y/T~,1" j A'£., / _ I ,,/ I .. .. I J. . ~ ... . .
t-J. oq . 'ID' t'~~5(/~W r.Y««~~i .,' :, '''',L'a:',::' ." '. " ·n 20° '''6 u:;=;o;:~,~.y9i .. :~:~~;c· . i " " ,::;=r-- '< ~~.y~.y.y~~~~~.y~~~~ 'lD'
0'1 0'1
o-~ ..... ~ ~.~:;:;~
~- ~: Eq
:~ ~ r4 11
20°
8)0 '~<g=' I 4()-, 40°

hj r"
O'Q . 0'\ '-J
t"Ej ~
OQ
°
2O"E 4a- roo f!U 100" 120" 140" 160° 180" 160° 140" 120" 100" 00° fC/' 40" 2fYW 0- ?J:J" 60
0
N j 'J U L A'U G _' 5 E p' '~ >7 I WAv bt<v/7//#//a¥ff//A 'V7AIVi ' , , , ww/1'1 6O-N ~
-6 -I RELATIVE VORTICITY (~,.) in 10 sec of
- 950mb (~,.parameter) 40° 1 ~< fI 40" 'ISSSSSSSSSSSSSSSSSS~SSq "SSS{," 9 Vt 4a-
'lJ]- r5,,555A'\}'555,5~;::~555~~f555~ 'C Ie .. , )'=1,. . ~ .... .-;--3»....... '~7XH-~ 4~~755ff55555f55571 'lJ]-
0- C 4~12/~ .~0"
20° c== ~ ~\"\.Y{£{0'~g1 r g~ ~ 'lJ]-
40- I xl{tfl ~~~~ "' I 40" -:-.,-.-
2C)IE -,- ,- ,- . j- . ._- ._- .-- •• - ..... - " ,., 'i" )"' ':-' ... '1 eo-Nn ::z:::z::t:i )7 I ia7nV ~77:;7;:;;";:;;:EW;:;:;;1 S;'}2 Ii
40°
JUL - AUG - SEP
MAGNITUDE OF d'Vh dP m/sec + 3 ( " 40° '6))»»7)'7))))))S?~r > J~~~r i ~~ 40"
0\ 'lJ]- HSSSSS5\Y.6SSSSSlf ~ISSSS~" '16SSSS~ ........ If) f « zo·~, 7' , ><16>S~( Fl" -..zL :a!'!'!1lg ~~~~~~~~~~~~~~~~ ?J:J" ()C)
0-~~ - . >4i~". \~~ I A., '" «~. - l!!!: ,. if~ 0"
20° 3e I rolQ
40" I'" ''-, L'ill 40° vv ~ft I 40"
00 V1
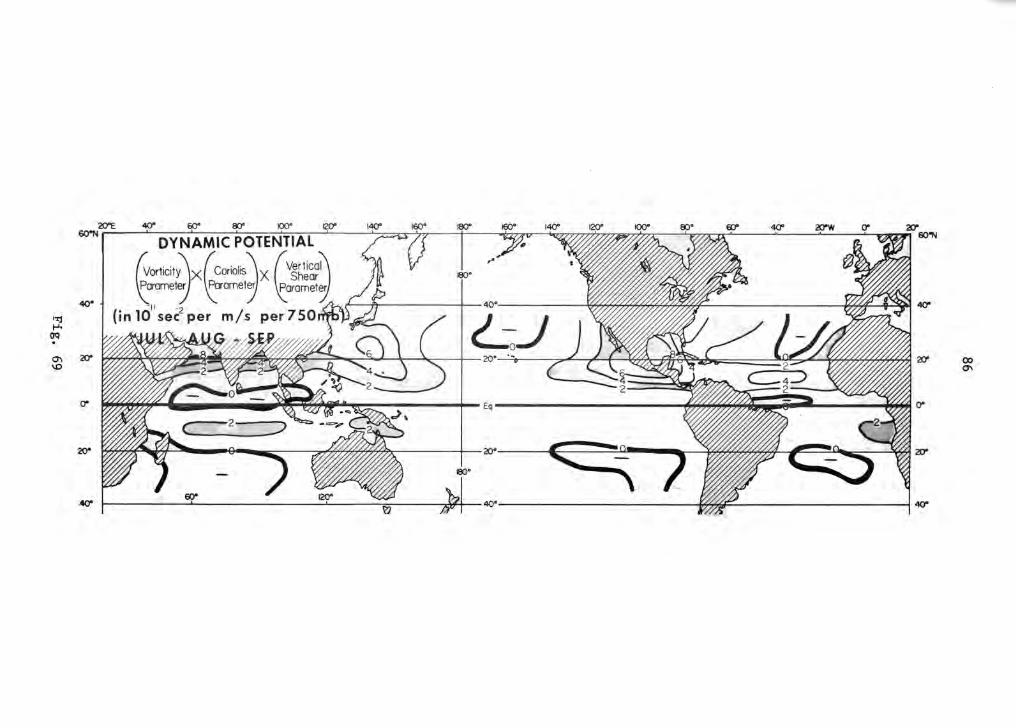


t'%j jo-Io
OQ . ......, N
t'%j j-I.
aq . ......, w
~ 4(]' ~ ~ ~ ~ ~ ~ ~ ~ ~ ~ ~ ~ ~ ~ &a-N, 0 0 0 0 0 0 ~ )'1' I WAv bt<::o7r//ff/T/APYff/7/L 0 V7XJA 0, t>AaJJ' i
.,. .I h----L I ' /III 40° '<;<;<;<;<;<;<;<;<;<;<;<;<;<;<;<;<;<;z,<;<;q J<;<;<;r I 2'", 4(]'
..,. W#/~W..&~ '~'Z~~~ ~} ~ '"" ,""'. 200 .~ ",,4 ,£ c'" r@~l;iI~ +i~ 'Wl~~'2!1'
ey- 0-
'If]It '2!1'
4(]' I -, '-, xVI 400 ~7'W= I ..a-
2O"E 4(]' ~ ~ IC:lOO 120" 140" 1600 ~ 1600 140" 120" I()()O ~. ~ 40" __ .. &a-N, 0 0 0 0 0 0 -<.= . { oJ'}' I &;)#u bv)))))))'7)))~))o))l 0 "))1 Ii 0 0 0 CJ>D"W'
«>-1 \ unITs IV \o.UI/ ~m "~~' 4()0
~ ~~14O"
'It1' HSSSS>s\:'<SS>SSS~i.£OISSSS~SSSS~JP,e=, < > co: '>" < '= 200 -.. ~. r6~SVI I?J - ::::g..:a; • .-: ~ ~~>S »~~~~~>~~~~ '/1:1' /)
zWf.;(I~;~r ey- 0 0-
~ '2!1'
4(]' I - f - f xV I 400 ~~S~~ I 40"
00 00

I'%j ~.
OQ
-...J ~
I':tj ~.
oq . -...J ~
ZO"E 6C)4IN. '" , DYNAMIC POTENTIAL :Z::;:C3 7? u(znnV ..... 7777777
I
n/72Wn>n 1 pn)\ 11 1 9M2».
rvorticit~x (COriOliS '\ X (V§h~~~~ '(mmet' t amet, ~aramet,
(inlO"sec2 per m/s per750~<?~'fjJ 40° ~~~ U~~ t~14Cl" ~
2f1' fSSSSH~"I(6HS~S '~;,fjffC.~. ....... :~~J~t" ::W~E~ 2f1'
C1' tf::ffffffff:Jbws 8 G NfJJl C1'
2C1' ~~......, 9 >'7?~{//$A 20° C "'0 • W//H/$g¢ ~~ !!(~2f1'
4CI" I -, -, xVI 40° H~~g= 14CI"
fIY't4~ ';z::;:u >7 W/{v '"vzTffffff/.:FYff/7;c 1 Vl/LOI 1 -1- VAtZf'i
4()- ~ I U n US IV \,.all em ~ M£V"VJI("IH. ~ ~~«"?«'~~ K«r I ~~ 4CI"
'Ill' 117
C1' C1'
II)- 2C1'
III:/' ,-, xV I 40° H~5r;=
co \.0

t'%j 1-'-
OQ . -....J 0'\
t'%j 1-'-
OQ
-....J -....J
2O"E 40'" filr ~ 100" 120" 140" 160° 1000 . - . . - . - . -, - -, ' ",- -, .. 1 _ 6O-N, ' J U L ' _ AU G _ 5 E P , , ~~ 'n' I t<D/lV ..... ;nnn'nn:a:wn771 i>nA t1 c>>.P2>>.
-.0.
SEASONAL ){ ~ GENESIS _ DYNAMIC THERMAL PARAMETER POTENTIAL OTEN
..c1;..., ,. ~ 40· \$~~~~~~~~~~~~~~~9;~W= J~~~r • ~~ 40'" no. per 50 LAT.-LONG. per 2 1
"
un Hs 1...5Xl0-sca 1 0 K sec-I
2tJ' ~ssss~sssss~sss~ '2D'
0- W~~ ~o-
20· ISSSSSS( AS! ..... ,sSSSSSSSSSS9x 20° 'SSSSSSSSSSSS9 "'SSt '2D'
40'" I . , x.VI 40° H»~ I 40'"
2O"E . 6O-N- ---'- -'-- 'j, '~"AO b;""",;'"".-="',,j 'V", '
-.0. ~ A:...tv ' . A 40· ~~~~~s~ss~ssss~ss~ss~ J~~~r 9 :<Qt, 40'"
2tJ' ~~'~~~y~"~~~~~~ ':llRQ'~~~~~;gy~~~ .. ';", r :~:;:;:S~(iiJljt::~~::;· ' ~;'.;a 20° ... 1"""'2>" nn ~~y~t 'fY+;~ • . , C! H'5~c: ~~Y~YYY~SSSSSSS~ 2tJ' f)
:1£ ~\ I
Eq
- -]: 20°
40'" I n, x:VI 40° HS~=r= 140'"
\0 o


I":I:j 1-'-
OQ . 00 o
I":I:j 1-'-
OQ . 00 ......
2O"E 40° 60° 80" KXJo 120" 14QO 160° 180° 160° 14QO 120" 100° 00° fIJ" 4QO 2O"W C1' _ 60
0N II ' , ! , ! ';z::z:u 77 I W??V '"v.7777777~7777;C ! P77X no !! ! \} :;;;> .... ».
OCT - NOV - DE C
SEA SURFACE TEMP (0 C) 40- ~ " ~ 40° 'V5757775577557775775,r {5->~r V ~1 40"
1.J....d,...' I 20°-______ _
20-~%B~~~5L_(i::7¥ifR:,~:: i.~;:';~R , '~-i~~~ ;" · ,Wi. ~~ss sss s ~sssss~~ 20-
0- H5Hil 0-
20° ~ ~~LO- :7/~20-~~ ' I ?6'~!6 7" ~I ~
60° 40" I' ,,-VI 40° E5)5r I 40"
2C)IE AK.r" tJlr ~ r..AF" .,v ~ ""'"' "-All """'" I~ .... _ ,__ _,_ _,_ .,_ _, __
so-N I ' I , , , ';;z::;:s;:s 77 I ~v '"'W77ffffff/A¥//}'7A;; V//U'\ OCU'I
«>- ~ A:....- I ~ 40- \sssssssssssssss~s~ss~ J~"r • ~1 110'
..,. t"~~~~XS'~;«'Yq ~~~~~~-~"~~~ c ~ .~- 20- ... {~~ : 671 -.: :-=9.Z : • iJl ~~~~~~~~~~~~ '111' • .. 6
C1' Eq 0-
2.(J- 20- 20-
110' 40- 40"
\.0 N

I":I:j f-J.
()Q . 00 N
I":I:j f-J.
()Q . 00 w
2()I'E: """" ~ f;1\J r\J\J IL.V .,-v ,.........., I~ ..... - ._- -- - • - -, .... ,. -
~ F'O (T _ NOV _' DEC I ':;;;;:;;:u >7 WAV bl{l.T/T/7/T/T/A#¥/T/7/C I f77/U)\ " tNA"i
-6 -I RELATIVE VORTICITY (;(r) in 10 sec
'" 950mb (~rparameter) «>- 1:....- J A 40° ~~~~9;~ J~~~ t "'9~ 40-
~ 'SSSSHsrXcSSSSSSSf". ~ (; <:o--ct7&O ~ / ~ '~~. ~~~ ~ _ . ! O../.i:ll ~ _ ,
(1" C r . ,.. . .~ (1"
'lJY' ~... : ;z§5,.v~:: · I~ ~ ~ ~~
40-I, ·-T "xVI 40°· ~r IIq
2()I'E: ._ __ __ ~ __ ,~ ,__ ~ ....., ,~ '~v 'VV ..,., ......, -.,., ~v .. v ...
eo-NI I I OCT _ NOV _ DEC~)( I ~V ~JMW~ '~' , , n' tldMl
~
MAGNITUDE OF dYh dP m/sec + 3
ft.vl l><~ I 7 «>- 25 ~~~~9'~ ~ t ~1 40-
2C1" ~~~~~~~~~~~~~_vA""l~)~~~ "6~~)~~ IX -... ... '< i 20· .... PiX"""'" .. <'WA .... S?Iibzs_ \c: W#'$h9"'#'~ ~
(1" , ,lfcf(ffffY«ffk "., fH'fA (1"
20· ~~ ffL.=?O ::::::t?"~~ ~O~ I 20· -II! ~~g== -- ~ roo
4fJ' I ~:::::-..... rc..r "<.<H 3O-ifl1 40 ~ ==::-:-..... oc::: ~~ I 40-
1..0 W


r.tj 1--"
OQ
(X) V1
.r.tj 1--"
OQ
(X) 0\
4()- .. A~. , . 40- '<; <; <; <; <; <; <; <; <; <; <; <; <; <; <; <; <; <; ~ <; <; if .~~~V • 75", 40-
'l!1" WP/O' wL<?'4aF'~ilij'1=««<L@¥/..(V(MeT' . ,~'rn{' ~-:;~'~A ;;:::~; :::~ ::;;; : ' ::: "C'r " !~ " .. .'~'f"~i@"":'. ··~: .·'::: 'm .A __ ~~~~~~~~~~~~~~ 'l!1"
0- 0-
..,. 'l!1"
...a- I I -r xVI 40° £>ffr 140-
2O"E 40" f:Cf' 80" 100° 120" 140" 160° 180" 160° 140" 120" 100° 00° 000 40" 2O"W 0" 20" 6QoN, ! , ! , , I ::z:::;:::z:::c ~ )'l' . I Cu7n v bv777777777?7b311777';)1 I V;7A 11 ' , , , CI>&::aM. 60~
OCT - NOV - DEC ~
~~. - SURFACE TO 500mb (0 K:sl 40..... y;"""?>""",,>?,,q:: < 1>,,(' i ~l 40"
180°
40°
-------�0----
20" ~~~>'~Sc&>'~>'~IO~ ~>'>'~~Plf --_ .... < , -0 .................. ~ ~C£5.. ".... W~#~ 20"
_----- 20 -I ---
0° 'c ; c;==; II I ~5550»?1;£M _ /j)51cJ 0"
20° ~ J::a A')?@,,~A c.v I 206 - I ~f y~~/ IL ~ 20"
I 60° IZOU
~--:::>-D7t -- - - --- -- ---40" . ' '........ x.¥I 40° _________ _ 40"
'>0 V1

~ 1-"
OQ . 00
"
~ 1-"
OQ . 00 00
2O"E 40" fI:r ~ IC)(Y 120" Iq(J' It)l.r ~ IO..r ,"tV I~V IVV""" .- -- • • -
6O'"Nr==' , , , , '~77 I ~v ~ff~~~ '~' , , ~I
4C' 40-
t/"///Ao. "V"///ff~ ~/////...w//////U'.£M!"'!' ,,&1,#, " .An ' .. • ;rij'A" .,., .. ~ .. iRJYW?e1'Yii;1;; '&. . ?%'%r},~ ~ 2!1' 2!1'
0" 0"
2!1' 20"
40" I -'-I ;c;'d'i 40° ~~r 140"
2O"E 4Kr fAr ~ IC)(Y ~ 140" 160° B)O 16()0 140" 120" 100" El)" fI:I' 40" 'l.!7W 0" 21: so-N I ' , , , , '~)f I ~v ~~ff/h$£ 'V/Mi' , , , w:71
«>-1 (units 10"Cal/cm~ OK ~~flb) ~
~ ~~14O"
'g ~~~~~~~~lIf6~~'1~Hf ~~.,~~~l6~~.,~a" :::' ~"'~;;;::t~?P!::~:'" 20- ·"ID ~~~'A:JiiB __ ~::~.'~ ~~~.:;~~~~~~~~~~ 2!1'
. $J\I~~~ f~_ •.. I; .. ~ ,,~, - ...
0" 0"
20" 'g
40'" 40'"
\.0 0\

hj r"
OQ . 00 '-D
hj r"
()'Q
\0 o
..0-
~o~ /~.
..0-
40-
40-
\0 "-J

4C)- ~ h-<., I /Ill 40· \~~~~~~~~~<~~~~~~~~~~if J~~~q: • ~, 40-
~ 1-"
OQ . \.0 'lD' 20° ' .. 2!1' ,....
a- Eq a-
'l.O'" 20° 2\?
..a- I -, LV I 40° ~F 140-


6. DISCUSSION
It is seen how closely the seasonal climatology of each area dictates
the number of cyclones which form there even though the days of cyclone
o genesis (1-15 per 5 square per 20 years) make up but a very small per-
centage of the days of seasonal climatology. If it is assumed that
cyclone genesis requires a favorable daily genesis potential to exist
for three consecutive days over a 50 latitude-longitude square (or for
o 1 day periods in 3 adjacent up- and downstream 5 square one day apart),
then the number of genesis days even in the regions of most active for-
mation is no more than ~ 2~% of the non-genesis days. It is doubtful
that these cyclones have a very large influence on the seasonal climatology
based on several years. The seasonal climatology parameters are, to a
large extent, independent of the cyclones. The cyclones are not inde-
pendent of the climatology, however.
It is encouraging to learn that the frequencies and spatial distri-
but ion of tropical cyclone formation are so closely related to the sea-
sonal climatology. Even though the dynamics of individual cyclone genesis
are very non-linear and unquestionably very complicated, the frequency
with which these individual genesis processes are activated is very
strongly tied to the large-scale and long-term parameter averages. It
was not expected that cyclone frequency could be so closely related to
the long term climatological parameters.
It is not just the correlation of these six seasonal parameters
with genesis frequency which is noteworthy, but also the physical ration-
ale concerning the effects of these parameters on genesis which is
important. It is possible that other climatological parameters can be
100
101
found which are also related to cyclone frequency, but the author doubts
if these other parameters, if detected, can be as well related to the
previously discussed physical requirements of upper tropospheric enthalpy
accumulation.
It is observed that cyclone genesis is· a slow process of gradual
cloud cluster upper tropospheric enthalpy increase which, on the average,
requires about three days of favorable conditions. In some situations
cyclones develop from cloud clusters in 1-2 days. In other cases it
takes 4-5 days. Pre-cyclone cloud clusters move westward at a velocity
of about 50 longitude per day (~ l2~ knots) and occupy areas of about
a 50 square. It can be assumed that cyclone formation requires favor
able daily genesis conditions to exist over a 50 square for about 3 con
secutive days or over three adjacent and progressive downwind 50 squares
o for one day each. In a statistical sense an interchange of space (5
square) and time (1 day) is assumed.
Since each 20 year individual seasonal climatology time period in
cludes about 1800 days (3 month x 30 days x 20 years) or 600 consecutive
o 3-day periods (or 600 consecutive 3-day adjacent downwind 5 square
period of one day each) we can calculate the percentage of time for
which favorable cyclone genesis conditions are present. Table 7 shows
the percentage of cyclone genesis days. Even for high frequency of
genesis, these percentages are not large.
Daily Values of the Seasonal Genesis Parameter. Our observations
of daily genesis parameter values associated with 40 individual cases
of pre-cyclone cloud clusters (Williams and Gray, 1973, and recent
undocumented studies) in the Western Pacific show that the early

102
Table 7
Number and Percent of Cyclone Genesis Days for 20 Seasons
Seasonal Cyclone Genesis Frequency per 50 Square per 20 Years
15
10
5 1
No. of 50 Seasonal 3 Day Consecutive Periods in 20 Years
600
600
600 600
Percent of 50 Consecutive 3 Day Periods Which Produce Cyclone Genesis
2.50
1.66
0.83 0.17
stage pre-cyclone cluster 950 mb vorticity is about ~ 10-15 x 10-6sec-l
and that the 950 to 200 mb vertical wind shear averaged over the 50
areas is no more than about 2-3 m/sec. Clusters which do not develop
have typical vertical wind shears of ~ 5-8 m/sec. The ocean thermal
energy content and ae lap are little different than climatological e
values. 500 to 700 mb relative humidity is larger than 70 percent. The
typical magnitude of the Seasonal Genesis Parameter when applied to in-
dividual daily cases of cloud cluster growth to cyclone intensity is as
shown in Table 8.
As the pre-cyclone disturbance gradually develops from a cloud
cluster with 50 square vorticity of 15 x 10-6sec-l to a cyclone with
-6 -1 vorticity of 100 x 10 sec , the magnitude of the daily genesis poten-
tial increases from an initial day value of ~ 15 to second and third
day values of about 30 and 80 respectively. This table also lists esti-
mated values of the daily genesis potential for the usual cloud cluster
which does not develop into a cyclone. Note that the thermal or Cb
potential is little altered in the genesis process. Given a sufficient
thermal potential, it is the daily variations in low level vorticity and

Type of Cluster System
Typical Non-Developing Cloud Clusters
Developing Cluster 1st Day
Developing Cluster 2nd Day
Developing Cluster 3rd Day
Tropical Cyclone (Max. Wind 10 m/sec at 200 Ian radius)
Table 8
Typical 50 Square Parameter Values of Daily Genesis Potential for Different Types of Cloud Clusters iIIhe Westerl North Pac.ific.
Vorticity Corio1is Vertical Shear Dynamic Ocean Energy Moist Stability Humidity Thermal Parameter Parameter Parameter Potential Parameter Parameter Parameter Potential
lr + 5 f l/(S + 3) E ae RH ('V1201at)
z ~+5 ap
-6 -1 10 sec -5 10 sec -1 750 mb per -11 -2 10 sec 3 10 ca1/cm 2 oK per 500 mb 5 2 10 ca1/cm m/sec per m/sec oK per 500
per 200 mb mb
12 3 1/10 3 10 20 1.0 2
18 3 1/7 8 10 20 1.0 2
30 3 1/6 15 10 20 1.0 2
55 3 1/4 40 10 20 1.0 2
100 3 1/3 100 10 20 1.0 2
Daily Genesis Parameter
(1.5 x 1a-8
ca10K/sec cm3)
6
16
30
80
200
-- -
...... o w

104
tropospheric vertical wind shear which are the major short term
determinants of genesis.
Daily values of the Genesis Potential for the developing clusters
are usually larger than the seasonal values, but in some cluster situa-
tions they can be less than the seasonal values. Daily values of 950-
200 mb vertical wind shear are often larger than climatological values
of vertical shear when the climatological values are small. Where cli-
matological vertical shear is small due to cancelling of larger magni-
tudes of daily easterly and westerly shear, the daily genesis parameter
can be smaller than the seasonal parameter.
Individual cases of cyclone genesis require a local environment
with favorable deviations from seasonal conditions. A crucial question
emerges: Can ~ directly relate the frequency of favorable deviations
of the daily Genesis Potential 1£ the Seasonal Genesis Potential?
Daily Correlation of Parameters. The author believes that the in-
dividual daily variations of each of the six individual genesis para-
o meters over 5 areas are largely uncorrelated. f does not vary with
time. E changes only slowly with time and has little daily dependence
upon wind or humidity factors. The 50 area daily variations of surface
to 500 mb ae lap are typically small. A separate study of the daily e
variations of 50 area average values of ~ and S parameters showed r z
negligible correlation over many days. Daily variations of the relative
humidity at individual locations is largely uncorrelated with all para-
meters except the low level vorticity, and this correlation is not very
high. Thus, as a first approximation it may be assumed without very
much error that the daily variations of these six genesis parameters
o over 5 areas are largely uncorrelated with each other. If the daily

105
correlation of parameters is negligibly small, then the correlation of
the 3-day average parameter values should be similarly small. The five
genesis parameters which undergo 3-day variations with time (f not con-
sidered) may be conveniently represented by the symbols A, B, C, D, E.
Let the seasonal values of these parameters at any location be designated
as A, B, C, D, E, where the -- (bar) denotes a seasonal average. Let
the deviation of the 50 area three consecutive day average values at
any location (or the 3-day downwind values at consecutive 50 squares)
from the seasonal averages be denoted by A', B', C', D', E', where the
3-day values (A, B, C, etc.) are also defined by the usual notation
A = A + A', B = B + B', C = C + C', etc.
If the correlations of the 3-day parameter deviations averaged over
a season are small, that is if the terms:
A'B' A'C', A'D' A'E' B'C' B'D' BrE' C'D' C'E' D'E' --' --' ---' --' ---' ---' --' --' A B A C A D AE B C B D B E C D C E D E
are each of magnitude between + 0-0.2, then the seasonal averages of the
3-day products will not be very different from the product of the sea-
sonal averages, or
ABCDE ~ ABC D E (13)
ABCDE is equal to the average of the 3-day values, or
i=600 ABCDE = 1/600 2: (ABCDE) •
i=l 1. (14)
A study of the magnitude of the positive deviations of the 3-day
Genesis Potential from its seasonal values in the Western Pacific show

106
1 5 10-8caloK) it to average about 9-10 (. x 3 units and to be largely
cm sec independent of location and season. Assuming the 3-day average product
of ABCDE to be randomly distributed for positive deviations of this
parameter5 with a standard deviation of ~ 9-10 units which does not
significantly vary with season or location one can see that a given
threshold value for genesis (say, a 3-day average value of the Genesis
Potential ~ 30) can occur on only a small number of days per season.
Given a standard deviation of 9-10 units, the number of days on which
this is possible is specified by a factor of ABCDE, or because of the
relationship expressed by Eq. (13), by a factor of ABe DE. Thus, a
direct relationship between the climatologically specified Seasonal
Genesis Parameter and the actual genesis frequency should not be unex-
pected.
It is assumed that if the 3-day genesis parameter is greater than
30 units (its second day value in its three-day growth) then enough
upper tropospheric enthalpy accumulation will occur such that a cyclone
will form and intensify. When the second day of the 3-day average of the
Genesis Potential is less than 30, upper troposphere enthalpy increases
are insufficient to allow cyclone formation. Even with the most favor-
able seasonal climatology, positive 3-day deviations of the Genesis
Potential of 20-30 units can occur on only a few days. The rarity of
cyclone genesis is to be expected.
5As negative values are not permitted for f, l/(Sz + 3), E, and RH, the negative deviations of the 3-day Genesis Potential are skewed around zero and not representative of a normal distribution. The positive deviations of the Daily Genesis Potential may be assumed to be normally distributed, however.
107
Figures 95 and 96 portray the number of 3-day periods per season
for which the 3-day average Genesis Potential is above certain specified
values for different Seasonal Genesis Parameters. Note the very infre
quent number of 3-day periods when this potential is above 30. Note
also how shifts in the seasonal genesis parameter from 1 to 5, 10 and 15
can increase the number of periods when the genesis potential is above
30 by a similar ratio. Because positive deviations of the Genesis Po
tential are largely independent of location and time of year, seasonal
climatology plays a fundamental role in specifying the number of 3-day
periods in which the genesis potential can be large enough to activate
individual cyclone formation. It is seen that cyclone frequency, al
though occurring on only a very few days per season, is, nevertheless,
directly related to the large scale and long term shifts in the tropical
general circulation and thermal energy content. From the long time
scale point of view, cyclone genesis frequency is seen as the statis
tical -result of largely random 2-3 day parameter variations superimposed
on a slowly varying seasonal climatology.

~"; ~~ 300
Ir~ ~~~
200 11n~
;~~ a<!>o ~~~ 100 IO o~~ ~~w
0 ~2;
108
SEASQ\JAL WEAN GENESIS POTENTIAL
1 5 10 15
GENESIS POTENTIAL
o 15 30 I , I
6 : 2 3 STAM)Af{) DEVIATIOO ( ..... 9Irits)
45 I
Fig. 95. Number of consecutive 3-day periods (ordinate) in which the 3-day genesis parameter is above the specified values on the abscissa for different values of seasonal forecast genesis frequency. A normal distribution for positive deviations of the 3-day daily genesis potential is assumed with the standard deviation of ~9-l0 units.
SEASONAL MEAN ·i GENESIS POTENTIAL ~
a:: .!. lr ~~~ 50 5 10 15
lr~~ 40
~~~ ~CII~ 30 ~~~ I-~o 20
i~~ ~~ 10
~~I ~~ 0 GENESIS POTENTIAL
20 30 40 I I I
i I I 0 I 2
MAG.t"fLG: CF STD. r£v.
Fig. 96. Same as for Fig. 95 except for showing an expansion of the right portion of the figure where the required value of the 3-day daily genesis potential > 30 has been shaded.

109
ACKNOWLEDGEMENTS
This research has been supported by a National Science Foundation
Research Grant Number (GA-32589X3)r The author is much indebted for the
excellent assistance rendered h~ in data reduction, in calculations,
in drafting, and in overall manuscript preparation by Messrs. Ronald
Phelps, Charles Solomon, and Scott Ryden and by Mrs. Barbara Brumit and
Mrs. Genevra Hetca1f.

110
REFERENCES
Anthes, R. A., 1972: Development of asymmetries in a three-dimensional numerical model of the tropical cyclone. Mon. Wea. Rev., 100, 461-476.
------, S. L. Rosenthal, and J. W. Trout, 1971a: Preliminary results from an asymmetric model of the tropical cyclone. Mon. Wea. Rev., 99, 744-758.
______ , J. W. Trout, and S. L. Rosenthal, 1971b: Comparisons of tropical cyclone simulations with and without the assumption of circular symmetry. Mon. Wea. Rev., 99, 759-766.
Aspliden, C. I., 1971: On energy distribution in the tropical atmosphere. Ph.D. Dissertation, Florida State Univers-ity, 232 pp.
______ , et al., 1966: parts I and II. 153 and 98 pp.
Satellite study, tropical North Atlantic, 1963, Research Reports, Florida State University,
Atkinson, G. D., 1971: Forecaster's guide to tropical meteorology, Unpublished Air Weather Service (MAC) Technical Report No. 240, 300 pp. (available from AWS, Scott AFB, Illinois).
,1973: Private communication. (Commander of the Joint Typhoon ----~W~arning Center, Guam). Black, P. G., and W. D. Mallinger, 1972: The mutual interaction of
Hurricane Ginger and the upper-mixed layer of the ocean. Appendix D, Project Stormfury Annual Report, 1971. National Hurricane Research Laboratory, Coral Gables, Florida.
Brand, S., 1971: The effects on a tropical cyclone of cooler surface waters due to upwelling and mixing produced by a prior tropical cyclone. J. Appl. Meteor., 10, 865-874.
Carrier, G. F., 1971: The intensification of hurricanes. J. Fluid Mech., 49, 145-158.
Ceselski, B. F., 1974: Cumulus convection in weak and strong tropical disturbances. J. Atmos. Sci., 31, 1241-1255.
Chang, C. P., 1970: Westward propagating cloud patterns in the tropical Pacific as seen from time-composite satellite photographs. J. Atmos. Sci., 27, 133-138.
Charney, J. C., and A. Eliassen, 1949: A numerical method for predicting the perturbations of the middle-latitude westerlies. Te1lus, 1, 38-54.
and ,1964: On the growth of the hurricane depression. J. Atmos. Sci., 21, 68-75.

III
Cox, S. K., 1968: A radiation model in which the effects of clouds are simulated fro~ moisture and temperature parameters. Annual Report on WBG-88, Department of 11eteorology, University of Wisconsin, 2-50.
---, 1971: Infrared radiation models for the tropics. Proceedings of the Miami Workshop on Remote Sensing, NOAA, Boulder,.Oolorado, 161-178.
---, 1973: Radiation components of the energy budget for BOMEX. Department of Atmospheric Science Report No. 208. Colorado State University, 43 pp.
Dunn, G. E., 1940: Cyclogenesis in the tropical Atlantic. Bull •. Am. Meteor. Soc., 21, 215-229.
______ a 1951: Tropical cyclones. Compendium of Meteorology, American Meteorological Society, Boston, Mass., 887-901.
Fett, R. W., 1964: Aspects of hurricane structure: New model considerations suggested by TIROS and Project Mercury observations. Mon. Wea. Rev., 92, 43-60.
---, 1968: Typhoon formation within the zone of the intertropical convergence. Mon. Wea. Rev., 96, 106-117.
Fisher, E. L., 1958: Hurricanes and the sea-surface temperature field. J. Ueteor., 15, 328-333.
Frank, N. L., 1969: The "Inverted V" cloud pattern - an easterly wave? Mon. Wea. Rev., 97, 130-140.
---,1970a: Atlantic tropical systems of 1969. MOn. Wea. Rev., 98, 307-324.
______ , 1970b: Energetics of cold lows. Proc. of the Symp. on Trop. Meteor., Honolulu, 2-11 June, 1970, Hawaii Inst. of Geophys.
---,1971: Atlantic tropical systems of 1970, Mon. Wea. Rev., 99, 281-285.
---,1972: Atlantic tropical systems of 1971~ Mon. Wea. Rev., 100, 268-275.
______ , 1973: Atlantic tropical systems of 1972, Men. Wea. Rev., 101, 334-338.
______ , and T. M. Johnson, 1969: Vertical cloud systems over the tropical Atlantic during the 1967 hurricane season. Men. Wea. Rev., 97, 124-129.
---, and P. J. Hebert, 1974: Atlantic tropical systems of 1973, Mon. Wea. Rev., 102, 290-295.

112
Gars tang , M., 1967: Sensible and latent heat exchange in low latitudes synoptic scale systems. Tellus, 19, 492~508.
Gray, W. M., 1963: Global view of the origin of tropical disturbances an.d storms. Mon. Wea. Rev., 96, 669-700.
,1972: A diagnostic study of the planetary boundary layer over -----::
the oceans. Department of Atmospheric Science, Colorado State University, Fort Collins. Atmos. Sci •. Paper 179, 1-95.
---,1973: Cumulus convection and large-scale circulations, Part I: Broadscale and meso-scale interactions. Mon. Wea. Rev., 101, 839-855.
Harrison, E. J., 1973: Three-dimensional numerical simulations of tropical storms utilizing nested finite grids. J. Atmos. Sci., 30, 1528-1543.
Heffernan, R. F., 1972: Hurricane heat potential of the North Atlantic and North Pacific Oceans. M.S. thesis of the Naval Postgraduate School, Monterey, California, 109 pp.
Holton, J., 1971: A diagnostic model for equatorial wave disturbances: The role of vertical shear of the mean zonal wind. J. Atmos. Sci., 28, 55-64.
Hubert, L. F., A. F. Krueger, and J. S. Winston, 1969: The double intertropical convergence zone - fact or fiction? J. Atmos Sci., 26, 771-773.
Jordan, C. L., 1958: Mean soundings of the West Indies area. J. of Meteor., 15, 91-92.
---, 1964: On the influence of tropical cyclones on the sea surface temperature field. Froc. Symp. Tropical Meteorology, t~ellington, New Zealand Meteor. Service, 614-622.
Kuo, H. L., 1965: On formation and intensification of tropical cyclone through latent heat release by cumulus convection. J. Atmos. Sci., 22, 40-63.
Kurihara, Y., and R. E. Tuleya, 1974: Structure of a tropical cyclone developed in a three-dimensional numerical simulation model. J. Atmos. Sci., 31, 893-919.
Landis, R. C., and D. F. Leipper, 1968: Effects of Hurricane Betsy upon Atlantic ocean temperature, based upon radio transmitted data. J. Apple Meteor., 7, 544-562.
LaSeur, N. E., 1962: On the role of convection in hurricanes. Proc. of the Second Tech. Conf. on Hurricanes, Miami, Fla., 1961, Nat. Hurr. Res. Proj. Report No. 50, 323-334. (Available from the U. S. Weather Bureau, Miami, Fla.)

113
Leipper, D. F., 1967: Observed ocean conditions and Hurricane Hilda, 1964. J. Atmos. Sci., 24, 182-196.
---, and J. Jensen, 1971: Changes in energy input from the sea into hurricanes. Bull. Am. Meteor. Soc., 52, 928.
---, and D. Volgenau, 1972: Hurricane heat potential of the Gulf of Mexico. J. Of Phy. Ocean., 2, 218-224.
Lopez, R. E., 1968: Investigation of the importance of cumulus convection and ventilation in early tropical storm development. Colorado State University, Atmos. Sci. Paper No. 124, Fort Collins, 86 pp.
---, 1973a: Cumulus convection and larger scale circulations. Part II: Cumulus and mesoscale interactions. Mon. Wea. Rev., 101, 856-870.
---,1973b: A parametric model of cumulus convection. J. Atmos. Sci., 30, 1345-1373.
Malkus, J. S., and H. Riehl, 1960: On the dynamics and energy transformation in steady-state hurricanes, Tellus, 12, 1-20.
Mathur, M. B., 1972: Simulation of an asymmetric hurricane with a fine mesh multiple grid primitive equation model. Ph.D. dissertation, Florida State University, Tallahassee, Florida, 162 pp.
Miller, B. I., 1964: A study of the filling of hurricane Donna (1960) over land. Mon. Wea. Rev., 94, 389-406.
---, 1969: Experiment in forecasting hurricane development with real data. ESSA Tech. Memorandum ERLTM-NHRL 85, Miami, Fla. 23 pp.
O'Brien, J. J., 1967: The non-linear response of a two-layer, baroclinic ocean to a stationary, axially-symmetric hurricane: Part II. Upwelling and mixing induced by momentum transfer. J. of Atm. Sci., 24, 208-215.
, and R. O. Reid, 1967: The non-linear response of a two-layer --~ baroclinic ocean to a stationary, axially-symmetric hurricane: Part
I. Upwelling induced by momentum transfer. J. of Atm. Sci., 24, 197-207.
Ooyama, K., 1969: Numerical simulation of the life cycle of tropical cyclones. J. Atmos. Sci., 26, 3-40.
Palm~, E. H., 1948: On the formation and structure of tropical cyclones, Geophysica, Helsinki, 3, 26-38.
___ , 1957: A review of knowledge on the formation and dev~lopment of tropical cyclones, Proc. Tropical Cyclone Symp., Brisbane, December 1965, Wilke & Co., Ltd., Melbourne, 213-231.

114
Perlroth~ I., 1967: Hurricane behavior as related to oceanographic environmental conditions. Tellus, 19, 258-268.
,1969: Effects of oceanographic media on equatorial Atlantic ----~ hurricanes. Tellus, 21, 230-244~
Ramage, C., 1974: Monsoonal influences on the annual variation of tropical cyclone development over the Indian and Pacific Oceans. Mon. Wea. Rev., 102, 745-753
Riehl, H., 1954: Tropical Meteorology, McGraw-Hill, New York,392 pp.
------, 1957-1962: Much personal communication during this period.
Rosenthal, S. L., 1970: A circularly symmetric primitive equation of tropical cyclone development containing an explicit water vapor cycle. Mon. Wea. Rev., 98, 643-663.
Ruprecht, E., and W. M. Gray, 1974: Analysis of satellite-observed tropical cloud clusters. Colorado State University, Fort Collins, Atmos. Sci. Paper 219, 91 pp.
Sadler, J. C., 1967a: On the origin of tropical vortices. Working Panel on Trop. Dyn. Meteor. Naval Post Graduate School, Monterey, Calif., 39-75.
------,1967b: The tropical tropospheric trough as a secondary source of typhoons and a primary source of tradewind disturbances. Final Rept. Cont. AF19 (628)3860, A. F. Cambridge Res. Lab., Bedford, Mass., Rept. 67-12, 44 pp.
------,1974a: A role of the tropical upper tropospheric trough in early seasonal typhoon development. Tech. Paper No. 9-74, ENVPREDRSCHFAC, U. S. Navy Environmental Prediction Research Facility Report. 54 Pp.
------,1974b: Personal Communication.
Sartor, J., 1968: Monthly climatological wind fields associated with tropical storm genesis in the West Indies. Colorado State Univ., Ft. Collins, Atmospheric Science Research paper, 34 pp.
Simpson, R. H., 1971: The decision process in hurricane forecasting. Technical Memorandum NWS SR 53, National Weather Service, Southern Region, U. S. Department of Commerce, Miami, Florida.
------, and H. Riehl, 1958: Mid-tropospheric ventilation as a constraint on hurricane development and maintenance. Proc. of the Tech. Conf. on Hurricanes, Miami Beach, Fla., Nov. 10-22, 1958. D4-1 to D4-10.
Sundquist, H., 1970: Numerical simulation of the development of tropical cyclones with a ten-layer model. Part I. Tellus, 22, 359-390.

115
Wachtmann, R. F., 1968~ Role of angular momentum transport in tropical storm dissipation over tropical oceans. Colorado State University, Fort Collins, Abmospheric Science Research Paper, 46 pp.
Wallace, J. M., 1970: Time-longitude sections of tropical cloudiness (December 1966-November 1967), ESSA Technical Report, NESC 56, National Environmental Satellite Center, Suitland, Md., 37 pp.
Whitaker, W. D., 1967: Quantitative determination of heat transfer from sea to air during passage of hurricane Betsy. Master's Thesis, Texas A&M University, College Station, Texas. 65 pp.
Williams, K. T., and W. M. Gray, 1973: A statistical analysis of satellite-observed trade wind cloud clusters in the western north Pacific. Tellus, 21, 323-336.
Yamasaki, M., 1968: Numerical simulation of tropical cyclone development with the use of primitive equations. J. Meteor. Soc. Jap., 46, 178-201.
Yanai, M., 1961:. A detailed analysis of typhoon formation. J. Heteor. Soc. Japan, 39, 187-214.
---,1963: A preliminary survey of large-scale disturbances over the tropical Pacific region. Proc. 3rd Conf. on Hurricanes and Tropical Meteor., Mexico City. Geofisica, 3, 73-84.
______ , 1964: Formation of tropical cyclones, Reviews Geophys., 2, 367-414.
______ , 1968: Evolution of a tropical disturbanc~ in the Caribbean Sea region. J. of Meteor. Soc. of Japan, Series II, 46, 86-108.
______ , S. Esbensen, and J. H. Chu, 1973: Determination of bulk properties of tropical cloud clusters from large-scale heat and moisture budgets. J. Atmos. Sci., 30, 611-617.
Zipser, E. J., 1964: On the thermal structure of daveloping tropical cyclones. Nat'l Hurr. Res. Proj. Report No. 67, 23 pp. (Available from the U.S. Weather Bureau, Miami, Florida),
116
APPENDIX
Data Sources for Various Calculations.
1. Seasonal vorticity was calculated from the monthly gradient
level streamline charts of G. D. Atkinson and J. C. Sadler's 1970 report
entitled "Mean Cloudiness and Gradient Wind Charts over the Tropics",
(Air Weather Service Technical Report No. 215, Vol. II). Vorticity was
calculated for each month and then averaged to obtain seasonal mean
values.
2. Vertical shear of the horizontal wind from 950 to 200 mb was
calculated from the low level data source listed above and from specially
constructed 200 mb flow fields for the months of February, May, August,
and November which were accomplished by the author at Colorado State
University. The specially constructed 200 mb maps were made from the
NOAA Monthly Climatic Data for the World where 200 mb monthly vector
winds are listed. It was assumed that the February, May, August, and
November 200 mb wind vectors were typical of those of the January-March,
April-June, July-September, and October-Deeember periods respectively.
The vertical shear charts represent the magnitude of the mean wind
vector differences between the 200 and 950 mb levels.
3. The oceanic thermal energy calculations were made from the
ocean temperature depth data of the North Pacific as reported by
Robinson and Bauer (1971). The other oceanographic temperature depth
information was obtained from special printout data supplied to the
author at cost by the National Oceanographic Data Center (Suitland, MD).
This information contained special 50 latitude-longitude seasonal bathy
thermograph averages for all ocean areas except the North Pacific.

117
These special listings included all bathythermograph data which the
Oceanographic Data Center had through 1972. Most 50 squares had ample
o Some 5 squares in the Southern Hemisphere had only a dozen
or so recorded seasonal temperature soundings. Nevertheless, this is
the best information which is available. These records contain mean
ocean temperatures and standard deviations of temperature and salinity
by 10 m depth intervals. o Although some 5 squares are not well sampled,
the seasonal energy calculations from this data are believed to be gen-
erally representative.
4. e gradients between the surface and 500 mb were calculated e
from monthly values of temperature and moisture from the NOAA Monthly
Climatic Data of the World Listings for the months. of February, May,
August, and November. These months were taken as representative of the
January-March, April-June, July-September, and October-December seasonal
averages.
5. Relative humidity at 500 and 700 rob was obtained from the monthly
mean of information of the NOAA Monthly Climatic Data of the World which
was adjusted and smoothed to fit as well as possible the upper air
moisture data contained in the United States Navy Marine Atlas of the
World, Vols. I-V and the 1969 report by J. J. Taljaard, H. VanLoon,
H. L. Crutcher and R. L. Jenne titled "Climate of the Upper Air, South-
ern Hemisphere, Vol. I, Temperature, Dew Point, and Height by Month at
Selected Pressure Levels". Some degree of smoothing and reconciliation
of these data sources was required. Special attention had to be paid
to biases introduced by different sondes and diurnal moisture measuring
errors. Figures 42, 57, 72 and 87 represent the author's best recti-
fied values.
~18
6. Initial tropical cyclone genesis location data was obtained
from the author's previous global data on tropical cyclone origin and
from updated information listed in the combined U.S. Navy Environmental
Prediction Research Facility and the NOAA Nationa~ Weather Records Cen
ter, Asheville, NC, printout tape of tropical cyclone date, position,
intensity, etc. This tape was kindly furnished to the author by Mr.
Samson Brand of the Navy Environmental Prediction Facility. The twenty
year period of 1952-1971 was used in this study. The tropical cyclone
origin points in the Northern Bay of Bengal may be excessive. Develop
ing cyclones in this region often move inland before they become very
intense. Some confusion in cyclone classification may be present. The
author has no reason to question the basic reliability of the cyclone
origin data from the other oceans.
7. Information on the characteristics of satellite-observed tro
pical cloud clusters and pre-cyclone disturbances was taken from pre
vious and current Colorado State University studies on this subject by
the author and his colleagues. Some of this cloud cluster information
is contained in the reports of Williams and Gray (1973) and Ruprecht
and Gray (1974). The tropical cloud cluster movies of Bohan (1968) are
also helpful.
Fina~ Note to Reader. Any of you who have handled large amounts
of meteorological data know of the many difficulties in reconciling
different data sources and coming to grips with fragmentary or non
existent information as is available over parts of the tropical oceans.
The observational information contained in this report undoubtedly has
some degree of inaccuracy. This is unavoidable. These possible data
inaccuracies are, however, not felt to be of sufficient importance as

119
to significantly alter any of the ideas or conclusions presented.
Much effort was expended to come up with the best possible parameter
analyses.
120
BIBLIOGRAPHY OF GENERAL TROPICAL DATA SOURCES
Atkinson, G. D., 1971: Forecaster's guide to tropical meteorology. Unpublished Air Weather Service (MAC) Technical Report No .. 240, 300 pp. (Available from Hq., AWS, Scott AFB, IL).
----, and J. C. Sadler, 1970: Mean-cloudiness and gradient-level-wind charts over the tropics. Tech. Rept. 215, II, published by U.S. Air Weather Service (MAC).
Bohan, W. A., 1968: Tropical Pacific cloud patterns. ESSA Digital Product, 1967 (WAB 196), 16-mm film prepared by Walter S. Bohan Co., Park Ridge, IL.
Chief of Naval Operations, 1966: Components of the 1000 mb (or surface 'winds) winds of the northern hemisphere. NAVAIR 50-1C-51.
Crutcher, H. L., 1961: Meridional cross-sections - upper winds over the northern hemisphere. Tech. Paper No. 41, U. S. Dept. of Commerce, Superintendent of Documents, LT .. S. Government Printing Office, Washington, DC, 307 pp.
-----, and J. M. Meserve, 1970: Selected level heights, temperatures and dew points for the northern hemisphere. NAVAIR 50-1C-52, Navy Weather Service Command.
-----, and R. G. Quale, 1974: Mariners' worldwide climatic guide to tropical storms at sea. NOAA/EDS National Climatic Center and Naval Weather Service Publication (NAVAIR 50-1C-61). (Available from NOAA, Asheville, NC).
Fleet Weather Central/Joint Typhoon Warning Center, (FWC/JTWC) Guam. Annual Typhoon reports of 1946-1973. Summaries of aircraft reconnaissance reports, tropical cyclone tracks, forecasts, etc.
Gray, W. M., 1968: Global view of the origin of tropical disturbances and storms. Mon. Wea. Rev .. , 96, 669-700.
Krishnamurti, T. N., 1971: Observational study of the tropical upper tropospherIc motion field during the northern hemisphere summer. J. of Appl. Meteor., 10, 1066-1096.
__________ , and E. B. Rodgers, 1970: August, 1967. Rept. No. 70-2. State University, 114 pp.
200 rob wind field; June, July, Dept. of Meteorology, Florida
Malkus, J., 1960: The air and sea in interaction. Woods Hole Oceanographic Institution, 350 pp.

121
BIBLIOGRAPHY OF GENERAL TROPICAL DATA SOURCES (cont'd)
Robinson, M. K., 1973: Atlas of monthly mean sea surface and sub-surface temperature and depth of the thermocline, Gulf of Mexico and Caribbean Sea. Research Rept. of the Scripps Institute of Oceanography, Univ. of California, San Diego, CA, 105 pp.
and R. A. Bauer, 1971: Atlas of monthly mean sea surface ------a-n~d--s-ub~s-urface temperature and depth of the top of the thermocline,
North Pacific Ocean. Monterey, Fleet Numerical Weather Central, 72 charts.
Ruprecht, E. and W. M. Gray, 1974: Analysis of satellite-observed tropical cloud clusters. Colo. State Univ., Dept. of Atmospheric Science Paper No. 219, 91 pp.
Newell, R. E., et al., 1972: The general circulation of the tropical atmosphere. The M.l.T. Press, Cambridge, MA., 258 pp.
Simpson, J., 1973: The global energy budget and the role of cumulus clouds. NOAA Technical Memorandum FRL WMPO-8, l75 ,pp. •
Taljaard, J. J., H. Van Loon, H. L. Crutcher, and R. J. Jenne, 1969: Climate of the upper air, Part 1, Southern hemisphere, Vol. 1, temperature, dew points and height. NAVAIR 50-lC-55, Navy Weather Service Command, Washington, DC.
U. S. Navy Marine Climatic Atlas of the World. Selected level temperatures and dew points for the northern hemisphere (NAVAIR 50-lC-52) 1 September 1966 (published by direction of Chief of Naval Operations) Superintendent of Documents, U.S. Government Printing Office, Washington, DC.
U. S. Navy Oceanographic Marine Climatic Atlas of the World, 1957-1959: Volumes II (North Pacific), III (Indian Ocean), IV (South Atlantic Ocean), V (South Pacific Ocean) and VII (Antarctic). Washington, DC.
U. S. Navy Oceanographic Atlas of the North Atlantic Ocean, Pub., 700, Section IV, 1963: U. S. Navy Oceanographic Office, Washington, DC, 235 pp.
U. S. Weather Bureau (NOAA) Monthly Climatic Data for the World, 1960-1968.
Williams, K. and W. M. Gray, 1973: A statistical analysis of sate1liteobserved trade wind cloud clusters in the Western North Pacific. Te11us, 21, 313-336. (Also see more expanded CSU Dept. of Atmospheric Sc~ence 1970 Project Report No. 161).

81BLIOGRAPHIC OATA 11• R.:port ~~. SHEET CSU-ATSP-234
4. Tide .lnd Subc ide
TROPICAL CYCLONE GENESIS
7. Author(s)
Willi:rm M. GrAv 9. Performin& Org3niz:uion :\ame and Address
Atmospheric Science Department Colorado State University Fort Collins, CO 80523
12. Sponsoring Org::mization :\ame ilnd Address
Nation~l Science Foundation Washington, D.C. 20550
15. Supplementary ~oces
16. Abstracts
3. Recipient's Accession ~o.
s. Report Date
March .. 1975 6.
8. Performing Organization Repr.
No. CSU-ATSP-234 10. Project/Task/Work unit ~o.
11. Contract/Grant :\0.
NSF GA-32589X3 13. Type ot Report &. Period
Covered
Pro.i ect Report 14.
A new global observational and theoretical study of tropical cyclone genesis is made. This is an extension of the autbor's previous, study (Gray, 1968) on this subject. Cyclone initial genesis locations have been stratified by season for the 20-year period of 1952-1971. Wind, temperature and moisture information are averaged by season and by 5-degree latitude-longitude Marsden squares. It is observationally shown and physical reasons are given why seasonal cyclone genesis frequency is related to the product of the seasonally averaged parameters of: 1) low level relative vorticity, 2.) Corialis parameter, 3) inverse of the vertical .shear of the horizontal wind from lower to upper troposphere, 4) ocean's thermal energy to 60 meters' depth, 5) moist stability from the surface to 500 rob, and 6) middle troposphere relative humidity. A seasonal forecast potential of cyclone genesis frequency is derived. This forecast potential very well specifies the location and frequency of global cyclone genesis. A general theory on cyclone frequency is advanced.
17. Key \\ords and Document An.llysis. 170. Des~riptors
Tropical Cyclone Formation Tropical Circulations Tropical Cumulus Convection
17b. IdencifiersiOpen-Ended Terms
17c:. COS:\ Tl fitdd/Grol.Lp
18. Avall1bility Statement
551.515.53 551.515,,52
THIS FORM MAYBE REPRODUCED
21. ~o. ot Pages
121