Estimation of Tropical Cyclone Intensity Using Satellite ... of Tropical Cyclone Intensity Using...
15
Estimation of Tropical Cyclone Intensity Using Satellite Passive Microwave Observations 71st IHC/2017 Tropical Cyclone Research Forum March 15-17, 2017 1 Haiyan Jiang 1 , Bo You 2 , and Cheng Tao 1 , 1 Florida International University 2 Yale University
-
Upload
nguyenkhanh -
Category
Documents
-
view
222 -
download
2
Transcript of Estimation of Tropical Cyclone Intensity Using Satellite ... of Tropical Cyclone Intensity Using...
Estimation of Tropical Cyclone Intensity Using Satellite Passive Microwave Observations
71st IHC/2017 Tropical Cyclone Research Forum March 15-17, 2017
1
Haiyan Jiang 1, Bo You 2, and Cheng Tao 1, 1Florida International University
2 Yale University
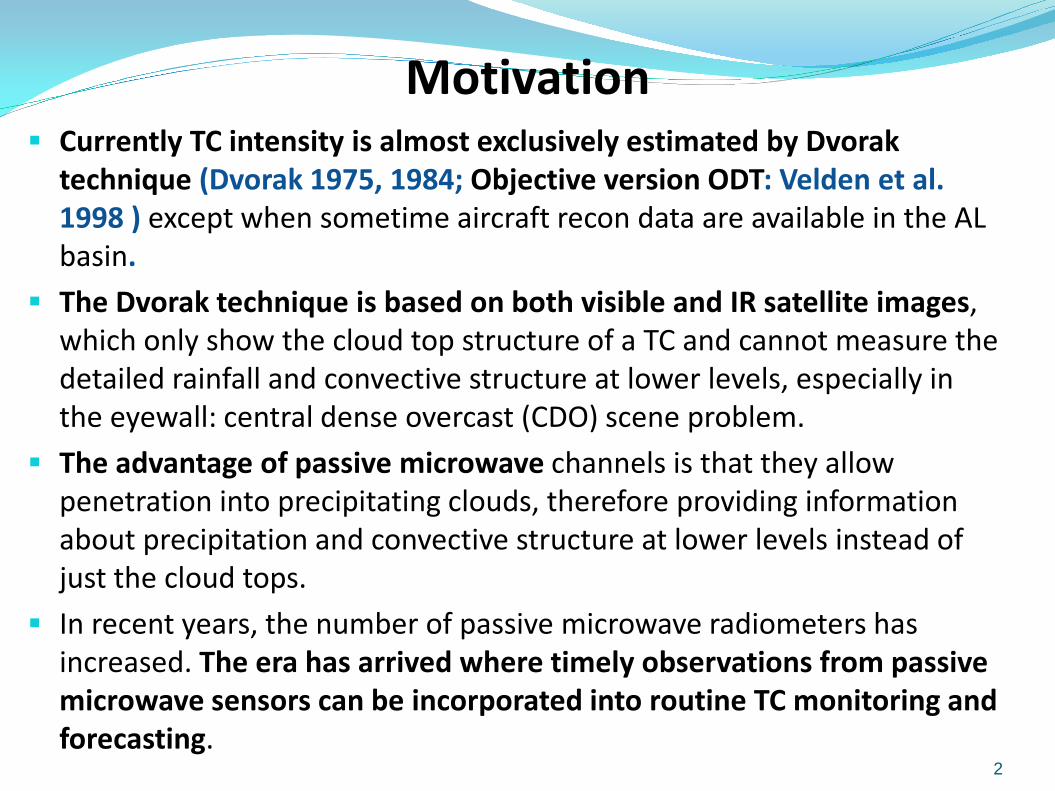
Motivation Currently TC intensity is almost exclusively estimated by Dvorak
technique (Dvorak 1975, 1984; Objective version ODT: Velden et al. 1998 ) except when sometime aircraft recon data are available in the AL basin.
The Dvorak technique is based on both visible and IR satellite images, which only show the cloud top structure of a TC and cannot measure the detailed rainfall and convective structure at lower levels, especially in the eyewall: central dense overcast (CDO) scene problem.
The advantage of passive microwave channels is that they allow penetration into precipitating clouds, therefore providing information about precipitation and convective structure at lower levels instead of just the cloud tops.
In recent years, the number of passive microwave radiometers has increased. The era has arrived where timely observations from passive microwave sensors can be incorporated into routine TC monitoring and forecasting.
2
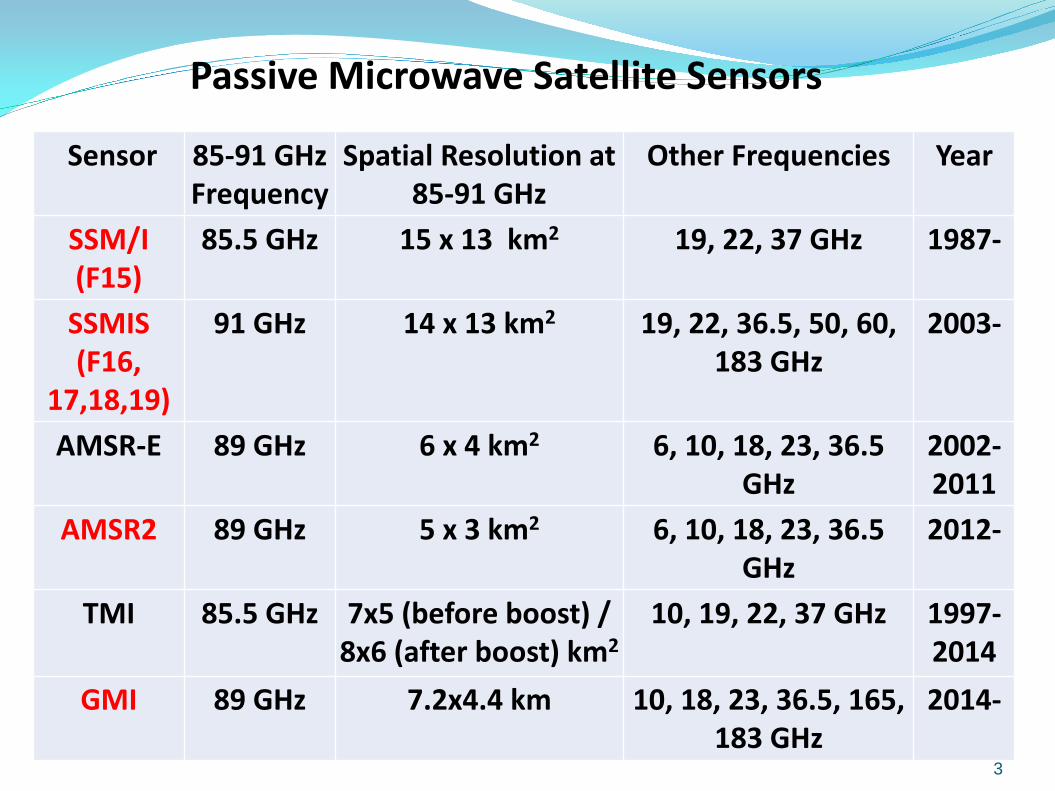
Passive Microwave Satellite Sensors
3
Sensor 85-91 GHz Frequency
Spatial Resolution at 85-91 GHz
Other Frequencies Year
SSM/I (F15)
85.5 GHz 15 x 13 km2 19, 22, 37 GHz 1987-
SSMIS (F16,
17,18,19)
91 GHz 14 x 13 km2 19, 22, 36.5, 50, 60, 183 GHz
2003-
AMSR-E 89 GHz 6 x 4 km2 6, 10, 18, 23, 36.5 GHz
2002-2011
AMSR2 89 GHz 5 x 3 km2 6, 10, 18, 23, 36.5 GHz
2012-
TMI 85.5 GHz 7x5 (before boost) / 8x6 (after boost) km2
10, 19, 22, 37 GHz 1997-2014
GMI 89 GHz 7.2x4.4 km 10, 18, 23, 36.5, 165, 183 GHz
2014-
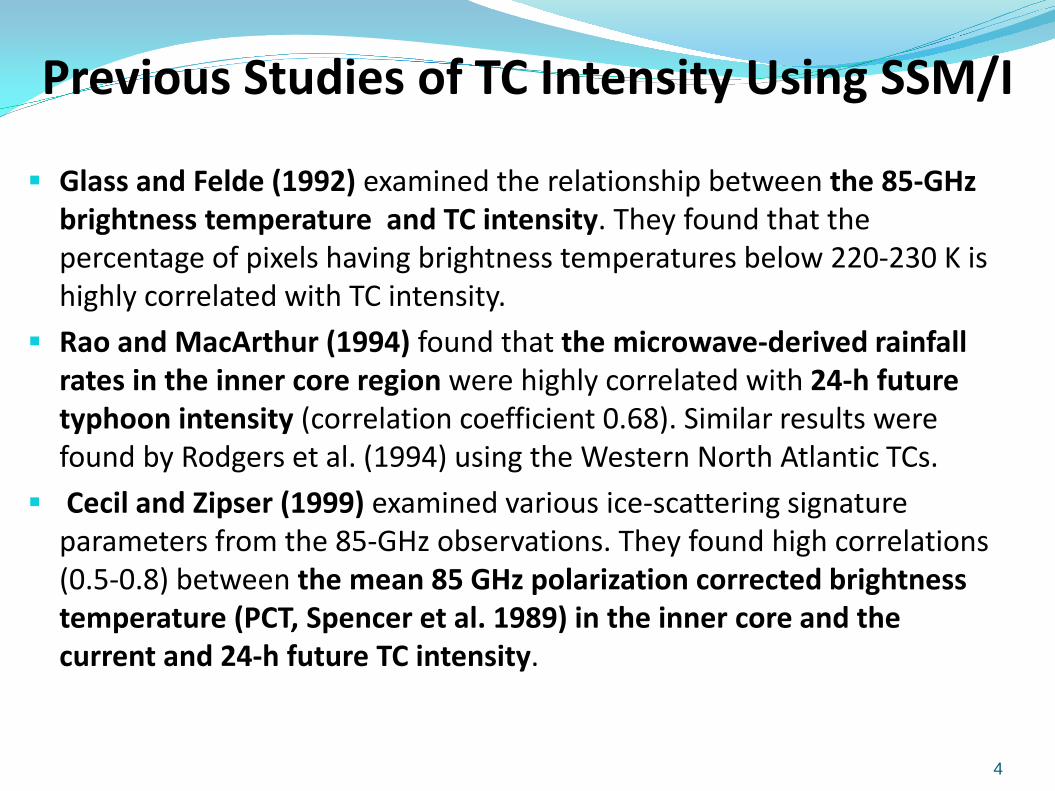
Previous Studies of TC Intensity Using SSM/I
Glass and Felde (1992) examined the relationship between the 85-GHz brightness temperature and TC intensity. They found that the percentage of pixels having brightness temperatures below 220-230 K is highly correlated with TC intensity.
Rao and MacArthur (1994) found that the microwave-derived rainfall rates in the inner core region were highly correlated with 24-h future typhoon intensity (correlation coefficient 0.68). Similar results were found by Rodgers et al. (1994) using the Western North Atlantic TCs.
Cecil and Zipser (1999) examined various ice-scattering signature parameters from the 85-GHz observations. They found high correlations (0.5-0.8) between the mean 85 GHz polarization corrected brightness temperature (PCT, Spencer et al. 1989) in the inner core and the current and 24-h future TC intensity.
4
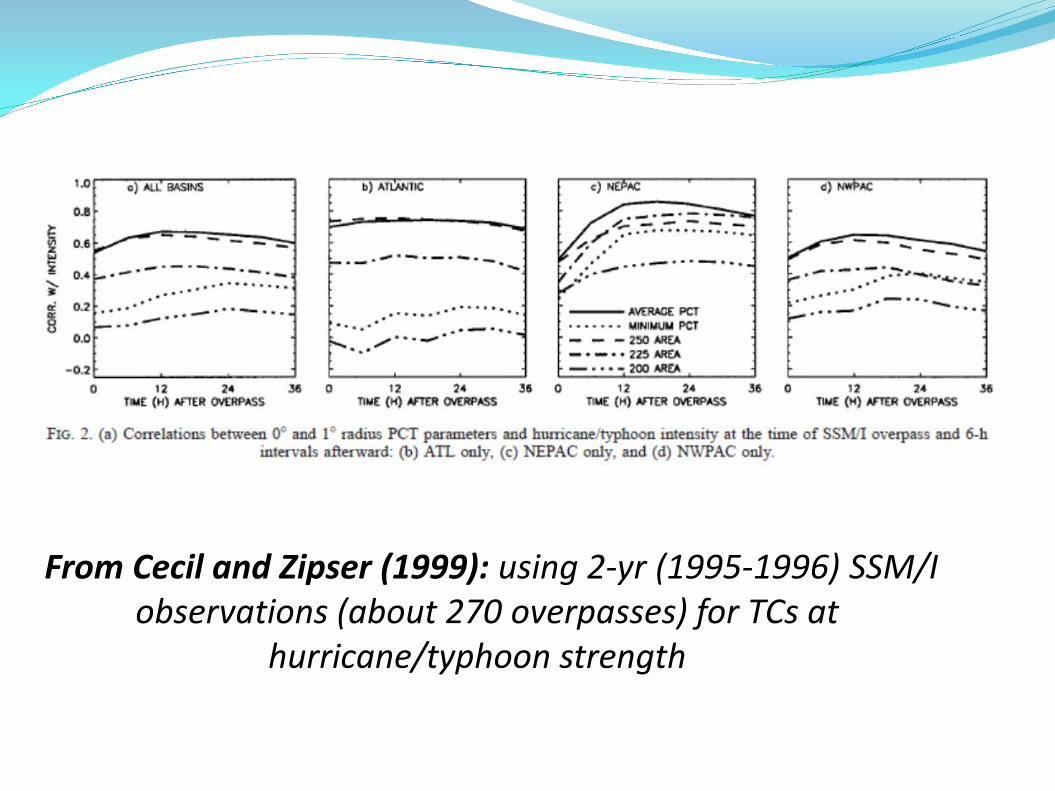
From Cecil and Zipser (1999): using 2-yr (1995-1996) SSM/I observations (about 270 overpasses) for TCs at
hurricane/typhoon strength )
Objectives
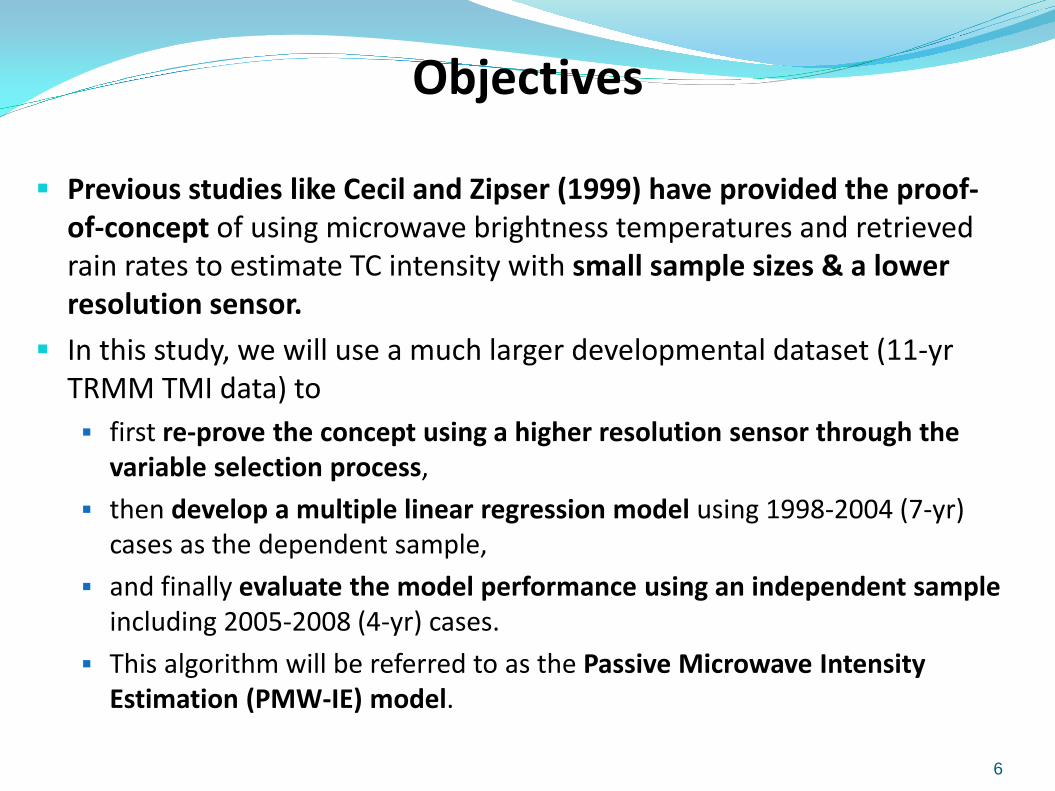
Previous studies like Cecil and Zipser (1999) have provided the proof-of-concept of using microwave brightness temperatures and retrieved rain rates to estimate TC intensity with small sample sizes & a lower resolution sensor.
In this study, we will use a much larger developmental dataset (11-yr TRMM TMI data) to first re-prove the concept using a higher resolution sensor through the
variable selection process, then develop a multiple linear regression model using 1998-2004 (7-yr)
cases as the dependent sample, and finally evaluate the model performance using an independent sample
including 2005-2008 (4-yr) cases. This algorithm will be referred to as the Passive Microwave Intensity
Estimation (PMW-IE) model.
6
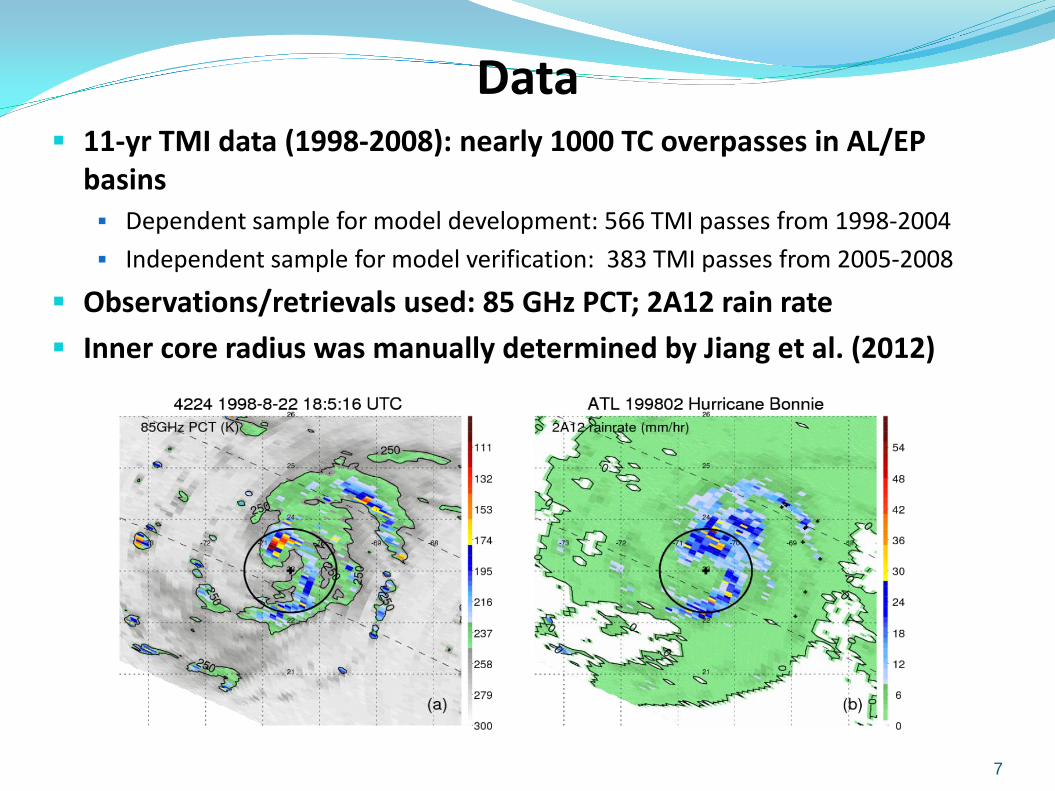
Data 11-yr TMI data (1998-2008): nearly 1000 TC overpasses in AL/EP
basins Dependent sample for model development: 566 TMI passes from 1998-2004 Independent sample for model verification: 383 TMI passes from 2005-2008
Observations/retrievals used: 85 GHz PCT; 2A12 rain rate Inner core radius was manually determined by Jiang et al. (2012)
7
Selection of Variables
8
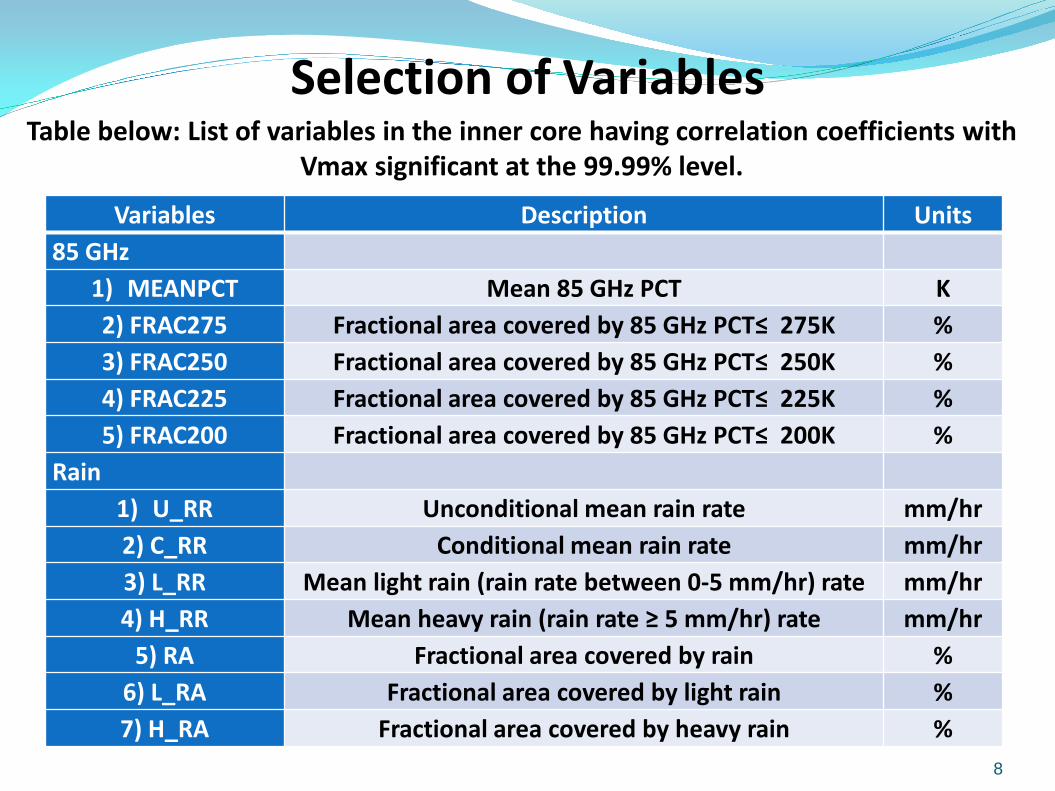
Variables Description Units 85 GHz
1) MEANPCT Mean 85 GHz PCT K 2) FRAC275 Fractional area covered by 85 GHz PCT≤ 275K % 3) FRAC250 Fractional area covered by 85 GHz PCT≤ 250K % 4) FRAC225 Fractional area covered by 85 GHz PCT≤ 225K % 5) FRAC200 Fractional area covered by 85 GHz PCT≤ 200K %
Rain 1) U_RR Unconditional mean rain rate mm/hr 2) C_RR Conditional mean rain rate mm/hr 3) L_RR Mean light rain (rain rate between 0-5 mm/hr) rate mm/hr 4) H_RR Mean heavy rain (rain rate ≥ 5 mm/hr) rate mm/hr
5) RA Fractional area covered by rain % 6) L_RA Fractional area covered by light rain % 7) H_RA Fractional area covered by heavy rain %
Table below: List of variables in the inner core having correlation coefficients with Vmax significant at the 99.99% level.
Proof-of-Concept: Correlation Coefficients
9
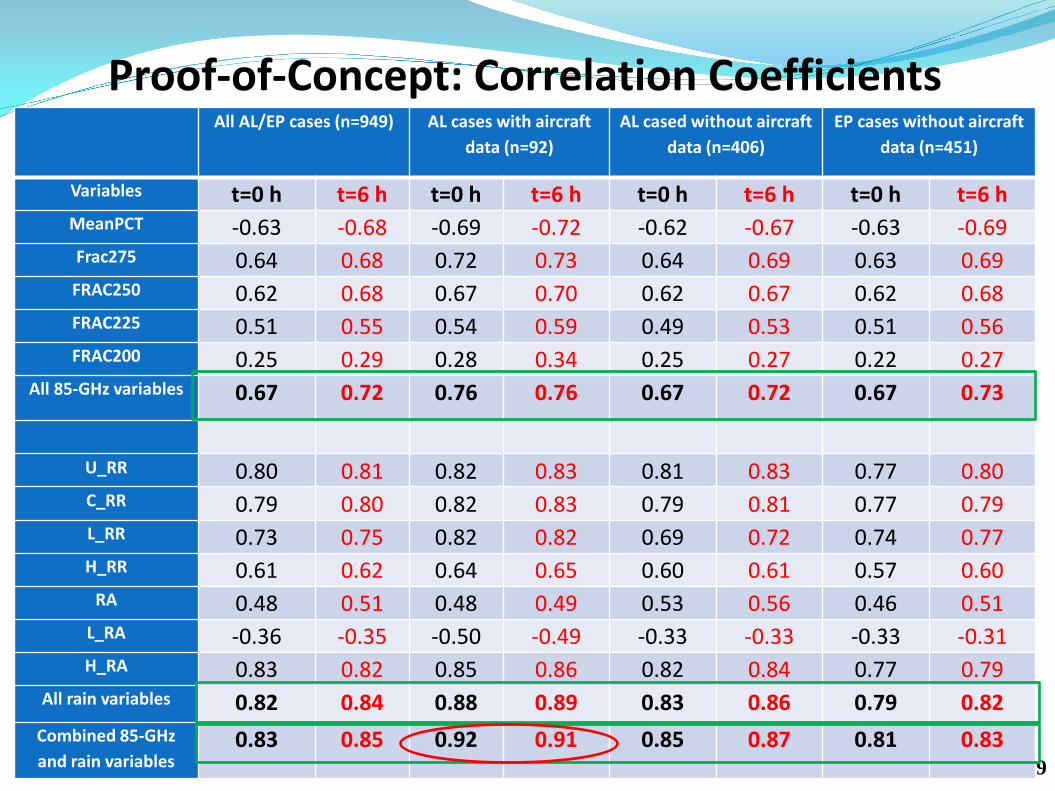
All AL/EP cases (n=949) AL cases with aircraft data (n=92)
AL cased without aircraft data (n=406)
EP cases without aircraft data (n=451)
Variables t=0 h t=6 h t=0 h t=6 h t=0 h t=6 h t=0 h t=6 h MeanPCT -0.63 -0.68 -0.69 -0.72 -0.62 -0.67 -0.63 -0.69 Frac275 0.64 0.68 0.72 0.73 0.64 0.69 0.63 0.69 FRAC250 0.62 0.68 0.67 0.70 0.62 0.67 0.62 0.68 FRAC225 0.51 0.55 0.54 0.59 0.49 0.53 0.51 0.56 FRAC200 0.25 0.29 0.28 0.34 0.25 0.27 0.22 0.27
All 85-GHz variables 0.67 0.72 0.76 0.76 0.67 0.72 0.67 0.73
U_RR 0.80 0.81 0.82 0.83 0.81 0.83 0.77 0.80 C_RR 0.79 0.80 0.82 0.83 0.79 0.81 0.77 0.79 L_RR 0.73 0.75 0.82 0.82 0.69 0.72 0.74 0.77 H_RR 0.61 0.62 0.64 0.65 0.60 0.61 0.57 0.60
RA 0.48 0.51 0.48 0.49 0.53 0.56 0.46 0.51 L_RA -0.36 -0.35 -0.50 -0.49 -0.33 -0.33 -0.33 -0.31 H_RA 0.83 0.82 0.85 0.86 0.82 0.84 0.77 0.79
All rain variables 0.82 0.84 0.88 0.89 0.83 0.86 0.79 0.82 Combined 85-GHz and rain variables
0.83 0.85 0.92 0.91 0.85 0.87 0.81 0.83
Multiple-Linear Regression Model
10
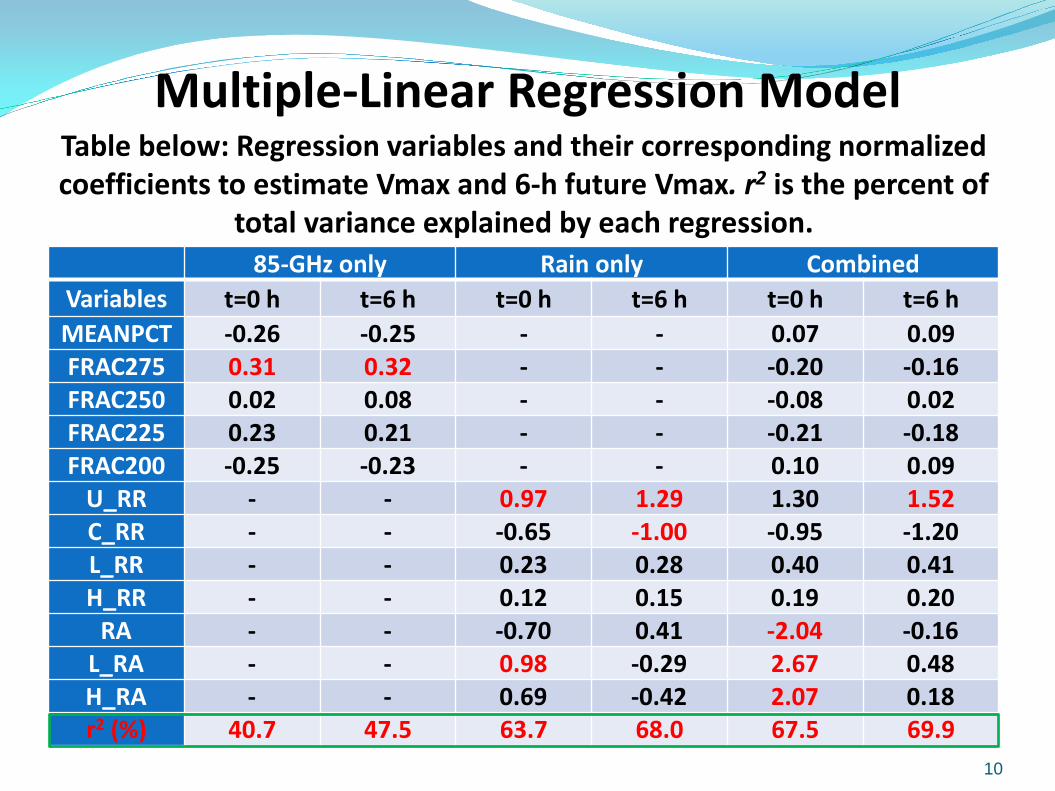
Table below: Regression variables and their corresponding normalized coefficients to estimate Vmax and 6-h future Vmax. r2 is the percent of
total variance explained by each regression. 85-GHz only Rain only Combined
Variables t=0 h t=6 h t=0 h t=6 h t=0 h t=6 h MEANPCT -0.26 -0.25 - - 0.07 0.09 FRAC275 0.31 0.32 - - -0.20 -0.16 FRAC250 0.02 0.08 - - -0.08 0.02 FRAC225 0.23 0.21 - - -0.21 -0.18 FRAC200 -0.25 -0.23 - - 0.10 0.09
U_RR - - 0.97 1.29 1.30 1.52 C_RR - - -0.65 -1.00 -0.95 -1.20 L_RR - - 0.23 0.28 0.40 0.41 H_RR - - 0.12 0.15 0.19 0.20
RA - - -0.70 0.41 -2.04 -0.16 L_RA - - 0.98 -0.29 2.67 0.48 H_RA - - 0.69 -0.42 2.07 0.18 r2 (%) 40.7 47.5 63.7 68.0 67.5 69.9
Independent Verification
11
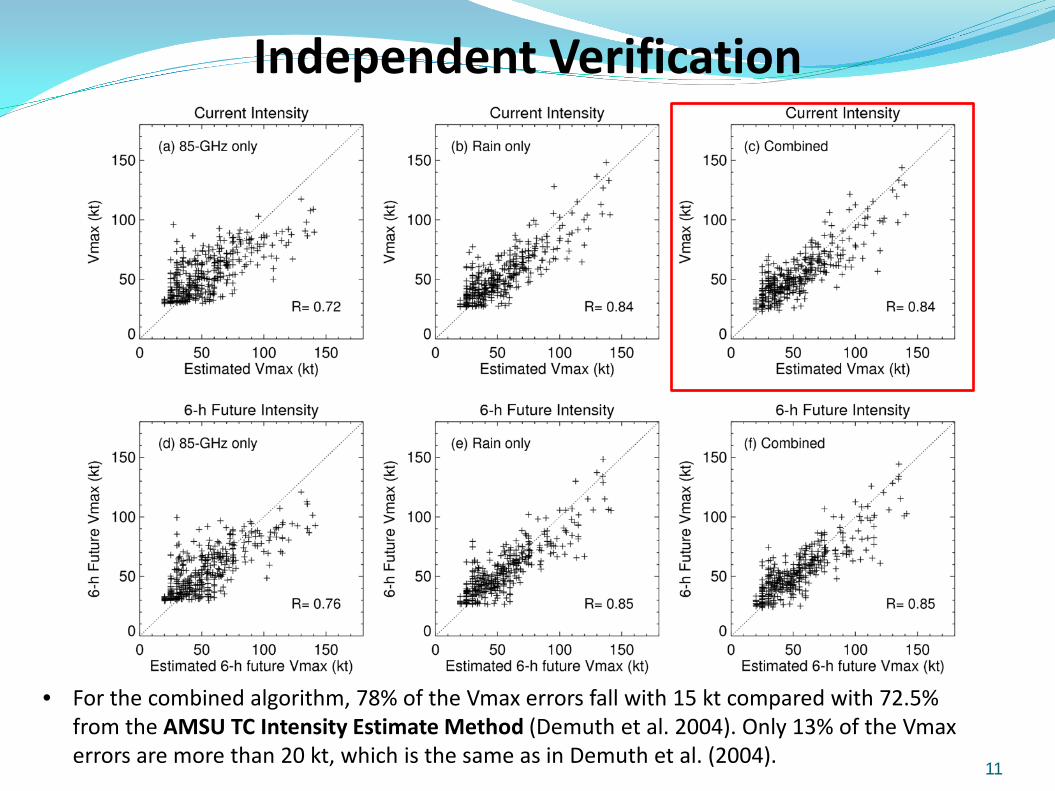
• For the combined algorithm, 78% of the Vmax errors fall with 15 kt compared with 72.5% from the AMSU TC Intensity Estimate Method (Demuth et al. 2004). Only 13% of the Vmax errors are more than 20 kt, which is the same as in Demuth et al. (2004).
Independent Verification
12
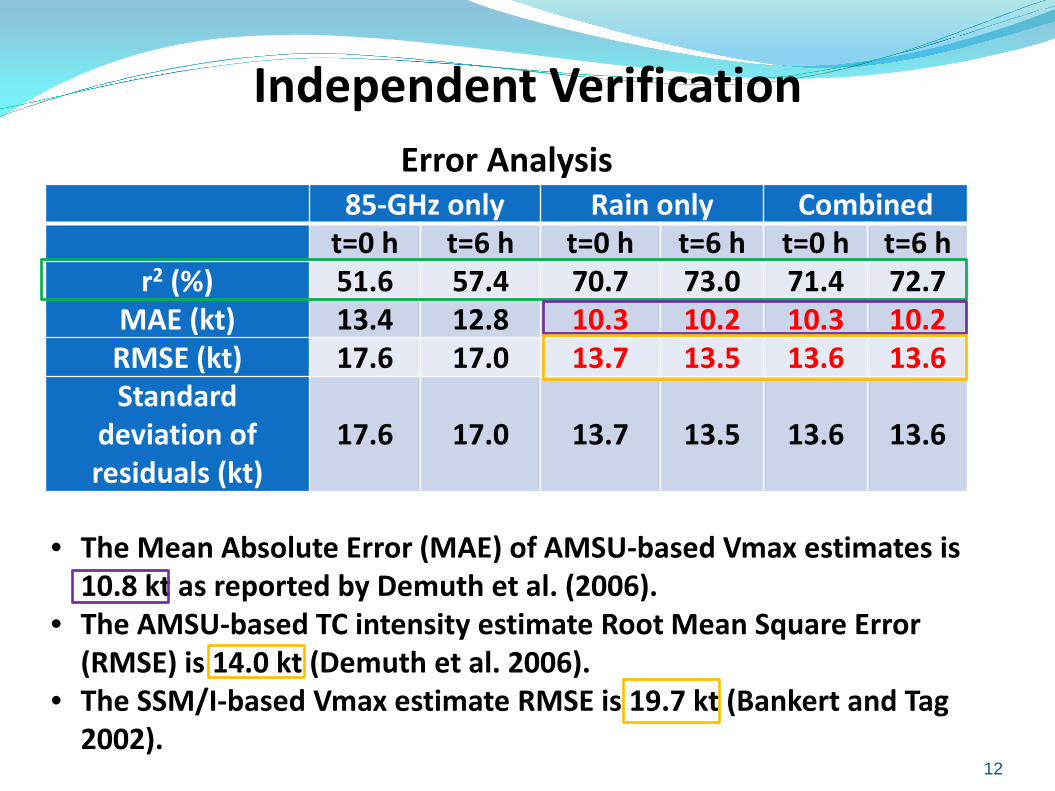
Error Analysis 85-GHz only Rain only Combined t=0 h t=6 h t=0 h t=6 h t=0 h t=6 h
r2 (%) 51.6 57.4 70.7 73.0 71.4 72.7 MAE (kt) 13.4 12.8 10.3 10.2 10.3 10.2 RMSE (kt) 17.6 17.0 13.7 13.5 13.6 13.6 Standard
deviation of residuals (kt)
17.6 17.0 13.7 13.5 13.6 13.6
• The Mean Absolute Error (MAE) of AMSU-based Vmax estimates is 10.8 kt as reported by Demuth et al. (2006).
• The AMSU-based TC intensity estimate Root Mean Square Error (RMSE) is 14.0 kt (Demuth et al. 2006).
• The SSM/I-based Vmax estimate RMSE is 19.7 kt (Bankert and Tag 2002).
Summary
As demonstrated in Landsea and Franklin (2013), the average best track uncertainty ranges from 5 to 15 kt when both satellite and aircraft data were available.
Our model is developed and verified against the best track, which contains mostly Dvorak estimates.
The results here suggest that the PMW-IE can provide TC intensity estimates that are slightly better than the AMSU method, and at least comparable to, if not better than, the Dvorak method.
But the PMW-IE estimates are independent of visible, IR, and microwave sounder observations. Because of this independence, the PMW-IE method will be able to provide additional information for TC forecasters who can utilize different methods to achieve more accurate intensity estimates.
13
Future Plan: Real-time Implementation In real-time, the 85-91 GHz observations will be available through the
GPM 1C-constelation near-real-time product, which includes the inter-calibrated brightness temperatures from GMI, ASMR2, and SSMIS.
The microwave rain retrievals will be from the GPM 2A-GPROF-constellation near-real-time product, which contains the rain rates retrieved from GMI, AMSR2, and SSMIS using the NASA GPROF algorithm (Kummerow et al. 1996).
The latency of the 1C-constelation near-real-time product is about 20 minutes to 1 hour, but the latency of the GPM 2A-GPROF-constellation near-real-time product is about 2 to 4 hours. Therefore, in real-time, the rain variables may or may not be available for estimating Vmax at the current synoptic time. But we still estimate the current Vmax using the regression model for the 6-h future Vmax.
14

Thanks for your attention!
15