Utilization of tropical cyclone heat potential for ... · Utilization of tropical cyclone heat...
27
1 Utilization of tropical cyclone heat potential for improving tropical cyclone intensity forecasts Akiyoshi Wada Meteorological Research Institute, Japan Meteorological Agency Abstract Tropical cyclone heat potential (TCHP) is a measure of ocean heat content from the surface to the depth of the 26°C isotherm (Z26). This report addresses the characteristics of a daily TCHP product experimentally used by the Japan Meteorological Agency (JMA) to elucidate tropical cyclone (TC) intensity in the western North Pacific. The product is derived from the North Pacific version of the Meteorological Research Institute multivariate ocean variational estimation (MOVE) system. This study used a five-day mean historical TCHP dataset covering the period from 1985 to 2012, which was validated based on in situ observations made via profiling floats from 2002 to 2012. The relationship between TC intensification and TCHP/Z26 before TC passage was also investigated using best-track data from the Regional Specialized Meteorological Center Tokyo. In climatological terms, TCHP is relatively high and Z26 is relatively deep east of the Philippines and around 150°E on the equator. Horizontal distributions show interannual variations of these two variables in association with TC activity in the western North Pacific. Validation reveals an average TCHP error of around 10 kJ cm -2 , corresponding to approximately 0.2°C based on the assumption that Z26 is equal to 100 m. Since 2008, TCHP has exhibited a trend of increase caused by errors in water temperature estimation at around 80 – 100 m. This report presents lookup tables for individual TC intensity values, speed of movement and geographical factors to highlight the relationship between TC intensification and TCHP/Z26 in the western North Pacific. 1. Introduction The ocean is a source of energy, heat and moisture for tropical cyclones (TCs) originating in tropical or subtropical ocean areas. The amount of heat and moisture transported through the air-sea interface depends on sea surface temperature, surface air temperature, surface moisture, surface winds and marine conditions. Estimation of heat and moisture fluxes at this interface is crucial in predicting TC intensification and maximum intensities of TCs. However, such estimation with a certain level of accuracy is
Transcript of Utilization of tropical cyclone heat potential for ... · Utilization of tropical cyclone heat...

1
Utilization of tropical cyclone heat potential for improving tropical cyclone intensity forecasts
Akiyoshi Wada Meteorological Research Institute, Japan Meteorological Agency
Abstract Tropical cyclone heat potential (TCHP) is a measure of ocean heat content from the surface to the depth of the 26°C isotherm (Z26). This report addresses the characteristics of a daily TCHP product experimentally used by the Japan Meteorological Agency (JMA) to elucidate tropical cyclone (TC) intensity in the western North Pacific. The product is derived from the North Pacific version of the Meteorological Research Institute multivariate ocean variational estimation (MOVE) system. This study used a five-day mean historical TCHP dataset covering the period from 1985 to 2012, which was validated based on in situ observations made via profiling floats from 2002 to 2012. The relationship between TC intensification and TCHP/Z26 before TC passage was also investigated using best-track data from the Regional Specialized Meteorological Center Tokyo. In climatological terms, TCHP is relatively high and Z26 is relatively deep east of the Philippines and around 150°E on the equator. Horizontal distributions show interannual variations of these two variables in association with TC activity in the western North Pacific. Validation reveals an average TCHP error of around 10 kJ cm-2, corresponding to approximately 0.2°C based on the assumption that Z26 is equal to 100 m. Since 2008, TCHP has exhibited a trend of increase caused by errors in water temperature estimation at around 80 – 100 m. This report presents lookup tables for individual TC intensity values, speed of movement and geographical factors to highlight the relationship between TC intensification and TCHP/Z26 in the western North Pacific.
1. Introduction The ocean is a source of energy, heat and moisture for tropical cyclones (TCs)
originating in tropical or subtropical ocean areas. The amount of heat and moisture transported through the air-sea interface depends on sea surface temperature, surface air temperature, surface moisture, surface winds and marine conditions. Estimation of heat and moisture fluxes at this interface is crucial in predicting TC intensification and maximum intensities of TCs. However, such estimation with a certain level of accuracy is

2
challenging in conditions of strong winds and high ocean waves due to the difficulty of performing direct in situ observation.
Sea surface temperature is generally considered to play a key role in TC genesis and development. Increases in sea surface temperature at a certain station are caused mostly by solar radiation and partly by horizontal advection, whereas reductions are caused by air-sea turbulent heat fluxes, long-wave radiation, one-dimensional vertical mixing and three-dimensional advection, including upwelling events induced by TCs. Palmén (1948) reported that TCs were not generated when the sea surface temperature was lower than 26.5°C. Such storms usually intensify over warm ocean areas at relatively low latitudes, but mature and transition to the decay phase when they move over marine areas with surface temperatures lower than 26°C.
The strong wind stress that accompanies TCs causes remarkable sea surface cooling and mixed-layer deepening in the upper ocean, indicating a direct effect on upper-ocean thermohaline conditions such as heat content. These conditions are in turn considered to potentially affect the supply of heat and moisture to the atmosphere.
In the area of TC-ocean interaction, the influence of sea surface temperature and upper-ocean heat content on TC intensity and intensification has been a subject of keen debate. Based on satellite altimeter observation data, Scharroo et al. (2005) and Scharroo (2006) pointed out that Hurricane Katrina (2005) intensified over warm-core eddies in the Gulf of Mexico basin, indicating that upper-ocean heat played a crucial role in the hurricane’s development because the eddies contained such abundant heat. Meanwhile, Sun et al. (2006) conducted numerical experiments using a non-hydrostatic atmosphere model and reported that sea surface temperature and latent heat flux significantly affected intensification. Wada and Usui (2007) concluded that tropical cyclone heat potential (TCHP) rather than sea surface temperature has a major influence on TC intensification and maximum intensity. It is therefore important to understand the role of the upper ocean both in TC intensification and in maximum intensity in order to improve TC intensity forecasting. However, no technical documentation outlines the relationship between TC intensification and TCHP or related utilization in TC intensity forecasting.
This technical document outlines the TCHP product used by the Japan Meteorological Agency. Section 2 briefly describes JMA’s oceanic operational analysis system, the calculation of TCHP and the 26°C isotherm depth (Z26), and their climatological characteristics. It also describes oceanic profiling float data used by JMA to validate oceanic operational reanalysis data and Regional Specialized Meteorological Center (RSMC) Tokyo best track data. Section 3 describes the results of the validation. Section 4 presents the characteristics of TCHP data for operational use in TC intensity
3
forecasting in particular. Finally, Section 5 gives the conclusion.
2. Data and Method 2.1. MOVE
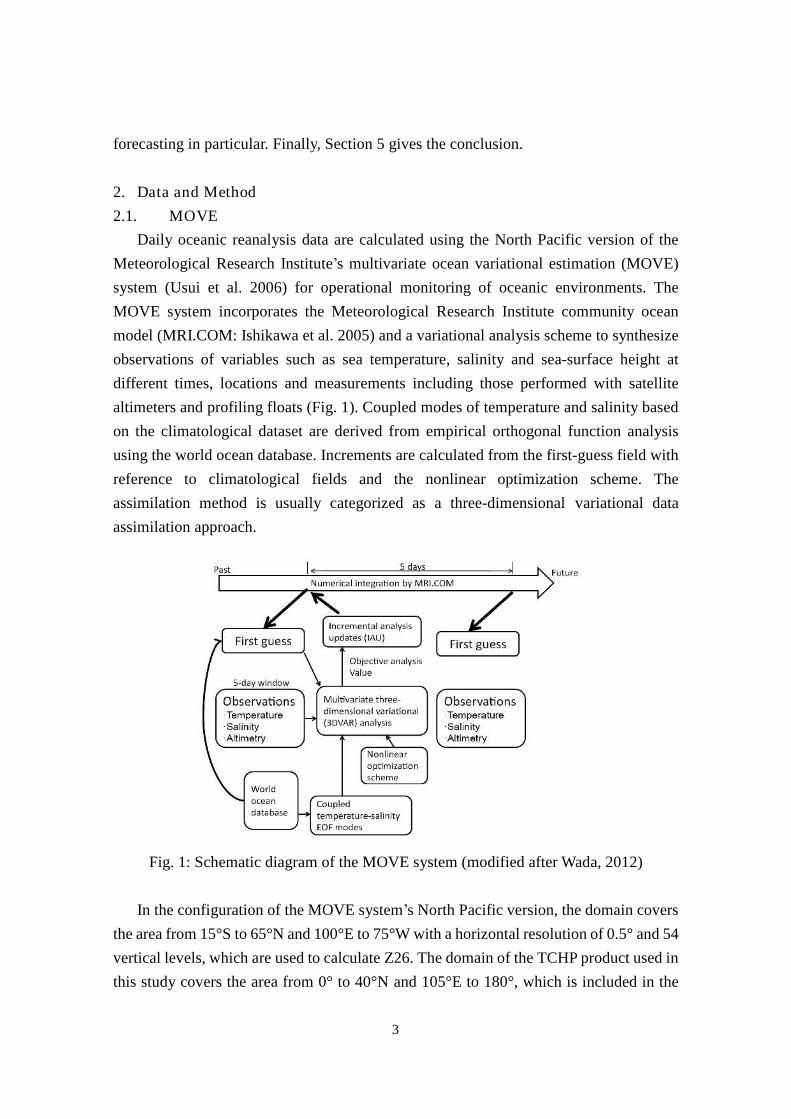
Daily oceanic reanalysis data are calculated using the North Pacific version of the Meteorological Research Institute’s multivariate ocean variational estimation (MOVE) system (Usui et al. 2006) for operational monitoring of oceanic environments. The MOVE system incorporates the Meteorological Research Institute community ocean model (MRI.COM: Ishikawa et al. 2005) and a variational analysis scheme to synthesize observations of variables such as sea temperature, salinity and sea-surface height at different times, locations and measurements including those performed with satellite altimeters and profiling floats (Fig. 1). Coupled modes of temperature and salinity based on the climatological dataset are derived from empirical orthogonal function analysis using the world ocean database. Increments are calculated from the first-guess field with reference to climatological fields and the nonlinear optimization scheme. The assimilation method is usually categorized as a three-dimensional variational data assimilation approach.
Fig. 1: Schematic diagram of the MOVE system (modified after Wada, 2012)
In the configuration of the MOVE system’s North Pacific version, the domain covers the area from 15°S to 65°N and 100°E to 75°W with a horizontal resolution of 0.5° and 54 vertical levels, which are used to calculate Z26. The domain of the TCHP product used in this study covers the area from 0° to 40°N and 105°E to 180°, which is included in the

4
computational domain in the North Pacific version of the MOVE system. The product archived at JMA consists of five-day mean TCHP data covering the period since 1985.
2.2. TCHP TCHP is calculated using the following equation:
26
0
26Z
ziiip zTcQ , (1)
where Q is the TCHP value (J cm−2), cp is specific heat at a constant pressure, Ti is water temperature in °C at the i-th level, Δzi is i-th layer water thickness, and ρi is the density of water at the i-th level. The parameter Z26 is the depth (m) of the 26°C isotherm.
In the study reported here, five-day oceanic reanalysis data were used to calculate five-day mean TCHP and Z26 (referred to here as “MOVE-based TCHP”). Sea temperature and salinity data at 17 levels (1, 2, 4, 7, 12, 18, 26, 38, 50, 66, 82, 100, 118, 138, 158, 178 and 200 m) were interpolated at 1-m intervals from the subsurface (the uppermost depth of 1 m) to the lowermost depth shallower than 200 m using the method proposed by Akima (1970).
Wada et al. (2012) reported that the relationship of accumulated TCHP (i.e., the sum of TCHP values observed before a TC reaches its maximum intensity from genesis) to minimum central pressure does not depend on the spatial or temporal resolution of the oceanic reanalysis dataset, even though the cooling effect of the TC’s passage and the associated TCHP reduction are reproduced realistically only by the daily dataset from the period during the passage.
Figure 2 shows the horizontal distribution of mean TCHP and Z26 for the periods from 1985 to 2012 and from 2002 to 2012. The 27-year mean TCHP distribution (Fig. 2a) indicates that TCHP is climatologically high over the tropical ocean, particularly around 150°E on the equator, while Z26 is climatologically deep not only over the tropical ocean but also over the subtropical ocean east of the Philippines along 15°N (Fig. 2c). Recently TCHP has been elevated and Z26 has deepened over both regions (Figs. 2b, d). Bimodal distribution is consistent with that reported by Wada and Chan (2008).
The horizontal distribution of TCHP standard deviation shows that the maximum standard-deviation value is up to 40 kJ cm-2 (Fig. 2a-b), while that of Z26 is up to 20 m (Fig. 2c-d). This indicates that five-day mean products of TCHP and Z26 include numerous variations on seasonal, interannual and decadal time scales. The TCHP standard deviation has also risen recently east of the Philippines where the TCHP itself has increased, indicating a rising trend for TCHP and a deepening trend for Z26.

5
Fig. 2: Horizontal distributions of (a) mean TCHP from 1985 to 2012, (b) mean TCHP from 2002 to 2012, (c) mean Z26 from 1985 to 2012 and (d) mean Z26 from 2002 to 2012 with standard deviation. Shading indicates average values, and contours indicate standard deviation. The contour intervals are 5 kJ cm-2 (Fig. 2a-b) and 5 m (Fig. 2c-d).
Based on the 44-year mean distribution of monthly mean TCHP for the period from 1961 to 2004, Wada and Chan (2008) reported that TCHP varies on an interannual time scale and is associated with TC activity in the western North Pacific. In consideration of this report, empirical orthogonal function (EOF) analysis excluding the 12-month running mean is made for JMA products. Wada and Chan (2008) categorized the first three EOF modes as ENSO, El Niño modoki and TC activity. Figure 3 shows spatial patterns derived from EOF analysis for a five-day mean MOVE-based TCHP time-series representation of normalized loading amplitude for the first, second and third modes. The first mode (48.7% of the total variance) indicates a positive correlation area extending broadly east of the Philippines with a quasi-biennial cycle. The second mode (13.4% of the total variance) shows north-south asymmetry in the western North Pacific. The third mode (8.5% of the total variance) is similar to that derived by Wada and Chan (2008), which indicates oceanic response to subsequent TC passage east of the Philippines, when the normalized loading amplitude of the third EOF mode is negative.
Figure 4 shows spatial patterns derived from EOF analysis for five-day mean MOVE-based Z26 time-series representations of normalized loading amplitude for the first, second and third modes. The first mode is similar to that of MOVE-based TCHP except around the area to the east of the Philippines (15°N). The second mode is also similar to that of TCHP except in the amplitude of the correlation. The third mode is

6
slightly different from that of TCHP, particularly east of the Philippines where TC activity in the western North Pacific is climatologically high. Figures 3 and 4 suggest that TCHP variation is not always connected with Z26 variation; TCHP is important as a metric of TC intensification and maximum intensity, whereas Z26 is a metric indicating the magnitude of sea surface cooling induced by TCs (with deeper values representing less sea surface cooling). However, it should be noted that sea surface cooling induced by TCs also depends on their intensity and speed of movement. Figures 3 and 4 show the characteristics of mean TCHP and Z26 products for JMA TC intensity forecasts.
Fig. 3: The upper panels show spatial patterns derived from EOF analysis for five-day mean MOVE-based TCHP (kJ cm-2), and the lower panel shows time-series representations of normalized loading amplitude for each of the first, second and third modes. Solid lines in the upper panels indicate a positive correlation, and dashed lines indicate a negative correlation.
In the study reported here, TCHP values in the area below a TC during its passage were averaged over square domains of 1.5° centered on the grid corresponding to each RSMC Tokyo TC position for validation against TCHP values derived from oceanic profiling float data. Section 4 describes the use of TCHP values from before TC passage to investigate the association with TC intensification.

7
Fig. 4: Same as Fig. 3, but for Z26 (m)
2.3. Profiling-float Data Profiling-float data on sea temperature and salinity for the period from 2002 to 2012
were used to verify MOVE-based TCHP and Z26. Both types of data were used to calculate ocean density with Equation 1 based on the equation of state (UNESCO 1981; Gill 1982). The profiling-float data were obtained from best-copy data in the Global Temperature and Salinity Profile Program (GTSPP) Continuously Managed Database and subjected to delayed-mode quality control (http://www.jamstec.go.jp/ARGORC/docs_top.html). As there was no surface observation information in the profiling-float data, surface sea temperature and salinity were assumed to correspond to the values at the uppermost depth (1 m).
2.4. Best-track Data RSMC-Tokyo best-track data for the period from 1985 to 2012 were used in this study
(http://www.jma.go.jp/jma/jma-eng/jma-center/rsmc-hp-pub-eg/trackarchives.html). These data include the TC center position, TC central pressure, and 10-minute-average maximum sustained wind speed measured four times a day (at 0600, 1200, 1800, and 2400 UTC).
In this report, TC intensification is defined as the positive deviation of TC central pressure (p6h) at the corresponding TC record from that at the subsequent TC record, as determined from RSMC Tokyo best-track data every six hours. The definition of TC intensification generally differs from that of TC deepening, with the former depending on

8
the maximum sustained wind speed and the latter on central pressure. Under the assumption of a certain relationship between central pressure and maximum sustained wind speed as suggested by Koba et al. (1990), the expression TC intensification is used here for cases in which p6h > 0 hPa.
3. Validation MOVE-based TCHP was validated using TCHP calculated from in situ sea
temperature and salinity profiles observed by profiling floats during the period from 2002 to 2012 (referred to here as “in situ TCHP”). Validation was made using TCHP values for the period from July to November, which corresponded to a TC season in the western North Pacific. The horizontal distribution of in situ TCHP at the location of in situ observation performed by profiling floats shows high values at low latitudes and decreasing values as latitude increases (Fig. 5). This characteristic is similar to that of five-day mean MOVE-based TCHP for the period from 2002 to 2012 (Fig. 2b). However, no bimodal distribution of TCHP from July to November is observed. In August, in situ TCHP is positive around the Sea of Japan, which is at a relatively high latitude. In November, positive in situ TCHP values appear only south of 30°N.
The horizontal distribution of five-day mean MOVE-based TCHP closely corresponds to the distribution of in situ TCHP (Fig. 5). However, MOVE-based TCHP is higher than in situ TCHP at low latitudes where MOVE-based TCHP is climatologically high east of the Philippines and around 150°E on the equator. As the amplitude of the standard deviation for MOVE-based TCHP is up to 40 kJ cm-2, the difference between MOVE-based TCHP and in situ TCHP is relatively small compared with seasonal and interannual variations in MOVE-based TCHP.
The relationship of in situ TCHP to five-day mean MOVE-based TCHP was investigated at profiling-float locations every month for the period from July to November during 2002 to 2012 (Fig. 6). The numbers of in situ TCHP values from 2002 to 2012 as referenced in this study were 3,786 in July, 4,443 in August, 4,600 in September, 3,476 in October and 3,370 in November. The numbers are high in July and August due to the high number of profilings in which the water temperature exceeded 26°C.
The second power of the correlation coefficient is 0.93 for July and August, 0.90 for September, 0.92 for October and 0.89 for November. Even though in situ observations are used for data assimilation in the MOVE system and thus directly affect the accuracy of oceanic temperature analysis, high correlation coefficients reveal that the three-dimensional variational data assimilation method in the MOVE system also

9
contributes to the accuracy of oceanic temperature analysis.
Fig. 5: Horizontal distributions of monthly TCHP derived from in situ observations performed by profiling floats (left) and those of monthly five-day mean MOVE-based TCHP from July to November (right). Colors indicate TCHP values.
In October and November, some in situ TCHP data exceed 200 kJ cm-2 (Fig. 6). In situ TCHP is underestimated in five-day mean MOVE-based TCHP when its values are relatively high. The slope is equal to or lower than 1 for each regression function for the

10
period from July to November (0.98 for July, 1.00 for August and October, 0.98 for September and 0.94 for November).
Fig. 6: Relationship of TCHP derived from in situ observations performed by profiling floats to five-day mean MOVE-based TCHP at positions of profiling floats as measured every month from July to November during the period from 2002 to 2012. The unit of both axes is kJ cm-2. The solid line indicates a one-to-one relationship between MOVE-based TCHP and in situ TCHP.
Annual mean vertical profiles of five-day mean MOVE-based water temperature are verified using in situ observation data from profiling floats (Fig. 7). Z26 shows variations in depths from 50 m to approximately 75 m during the period from 2002 to 2012 (Fig. 7a). The deviation of five-day mean MOVE-based water temperature from in situ observations exhibits a positive peak around a depth of 40 m and lower than 100 m, where the water temperature is usually lower than 26°C (particularly north of 20°N).
In 2003 the deviation was at its maximum (approximately 0.57°C) around a depth of 45 m, and the error of five-day mean MOVE-based TCHP was equivalent to 10 kJ cm-2 based on summation of the deviation from the surface to Z26 (69 m) (Fig. 7). The uncertainty of five-day mean MOVE-based TCHP is comparable to that derived from the standard deviation of TCHP shown in Fig. 2. Deviation around 80 – 100 m is roughly divided into two clusters. On one side the deviation is small, while on the other it has been high since 2008. At low latitudes, high positive deviation directly affects the estimation of MOVE-based TCHP. This means that MOVE-based TCHP has been overestimated compared with in situ TCHP since 2008.

11
Fig. 7: (a) Vertical profiles of annual mean in situ water temperature as observed by profiling floats from 2002 to 2012. (b) Vertical profiles of differences in annual mean in situ water temperature between MOVE analysis and in situ observations from 2002 to 2012.
In fact, since 2008, MOVE-based TCHP has been high compared with TCHP before 2007 with reference to in situ TCHP (Fig. 8a). This characteristic is also seen in the bias between MOVE-based Z26 and in situ Z26 (Fig. 8b) for the period from 2002 to 2012. The relationship between latitude and the difference between MOVE-based and in situ TCHPs for the period from 2011 to 2012 indicates that the bias (MOVE-based TCHP minus in situ TCHP) was relatively high at low latitudes (Fig. 8c), but averaged zero north of 25°N. JMA has also experimentally used corrected TCHP (Qcorr) calculated using the following equation together with MOVE-based TCHP without correction (Q) to test the applicability of corrected values to TC intensity forecasts:
,4.14576.0max( latQQcorr 0). (2)
The function max represents the value obtained from the linear equation or zero, whichever is higher.

12
Fig. 8: (a) Time-series representation of annual mean MOVE-based (brown circles) and in situ (blue dots) TCHPs with standard deviation. The solid black line indicates the difference between the two from 2002 to 2012 (after Wada, 2015). (b) Same as (a), but for Z26 (after Wada, 2015). (c) Scatter diagram showing the relationship of latitude to the deviation between in situ and MOVE-based TCHPs. The regression function (solid line) is applicable around 0 – 25°N. (d) Scatter diagram of the relationship between in situ TCHP and bias-corrected TCHP with a regression function (solid line) and the square of the correlation coefficient.
MOVE-based TCHP without correction was extremely high in 2012 compared with in situ TCHP (Fig. 8a). The slope for the linear regression function was 1.03, and the square of the correlation coefficient was 0.92. The overestimation was caused by positive bias differences since 2008 (Fig. 8a). After the correlation formula was applied, the slope of the linear regression function was reduced to 0.90 (Fig. 8d). This indicates that MOVE-based TCHP with bias correction was markedly underestimated compared to in situ TCHP. Accordingly, underestimation of TCHP data with bias correction since 2008 is more significant than that of MOVE-based TCHP without correction.
4. Characteristics of TCHP data for improving TC intensity forecasts
TCs usually undergo the phases of genesis, development, maturity and decay during their lifetime. This study involved consideration of all 24,206 RSMC Tokyo best-track records for the period from 1985 to 2012 (Fig. 9). TC intensification is defined here as the positive deviation of central pressure (p6h) over a period of six hours in the relevant

13
record from the central pressure in the subsequent record. The number of best-track records for the deviation 0 < p6h ≤ 5 hPa was 5,760, and the ratio to the total number of records was 24.0%. The number of records with deviation 5 < p6h ≤ 10 hPa was 960 (4.0%), and that for p6h > 10 hPa was only 166 (0.7%). The overall ratio of the number of records with positive deviationp6h > 0 hPa (7,052) to the total number of records was 29.1%.
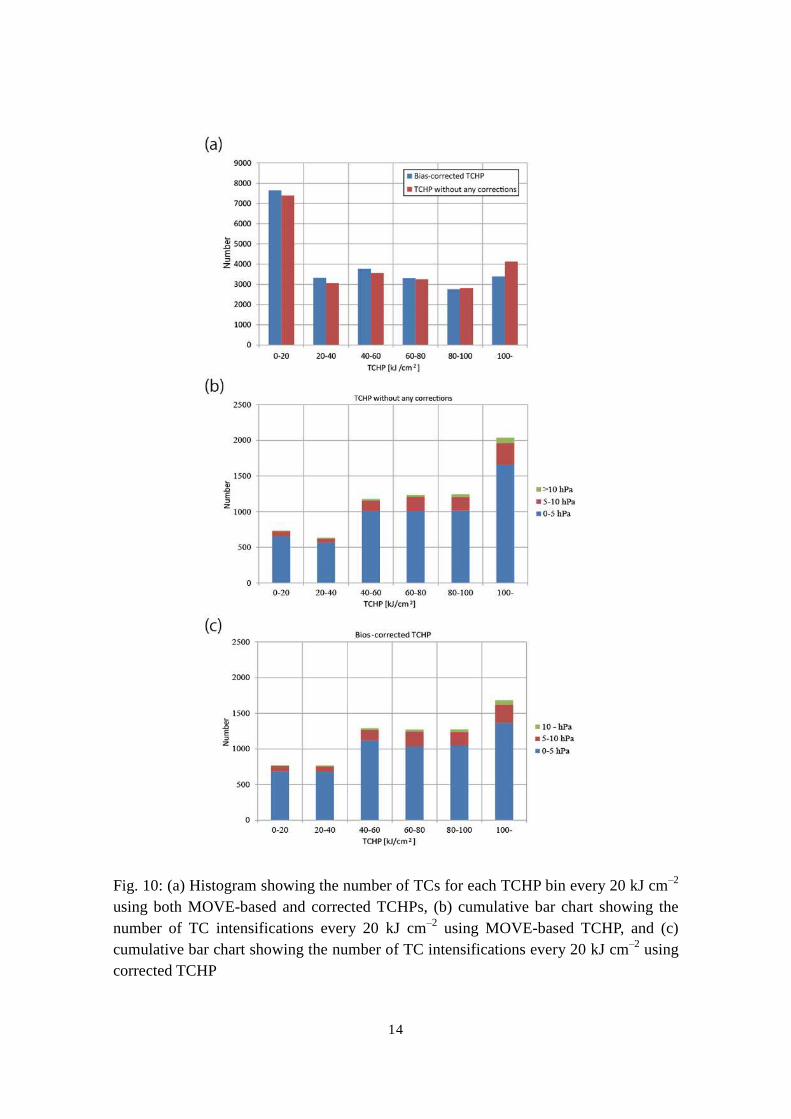
Figure 10a shows a histogram of the number of best-track records for each bin of MOVE-based and corrected TCHP every 20 kJ cm–2. The number of records (7,392 for MOVE-based TCHP and 7,647 for corrected TCHP) is highest when TCHP is 0 – 20 kJ cm–2 (0 < Q ≤ 20 kJ cm–2) corresponding to approximately 31% of the total number of records. The number for each bin is locally high when TCHP is 40 – 60 kJ cm–2 (40 < Q ≤ 60 kJ cm–2) (3,561, or approximately 14.7%, when TCHP without correction is used) and exceeds 100 kJ cm–2 (4,126, or approximately 17%, when TCHP without correction is used).
Fig. 9: Pie chart showing numbers and ratios of the number of records for TC intensification to the total number of best-track records. TC intensification is defined by falls in central pressure, and is categorized as 0 – 5 (0 < p6h ≤ 5 hPa), 5 – 10 (5 < p6h ≤ 10 hPa) and higher than 10 hPa (p6h > 10 hPa).
14
Fig. 10: (a) Histogram showing the number of TCs for each TCHP bin every 20 kJ cm–2 using both MOVE-based and corrected TCHPs, (b) cumulative bar chart showing the number of TC intensifications every 20 kJ cm–2 using MOVE-based TCHP, and (c) cumulative bar chart showing the number of TC intensifications every 20 kJ cm–2 using corrected TCHP

15
Bias correction for MOVE-based TCHP leads to a reduced number of records when MOVE-based TCHP is over 80 kJ cm–2 and an increased number when TCHP is lower than 100 kJ cm–2. In reality, TCHP values greater than 100 kJ cm–2 are observed climatologically south of 20°N in the western North Pacific (see Fig. 2). As TCHP is higher at lower latitudes, high MOVE-based TCHP is significantly modified by the bias correction in Equation 2.
Figures 10b and c show cumulative bar charts of the number of records for each TC intensification. Intensification is divided into three bins (0 – 5, 5 – 10 and over 10 hPa) for each MOVE-based TCHP bin every 20 kJ cm–2. In contrast to the results shown in Fig. 10a, the number of records (2,035) for TC intensification is greatest when MOVE-based TCHP without correction exceeds 100 kJ cm–2 (Fig. 10b). The ratio to the total number of records for TC intensification (7,052) is approximately 28.9%.
When the bias correction in Equation 2 is applied, the number of records for TC intensification is significantly reduced from 2,035 to 1,683 when the corrected TCHP exceeds 100 kJ cm–2 (Fig. 10c). Irrespective of bias correction, the number of records for TC intensification increases remarkably when MOVE-based TCHP exceeds 40 kJ cm–2 (Fig. 10b-c).
In the study reported here, MOVE-based TCHP without correction before TC passage was mainly used to investigate the relationship linking TC intensification with TC intensity and the speed of movement for each TCHP bin, and to determine the reference value of TCHP as a threshold for triggering further TC intensification for each geographic condition. TCHP before TC passage is calculated using five-day mean TCHP data for the reference day corresponding to five days before the day of the best-track record. The time interval of five-day mean TCHP data is five days
Tables 1 – 7 show the relationship of the latitudinal condition to TC intensification for each MOVE-based TCHP, central pressure and speed of movement. Here, MOVE-based TCHP is referred to simply as TCHP. Its values were categorized into the six bins of 0 – 20, 20 – 40, 40 – 60, 60 – 80, 80 – 100 and above 100 kJ cm–2. The central pressure (P) was categorized into the six bins of below 920 (P ≤ 920 hPa), 920 – 940 (920 < P ≤ 940 hPa), 940 – 960 (940 < P ≤ 960 hPa), 960 – 980 (960 < P ≤ 980 hPa), 980 – 1,000 (980 < P ≤ 1000 hPa) and above 1,000 hPa (P > 1000 hPa) based on RSMC best-track data. Speed of movement (V) was calculated from the distance between the current and subsequent positions divided by the interval time (six hours), and was categorized into the six bins of below 3 (V ≤ 3 m s-1), 3 – 5 (3 <V ≤ 5 m s-1), 5 – 7 (5 <V ≤ 7 m s-1), 7 – 9 (7 <V ≤ 9 m s-1), 9 – 11 (9 <V ≤ 11 m s-1)and above 11 m s–1 (V > 11 m s-1).

16
Fig. 11 Bar charts showing (a) the population rate with best-track records indicating TC intensification among all TC records for each domain and the rate at a TCHP threshold displayed on the right side of each bar, (b) a higher rate at a certain central pressure and that at a certain TCHP, and (c) a higher rate at a certain rate of movement and that at a certain TCHP. The population rate and the other ratios are significant at level of 0.05 based on the z-test (after Wada, 2015).

17
First, the ratio of the number of records of TC intensification to that of the total number of records is determined for each domain, and this is regarded as a reference ratio (statistically corresponding to the population rate). The reference ratio represents the probability of TC intensification for each domain irrespective of the TCHP value. Next, the ratio of the number of records of TC intensification to that of the total number of records is determined for each bin of central pressure and speed of movement. Finally, the ratio for each bin of central pressure and speed of movement is determined for each TCHP bin. Statistical significance is investigated for each ratio in consideration of the reference ratio based on the z-test. When the ratio for each TCHP bin exceeds the reference ratio at a significance level of 0.05, the TCHP value is regarded as favorable for triggering TC intensification. The minimum range of TCHP is regarded as the threshold of TCHP for the increase in the occurrence of TC intensification. It should be noted that a ratio with more than 20 TC intensification records (approximately 2 records a year) is used to examine statistical significance based on the z-test and to determine the threshold.
Figure 11 shows bar charts indicating the ratio of TC intensification to the total number of TCs (i.e., the reference ratio and the ratio for each TCHP threshold (Fig. 11a)), the ratio for each specified range of central pressure and the highest ratio for each specified range of both central pressure and TCHP for each domain (Fig. 11b). It also shows bar charts indicating the ratio for each specified range of speed of movement and the highest ratio for each specified range of both speed of movement and TCHP for each domain (Fig. 11c). The reference ratio is highest around 10 – 15°N and decreases north of 10°N as latitude increases. The value is relatively high around 120 – 140°E.
Figure 11a indicates that TCs tend to intensify over high-TCHP areas exceeding the threshold except around 10 – 15°N. No threshold is significant at the significance level of 0.05 around 10 – 15°N (Table 2). The threshold is lowest (40 – 60 kJ cm–2) around 5 – 10°N (Table 1), west of 120°E (Table 6) and east of 140°E (Table 8), and is highest (80 – 100 kJ cm–2) around 15 – 20°N (Table 3). The threshold decreases as latitude increases and longitude decreases. The effect of the threshold on TC intensification is remarkable west of 120°E. The ratio of TC intensification increases significantly from 0.22 to 0.38 (Table 6). Around 26 – 32°N (Table 5), the threshold is 60 – 80 kJ cm–2, which is higher than that around 5 – 10°N, west of 120°E and east of 140°E. However, the ratio of TC intensification is the lowest (0.25) of all domains. This means that only a quarter of all TCs intensify over the ocean even if TCHP exceeds the threshold.
Figure 11b shows that TCs tend to intensify at a certain range of central pressure. The ratio of TC intensification increases over relatively high-TCHP areas at a significance level of 0.05. Around 5 – 20°N, TCs tend to intensify over relatively high-TCHP areas

18
with values exceeding 100 kJ cm–2 (Tables 1 – 3) when the central pressure favorable for the increase in the occurrence of TC intensification is relatively high (above 960 hPa; Fig. 11b). The ratio of TC intensification exceeds 0.6, which is approximately 0.1 higher than the ratio at the range of central pressure irrespective of TCHP. Around 120 – 140°E (Table 7), the central pressure favorable for the increase in the occurrence of TC intensification exceeds 1,000 hPa, indicating that high TCHP helps storm cyclogenesis. Around 20 – 26°N (Table 4), the value of TCHP (60 – 80 kJ cm–2) is the same as the threshold value (Fig. 11a). In this domain, relatively weak TCs tend to intensify over TCHP areas with values of 60 – 80 kJ cm–2.
Figure 11c shows that TCs tend to intensify in a certain range of speed of movement. The ratio of TC intensification increases over relatively high-TCHP areas at a significance level of 0.05. At around 5 – 10°N (Table 1), the ratio of TC intensification for each speed of movement shows two peaks: 40 – 60 kJ cm–2 with speeds of movement of 3 – 5 m s–1 and 7–9 m s–1. The ratio increases by approximately 0.1 over the TCHP area with values of 40 – 60 kJ cm–2. Around 10 – 26°N (Tables 2 – 4), 120 – 140°E (Table 7) and east of 140°E (Table 8), TCHP values exceeding 100 kJ cm–2 represent favorable conditions for the increase in the occurrence of TC intensification with relatively high speeds of movement (7 – 11 m s–1) around 10 – 20°N and relatively low speeds (3 – 5 m s–1) east of 140°E.
Figure 11b-c suggests that the threshold of TCHP is an index of TC intensification. High TCHP values are favorable for the increase in the occurrence of TC intensification at a certain central pressure and speed of movement. In addition, geographical factors should be considered in the use of the TCHP threshold for TC intensity forecasts because the ratio of TC intensification differs significantly among regions. Figure 11 also indicates that TC intensification is not explained by TCHP alone, although high values certainly contribute.

19
Table 1 Ratio of TCs with central pressure drops to all TCs and the number of TCs for each central pressure, speed of movement and TCHP without correction around 5 – 10°N in the western North Pacific
All (ratio (number)) 0 – 20 kJ/cm2 20 – 40 kJ/cm2 40 – 60 kJ/cm2 60 – 80 kJ/cm2 80 – 100 kJ/cm2 100 kJ/cm2 –
Total 0.40 (657) 0.18 (21) 0.26 (23) 0.45 (118) 0.39 (129) 0.43 (148) 0.42 (218)
Central pressure – 920 hPa 0.25 (1) 1.00 (1)
920 – 940 hPa 0.25 (5) 0.33 (2) 0.29 (2) 0.17 (1)
940 – 960 hPa 0.45 (20) 0.43 (3) 0.54 (7) 0.13 (1) 0.86 (6) 0.33 (3)
960 – 980 hPa 0.66 (49) 0.83 (5) 0.67 (16) 0.75 (12) 0.47 (7) 0.69 (9)
980 – 1,000 hPa 0.50 (235) 0.18 (8) 0.20 (9) 0.59 (48) 0.54 (52) 0.53 (56) 0.64 (62)
1,000h Pa – 0.33 (347) 0.19 (13) 0.19 (6) 0.33 (45) 0.30 (63) 0.37 (77) 0.36 (143)
Speed of movement – 3 m/s 0.31 (173) 0.26 (11) 0.06 (1) 0.40 (27) 0.26 (26) 0.30 (34) 0.33 (74)
3 – 5 m/s 0.46 (170) 0.20 (6) 0.40 (10) 0.54 (31) 0.48 (36) 0.48 (42) 0.47 (45)
5 – 7 m/s 0.42 (167) 0.04 (1) 0.27 (8) 0.37 (24) 0.45 (34) 0.47 (37) 0.51 (63)
7 – 9 m/s 0.45 (95) 0.15 (2) 0.23 (3) 0.53 (23) 0.49 (23) 0.44 (18) 0.49 (26)
9 – 11 m/s 0.43 (44) 0.11 (1) 0.48 (12) 0.38 (9) 0.75 (12) 0.37 (10)
11 m/s – 0.38 (10) 1.00 (1) 0.50 (1) 0.13 (1) 0.71 (5) 0.29 (2)
Table 2 Same as Table 1, but for TCHP without correction around 10 – 15°N in the western North Pacific
All (ratio (number)) 0 – 20 kJ/cm2 20 – 40 kJ/cm2 40 – 60 kJ/cm2 60 – 80 kJ/cm2 80 – 100 kJ/cm2 100 kJ/cm2 –
Total 0.43 (1,806) 0.06 (9) 0.21 (48) 0.36 (169) 0.39 (295) 0.45 (369) 0.51 (916)
Central pressure – 920h Pa 0.25 (15) 0.33 (1) 0.30 (6) 0.14 (3) 0.33 (5)
920 – 940 hPa 0.39 (51) 0.43 (3) 0.29 (14) 0.41 (14) 0.50 (20)
940 – 960 hPa 0.46 (113) 0.25 (1) 0.25 (3) 0.26 (9) 0.45 (25) 0.53 (25) 0.53 (50)
960 – 980 hPa 0.51 (227) 0.25 (3) 0.31 (11) 0.38 (22) 0.43 (42) 0.54 (43) 0.64 (106)
980 – 1,000 hPa 0.49 (732) 0.03 (2) 0.21 (23) 0.40 (89) 0.41 (116) 0.53 (133) 0.63 (369)
1,000 hPa – 0.36 (668) 0.04 (3) 0.14 (11) 0.29 (45) 0.36 (92) 0.38 (151) 0.41 (366)
Speed of movement – 3 m/s 0.35 (333) 0.14 (3) 0.16 (8) 0.34 (44) 0.35 (59) 0.29 (51) 0.40 (168)
3 – 5 m/s 0.45 (540) 0.03 (1) 0.17 (13) 0.30 (45) 0.43 (104) 0.46 (100) 0.57 (277)
5 – 7 m/s 0.46 (562) 0.02 (1) 0.27 (21) 0.41 (55) 0.39 (85) 0.52 (130) 0.56 (270)
7 – 9 m/s 0.45 (272) 0.10 (3) 0.32 (6) 0.42 (20) 0.37 (37) 0.49 (65) 0.51 (141)
9 – 11 m/s 0.46 (84) 0.08 (1) 0.33 (4) 0.48 (10) 0.54 (20) 0.52 (49)
11 m/s – 0.29 (15) 0.25 (1) 0.30 (3) 0.38 (11)

20
Table 3 Same as Table 1, but for TCHP without correction around 15 – 20°N in the western North Pacific
All (ratio (number)) 0 – 20 kJ/cm2 20 – 40 kJ/cm2 40 – 60 kJ/cm2 60 – 80 kJ/cm2 80 – 100 kJ/cm2 100 kJ/cm2 –
Total 0.38 (2,227) 0.07 (30) 0.24 (147) 0.31 (296) 0.38 (419) 0.45 (517) 0.51 (818)
Central pressure - – 920 hPa 0.10 (14) 0.16 (2) 0.03 (1) 0.08 (3) 0.16 (8)
920 – 940 hPa 0.24 (83) 0.07 (1) 0.02 (1) 0.26 (20) 0.31 (34) 0.31 (27)
940 – 960 hPa 0.33 (183) 0.06 (1) 0.11 (6) 0.24 (22) 0.30 (39) 0.37 (50) 0.51 (65)
960 – 980 hPa 0.42 (357) 0.07 (4) 0.18 (20) 0.32 (49) 0.47 (72) 0.50 (87) 0.62 (125)
980 – 1,000 hPa 0.44 (1,025) 0.07 (16) 0.28 (85) 0.36 (161) 0.44 (200) 0.58 (211) 0.65 (352)
1,000 hPa – 0.35 (565) 0.07 (9) 0.28 (35) 0.33 (61) 0.34 (87) 0.40 (132) 0.40 (241)
Speed of movement – 3m/s 0.33 (594) 0.08 (10) 0.25 (55) 0.29 (85) 0.35 (123) 0.39 (131) 0.43 (190)
3 – 5 m/s 0.37 (705) 0.07 (10) 0.22 (46) 0.32 (107) 0.41 (143) 0.41 (152) 0.52 (247)
5 – 7 m/s 0.42 (578) 0.09 (8) 0.24 (33) 0.32 (69) 0.40 (110) 0.48 (123) 0.56 (235)
7 – 9 m/s 0.44 (261) 0.03 (1) 0.23 (9) 0.37 (29) 0.33 (32) 0.58 (85) 0.54 (105)
9 – 11 m/s 0.50 (70) 0.50 (2) 0.40 (6) 0.53 (10) 0.60 (21) 0.61 (31)
11 m/s – 0.31 (19) 0.40 (2) 0.00 (0) 0.09 (1) 0.38 (5) 0.53 (10)
Table 4 Same as Table 1, but for TCHP without correction around 20 – 26°N in the western North Pacific
All (ratio (number)) 0 – 20 kJ/cm2 20 – 40 kJ/cm2 40 – 60 kJ/cm2 60 – 80 kJ/cm2 80 – 100 kJ/cm2 100 kJ/cm2 –
Total 0.27 (1,394) 0.05 (55) 0.22 (225) 0.35 (490) 0.38 (364) 0.44 (199) 0.43 (61)
Central pressure – 920 hPa 0.07 (4) 0.50 (2) 0.00 (1)
920 – 940 hPa 0.14 (48) 0.03 (2) 0.13 (15) 0.18 (18) 0.27 (12)
940 – 960 hPa 0.19 (145) 0.02 (2) 0.10 (19) 0.20 (47) 0.32 (48) 0.40 (25) 0.29 (4)
960 – 980 hPa 0.31 (291) 0.07 (11) 0.23 (54) 0.36 (92) 0.50 (80) 0.47 (43) 0.39 (11)
980 – 1,000 hPa 0.29 (579) 0.05 (30) 0.27 (109) 0.44 (212) 0.41 (120) 0.55 (75) 0.59 (33)
1,000 hPa – 0.32 (327) 0.05 (12) 0.30 (39) 0.42 (123) 0.45 (97) 0.40 (44) 0.40 (12)
Speed of movement – 3m/s 0.24 (298) 0.05 (13) 0.14 (31) 0.28 (95) 0.35 (88) 0.41 (62) 0.32 (9)
3 – 5 m/s 0.29 (489) 0.02 (7) 0.24 (76) 0.38 (190) 0.38 (115) 0.49 (82) 0.39 (19)
5 – 7 m/s 0.29 (356) 0.05 (12) 0.24 (70) 0.35 (122) 0.39 (92) 0.46 (40) 0.57 (20)
7 – 9 m/s 0.26 (166) 0.07 (11) 0.22 (30) 0.38 (56) 0.40 (49) 0.26 (9) 0.46 (11)
9 – 11 m/s 0.28 (59) 0.05 (4) 0.35 (13) 0.43 (20) 0.48 (16) 0.50 (5) 0.33 (1)
11 m/s – 0.23 (26) 0.13 (8) 0.26 (5) 0.44 (7) 0.31 (4) 1.00 (1) 0.50 (1)

21
Table 5 Same as Table 1, but for TCHP without correction around 26 – 32°N in the western North Pacific
All (ratio (number)) 0 – 20 kJ/cm2 20 – 40 kJ/cm2 40 – 60 kJ/cm2 60 – 80 kJ/cm2 80 – 100 kJ/cm2 100 kJ/cm2 –
Total 0.14 (419) 0.09 (186) 0.19 (177) 0.21 (95) 0.25 (27) 0.27 (7) 0.33 (1)
Central pressure – 920 hPa
920 – 940 hPa 0.06 (6) 0.04 (1) 0.05 (2) 0.04 (1) 0.09 (2) 1.00 (1)
940 – 960 hPa 0.06 (25) 0.02 (5) 0.07 (12) 0.07 (7) 0.13 (3)
960 – 980 hPa 0.11 (78) 0.05 (20) 0.13 (30) 0.18 (24) 0.31 (9) 0.29 (4)
980 – 1,000 hPa 0.17 (198) 0.10 (84) 0.25 (93) 0.41 (51) 0.29 (6) 0.50 (2) 1.00 (1)
1,000 hPa – 0.19 (112) 0.17 (76) 0.30 (40) 0.21 (12) 0.78 (7)
Speed of movement – 3 m/s 0.13 (68) 0.10 (27) 0.18 (31) 0.16 (20) 0.17 (4) 0.10 (1)
3 – 5 m/s 0.15 (116) 0.12 (53) 0.19 (55) 0.19 (23) 0.18 (6) 0.50 (1)
5 – 7 m/s 0.14 (100) 0.09 (39) 0.18 (42) 0.24 (24) 0.37 (11) 0.50 (2)
7 – 9 m/s 0.14 (64) 0.09 (26) 0.17 (21) 0.28 (18) 0.25 (3) 0.50 (2)
9 – 11 m/s 0.14 (40) 0.09 (18) 0.25 (19) 0.24 (7) 0.43 (3) 0.33 (1)
11 m/s – 0.09 (31) 0.08 (23) 0.19 (9) 0.38 (3) 0.00 (0) 1.00 (1)
Table 6 Same as Table 1, but for TCHP without correction around the Pacific region west of 120°E
All (ratio (number)) 0 – 20 kJ/cm2 20 – 40 kJ/cm2 40 – 60 kJ/cm2 60 – 80 kJ/cm2 80 – 100 kJ/cm2 100 kJ/cm2-
Total 0.22 (1,011) 0.06 (92) 0.21 (188) 0.31 (306) 0.38 (246) 0.44 (126) 0.37 (53)
Central pressure – 920 hPa
920 – 940 hPa 0.09 (2) 0.11 (1)
940 – 960 hPa 0.16 (24) 0.08 (2) 0.10 (4) 0.18 (7) 0.27 (7) 0.31 (4)
960 – 980 hPa 0.19 (119) 0.05 (7) 0.19 (38) 0.23 (40) 0.24 (17) 0.29 (10) 0.30 (7)
980 – 1,000 hPa 0.22 (555) 0.04 (37) 0.22 (107) 0.34 (183) 0.40 (147) 0.55 (55) 0.45 (26)
1,000 hPa- 0.24 (311) 0.08 (46) 0.22 (39) 0.34 (76) 0.40 (74) 0.41 (56) 0.38 (20)
Speed of movement – 3 m/s 0.24 (340) 0.09 (38) 0.21 (62) 0.31 (104) 0.37 (90) 0.38 (38) 0.23 (8)
3 – 5 m/s 0.23 (339) 0.04 (21) 0.20 (63) 0.33 (124) 0.40 (73) 0.56 (38) 0.47 (20)
5 – 7 m/s 0.20 (211) 0.03 (12) 0.22 (47) 0.26 (52) 0.37 (58) 0.41 (26) 0.47 (16)
7 – 9 m/s 0.19 (86) 0.06 (13) 0.19 (12) 0.39 (22) 0.34 (20) 0.41 (15) 0.20 (4)
9 – 11 m/s 0.21 (27) 0.07 (5) 0.30 (3) 0.24 (4) 0.40 (4) 1.00 (15) 0.29 (2)
11 m/s – 0.21 (8) 0.13 (3) 0.25 (1) 0.25 (1) 0.75 (3)

22
Table 7 Same as Table 1, but for TCHP without correction around the Pacific region east of 140°E
All (ratio (number)) 0 – 20 kJ/cm2 20 – 40 kJ/cm2 40 – 60 kJ/cm2 60 – 80 kJ/cm2 80 – 100 kJ/cm2 100 kJ/cm2 –
Total 0.30 (2,843) 0.14 (534) 0.23 (228) 0.41 (422) 0.43 (470) 0.48 (540) 0.49 (649)
Central pressure – 920 hPa 0.17 (13) 0.29 (7) 0.08 (1)
920 – 940 hPa 0.24 (68) 0.03 (1) 0.17 (8) 0.25 (20) 0.36 (26) 0.31 (13)
940 – 960 hPa 0.27 (167) 0.04 (5) 0.14 (25) 0.25 (29) 0.46 (42) 0.56 (39) 0.60 (27)
960 – 980 hPa 0.30 (385) 0.12 (76) 0.15 (28) 0.54 (82) 0.61 (74) 0.63 (62) 0.74 (63)
980 – 1,000 hPa 0.32 (1,192) 0.14 (297) 0.30 (110) 0.51 (175) 0.52 (170) 0.65 (210) 0.69 (230)
1,000 hPa – 0.29 (1,018) 0.14 (156) 0.30 (64) 0.35 (128) 0.34 (157) 0.37 (198) 0.39 (315)
Speed of movement – 3 m/s 0.27 (477) 0.05 (17) 0.19 (35) 0.34 (86) 0.33 (88) 0.35 (104) 0.35 (147)
3 – 5 m/s 0.37 (774) 0.10 (49) 0.23 (65) 0.43 (129) 0.47 (153) 0.50 (176) 0.58 (202)
5 – 7 m/s 0.35 (694) 0.10 (57) 0.28 (68) 0.44 (117) 0.44 (132) 0.52 (148) 0.52 (172)
7 – 9 m/s 0.31 (382) 0.09 (47) 0.25 (34) 0.41 (61) 0.48 (70) 0.55 (78) 0.59 (92)
9 – 11 m/s 0.24 (177) 0.11 (53) 0.24 (18) 0.51 (24) 0.54 (26) 0.66 (27) 0.57 (29)
11 m/s – 0.21 (339) 0.20 (311) 0.15 (8) 0.33 (5) 0.05 (1) 0.47 (7) 0.39 (7)
Table 8 Same as Table 1, but for TCHP without correction around the Pacific region between 120 and 140°E
All (ratio (number)) 0 – 20 kJ/cm2 20 – 40 kJ/cm2 40 – 60 kJ/cm2 60 – 80 kJ/cm2 80 – 100 kJ/cm2 100 kJ/cm2 –
Total 0.32 (3,225) 0.06 (109) 0.18 (219) 0.29 (450) 0.34 (523) 0.41 (579) 0.50 (1,345)
Central pressure – 920 hPa 0.11 (21) 0.18 (2) 0.19 (4) 0.04 (2) 0.03 (1) 0.19 (12)
920 – 940 hPa 0.19 (124) 0.05 (4) 0.09 (14) 0.21 (34) 0.30 (36) 0.37 (36)
940 – 960 hPa 0.22 (298) 0.02 (3) 0.06 (14) 0.17 (56) 0.26 (67) 0.36 (63) 0.49 (95)
960 – 980 hPa 0.32 (573) 0.04 (14) 0.19 (56) 0.26 (81) 0.47 (124) 0.46 (112) 0.60 (186)
980 – 1,000 hPa 0.37 (1,346) 0.07 (61) 0.27 (114) 0.44 (210) 0.39 (178) 0.48 (215) 0.63 (568)
1,000 hPa – 0.33 (863) 0.08 (31) 0.24 (29) 0.32 (85) 0.37 (118) 0.39 (152) 0.40 (448)
Speed of movement – 3 m/s 0.30 (678) 0.03 (6) 0.13 (29) 0.22 (83) 0.31 (124) 0.35 (138) 0.42 (298)
3 – 5 m/s 0.34 (942) 0.03 (10) 0.22 (75) 0.29 (143) 0.36 (178) 0.37 (163) 0.51 (373)
5 – 7 m/s 0.36 (921) 0.06 (21) 0.18 (64) 0.31 (128) 0.37 (144) 0.48 (158) 0.57 (406)
7 – 9 m/s 0.32 (444) 0.07 (21) 0.15 (25) 0.35 (66) 0.31 (55) 0.47 (87) 0.50 (190)
9 – 11 m/s 0.26 (157) 0.06 (15) 0.22 (16) 0.32 (22) 0.38 (18) 0.52 (25) 0.51 (61)
11 m/s – 0.15 (83) 0.08 (36) 0.26 (10) 0.29 (8) 0.27 (4) 0.47 (8) 0.41 (17)

23
Fig. 12: Horizontal distribution of (a) the location of TC intensification with colors indicating central pressure, (b) the location of TC intensification for which central pressure is lower than 926 hPa with colors indicating central pressure, (c) Same as (b) but with colors indicating the speed of movement, (d) Same as (c) but with colors indicating TCHP, (e) Same as (d) but with colors indicating Z26, and (f) – (j) Same as (a) – (e) but for maturity

24
Table 9 Mean values associated with TCs shown in Fig. 12 for which central pressure is lower than 926 hPa
Lon. (°) Lat. (°) Central pressure (hPa)
Speed of movement (m/s)
TCHP (kJ/cm2) Z26 (m)
p > 0 hPa
137.1 16.7 917.7 5.3 78.1 85.8
p = 0 hPa
136.3 19.3 918.6 5.0 65.1 76.4
Table 8 reveals that high TCHP values exceeding 100 kJ cm-2 are not a significant
factor for TC intensification in the region between 120 and 140°E, which includes warm TCHPs and a deep Z26 east of the Philippines. This means that such high TCHP values do not always represent favorable oceanic environments for TC intensification. Atmospheric environmental factors should therefore be taken into consideration for TC intensity forecasts around the region, which is known as a zone of confluence between monsoonal westerly and subtropical westerly winds.
Figure 12 shows horizontal distributions of the locations of TCs and intense TCs defined by a central pressure below 926 hPa (corresponding approximately to a Current Intensity (CI) of 6.5 (Koba et al. 1990)) during the intensification and mature phases for each central pressure, speed of movement, TCHP and Z26 value. As shown in Fig. 12, relatively strong TCs tend to appear east of the Philippines between 120 and 140°E. The intensity and speed of movement varies with each TC. However, the latitudinal location differs considerably between cases of intensification and maturity (Table 9). In addition, TCHP is higher and Z26 is deeper in the intensification phase than in the maturity phase (Table 9). Accordingly, geographical factors associated with atmospheric environments should be taken into account in explaining TC intensification together with TCHP and Z26. It should therefore be noted that Tables 1 – 8 present only partial information on TC intensification for monitoring of TC intensity and TC intensity forecasts. 5. Conclusion
The purposes of this technical report are 1) to outline the tropical cyclone heat potential (TCHP) product developed by the Japan Meteorological Agency (JMA) based on the method of Wada et al (2012), 2) to highlight the characteristics of TCHP, and 3) to elucidate the relationship between TCHP and tropical cyclone (TC) intensification, with the ultimate aim of improving TC intensity forecasts in the western North Pacific. TCHP is a measure of ocean heat content from the surface down to the depth of the 26°C isotherm (Z26). Five-day mean oceanic historical data covering the period from 1985 to 2012 calculated using the Meteorological Research Institute’s multivariate ocean variational estimation (MOVE) system with a horizontal resolution of 0.5° in the latitude/longitude coordinate system and 54 vertical levels (Usui et al. 2006) were used in

25
this investigation. The MOVE system covers the North Pacific area, and the TCHP dataset covers the area of 105 – 175°E and 0 – 40°N. The five-day mean MOVE-based TCHP and Z26 are validated using in situ observations made by profiling floats. In addition, the relationship between MOVE-based TCHP and the TC intensification rate is investigated. This rate is determined by the positive deviation of central pressure at the corresponding TC record from that at the subsequent record, which is determined based on Regional Specialized Meteorological Center Tokyo best-track data every six hours.
The horizontal distribution of the mean TCHP for the period from 1985 to 2012 indicates climatologically high values for the tropical ocean, particularly around 150°E on the equator, while Z26 is climatologically deep not only for the tropical ocean but also for the subtropical ocean east of the Philippines along 15°N. Recently TCHP has increased and Z26 has deepened over both regions. The bimodal distribution is consistent with that reported by Wada and Chan (2008).
Following Wada and Chan (2008), empirical orthogonal function (EOF) analysis was conducted for the western North Pacific Ocean. The first mode (48.7% of the total variance) indicates that the positive correlation area spreads widely east of the Philippines with a quasi-biennial cycle. The second mode (13.4% of the total variance) shows north-south asymmetry in the western North Pacific. The third mode (8.5% of the total variance) is similar to the third mode derived from Wada and Chan (2008), which represents oceanic response to subsequent TC passages when the normalized loading amplitude of the third EOF mode is negative. The results of EOF analysis for Z26 are similar to those for TCHP. However, TCHP variation does not always correlate to Z26 variation. TCHP is important as a metric of TC intensification and maximum intensity, whereas Z26 is a metric indicating the magnitude of sea surface cooling induced by TCs. A deep Z26 leads to minimal sea surface cooling.
Since 2008, MOVE-based TCHP has been higher than before 2007 with reference to TCHP calculated from in situ observations. Around the seasonal thermocline, the positive bias of water temperature in MOVE reanalysis has been remarkable in the seasonal thermocline since 2008, being responsible for the positive bias of MOVE-based TCHP. The lower the latitude, the greater the impact of differences in water temperature on TCHP calculation. The correction of TCHP based on the regression function experimentally used by JMA was not applicable to improvement of the product due to excessive underestimation of relatively high TCHP values during the period from 2008 to 2011. Accordingly, five-day MOVE-based TCHP without bias correction was used in this study even if corrected TCHP is currently available at JMA.
After verification of MOVE-based TCHP, the relationship between TCHP before TC

26
passage and TC intensification was investigated using MOVE-based TCHP calculated from five-day ocean reanalysis data for the period from 1985 to 2012. The ratio of the number of records with positive deviationp6h > 0 hPa to the total number of records was 28.9% during the period. This study examined the threshold of five-day MOVE-based TCHP before the passage of TCs for TC intensification, which is defined by a positive deviation of TC central pressure (p6h > 0) every six hours in the corresponding TC record from that in the subsequent TC record. The reference ratio of the number of records of TC intensification to that of the total number of records irrespective of TCHP was first determined. The reference ratio indicates the probability of TC intensification irrespective of the TCHP beneath a TC. The ratio is calculated for each bin of central pressure, speed of movement and TCHP. Statistical significance is examined for each ratio with reference to the reference ratio based on the z-test. When the ratio for each TCHP bin significantly exceeds the reference ratio at a significance level of 0.05, the value of TCHP is regarded as favorable for TC intensification. The minimum range of TCHP was regarded as the threshold of TCHP for the increase in the occurrence ofTC intensification in this study.
The threshold is lowest (40 – 60 kJ cm–2) around 5 – 10°N, west of 120°E and east of 140°E, and highest (80 – 100 kJ cm–2) around 15 – 20°N. The threshold roughly decreases as latitude increases. The effect of the TCHP threshold on TC intensification is remarkable west of 120°E, with the ratio increasing considerably from 0.22 to 0.38. Around 15 – 20°N, no threshold is significant at a significance level of 0.05.
Therefore, the threshold is a metric for TC intensification; high TCHP values are associated with an increased possibility of intensification at a certain central pressure and speed of movement. However, geographical factors should also be considered in using the threshold of TCHP for TC intensity forecasts.
References Akima, H., 1970: A new method of interpolation and smooth curve fitting based on local
procedures. J. Assoc. Comp. Mach., 17, 589 – 602. Gill, A. E. 1982: Atmosphere-ocean dynamics, 30. Academic Press. Ishikawa, I., H. Tsujino, M. Hirabara, H. Nakano, T. Yasuda and H. Ishizaki, 2005:
Meteorological Research Institute Community Ocean Model (MRI.COM) manual. Technical Reports of the Meteorological Research Institute. 47, 189 (in Japanese).
Koba, H., T. Hagiwara, S. Osano and S. Akashi, 1990: Relationship between the CI-number and central pressure and maximum wind speed in typhoons. J. Meteor. Res., 42, 59 – 67 (in Japanese).

27
Lin, I.-I., C.-C. Wu, K. A. Emanuel, I.-H. Lee, C.-R. Wu and I.-F. Pan, 2005: The interaction of supertyphoon Maemi (2003) with a warm ocean eddy. Mon. Weather Rev. 133. 2635 – 2649, doi: 10.1175/MWR3005.1.
Palmén, E. H., 1948: On the formation and structure of tropical cyclones. Geophysica, 3, 26 – 38.
Scharroo, R., W. H. F. Smith and J. L. Lillibridge, 2005: Satellite altimetry and the intensification of Hurricane Katrina. EOS Trans. AGU, 86, 366.
Scharroo, R., 2006: Reply to comment on “Satellite altimetry and the intensification of Hurricane Katrina.” EOS Trans. AGU, 87, 90.
Sun, D., R. Gautam, G. Cervone and M. Kafatos, 2006: Comment on “Satellite altimetry and the intensification of Hurricane Katrina.” EOS Trans. AGU, 87, 89 – 90.
UNESCO, 1981: Tenth report of the joint panel on oceanographic tables and standards. UNESCO Technical Papers in Marine Sci. 36. UNESCO, Paris.
Usui, N., S. Ishizaki, Y. Fujii, H. Tsujino, T. Yasuda and M. Kamachi, 2006: Meteorological Research Institute multivariate ocean variational estimation (MOVE) system: some early results. J. Adv. Space Res., 37, 806 – 822, doi: 10.1016/j.asr.2005.09.022.
Wada, A. and N. Usui, 2007: Importance of tropical cyclone heat potential for tropical cyclone intensity and intensification in the western North Pacific. J. Oceanogr., 63, 427 – 447.
Wada, A. and J. C. L. Chan, 2008: Relationship between typhoon activity and upper ocean heat content. Geophys. Res. Lett. 35, L17603, doi: 10.1029/2008GL035129.
Wada, A., 2012: Tropical Cyclone-Ocean Interaction: Climatology. Climatology: New Developments, NOVA Publishers, 107 – 152.
Wada, A., N. Usui and K. Sato, 2012: Relationship of maximum tropical cyclone intensity to sea surface temperature and tropical cyclone heat potential in the North Pacific Ocean. J. Geophys. Res. 117, D11118. doi: 10.1029/2012JD017583.
Wada, A. 2015: Verification of tropical cyclone heat potential for tropical cyclone intensity forecasting in the western North Pacific. J. Oceanogr., in revision.