
U.S. Fresh Fruit and Vegetable Marketing: Emerging Trade
61
U.S. Fresh Fruit and Vegetable Marketing: Emerging Trade Practices, Trends, and Issues. By Linda Calvin and Roberta Cook (coordinators); Mark Denbaly, Carolyn Dimitri, Lewrene Glaser, Charles Handy, Mark Jekanowski, Phil Kaufman, Barry Krissoff, Gary Thompson, and Suzanne Thornsbury. Market and Trade Economics Division, Economic Research Service, U.S. Department of Agriculture. Agricultural Economic Report No. 795. January 2001
Transcript of U.S. Fresh Fruit and Vegetable Marketing: Emerging Trade

U.S. Fresh Fruit and Vegetable Marketing: Emerging Trade Practices, Trends,
and Issues.
By Linda Calvin and Roberta Cook (coordinators); Mark Denbaly,
Carolyn Dimitri, Lewrene Glaser, Charles Handy, Mark Jekanowski, Phil Kaufman,
Barry Krissoff, Gary Thompson, and Suzanne Thornsbury. Market and Trade
Economics Division, Economic Research Service, U.S. Department of Agriculture.
Agricultural Economic Report No. 795.
January 2001

U.S. Fresh Fruit and Vegetable Marketing: Emerging Trade Practices, Trends,and Issues. By Linda Calvin and Roberta Cook (coordinators); Mark Denbaly,Carolyn Dimitri, Lewrene Glaser, Charles Handy, Mark Jekanowski, Phil Kauf-man, Barry Krissoff, Gary Thompson, and Suzanne Thornsbury. Market and TradeEconomics Division, Economic Research Service, U.S. Department of Agriculture.Agricultural Economic Report No. 795.
Abstract
In the past year, trade practices between fresh produce shippers and food retailersgained national attention. Shippers are concerned that recent retail consolidationhas led to market power and the growing incidence of fees and services. Retailersargue that these new trade practices reflect their costs of doing business and thedemands of consumers. Trade practices include fees such as volume discounts andslotting fees, as well as services like automatic inventory replenishment, specialpackaging, and requirements for third-party food safety certification. Trade prac-tices also refer to the overall structure of a transaction—for example, long-termrelationships or contracts versus daily sales with no continuing commitment. Thisstudy compares trade practices in 1999 with those prevalent in 1994, placing themin the broader context of the evolving shipper/retailer relationship. Most shippersand retailers reported that the incidence and magnitude of fees and services associ-ated with transactions has increased over the last 5 years. Fees paid to retailers areusually around 1-2 percent of sales for most of the commodities we examined, but1-8 percent for bagged salads. Information on the incidence and magnitude ofthese new practices is scarce. To augment information that is publicly available, weinterviewed a limited number of shippers, retailers, and wholesalers about theirfirms and trade practices. We received a high level of voluntary cooperation fromthe interviewed firms.
Keywords: Produce, fresh fruit and vegetables, fresh-cut produce, trade practices,fees and services, slotting fees, retail consolidation, produce shipper consolidation.
Note: Use of brand or firm names in this publication does not imply endorsementby the U.S. Department of Agriculture.
Author affiliation: Linda Calvin, Carolyn Dimitri, Lewrene Glaser, and BarryKrissoff are with the Market and Trade Economics Division, Economic ResearchService, U.S. Department of Agriculture; Mark Denbaly, Charles Handy, and PhilKaufman are with the Food and Rural Economics Division, ERS, USDA; RobertaCook is with the University of California at Davis; Mark Jekanowski, formerlywith the Food and Rural Economics Division, ERS, is now with Sparks Compa-nies, Inc.; Gary Thompson is with the University of Arizona; and Suzanne Thorns-bury is with the University of Florida. The views presented here do not necessarilyreflect those of Sparks Companies, Inc.
1800 M Street, NWWashington, DC 20036-5831 January 2001

ii � U.S. Fresh Fruit and Vegetable Marketing / AER-795 Economic Research Service/USDA
Preface
This is the second in a series of three reports assessing the changing nature of theproduce shipper/retailer relationship and the implications for competitive behavior.Such an assessment requires an objective understanding of the increasingly com-plex relationships among buyers and sellers along the marketing chain. The Eco-nomic Research Service (ERS) is working with industry experts to undertakedescriptive and analytical research studies. This project has three major objectives:
� Develop a comprehensive overview of the produce industry from shipper toretailer, including consumption and retail sales trends, markets and marketingchannels, and the changing structure of produce buyers.
� Identify and characterize the types of trade practices used in the produce indus-try, including fees and services provided by shippers, contracts, and other mar-keting strategies.
� Empirically analyze shipper/retailer price margin behavior to investigatewhether retail market power can be detected.
The first objective was addressed in Understanding the Dynamics of Produce Mar-kets: Consumption and Consolidation Grow, published by ERS in August 2000.This report addresses the second objective. The third objective will be addressed ina forthcoming ERS report. Taken together, these reports will inform industry par-ticipants, researchers, and policymakers about the forces affecting competition andchange in the produce industry.
Mark Denbaly and Barry KrissoffERS Produce Marketing Study Co-Directors
Acknowledgments
The authors wish to thank the shippers, retailers, and wholesalers who participated inthe study and shared their time and knowledge of the produce industry. Manygrower/shipper organizations also provided invaluable assistance. We expresslyacknowledge Chuck Handy, our co-author and retiring colleague, who has made amajor contribution to this report and dedicated over 30 years of service to providinghigh-caliber analysis for ERS. Gregory Gundlach, James MacDonald, Paul Patterson,Daniel Pick, Timothy Richards, Richard Sexton, and Thomas Worth all providedinsightful ideas for this study. Neil Averitt, Bernadine Baker, Kevin Kesecker, TerryLong, John Love, Edward McLaughlin, and Thomas Spreen provided helpful reviews.We appreciate the contributions of these colleagues. The authors also wish to thankDale Simms, Wynnice Pointer-Napper, Susan DeGeorge, and Andrea Mackall forexcellent editorial and production services. The authors gratefully acknowledge addi-tional funding from USDA’s Agricultural Marketing Service.

Economic Research Service/USDA U.S. Fresh Fruit and Vegetable Marketing / AER-795 � iii
Contents
Executive Summary . . . . . . . . . . . . . . . . . . . . . . . . . . . . . . . . . . . . . . . . . . . . .iv
Introduction . . . . . . . . . . . . . . . . . . . . . . . . . . . . . . . . . . . . . . . . . . . . . . . . . . . .1
Factors Affecting the Shipper/Retailer Relationship . . . . . . . . . . . . . . . . . . . .3
Methodology . . . . . . . . . . . . . . . . . . . . . . . . . . . . . . . . . . . . . . . . . . . . . . . . . . .6
Shipper/Retailer Transactions . . . . . . . . . . . . . . . . . . . . . . . . . . . . . . . . . . . . . .9Marketing Channels . . . . . . . . . . . . . . . . . . . . . . . . . . . . . . . . . . . . . . . . . . . . .9Number of Regular Customers . . . . . . . . . . . . . . . . . . . . . . . . . . . . . . . . . . . .13Sales and Marketing Arrangements . . . . . . . . . . . . . . . . . . . . . . . . . . . . . . . .16
Contracts . . . . . . . . . . . . . . . . . . . . . . . . . . . . . . . . . . . . . . . . . . . . . . . . . . . . .21
Fees and Services . . . . . . . . . . . . . . . . . . . . . . . . . . . . . . . . . . . . . . . . . . . . . . .25Fees . . . . . . . . . . . . . . . . . . . . . . . . . . . . . . . . . . . . . . . . . . . . . . . . . . . . . . . .25Retailers Report on Their Requests for Fees . . . . . . . . . . . . . . . . . . . . . . . . . .31Services . . . . . . . . . . . . . . . . . . . . . . . . . . . . . . . . . . . . . . . . . . . . . . . . . . . . .32Retailers Report on Their Requests for Services . . . . . . . . . . . . . . . . . . . . . . .37
Impacts of Marketing Changes on the Produce Shipping Industry . . . . . . . .38Cost of Fees and Services . . . . . . . . . . . . . . . . . . . . . . . . . . . . . . . . . . . . . . .38Trends in Shipper Consolidation, Shipping Seasons, and Product Line . . . . . .40
Conclusions . . . . . . . . . . . . . . . . . . . . . . . . . . . . . . . . . . . . . . . . . . . . . . . . . . .41
References . . . . . . . . . . . . . . . . . . . . . . . . . . . . . . . . . . . . . . . . . . . . . . . . . . . .45
Glossary . . . . . . . . . . . . . . . . . . . . . . . . . . . . . . . . . . . . . . . . . . . . . . . . . . . . . .47
Appendix: Interview Questions on Fees and Services . . . . . . . . . . . . . . . . . .50
iv � U.S. Fresh Fruit and Vegetable Marketing / AER-795 Economic Research Service/USDA
Executive Summary
In the past year, trade practices between fresh produce shippers and food retailersgained national attention. The Federal Trade Commission and the U.S. SenateCommittee on Small Business conducted hearings in which industry leaders, gov-ernment officials, and academics offered their perspectives on how both the recentwave of supermarket mergers and the growth of new trade practices have affectedvarious industries, including the produce industry (U.S. Senate, 1999; U.S. Senate,2000; Federal Trade Commission, 2000). Shippers are concerned that recent retailconsolidation has led to market power and the growing incidence of fees and serv-ices. Retailers argue that these new trade practices reflect their costs of doing busi-ness and the demands of consumers.
Trade practices is a broad term that refers to the way shippers and retailers dobusiness, including fees such as volume discounts and slotting fees, as well asservices like automatic inventory replenishment, special packaging, and require-ments for third-party food safety certification. Trade practices also refer to theoverall structure of a transaction—for example, long-term relationships or con-tracts versus daily sales with no continuing commitment.
This study compares trade practices in 1999 with those prevalent in 1994, placingthem in the broader context of the evolving shipper/retailer relationship. Informa-tion on the incidence and magnitude of these new practices and how they affectshippers, retailers, and consumers is limited. Public information about produceshippers and the nature of their transactions with retailers is scarce as well, in partbecause the data are proprietary. To augment information that is publicly available,we interviewed a limited number of produce shippers, retailers, and wholesalersabout their firms and trade practices. We received a high level of voluntary cooper-ation from the interviewed firms.
The Interviews
For shipper interviews, we generally spoke with owners and/or senior sales andproduce managers, and they often consulted their financial and accounting depart-ments to provide us information. We did not directly review sales accounts fromfirms’ records to confirm the information provided. The interviews focused onseven products: California grapes, oranges, and tomatoes; Florida grapefruit andtomatoes; and California/Arizona lettuce and bagged salads. We interviewed nomore than 9 shippers per commodity in any geographical region, 57 in all. Forsome commodities, the supply side is rather consolidated, meaning that the seem-ingly small sample accounts for a relatively large share of total sales.
To complement the shipper interviews and provide a stronger view of theshipper/retailer relationship, we interviewed a limited number of retailers andwholesalers for their perspective. We selected firms across regions and included amix of retailer and wholesaler types and sizes. The sample included eight nationalchains (three headquarter and five division offices), six midsize regional chains,and three large general-line wholesalers. The retail interviews asked about thesame seven products as the shipper interviews.
Since our interviews were limited in number, our findings should be interpretedwith caution. In particular, the quantitative results presented should be viewed as
Economic Research Service/USDA U.S. Fresh Fruit and Vegetable Marketing / AER-795 � v
indicative of industry practices rather than a precise accounting. Nevertheless, theinformation from these interviews is an important first step in understanding therecent changes in produce marketing.
Study Highlights
� Retail Concentration. The 4 largest retailers’ share of grocery store sales rosefrom 17 percent in 1987 to 27 percent in 1999, and the 20 largest from 37 to 52percent. Shippers are concerned about the accelerated pace of consolidation inpart because market structure is still very fragmented at the shipper level formany commodities, implying low countervailing power relative to the fewer,larger buyers.
� Shipper Concentration. While shipper consolidation is occurring, it varies signif-icantly across commodities. For example, in 1999 there were 149 Californiagrape shippers with none estimated to account for over 6 percent of total industrysales. At the other extreme, there were only 25 California tomato shippers. Whilethere were 54 bagged salad firms selling to retailers, the top 2 firms accountedfor 76 percent of total fresh-cut salad sales in supermarkets. Hence, for a fewfresh produce items, concentration of sales at the shipper level has surpassed thatof retailers, even though the sales of these firms may still be small relative tothose of the large retail chains.
� Many Factors Affect the Shipper/Retailer Relationship. Retail consolidation isnot the only factor affecting the shipper/retailer relationship. Changes in con-sumer preferences for variety, convenience, and food safety; changes in tech-nology; and changes in shipper consolidation have all played a part in the evo-lution of the two industries and their interactions.
� Number of Buyers. Despite perceptions to the contrary, when shippersreviewed their records, many found relatively small changes in the number ofregular customers when considering all buyer types. While some shippersreported a decrease in the total number of customers, roughly as many reportedan increase. Most shippers believed that the number of retail customers haddeclined, and the majority viewed this as harmful. Other shippers were sellingto fewer but larger retail accounts and felt this reduced their transaction costs.With declining retail customers, most shippers thought they had less negotiat-ing power and were more fearful of losing accounts if they did not comply withbuyer requests. Some shippers were replacing retail accounts with other typesof buyers, sometimes due to declining competitiveness in serving the needs oflarge retailers. In any case, many shippers are adjusting their marketing strate-gies to sell to other types of buyers.
� Marketing Channels. The share of sales to conventional retailers was either sta-ble or declining for all products. Regardless of how marketing channel shareschanged over the 1994-99 period, direct grocery retail sales remain the mostimportant marketing channel for sales of all the products studied except Califor-nia and Florida tomatoes. An important factor affecting the share of producesold to grocery retailers is the growth in competition from mass merchandisers.The share of shipper sales to mass merchandisers, although starting from a smallbase, was up across all commodities with the largest gains in grapes, oranges,and grapefruit. The competitive effects of mass merchandisers on conventionalretailers are evident in that the share of direct sales to conventional retailers wasstable or declining in the face of the growth in direct sales to mass merchandis-ers, consistent with broad food industry trends. Combining mass merchandisers

vi � U.S. Fresh Fruit and Vegetable Marketing / AER-795 Economic Research Service/USDA
(also retailers) with conventional grocery retailers, the “retail” share of salesincreased for every crop considered except California and Florida tomatoes.This broader definition captures the evolving structure of the U.S. food market-place in which a new type of retailer is playing a greater relative role.
� Retail Buying - Corporate, Division, and Field Buyers. While consolidatingretailers often cite the potential for lowering procurement, marketing, and dis-tribution costs, many recently merged chains are still in the process of integrat-ing their buying operations. Indeed, over the last 5 years, retailers reported thatthe number of their buyers remained fairly constant at the corporate and divi-sion levels, although 18 percent reported a decline in field buyers. As retailersfully integrate their acquired chains and implement new procurement modelsdesigned to streamline the supply chain, the buying practices of retailers maybecome more centralized than they have to date.
� Importance of Largest Buyers and Suppliers. While the total number of buyersof all types may not have changed much for most shippers over the last 5 years,the importance of the largest buyers has increased, but only slightly. The share ofthe top four buyers of total shipper sales ranges from 22 to 45 percent of sales,depending on the product. The largest increase in this share was for Floridatomato shippers, from 34 percent in 1994 to 45 percent in 1999. For their part,retail buyers report more concentrated purchases, with their top four suppliersproviding from 85 to 97 percent of total purchases, depending on the product.
� Daily and Advance Sales. Traditionally, the fresh produce industry has concen-trated on daily sales. For commodities (grapes, oranges, grapefruit, and toma-toes), daily sales remain the most important sales mechanism across all typesof buyers, but the share declined from 72 percent in 1994 to 58 percent in1999. The use of advance pricing arrangements for promotions increased from19 to 24 percent over the same time period and it appears that the number ofweeks in advance for which prices are fixed has grown as well.
� Use of Contracts. The use of contracts is also becoming more common. Thepoint of distinction (relative to daily sales) is ongoing sales and marketingagreements with buyers versus single shipments. In 1999, short-term contractsaccounted for 11 percent of total commodity sales (grapes, oranges, grapefruit,and tomatoes), and long-term (annual or multiyear) contracts 7 percent. Lettucesales mechanisms in 1999 were similar to other commodities except all con-tracts were long term. Bagged salad shippers indicated that annual or multiyearcontracts are the standard for retail sales.
� Fees and Services. Most shippers and retailers reported that the incidence andmagnitude of fees and services associated with transactions had increased overthe last 5 years; a few tomato shippers reported no change. Data were collectedfrom commodity shippers on actual fees paid to the top five retailer and massmerchandiser accounts. They were usually around 1-2 percent of sales for mostcommodities. Bagged salad firms reported a range of fees paid of 1-8 percentfor all retail accounts. Fees paid to all retailer and mass merchandiser accountsaveraged $5,200 and $8,700 per million dollars of sales, respectively, for theinterviewed grape and orange shippers, compared with $10,100 for the grape-fruit shippers and only $1,300 for California tomato shippers. Fees can makethe difference between profit and loss, especially for commodity shippers whoact as price takers and are therefore less able to pass costs along to customers.Services per million dollars of sales were less than fees for all the commoditysamples, averaging from $1,200 for grapes to $4,400 for grapefruit. However,

Economic Research Service/USDA U.S. Fresh Fruit and Vegetable Marketing / AER-795 � vii
many firms did not keep close track of the cost of fees and, in particular,services.
� Types of Fees. Overall, 48 percent of the types of fees requested were new inthe last 5 years. The most frequently paid type of fee is the volume discount, atrade practice that has been used for years, although shippers agree that theincidence and magnitude of this fee has increased. Shippers generally viewedthis fee as having a negative or neutral impact on their business. Still, volumeincentives have the potential to promote a more stable relationship betweensuppliers and retailers; as the retailer buys more units from the supplier, costsper unit decline, providing an incentive for the retailer to buy larger quantities(over the season) from a particular supplier. Shippers may also gain efficienciesin marketing by increasing the size of accounts.
� Slotting Fees and Fresh-Cut Produce. While slotting fees (defined, in this case,as an upfront fee to gain retail shelf space for a new or existing product) havelong been used in the grocery store outside of fresh produce, they recentlyentered the fresh produce department with the advent of fresh-cut fruits andvegetables. Slotting fees are now common for fresh-cut produce and may beeither requested by retailers or offered by shippers. Most bagged salad shippersreported that it was shippers, not retailers, who first introduced slotting fees tothis industry in an attempt to buy market share from their competition, and thatthe fees began prior to the last wave of retail consolidation. None of the baggedsalad shippers revealed the exact size of the slotting fees requested or paid bytheir firm or for individual accounts, but several talked about the general use ofslotting fees in the bagged salad industry. Slotting fees were reported to rangefrom $10,000-$20,000 for small retail accounts to $500,000 for a division of amultiregional chain, and up to $2 million to acquire the entire business of alarge multiregional chain.
� Slotting Fees and Commodities. In contrast to fresh-cut shippers, none of thecommodity shippers reported paying slotting fees as defined above. However, afew were asked to pay, and some lost accounts when they failed to comply.Shippers do not always distinguish between slotting fees and other fees such asa fixed, upfront promotional allowance.
� Types of Services. Service requests are also increasing, with 77 percent ofrequests reported as new in the last 5 years. Shippers tended to believe theyreceive more benefits from providing services than from paying fees. Accord-ing to shippers, the most common service requested is third-party food safetycertification, with one-third viewing it as harmful and the remainder feelingthat the impact of providing this service is beneficial or neutral.
� Adverse Effect on Smaller Shippers. Fees and services can more adverselyaffect smaller shippers if they are fixed and equal in cost across all shippers.While fees are generally per-unit costs, services are mainly fixed costs and somay be more difficult for small shippers to implement since they are spreadingthe costs across fewer units. If requests for fixed fees and services grow, smallershippers may need to seek alternative buyer types. Preliminary canvassing ofshippers for this study indicated that smaller shippers were already selling verylittle to retail buyers. Aside from the issue of fees and services, small shippersare generally unlikely to provide adequate volume to supply large retailer needs.

viii � U.S. Fresh Fruit and Vegetable Marketing / AER-795 Economic Research Service/USDA
Public Policy Issues
Part of the interest in this study stems from concern of produce shippers, growers,and their associations regarding how pervasive fees and services have become andwhether the requests for fees and services represent market power on the part ofretailers. The Federal Trade Commission (FTC) and the Department of Justice arethe Federal agencies that determine whether a pricing strategy violates antitrustlegislation, or, in other words, is anticompetitive. FTC decisions are based on bothlegal and economic precepts. USDA’s Economic Research Service contributes tothe policy debate through analyses—such as this study—that explore produce mar-keting in detail.
Another important policy issue is the effect of changing trade practices on USDA'sproduce price reporting activities. USDA's Agricultural Marketing Service (AMS)collects free-on-board (f.o.b.) shipping-point prices based on daily sales for majorfresh fruits and vegetables, and daily spot prices in terminal wholesale markets fornearly 300 products. As shippers reduce their reliance on daily sales and movemore to contracts, f.o.b. shipping-point prices will still represent daily prices butthey may gradually become less representative of prices for commodities beingsold under other sales mechanisms. However, contracts may rely on formula pric-ing derived from Market News prices. Many transactions are more complex thanever before, with price just one of several important parameters describing the sale.Transactions may specify quality characteristics; payment of off-invoice fees suchas promotional fees, rebates, or other discounts; volume commitments; or the pro-vision of special services. The proprietary nature of many transactions makes theprice discovery process more complex. This poses new challenges for data collec-tion but AMS' Market News Branch reviews its strategies on an ongoing basis toadapt to new market conditions. Also, as shippers and buyers use more direct sales,bypassing wholesale markets, spot prices there become less robust and offer lessinformation to industry players concerned about understanding price trends. It isimportant to note, however, that wholesale market prices should continue to play aparticularly important role in price discovery for many minor products, which donot generally have shipping-point price reports.

Economic Research Service/USDA U.S. Fresh Fruit and Vegetable Marketing / AER-795 � 1
Introduction
In the past year, trade practices between produce ship-pers and retailers gained national attention. The Fed-eral Trade Commission and the U.S. Senate Commit-tee on Small Business conducted hearings in whichindustry leaders, government officials, and academicsoffered their perspectives on how both the recent waveof supermarket mergers and the growth of new tradepractices have affected various industries, includingthe produce industry (U.S. Senate, 1999; U.S. Senate,2000; Federal Trade Commission, 2000). Shippers areconcerned that recent retail consolidation has led tomarket power and the growing incidence of fees andservices. Retailers argue that these new trade practicesreflect their costs of doing business and the demandsof consumers.
Trade practices is a broad term that refers to the wayshippers and retailers do business, including fees suchas volume discounts and slotting fees, as well as serv-ices like automatic inventory replenishment, specialpackaging, and third-party food safety certification.Trade practices also include the overall structure of atransaction—for example, long-term relationships orcontracts versus daily sales with no continuing commit-ment. Information on the incidence and magnitude ofthese trade practices, old or new, and how they affectshippers, retailers, and consumers is limited (McLaugh-lin, 1999). Public information about produce shippersand the nature of their transactions with retailers isscarce, in part because the data are proprietary.
Years ago, the typical produce transaction was charac-terized by many shippers selling to many buyers in ter-minal wholesale markets—the classic case of a per-fectly competitive market with many independenttransactions at the observable spot market price.Today, a large share of fresh produce is sold directlyby shippers to retailers, bypassing intermediaries andterminal wholesale markets. In the shipper/retailer
transaction, price may be just one component of amore complicated sales arrangement that might alsospecify quality characteristics; payment of off-invoicefees such as promotional fees, rebates, or other dis-counts; volume commitments; or provision of third-party food safety certification. Public data covering allaspects of such transactions are not available. USDA’sAgricultural Marketing Service (AMS) provides f.o.b.shipping-point prices, based on daily sales. Whilesome limited information on extra fees such as pal-letizing and precooling are included in the f.o.b. price,many other characteristics of transactions are not cap-tured. AMS also provides terminal-market wholesaleprices, but as such transactions are an increasinglysmall portion of produce sales for mainstream com-modities, they may not represent the price of a com-modity being sold through the more dominant market-ing channel—directly from shippers to final buyers.
This study describes trade practices and places them inthe broader context of the shipper/retailer relationship. Italso provides an explanation of the forces behind thechanging dynamics of the $71-billion-plus fresh pro-duce marketing system. Because of the scarce publicdata, we conducted personal interviews with a total of74 shippers, retailers, and wholesalers. We received ahigh level of voluntary cooperation from these firms.However, we did not directly review firms’ records toconfirm the information provided. While results must beinterpreted with caution because of the relatively smallnumber of interviews, they are, nevertheless, an impor-tant first step in understanding these recent changes.
The shipper/retailer (both conventional retailers andmass merchandisers) interaction is the focus of thisstudy. Shippers may market only their own production,only that of other growers, or a combination of both.Most shippers are vertically integrated grower-shippers, marketing what they produce as well as theoutput of affiliated growers. Although we target ship-per sales to retailers and mass merchandisers, we also
U.S. Fresh Fruit and Vegetable Marketing:Emerging Trade Practices, Trends, and Issues
Linda Calvin, Roberta Cook, Mark Denbaly, Carolyn Dimitri, Lewrene Glaser,Charles Handy, Mark Jekanowski, Phil Kaufman, Barry Krissoff,
Gary Thompson, and Suzanne Thornsbury

2 � U.S. Fresh Fruit and Vegetable Marketing / AER-795 Economic Research Service/USDA
look at other buyers including wholesalers, foodser-vice buyers, and brokers. We examine two mainaspects of the shipper business relationship with buy-ers and how they have changed over the last 5 years:
�The type, number, and size of shippers’ regular buy-ers, and the nature of sales and marketing arrange-ments. Analysis highlights changes occurring inmarketing channels and sales arrangements underthe conditions of a consolidating retail marketplace.
�Specific trade practices, namely, the types of feesand services that shippers are being asked to pro-vide or are offering to retailers and mass merchan-disers, the prevalence of these trade practices, theincidence of compliance, and the consequences ofnoncompliance.
This report begins with background on the economicfactors affecting the business relationship betweenshippers and retailers, then turns to the interviewmethodology employed to gain information on tradepractices. Since many of the trade practices varyacross individual produce sectors, we selected sevenproducts for analysis: California grapes, oranges, and
tomatoes; Florida grapefruit and tomatoes; and Cali-fornia/Arizona lettuce and bagged salads. Next, basedon the indepth personal interviews, we present adetailed description of the shipper/retailer businessrelationship and trade practices for the selected com-modities. Overviews of the structure of the selectedproduce sectors are included throughout the text. Aglossary appears at the end of the report.
An understanding of both the retail and shippingindustries provides important context for shipper/retailer transactions. For an overview of the retail sec-tor and changes in marketing channels for the entireproduce industry, we refer the reader to the first publi-cation in this series, Understanding the Dynamics ofProduce Markets: Consumption and ConsolidationGrow (Kaufman et al., 2000b). Retail consolidationhas prompted concerns about whether retail buyers areexerting market power in their relationship with pro-duce shippers, specifically, reducing prices to shippersbelow competitive levels. The third report in this serieswill address the question of whether market power canbe observed from an analysis of the relationshipbetween f.o.b. shipping-point and retail prices.

Economic Research Service/USDA U.S. Fresh Fruit and Vegetable Marketing / AER-795 � 3
Factors Affecting theShipper/Retailer Relationship
Many factors underlie the recent changes in the ship-per/retailer relationship, including changes in con-sumer demand, technological innovation, and the con-solidation of the retail industry itself. Americans havebecome more health-conscious, and are consuming 49pounds more fresh fruits and vegetables per capita in1999 than in 1986. As consumption has increased, sohas the demand for variety and convenience. The typi-cal grocery store carried 345 produce items in 1998,compared with 173 in 1987 (Litwak, 1988 and 1998).
These new items are both exotic imports as well asvariations on standard products. For example, in addi-tion to traditional mature green and vine-ripe toma-toes, product differentiation has generated a wide arrayof new tomato products: extended-shelf-life, grape,yellow, and red baby pear tomatoes, as well as cluster,greenhouse, organic, and heirloom varieties. Variety isalso evident in the year-round availability of itemsonce thought seasonal, with U.S. consumers willing topay the higher price for imported out-of-season freshproducts. Given the product diversity and seasonalityof production of some crops (grapes and tomatoes, forexample), retailers have increasingly sought to reducecosts by dealing with suppliers that can providebroader product lines year-round or over extended sea-sons. This trend pressures U.S. shippers to coordinatewith shippers in other countries and to diversify theirproduct lines to meet retailers’ more complicatedneeds. However, providing a broader product line on ayear-round basis can be risky and costly, given thehigh capital requirements involved in the productionand distribution of many fresh produce items. Largefirms may more easily find funds to support theseactivities, which favors consolidation and greater verti-cal and horizontal coordination in the produce ship-ping industry (Wilson et al., 1997).
Consumer habits are also affecting shippers. Manyshippers find their share of sales to foodservice buyersincreasing as consumers eat more food away fromhome. In 1999, 48 percent of total spending on foodwent to the foodservice sector, up from 44 percent in1992 and 40 percent in 1982 (Kaufman et al., 2000a).This change in consumer habits also affects retailerswho are faced with a declining share of consumer foodspending. Many are introducing more ready-to-eatmeals, commonly referred to as retail Home-Meal-Replacement or Meal Solutions.
As Americans spend less time preparing the mealsthey eat at home, the convenience of fresh-cut producehas become more important. Bagged salads (washed,cut, and ready-to-eat salads) are now a major sector ofthe produce industry. New developments in packagingtechnologies have spurred the growth of a wide arrayof fresh-cut products, still primarily on the vegetablerather than the fruit side of the industry. Marketingfresh-cut produce differs from bulk commodities inthat they are usually either branded or private-labelproducts, which need dedicated shelf space year round.In 1997, 19 percent of retail produce sales werebranded products, compared with only 7 percent in1987 (Kaufman et al., 2000b).
Growth of the fresh-cut industry may also have struc-tural impacts. Bagged salads require substantial capitalinvestments in plants and machinery, in excess of $20million for a processing plant. This creates a significantbarrier to entry, particularly when the fixed assets haverelatively limited use outside of processing salad ingre-dients. Research and development to produce sophisti-cated films to manage product transpiration/respirationrates and extend shelf life is also costly.
As a result of the high costs of entry and other fac-tors, the number of firms in the bagged salad industryis relatively small. For 1999, Information Resources,Inc. (IRI) scanner data show that 54 firms sold tomainstream supermarkets (these firms may also sell toother types of buyers as well) and that the two largestfirms accounted for 76 percent of fresh-cut saladsales. However, there are still other fresh-cut proces-sors serving foodservice and other local and regionalprocessors producing more perishable fresh-cut pro-duce—such as fruit and limited-shelf-life vegetableslike chopped tomatoes and onions—for nearby mar-kets. More stringent food safety standards may con-tribute to further consolidation in the fresh-cut pro-cessing industry.
Increased coordination between shipper and buyerbecomes critical as shippers develop more specializedor differentiated products for particular buyers. Forexample, a retailer may want products tested for foodsafety by specific companies, a particular brand ofbagged salad, or an unusual domestic or importedproduct. The growing use of shipper/retailer contractsis one way to achieve vertical coordination. Use ofcontracts can also have structural impacts, as shippersoften need to have a large supply to guarantee volumecommitments (Carman et al., 1997).

4 � U.S. Fresh Fruit and Vegetable Marketing / AER-795 Economic Research Service/USDA
New technology is transforming the shipper/retailerrelationship as well. Information technologies havedramatically changed the amount and timeliness ofinformation available. With the advent of standardizedprice look-up (PLU) codes on variable-weight prod-ucts, retail sales data are now available, allowing forthe implementation of category management programsin the produce department. With more accurate track-ing of sales and profit margins, shippers and retailerscan work together to improve category profitability bydesigning effective sales, product mix, and pricingstrategies, potentially benefiting preferred suppliers aswell as the retailer. Investing in the human resourcesand technology necessary to analyze category informa-tion, however, may be difficult for smaller shippers tofinance. As a result, grower/shipper mandated market-ing programs, such as the California Tomato Commis-sion, are developing category management programswith selected retailers, enabling shippers of all sizes toshare in the benefits.
Improvements in transportation and technologies thatprolong the life of fresh produce have also boostedtrade (Carman et al., 1997). Globalization of the pro-duce market can introduce both new competition andnew opportunities. While freer international trade hasfacilitated shippers’ efforts to provide a year-roundsupply to their buyers, sudden influxes of imports dur-ing competing seasons can force adjustment on U.S.growers and shippers. For example, the recent growthof clementine imports during the winter has placednew competitive pressure on California orange grow-ers and shippers. Still, in a consumer-driven system,imports will likely continue to grow in response toconsumer demand. To be competitive, more shippersare expected to position themselves to participate inthis growing trade.
Retail consolidation at the national level has alteredthe shipper/retailer relationship. A recent wave of foodretail consolidation has seen the sales shares of thelargest 4, 8, and 20 U.S. retailers’ rise sharply. The top20 retailers consist exclusively of retail chains, withthe number of grocery stores per chain ranging from57 to over 2,200. In 1999, the 4 largest food retailers’share of grocery store sales was 27 percent, up from18 percent in 1987; the 8 largest retailers’ share was 38percent, up from 27 percent; and the 20 largest retail-ers’ share was 52 percent, up from 39 percent (fig. 1).While food retailers have been consolidating, so haveother produce buyers such as wholesalers that sell toretail buyers.
Grocery-oriented wholesalers undertook 32 mergersand acquisitions in 1999 and a cumulative total of 105since 1997. Foodservice wholesalers completed 31mergers and acquisitions in 1999. Still, foodservicewholesalers remain relatively fragmented. In 1998, the4 largest foodservice wholesalers accounted for 21percent of the $147 billion in total foodservice whole-sale industry sales, followed by the top 8 and 20 firmswith 25- and 27-percent shares (Tanyeri, 1999). Ongo-ing consolidation in the general-line, produce (special-ized), and foodservice wholesaling industries will con-tinue to contribute to a more consolidated marketplace,even though consolidation at the wholesale level stilllags behind retail.
Retail consolidation has influenced the way firmsdeal with produce shippers. Retailers often cite thepotential for lowering procurement, marketing, anddistribution costs as motivating mergers and acquisi-tions. By purchasing more volume directly fromlarger shippers, retailers hope to gain greater effi-ciency in procurement by eliminating intermediariesand lowering the per-unit cost of goods. Large retail-ers also desire large volumes of consistent product toprovide uniformity across all their stores, which maybe more easily supplied by larger shippers. In returnfor consistent supply, retailers are able to offer ship-pers preferential procurement agreements such aspartnering, long-term agreements, and other strategicalliances that can be mutually beneficial. Large retail-
Grocery sales of the largest four, eight, andtwenty food retailers, 1987-99
Figure 1
Sources: Census of Retail Trade, Census Bureau, 1987 and 1992; and company annual reports.
Percent of U.S. grocery store sales
1987 89 91 93 95 97 990
10
20
30
40
50
60
Top 20
Top 8
Top 4

Economic Research Service/USDA U.S. Fresh Fruit and Vegetable Marketing / AER-795 � 5
ers can also achieve marketing efficiencies, such aslower costs for advertising.
Consolidating retailers have also cited potential costsavings through streamlining of product distributionfunctions. Large retailers typically are self-distributing;they perform wholesaling activities such as purchasinggoods from suppliers, arranging for shipment to distri-bution warehouses, and replenishing store-level inven-tory. Supply-chain management practices such as con-tinuous inventory replenishment are becoming morecommon. Under this system, shippers have access toretail sales data and are responsible for providing thecorrect amount of produce to each distribution centerserved, on a just-in-time basis, potentially reducing thesize and cost of retail distribution centers. It alsoallows retailers to streamline and downsize their pro-duce buying offices. However, to date, mainly massmerchandisers rather than conventional grocery retailchains have implemented automatic inventory replen-ishment systems in fresh produce. The future impactof consolidation on shippers depends in large part onthe types of procurement models eventually adopted
by the consolidating firms and whether they turn tomore closely coordinated supply chain models.
In general, shippers have also been consolidating,although there is considerable variation among differ-ent sectors. For example, of 149 California fresh grapeshippers, none are estimated to account for over 6 per-cent of total industry sales. In contrast, there were only25 California tomato shippers in 1999 and 23 in 2000.Although there were 54 bagged salad firms in 1999selling to mainstream supermarkets, the top twoaccounted for 76 percent of total fresh-cut salad sales.Hence, for a few fresh produce items, consolidation atthe shipper level has surpassed retail consolidation,even though the sales of these firms may still be smallrelative to those of the large retail chains. Shipper con-solidation is motivated by many of the industry trendsdiscussed above. Larger firms are more able to providethe services requested by consolidating retailers, andthey may also develop some countervailing power intheir relationships with retailers. More shipper consoli-dation is expected in the future (Eldredge, 2000).
6 � U.S. Fresh Fruit and Vegetable Marketing / AER-795 Economic Research Service/USDA
Methodology
Because public data on the transactions between pro-duce shippers and retailers are scarce, to better under-stand current transactions we collected informationthrough personal interviews. Since our interviews werelimited in number, our findings should be interpretedwith caution. In particular, the quantitative results pre-sented should be viewed as indicative of industry prac-tices rather than a precise accounting. Nevertheless,the information from these interviews is an importantfirst step in understanding these recent changes.
The interviews covered objective questions (How manybuyers do you have?) and subjective questions (Do youthink this type of fee is beneficial, neutral, or harmful?).It was not possible to verify responses to objective ques-tions or to provide analysis to corroborate responses tosubjective questions. We have no reason to believe thereis any bias in the results and, in general, shipper, whole-saler, and retailer responses were consistent with eachother. However, responses regarding the value of feesand services may not be as precise as desired since mostshippers did not have comprehensive record systems inplace to track these data completely.
Characteristics of the produce industry vary by crop, sothe study targeted a small number of fresh produce prod-ucts: California grapes, oranges, and tomatoes; Floridagrapefruit and tomatoes; and California/Arizona lettuceand bagged salads. The diversity among these variousproducts required some variation in the interviews, butthe general lines of inquiry were the same. Although themain focus is on commodities as opposed to value-addedfresh produce, we included bagged salads because fresh-cut produce is gaining in importance. In 1997, fresh-cutproduce was estimated to account for 15 percent of freshproduce sales (McLaughlin et al., 2000). Fresh-cut pro-duce has similar characteristics to manufactured foodproducts (such as a stable, weekly supply throughout theyear), and can be similarly marketed. In contrast, freshcommodities have traditionally been marketed differentlybecause they are relatively undifferentiated products withseasonal variation in supply and quality.
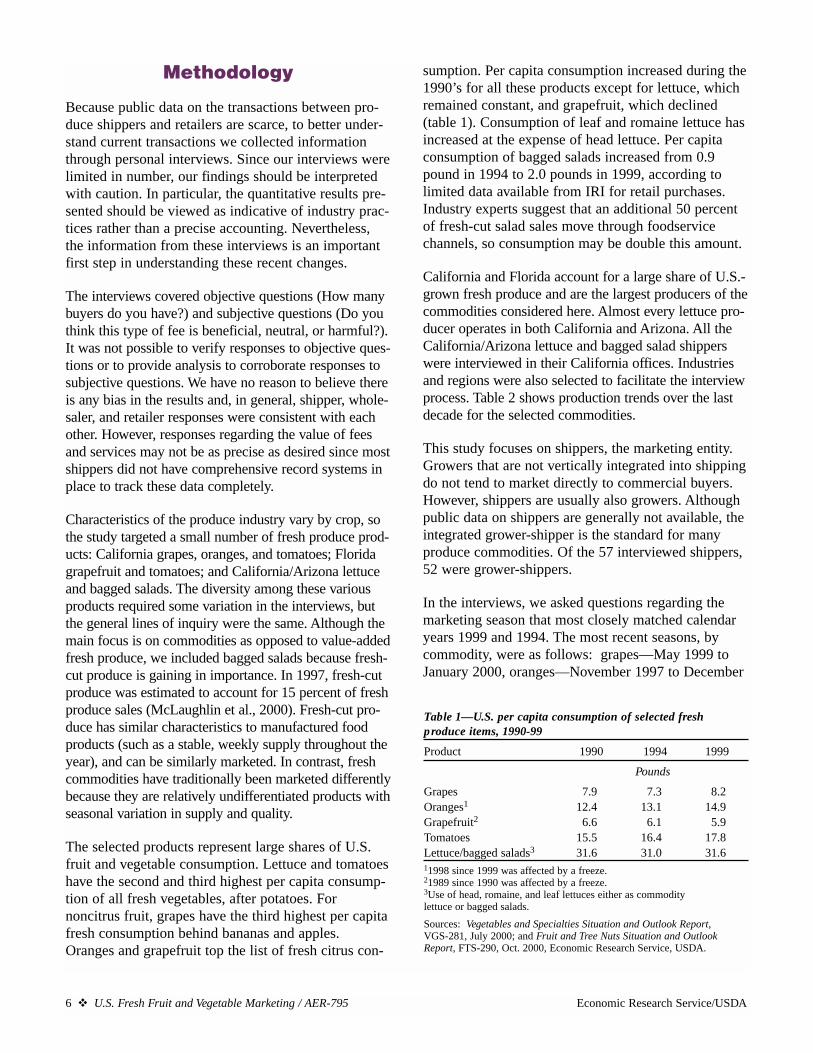
The selected products represent large shares of U.S.fruit and vegetable consumption. Lettuce and tomatoeshave the second and third highest per capita consump-tion of all fresh vegetables, after potatoes. Fornoncitrus fruit, grapes have the third highest per capitafresh consumption behind bananas and apples.Oranges and grapefruit top the list of fresh citrus con-
sumption. Per capita consumption increased during the1990’s for all these products except for lettuce, whichremained constant, and grapefruit, which declined(table 1). Consumption of leaf and romaine lettuce hasincreased at the expense of head lettuce. Per capitaconsumption of bagged salads increased from 0.9pound in 1994 to 2.0 pounds in 1999, according tolimited data available from IRI for retail purchases.Industry experts suggest that an additional 50 percentof fresh-cut salad sales move through foodservicechannels, so consumption may be double this amount.
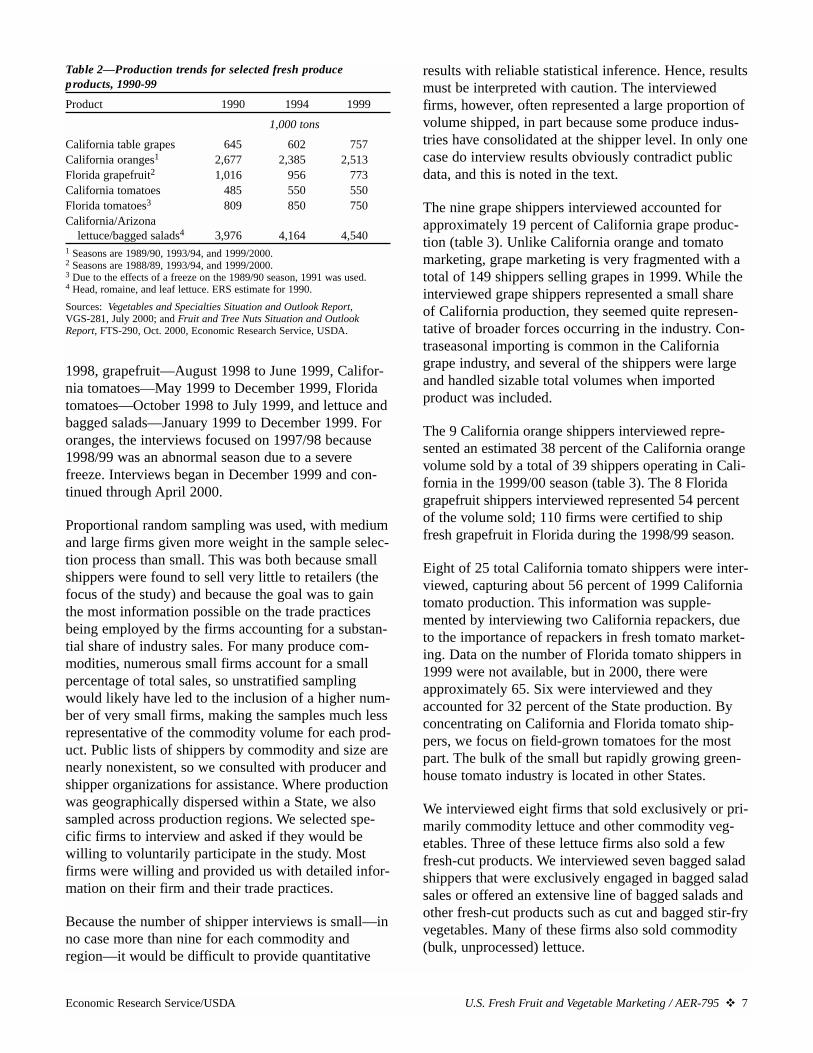
California and Florida account for a large share of U.S.-grown fresh produce and are the largest producers of thecommodities considered here. Almost every lettuce pro-ducer operates in both California and Arizona. All theCalifornia/Arizona lettuce and bagged salad shipperswere interviewed in their California offices. Industriesand regions were also selected to facilitate the interviewprocess. Table 2 shows production trends over the lastdecade for the selected commodities.
This study focuses on shippers, the marketing entity.Growers that are not vertically integrated into shippingdo not tend to market directly to commercial buyers.However, shippers are usually also growers. Althoughpublic data on shippers are generally not available, theintegrated grower-shipper is the standard for manyproduce commodities. Of the 57 interviewed shippers,52 were grower-shippers.
In the interviews, we asked questions regarding themarketing season that most closely matched calendaryears 1999 and 1994. The most recent seasons, bycommodity, were as follows: grapes—May 1999 toJanuary 2000, oranges—November 1997 to December
Table 1—U.S. per capita consumption of selected fresh produce items, 1990-99
Product 1990 1994 1999
Pounds
Grapes 7.9 7.3 8.2Oranges1 12.4 13.1 14.9Grapefruit2 6.6 6.1 5.9Tomatoes 15.5 16.4 17.8Lettuce/bagged salads3 31.6 31.0 31.611998 since 1999 was affected by a freeze.21989 since 1990 was affected by a freeze.3Use of head, romaine, and leaf lettuces either as commodity lettuce or bagged salads.
Sources: Vegetables and Specialties Situation and Outlook Report,VGS-281, July 2000; and Fruit and Tree Nuts Situation and OutlookReport, FTS-290, Oct. 2000, Economic Research Service, USDA.
Economic Research Service/USDA U.S. Fresh Fruit and Vegetable Marketing / AER-795 � 7
1998, grapefruit—August 1998 to June 1999, Califor-nia tomatoes—May 1999 to December 1999, Floridatomatoes—October 1998 to July 1999, and lettuce andbagged salads—January 1999 to December 1999. Fororanges, the interviews focused on 1997/98 because1998/99 was an abnormal season due to a severefreeze. Interviews began in December 1999 and con-tinued through April 2000.
Proportional random sampling was used, with mediumand large firms given more weight in the sample selec-tion process than small. This was both because smallshippers were found to sell very little to retailers (thefocus of the study) and because the goal was to gainthe most information possible on the trade practicesbeing employed by the firms accounting for a substan-tial share of industry sales. For many produce com-modities, numerous small firms account for a smallpercentage of total sales, so unstratified samplingwould likely have led to the inclusion of a higher num-ber of very small firms, making the samples much lessrepresentative of the commodity volume for each prod-uct. Public lists of shippers by commodity and size arenearly nonexistent, so we consulted with producer andshipper organizations for assistance. Where productionwas geographically dispersed within a State, we alsosampled across production regions. We selected spe-cific firms to interview and asked if they would bewilling to voluntarily participate in the study. Mostfirms were willing and provided us with detailed infor-mation on their firm and their trade practices.
Because the number of shipper interviews is small—inno case more than nine for each commodity andregion—it would be difficult to provide quantitative
results with reliable statistical inference. Hence, resultsmust be interpreted with caution. The interviewedfirms, however, often represented a large proportion ofvolume shipped, in part because some produce indus-tries have consolidated at the shipper level. In only onecase do interview results obviously contradict publicdata, and this is noted in the text.
The nine grape shippers interviewed accounted forapproximately 19 percent of California grape produc-tion (table 3). Unlike California orange and tomatomarketing, grape marketing is very fragmented with atotal of 149 shippers selling grapes in 1999. While theinterviewed grape shippers represented a small shareof California production, they seemed quite represen-tative of broader forces occurring in the industry. Con-traseasonal importing is common in the Californiagrape industry, and several of the shippers were largeand handled sizable total volumes when importedproduct was included.
The 9 California orange shippers interviewed repre-sented an estimated 38 percent of the California orangevolume sold by a total of 39 shippers operating in Cali-fornia in the 1999/00 season (table 3). The 8 Floridagrapefruit shippers interviewed represented 54 percentof the volume sold; 110 firms were certified to shipfresh grapefruit in Florida during the 1998/99 season.
Eight of 25 total California tomato shippers were inter-viewed, capturing about 56 percent of 1999 Californiatomato production. This information was supple-mented by interviewing two California repackers, dueto the importance of repackers in fresh tomato market-ing. Data on the number of Florida tomato shippers in1999 were not available, but in 2000, there wereapproximately 65. Six were interviewed and theyaccounted for 32 percent of the State production. Byconcentrating on California and Florida tomato ship-pers, we focus on field-grown tomatoes for the mostpart. The bulk of the small but rapidly growing green-house tomato industry is located in other States.
We interviewed eight firms that sold exclusively or pri-marily commodity lettuce and other commodity veg-etables. Three of these lettuce firms also sold a fewfresh-cut products. We interviewed seven bagged saladshippers that were exclusively engaged in bagged saladsales or offered an extensive line of bagged salads andother fresh-cut products such as cut and bagged stir-fryvegetables. Many of these firms also sold commodity(bulk, unprocessed) lettuce.
Table 2—Production trends for selected fresh produce products, 1990-99
Product 1990 1994 1999
1,000 tons
California table grapes 645 602 757California oranges1 2,677 2,385 2,513Florida grapefruit2 1,016 956 773California tomatoes 485 550 550Florida tomatoes3 809 850 750California/Arizona
lettuce/bagged salads4 3,976 4,164 4,5401 Seasons are 1989/90, 1993/94, and 1999/2000.2 Seasons are 1988/89, 1993/94, and 1999/2000.3 Due to the effects of a freeze on the 1989/90 season, 1991 was used. 4 Head, romaine, and leaf lettuce. ERS estimate for 1990.
Sources: Vegetables and Specialties Situation and Outlook Report,VGS-281, July 2000; and Fruit and Tree Nuts Situation and OutlookReport, FTS-290, Oct. 2000, Economic Research Service, USDA.

8 � U.S. Fresh Fruit and Vegetable Marketing / AER-795 Economic Research Service/USDA
Lettuce/bagged salad shippers are diversified, selling abroad range of vegetables, mainly leafy green vegeta-bles. The average lettuce/bagged salad firm sold 33 prod-ucts (table 4). No other type of shipper considered in thisreport sold as many different products, and interviewedshippers often had a difficult time breaking out numbersfor just lettuce or bagged salads. Data reported here,therefore, refer mainly to lettuce and bagged salads butmay also encompass other leafy green vegetables.
To complement the shipper interviews and better cap-ture the shipper/retailer relationship, we also inter-viewed a limited number of retailers and wholesalersfor their perspective. We sampled across regions andincluded a mix of retailer and wholesaler types andsizes. Participants included eight national chains (threeheadquarter and five division offices), six midsizeregional chains, and three large general-line whole-salers. For simplicity, we refer to these as the retailinterviews although wholesalers are included. Theretail interviews asked about the same seven productsas in the shipper interviews.
Table 4—Number of products sold by interviewed shippers1
Shipper type 1994 1999
Number
Grape 15 23Orange 15 16Grapefruit n.a. n.a.California tomato 13 15Florida tomato n.a. n.a.Lettuce n.a. 29Bagged salad2 n.a. 33n.a. = Not available.1 For commodities, a product is a type of fruit or vegetable, such asbunched spinach or tangerines (regardless of variety). For fresh-cut, aproduct could be a minimally processed item, such as cello spinach orhearts of romaine, or more processed items, such as salad blends or aspinach salad kit. 2 Bagged salad firms consist of those exclusively selling bagged salads andcommodity lettuce firms that offer a broad line of salad and/or other fresh-cut products.
Source: Economic Research Service, Produce Marketing Study interviews,1999-2000, USDA.
Table 3—Number of firms interviewed; share of shippers and State production
Firms Shippers in Share of 1999 StateType of firm interviewed State production1
--Number-- Percent
Shippers
California fresh grape shippers 9 149 19California orange shippers 9 39 38Florida grapefruit shippers 8 110 54California tomato shippers 8 25 56California tomato repackers 2 n.a. n.a.Florida tomato shippers 6 65 32California/Arizona lettuce shippers 8 n.a. n.a.California/Arizona bagged salad shippers2 7 54 n.a.
Retailers and wholesalers
National retailers 8 n.a. n.a.Regional retailers 6 n.a. n.a.Wholesalers 3 n.a. n.a.
n.a. = Not available or not applicable.1 Imports and production from other States handled by these shippers were excluded in determining the sample share of State production.2 Number of firms selling bagged salads nationally to mainstream supermarkets is used as a proxy for the number of California/Arizona shippers.
Sources: Economic Research Service, Produce Marketing Study interviews, 1999-2000; National Agricultural Statistics Service; Agricultural Marketing Service, USDA; commodity commissions; and Information Resources, Inc.

Economic Research Service/USDA U.S. Fresh Fruit and Vegetable Marketing / AER-795 � 9
Shipper/Retailer Transactions
This section reports on the findings from the shipperand retailer interviews. The interview questionnaireand responses to questions varied by firm, commodity,and geographic region, so not all information is avail-able for all firms. Also, depending on how the inter-view questions were asked, we sometimes have infor-mation for lettuce/bagged salad shippers combined andsometimes for predominantly lettuce shippers versuspredominantly bagged salad shippers.
Marketing Channels
Produce shippers have a wide range of potential buy-ers, including conventional retailers, mass merchandis-ers, wholesalers, distributors, repackers, and foodser-vice buyers; products may also be sold in export chan-nels (see box, “Produce Marketing Channels”). Bro-kers may assist in arranging transactions between anytype of buyer or seller. Marketing channels used byshippers are not identical to marketing channels serv-ing the final user. Because wholesalers, repackers, dis-tributors, and brokers are intermediaries, shipper mar-keting channels do not necessarily reflect the product’sfinal destination. For example, fresh produce soldthrough wholesale channels or with the assistance ofbrokers could be destined for either retail or foodser-vice users. Hence, the shipper volumes reported hereas direct sales to retailers, mass merchandisers, andfoodservice buyers underestimate the total shares ulti-mately being sold to final users of these types. For theentire fresh produce industry in 1997, ERS reports thataround 50 percent of final sales were through foodser-vice outlets (both commercial and noncommercial), 48percent through retailers, and 2 percent to consumersvia farmers’ markets or roadside stands (Kaufman etal., 2000b). However, another estimate indicates some-what different results: 56 percent of fresh produce wassold through retail channels in 1999, while foodserviceaccounted for 43 percent of total sales, and directfarmer-to-consumer sales were 1 percent of the total(Cook, 2000).
In this section, we examine the share of total salesthrough various marketing channels for each productsample. The results presented in table 5 reflect the per-cent of total sales of the selected products marketedthrough each channel, aggregated across all firms. Forexample, total grape sales in 1994 amounted to $210.5million for the firms sampled, of which 58 percent wasmarketed directly to grocery retailers. In 1999, the
Grocery retail channels are defined to include inte-grated wholesaler-retailers, consisting of the buyingoperations of corporate chains such as Kroger orSafeway, voluntary chains such as Super-Valu andFleming, and retail cooperatives like Associated Gro-cers and Certified Grocers of California. Voluntarychains consist of sponsoring wholesalers who supplyindependent retailers or small chains and, in somecases, their own stores. Retail cooperatives are essen-tially member-owned wholesalers, since they consistof groups of retailers who jointly own a central buy-ing and warehousing facility.
Mass merchandisers are supercenters (large generalmerchandise discount stores with grocery depart-ments) and club stores (membership wholesaleclubs). The supercenter format is led by Wal-Mart,with estimated 1999 grocery-equivalent supercentersales of $15.7 billion and total supercenter sales of$39.1 billion, 56 percent of the total national super-center industry sales ($69.8 billion). National clubstore sales totaled $60.7 billion in 1999, dividedbetween Costco (49.3-percent market share), Sam’sClub (also owned by Wal-Mart and with a 43-percentmarket share), and BJ’s holding a 6.7-percent marketshare (The Food Institute, 1999).
Produce wholesalers include those operating in ter-minal markets, distributors, and tomato repackers.These intermediaries serve retailers, mass merchan-disers, and foodservice buyers.
Foodservice buyers sell to restaurants, hospitals,schools, hotels, etc. Commodities going to foodser-vice destinations can be sold directly to the final useror sold via wholesalers or brokers.
Brokers are agents that negotiate transactionsbetween buyers and sellers without taking title to themerchandise or physically handling the product. Inthis study, brokers were considered as a separatemarketing channel when shippers were unaware ofthe final destination of the product. In cases wherethe sale involved a broker and the shipper knew thetype of buyer, sales were reported in the channel cor-responding to the final buyer type.
Export marketing channels were classified as a singlebuyer type, regardless of how the shipper exported.Shippers may export directly to importers in othercountries or via U.S. wholesalers and brokers, with orwithout the direct assistance of freight forwarders.
Produce Marketing Channels

10 � U.S. Fresh Fruit and Vegetable Marketing / AER-795 Economic Research Service/USDA
share of total grape sales sold directly to retailers waslower at 55 percent. However, since the combinedgrape sales volume for the sample firms was higher in1999 at $255.3 million, the absolute volume beingmarketed directly to retailers was still $18.3 millionmore in 1999 than in 1994, despite representing adeclining share.
Indeed, while the retail share was essentially eitherstable or declining for all products, total sales throughall channels increased for all products except grape-fruit. Hence, the actual value of sales marketeddirectly to retailers increased over the 5-year periodfor all commodities except grapefruit and Floridatomatoes. In the case of grapefruit, the declining sharemoving through retail channels could not be offset byrising total sales since sales declined from $215.9 to$199.5 million between 1994 and 1999. For Floridatomatoes, while total tomato sales of the firms sam-pled grew from $103.6 to $121.4 million, the sharesold directly to retailers declined dramatically from 23to 3 percent.
Regardless of how marketing channel shares changedover the period in question, direct grocery retail salesstill remain the most important domestic marketingchannel for sales of all the products studied except
California and Florida tomatoes, with the 1999 shareranging from 3 percent for Florida tomatoes to 61 per-cent for lettuce/bagged salads (table 5).
Several factors likely cause lettuce/bagged salads tohave the highest share of product going directly to theretail channel. The lettuce/bagged salad industry isyear-round rather than seasonal and has large shipperscapable of meeting retailer needs. Bagged salad firmsmaintain large marketing staffs and have the infra-structure to market directly to retailers. Shippers thatsell both bagged salads and commodity lettuce may bemore likely to sell lettuce to the same retailers who arebuying bagged salads. The high perishability ofbagged salads also causes shippers to prefer directsales in order to maintain the cold chain. This reducesthe risk of deviating from ideal temperature controland degrading the quality of the product.
California and Florida tomatoes stand in contrast to thecase of lettuce/bagged salads. Unlike most vegetables,tomatoes continue to ripen after they leave the shipper.Shippers generally sell tomatoes to repackers near finalconsumers, who then generate a uniform pack and sellto retailers, mass merchandisers, foodservice buyers, orother intermediaries. As a result, the dominant market-ing channel for both California and Florida tomatoes is
Table 5—Changing use of marketing channels, 1994-991
Mass Wholesalers Food-Product (number of Grocery merchan- and service Value of shippers reporting) Year retailers disers distributors Brokers buyers Exports Other sales
--Percent of total value of sales-- Milliondollars
Grapes (9) 1994 58 2 15 8 2 10 5 210.51999 55 8 17 7 2 9 2 255.3
Oranges (9)2 1994 45 3 16 10 1 25 0 183.11998 44 9 14 6 2 25 0 228.9
Grapefruit (8)3 1994 41 0 12 6 2 39 0 215.91999 37 8 11 4 2 38 0 199.5
California tomatoes (10)4 1994 26 2 40 21 6 3 2 222.31999 25 2 37 17 15 2 2 235.9
Florida tomatoes (6) 1994 23 0 57 3 4 13 0 103.61999 3 3 67 4 13 10 0 121.4
Lettuce/bagged salads (10) 1994 60 1 16 4 17 2 0 n.a.1999 61 3 8 3 23 2 0 n.a.
n.a. = Not available.1 Results are based on a limited number of observations and must be interpreted with caution.2 Because of a severe freeze in 1999, we base our analysis on the 1998 crop year.3 Grapefruit exports reported by this sample of shippers do not reflect the Florida industry trend of increasing volume. The Florida Department of Citrusreports that 54 percent of fresh Florida grapefruit was exported in the 1994/95 season and 59 percent in the 1998/99 season.4 Information on 2 repackers is included to provide a more accurate view of how tomatoes are marketed.
Source: Economic Research Service, Produce Marketing Study interviews, 1999-2000, USDA.

Economic Research Service/USDA U.S. Fresh Fruit and Vegetable Marketing / AER-795 � 11
the wholesaler/distributor category, which includesrepackers (see box, “California and Florida Tomatoes,”for more information on marketing).
While the share of Florida tomatoes going to retail wasexpected to decline, the specific magnitude of thedecline may be an artifact of the small sample size.However, there are clearly several factors contributingto the declining trend in retail share experienced bytomatoes. These include the growth of product formssuch as greenhouse and vine-ripe tomatoes competingwith the market leader, the mature green tomato. Dur-ing the summer/fall 1999 period, mature green toma-toes accounted for only 31 percent of the total volumeof tomatoes sold in a national sample of retail stores(California Tomato Commission, 1999). This loss incompetitiveness for mature green tomatoes in the retailmarket has obliged shippers to move even greater vol-ume through wholesaler/repacker channels and directlyto foodservice where buyers value the slicing charac-teristics of mature green tomatoes. If greenhousetomato production were more common in Californiaand Florida, the results would show higher retailshares for tomatoes, since greenhouse tomatoes areoften sold directly to retailers and mass merchandisers.
Another factor affecting the share sold to retailers is thegrowth in competition from mass merchandisers. Theshare of shipper sales to mass merchandisers, althoughstarting from a small base, was up across all commodi-ties (the growth of California tomatoes was less than 1percentage point), with the largest gains in grapes,oranges, and grapefruit. The competitive effects of massmerchandisers on conventional retailers are evident inthat the share of direct sales to conventional retailers wasstable or declining in the face of the growth in directsales to mass merchandisers, consistent with broad foodindustry trends. Combining mass merchandisers (alsoretailers) with conventional grocery retailers, the “retail”share of sales increased for every crop considered exceptCalifornia and Florida tomatoes. This broader definitioncaptures the evolving structure of the U.S. food market-place in which a new type of retailer is playing a greaterrelative role. Shippers are likely to continue to shift salesaway from conventional retailers to mass merchandisersgiven the higher growth rate of the latter.
For some shippers, a declining share of produce sales toconventional retailers may reflect the relative competi-tiveness of shippers in retail channels. Some shippers,especially smaller ones, may find it difficult to deal withretailers’ large buying requirements and may switch their
emphasis to wholesalers or specialty food channels. Sev-eral small and medium-sized lettuce shippers mentionedthey made a strategic decision to pursue more foodser-vice business. On the other hand, some shippers, usuallylarger and extended-season shippers, increased theirshare of sales to retailers over the last 5 years.
With the exception of tomatoes, shippers used whole-salers and distributors for only 8-17 percent of sales in1999. The share of sales to wholesalers is higher forCalifornia and Florida tomatoes, 37 and 67 percent,since repackers are included in the wholesaler cate-gory. Except for Florida tomato and lettuce/baggedsalad shippers, the change in share sold to wholesalersfrom 1994 to 1999 was minor (table 5).
Shippers’ use of brokers in 1999 ranged from 3 per-cent for lettuce/bagged salads to 17 percent for Cali-fornia tomatoes (table 5). Broker use depends in parton the buying practices of grocery retailers since somedesignate brokers to arrange purchases of certain com-modities. Shippers report that where use of brokers hasincreased, there may be direct cost implications sincethey, and not the buyer, may be required to pay thebrokerage fee. The use of brokers declined from 1994to 1999 for all products but Florida tomatoes—up lessthan 1 percentage point.
In another part of the interview, shippers were askedabout the reasons behind the changes in broker use andthe impact on their businesses. Shippers reportedincreases, decreases, and no change for use of brokers;both increases and decreases were attributed to retailconsolidation. Those shippers that experienced adecrease in the use of brokers generally thought thistrend had a beneficial or neutral impact on their busi-ness; those that experienced an increase in use wereunhappy with the trend.
Given U.S. eating habits, it should be no surprise that theshare of sales going directly to foodservice increased forevery crop (increases for grapes and grapefruit were lessthan 1 percentage point). Tomatoes and lettuce/baggedsalads have the highest share of sales to foodservice buy-ers (table 5). Foodservice offers a stable demand forthese crops—many hamburgers require a slice of tomatoand a leaf of lettuce every week of the year. While thefoodservice industry is consolidating, it is still frag-mented with much of the fresh produce procured viawholesalers and with the assistance of brokers. Hence,much of the volume moving through wholesale and bro-ker channels may be destined for foodservice users.

12 � U.S. Fresh Fruit and Vegetable Marketing / AER-795 Economic Research Service/USDA
The structure of tomato marketing is unique in produce.Tomatoes change color and continue to mature afterharvest; consequently, the marketing process is morecomplicated than for other fresh vegetables. Tomatoesharvested at the mature green stage, the dominantdomestic tomato product, are treated with ethylene gasto finish ripening. Some tomatoes, especially green-house products, are sold directly to retailers by ship-pers; however, many tomatoes are shipped from theirproduction regions to repackers or wholesalers to beresorted and repacked at that stage for uniform colorand then sold to retailers and foodservice buyers.
California and Florida are the primary sources of freshdomestic tomatoes consumed in the United States. TheCalifornia marketing season runs from May to Decem-ber, complementing the Florida season that supplies themarket from October through July. The Florida tomatoindustry is the only source of domestically producedfield-grown tomatoes during the winter. In 1999, Cali-fornia produced 31 percent of total U.S. tomato produc-tion, up from 28 percent in 1991. In 1999, Floridaaccounted for 42 percent of domestic production com-pared with 48 percent in 1991. Two major trends affecttomato markets in both States: a shift in consumer pref-erence away from mature green tomatoes toward othertypes of tomatoes, and increased foreign competition.
In recent years, the California fresh-market tomatoindustry has experienced growing production volumesoverall. The product mix has changed as the share ofmature green tomatoes has decreased in favor of vine-ripe, roma, and small but growing volumes of specialtytomatoes such as orange and yellow, heirloom, grape,and other types of cherry tomatoes. Greenhouse toma-toes are generally not produced in California. Changingconsumer preferences for tomatoes have had significantimpacts on buyer type. The retail market share for thedominant mature green industry has declined, forcingproducers to rely more on the foodservice market, whichvalues the firmness of a mature green tomato for slicing.
The Florida industry, producing almost exclusivelymature green tomatoes, has confronted the same chang-ing consumer preferences as its California counterpart.The varieties developed for the Florida climate areapparently better harvested and handled as maturegreens rather than vine ripes. For Florida, mature greentomatoes made up 91 percent of the sales of the inter-viewed firms in 1999, essentially the same as in 1994.Although small amounts of roma, vine-ripe, cherry,
grape, and greenhouse tomatoes are grown, there hasnot been much change in their shares.
In addition to changing consumer preferences, increasedforeign competition has had significant impacts ondomestic fresh tomato markets. Competition with winterimports from Mexico is one of the most critical factorsaffecting Florida tomato production. Tomato exports fromSinaloa, Mexico, directly compete with South Florida,where harvested tomato acreage declined 22 percentbetween 1993/94 (prior to the implementation ofNAFTA) and 1998/99. Mexican shippers in Sinaloa pro-duce mainly extended-shelf-life tomatoes that are har-vested as vine-ripe tomatoes and are popular with retail-ers, helping them to gain market share relative to Floridaover the last decade. The industry also faces growingcompetition from domestic and foreign greenhousetomato production. Canada has gained increased marketshare and provides the primary source of imports duringthe California season as well. During California’s season,approximately 31 additional States produce tomatoes. Inaddition to domestic sources, California competes withvine-ripe tomatoes from Baja California, Mexico.
The California tomato shipping industry is concen-trated, with only 25 shippers in 1999 and 23 in 2000.Although precise figures on the number of growers andshippers over time are hard to obtain, official statisticsare available for the years in which referenda were heldon either continuance of the State marketing order or itsreplacement with a marketing commission. In 1986,there were 48 handlers compared to 31 in 1996.Although the number of shippers is declining, the num-ber of growers actually increased from 209 in 1986 to284 in 1996, the last year for which a grower count isavailable. Shipper concentration is estimated to haveincreased over the last 5 years as firm numbers havecontinued to decline. The estimated share of total Cali-fornia tomato volume handled by the top four shipperswas 36 percent in 1994 compared with an estimated 43percent in 1999. The share of the top eight shippers was62 percent in 1994 versus 70 percent in 1999. Hence,the industry has become more concentrated at the ship-per level. The industry in Florida had 65 registered han-dlers of tomatoes in 2000 compared with 59 in 1997/98.However, volume shipped remains concentrated amonghandlers, with the top 5 accounting for approximately45 percent of volume, the top 10 accounting for about70 percent, and the top 20 accounting for approximately90 percent of the volume. These concentration ratioshave changed only marginally over the last 3 years.
California and Florida Tomatoes

Economic Research Service/USDA U.S. Fresh Fruit and Vegetable Marketing / AER-795 � 13
Except for citrus, export markets accounted for 10 per-cent or less of sales in 1999. The share of orange salesgoing to export markets remained relatively constant atabout 25 percent. For the interviewed firms, the shareof grapefruit going to export markets was also rela-tively constant, at 38 percent in 1999 compared with39 percent in 1994 (table 5). This is a case where theexperience of the firms in the sample is not consistentwith broader industry experience. The Florida Depart-ment of Citrus (1999) reported that 54 percent of freshFlorida grapefruit was exported in the 1994/95 seasonand 59 percent in the 1998/99 season. On the otherhand, grapefruit is the only case where the value ofsales for the interviewed firms was less in 1999 than1994, and this is consistent with Florida statistics (seebox, “Florida Grapefruit”).
Retailers also reported changes in the use of differentmarket channels. In the retail interviews, 88 percent ofthe 17 respondents said they had increased direct pur-chases from shippers, 71 percent had reduced pur-chases from produce wholesalers, 71 percent hadreduced purchases from distributors or brokers, and 59percent had reduced produce purchases from terminalwholesale markets. There were no significant differ-ences by size of retailer. Reasons for more direct pur-chases from shippers included better quality control,better inventory management on the part of shippers,and lower product cost.
Number of Regular Customers
The average number of regular buyers in 1999 rangedfrom 78 for the grapefruit shippers to 367 for the let-tuce/bagged salad shippers (table 6). To identify trends
with shippers’ ongoing customer bases, in most caseswe asked shippers to define regular buyers as thosewith at least $15,000 in annual purchases. This thresh-old was selected after interviews with shippers showedit to be a common internal measure for identifying reg-ular customers. Findings on both the number of regu-lar buyers and changes in the concentration of salesare for the shippers’ total sales (for example, all salesof grape shippers, not just their grape sales) and reflectchanges in sales to all buyer types, not just retailers.
If retailers consolidate, overall there should be fewerbuyers, all else being equal. But other factors besideretail consolidation affect the number of buyers pershipper. Some firms never sold much to retailersbecause of technical issues in postharvest handling oftheir key commodities, as in the case of tomato ship-pers, so were affected less by retail consolidation.Many firms reported that while the total number ofcustomers had not changed much in the last 5 years,they had different types of customers, which hadaltered their ways of doing business. Both foodservicebuyers and mass merchandisers have provided otheroutlets for shippers. Smaller shippers, unable to supplythe volume requirements of large retail buyers, havepursued various niche markets. Specialized retail out-lets such as organic and health food stores are alsoimportant buyers. Some firms may have had a changein the number of buyers due to a decision to abandon aproduct line. Consolidation within the shipping indus-try could also increase the average number of buyersper shipper. For example, products with more consoli-dated shipper structures, such as bagged salads, tend tohave more buyers, as fewer firms are supplying mostof the potential buyers.
Table 6—Number of buyers in 1999 and changes in number of buyers between 1994 and 19991
California Florida Lettuce/Item Grapes Oranges Grapefruit tomatoes tomatoes bagged salads
Number
Average number of regular buyers in 1999 171 198 78 118 84 367
PercentAverage change for individual shippers in number
of regular buyers between 1994 and 1999 7 -12 9 -4 -9 n.a.
Number
Firms with increase, no change, or decrease innumber of regular buyers between 1994 and 19992 4,1,4 2,1,5 5,1,2 2,3,5 3,0,3 4,3,7
n.a. = Not available.1 Results are based on a limited number of observations and must be interpreted with caution.2 Number of firms reporting an increase, followed by the number reporting no change and a decrease.
Source: Economic Research Service, Produce Marketing Study interviews, 1999-2000, USDA.
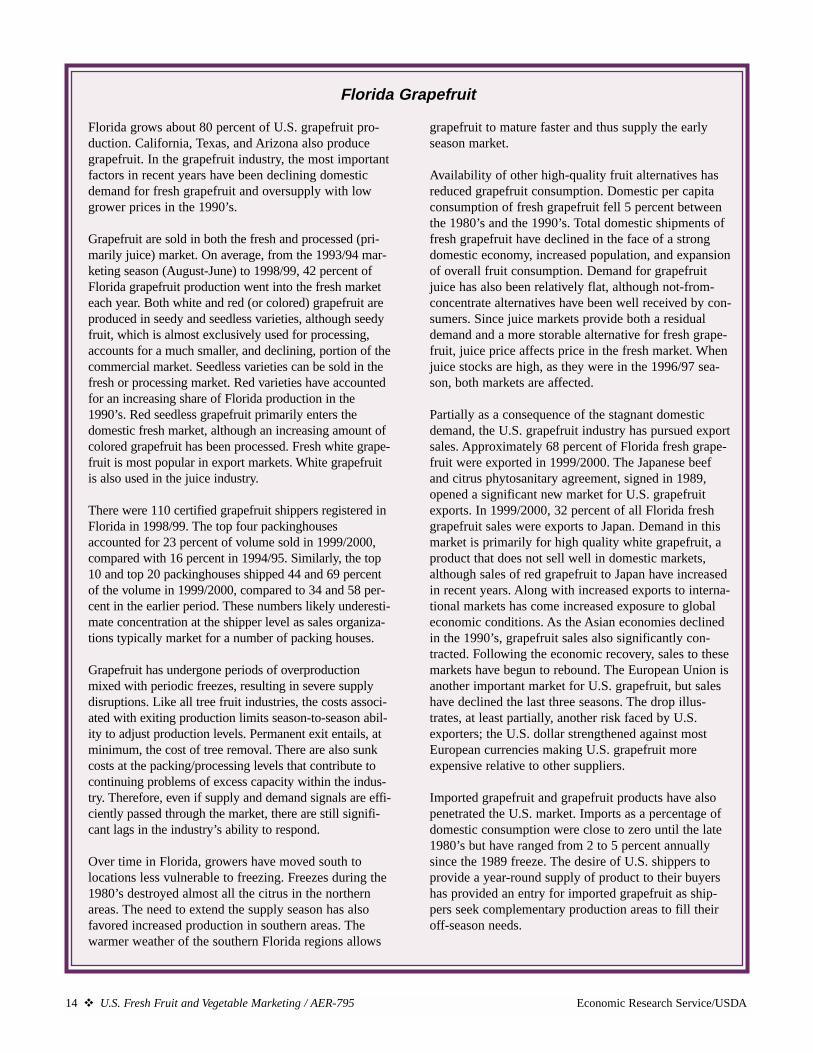
14 � U.S. Fresh Fruit and Vegetable Marketing / AER-795 Economic Research Service/USDA
Florida grows about 80 percent of U.S. grapefruit pro-duction. California, Texas, and Arizona also producegrapefruit. In the grapefruit industry, the most importantfactors in recent years have been declining domesticdemand for fresh grapefruit and oversupply with lowgrower prices in the 1990’s.
Grapefruit are sold in both the fresh and processed (pri-marily juice) market. On average, from the 1993/94 mar-keting season (August-June) to 1998/99, 42 percent ofFlorida grapefruit production went into the fresh marketeach year. Both white and red (or colored) grapefruit areproduced in seedy and seedless varieties, although seedyfruit, which is almost exclusively used for processing,accounts for a much smaller, and declining, portion of thecommercial market. Seedless varieties can be sold in thefresh or processing market. Red varieties have accountedfor an increasing share of Florida production in the1990’s. Red seedless grapefruit primarily enters thedomestic fresh market, although an increasing amount ofcolored grapefruit has been processed. Fresh white grape-fruit is most popular in export markets. White grapefruitis also used in the juice industry.
There were 110 certified grapefruit shippers registered inFlorida in 1998/99. The top four packinghousesaccounted for 23 percent of volume sold in 1999/2000,compared with 16 percent in 1994/95. Similarly, the top10 and top 20 packinghouses shipped 44 and 69 percentof the volume in 1999/2000, compared to 34 and 58 per-cent in the earlier period. These numbers likely underesti-mate concentration at the shipper level as sales organiza-tions typically market for a number of packing houses.
Grapefruit has undergone periods of overproductionmixed with periodic freezes, resulting in severe supplydisruptions. Like all tree fruit industries, the costs associ-ated with exiting production limits season-to-season abil-ity to adjust production levels. Permanent exit entails, atminimum, the cost of tree removal. There are also sunkcosts at the packing/processing levels that contribute tocontinuing problems of excess capacity within the indus-try. Therefore, even if supply and demand signals are effi-ciently passed through the market, there are still signifi-cant lags in the industry’s ability to respond.
Over time in Florida, growers have moved south tolocations less vulnerable to freezing. Freezes during the1980’s destroyed almost all the citrus in the northernareas. The need to extend the supply season has alsofavored increased production in southern areas. Thewarmer weather of the southern Florida regions allows
grapefruit to mature faster and thus supply the earlyseason market.
Availability of other high-quality fruit alternatives hasreduced grapefruit consumption. Domestic per capitaconsumption of fresh grapefruit fell 5 percent betweenthe 1980’s and the 1990’s. Total domestic shipments offresh grapefruit have declined in the face of a strongdomestic economy, increased population, and expansionof overall fruit consumption. Demand for grapefruitjuice has also been relatively flat, although not-from-concentrate alternatives have been well received by con-sumers. Since juice markets provide both a residualdemand and a more storable alternative for fresh grape-fruit, juice price affects price in the fresh market. Whenjuice stocks are high, as they were in the 1996/97 sea-son, both markets are affected.
Partially as a consequence of the stagnant domesticdemand, the U.S. grapefruit industry has pursued exportsales. Approximately 68 percent of Florida fresh grape-fruit were exported in 1999/2000. The Japanese beefand citrus phytosanitary agreement, signed in 1989,opened a significant new market for U.S. grapefruitexports. In 1999/2000, 32 percent of all Florida freshgrapefruit sales were exports to Japan. Demand in thismarket is primarily for high quality white grapefruit, aproduct that does not sell well in domestic markets,although sales of red grapefruit to Japan have increasedin recent years. Along with increased exports to interna-tional markets has come increased exposure to globaleconomic conditions. As the Asian economies declinedin the 1990’s, grapefruit sales also significantly con-tracted. Following the economic recovery, sales to thesemarkets have begun to rebound. The European Union isanother important market for U.S. grapefruit, but saleshave declined the last three seasons. The drop illus-trates, at least partially, another risk faced by U.S.exporters; the U.S. dollar strengthened against mostEuropean currencies making U.S. grapefruit moreexpensive relative to other suppliers.
Imported grapefruit and grapefruit products have alsopenetrated the U.S. market. Imports as a percentage ofdomestic consumption were close to zero until the late1980’s but have ranged from 2 to 5 percent annuallysince the 1989 freeze. The desire of U.S. shippers toprovide a year-round supply of product to their buyershas provided an entry for imported grapefruit as ship-pers seek complementary production areas to fill theiroff-season needs.
Florida Grapefruit

Economic Research Service/USDA U.S. Fresh Fruit and Vegetable Marketing / AER-795 � 15
Due to all these factors, the average change in numberof buyers of all types across all firms selling a particu-lar crop between 1994 and 1999 was fairly small,ranging from 9 to -12 percent (table 6). Forlettuce/bagged salad firms, only information on thedirection of change in the number of regular buyerswas available. Overall, no obvious trend was observed;with approximately equal numbers of shippers report-ing increases and decreases.
While the relative stability in the overall number ofbuyers does not suggest any clear increase in bargain-ing power of buyers, the share of shipper sales to theirlargest buyers shows how important a few accounts canbe. In 1999, the share of sales to the top four buyersranged from 22 percent (of total firm sales, not justsales of the targeted crop) for lettuce shippers to 45percent for Florida tomatoes. The Florida tomato indus-try sells little to final users, relying instead on sales to asmall number of repackers. With an average of 367buyers for lettuce/bagged salad shippers, the top 4accounts are less important than for other products. Theshare of sales going to the top 4 and top 10 buyersincreased slightly for all commodities from 1994 to1999, except for the top 10 buyers of Florida grapefruit(table 7). The decrease in buyer concentration forgrapefruit may be due to the small sample size.
Change in Retail Accounts
When asked about changes in the number of retailaccounts specifically, most shippers reported a declineand indicated they believed that this was due to retailconsolidation. A decline in the number of retailaccounts was generally viewed as negative. Some ship-pers, however, selling to fewer but larger retailaccounts felt this generated internal operating efficien-cies by reducing transaction costs. Each product had at
least one firm that thought retail accounts had notdeclined, with California tomato and lettuce/baggedsalad shippers most likely to feel that way.
We questioned shippers on the impact of retail consoli-dation. Most thought their negotiating strength relativeto retailers had decreased due to retail consolidationand that this was harmful. Individual crop experiencesvaried, with grapefruit shippers reporting there hadbeen no change in their negotiating strength. Tomatoshippers in both California and Florida were less cer-tain the change was due to retail consolidation, perhapsindicating that their negotiating strength had declinedas consumer preferences have shifted from the stilldominant mature green to other types of tomatoes.
Overall, shippers indicated that over the last 5 yearsthey were more fearful of losing business if they didnot comply with buyer requests, that this change wasdue to retail consolidation, and the impact on theirfirms was harmful. Tomato shippers were less con-cerned, possibly because many of them deal withrepackers, not retailers. In a similar vein, we asked ifshippers were more or less willing to use the provisionsof USDA’s Perishable Agricultural Commodities Act(PACA) to settle disputes with buyers. The majority ofshippers said there was no change, but there were largenumbers reporting both increases and decreases. Ship-pers less willing to use PACA attributed this harmfultrend to retail consolidation and, by implication, thefear of losing business. Shippers reporting increasedwillingness to use PACA viewed this trend as benefi-cial, but not necessarily due to retail consolidation.
The majority of shippers said that volume require-ments of retail buyers had increased and that it wasdue to retail consolidation. Almost all grape andorange shippers reported that volume requirements
Table 7—Share of total shipper sales going to top 4 and top 10 buyers, 1994 and 19991
California Florida BaggedItem and year Grapes Oranges Grapefruit tomatoes tomatoes Lettuce salads
Percent of total sales2
Top four buyers:1994 29 28 26 26 34 21 n.a.1999 31 34 29 28 45 22 n.a.
Top 10 buyers:1994 47 46 54 45 48 37 n.a.1999 49 52 51 48 59 39 n.a.
n.a. = Not available.1 Results are based on a limited number of observations and must be interpreted with caution.2 Sales of all products sold by shippers, not just the targeted product.
Source: Economic Research Service, Produce Marketing Study interviews, 1999-2000, USDA.
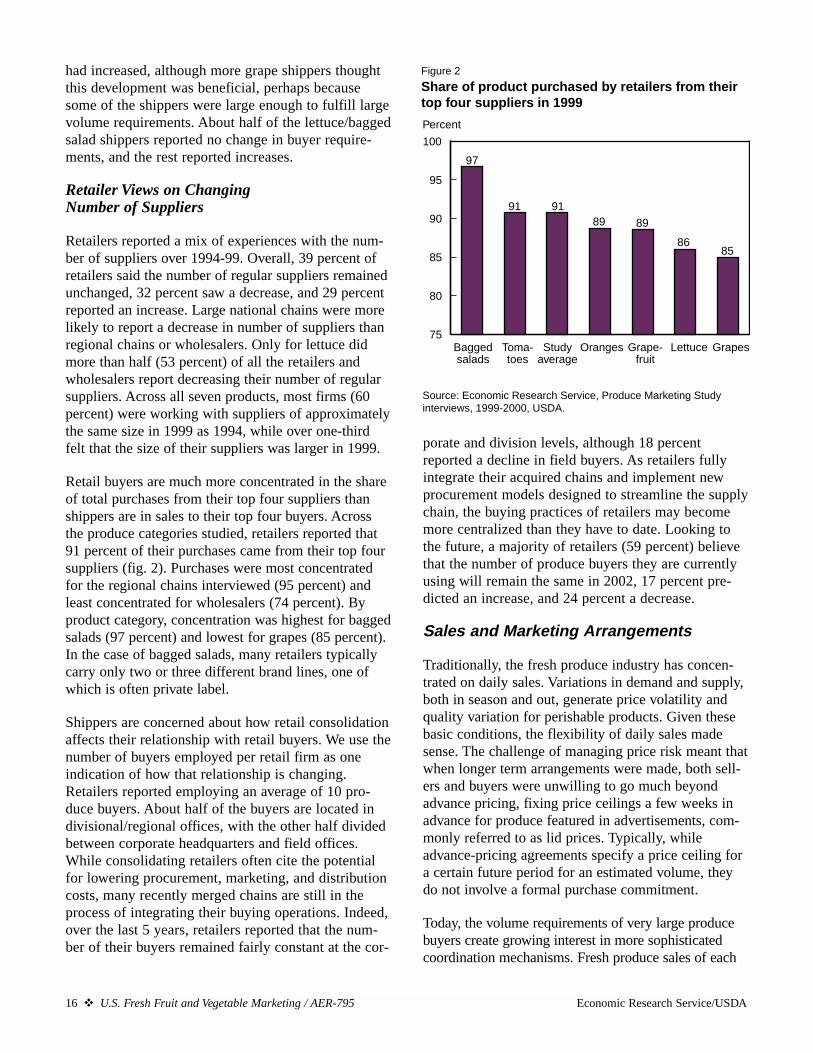
16 � U.S. Fresh Fruit and Vegetable Marketing / AER-795 Economic Research Service/USDA
had increased, although more grape shippers thoughtthis development was beneficial, perhaps becausesome of the shippers were large enough to fulfill largevolume requirements. About half of the lettuce/baggedsalad shippers reported no change in buyer require-ments, and the rest reported increases.
Retailer Views on Changing Number of Suppliers
Retailers reported a mix of experiences with the num-ber of suppliers over 1994-99. Overall, 39 percent ofretailers said the number of regular suppliers remainedunchanged, 32 percent saw a decrease, and 29 percentreported an increase. Large national chains were morelikely to report a decrease in number of suppliers thanregional chains or wholesalers. Only for lettuce didmore than half (53 percent) of all the retailers andwholesalers report decreasing their number of regularsuppliers. Across all seven products, most firms (60percent) were working with suppliers of approximatelythe same size in 1999 as 1994, while over one-thirdfelt that the size of their suppliers was larger in 1999.
Retail buyers are much more concentrated in the shareof total purchases from their top four suppliers thanshippers are in sales to their top four buyers. Acrossthe produce categories studied, retailers reported that91 percent of their purchases came from their top foursuppliers (fig. 2). Purchases were most concentratedfor the regional chains interviewed (95 percent) andleast concentrated for wholesalers (74 percent). Byproduct category, concentration was highest for baggedsalads (97 percent) and lowest for grapes (85 percent).In the case of bagged salads, many retailers typicallycarry only two or three different brand lines, one ofwhich is often private label.
Shippers are concerned about how retail consolidationaffects their relationship with retail buyers. We use thenumber of buyers employed per retail firm as oneindication of how that relationship is changing.Retailers reported employing an average of 10 pro-duce buyers. About half of the buyers are located indivisional/regional offices, with the other half dividedbetween corporate headquarters and field offices.While consolidating retailers often cite the potentialfor lowering procurement, marketing, and distributioncosts, many recently merged chains are still in theprocess of integrating their buying operations. Indeed,over the last 5 years, retailers reported that the num-ber of their buyers remained fairly constant at the cor-
porate and division levels, although 18 percentreported a decline in field buyers. As retailers fullyintegrate their acquired chains and implement newprocurement models designed to streamline the supplychain, the buying practices of retailers may becomemore centralized than they have to date. Looking tothe future, a majority of retailers (59 percent) believethat the number of produce buyers they are currentlyusing will remain the same in 2002, 17 percent pre-dicted an increase, and 24 percent a decrease.
Sales and Marketing Arrangements
Traditionally, the fresh produce industry has concen-trated on daily sales. Variations in demand and supply,both in season and out, generate price volatility andquality variation for perishable products. Given thesebasic conditions, the flexibility of daily sales madesense. The challenge of managing price risk meant thatwhen longer term arrangements were made, both sell-ers and buyers were unwilling to go much beyondadvance pricing, fixing price ceilings a few weeks inadvance for produce featured in advertisements, com-monly referred to as lid prices. Typically, whileadvance-pricing agreements specify a price ceiling fora certain future period for an estimated volume, theydo not involve a formal purchase commitment.
Today, the volume requirements of very large producebuyers create growing interest in more sophisticatedcoordination mechanisms. Fresh produce sales of each
75
80
85
90
95
100
Baggedsalads
Toma-toes
Studyaverage
Oranges Lettuce GrapesGrape-fruit
Share of product purchased by retailers from their top four suppliers in 1999
Percent
Figure 2
Source: Economic Research Service, Produce Marketing Studyinterviews, 1999-2000, USDA.
97
91 9189 89
8685

Economic Research Service/USDA U.S. Fresh Fruit and Vegetable Marketing / AER-795 � 17
of the top five U.S. retailers and mass merchandisers arein the multi-billion-dollar range; relying on daily salesruns the risk of not being able to procure the volumes,sizes, varieties, quality, and consistency levels neces-sary. Furthermore, branded, fresh-cut products such asbagged salads require consistent, reliable, year-roundavailability and quality that makes longer term arrange-ments more desirable for both shippers and retailers.
The use of advance pricing arrangements for promo-tions has been increasing and it appears that the num-ber of weeks in advance for which prices are fixed hasgrown as well. The majority of shippers indicated anincrease in lead time for lid prices, and they viewedthis as a harmful trend due to retail consolidation.Shippers in this sample reported 3-week advance pric-ing arrangements as common (compared with 1-2weeks in the early 1980’s) and many reported leadtimes of a month or more as no longer uncommon.
Shippers have always asserted that this type of forwardselling arrangement is loosely implemented and func-tions mainly to protect retailers from price spikeswhen a product is being sold at an advertised saleprice. These advance arrangements are not forwardretail purchases, which entail a commitment to pur-chase. If the market price declines below the negoti-ated lid price, shippers are generally obliged to lowerprices to the current f.o.b. price since retailers usuallyhave the option to obtain supplies elsewhere. Shipperscommonly consider lid prices to be an unequalarrangement, reducing their ability to capture potentialmarket highs. Still, they also help to ensure a home forthe product and shippers report increasing use ofadvance pricing as retail interest apparently grows.
The use of contracts is becoming more common aswell. We define contracts broadly to include preferredsupplier relationships/deals, partnerships, or programsbetween buyers and sellers. Specifically, contractsinclude both written and verbal negotiated salesarrangements that cover multiple sales transactions orongoing relationships. The point of distinction (relativeto daily sales) is ongoing sales and marketing agree-ments with buyers versus single shipments, even ifprice is not fixed.
Daily sales remain the leading sales and marketingarrangement across all the products considered, withthe exception of bagged salads. Data on sales mecha-nisms for bagged salads are incomplete and notreported here. For all marketing channels and prod-
ucts, except lettuce and bagged salads, daily salesaccounted for 58 percent of total sales in 1999, com-pared with 72 percent in 1994 (table 8). As noted ear-lier, percentages are based on the total value of sales ineach category, not the percentage of sales of each firmin each category. Hence, these results reflect how theactual dollar sales volumes captured by each commod-ity sample were sold. Advance pricing increased from19 to 24 percent of the total value of sales over thesame 5-year period. Short-term contracts (less than 1year) increased from 7 to 11 percent of sales, andannual or multiyear contracts increased from 2 to 7percent in 1999. However, these trends varied greatlyacross marketing channels. Data for lettuce salesmechanisms were only available for 1999 and indicatea higher reliance on daily sales (66 percent) than forthe other commodities. Lettuce also had double the
Table 8—Sales mechanisms for each marketing channel,1994 and 19991
Type of sales mechanismProduct and Daily Advance Short-term Long-termmarketing channel sales sales contract contract
Percent of sales via each sales mechanism
Grapes, oranges, grapefruit, 1994and California and Florida tomatoes
All 72 19 7 2Retail 57 30 12 1Mass merchandise 20 19 48 13Wholesale 90 7 1 2Broker 92 8 0 0Foodservice 74 6 20 0
1999All 58 24 11 7Retail 43 42 11 4Mass merchandise 7 23 41 29Wholesale 87 8 3 2Broker 90 10 0 0Foodservice 39 3 28 30
Lettuce2 1999All 66 20 0 14Retail 76 11 0 13Mass merchandise 0 0 0 100Wholesale 98 2 0 0Broker n.a. n.a. n.a. n.a.Foodservice 12 79 0 9
n.a. = Not available.1 Results are based on a limited number of observations and must be interpreted with caution.2 Similar data on lettuce were not available for 1994. Data on bagged salads were unavailable for both years.
Source: Economic Research Service, Produce Marketing Study interviews,1999-2000, USDA.

18 � U.S. Fresh Fruit and Vegetable Marketing / AER-795 Economic Research Service/USDA
percentage of sales moving via long-term contracts (14percent), probably due to their frequent associationwith bagged salad sales under contract.
Retail Marketing Channels
For shippers’ sales specifically to retail marketingchannels, daily sales accounted for 43 percent of salesof grapes, oranges, grapefruit, and tomatoes in 1999,and advance pricing accounted for most of the rest (42percent). (In comparison, 76 percent of lettuce sales toretailers were via daily sales in 1999 and only 11 per-cent via advance pricing). Over 1994-99, there was ashift away from daily sales to more advance pricing.Sales under short-term contracts dropped slightly.Shipper sales to retailers under longer term contractarrangements grew from 1 percent of their sales to 4percent, well behind contracts with mass merchandis-ers, but indicating greater application of supply chainmanagement practices than 5 years before (table 8).
Interviews with bagged salad shippers indicated thatannual or multiyear contracts are the most commontype of marketing arrangement for retail sales. In1994, bagged salads were still a new product in manyretail markets. As bagged salads gained acceptanceand sales skyrocketed, bagged salad firms began tocompete more intensely for market share in particularmetropolitan areas. Since retailers typically carry onlytwo or three different brands of bagged salads, long-term contracts assure the shipper of continuous sales.
Retailers were also asked how their sales arrangementswith suppliers had changed since 1994 and theiranswers tally with those of shippers. Forty-seven per-cent said use of daily sales remained unchanged, whileabout one-quarter had decreased their use of daily sales.Hence, practices appear to be changing at different ratesacross retail firms. Almost two-thirds (65 percent)responded that the use of both advanced pricing andseasonal (short-term) contracts had increased. Nearlyhalf said they increased their use of annual contracts,while one-third used more multiyear contracts. Retailerresponses include information on bagged salads, whichwas unavailable from shipper interviews.
Mass Merchandise Marketing Channels
Mass merchandisers have become important outlets forthe fresh produce industry, especially in the last 5years. As newcomers, mass merchandisers are imple-menting unconventional procurement models, the bestdeveloped of which is the automatic inventory replen-
ishment model. This model electronically integratesprequalified preferred suppliers with the mass mer-chandiser’s internal inventory and sales records,enabling the supplier to automatically replenish inven-tory based on product movement and pre-establishedorder triggers. Preferred suppliers are responsible forone or more distribution centers of the buyer, depend-ing on their volume capabilities and performance, andthe buyer usually has a limited number of preferredsuppliers per commodity. This contracting model, bydefinition, allows flexible volumes, but arrangementsfor handling price and duration of the relationship mayvary, depending on the commodity and season.
In contrast to retail channels, sales of our sample tomass merchandisers were generally not via daily sales.In 1999, only 7 percent of volume sold through themass merchandising channel was as daily sales(excluding lettuce and bagged salads). Mass merchan-disers have been experimenting for some time withmore closely coordinated procurement approaches andthey are clearly evolving toward longer term arrange-ments. In 1999, mass merchandisers purchased 29 per-cent of the sample commodities under annual preferredsupplier deals or contracts, compared with 13 percentin 1994 (table 8). Furthermore, mass merchandiserspurchased lettuce exclusively via annual contracts,according to the shippers interviewed. While massmerchandisers were by far the heaviest users of short-term contracts in 1999, at 41 percent of purchases, thiswas down from 48 percent in 1994 as they shiftedmore volume to annual contracts or advance pricing.Advance pricing accounted for 23 percent of sales in1999, up from 19 percent in 1994.
Wholesale, Broker, and Foodservice Marketing Channels
In 1999, wholesalers and brokers used daily salesmuch more than other buyers, at 87 and 90 percent ofsales, for sample commodities other than lettuce andbagged salads (table 8). For lettuce, 98 percent of salesto wholesalers were via daily sales. Information on thesales mechanisms used for lettuce sales to brokers isnot available.
Sales mechanisms for foodservice firms depend on thecommodity. For grapes, oranges, and grapefruit,almost all sales were via daily sales and advance pric-ing. California tomato shippers used long-term con-tracts for 56 percent of sales. Florida tomato shippersfavored short-term contracts. Foodservice buyers

Economic Research Service/USDA U.S. Fresh Fruit and Vegetable Marketing / AER-795 � 19
In 1999, the California grape industry produced 98 per-cent of the U.S. fresh domestically produced grape sup-ply. California grape production and shipments havetrended upward since 1990, from 645,000 tons to757,000 tons in 1999. The grape season starts in theCoachella Valley in May, moving up the Central Valleywith shipments extending into January, including salesof grapes from storage. Grapes destined for the freshmarket are produced differently from other grapes, butmany grape varieties can be used in several differentproducts, such as raisins, wine, or juice, most notablythe ubiquitous Thompson Seedless grape.
Grape imports increased 37 percent between 1989 and1999, and are now equal to one-half of domestic pro-duction. While imports are sizable, traditionally most ofthe imports have entered during the off-season andhelped to extend supply on a year-round basis, ratherthan competing with most of California’s production.Imports seemed to be stabilizing in recent years, uponly 6.6 percent between 1997 and 1999. In 2000, how-ever, volumes from Chile increased substantially for thefirst time in several years. In addition, small, but rapidlyincreasing volumes are now being imported from otherSouth American countries. Mexico’s role as a springcompetitor has grown during the 1990’s with imports in2000 reaching 90,689 metric tons; however, importswere well below the 1998 peak of 101,044 metric tons.Mexico’s shipments overlap almost entirely with theCoachella Valley, although production in the Arvin areaof the southern Central Valley can also be affected.
When imports are important for an industry, shippersoften try to control or coordinate the situation by import-ing product themselves to sell along with their own sup-ply. For example, some California grape shippers importgrapes from Mexico, Chile, and a few other countries toprovide a year-round supply. In 1999, five of the nineinterviewed firms imported grapes, up from three in 1994.Imports are frequently acquired via vertically integrated orcoordinated relationships such as joint ventures and strate-gic alliances, but in many cases the shipper simply acts asa sales agent. The importing strategy may require moremarketing sophistication and acceptance of risk than justselling domestic product, with the latter depending onhow involved the shipper becomes in financing the for-eign production. The growth in imports handled by ship-pers facilitates meeting buyer demand for year-roundavailability of product, and shippers’ benefit during thedomestic season by maintaining their marketing presencewith buyers on a consistent basis throughout the year.
California grape shippers, except those located in theCoachella Valley, have fared quite well in recent years.California grape producers and shippers have tradition-ally benefited from almost nonexistent competitionfrom other domestic sources, the entrance of importsprimarily during the off-season, and a single majorsource of import supply, Chile, with an organizedapproach to marketing and promotion in the U.S. mar-ket. Chilean producers and exporters generally spendover $3 million annually to fund a generic promotionprogram for Chilean winter fruit. This helps maintainconsumer demand and retail shelf space for grapes year-round, assuring a smoother transition to the Californiashipping season. However, as more imports arrive fromnew (Argentina and South Africa) or expanding(Sonora, Mexico) production regions and for extendedperiods, they overlap more with early season Californiaproduction without contributing to a consumption pro-motion program. Furthermore, U.S. per-capita con-sumption is no longer growing at the rapid rate of thelate 1970’s through the 1980’s; per capita consumptionin 1989 of 7.9 pounds was close to the 1999 level of 8.2pounds. Expanding plantings of California fresh-marketgrapes may exert additional pressure on the Californiagrape industry.
With one of the most fragmented shipper structures ofCalifornia fresh produce commodities, the grapeindustry will also increasingly grapple with marketstructure issues. No shipper has more than an esti-mated 6-percent share of total California volume.Many shippers, considered large by grape industrystandards, are in the 1- to 2-percent-range of total vol-ume. There were an estimated 149 California grapeshippers in 1999. The number of growers, includinggrower-shippers, has declined over time, from an esti-mated peak of 1,049 in 1985 to 729 in 1995 to justover 600 currently. Much of the decline clearlyoccurred prior to the recent increase in retail consoli-dation.
To mitigate this fragmentation, the grape industry hasbeen implementing strategic alliances and joint venturesthat allow for either the consolidation of volumesbetween formerly competing shippers, or the extensionof shipping seasons via alliances with off-shoreexporters. Four grape firms out of 9 interviewedreported having made alliances of this type in the last 5years, half in response to retailer consolidation, and halfdue to other factors such as growing buyer demand foryear-round supply.
California Fresh Grapes

20 � U.S. Fresh Fruit and Vegetable Marketing / AER-795 Economic Research Service/USDA
greatly increased their use of both short-term andlonger term contracting under direct arrangements withshippers, with both mechanisms combined amountingto 58 percent of the sales to this channel in 1999, com-pared with 20 percent in 1994. This likely reflects the
importance of tomatoes as a menu item for many food-service users, hence, the need to ensure stable supplyand predictable pricing. Lettuce was sold to foodser-vice mainly via advance sales (table 8).

Economic Research Service/USDA U.S. Fresh Fruit and Vegetable Marketing / AER-795 � 21
Contracts
Both buyers and sellers face risks when forward con-tracting in markets with volatile prices. The fresh pro-duce industry has begun to experiment with contract-ing provisions that meet both buyer and seller needs.This process appears to be led by mass merchandisersrather than conventional retailers, although foodserviceusers are also becoming more involved.
Given the growth in contracts and its implications forthe coordination of supply and demand, contracts wereexplored in more detail. For the most part, the percent-age of sales under contract with any given buyer isquite low. Short- and long-term contracts togetheraveraged 18 percent of total sales in 1999 for grapes,oranges, grapefruit, and tomatoes, and 14 percent forlettuce (table 8). While contracts for most fresh pro-duce items are relatively new, a broad range of ship-pers already use them. When we asked firms detailedquestions about contracts with all types of buyers, 44percent of grape shippers, 89 percent of orange ship-pers, 50 percent of grapefruit shippers, 80 percent ofCalifornia tomato shippers, 33 percent of Floridatomato shippers, and 88 percent of lettuce shippersreported having at least one contract. Californiatomato repackers use contracts for a much larger per-centage of their sales than tomato shippers, since theyare the final service providers to large foodservice andretail buyers. Data are not available for bagged salads,but industry experts estimate that about 95 percent ofthe volume sold to retail is under contract.
Shippers have many reasons for contracting (table 9).Across all commodities (excluding lettuce and baggedsalads, which had inadequate data), shippers reportedthree main factors influencing their decision to enterinto retail contracts: to ensure the market or sale, tomaintain future relationships with buyers, and toachieve stable prices. While some shippers activelyseek contract business with their customers, most pro-viding contracts indicated that it was in response tobuyer requests.
Designing efficient contracts from the standpoint ofboth buyers and sellers is a challenge for perishablecrops where prices may fluctuate significantly due toexogenous supply and demand shocks, beyond morepredictable seasonal factors. If a product is in shortsupply, buyers will be protected from high prices viacontracts but shippers will lose the opportunity to ben-efit from high spot market prices. With large supply,shippers may benefit from either a higher contractprice or greater assurance that they will sell their pro-duce, even at the prevailing market price, while buyersrisk overpaying relative to competitors not using con-tracts. Fluctuations in volume, as well as price, poseproblems for both shippers and retailers. Shippersmust have a sufficiently large supply to be able tocommit a particular volume to a buyer. Buyers maywant to limit their risk exposure, reluctant to be lockedin to purchasing from a supplier who may experienceinconsistencies in quality, sizing, and volume.
Shippers may be further constrained in their decisionsregarding contracting by their relationships with the
Table 9—Importance of various factors in shippers' decisions to use contracts1
Average degree of importance(1 = not important, 5 = very important)
Item California Florida Lettuce/ AllGrapes Oranges Grapefruit tomatoes tomatoes bagged salads products
Assured market or sale 4.4 4.4 4.2 4.5 4.0 n.a. 4.3Maintenance of future relationship with buyers 4.2 4.5 4.2 4.5 4.0 n.a. 4.3Price stability 3.6 3.8 4.4 3.5 4.5 n.a. 3.8Pressure from retailers and their repackers 2.8 2.9 4.0 3.2 2.5 n.a. 3.1Superior price 3.4 3.0 3.4 2.8 1.5 n.a. 3.0Incentives provided by retailers 2.6 2.1 2.6 2.3 1.0 n.a. 2.3Reduction in cost of sales and marketing 3.0 1.6 2.6 2.5 1.0 n.a. 2.2Reduction in cost of distribution 3.0 1.4 2.8 2.0 1.0 n.a. 2.0Pressure from growers 2.6 1.6 2.2 1.7 3.0 n.a. 2.0Prior experience with foodservice contracts 1.8 1.1 1.0 3.0 3.5 n.a. 1.8
n.a. = Not available.1 Results are based on a limited number of observations and must be interpreted with caution.
Source: Economic Research Service, Produce Marketing Study interviews, 1999-2000, USDA.
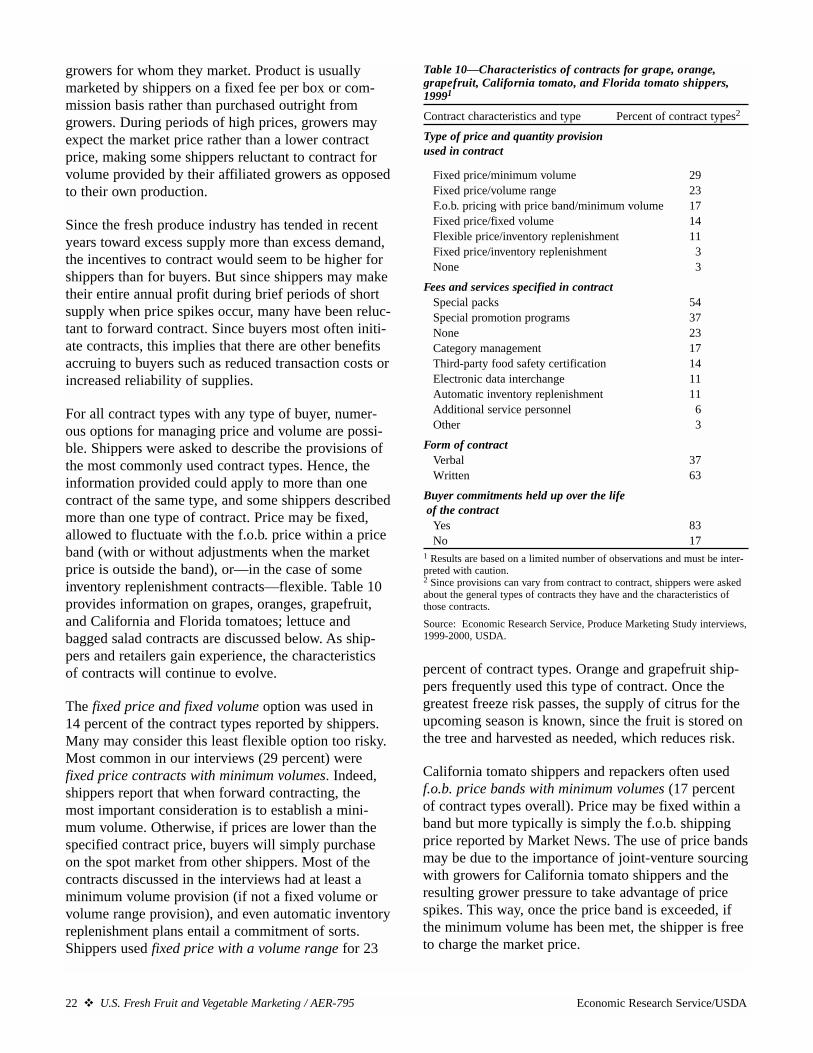
22 � U.S. Fresh Fruit and Vegetable Marketing / AER-795 Economic Research Service/USDA
growers for whom they market. Product is usuallymarketed by shippers on a fixed fee per box or com-mission basis rather than purchased outright fromgrowers. During periods of high prices, growers mayexpect the market price rather than a lower contractprice, making some shippers reluctant to contract forvolume provided by their affiliated growers as opposedto their own production.
Since the fresh produce industry has tended in recentyears toward excess supply more than excess demand,the incentives to contract would seem to be higher forshippers than for buyers. But since shippers may maketheir entire annual profit during brief periods of shortsupply when price spikes occur, many have been reluc-tant to forward contract. Since buyers most often initi-ate contracts, this implies that there are other benefitsaccruing to buyers such as reduced transaction costs orincreased reliability of supplies.
For all contract types with any type of buyer, numer-ous options for managing price and volume are possi-ble. Shippers were asked to describe the provisions ofthe most commonly used contract types. Hence, theinformation provided could apply to more than onecontract of the same type, and some shippers describedmore than one type of contract. Price may be fixed,allowed to fluctuate with the f.o.b. price within a priceband (with or without adjustments when the marketprice is outside the band), or—in the case of someinventory replenishment contracts—flexible. Table 10provides information on grapes, oranges, grapefruit,and California and Florida tomatoes; lettuce andbagged salad contracts are discussed below. As ship-pers and retailers gain experience, the characteristicsof contracts will continue to evolve.
The fixed price and fixed volume option was used in14 percent of the contract types reported by shippers.Many may consider this least flexible option too risky.Most common in our interviews (29 percent) werefixed price contracts with minimum volumes. Indeed,shippers report that when forward contracting, themost important consideration is to establish a mini-mum volume. Otherwise, if prices are lower than thespecified contract price, buyers will simply purchaseon the spot market from other shippers. Most of thecontracts discussed in the interviews had at least aminimum volume provision (if not a fixed volume orvolume range provision), and even automatic inventoryreplenishment plans entail a commitment of sorts.Shippers used fixed price with a volume range for 23
percent of contract types. Orange and grapefruit ship-pers frequently used this type of contract. Once thegreatest freeze risk passes, the supply of citrus for theupcoming season is known, since the fruit is stored onthe tree and harvested as needed, which reduces risk.
California tomato shippers and repackers often usedf.o.b. price bands with minimum volumes (17 percentof contract types overall). Price may be fixed within aband but more typically is simply the f.o.b. shippingprice reported by Market News. The use of price bandsmay be due to the importance of joint-venture sourcingwith growers for California tomato shippers and theresulting grower pressure to take advantage of pricespikes. This way, once the price band is exceeded, ifthe minimum volume has been met, the shipper is freeto charge the market price.
Table 10—Characteristics of contracts for grape, orange,grapefruit, California tomato, and Florida tomato shippers,19991
Contract characteristics and type Percent of contract types2
Type of price and quantity provision used in contract
Fixed price/minimum volume 29Fixed price/volume range 23F.o.b. pricing with price band/minimum volume 17Fixed price/fixed volume 14Flexible price/inventory replenishment 11Fixed price/inventory replenishment 3None 3
Fees and services specified in contractSpecial packs 54Special promotion programs 37None 23Category management 17Third-party food safety certification 14Electronic data interchange 11Automatic inventory replenishment 11Additional service personnel 6Other 3
Form of contractVerbal 37Written 63
Buyer commitments held up over the life of the contract
Yes 83No 17
1 Results are based on a limited number of observations and must be inter-preted with caution.2 Since provisions can vary from contract to contract, shippers were askedabout the general types of contracts they have and the characteristics ofthose contracts.
Source: Economic Research Service, Produce Marketing Study interviews,1999-2000, USDA.

Economic Research Service/USDA U.S. Fresh Fruit and Vegetable Marketing / AER-795 � 23
Clearly, price volatility in the produce industry contin-ues to pose challenges in designing contracts benefi-cial to both buyers and sellers. Any of the above typesof contracts may be designed with supplementaryadjustment mechanisms. For example, when the f.o.b.price exceeds the high price in a contract by a prede-termined amount, the high price may ratchet up aspecified amount, but less than the market price.Hence, if market prices exceed the price band, ship-pers are still able to return a price to growers morereflective of the f.o.b. spot market. Likewise, whenf.o.b. prices go below the minimum contract price, theprice may adjust downward by a specified amount,allowing retailers to source at more competitive prices.The buyer might otherwise tend not to meet the mini-mum volume commitment, forcing the shipper to findanother buyer in a depressed marketplace.
Automatic inventory replenishment was used in 11 per-cent of the contract types with a flexible price and in 3percent with a fixed price (table 10). Only for 3 percentof the contract types were there no price or volumeprovisions, meaning that the contract type merelyreflected an ongoing preferred supplier relationship,specifying other arrangements such as packaging orother services.
As discussed earlier, contracts are a means for firms tobetter coordinate supply and demand, particularly fordifferentiated products. Many contract types includeservices that help tailor the product to retailer needs,such as provision of special packs (54 percent) andpromotion programs (37 percent). That said, 23 per-cent of contract types specified no fees and services.
Contracts can still be informal unwritten deals consum-mated with a handshake. Nevertheless, in 1999, 63 per-
cent of contract types were written (table 10). As notedearlier, shippers commonly report that buyers do notalways honor advance pricing, manifested as lid pricesfor advertisements. The types of contracts reported hereare different because they reflect ongoing relationshipsand advance buying arrangements rather than just one-time advance prices without buying commitments. Ship-pers viewed these contracting arrangements favorably,reporting that 83 percent of contract types had held upover time (table 10). Orange shippers reported most ofthe failed contracts, perhaps the result of the freeze inthe 1998/99 season that reduced total orange productionby 48 percent from the previous season.
Use of contracts will likely continue, especially aslarger buyers begin to adopt supply chain managementpractices that focus more on year-end rather thanweekly results, as well as focusing more on net ratherthan gross returns. The shippers interviewed for thisstudy were largely satisfied with the results of con-tracts. Actions required to meet contract require-ments—most frequently assigning employees to thecontract account and requiring employees to workovertime—appear to be manageable (table 11). Buyingproduce from others due to a production shortfall didnot seem to be a serious problem. Grape and Califor-nia tomato shippers mentioned the need to developglobal sourcing to meet year-round or extended-seasoncontract commitments.
Lettuce firms also used a range of contract types. Sev-eral shippers indicated that their contracts with retailbuyers had fixed prices with volume ranges. Othershippers used f.o.b. pricing within a specified priceband with price adjustments. A few other firms men-tioned that they used a variety of contract types. Sometimes the type of contract depended on buyer
Table 11—Actions to meet contract requirements, 19991
Average of frequency of actions (1 = never, 5 = often)Item California Florida Lettuce/ All
Grapes Oranges Grapefruit tomatoes tomatoes bagged salads products
Assign employees to account 3.8 2.4 4.0 3.3 1.5 n.a. 3.1Require employees to work overtime 2.8 2.9 3.2 3.2 1.5 n.a. 2.9Buy produce from others 2.8 2.5 3.0 2.8 1.5 n.a. 2.7Form joint ventures or strategic alliances 3.2 1.5 2.5 3.2 3.0 n.a. 2.5Acquire additional transport and/or storage 3.0 2.0 2.8 2.8 1.5 n.a. 2.5Redirect shipments from other customers 2.0 1.9 2.3 2.8 3.0 n.a. 2.3Develop global sourcing opportunities 3.3 1.1 2.0 3.3 n.a. n.a. 2.1
n.a. = Not available.1 Results are based on a limited number of observations and must be interpreted with caution.
Source: Economic Research Service, Produce Marketing Study interviews, 1999-2000.

24 � U.S. Fresh Fruit and Vegetable Marketing / AER-795 Economic Research Service/USDA
preferences and sometimes the shipper only offeredcertain types of contracts to their best customers.
Provisions for advertisement promotions are some-times included in lettuce contracts. Lower prices arespecified, and sometimes a higher volume commit-ment. Lettuce contracts were both verbal and writtenand usually negotiated on an annual basis. A few firmsused shorter contracts—for 3, 6, and 9 months—whileone had a multiyear contract. Only a few lettuce firmsindicated having contracts with foodservice buyers,
although several mentioned the stable, ongoing rela-tionships they had with many foodservice buyers.Foodservice contract provisions ranged from the flexi-ble, with price and quantity determined on a weeklybasis, to a fixed price with a specified volume. Insteadof a set duration, contract terms were often renegoti-ated only when necessary. Bagged salad contracts arewritten and specific about price, quantity, advertise-ment periods, fees, and services. They are usuallyannual or multiyear contracts.

Economic Research Service/USDA U.S. Fresh Fruit and Vegetable Marketing / AER-795 � 25
Fees and Services
All but five of the interviewed firms reported that feeand service requests from grocery retailers and massmerchandisers had increased; none reported adecrease. The five exceptions were California andFlorida tomato shippers, who felt that requests wereunchanged. Responses from the retailer interviewsconfirm the increase in fees and services. We askedshippers to describe their experiences with a list ofpossible fees and services. For each type of fee orservice, we know if a shipper paid a fee or providedthe service or had received a request to do so, but notto how many accounts it applied. Generally, firmsreported that multiple buyers requested a particulartype of fee or service.
Not all fees and services were necessarily viewed asharmful. Some were thought to enhance product move-ment or to provide competitive advantages to the ship-per. In general, fees were viewed as more harmful thanservices, which likely explains the higher shipper com-pliance rate with services. Specifically, 17 percent ofthe types of fees requested were viewed as beneficial,21 percent were viewed as neutral, and 62 percentwere considered to be harmful. In contrast, 44 percentof the types of services requested were consideredbeneficial, 27 percent neutral, and 29 percent harmful.
Fees
On average, 3.7 different types of fees had beenrequested by retailers and mass merchandisers oroffered by shippers in 1999 (table 12). As price takers,
individual commodity shippers may not be able to passfees along to buyers. As a result, with the exception offresh-cut produce, shippers generally paid fees onlywhen required to do so by their retail customers ratherthan using them proactively to capture greater marketshare from competitors.
Florida and California tomatoes had the least numberof fee requests or offers (2.5 and 2.3) and grapefruitshippers the most, 5.4 (table 12). However, if the let-tuce and bagged salad data are separated, bagged saladshippers experienced 5.8 types of fees. The relativelyhigh incidence of fees for grapefruit shippers is puz-zling. One explanation is that theirs is the only consid-ered commodity with declining per capita consump-tion; retailers may request more fees to mitigate lowgrapefruit demand relative to supply.
Nearly half of all fee requests were reported to be newwithin the last 5 years. For lettuce/bagged salad ship-pers, however, fees appear more longstanding withonly 30 percent reported to be new (table 12).
We asked how shippers dealt with requests for differ-ent fee types and the consequences of their actions. Inthe interviews, we provided four options for each typeof fee request: the shipper complied with a request, didnot comply but suffered no adverse consequences, didnot comply and lost the account, or negotiated analternative (see appendix). If a firm reported that theycomplied with a request for a particular type of fee, wedo not know if they complied with a request for justone account or for more than one. For example, if allfirms complied with a fee request for at least one
Table 12—Average number of fee types reported per shipper and dispositive of requests by product type, in 19991
California Florida Lettuce/ AllItem Grapes Oranges Grapefruit tomatoes tomatoes bagged salads products
Number per firmAverage number of fee types requested by or offered to retailers and mass merchandisers2 3.2 4.3 5.4 2.3 2.5 4.7 3.7
Percent of requests3
Average share of new fee types among requested fee types4 52 59 49 61 47 30 48
Average share of requested fee types complied with 69 51 45 36 29 79 58
Average share of requests resulting in accounts lost when not complied with 33 47 47 15 100 63 41
1 Results are based on a limited number of observations and must be interpreted with caution. The nine types of fees considered are listed in the box, "Fees."2 Shippers were asked if they paid a type of fee to any of their retail accounts. Thus, these results indicate the number of fee types paid to at least one retailaccount. 3 Includes fees offered by shippers.4 New since 1994.
Source: Economic Research Service, Produce Marketing Study interviews, 1999-2000, USDA.

26 � U.S. Fresh Fruit and Vegetable Marketing / AER-795 Economic Research Service/USDA
account, we would show 100 percent compliance butthis does not mean that all firms complied withrequests for 100 percent of their accounts.
Also, when firms have more than one account for anyparticular type of fee, they could report more than oneoption for dealing with requests. A firm with feerequests for more than one account could possiblyreport more than one outcome and perhaps all four; wedo not have a one-to-one mapping of accounts and feerequest disposition. As a result, the sum of the fourresponses does not necessarily equal 100 percent(although firms often reported the most common waythey handled fee requests). For example, in table 12, forthose grape firms receiving requests for the nine typesof fees considered, 69 percent of requests were com-plied with for at least one account. Another 33 percentof requests had at least one account where the shipperdid not comply with the fee and lost the account.
On average, shippers complied with 58 percent of thetypes of requests they received. Here, the differencesamong products were striking. Florida tomato shipperscomplied with only 29 percent of the types of feerequests they received, compared with 79 percent forlettuce/bagged salad shippers.
For 41 percent of the requests, shippers did not com-ply and lost business for at least one account. Califor-nia tomato shippers appeared to suffer these conse-quences much less; only 15 percent of fee type
requests not complied with resulted in lost accounts(table 12). In general, many California commodityfirms indicated that although they didn’t always losean account when unwilling to comply with a specialfee request, they often noted a decline in purchasesfrom the firm in question. These firms expressed con-cern since they felt unable to fully measure the oppor-tunity cost of noncompliance. In other words, it is dif-ficult to know what would have happened with salesto an account if fees had been paid.
Volume incentives (see box, “Fees”) are the mostcommonly provided type of fee with the highest costto shippers. While some fees are new within the last 5years, volume incentives have been used for years,although perhaps not at current levels. Volume incen-tives were requested of 73 percent of the firms inter-viewed, with only 18 percent of the requests reportedas new (table 13).
Volume incentives are typically implemented as gradu-ated incentives, with the discount per carton increasingwhen certain volume goals are met. When retailersrespect these graduated volume scales, some shippersview their implementation as beneficial. In other cases,shippers report that retailers take the deeper discountsregardless of whether the volume goals are met. Whenbilling and payment discrepancies of this type occur,some shippers are unwilling to engage in disputes forfear of losing a retail customer. More shippers consid-
Table 13—Fees requested by retailers and mass merchandisers, by type, 19991
Average share of firms Average share of requests3
Fee type Providing With a fee Complied Lost account for fee2 request3 New4 with5 noncompliance5
Percent
Volume incentives/discounts 40 73 18 68 33Promotional allowances or cooperative advertisements 34 62 41 67 50Other rebates 29 58 38 61 64Free-product discounts 28 42 26 78 25E-commerce fees 12 24 92 62 0Buy-back unsold products or failure fees 11 22 42 58 25Retail capital improvement fees 9 40 64 27 23Pay-to-stay fees 8 27 93 33 63Slotting fees 6 24 92 31 571 Results are based on a limited number of observations and must be interpreted with caution.2 Shippers were asked if they provided a type of fee to any of their retail accounts. Thus, these results indicate the share of firms paying fees to at least one retail account.3 Includes fees requested, whether complied with or not, and fees offered by shippers to at least one account.4 New since 1994.5 For any fee type requested, a shipper may comply with a request, not comply and suffer no adverse consequences, not comply and lose an account, or nego-tiate an alternative. A shipper may have more than one account and more than one response for the same type of fee, so the four alternatives (even though weonly report two) do not necessarily sum to 100 percent.
Source: Economic Research Service, Produce Marketing Study interviews, 1999-2000, USDA.

Economic Research Service/USDA U.S. Fresh Fruit and Vegetable Marketing / AER-795 � 27
ered volume discounts as harmful or neutral ratherthan beneficial.
Still, volume incentives have the potential to promotemore stable relationships between suppliers and retail-ers; as the retailer buys more units from the supplier,costs per unit decline, providing an incentive for theretailer to buy larger quantities (over the season) froma particular supplier. Shippers may also gain efficien-cies in marketing by increasing the size of accounts.
Promotional fees or cooperative advertisements arethe second most frequently requested fee, with 62 per-cent of shippers having either received requests oroffered this fee (table 13). If there is a performancecommitment on the part of the buyer to promote theproduct, shippers may gain—for example, if an adver-tisement for a product stimulates demand. However,many shippers question the return received from pro-motional allowances since it is often unclear to themhow retailers are spending monies allocated to promo-tion and whether consumer demand is indeedenhanced. Demand for fresh produce is generally rela-tively inelastic within certain price ranges. Hence,within these ranges, lower prices may not stimulategreater product movement, discouraging retailers fromreducing retail prices in accordance with f.o.b. pricereductions. When this occurs, promotional allowancesmay provide a benefit to the retailers’ bottom linewithout stimulating additional shipper sales.
Other rebates are simply a reduction in price with nobenefit to shippers unless such a payment is critical toretaining an important buyer. Other rebates seem tohave been present for a while as only 38 percent of therequests for other rebates were new. The compliancerate is relatively high at 61 percent, which may berelated to the fact that 64 percent of the requests notcomplied with resulted in lost accounts—the highestlevel of any fee or service considered (table 13).
Twenty eight percent of shippers paid free-product dis-counts and they generally viewed this fee as reasonable.Shippers are used to this fee—only 26 percent reportedthat it was new in the last 5 years—and the compliancelevel was the highest of all the fees, 78 percent. Evenfor those that did not comply with this fee, just 25 per-cent lost accounts, a low rate for fees in general. Thesefree product discounts are generally paid when retailersare opening new stores or warehouses.
E-commerce fees are charged by e-commerce firms tosell products using their electronic exchanges. These
fees are new and only 24 percent of shippers hadreceived a request, with 62 percent of requests com-plied with, and no one losing business by not comply-ing. E-commerce fees may become significant if more
Volume incentives. With this type of fee, shippers andbuyers agree that a per-unit rebate will be paid oncea certain volume level is attained. Volume incentivesare usually structured with graduated scales, increas-ing as certain target volumes are reached. This is aretroactive payment after sales for the season or aspecified period are over.
Promotional allowances or cooperative advertise-ments. This is a fee that shippers pay to retailers toadvertise their products. This may be a fixed, up-front fee or structured as a per carton allowance.There may or may not be a performance commit-ment associated with these fees.
Other rebates. This is a per-unit price reductionwithout any performance commitment, such as thoseassociated with volume incentives.
Free product discounts. When a shipper offers a newproduct, a retailer may request a certain number offree boxes, usually a specific number per store. Con-versely, when retailers open new stores, they mayrequest free product from their suppliers.
E-commerce fees. Fees charged by new e-commercefirms to sell products using their electronic exchanges.
Buy-back unsold product or failure fees. Retailersmay charge suppliers fixed fees when products failor force shippers to take back product rejected at thedistribution center level. A few shippers offer to buyback products that do not sell.
Capital improvement fees. Retailers request that ship-pers help pay for capital improvements, such as pur-chasing new refrigerated display equipment or newwarehouse construction.
Pay-to-stay fees. These are upfront fees paid for anexisting product to retain shelf space.
Slotting fees/listing fees/warehouse fees. Tradition-ally, slotting fees have been used to guarantee shelfspace for new products. A slotting fee may be aone-time or an annual fee. Listing or warehousefees are similar.
Fees

28 � U.S. Fresh Fruit and Vegetable Marketing / AER-795 Economic Research Service/USDA
buyers incorporate e-commerce into their procurementsystems. These fees were originally expected toamount to 1-2 percent of each invoice and many ship-pers indicate that their profit margins are insufficientto support this level of new expense. The e-commercefirms appear to be rapidly evolving toward fixedmonthly fees as a more appropriate business model.Still, many shippers are concerned about paying anynew fee to market to existing customers.
Although only 22 percent of firms reported a requestfor buy-back unsold product or failure fees, they hada relatively high rate of compliance, 58 percent,largely due to a perceived lack of an alternative. Ship-pers may be asked to take product back upon arrival ata distribution center, even paying the return freight.While some requests are for product rejected as sub-standard, shippers also accuse retailers of rejectingproduct without Federal or State inspections in periodsof abundant supply. This practice was viewed as veryharmful to shippers, but few firms reported lostaccounts due to noncompliance, largely due to thenegotiation of alternatives such as invoice adjustments.
One of the fee types considered most onerous by ship-pers is a request by retailers for their suppliers to con-tribute to the cost of capital improvements, such as theconstruction of distribution centers or refrigerated dis-play equipment. Forty percent of the firms in our studyreported having received this type of request, althoughthe compliance rate was the lowest of the fees consid-ered, likely because 100 percent of the requests wereviewed as harmful. Some firms reported that eventhough they did not agree to comply, deductions werestill made from their invoices for charges of this type.While at least three cases of requests to contribute tothe construction of new distribution centers have beendocumented nationally, they appear to be relativelyisolated occurrences compared with requests for shar-ing the cost of new equipment. However, requests tocontribute to the cost of any type of capital improve-ment are included in these responses.
Fresh produce shippers are particularly concernedabout pay-to-stay fees and slotting fees. Slotting feesare fixed, upfront fees to retailers to guarantee shelfspace for new products. Pay-to-stay fees are similarfees for existing products. Economists distinguishbetween these two types of fees (see box, “Economicsof Slotting and Pay-to-Stay Fees”), but in practice theyare often used interchangeably. We frequently consider
the two fees together and call them slotting fees tosimplify the discussion. Slotting fees first appeared inthe nonproduce section of the grocery store beginningin 1984 (Sullivan, 1997) and have only recentlybecome an issue for produce shippers. The emergenceof slotting fees in fresh-cut produce has led to shipperconcern that they will soon become standard for com-modities as well.
A key finding of this study is that this does not appearto be the case, at least so far. Only two grape, threeorange, three grapefruit, one California tomato, oneFlorida tomato, and three lettuce shippers reported thatslotting fees had been requested for either a new orexisting product. Requests were new within the last 5years, except for one grapefruit firm. Shippers do notalways distinguish between slotting fees and otherfixed, upfront fees. In one case, a buyer required ashipper to pay a fixed, upfront promotional fee inorder to gain their business and the shipper classifiedthis as a slotting fee. One lettuce firm reported payinga slotting fee once, although it is not clear whether thatwas for lettuce or a fresh-cut product, but then decidednot to pay again and lost the account. Several firms didlose accounts by not paying requested slotting fees—one of the orange shippers and all three of the lettucefirms. One grape shipper received a request for a$15,000 slotting fee, but successfully negotiated analternative without losing the account. In the end, noneof the commodity shippers interviewed were actuallypaying slotting fees.
Slotting fees are common for bagged salads and otherfresh-cut branded products. Most lettuce/bagged saladshippers said that shippers initiated slotting fees in themid-1990’s in an effort to win new retail accounts andgain market share (see box, “Emergence of SlottingFees in the Bagged Salad Industry”). A few baggedsalad shippers said that retailers initiated slotting fees.When retailers were asked the same question,responses were mixed. About half said retailers hadinitiated slotting fees, while half said shippers had.Retailers agreed that slotting fees are used to obtain orincrease shelf space. All bagged salad shippersreceived requests from retailers to pay slotting fees.Most paid slotting fees, either in response to retailerrequests or to remain competitive with other shippers.Two firms did not comply; one was able to make analternative arrangement, while the other, for whombagged salads were a minor part of the business, lostthe account.

Economic Research Service/USDA U.S. Fresh Fruit and Vegetable Marketing / AER-795 � 29
Nearly all of the lettuce consumed in the United Statesis produced domestically. The vast majority of domesticproduction is situated in just two States: California andArizona. Harvested area of head, leaf, and romaine let-tuce in California and Arizona averaged 195,988,41,538, and 29,213 acres, respectively, during 1992-99and accounted for over 94 percent of U.S. acreage onaverage (USDA, NASS).
A relatively small number of shippers coordinate thegrowing, processing, and transport of lettuce. Nearly allthe major shippers have headquarters and year-roundsales offices in the Salinas, California, area. Domesticproduction throughout the year is facilitated by precisesequencing of production within and across major pro-ducing areas (Wilson et al., 1997). A typical sequenceof production for iceberg lettuce begins in the SalinasValley from April through October. Huron, California,briefly provides production while the industry shiftsfrom Salinas to the desert areas of Yuma, Arizona,where production continues from November throughMarch. Huron provides another brief production bridgebetween the desert and the Salinas Valley in March andApril. Leaf lettuces may follow a slightly differentsequence of growing regions, which could include theSanta Maria, Coachella, and Imperial valleys in Califor-nia. Regardless of the geographic sequence, grower-shippers need to control the sequence of production toassure that no gaps occur in their year-round supply.Control can be achieved by many methods ranging fromoutright ownership, to handshake agreements, leasing,and contracts with various risk positions. While coordi-nating year-round production, harvesting, processing,and shipping across these domestic regions is a formi-dable task, it likely involves lower transaction costs thancoordinating tomato shipments from Mexico or grapeshipments from Chile.
Most shippers of iceberg, leaf, and romaine lettuce arediversified leafy-green vegetable shippers with largeproduct lines including broccoli, cauliflower, celery, andmany other products. Most of these Salinas-based ship-pers carry wide product lines as a way to offer their cus-tomers one-stop shopping. Some of these same shippersalso focus on specialty items that have thinner markets.Several of the interviewed firms had expanded into theproduction and/or marketing of organic produce.
Many lettuce shippers engage in some degree of pro-cessing. Industry participants refer to processed productsas fresh-cut or value-added items. Adding value mayrequire relatively little processing, as is the case with
leaf lettuces inserted into sleeves. Slightly more process-ing is required for items such as broccoli florets. But thelevel of investment and degree of sophisticated technol-ogy required for producing bagged salads is an order ofmagnitude greater than for other value-added products.Fresh-cut products like bagged salads require substantialcapital investments in plants and machinery, in excess of$20 million for central or regional processing plants. Theplastic films used in manufacturing bags must bedesigned for specific respiration rates of the processedvegetables inside the bag. Investment in research anddevelopment for new films continues constantly. Exact-ing logistics are followed to maintain the cold chain ofthe bagged products, because deviations from the idealtemperature could degrade product quality.
Commodities are undifferentiated products likeunwrapped iceberg lettuce that may or may not bebranded. These products have a price look-up (PLU)code but seldom have a universal product code (UPC)bar code. Value-added items like hearts of romaine aremore likely to be branded, carry a UPC code, and aremore convenient for final consumers than commodities.Fresh-cut items such as bagged salads may even includesalad dressing and croutons. These items are usuallybranded, whether as a private label or that of a particularsalad firm, and all salads are scanned at retail checkout.
Largely because of the barriers to entry in the baggedsalad market, only five firms have effectively vied formajor shares of the national retail market (table A).Competition for regional and national market shares hasbeen intense, resulting in even larger market shares forthe top two firms. From 1994 to 1999, the top two firmsincreased their joint market share from two-thirds tothree-quarters of national mainstream supermarket sales.Some of the remaining three firms among the top fiveapparently shifted from branded products to privatelabel. The number of competitors outside the top 5firms shrank from 58 to 48 over the same period, whiletheir joint market share also shrank from 6 to less than3 percent of total dollar sales.
Lettuce/Bagged Salads
Table A—National market shares of fresh-cut saladsales in mainstream supermarkets
Firms/brands 1994 1999
PercentTop two firms 66.1 75.5Top five firms 91.2 87.6Private-label brands 2.4 9.7All other firms 6.4 2.7
Source: Information Resources, Inc.

30 � U.S. Fresh Fruit and Vegetable Marketing / AER-795 Economic Research Service/USDA
None of the bagged salad shippers would reveal theexact size of the slotting fees requested or paid bytheir firm, but several would talk about general use ofslotting fees in the sector. For instance, shippersreported that slotting fees generally ranged from$10,000-$20,000 for small retail accounts to $500,000for a division of a multiregional chain, and up to $2million to acquire the entire business of a large multi-regional chain.
Shippers typically negotiate annual contracts with buy-ers for fresh-cut products. The contract often containsa package of fees and services including slotting fees,volume incentives, and promotional fees. A contract isdesigned to guarantee a certain percentage of profit tothe shipper regardless of the particular provisions, andsome shippers argue that the distinctions between dif-ferent fees and services have blurred. A few firms offervarious contract proposals to their clients and allow
each buyer to choose the preferred arrangement.Bagged salad shippers reported that the share of allfees ranged from 1 to 8 percent of sales.
Bagged salad firms were not clear what rights theyobtained from paying fees. No firm mentioned slottingfees as a guarantee of a specified number of linear feetin refrigerated displays. A few mentioned using third-party or retailer scanner data to track sales. But it isnot clear what happens when volume does not meetexpectations. In a few cases, when one retail chainacquired another, previous slotting fee agreementswere not honored.
Shippers selling private-label products, which are pro-duced for a particular firm to sell as their house brand,do not pay slotting fees. Some bagged salad shippershave become much larger suppliers of private-labelproduct as their branded market share has declined.
Since slotting and pay-to-stay fees first appeared in thenonproduce section of the grocery store beginning in1984, the economics literature on these fees is new andfocuses on manufactured products and retailers.
Slotting Fees: In the narrowest definition, a slotting feeis a lump sum payment made by a supplier to a retailerfor introducing a new product to the supermarket shelf.The standard set of assumptions used when analyzingslotting fees is that there is a limited supply of shelfspace coupled with new product introductions. There isuncertainty about consumer acceptance of a new prod-uct, making the risk of new product failure unknown.Most researchers assume that manufacturers, as productinnovators, have better information about product qual-ity and consumer acceptance. Manufacturers may trans-mit information about product quality (or consumeracceptance of the new product) to retailers by offeringto pay a slotting fee (Lariviere and Padmanabhan,1997). Alternatively, retailers may request slotting feesfrom manufacturers, under the assumption that manu-facturers of high-quality products (those that consumersare likely to accept) are more likely to pay slotting feesthan are manufacturers of low-quality products (Chu,1992). Some researchers argue that slotting fees mightbe the result of retailer market power, and can reduceconsumer welfare by reducing output, increasing prices,or reducing product innovation (see the surveys byBloom et al., 2000, and Richards and Patterson, 2000).
Others argue that consumers benefit because slottingfees make it possible for new products to enter the mar-ket (Sullivan, 1997). The net benefit of the two (possi-bly) competing effects is difficult to predict, and wouldbe specific to each particular situation. The overall wel-fare effect of slotting fees is largely an empirical ques-tion, which has not yet been addressed by researchers.
Pay-to-Stay Fees: Pay-to-stay fees are fixed paymentsmanufacturers make to retailers for keeping their producton the shelf. Like slotting fees, pay-to-stay fees mayresult from retailer market power. Unlike slotting fees,pay-to-stay fees do not transmit quality information,since consumer acceptance of the product is alreadyknown. There are some alternative explanations for thepay-to-stay fee. First, retailing costs have been increas-ing, and the fee may be a way to allocate these costsbetween the supplier and retailer (Toto, 1990). An effi-cient allocation would spread the costs to the party thatcould most easily bear them; an efficient allocation ismost likely when the parties have equal bargainingpower. If one has a strategic advantage, however, theother might ultimately bear a greater cost (Gundlach,2000). Second, the manufacturer might be paying theretailer to “not carry” a new, substitute product, anotherbrand of a substitute product, or a private label product.Third, the fee might serve to place the product in a primelocation, such as in an eye-level space on the shelf.
Economics of Slotting and Pay-to-Stay Fees

Economic Research Service/USDA U.S. Fresh Fruit and Vegetable Marketing / AER-795 � 31
Slotting fees paid by shippers for their branded fresh-cutproducts may have a negative indirect effect on com-modity shippers. A few bagged salad shippers also carrya broad product line of commodity products. Someshippers claimed that when such a firm negotiates acontract with retailers for its fresh-cut products, it mightalso negotiate terms favoring its commodity products.Thus, some commodity-only shippers could risk losingbusiness. One firm redirected its marketing from retaildue to retailers’ tendency to purchase from suppliersthat offer both commodities and fresh-cut products.
Retailers Report on Their Requests for Fees
Eight out of ten retailers agreed that the level of finan-cial support provided by suppliers has increased.Retailers were asked about how fees vary across sup-pliers; they reported that fees are highest for their pri-
mary suppliers for each type of product, higher forfresh-cut and branded products, and lower for smallershippers who have limited marketing budgets. As withshippers, retailers reported that the most commontypes of fees received from suppliers are volume dis-counts, advertising allowances, and other rebates (fig.3). Eighty-eight percent of retailers said they receivevolume discounts, while 82 percent received advertis-ing allowances and other rebates.
Slightly more than half of the respondents used adver-tising/promotional allowances more often in 1999 thanthey did 5 years earlier. With the increased ability tomeasure sales by item, retailers can better weigh thecosts and benefits of having an advertised sale on aproduct, balancing the lower price and the cost of thepromotion with expected incremental sales and theallowance received from shippers. Seventy-one percentof retailers received fees for cooperative advertise-
The relationship between shippers and retailers haschanged, but only part of this change is due to retailconsolidation. Looking at the bagged salad industry andthe emergence of slotting fees illustrates the complexinteractions between several economic forces. In theearly 1990’s, three separate trends converged to producethe new bagged salad industry: the continuing interestof consumers for more convenient product forms, theevolution of new breathable films that preserve fresh-cutproduce, and shippers’ desire to add value to and differ-entiate their products. Unlike bulk fresh produce com-modities such as lettuce or tomatoes, bagged salads areproduced and marketed much like other manufacturedgrocery products, available every week of the year andrequiring dedicated year-round shelf space.
Bagged salads achieved a rapid sales growth in the earlyand mid 1990’s and new firms entered the industry. In1994 and 1995, the growth in sales increased 49 and 32percent over the previous year. Sales continued to growin the late 1990’s, although the rate of growth slowed tobetween 5 and 12 percent, and competition among ship-pers intensified. Slotting fees evolved in the mid-1990’swithin this highly competitive environment as part of amarket share battle between competitors eager to pro-tect their investment in costly salad processing plants.
Retailers typically sell two or three brands of baggedsalads, with one being a private-label product. Manyshippers want to capture the business of retailers. In
addition to gaining a retailer’s business, shippers alsowant to place specific products in stores. According toIRI data for mainstream supermarkets, the number oflettuce-based bagged salad items increased from 202 in1993 to 464 in 1999. As the new industry launchedmany new bagged salad products, retailers were alsocoping with a large increase in products in the rest ofthe produce department.
Retailers have used slotting fees in the remainder of thegrocery store since about 1984, even before the recentincrease in retail consolidation. As the bagged saladindustry developed characteristics of manufactured foodproducts, it would not have been surprising for retailersto request slotting fees for bagged salads. However, mostshippers reported that it was bagged salad shippers whofirst offered slotting fees as a means to garner marketshare from their competitors. The number of baggedsalad shippers (selling to mainstream supermarkets) hasdeclined from a high of 63 in 1995 to 54 in 1999. Thepercent of sales in private-label bagged salads, where noslotting fees are used, has increased from 2 percent in1993 to 10 percent in 1999. Now fees are both offeredby shippers and requested by retailers. Since retailersalready asked for slotting fees for other products beforethe recent retail consolidation, these fees in bagged sal-ads may not necessarily be a function of market poweralone, but rather a combination of product characteris-tics, interfirm rivalry in a capital-intensive sector, and therelative negotiating strength between buyer and seller.
Emergence of Slotting Fees in the Bagged Salad Industry

32 � U.S. Fresh Fruit and Vegetable Marketing / AER-795 Economic Research Service/USDA
ments and 53 percent received free-product discounts.Fewer retailers (29 percent) reported that suppliersbought back unsold product. Over 40 percent of retail-ers said they receive fees from suppliers for capitalimprovements such as the purchase of refrigeratedequipment or construction of a new warehouse.
As noted above, slotting fees and pay-to-stay fees areless common in the produce department than forbranded grocery products in other departments. Sevenof the 17 retailers/wholesalers interviewed (41 percent)said they received fixed upfront fees for new products,and another 18 percent said they received a per-unitfee for new products. The firms requesting fees were amix of national and regional retailers and wholesalers.Some of the remaining 10 firms may have receivedslotting fees, but chose not to respond to this question.
Retailers reported that slotting fees were found prima-rily in branded categories such as bagged salads, babycarrots, and dried fruits and nuts. Retailers agreed thatcompetition among bagged salad suppliers for marketshare is intense and that upfront fees are a way forshippers to obtain or increase shelf space. Hence,retailers concur that despite the current high profile ofslotting fees in the produce trade press, they are notprevalent beyond the fresh-cut category, where theymay be supplier as well as retailer induced.
Retailers use different business models. Not allretailers request slotting fees or accept them, evenfor branded, fresh-cut products. Some retailers focus
on the efficiencies of handling relatively high-vol-ume products, negotiating long-term agreementswith suppliers, and then requiring these preferredsuppliers to provide services such as automaticinventory replenishment, use of returnable contain-ers, or other special packaging.
Services
Services requested by retailers, or offered by produceshippers, are on the rise. Retailers requested 4.1 typesof services on average, slightly more than for feerequests (table 14). However, new service requestsmake up 77 percent of total requests, compared with48 percent for fees. Several of these services, such aselectronic data interchange (EDI) and category man-agement, derive from relatively new information tech-nology that provides both shipper and retailer withmore timely market intelligence and means for infor-mation exchange, which could reduce costs andimprove profits. However, some of these new tech-nologies may impose substantive fixed costs, posing acompetitive disadvantage to smaller shippers. Othernew services such as third-party certification may bepaid for on a per-unit basis, but also increase fixedcosts by causing producers to change some of theiroperating systems in order to meet requirements.
Grapefruit shippers had the highest number of servicesrequested or offered, with an average of 6.4 (table 14).Florida tomato shippers reported an average of only 2.7services per firm, the lowest of the products consid-
Other fees
Per-unit fees for new products
Buy-back unsold products
Capital improvements
Fixed upfront fees for new products
Free-product discounts
Cooperative advertisements
Other rebates
Promotional allowances
Volume discounts
0 20 40 60 80 100
Share of retailers receiving various types of fees in 1999Figure 3
Source: Economic Research Service, Produce Marketing Study interviews, 1999-2000, USDA.
Percent of firms
88
82
82
71
53
41
41
29
18
6

Economic Research Service/USDA U.S. Fresh Fruit and Vegetable Marketing / AER-795 � 33
ered. Across all products, 79 percent of the servicerequests were complied with, a much higher compli-ance rate than for fee requests. California and Floridatomato shippers were again the least likely to respondto the requests, lettuce/bagged salad shippers mostlikely. The high compliance rate for lettuce/baggedsalad shippers has two components. First, some of thebagged salad firms offered services, such as EDI andcategory management, to their customers. Second, let-tuce firms generally complied with the servicesrequested by retailers, citing product quality and timely
services as a way to trump competition and to cementongoing relationships. Lettuce/bagged salad shippersreported no accounts lost due to not complying oroffering a service, and orange shippers were mostlikely to lose business.
The most frequently requested service was third-partyfood safety certification (see box, “Services”), with 80percent of the firms having received this request (table15). In 1999 and early 2000 when the interviews wereconducted, third-party food safety certification was just
Table 14—Average number of service types reported per shipper and disposition of requests, by product type, in 19991
California Florida Lettuce/ AllItem Grapes Oranges Grapefruit tomatoes tomatoes bagged salads products
Number per firm
Average number of service types requested by or offered to retailers and mass merchandisers2 3.0 4.6 6.4 3.1 2.7 4.9 4.1
Percent of requests3
Average share of new service types amongrequested service types4 96 93 59 94 38 75 77
Average share of requested service typescomplied with 82 83 74 65 64 90 79
Average share of requests resulting in lost accounts when service not complied with 20 43 15 18 33 0 21
1 Results are based on a limited number of observations and must be interpreted with caution. The eight types of services considered are listed in the box, "Services."2 Shippers were asked if they provided a type of service to any of their retail accounts. Thus, these results indicate the number of service types provided to at least one account.3 Includes services offered by shippers.4 New since 1994.Source: Economic Research Service, Produce Marketing Study interviews, 1999-2000, USDA.
Table 15—Services requested by retailers and mass merchandisers, by type, 19991
Average share of firms Average share of requestsService type Providing With a Complied Lost account for
service2 service request3 New4 with5 noncompliance5
Percent
Third-party food safety certification 47 80 72 71 0Returnable containers/pallets 47 69 81 83 0Special packs 45 65 80 83 33Electronic data interchange or retail link program 34 56 90 73 25Private labels 33 48 65 81 60Automatic inventory replenishment program 25 35 90 84 33Special merchandising displays 19 30 50 80 33Category management services 19 28 80 80 01 Results are based on a limited number of observations and must be interpreted with caution.2 Shippers were asked if they provided a type of service to any of their retail accounts. Thus, these results indicate the share of firms providing services to at least one retail account3 Includes services requested, whether complied with or not, and services offered by shippers to at least one account.4 New since 1994.5 For any fee type requested, a shipper may comply with a request, not comply and suffer no adverse consequences, not comply and lose an account, or nego-tiate an alternative,. A shipper may have more than one account and more than one response for the same type of fee, so the four alternatives (even though weonly report two) do not necessarily sum to 100 percent.
Source: Economic Research Service, Produce Marketing Study interviews, 1999-2000, USDA.
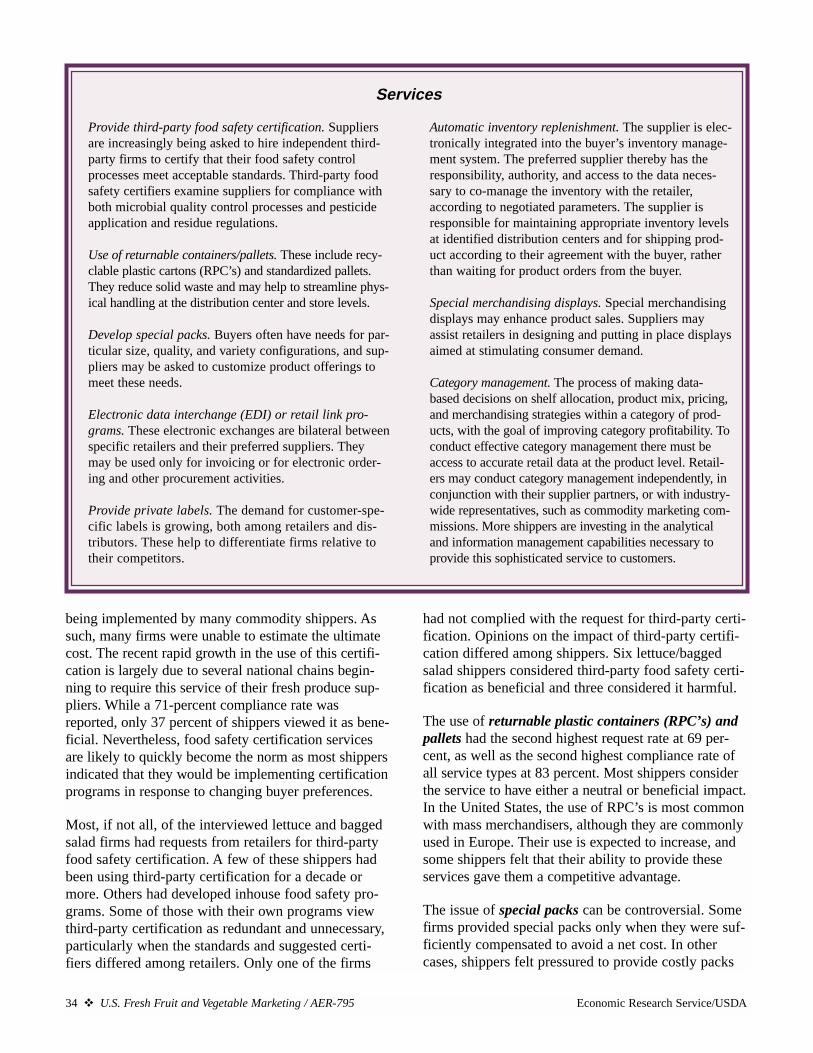
34 � U.S. Fresh Fruit and Vegetable Marketing / AER-795 Economic Research Service/USDA
being implemented by many commodity shippers. Assuch, many firms were unable to estimate the ultimatecost. The recent rapid growth in the use of this certifi-cation is largely due to several national chains begin-ning to require this service of their fresh produce sup-pliers. While a 71-percent compliance rate wasreported, only 37 percent of shippers viewed it as bene-ficial. Nevertheless, food safety certification servicesare likely to quickly become the norm as most shippersindicated that they would be implementing certificationprograms in response to changing buyer preferences.
Most, if not all, of the interviewed lettuce and baggedsalad firms had requests from retailers for third-partyfood safety certification. A few of these shippers hadbeen using third-party certification for a decade ormore. Others had developed inhouse food safety pro-grams. Some of those with their own programs viewthird-party certification as redundant and unnecessary,particularly when the standards and suggested certi-fiers differed among retailers. Only one of the firms
had not complied with the request for third-party certi-fication. Opinions on the impact of third-party certifi-cation differed among shippers. Six lettuce/baggedsalad shippers considered third-party food safety certi-fication as beneficial and three considered it harmful.
The use of returnable plastic containers (RPC’s) andpallets had the second highest request rate at 69 per-cent, as well as the second highest compliance rate ofall service types at 83 percent. Most shippers considerthe service to have either a neutral or beneficial impact.In the United States, the use of RPC’s is most commonwith mass merchandisers, although they are commonlyused in Europe. Their use is expected to increase, andsome shippers felt that their ability to provide theseservices gave them a competitive advantage.
The issue of special packs can be controversial. Somefirms provided special packs only when they were suf-ficiently compensated to avoid a net cost. In othercases, shippers felt pressured to provide costly packs
Provide third-party food safety certification. Suppliersare increasingly being asked to hire independent third-party firms to certify that their food safety controlprocesses meet acceptable standards. Third-party foodsafety certifiers examine suppliers for compliance withboth microbial quality control processes and pesticideapplication and residue regulations.
Use of returnable containers/pallets. These include recy-clable plastic cartons (RPC’s) and standardized pallets.They reduce solid waste and may help to streamline phys-ical handling at the distribution center and store levels.
Develop special packs. Buyers often have needs for par-ticular size, quality, and variety configurations, and sup-pliers may be asked to customize product offerings tomeet these needs.
Electronic data interchange (EDI) or retail link pro-grams. These electronic exchanges are bilateral betweenspecific retailers and their preferred suppliers. Theymay be used only for invoicing or for electronic order-ing and other procurement activities.
Provide private labels. The demand for customer-spe-cific labels is growing, both among retailers and dis-tributors. These help to differentiate firms relative totheir competitors.
Automatic inventory replenishment. The supplier is elec-tronically integrated into the buyer’s inventory manage-ment system. The preferred supplier thereby has theresponsibility, authority, and access to the data neces-sary to co-manage the inventory with the retailer,according to negotiated parameters. The supplier isresponsible for maintaining appropriate inventory levelsat identified distribution centers and for shipping prod-uct according to their agreement with the buyer, ratherthan waiting for product orders from the buyer.
Special merchandising displays. Special merchandisingdisplays may enhance product sales. Suppliers mayassist retailers in designing and putting in place displaysaimed at stimulating consumer demand.
Category management. The process of making data-based decisions on shelf allocation, product mix, pricing,and merchandising strategies within a category of prod-ucts, with the goal of improving category profitability. Toconduct effective category management there must beaccess to accurate retail data at the product level. Retail-ers may conduct category management independently, inconjunction with their supplier partners, or with industry-wide representatives, such as commodity marketing com-missions. More shippers are investing in the analyticaland information management capabilities necessary toprovide this sophisticated service to customers.
Services

Economic Research Service/USDA U.S. Fresh Fruit and Vegetable Marketing / AER-795 � 35
for which they felt they would be insufficientlyrewarded, with a third losing accounts over theirunwillingness to provide the service (table 15). Onenational chain recently adopted a standardized stack-able box for most fresh produce to facilitate internalmaterials handling and reduce costs. This could havesignificant cost implications, especially for shipperspacking in sheds (as opposed to packing in fields)because it can entail changing bandwidths and othercostly adaptations. For large shippers, these costscould be hundreds of thousands of dollars. Further-more, the standard carton proposed might not suit allcrops from a postharvest handling perspective. Issuesof this type are likely to become more contentious.
Electronic data interchange (EDI), or retail link pro-gram, is another service where the experience of com-modity and fresh-cut firms differed. While EDI sys-tems had been requested of 56 percent of the firms,most reported that even though they were set up to useit based on the requests of specific buyers, the buyersnever successfully implemented the system. EDI ismore important for lettuce/bagged salad firms; 92 per-cent of the firms had offered or had been asked to useEDI and 83 percent of the requests had been compliedwith. All bagged salad-only firms used EDI, with sev-eral indicating they offered EDI to their customers.The more commodity-oriented shippers waited for cus-tomers to ask for the service. Bagged salad shippersgenerally viewed the impact of EDI as either neutral orbeneficial. For other commodities, a significant shareof firms is EDI-ready if buyers do decide to incorpo-rate it into their procurement practices.
The use of private labels appears to be on the rise,requested of 48 percent of shippers, with 65 percent ofthe requests reported to be new. Some firms mightonly supply an account or two with private labelswhile others relied more heavily on this marketingstrategy. While 81 percent of the requests were com-plied with, 60 percent of the requests not compliedwith resulted in at least one lost account.
In general, shippers felt that the growing buyer interestin private labels was beneficial or had a neutral impacton their business, with only 25 percent describing thetrend as harmful. Again, the impact varied across com-modities, with 100 percent of grape shippers consider-ing them to be beneficial and orange shippers moreambivalent. This could be due to the practice of someretail/mass merchandiser buyers designating buyingbrokers to handle their orange sourcing. In these
instances, the buying broker may sell its private labelto the retailer and charge the shipper a per-box fee forthe use of the private label. Shippers maintain that theyare only selling through the buying broker because thebuyer requires it and that they would otherwise selldirectly to the retailer and avoid the private label“licensing” fee. As European chains increase theirpresence in the U.S. market and more buyers imple-ment supply chain management, the use of privatelabels is likely to increase. The direct use of privatelabels by chains may not involve licensing fees.
More fresh-cut products are also showing up on storeshelves with private labels. According to IRI data,supermarket sales of private-label bagged salads haverisen from 2.4 percent of national bagged salad sales in1994 to almost 10 percent in 1999. A couple of thebagged salad firms interviewed indicated a consciousshift from their own branded product to private labelprocessing and sales—for both retail and foodservice.In metropolitan areas where incumbent bagged saladfirms already enjoy relatively large retail market shares,a firm with a smaller market share may find that privatelabels are a lower cost alternative to introducing andpromoting their own branded products. In addition,retail chains are usually more willing to devote somerefrigerated shelf space to their own private label. Oneshipper expects that retail consolidation will contributeto further growth in private-label use as chains sell theirprivate-label products in their acquired divisions.
Automatic inventory replenishment programs are rela-tively new; 90 percent of requests were new in the last5 years, with only 35 percent of the firms havingreceived requests to provide this service (table 15).The requests for automatic inventory replenishmentreflect its use among mass merchandisers rather thanconventional retail buyers. Shippers complied with 84percent of requests, the highest compliance rate of anyservice type.
An automatic inventory replenishment program grantsshippers direct access to current sales information.Usually, shippers can only monitor sales of their prod-uct after the fact with scanner data compiled and soldby national purveyors of data such as Willard Bishop’sFresh Facts and IRI. Commodities have price look-up(PLU) codes, and most fresh-cut products and allbagged salads have universal product codes (UPC) thatare scanned at retail. Three out of seven lettuce ship-pers and all bagged salad firms were requested to pro-vide automatic inventory replenishment and all com-
36 � U.S. Fresh Fruit and Vegetable Marketing / AER-795 Economic Research Service/USDA
The California orange industry is oriented toward thefresh market, in contrast to Florida, which producesalmost entirely for the processed market. California pro-duction totaled 2,513,000 short tons for the 1999/2000season (one year after the 1998/99 freeze season) com-pared to 2,677,000 in 1989/90, the season prior toanother major freeze. The juice market provides a sec-ondary market for the industry when there are produc-tion problems or low fresh-market prices. In 1997/98,80 percent of production went to the fresh market. Dur-ing the 1998/99-freeze season, only 57 percent of pro-duction went to the fresh market.
The California orange industry ships year round. Navelsrepresent approximately two-thirds of California’s orangevolume and were traditionally shipped mainly fromNovember to May, with Valencia oranges produced in thelate spring through fall. However, grower efforts in the1990’s to target early and late markets mean that thenavel season is increasingly encroaching on both ends ofthe Valencia season. For our sample, the share of naveland Valencia oranges remained virtually unchanged overthe period studied with about 74 percent and 26 percentrespectively. Many California orange shippers are diversi-fied only within the citrus category. Still, the interviewedfirms included some well-diversified shippers for whichoranges were not the main product.
The California orange industry is affected by a marketstructure different from most other commodities, due tothe Sunkist cooperative, which has held a 50-55 percentmarket share in recent years. Several other shippers par-ticipate in an information-sharing cooperative called theCentral California Orange Growers Cooperative(CCOGC), currently consisting of eight shippers whoeach market independently. Sales of this group are equiv-alent to about 25-30 percent of California orange volume.CCOGC does not handle or market oranges, although itdoes establish a floor price for the volume sold by itsshipper members. No sanctions are imposed, however, onits shipper members for sales under the minimum price.In addition to these two cooperatives, there are two largebranded players and numerous other independents, with39 shippers of all types in the 1999/2000 season.
Structural change at the retail level does not alwaysimply consolidation at the shipper level. The orangeindustry is much less concentrated than it was in the1960’s when Sunkist accounted for almost 90 percent ofthe volume of California oranges marketed. Independentshippers have gradually made inroads into the Califor-nia orange industry at the expense of the market leader,
with 39 shippers today up from 32 in 1990. Growth ofindependents may have accelerated since the demise ofthe orange marketing order in 1994.
While the number of orange handlers has increased, thenumber of California citrus growers declined from7,452 in 1977 to 6,768 in 1987 and 4,842 in 1997, thelast year in which a referendum was held for the CitrusResearch Advisory Board. Some industry experts feelthat there may be some double counting of growers inthese numbers due to registrations by individual parcelsrather than total grower operations, with the total possi-bly closer to 2,500.
Recent problems in the export market for Californiaoranges, due both to the economic problems in Asia andgrowth in competing exporting regions, plus long-termstagnation in domestic per capita fresh orange consump-tion (14.7 lbs. per capita in 1976 compared with 14.9 in1998 and 13.5 lbs. forecast for 1999/2000), have com-bined to create excess supply. Growers cite competitionfrom more fruits being available year-round as one ofthe factors contributing to declining domestic per capitaconsumption. In addition, the need to peel and sectionoranges may make some consumers view them as lessconvenient fruit choices.
U.S. consumers have a preference for seedless navelsover Valencias, yet in the past Valencias were the onlyoption offered by the California industry during thesummer, helping to ensure a market. As of the 2000summer season, many retailers were choosing to sourcesouthern-hemisphere navels instead of switching fromCalifornia navels to Valencias. This makes Valenciaseven more dependent on export markets than normal.The evident preference of many retailers for summer-season seedless varieties, now that this alternative isavailable, has caught the California industry by surprise.Navel oranges are also facing competition from winterimports of Spanish clementines and oranges. If importscontinue at these levels in the future, it is likely thatmore orange shippers will market imports themselves,as in the case of grapes.
More than half of the interviewed orange shippersreported lower profits in the last 5 years. However, noneof these firms reported strategic alliances, joint ven-tures, or mergers during the same period. Since the timeof the interviews a key merger occurred and the trendtowards consolidation now appears to be underway andis expected to continue as supply and demand adjust.
California Oranges

Economic Research Service/USDA U.S. Fresh Fruit and Vegetable Marketing / AER-795 � 37
plied. Several of those firms did mention additionalstaff and equipment costs associated with inventoryreplenishment. On the other hand, firms generallyviewed this service as beneficial since it enabled themto more fully participate with the buyer in managingthe supply and marketing of their products.
Special merchandising displays are sometimesrequested for promotions to enhance product sales.Only 30 percent of shippers had received requests forthis service but compliance was high at 80 percent asfirms tended to feel that it might stimulate sales. Still,this type of service is much more routinely providedby other types of food industry suppliers, comparedwith produce shippers. As more produce shippersbecome year-round, larger suppliers, the economicreturn on providing this type of service will increaseand both retailers and shippers may be more interestedin collaborating in this area.
About 28 percent of shippers received requests forassistance with category management, and 80 percentof the requests were complied with (table 15). No onereported losing business if they did not comply. This isa relatively new service, with 80 percent of therequests reported as new in the last 5 years. Commod-ity produce shippers have generally not been (directly)providing many of these marketing support services,commonly provided to customers by most food indus-try suppliers, since industry-level generic marketingand promotion programs support many fresh producecommodities. Until recently, category management in
fresh produce was hindered by the lack of standardizedPLU codes. Category management services are nowbeing offered more often, but still mainly at thegeneric rather than the shipper level, with the excep-tion of branded products such as bagged salads. Incontrast to the commodity shippers, not only did mostof the bagged salad shippers offer category manage-ment to their customers, some firms specifically men-tioned category management as a way to provide top-quality service to their customers.
Retailers Report on Their Requests for Services
Nine out of ten retailers requested more services fromtheir suppliers in 1999 than they did 5 years before.The primary benefit of these services, as viewed byretailers, was better distribution efficiencies andincreased overall profits (by reducing the cost ofgoods sold).
Retailers requested, on average, 5.5 different types ofservices from suppliers. Almost three out of fourretailers are asking suppliers for support in three areas:provision of private-label produce, category manage-ment, and EDI (fig. 4). Over half the respondents arerequesting special transportation arrangements (suchas discounts on transportation for large volume sales),new types of packaging, and third-party food safetycertification. Shipper and retailer responses regardingthe prevalence of different types of services is lessconsistent than for fees.
Automatic inventory replenishment
Special merchandising displays
Third-party food safety certification
Special packs and returnable plastic containers
Special transportation arrangements
Electronic data interchange
Category management
Private labels
0 10 20 30 40 50 60 70 80
Share of retailers receiving various types of services in 1999Figure 4
Source: Economic Research Service, Produce Marketing Study interviews, 1999-2000, USDA.
Percent of firms
71
71
71
59
59
53
41
24

38 � U.S. Fresh Fruit and Vegetable Marketing / AER-795 Economic Research Service/USDA
Impacts of Marketing Changes on the Produce
Shipping Industry
Cost of Fees and Services
Information was collected on the cost of providingeach of the fees and services discussed above to allaccounts. While not all firms kept complete records onthe cost of providing all fees and services, theyattempted to estimate costs where complete data wereunavailable. Estimates are likely to underestimate costsas shippers often noted that their accounting systemswere better designed to fully account for costs back tothe grower rather than forward in the marketing sys-tem. The average sales of the interviewed firms andthe average cost of their fees and services are providedin table 16, by key commodity. Average firm-levelsales varied from $18.2 million for the grapefruit sam-ple to $28.4 million for grapes. The average cost offees per shipper ranged from $66,500 for Californiatomatoes to $209,000 for grapefruit shippers. The pat-tern was different for services with grapefruit shipperspaying the least at $12,300 per shipper while orangeshippers paid the most, averaging $64,000. In all casesservice costs were less than the cost of fees.
In order to provide a standard measure for comparingcosts across the commodity samples, independent ofthe samples’ sales volumes, the information is alsopresented on the basis of average costs per million dol-lars in sales. There is significant variation in the levelof fees and services among the various commodities.For grape, orange, grapefruit, and California tomatoshippers, total fees and services per million dollars insales ranged from $2,600 for California tomatoes to$14,600 for grapefruit (table 16). Grape and orangeshippers were in between, with grape shippers spend-
ing an average of $6,400 per million dollars in sales toprovide fees and services, compared with orange ship-pers spending an average of $11,400. Services per mil-lion dollars of sales were less than fees for all thecommodity samples, averaging from $1,200 per mil-lion dollars in sales for grapes to $4,400 for grapefruit.
Some of the differences between commodities may berelated to costs excluded from these data. For example,grape, grapefruit, and California tomato shippers allhave longstanding industrywide generic-promotionprograms supported by assessments to growers and/orshippers. Since the marketing support services andpromotional fees paid for by these assessments are notincluded, the costs shown in table 16 underestimateactual costs for these commodities. In contrast, Cali-fornia oranges have no generic promotion program,which may be one factor explaining the higher inci-dence of fee and service costs they experience relativeto grapes and tomatoes.
Another measure of the incidence of fees was obtainedby asking firms to provide actual sales volume andfees paid for each of their top five retail and mass mer-chandise accounts. For the top five retail and massmerchandise accounts, we asked whether the buyerwas a major retailer (defined as the top 10 corporatebuying chains), other retailer, or mass merchandiser.Fees varied by type of buyer—higher for major retail-ers than for the other retailers, with fees to mass mer-chandisers falling in between.
This measure yielded results consistent with those pre-sented in table 16, with grapefruit shippers paying themost, followed in descending order by oranges,grapes, and tomatoes. Indeed, California and Floridatomato shippers have very few retail and mass mer-chandiser sales and no fees at all in their top five
Table 16—Average sales, fees, and cost of services per shipper, by crop, 19991
Average Average Average Average feeAverage fee and fees per service cost and service
Product (number of Average Average service service $ million per $ million cost per shippers reporting) sales fees cost cost in sales in sales $ million in sales
Dollars
Grapes (9) 28,361,837 160,868 53,363 214,231 5,192 1,233 6,425Oranges (9) 26,466,812 207,693 64,036 271,730 8,677 2,685 11,362Grapefruit (5) 18,245,368 209,000 12,333 221,333 10,128 4,435 14,563California tomatoes (10)2 24,502,254 66,534 38,450 104,984 1,309 1,305 2,6141 Results are based on a limited number of observations and must be interpreted with caution.2 Includes California tomato repackers.
Source: Economic Research Service, Produce Marketing Study interviews, 1999-2000, USDA.

Economic Research Service/USDA U.S. Fresh Fruit and Vegetable Marketing / AER-795 � 39
accounts (table 17). Among those shippers paying feesto their top five accounts, grape shippers have the low-est share of fees per sales on an account basis, 0.66percent. Orange and grapefruit fees as a share of salesaveraged 1.13 percent and 1.77 percent, respectively.Bagged salad firms reported that fees as a share of allsales (not just the top five retail and mass merchandiseaccounts) ranged from 1 percent of shipper sales up to8 percent.
The differing cost of fees and services across com-modities may mean that some have been affected muchmore than others by the new operating environmentprevalent in today’s fresh produce industry. However,several factors affect the shipper/buyer relationship,including market structure at the shipper level, inter-firm rivalry, and most certainly supply and demandconditions. While these effects cannot be separated atthis point, identifying the existence of differencesbetween commodities is important.
The lack of fees paid to the top five accounts for Cali-fornia tomatoes is likely due to their reliance on salesthrough repacker/wholesaler channels. In the case ofCalifornia grapes, the fragmented shipper structure mayprovide some protection from retailer requests for fees.Given an implicit need for retailers to spread purchasesamong more grape suppliers than for commodities withmore concentrated supply structures, retailers may beless able or inclined to charge certain fees such as vol-ume incentives. The prevalence of relatively large firmsand more concentrated industry structures in the case ofgrapefruit and oranges may mean that retailers are better
able to approach firms for fees. Fees paid by some firmsthen affect fees requested of competitors.
While the level of fees as a share of sales might appearlow, it is important to remember that in the produceindustry market prices are often at or below total pro-duction and marketing costs, covering only variablecosts. Consequently, these fees could be sufficient toeliminate profits or increase losses in periods wheretotal production and marketing costs are not being met.As shown in table 16, in absolute terms the averagecost of fees and services per shipper varied from$105,000 for California tomatoes to $271,700 fororanges. Given low profits or even losses in some sea-sons, fee and service costs of this magnitude may serveto accelerate supply adjustments and may reduce pro-duction. If production declines, retailers could riskinsufficient supply when adverse weather shocks occur.
Fees and services that raise the costs of shippers with-out providing some benefit of equal value are a con-cern to the produce shipping industry. Even in the casewhere there is an equal trade, the types of fees andservices requested can have structural impacts on theshipping industry. Per-unit fees or services, such asper-carton volume incentives, imply no differingimpact by size of shipper if the fee is the same for allshippers. While fees are more costly than services,most fees are per-unit costs, ranging from 68 to 99percent of the value of all fees paid (table 18). Feesare, therefore, generally neutral in terms of structuralrepercussions. However, as noted above, their impacton profits may be quite significant, given the low mar-gins prevalent at the shipper level of the fresh producedistribution system.
The costs of providing most services are fixed. Fixedfees or services, if they are uniformly applied, couldhave a more negative effect on smaller shippers thatcannot spread the costs over as many units as a largershipper. However, service requests are expected tocontinue to increase and change the costs of doingbusiness, as many appear to be the result of technol-ogy. For example, materials handling technology at thewarehouse level may cause retailers to request specialpackaging, such as the use of a standardized stackablecarton for all commodities to facilitate uniform palleti-zation of store loads. Information technology is allow-ing retailers to better target specific consumer seg-ments, sometimes leading to special merchandising,category management, or packaging requests. While itis likely that the costs of setting up some of these serv-
Table 17—Fees as a percentage of sales, based on shippers' topfive retail and mass merchandiser accounts, 19991
Total Total Share of feesProduct fees2 sales3 per account
Dollars Percent
Grapes 367,305 55,556,924 0.66Oranges 494,393 43,834,539 1.13Grapefruit 438,699 24,820,538 1.77California tomatoes4 0 5,379,034 0Florida tomatoes4 0 977,480 01 Results are based on a limited number of observations and must be interpreted with caution.2 Sum of fees paid to the top five retail accounts by all shippers providing data.3 Sum of sales made to the top five retail accounts by all shippers providing data.4 Although tomato shippers paid no fees to their top five retail and massmerchandiser accounts, they may pay fees to other accounts.
Source: Economic Research Service, Produce Marketing Study interviews,1999-2000, USDA.

40 � U.S. Fresh Fruit and Vegetable Marketing / AER-795 Economic Research Service/USDA
ices are equal regardless of firm size, the cost per unitof sales is obviously greater for smaller firms. Therelationship between shipper size and the ratio of feesand services paid per unit of sales is also of interestand must be further investigated, as this sample sizewas insufficient to yield reliable results on differencesby firm size.
Trends in Shipper Consolidation, Shipping Seasons, and Product Line
As retailers increase their size and volume require-ments, shippers will probably face more pressure toincrease their scale of operation. New technologiessuch as capital-intensive fresh-cut processing opera-tions may also motivate consolidation. Greater volumemay be achieved by increasing a firm’s own capacity,via consolidation, or joint marketing arrangements andstrategic alliances (such as copacking) that fall short ofactual consolidation.
Not all produce shippers, however, experience thesame level of consolidation pressure. Data on the totalnumber of shippers by commodity are sparse and oftenclosely held. Although the march toward consolidationis often thought of as inevitable and ongoing, the levelof consolidation varies across crops, and for a fewcrops the number of shippers has actually increased insome periods. While Sunkist is still the largest orangeshipper in California, its share of volume hasdecreased and the total number of orange shippers hasincreased slightly during the 1990’s. Interviewedorange shippers reported no consolidation since 1994.
However, merger/acquisition activities since the early2000 interviews indicate that this industry has alsoembarked on consolidation.
The number of Florida tomato shippers grew from 59in 1997/98 to 68 in the following season. In contrast,California tomato shippers declined from 31 in 1996 to23 in 2000, and grape shippers also declined in the1990’s. Grape and California tomato shippers bothreported consolidation, but only about half of thechanges were in response to retail consolidation. Thenumber of bagged salad shippers selling to mainstreamsupermarkets declined from 64 in 1994 to 54 in 1999.Information was unavailable on bagged salad shippersfocused on other markets such as foodservice.
Shippers were asked whether retailers put pressure onthem to consolidate. About half saw no change andhalf saw an increase in pressure due to retail consoli-dation. Most grape, grapefruit, California tomato, let-tuce, and bagged salad shippers reported increasedpressure; most orange and Florida tomato shippers didnot. Overall, of those facing additional pressure toconsolidate, opinion was split on the impact of thistrend; two-thirds thought it was beneficial or neutral,one-third harmful. Increasing shipper consolidationmay provide firms with countervailing power in theirbargaining with retailers.
The trend toward longer shipping seasons continues.Over half the shippers reported that retailers wereasking for longer seasons and almost all viewed thistrend as beneficial. Most orange shippers felt therehad been no change, but their product has long beenavailable year-round. Interviewed shippers were splitevenly on whether retailer demands for a broaderproduct line had increased or stayed the same. Themajority of grape, grapefruit, Florida tomato, and let-tuce/bagged salad shippers felt demands hadincreased. Most orange shippers reported no changein product line and California tomato shippers wereevenly split. Most shippers who reported increaseddemands thought the change was definitely due toretail consolidation. While risks increase when ship-ping seasons are extended, the potential for spreadingcosts over greater volume and maintaining more sta-ble relationships with buyers also improves.
Table 18—Cost of fees and services, per unit and fixed, 1999 1,2
Per-unit Fixed Per-unit Fixed Product share of share of share of share of
fees fees services servicesPercent
Grapes 99 1 40 60Oranges 68 32 63 37Grapefruit 74 26 16 84California tomatoes 72 28 24 761 Complete data were not available for Florida tomatoes, lettuce, andbagged salads.2 Results are based on a limited number of observations and must be inter-preted with caution.
Source: Economic Research Service, Produce Marketing Study interviews,1999-2000, USDA.
Economic Research Service/USDA U.S. Fresh Fruit and Vegetable Marketing / AER-795 � 41
Conclusions
Trade practices used in shipper/retailer transactions is atopic that has recently come to the attention of policy-makers. This report provides a description and analysisof the trade practices currently used in shipper/retailertransactions and the economic forces behind recentchanges in the produce industry. The findings in thisstudy are based on a limited number of shipper, retailer,and wholesaler interviews and publicly available infor-mation; as a result, they must be interpreted as indica-tive of industry trends rather than authoritative results.This research is a first step; while we answer manyquestions about trade practices, many remain and willundoubtedly be the focus of future research.
The study examined the evolution of marketing chan-nels used by shippers over the 1994-99 period. Con-ventional retail buyers remain the primary marketingchannel for domestic sales of all the products exam-ined except for California and Florida tomatoes (toma-toes are typically sold to repackers servicing final buy-ers). However, the share of total sales to conventionalretail buyers did not increase for any product in oursample, despite the emergence of larger retail buyers.For grapes, oranges, and California tomatoes, theabsolute dollar volume of sales to this channel didincrease, but this was due to growth in the total salesvolumes for the sampled firms rather than an increasein the retail share of total sales.
The stable or declining share of sales to conventionalretailers was likely due in part to an increase in sales tomass merchandisers, a new segment that grew rapidlyduring the 1990's. If mass merchandisers are includedin the retail category, the share to retail increased for allproducts except tomatoes. Hence, for most commodi-ties, even where there was a declining relative share ofsales to retailers, this was more than offset by thegrowth in relative importance of mass merchandisers.
Some of the changes observed in marketing channelsare probably due to retail consolidation. For example,smaller shippers may not be able to match the largebuying requirements of consolidated retailers. How-ever, some of the change may be due to other eco-nomic factors such as growth in foodservice demand.
Given recent retail consolidation, we expected thatshippers would have fewer total buyers and possiblyencounter less competitive markets. However, whenasked about the number of total accounts for all buyer
types in 1999 compared with 1994, about equal num-bers of shippers reported increases as decreases, with afew reporting no change. Factors affecting the numberof total buyers, independent of changes in retail con-solidation, include changes in volume of sales or prod-uct line, acquisition of other shipping firms, andchanges in business focus. In addition, retailersreported that over the same period, their total numberof produce buyers had declined only slightly. Indeed,60 percent of retailers said that when they consoli-dated, the number of buyers remained the same at thefield and division levels, while 18 percent reportedreducing the number of field-level buyers. As the buy-ing structure of the now larger retailers continues toevolve, buying may become more centralized than ithas to date, implying fewer accounts.
When asked specifically about their number of retailaccounts, most shippers perceived a decline due toretail consolidation, and that this had an adverse effecton their business. The impact of consolidation on indi-vidual shippers was highly correlated with their rela-tionship with the merging chains prior to consolidation.If a shipper supplied the acquiring but not the acquiredchain, the shipper might gain by additional sales to thenow larger account. Conversely, if a shipper suppliedthe acquired chain, the account might be lost.
For commodity shippers in 1999, their four largest cus-tomers comprised from 22 to 45 percent of sales to alltypes of buyers. Such dependence may compromiseshippers’ power in negotiating with buyers over pricesand requests for fees and services. For their part, retailbuyers reported more concentrated purchases, withtheir top four suppliers providing from 85 to 97 percentof total purchases depending on the product. As retail-ers source from fewer suppliers, shippers will likelybecome more account-oriented in their marketingstrategies, providing products and services tailored tothe needs of specific large accounts. These trends maybe consistent with greater payment of fees; as the valueof the business generated by individual accounts grows,suppliers may feel increased incentives to comply withfee and service requests to gain or keep the business.
Both shippers and retailers agree that the incidenceand costs of fees and services are increasing. Shippersare particularly alarmed at the rapid escalation inrequests for new types of fees and services in the last 5years. However, volume discounts, the most com-monly requested fee type, are a longstanding tradepractice, though today they are more prevalent and

42 � U.S. Fresh Fruit and Vegetable Marketing / AER-795 Economic Research Service/USDA
costlier than before. When viewed together, the major-ity of the cost of fees and services was attributed tofees, with the provision of services often perceived tobe less onerous than fees. In general, whether or not afee or service was thought to be harmful to doing busi-ness depended on whether the shippers felt theyreceived something in return. For example, when vol-ume discounts led to increased purchases, they wereoften viewed as beneficial.
The most controversial fees are slotting fees. We foundthat shippers paid slotting fees (in this case defined asa fixed upfront fee for a new or existing product) onlyin the fresh-cut side of the produce industry, ratherthan the commodity side. No commodity firms inter-viewed paid slotting fees, although several hadreceived requests and a few lost accounts for not com-plying. Commodity shippers fear that slotting fees willbecome standard practice in their industries now thatthey have been introduced into one section of the pro-duce department. Although lettuce shippers did notpay slotting fees, they have felt the effect. Shipperspaying slotting fees for bagged salads and also sellinglettuce were thought to have an advantage over lettuce-only shippers because buyers were receiving, in effect,slotting fees on a bundle of products. Some baggedsalad firms have shifted to selling private-label productrather than their own brands because slotting fees arenot used in that segment of the industry.
Current concern focuses on the potential for slottingfees to enter the commodity side of the fresh produceindustry. However, all types of fees can affect a firm’sbottom line. Commodity firms did pay fees, and theyare increasing. In 1999, fees of all types averagedabout 1-2 percent of sales for most commodity ship-pers, but ranged from 1 to 8 percent for bagged saladshippers. Given low margins in the fresh produce ship-ping industry, these fees may be sufficient to deter-mine whether a firm earns a profit or loses money overthe course of a season. Hence, this research demon-strates that a focus on slotting fees is far too narrowwhen examining fees paid by shippers.
Many types of services are newer than the types offees being requested. They were also more oftenviewed as beneficial and therefore, not surprisingly,were complied with more frequently. New servicesmay reflect changes in the way produce is marketed,independent of retail consolidation. Shippers reportedthe most commonly provided service as third-partyfood safety certification. Requests for third-party food
safety certification reflect growing buyer awareness ofthe concerns of consumers and the business conse-quences when food safety is compromised. Requestsfor returnable plastic containers or pallets areexplained by buyer efforts to reduce labor costs andcardboard refuse, rather than retail consolidation, espe-cially since the request for this service is most preva-lent among mass merchandisers rather than conven-tional retailers. Many shippers viewed this service ashaving a beneficial or neutral impact on their business.
Requests for private labels are related to the growingemphasis of some buyer types on improving customerloyalty and controlling quality, profitability, and vol-umes. Category management services were enteringthe fresh produce side of the grocery business prior tothe latest wave of retail consolidation. With the adop-tion of standardized PLU codes and customer carddata, it is possible to conduct more rigorous analysesof category profitability at the store level. This is evenmore important now with the increased number of pro-duce items handled by retailers.
Some shippers appear to be struggling more than oth-ers to adapt to the emerging trade practices. Services,which are generally fixed costs, would naturally behigher as a percentage of sales for smaller firms.Smaller firms may find it difficult to compete withlarger shippers in funding large investments for someservices. On the other hand, retailers reported that theyexpect more fees and services from their largest sup-pliers for any particular product because of a perceivedgreater ability to pay. Smaller shippers already hadbegun to focus on niche markets prior to the recentconsolidation and those that succeed will likely con-tinue to target specialty markets of less interest tolarger shippers.
From a public policy perspective, fees and servicesmay be of particular concern if they are off-invoiceand not reflected in publicly reported market prices,such as AMS’ Market News reports. If so, publicprices may no longer provide representative referenceprices for all parties. In addition, publicly reportedshipping-point prices based on daily sales will increas-ingly represent a lower share of actual transactions asfirms move more to supply chain management prac-tices, with ongoing bilateral contracts between buyersand sellers. The issue of whether shipping-point pricesreflect current net prices may be more serious forproducts with a high incidence of contracts. Both buy-ers and sellers are concerned that with less information
Economic Research Service/USDA U.S. Fresh Fruit and Vegetable Marketing / AER-795 � 43
about the net prices obtained by their competitors, theywill be less able to make informed decisions about theextent to which they should make (retailers) or complywith (shippers) fee and service requests. As off-invoicefees increase, firms will need other sources of informa-tion on fees in order to negotiate competitive deals.
Why are fees and services increasing in incidence,magnitude, and type? What lessons can be learnedfrom the experiences of the products studied here? Aone-size-fits-all explanation is most likely a simplifica-tion. We can say that, in general, the relationshipbetween shippers and retailers has changed, but onlypartly due to retail consolidation. Retail consolidationdoes not necessarily lead to market power. Marketpower may, indeed, play a role in new trade practicesbut that is an empirical question to investigate. Feesand services are also a function of several complexfactors such as changes in consumer demand, technol-ogy, supply and demand conditions, shipper marketingstrategies, buyer procurement strategies, the structure
of the shipping and retailing industries, and the levelof interfirm rivalry.
The Federal Trade Commission (FTC) and the Depart-ment of Justice are the Federal agencies that determinewhether a pricing strategy violates antitrust legislationor, in other words, is anticompetitive. FTC decisionsabout whether a practice is competitive or anticompeti-tive are based on both legal and economic precepts (seebox, “Determining Anticompetitive Trade Practices”).
Another pressing question is whether slotting fees willeventually become common in commodity transac-tions. Bagged salad shippers, as sellers of a differenti-ated, branded product requiring dedicated shelf spaceyear round, are more able to incorporate slotting andother types of fees into their pricing structures andmay find that slotting fees can provide a benefit totheir firms in terms of acquiring shelf space. In con-trast, commodity shippers as price takers are less ableto incorporate slotting and other types of fees into their
The Federal Trade Commission (FTC) and the Depart-ment of Justice are the Federal agencies that determinewhether a pricing strategy violates antitrust legislationor, in other words, is anticompetitive. According to theFTC, “A practice is illegal if it restricts competition insome significant way and has no overriding businessjustification. Practices that meet both characteristics arelikely to harm consumers—by increasing prices, reduc-ing availability of goods or services, lowering quality orservice, or significantly stifling innovation.” Four lawsregulate pricing: the Sherman Antitrust Act, the FederalTrade Commission Act, the Clayton Act, and the Robin-son Patman Act.
The Sherman Antitrust Act, enforced by the Departmentof Justice, regulates horizontal relationships amongfirms, including price fixing, collusion, and other hori-zontal restraints. The Federal Trade Commission Act,enforced by FTC, also regulates horizontal firm rela-tionships. The Clayton Antitrust Act, supplements theSherman Act. These three Acts are designed to protectand preserve competition in the marketplace. TheRobinson Patman Act regulates vertical relationships(those between suppliers and retailers), and prohibitsretailers from paying suppliers different prices for likequality and quantity if the discrimination has a negative
effect on competition. Sellers are also prohibited fromknowingly soliciting a discriminatory price.
Past antitrust court decisions have determined that cer-tain practices are “per se” illegal, and firms can be pros-ecuted for adopting these practices. For example, pricefixing is per se illegal. If authorities are able to provethat there is an agreement to fix prices, the firmsinvolved can be prosecuted on the basis of the existenceof the agreement. If, however, the defendants candemonstrate that the pricing strategy in question hascreated a better product or greatly reduced costs, thepricing strategy will be assessed under the “rule of rea-son.” Other questionable pricing strategies that are notper se illegal are also assessed under the rule of reason.
A rule of reason analysis assesses the overall social ben-efit resulting from the questionable practice. The firststep is determining whether the pricing strategy is nec-essary to achieve these benefits. If so, the next questionis whether the pricing strategy in question leads to theexercise of market power, resulting in prices above thecompetitive level. If prices do not rise above the com-petitive level, the final step is to assess whether the effi-ciency benefits outweigh the anticompetitive harm(Salop and Scheffman, 1997).
Determining Anticompetitive Trade Practices

44 � U.S. Fresh Fruit and Vegetable Marketing / AER-795 Economic Research Service/USDA
cost/pricing structures so incentives are low to offerslotting fees as a strategy for capturing market sharefrom competing suppliers. Even if retailers have mar-ket power, it may be difficult to apply slotting fees tocommodities unless and until they are available yearround from a relatively consolidated shipper structure.
Hence, while current conditions in the commodity sideof the business may not lend themselves to slottingfees, this may change. If more commodity shippersconsolidate or form strategic alliances to match theneeds of fewer, larger buyers and become year-roundoperators capable of supplying large, consistent vol-umes with the quality specifications desired by indi-vidual accounts, it may be easier for retailers torequest slotting fees. However, if a consolidated ship-per structure were to prevail, it is not a given that slot-ting fees would become the norm since countervailingpower could help shippers resist these fees. The inten-sity of interfirm rivalry becomes critical at this point,with shippers either capable of resisting fees or offer-ing them as a strategy for capturing market share from
competitors. On the other hand, if retailers focus onsupply chain management approaches where theyoperate more in partnership with preferred suppliers,slotting fees may be less of a factor.
This report provides a first look at the complex inter-actions between shippers and retailers. By describingthe trade practices and indicating broad trends, it pro-vides a launching point for further hypotheses andresearch. Data will continue to be a stumbling blockfor future research. More comprehensive samplingwould provide more confidence in results, but the pro-prietary nature of transaction data may preclude effortsto improve the information base.
The next report in this series will focus on whetherretailers exert market power, based on an empiricalanalysis of the relationship between shipping-pointand retail prices. This third report will provide furtherinsight into the complex interactions between shippersand retailers.

Economic Research Service/USDA U.S. Fresh Fruit and Vegetable Marketing / AER-795 � 45
References
Bloom, Paul, Gregory Gundlach, and Joseph Cannon.“Slotting Allowances and Fees: Schools of Thoughtand the Views of Practicing Managers.” Journal ofMarketing 65(2000):92-108.
California Tomato Commission. Private communication,1999.
Carman, Hoy, Richard Sexton, and Roberta Cook.“Marketing California’s Agricultural Production” inCalifornia Agriculture: Issues and Challenges,Jerome Siebert, ed., University of California,Giannini Foundation of Agricultural Economics,Berkeley, CA, 1997.
Cook, Roberta. “The Fresh Fruit and Vegetable ValueChain Faces New Forces for Change.” Paper pre-sented at the American Agricultural EconomicsAssociation Pre-Conference Workshop on PolicyIssues and the Changing Structure of the Food Sys-tem, Tampa, FL, July 29, 2000,http://www.aaea.org/changingstructure/html.
Chu, Wujin. “Demand Signalling and Screening inChannels of Distribution.” Marketing Science11(1992): 327-47.
Eldredge, Dave. “Survival of the Biggest? AnotherLook at Retail Consolidation.” Symposium pre-sented at the Produce Marketing Association Inter-national Convention and Exposition, Anaheim, CA,October 31, 2000.
Federal Trade Commission. Workshop on SlottingAllowance and Other Grocery Marketing Practices,Washington, DC, May 31-June 1, 2000.
The Florida Department of Citrus. “Citrus ReferenceBook.” Economic and Market Research Depart-ment, Lakeland, FL, April 1999.
The Food Institute. The Food Institute Report. FairLawn, NJ, May 24, 1999 (p. 2) and May 1, 2000 (p. 3).
Gundlach, Gregory. “Slotting Allowances and Fees:Research Status, Emerging Insights and FutureDirections.” Testimony to U.S. Senate, Committeeon Small Business, September 14, 2000.
Kaufman, Phil, Charles Handy, and Roberta Cook.“Changing Structure of Produce Buyers—FoodRetailing and Wholesaling—and Implications forSuppliers.” Perishables Handling Quarterly. Uni-
versity of California at Davis Technology Researchand Information Center, Issue 103, August 2000a.
Kaufman, Phil, Charles Handy, Edward McLaughlin,Kristen Park, and Geoffrey Green. Understandingthe Dynamics of Produce Markets: Consumptionand Consolidation Grow. U.S. Dept. Agr., Eco-nomic Research Service, AIB-758, August 2000b.
Lariviere, Martin A. and V. Padmanabhan, “SlottingAllowances and New Product Introductions.” Mar-keting Science 16(1997):112-28.
Litwak, David. “Is Bigger Better?” Supermarket Busi-ness, New York, NY. October 1998.
Litwak, David. Supermarket Business, New York, NY.October 1988.
McLaughlin, Edward, Kristen Park, Debra Perosio,and Geoffrey Green. FreshTrack 1999: New Dynam-ics of Produce Buying and Selling. Produce Market-ing Association, Newark, DE, 1999.
Patterson, Paul, and Timothy Richards. “Produce Mar-keting and Retail Buying Practices.” Review of Agri-cultural Economics 22(2000): 160-171.
Salop, Steven, and David Scheffman. “Raising Rivals’Costs.” American Economic Review 73(1983):267-71.
Sullivan, Mary. “Slotting Allowances and the Marketfor New Products.” Journal of Law and Economics90(1997):461-493.
Tanyeri, Dana. “The ID Top 50.” Industrial Distribu-tion. New York, NY, March 1999.
Toto, Dominic. “Slotting Allowances and Competitionin the Food Industry: Paying the Price for Non-Price Competition,” Master’s Thesis, PennsylvaniaState University, State College, PA, August 1990.
Thompson, Gary D. and Paul N. Wilson. “The Organi-zational Structure of the North American FreshTomato Market: Implications for Seasonal TradeDisputes,” Agribusiness: An International Journal.13(1997):533-547.
U.S. Department of Agriculture, National AgriculturalStatistics Service. Vegetables: Final Estimates,1992-97, SB 946c, January 1999.
U.S. Department of Agriculture, National AgriculturalStatistics Service. Vegetables: 1999 Summary, Vg 1-2 (00)a, January 2000.

46 � U.S. Fresh Fruit and Vegetable Marketing / AER-795 Economic Research Service/USDA
U.S. Senate, Committee on Small Business. “Slot-ting: Fair for Small Business and Consumers?”106th Congress, September 14, 1999.
U.S. Senate, Committee on Small Business. HearingsBefore the Committee on Small Business, Septem-ber 14, 2000.
Wilson, Paul N., Gary D. Thompson, and Roberta L.Cook. “Mother Nature, Business Strategy, and theFresh Produce Industry.” Choices, First Quarter1997, pp. 18-21, 24-25.

Economic Research Service/USDA U.S. Fresh Fruit and Vegetable Marketing / AER-795 � 47
Glossary
Advance pricing/lid prices. Buyers and sellers maynegotiate “lid prices” or price ceilings for estimatedquantities of product in anticipation of future retailpromotions. No price floors are implied with theseadvance prices, meaning that if market prices declinein the interim the buyer is likely to request a lowerprice, whereas if the price rises the shipper is obligedto supply the estimated volume at the lid price.
Automatic inventory replenishment. The supplier iselectronically integrated into the buyer’s inventorymanagement system. The preferred supplier therebyhas the responsibility, authority, and access to the datanecessary to co-manage the inventory with the retailer,according to negotiated parameters. The supplier isresponsible for maintaining appropriate inventory lev-els at identified distribution centers and for shippingproduct according to the agreement with the buyer,rather than waiting for product orders from the buyer.
Branded produce. All produce shippers have tradelabels that are recognized by retail produce buyers, butmost of these are not consumer brands since they don’tachieve consumer recognition. In this study, brandedproduce refers to products with brands that consumersmay also recognize. Firms that successfully develop adifferentiated product often use branding to solidifythat advantage.
Broker. A broker is an agent in the marketing chainthat negotiates transactions between buyers and sellerswithout taking title to the merchandise or physicallyhandling the product. There are also buying brokersthat purchase on account for clients and do take title.
Buy-back unsold product or failure fees. Retailersmay charge suppliers fixed fees when products fail tosell or force shippers to take back product rejected atthe distribution center level. A few shippers offer tobuy back products that do not sell.
Capital improvement fees. Fees requested of suppli-ers by retailers to help pay for internal capitalimprovements, such as new refrigerated display equip-ment or the construction of new warehouses.
Category management. The process of making data-based decisions on shelf allocation, product mix, pric-ing, and merchandising strategies within a category ofproducts, with the goal of improving category prof-itability. To conduct effective category management
there must be access to accurate retail data at the stan-dard stock-keeping unit (SKU) level. Retailers mayconduct category management in conjunction withtheir supplier partners or with industry-wide represen-tatives, such as commodity marketing commissions.More shippers are investing in the analytical and infor-mation management capabilities necessary to providethis sophisticated service to customers.
Contracts. In this study we define contracts broadly toinclude preferred supplier relationships/deals, partner-ships, or programs between buyers and sellers. Specifi-cally, contracts include both written and verbal negoti-ated sales arrangements that cover multiple sales trans-actions or ongoing relationships. The point of distinc-tion (relative to daily sales) is ongoing sales and mar-keting agreements with buyers versus single ship-ments, even if price is not fixed.
Copacking. Firms may enhance their product line byhaving another shipper pack according to their specifi-cations. These arrangements allow each firm to spe-cialize in products in which they have a competitiveadvantage. For specialty items with small absolute vol-umes like escarole or bok choy, for example, firms canachieve scale economies through such arrangements.
E-commerce fees. Fees charged by new e-commercefirms to sell products using their electronic exchanges;these fees may be per transaction, or fixed for a spe-cific period of time, such as a month.
Electronic data interchange (EDI) or retail linkprograms. These are bilateral electronic transactionsbetween specific retailers and their preferred suppliers.They may be used only for invoicing or for electronicordering and other procurement activities.
F.o.b. shipping-point price. Free-on-board pricesexclude freight and insurance costs. This price is theaverage, unweighted unit price received by the shipperor grower-shipper primarily for sales in carload ortruckload quantities but also including mixed loads.
Foodservice. Foodservice outlets provide products toconsumers via commercial channels such as restau-rants and hotels as well as non-commercial channelssuch as hospitals, schools, and other institutions.
Free product discounts. When a shipper offers a newproduct, a retailer may request a certain number offree boxes, usually a specific number per store. Con-

48 � U.S. Fresh Fruit and Vegetable Marketing / AER-795 Economic Research Service/USDA
versely, when retailers open new stores, they mayrequest free products from their suppliers.
Fresh-cut produce. Lightly processed fresh producesold in cut and/or packaged form rather than asunprocessed bulk commodities. While these productsare lightly processed they are still perishable with shelflife generally ranging from 14 to 21 days. Bagged sal-ads and broccoli florets are common examples offresh-cut produce.
Grocery retailers. Grocery retailers are broadlydefined to include integrated wholesaler-retailers, con-sisting of the buying operations of corporate chainssuch as Kroger or Safeway, voluntary chains such asSuper-Valu and Fleming, and retail cooperatives likeAssociated Grocers and Certified Grocers of Califor-nia. Voluntary chains consist of sponsoring whole-salers who supply independent retailers or small chainsand, in some cases, their own stores as well. Retailcooperatives are essentially member-owned whole-salers since they consist of groups of retailers whojointly own a central buying and warehousing facility.
Grower-shippers. Growers that forward-integrate intothe shipping and marketing of their own produce, fre-quently handling that of other growers as well, usuallyacting as sales agents rather than taking title.
Listing fees or warehouse fees. Listing or warehousefees may be required to become a supplier to a distri-bution center, and are charged to cover the administra-tive costs of entering the shipper into the buyer’s com-puter system.
Market power. A firm with market power can affectprice by its own actions, for example raise the marketprice above competitive levels by reducing output. Incontrast, in a competitive industry, firms are price tak-ers and individually they can not raise price withoutlosing their customers.
Mass merchandisers. Mass merchandisers includesupercenters (large general merchandise discountstores with grocery departments) and club stores(membership wholesale clubs).
Pay-to-stay fees. Upfront fees paid to retailers for anexisting product to retain shelf space. While econo-mists distinguish between pay-to-stay fees for exist-ing products and slotting fees for new products, ship-pers do not always distinguish between the two. Insome cases, we discuss pay-to-stay fees and slotting
fees together and for convenience call them both slotting fees.
Perishable Agricultural Commodity Act (PACA).The Perishable Agricultural Commodities Act isdesigned to encourage fair trading practices in themarketing of fresh and frozen fruits and vegetables ininterstate and foreign commerce. It prohibits unfairand fraudulent practices and provides a means ofenforcing contracts. Under the PACA, anyone buyingor selling commercial quantities of fruit and vegetablesmust be licensed.
Price look-up (PLU) codes. Codes used by retailtellers to look up the price of unpackaged fruits andvegetables. These codes may be retailer-assigned orstandardized. Most standardized codes are four digits,but if products are organically grown a 9 precedes theregular four digits. If an item is genetically engineered,an 8 precedes the four digits. The Produce ElectronicIdentification Board, part of the Produce MarketingAssociation, assigns the standardized numbers.
Private-label product. An item sold under a buyer’strade label rather than the shipper’s. The demand forcustomer-specific labels is growing, both among retail-ers and distributors.
Promotional fees or cooperative advertisements.Shippers pay promotional fees to retailers to promotetheir products to consumers. They may be fixed, up-front fees or structured as per-carton allowances. Theremay or may not be a performance commitment associ-ated with these fees. For cooperative advertisementsthe buyer also contributes toward advertising jointlywith the shipper.
Other rebates. These are per-unit price reductionswithout any stated performance commitment.
Repacker. A produce wholesaler who ripens andpacks or repacks bulk produce, particularly tomatoes,generating packs with uniform product maturity andoften providing presentations specific to the needs ofindividual buyers.
Returnable containers. These include recyclable plas-tic cartons (RPC’s) and standardized pallets. Theyreduce solid waste and may help to streamline physicalhandling at the distribution center and store levels.
Shipper. Any shipping-point firm engaged in the busi-ness of marketing produce from growers or others and

Economic Research Service/USDA U.S. Fresh Fruit and Vegetable Marketing / AER-795 � 49
distributing such produce in commerce. Shippers mayor may not be forward-integrated growers and theyincreasingly also operate as importers in order toextend seasons or product lines.
Slotting fees. Economists define slotting fees as up-front fees paid by suppliers to retailers to guaranteeshelf space for new products. Fees that are paid toguarantee shelf space for existing products are referredto as pay-to-stay fees. Produce industry usage does notalways distinguish between the two. Listing or ware-house fees are similar. In some cases, we discuss slot-ting and pay-to-stay fees together and for conveniencecall them both slotting fees.
Special merchandising displays. These are store-leveldisplays designed to enhance product sales. Suppliersoften assist retailers in developing these displays asmeans of stimulating consumer demand.
Special packs. Buyers often have needs for particularsize, quality, and variety configurations and suppliersmay be asked to customize product offerings to meetthese needs.
Supply-chain management. A procurement modeldesigned to streamline the distribution system by elim-inating nonvalue-adding transaction costs. This ofteninvolves marketing programs between buyers and pre-ferred suppliers, rather than daily sales, including con-tract buying. Focusing procurement on preferred sup-pliers allows retailers to exercise greater control overproduct volumes, quality, pricing, promotions, andfood safety standards.
Third-party food safety certification. Third-partyfood safety certifiers examine firms for compliancewith both microbial quality control processes, andpesticide application and residue regulations, certify-ing that food safety control processes meet accept-able standards.
Trade practices. Trade practices is a broad term thatrefers to the way shippers and retailers do business,including fees such as rebates and slotting fees, aswell as services like automatic inventory replenish-ment, special packaging, and third-party food safetycertification. Trade practices also refer to the overallstructure of a transaction—for example, long-termrelationships or contracts versus daily sales with nocontinuing commitment.
Universal product codes (UPC’s). The 12-digit codefound on fixed-weight, packaged items. For fixed-weight produce, as opposed to manufactured items,numbers are assigned by the Produce Electronic Identi-fication Board, which is part of the Produce MarketingAssociation. UPC’s are scanned at retail checkout andat least two companies purchase and assemble scannersales data for use throughout the food industry.
Volume incentives. Per-carton rebates are paid once acertain volume level is attained. Volume incentives areusually structured with graduated scales, increasing ascertain target volumes are reached. Payments to buyersare retroactive after sales for the season, or a specifiedperiod, are over.
50 � U.S. Fresh Fruit and Vegetable Marketing / AER-795 Economic Research Service/USDA
Generally, have the requests for services and fees byyour GROCERY RETAIL and MASS MERCHAN-DISER customers increased, decreased, or remainedabout the same in recent times?
� Increased � Decreased � Same
Please indicate (check yes or no) whether each of theservices and fees listed in the next table have beenrequested by your retail/mass merchandise cus-tomers. If yes, please check where shown if thefees/services are new within the last five years,whether they were initiated by retail/mass merchan-diser buyers or rather by your firm or other shippers togain a competitive advantage. If retailers did request afee/service, indicate whether you complied with theoriginal request (check yes or no). If no, check whereshown if you negotiated an alternative arrangement. Ifnot, check if you lost the account due to not comply-ing. If you provided any of these fees/services, please
provide the approximate $ cost (where applicable) ofdoing so. Please indicate if these costs were one time(1 T) fixed costs, or whether they were incurred on aper carton (/C) basis or per store (/S); for example, 1free carton per store when introducing a new productinto a chain. Also indicate the sales volume marketedunder that type of arrangement as a percentage of totalsales. For example, if you provided category manage-ment services or gave volume incentives, approxi-mately what percentage of your sales was made usingthese arrangements? For any services/fees you pro-vided/paid, did you receive any performance commit-ments in exchange from retailers? For example, if youpaid volume incentives did retailers have to meet aminimum volume over the season to qualify? If yes,please specify the type of commitment where shown.Finally, please indicate whether the net impact to yourbusiness was Beneficial (B), Harmful (H), or Neutral(N) for each of the services/fees you provided/paid.
Appendix: Interview Questions on Fees and Services

Econom
ic Research Service/U
SDA
U.S. F
resh Fruit and Vegetable M
arketing / AE
R-795
�51
Check if the FeeHas Been
Requested/providedand if Yes, Check if is New Since '94
Who Initiated Fee
(Check R ifRetail Buyer,S if Self, C ifCompetitor)
If RetailerInitiated, DidYou Comply
With theOriginalRetailer
Request?
Indicate ifNegotiatedAlternative
Arrangement (A)or
Lost theAccount (L)
$ Cost of FeePer
Season
Indicate if Fees wereOne-time,Per CartonSold or Per
Store
% of SalesUnderFee
Indicate if ThereWas any Volume/
PeformanceCommitments Made
by Retailer inExchange for Fee-
If Yes, Specify
What is the NetImpact of these
Fees?Please insert
the appropriateabbreviation(B) Beneficial(H) Harmful(N) Neutral
Fees: Yes No New R S C Yes No A L
Pay fixed up-front slotting/listing/warehouse fee for a new product
Pay fixed up-front slotting/listing/warehouse fee for an existing product (pay-to-stay fees)
Give volume incentives
Pay promotional allowance or co-op ads
Pay other rebates
Pay free-product discounts
Buy-back unsold products or failure fees
Contribute to retail capital improvements, e.g., refrigeratedequipment allowances, warehouse construction
Pay e-commerce fees (retailer requires shipper to list with an e-commere (firm)
Other fees (please specify)
/Cor/S
1 T
1 T
1 T
/C

52�
U.S. F
resh Fruit and Vegetable M
arketing / AE
R-795
Econom
ic Research Service/U
SDA
Check if the Service Has Been
Requested/providedand if Yes, Check if is New Since '94
Who Initiated Service
(Check R ifRetail Buyer,S if Self, C ifCompetitor)
If RetailerInitiated, DidYou Comply
With theOriginalRetailer
Request?
Indicate ifNegotiatedAlternative
Arrangement (A)or
Lost theAccount (L)
$ Cost of Service
PerSeason
Indicate if Services
wereOne-time,Per CartonSold or Per
Store
% of SalesUnder
Service
Indicate if ThereWas any Volume/
PeformanceCommitments Made
by Retailer inExchange for Fee-
If Yes, Specify
What is the NetImpact of these
Services?Please insert
the appropriateabbreviation(B) Beneficial(H) Harmful(N) Neutral
Services: Yes No New R S C Yes No A L
Participate in an Electronic DataInterchange (EDI) or retail linkprogram
Participate in an automaticinventory replenishmentprogram
Provide category managementservices
Develop special merchandisingdisplays
Provide private labels
Use of returnable containers(e.g., Chep. IFCO)
Provide third-party food safetycertification
Other (please specify)
Other fees (please specify)
/C1 T
Develop special packs