Continuity of Import and Export Trade Statistics After Implementation of the Harmonized Commodity
FreshFruit&VegetableExport/ImportStatistics
2017/18
AstatisticsresourceforfreshproduceexportersandimporterspreparedfortheAustralianHorticulturalExporters&ImportersAssociationbyFreshIntelligenceConsulting
AHEIAFreshFruitandVegetableExport/ImportStatistics(2017/18)
©2018FreshIntelligenceConsulting 2
IntroductionThis extensive statistics update covers fresh fruit and vegetable exports and imports to and fromAustralia’smajortradingpartnerswithvolumeandvaluebyproductbycountry.Withthedualfocusonexportsandimportsthisanalysisiscompiledbycountrywithcombinedtwo-way trade for exports and imports, where applicable, on each page. The tables are colour codedgreenforexportsandredforimports.As in previous issues all the country tables have been prepared in the same format for ease ofcomparisonacrossmarkets.Theyinclude3yearsofvolumefigures,growthandshareanalyticswiththelatestannualA$valueonthefarrightcolumn.Thedatahasbeensortedbyvalue.Thekeymarketmeasuresfortotalvolume,valueandunitvaluesoverthreeyearsaresummarisedinthetop3linesofeachtable.AllexportvaluemeasuresareFOBandimportvaluemeasuresareCIF.Thetotalfreshfruitandvegetablesexcludedriedfruitsandvegetablesexceptinsomecaseswherethere is nodistinctionby the codes. Such volumeswouldmakenomaterial impact on theoverallresults.WayneProwsePrincipal&SeniorAnalystFreshIntelligenceConsulting
DisclaimerThedata for theAHEIAexport import statisticswas collatedby Fresh IntelligenceConsulting fromdataprovidedthroughtheInternationalTradeCentreandGlobalTradeAtlasbasedondataprovidedbytheAustralianBureauofStatistics.Thisdataiscollatedfromexportandimportdocuments.Whileeveryeffortismadetoensurethatthedataisatruereflectionofthetrade,someerrorsmayoccurduetothereportingandFreshIntelligenceConsultingtakesnoresponsibilityforanylossesthatmayoccurasaresultofdecisionsbasedonthisdata

AHEIAFreshFruitandVegetableExport/ImportStatistics(2017/18)
©2018FreshIntelligenceConsulting 3
TableofContentsIntroduction 2Disclaimer 2FreshFruitandVegetableSummary 4FreshFruitExports&Imports 6
China 9HongKong 10Japan 11Indonesia 11India 12SouthKorea 13Malaysia 14Taiwan 14Philippines 15Singapore 16Vietnam 16Thailand 17UnitedArabEmirates 18SaudiArabia 18NewZealand 19Europe 20UnitedStates 21Canada 22Egypt 23Israel 23
FreshVegetableExportsandImports 24Singapore 27Indonesia 27Japan 28SouthKorea 28Malaysia 29HongKong 29China 30Thailand 31Taiwan 31UnitedArabEmirates 32SaudiArabia 32BahrainKuwaitQatar 33Europe 34NewZealand 35UnitedStates 36Mexico 36Peru 36
References 37

AHEIAFreshFruitandVegetableExport/ImportStatistics(2017/18)
©2018FreshIntelligenceConsulting 4
FreshFruitandVegetableSummaryAustralian fresh fruit and vegetable exports combined increased 15.9 per cent to 675,051 tonnesworthAU$1.40 billion for the year ending June 2018.Of this fresh fruit increased 19 per cent to466,546tonnesandfreshvegetablesincreased8.8percentto208,505tonnes.FreshfruitexceededAU$1billionforthefirsttimeinafinancialyear.
The2017/18exportresultwasagainarecordbreakerforthefifthconsecutiveyear.Theabovechartdemonstrates the impactof theAUD:USDexchangerateover2decadesalthoughother influencespositiveandnegativehaveshapedthetradepattern.Themillennialdrought,GlobalFinancialCrisisand tri-state floods impacted results, as has the implementation of free trade agreements, newmarketaccessandtheunprecedenteddemandfromChina.Global trademovementsof fresh fruit in2017 stoodat around80million tonnesaccording to ITCTrademapandUNComtradedataofwhichAustralia’sexportshareof466thousandtonneswasjust0.58percent.Australia’simportsdecreased16.5percentto119,579tonnesworth$410.8m.Thisincluded90,247tonnesof fresh fruit and29,332 tonnesof freshvegetables.Avocados fromNewZealanddroppedsome 50 per cent due to an “off” season and were the greatest contributor the lower importmeasure.
HorticultureExports2017/18 2017/18 2017/18changetoLY volshare Value
Value$AMillion 1,158.8 1,195.3 1,404.2 17.5%VolumeTonnes 602,205 582,692 675,051 15.9%A$perkg $1.92 $2.05 $2.08 1.4%
Tonnes Tonnes Tonnes A$million
FreshFruit 393,968 391,040 466,546 19.3% 69.1% 1,141.8FreshVegetables 208,237 191,652 208,505 8.8% 30.9% 262.4
Total 602,205 582,692 675,051 15.9% 100% 1,404.2Source:AustralianBureauofStatistics;FreshIntelligenceanalysis
2017/182015/16 2016/17
-
0.20
0.40
0.60
0.80
1.00
1.20
-
200
400
600
800
1,000
1,200
1,400
1,600
1996/97
1997/98
1998/99
1999/00
2000/01
2001/02
2002/03
2003/04
2004/05
2005/06
2006/07
2007/08
2008/09
2009/10
2010/11
2011/12
2012/13
2013/14
2014/15
2015/16
2016/17
2017/18
AUD:U
SDExcha
ngeRa
te
MillionAU
Dpe
ryear
Fruit&VegetableExportValuesover20years
FreshVegetables
FreshFruit
USD:AUD

AHEIAFreshFruitandVegetableExport/ImportStatistics(2017/18)
©2018FreshIntelligenceConsulting 5
Thecombinedexportsaccountedfor77percentofthetotal2-waytradeupfrom71percent lastyearasexportssurged16percentandimportseasedback17percent.Overall2-waytradeinfreshfruitandvegetablesreached1.8billionwithanA$993,000exportstradesurplus.
Source:ABS(2018)viaTrademap;FreshIntelligenceanalysis
HorticultureImports2017/18 2017/18 2017/18changetoLY volshare Value
Value$AMillion 411.6 489.3 410.8 -16.1%VolumeTonnes 118,375 143,170 119,579 -16.5%A$perkg $3.48 $3.42 $3.44 0.5%
Tonnes Tonnes Tonnes A$million
FreshFruit 90,472 110,367 90,247 -18.2% 13.4% 333.7FreshVegetables 27,903 32,803 29,332 -10.6% 4.3% 76.8
Total 118,375 143,170 119,579 -16.5% 18% 410.8Source:AustralianBureauofStatistics;FreshIntelligenceanalysis
2015/16 2016/17 2017/18
2-WayTradeforAuystralianFreshFruitandVegetables2017/18 2017/18changetoLY share
MillionAUD MillionAUD MillionAUD
Imports 411.6 489.3 410.8 -16% 23%Exports 1,158.8 1,195.3 1,404.2 17% 77%TotalTrade 1,570.35 1,684.61 1,814.94 8% 100%Balance 747.20 705.93 993.41 41%
2015/16 2016/17 2017/18
-1,000.0
-500.0
-
500.0
1,000.0
1,500.02015/16 2016/17 2017/18
MillionAU
Dpe
ryear
2-wayTradeFreshFruitandVegetables
Exports
Imports
FreshFruit81%
FreshVegetables19%
FreshFruit&VegetableExportsbyValueA$1.81bn(Jul-Jun2018)
FreshFruit81%
FreshVegetables19%
FreshFruit&VegetableImportsbyValueA$410million(Jul-June2018)

AHEIAFreshFruitandVegetableExport/ImportStatistics(2017/18)
©2018FreshIntelligenceConsulting 6
FreshFruitExports&ImportsByvolumefreshfruitexportsincreased19.6percentto466,546tonnesintheyeartoJune2018andthevaluelifted19.3percentto$1.14billion.ThisisthefirsttimetheA$1Billionmilestonehasbeenreachedinafinancialyear.Citrusliftedstrongly,withmandarinsincreasing37percentto71,000tonnesandorangesby20percenttoalmost200,000tonnes.Tablegrapeshadastrongstartandweakfinishthoughmanagedarecordresultat114,000tonnes.Cherriesrecoveredafterapoor2017seasontoexceed4,000tonneswhilesummerfruitexceed17,000tonnestothebestresultsince2003.
Source:AustralianBureauofStatistics;FreshIntelligenceanalysis
FreshFruitExportsbyProduct2017/18vsprevious2years2017/18 2017/18 2017/18 2017/18changetoLY volshare Value A$perkg
Value$AMillion 933.8 954.6 1,141.8 19.6%VolumeTonnes 393,968 391,040 466,546 19.3%A$perkg $2.37 $2.44 $2.45 0.2%
Tonnes Tonnes Tonnes A$million A$perkgTableGrapes 110,007 106,841 114,075 7% 24.5% 396.2 3.47Oranges 160,580 164,585 197,437 20% 42.3% 296.7 1.50Mandarins 48,974 52,498 71,720 37% 15.4% 153.8 2.14Cherries 5,593 2,462 4,273 74% 0.9% 64.4 15.08Peaches&nectarines 10,018 9,023 12,498 39% 2.7% 44.9 3.59Melons 19,243 19,401 20,774 7% 4.5% 32.7 1.57Strawberries 3,009 3,897 4,585 18% 1.0% 31.9 6.96Mangoes 7,006 7,120 8,092 14% 1.7% 29.9 3.69Plums 3,748 4,521 5,551 23% 1.2% 20.9 3.76Pears 12,260 7,165 13,170 84% 2.8% 20.9 1.58Apples 4,665 4,958 5,364 8% 1.1% 12.0 2.23Avocados 1,546 2,323 1,833 -21% 0.4% 11.9 6.48Lemons&limes 4,088 1,730 2,945 70% 0.6% 6.2 2.11Blueberries 254 356 235 -34% 0.1% 4.7 20.17Kiwifruit 1,004 970 1,034 7% 0.2% 3.6 3.49allother 29,537 25,214 33,092 31% 7.1% 91.3 2.76
Total 393,968 391,040 466,546 19% 100% 1,141.8 2.45
Source:ABS(2018)viaITCTrademap;FreshIntelligenceanalysis
2015/16 2016/17 2017/18
TableGrapes35%
Oranges26%
Mandarins13%
Cherries6%
Peaches&nectarines
4%
Melons3%
Strawberries3%
Mangoes2%
Plums2%
Pears2%
Apples1%
allother3%
FruitExportsbyTypebyValue
AHEIAFreshFruitandVegetableExport/ImportStatistics(2017/18)
©2018FreshIntelligenceConsulting 7
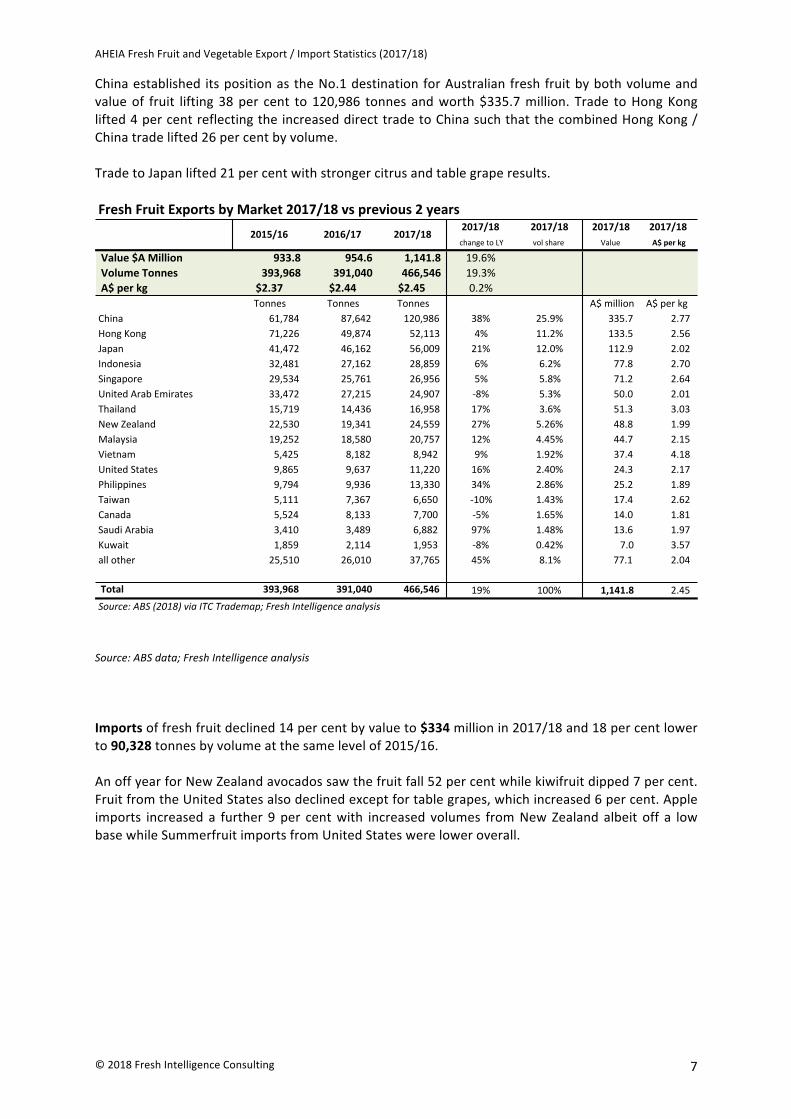
Chinaestablished itspositionastheNo.1destinationforAustralianfreshfruitbybothvolumeandvalueof fruit lifting38per cent to120,986 tonnesandworth$335.7million. Trade toHongKonglifted4percentreflectingtheincreaseddirecttradetoChinasuchthatthecombinedHongKong/Chinatradelifted26percentbyvolume.TradetoJapanlifted21percentwithstrongercitrusandtablegraperesults.
Source:ABSdata;FreshIntelligenceanalysisImportsoffreshfruitdeclined14percentbyvalueto$334millionin2017/18and18percentlowerto90,328tonnesbyvolumeatthesamelevelof2015/16.AnoffyearforNewZealandavocadossawthefruitfall52percentwhilekiwifruitdipped7percent.FruitfromtheUnitedStatesalsodeclinedexceptfortablegrapes,whichincreased6percent.Appleimports increased a further 9per centwith increased volumes fromNewZealand albeit off a lowbasewhileSummerfruitimportsfromUnitedStateswereloweroverall.
FreshFruitExportsbyMarket2017/18vsprevious2years2017/18 2017/18 2017/18 2017/18changetoLY volshare Value A$perkg
Value$AMillion 933.8 954.6 1,141.8 19.6%VolumeTonnes 393,968 391,040 466,546 19.3%A$perkg $2.37 $2.44 $2.45 0.2%
Tonnes Tonnes Tonnes A$million A$perkgChina 61,784 87,642 120,986 38% 25.9% 335.7 2.77HongKong 71,226 49,874 52,113 4% 11.2% 133.5 2.56Japan 41,472 46,162 56,009 21% 12.0% 112.9 2.02Indonesia 32,481 27,162 28,859 6% 6.2% 77.8 2.70Singapore 29,534 25,761 26,956 5% 5.8% 71.2 2.64UnitedArabEmirates 33,472 27,215 24,907 -8% 5.3% 50.0 2.01Thailand 15,719 14,436 16,958 17% 3.6% 51.3 3.03NewZealand 22,530 19,341 24,559 27% 5.26% 48.8 1.99Malaysia 19,252 18,580 20,757 12% 4.45% 44.7 2.15Vietnam 5,425 8,182 8,942 9% 1.92% 37.4 4.18UnitedStates 9,865 9,637 11,220 16% 2.40% 24.3 2.17Philippines 9,794 9,936 13,330 34% 2.86% 25.2 1.89Taiwan 5,111 7,367 6,650 -10% 1.43% 17.4 2.62Canada 5,524 8,133 7,700 -5% 1.65% 14.0 1.81SaudiArabia 3,410 3,489 6,882 97% 1.48% 13.6 1.97Kuwait 1,859 2,114 1,953 -8% 0.42% 7.0 3.57allother 25,510 26,010 37,765 45% 8.1% 77.1 2.04
Total 393,968 391,040 466,546 19% 100% 1,141.8 2.45Source:ABS(2018)viaITCTrademap;FreshIntelligenceanalysis
2015/16 2016/17 2017/18

AHEIAFreshFruitandVegetableExport/ImportStatistics(2017/18)
©2018FreshIntelligenceConsulting 8
United States andNewZealand accounted for77percentof the fresh fruit supplied toAustralia,with New Zealand falling 33 per cent mostly due to avocados. Citrus, grapes, cherries andsummerfruit arriving counter seasonally fromUnited States were 13 per cent lower overall whilecitrusfromEgyptincreased11percent.Italy,whichsupplementedkiwifruitintheNewZealandoff-season,alsodipped9percent.
FreshFruitImportsbyProduct2017/18vsprevious2years2017/18 2017/18 2017/18 2017/18changetoLY volshare Value A$perkg
Value$AMillion 325.8 389.0 334.0 -14.1%VolumeTonnes 90,472 110,367 90,328 -18.2%A$perkg $3.60 $3.52 $3.70 4.9%
Tonnes Tonnes Tonnes A$million A$perkgKiwifruit 23,254 23,527 21,772 -7% 24.1% 54.6 2.51Oranges 14,587 20,694 18,116 -12% 20.1% 30.4 1.68TableGrapes 13,784 14,405 15,265 6% 16.9% 69.5 4.55Avocados 13,108 23,478 11,370 -52% 12.6% 72.0 6.34Lemons&limes 6,464 7,812 4,739 -39% 5.2% 12.3 2.60Mandarins 3,375 4,324 3,805 -12% 4.2% 9.0 2.37Peaches&nectarines 3,653 2,235 2,281 2% 2.5% 10.7 4.67Cherries 1,505 2,295 2,196 -4% 2.4% 15.5 7.05Pears 1,487 2,158 1,826 -15% 2.0% 3.1 1.72Blueberries 1,432 1,211 1,234 2% 1.4% 29.5 23.89Apples 619 1,053 1,145 9% 1.3% 2.9 2.51Grapefruit 1,036 1,291 1,125 -13% 1.2% 2.3 2.03Mangoes 887 1,111 866 -22% 1.0% 4.1 4.74Persimmons 546 492 445 -10% 0.5% 2.5 5.71Apricots 900 794 434 -45% 0.5% 1.9 4.34Plums 798 548 380 -31% 0.4% 1.6 4.15allother 3,034 2,939 3,330 13% 3.7% 12.1 3.64
Total 90,472 110,367 90,328 -18% 100% 334.0 3.70Source:ABS(2018)viaITCTrademap;FreshIntelligenceanalysis
2015/16 2016/17 2017/18
FreshFruitImportsbySupplier2017/18vsprevious2years2017/18 2017/18 2017/18 2017/18changetoLY volshare Value A$perkg
Value$AMillion 325.8 389.0 334.0 -14.1%VolumeTonnes 90,472 110,367 90,328 -18.2%A$perkg $3.60 $3.52 $3.70 4.9%
Tonnes Tonnes Tonnes A$million A$perkgUnitedStates 42,708 46,228 40,333 -13% 44.7% 144.8 3.59NewZealand 32,771 43,688 29,422 -33% 32.6% 146.0 4.96Egypt 1,685 7,085 7,846 11% 8.7% 9.8 1.25Italy 7,387 6,927 6,306 -9% 7.0% 15.9 2.53China 1,917 2,832 2,450 -13% 2.7% 4.7 1.94Israel 1,206 1,228 1,385 13% 1.5% 2.5 1.83Vietnam 93 218 599 175% 0.7% 2.3 3.90Thailand 838 613 522 -15% 0.58% 3.2 6.21Spain 690 89 484 446% 0.54% 0.9 1.91Mexico 424 486 263 -46% 0.29% 0.7 2.61allother 1,868 1,548 1,464 -5% 1.6% 4.6 3.14
Total 90,472 110,367 90,328 -18% 100% 334.0 3.70Source:AustralianBureauofStatistics;FreshIntelligenceanalysis
2015/16 2016/17 2017/18

AHEIAFreshFruitandVegetableExport/ImportStatistics(2017/18)
©2018FreshIntelligenceConsulting 9
ChinaChinafurtherestablisheditspositionastheleadingexportdestinationbyvalueandvolumefollowingverystronggrowthincitrusexports,newaccessforsummerfruit includingplumsforthefirsttime,recoveryfromthe2017seasonforcherriesandsustainedtablegrapetrade.
ImportsfromChinacomprisemostlyapplesandpearsthoughvolumesarelow.Fortytonnesofpeaches&nectarinesimportedwererecorded.The“allother”categoryrecordsasproducts“notspecified”thoughappearaslycheesontheChinaCustomsexportdata.ThebalanceoftradeforfreshfruitwithChinaisstronglyfavouringexportswitha98.6percentshareofthetwo-waytradeandincreasing.
FreshFruitExportsto China2017/18 2017/18 2017/18changetoLY volshare Value
Value$AMillion 175.8 244.8 335.7 37.1%VolumeTonnes 61,784 87,642 120,986 38.0%A$perkg $2.84 $2.79 $2.77 -0.7%
Tonnes Tonnes Tonnes A$million
TableGrapes 29,936 41,196 42,851 4.0% 35.4% 153.5Oranges 23,034 34,159 51,732 51.4% 42.8% 97.6Mandarins 7,789 9,812 20,040 104.2% 16.6% 49.6Peaches&nectarines - 1,866 4,144 122.0% 3.4% 15.4Cherries 791 373 764 104.5% 0.6% 13.1Plums - - 1,097 ++ 0.9% 5.3Mangoes 83 80 124 54.9% 0.1% 0.8Apples 92 138 125 -10.0% 0.1% 0.2Grapefruit 18 - 65 ++ 0.1% 0.1Lemons&limes 42 - 43 ++ 0.0% 0.1
allother 0 17 3 ++ 0.0% 0.1
Total 61,784 87,642 120,986 38.0% 100% 335.7Source:ABS(2018)viaITCTrademap;FreshIntelligenceanalysis (++)morethan500%increase
2015/16 2016/17 2017/18
FreshFruitImportsfrom China2017/18 2017/18 2017/18changetoLY volshare Value
Value$AMillion 4.4 5.1 4.8 -6.5%VolumeTonnes 1,917 2,832 2,450 -13.5%A$perkg $2.29 $1.80 $1.94 8.1%
Tonnes Tonnes Tonnes A$million
Pears 1,374 1,959 1,638 -16.3% 66.9% 2.5Apples 357 698 594 -14.8% 24.3% 1.3Peaches&nectarines 0 34 40 17.0% 1.6% 0.1
allother 186 141 178 25.6% 7.2% 1.0
Total 1,917 2,832 2,450 -13.5% 100% 4.8Source:ABS(2018)viaITCTrademap;FreshIntelligenceanalysis
2015/16 2016/17 2017/18

AHEIAFreshFruitandVegetableExport/ImportStatistics(2017/18)
©2018FreshIntelligenceConsulting 10
HongKongAlthoughHongKonghasbeenmoreoftenby-passedwithmorefruitshippeddirecttoChina,itisstillan importantmarket that increased4.5per cent to52,113 tonnesworth$133million.Both citrusandgrapes,whichachievedstronggainsinChina,alsoincreasedtradeintoHongKong.Apples and pears increased off a small base, and pears in particular may be benefiting from themarketdevelopmentforEuropeanstylepearsinChinabyUSAPearsandBelgianPears.Mangoesandsummerfruitproducts,blueberryandmelonsweretheonlylinestodecreasevolumesintoHongKongin2017/18.
TherearenorecordedfreshfruitimportsbyAustraliafromHongKong.
FreshFruitExportsto HongKong2017/18 2017/18 2017/18changetoLY volshare Value
Value$AMillion 164.0 129.1 133.5 3.4%VolumeTonnes 71,226 49,874 52,113 4.5%A$perkg $2.30 $2.59 $2.56 -1.0%
Tonnes Tonnes Tonnes A$million
Oranges 39,641 25,967 28,009 7.9% 53.7% 26.2TableGrapes 13,097 8,026 8,578 6.9% 16.5% 28.9Cherries 2,259 895 1,247 39.3% 2.4% 17.3Mandarins 3,411 3,743 5,359 43.2% 10.3% 8.9Mangoes 3,010 3,328 2,557 -23.2% 4.9% 14.3Plums 1,948 3,096 2,123 -31.4% 4.1% 11.3Peaches&nectarines 4,434 1,711 1,220 -28.7% 2.3% 7.3Strawberries 197 368 510 38.5% 1.0% 2.7Blueberries 115 169 119 -29.3% 0.2% 4.1Melons 1,273 1,174 873 -25.7% 1.7% 2.2Avocados 87 217 212 -2.5% 0.4% 1.4Apples 297 343 440 28.4% 0.8% 0.9Pears 896 147 447 203.3% 0.9% 0.3Apricots 30 50 52 4.2% 0.1% 0.2
allother 1,841 1,397 1,519 8.8% 2.9% 5.7
Total 71,226 49,874 52,113 4.5% 100% 129.1Source:ABS(2018)viaITCTrademap;FreshIntelligenceanalysis
2015/16 2016/17 2017/18

AHEIAFreshFruitandVegetableExport/ImportStatistics(2017/18)
©2018FreshIntelligenceConsulting 11
JapanWhile citrus continues to lead the fresh fruit exports to Japan table grapes also gained furthertractioninthemarketandhasbecometheseleadingsouthernsupplieraheadofChileaccordingtoJapan Customs data. Access for Melons granted by Japan in 2016 generated 530 tonnes for thesecondyearofaccess.Australianbananasalsostartedtogainsomerecurringtradewith129tonnesof organic bananas. This of course is minute in the scale of some 1 million tonnes of bananasimportedbyJapanfromPhilippinesandEcuador.
IndonesiaExportstoIndonesiaincreased6.2percentto28,859tonneswithgrowthfromtablegrapes,lemons& limesandplums.Ongoingchangingmarketaccessconditionsarguably inhibitgrowthwithsomeuncertainty for longer-term development, though Australia’s close proximity andmore favourableaccessthancompetitorshasbeenanadvantage.
FreshFruitExportsto Japan2017/18 2017/18 2017/18changetoLY volshare Value
Value$AMillion 75.7 86.5 112.9 30.5%
VolumeTonnes 41,472 46,162 56,009 21.3%
A$perkg $1.82 $1.87 $2.02 7.6%
Tonnes Tonnes Tonnes A$million
Oranges 29,898 33,101 38,253 15.6% 68.3% 58.6TableGrapes 9,383 8,397 11,235 33.8% 20.1% 39.2Mandarins 1,895 3,430 4,868 41.9% 8.7% 11.0Grapefruit 117 779 778 -0.1% 1.4% 1.4Melons - 165 530 220.7% 0.9% 1.0Cherries 36 30 33 8.9% 0.1% 0.5Mangoes 59 48 35 -27.2% 0.1% 0.4Bananas - 45 129 187.0% 0.2% 0.2
allother 86 167 149 -11.0% 0.3% 0.8
Total 41,472 46,162 56,009 21.3% 100% 112.9Source:ABS(2018)viaITCTrademap;FreshIntelligenceanalysis
2015/16 2016/17 2017/18
FreshFruitExportsto Indonesia2017/18 2017/18 2017/18changetoLY volshare Value
Value$AMillion 88.1 75.0 77.8 3.8%VolumeTonnes 32,481 27,162 28,859 6.2%A$perkg $2.71 $2.76 $2.70 -2.4%
Tonnes Tonnes Tonnes A$million
TableGrapes 17,363 15,586 16,563 6.3% 57.4% 52.1
Mandarins 3,313 3,389 3,362 -0.8% 11.6% 6.9
Oranges 3,515 4,305 3,135 -27.2% 10.9% 5.0
Pears 4,700 1,757 2,581 46.9% 8.9% 4.2
Lemons&limes 2,752 943 1,999 112.0% 6.9% 3.8
Cherries 95 105 128 21.4% 0.4% 2.4
Apples 434 671 401 -40.3% 1.4% 1.3
Plums 164 276 563 103.7% 2.0% 1.5
Peaches&nectarines 64 64 61 -4.1% 0.2% 0.2
allother 81 64 67 4.7% 0.2% 0.5
Total 32,481 27,162 28,859 6.2% 100% 77.8Source:ABS(2018)viaITCTrademap;FreshIntelligenceanalysis
2015/16 2016/17 2017/18

AHEIAFreshFruitandVegetableExport/ImportStatistics(2017/18)
©2018FreshIntelligenceConsulting 12
IndiaAustralian fresh fruit exports to India lifted almost 240 per cent off a small base with a largerpercentage lift in oranges, apples and pears. Overall fresh fruit trade to India from Australia was6,568tonnesworth$8.7million.India’sbanonChineseappleimportsmayhaveassistedtheresultforAustralianapplesalthoughAustralia’scontributiontoIndia’s330,000tonnesofappleimportsismarginal.India’s hugemarket potentialwith 1.3billion consumers is a reason for plugging away todeveloptrade albeit at low volumes. High tariff and non-tariff barriers are problematic alongwith lack ofreliablecoldchaininfrastructuretodeliverfruitinpeakconditiontoconsumers.
FreshFruitExportsto India2017/18 2017/18 2017/18changetoLY volshare Value
Value$AMillion 3.6 3.0 8.7 186.4%VolumeTonnes 2,701 1,938 6,568 238.9%A$perkg $1.32 $1.57 $1.33 -15.5%
Tonnes Tonnes Tonnes A$million
Oranges 1,911 1,200 4,172 247.7% 63.5% 4.0Pears - 121 1,149 849.5% 17.5% 1.5TableGrapes 204 279 468 67.5% 7.1% 1.4Mandarins 337 276 403 46.1% 6.1% 0.7Cherries 37 23 39 71.4% 0.6% 0.4Apples 62 19 269 1296.2% 4.1% 0.4Peaches&nectarines 3 12 39 232.3% 0.6% 0.1Blueberries - - 4 0.1% 0.1Plums 80 3 16 530.6% 0.2% 0.04
allother 145 8 25 220.8% 0.4% 0.05
Total 2,701 1,938 6,568 238.9% 100% 8.73Source:ABS(2018)viaITCTrademap;FreshIntelligenceanalysis
2015/16 2016/17 2017/18
AHEIAFreshFruitandVegetableExport/ImportStatistics(2017/18)
©2018FreshIntelligenceConsulting 13
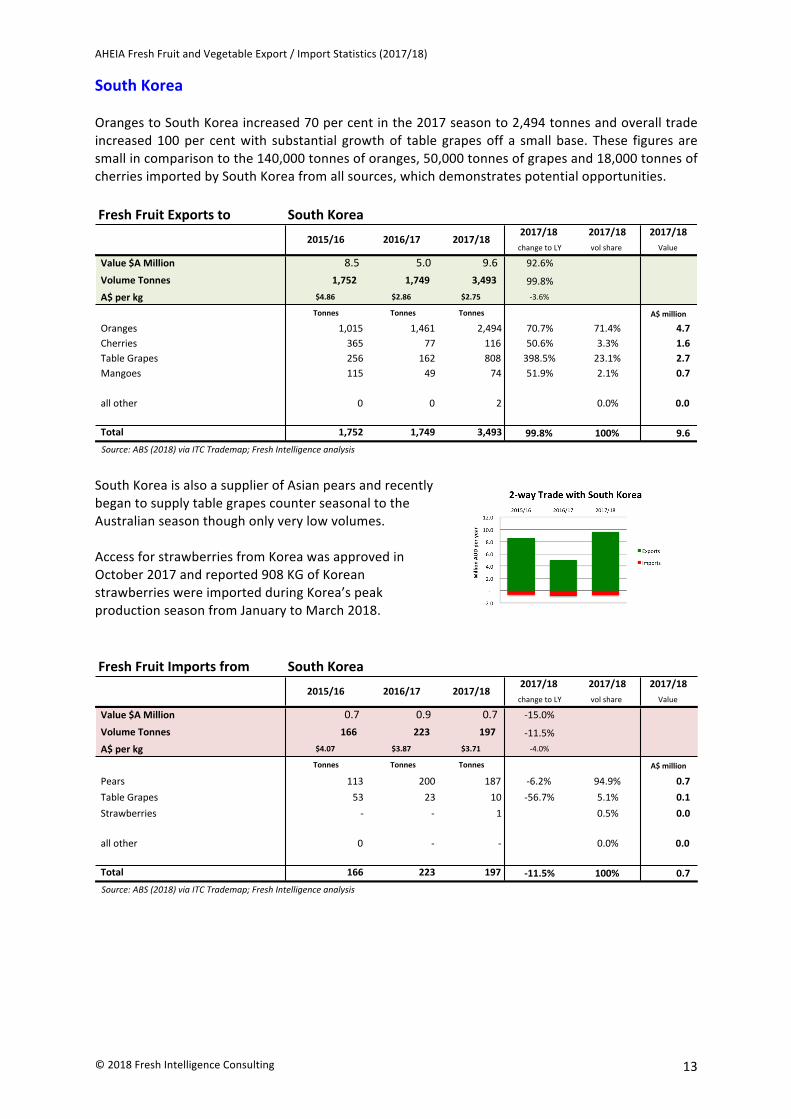
SouthKoreaOrangestoSouthKoreaincreased70percentinthe2017seasonto2,494tonnesandoveralltradeincreased100per centwith substantial growthof table grapesoff a small base. These figures aresmallincomparisontothe140,000tonnesoforanges,50,000tonnesofgrapesand18,000tonnesofcherriesimportedbySouthKoreafromallsources,whichdemonstratespotentialopportunities.
SouthKoreaisalsoasupplierofAsianpearsandrecentlybegantosupplytablegrapescounterseasonaltotheAustralianseasonthoughonlyverylowvolumes.AccessforstrawberriesfromKoreawasapprovedinOctober2017andreported908KGofKoreanstrawberrieswereimportedduringKorea’speakproductionseasonfromJanuarytoMarch2018.
FreshFruitExportsto SouthKorea2017/18 2017/18 2017/18changetoLY volshare Value
Value$AMillion 8.5 5.0 9.6 92.6%VolumeTonnes 1,752 1,749 3,493 99.8%A$perkg $4.86 $2.86 $2.75 -3.6%
Tonnes Tonnes Tonnes A$million
Oranges 1,015 1,461 2,494 70.7% 71.4% 4.7Cherries 365 77 116 50.6% 3.3% 1.6TableGrapes 256 162 808 398.5% 23.1% 2.7Mangoes 115 49 74 51.9% 2.1% 0.7
allother 0 0 2 0.0% 0.0
Total 1,752 1,749 3,493 99.8% 100% 9.6Source:ABS(2018)viaITCTrademap;FreshIntelligenceanalysis
2015/16 2016/17 2017/18
FreshFruitImportsfrom SouthKorea2017/18 2017/18 2017/18changetoLY volshare Value
Value$AMillion 0.7 0.9 0.7 -15.0%VolumeTonnes 166 223 197 -11.5%A$perkg $4.07 $3.87 $3.71 -4.0%
Tonnes Tonnes Tonnes A$million
Pears 113 200 187 -6.2% 94.9% 0.7TableGrapes 53 23 10 -56.7% 5.1% 0.1Strawberries - - 1 0.5% 0.0
allother 0 - - 0.0% 0.0
Total 166 223 197 -11.5% 100% 0.7Source:ABS(2018)viaITCTrademap;FreshIntelligenceanalysis
2015/16 2016/17 2017/18

AHEIAFreshFruitandVegetableExport/ImportStatistics(2017/18)
©2018FreshIntelligenceConsulting 14
MalaysiaMalaysia is amajor export destination forAustralian fruit andenjoys unregulated access formostproducts.Overallgrowthwas11.7percentto20,757tonnesworth$44.7million.OrangesandgrapesleadthetradefromAustraliaandaccountfor77percentsharetheexporttrade.Pearsincreasedfrom24to719tonnes,strawberriesincreased34percentandcherrieswereup116percent.
TaiwanCherries partially recovered from the adverse 2017 season and leads by value in Taiwan. A fewconsignmentsofnectarineswererecorded.Mandarinsdeclined39percentafterasharpincreaseinthepreviousyear.Overall6,650tonnesoffruitwasexportedtoTaiwanworth$17.4million,andwas9.7percentlowerthanlastyearbyvolume.
FreshFruitExportsto Malaysia2017/18 2017/18 2017/18changetoLY volshare Value
Value$AMillion 40.9 39.7 44.7 12.5%
VolumeTonnes 19,252 18,580 20,757 11.7%
A$perkg $2.12 $2.14 $2.15 0.7%
Tonnes Tonnes Tonnes A$million
Oranges 11,991 11,465 13,132 14.5% 63.3% 15.7TableGrapes 3,748 3,691 3,061 -17.1% 14.7% 10.9Avocados 591 900 822 -8.6% 4.0% 5.5Strawberries 248 278 374 34.4% 1.8% 2.7Cherries 219 89 192 116.2% 0.9% 2.4Peaches&nectarines 477 406 664 63.5% 3.2% 2.3Pears 106 24 719 2925.7% 3.5% 1.2Mandarins 668 794 504 -36.5% 2.4% 0.9Plums 214 174 255 46.2% 1.2% 0.9Apples 411 453 355 -21.6% 1.7% 0.5Kiwifruit 44 41 170 309.5% 0.8% 0.5Melons 196 157 264 67.5% 1.3% 0.5
allother 337 109 247 126.0% 1.2% 1.7
Total 19,252 18,580 20,757 11.7% 100% 44.7Source:ABS(2018)viaITCTrademap;FreshIntelligenceanalysis
2015/16 2016/17 2017/18
FreshFruitExportsto Taiwan2017/18 2017/18 2017/18changetoLY volshare Value
Value$AMillion 20.6 17.9 17.4 -2.6%VolumeTonnes 5,111 7,367 6,650 -9.7%A$perkg $4.04 $2.43 $2.62 7.9%
Tonnes Tonnes Tonnes A$million
Cherries 508 165 277 67.7% 4.2% 4.9TableGrapes 1,946 1,374 1,460 6.2% 22.0% 4.6Mandarins 2,125 3,392 2,067 -39.1% 31.1% 4.3Oranges 430 2,398 2,738 14.2% 41.2% 3.2Peaches&nectarines 61 19 98 408.9% 1.5% 0.3Apples 41 1 9 620.6% 0.1% 0.0
allother - 18 - 0.0%
Total 5,111 7,367 6,650 -9.7% 100% 17.4Source:ABS(2018)viaITCTrademap;FreshIntelligenceanalysis
2015/16 2016/17 2017/18

AHEIAFreshFruitandVegetableExport/ImportStatistics(2017/18)
©2018FreshIntelligenceConsulting 15
PhilippinesTrade to the Philippines continued to lift buoyed by the improved access conditions legislated in2012andmosttariffreductionsreachedzero.Volumesexceeded13,300tonnesworth$25.2million,anincreaseofalmost30percent.Tablegrapeslifted46percentandmandarinsby163percent.
AustraliaimportsmangoesfromPhilippinesalthoughthesewerenegligible(2tonnes)in2017/18.
FreshFruitExportsto Philippines2017/18 2017/18 2017/18changetoLY volshare Value
Value$AMillion 20.3 18.8 25.2 33.9%VolumeTonnes 9,794 10,305 13,330 29.4%A$perkg $2.07 $1.83 $1.89 3.5%
Tonnes Tonnes Tonnes A$million
TableGrapes 4,446 3,684 5,385 46.2% 40.4% 15.1Oranges 3,949 5,067 5,213 2.9% 39.1% 5.9Mandarins 1,025 938 2,470 163.2% 18.5% 3.6Lemons&limes 262 218 164 -24.5% 1.2% 0.3Plums 26 12 16 32.3% 0.1% 0.1Cherries 9 3 8 200.7% 0.1% 0.1Peaches&nectarines 14 7 4 -47.7% 0.0% 0.0
allother 64 376 70 -81.4% 0.5% 0.15
Total 9,794 10,305 13,330 29.4% 100% 25.2Source:ABS(2018)viaITCTrademap;FreshIntelligenceanalysis
2015/16 2016/17 2017/18
FreshFruitImportsfrom Philippines2017/18 2017/18 2017/18changetoLY volshare Value
Value$AMillion 2.2 1.2 0.0 -96.2%VolumeTonnes 136 78 2 -96.9%A$perkg $16.04 $16.00 $19.59 22.5%
Tonnes Tonnes Tonnes A$million
Mangoes 136 78 2 -96.9% 100.0% 0.0
Total 136 78 2 -96.9% 100% 1.2Source:ABS(2018)viaITCTrademap;FreshIntelligenceanalysis (++)morethan500%increase
2015/16 2016/17 2017/18
AHEIAFreshFruitandVegetableExport/ImportStatistics(2017/18)
©2018FreshIntelligenceConsulting 16
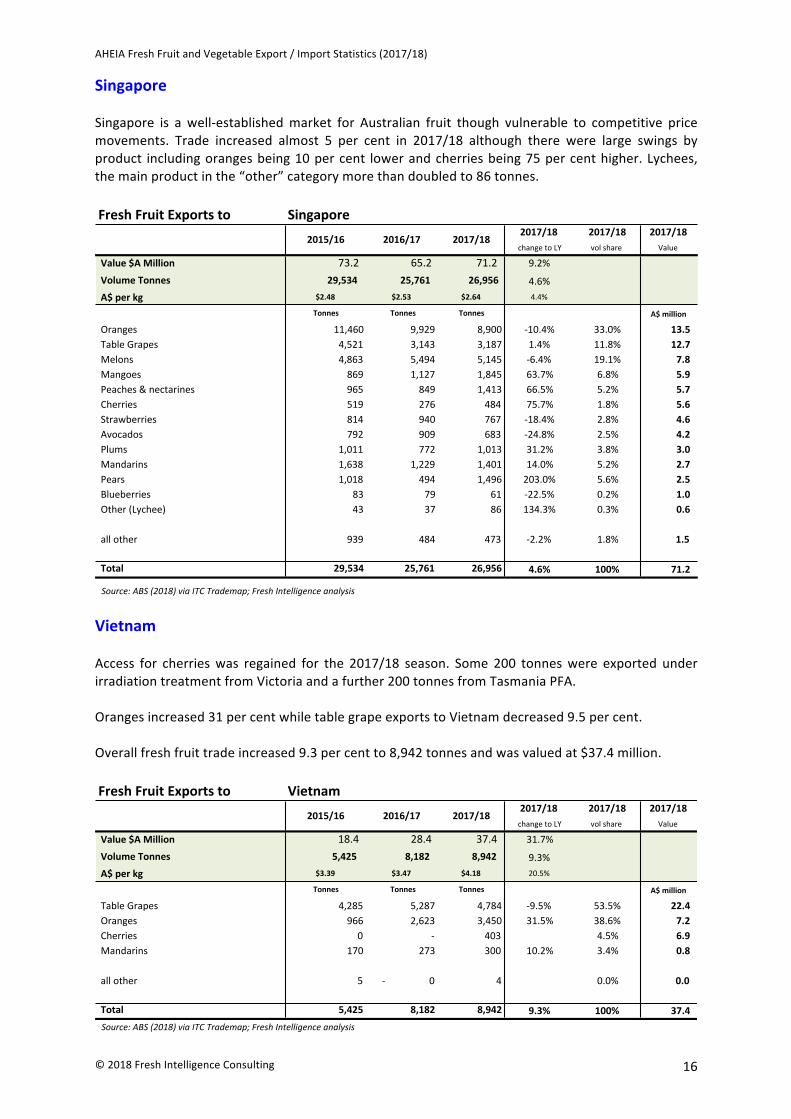
SingaporeSingapore is a well-establishedmarket for Australian fruit though vulnerable to competitive pricemovements. Trade increased almost 5 per cent in 2017/18 although there were large swings byproduct includingorangesbeing10percent lowerandcherriesbeing75percenthigher.Lychees,themainproductinthe“other”categorymorethandoubledto86tonnes.
VietnamAccess for cherrieswas regained for the 2017/18 season. Some 200 tonneswere exported underirradiationtreatmentfromVictoriaandafurther200tonnesfromTasmaniaPFA.Orangesincreased31percentwhiletablegrapeexportstoVietnamdecreased9.5percent.Overallfreshfruittradeincreased9.3percentto8,942tonnesandwasvaluedat$37.4million.
FreshFruitExportsto Singapore2017/18 2017/18 2017/18changetoLY volshare Value
Value$AMillion 73.2 65.2 71.2 9.2%VolumeTonnes 29,534 25,761 26,956 4.6%A$perkg $2.48 $2.53 $2.64 4.4%
Tonnes Tonnes Tonnes A$million
Oranges 11,460 9,929 8,900 -10.4% 33.0% 13.5TableGrapes 4,521 3,143 3,187 1.4% 11.8% 12.7Melons 4,863 5,494 5,145 -6.4% 19.1% 7.8Mangoes 869 1,127 1,845 63.7% 6.8% 5.9Peaches&nectarines 965 849 1,413 66.5% 5.2% 5.7Cherries 519 276 484 75.7% 1.8% 5.6Strawberries 814 940 767 -18.4% 2.8% 4.6Avocados 792 909 683 -24.8% 2.5% 4.2Plums 1,011 772 1,013 31.2% 3.8% 3.0Mandarins 1,638 1,229 1,401 14.0% 5.2% 2.7Pears 1,018 494 1,496 203.0% 5.6% 2.5Blueberries 83 79 61 -22.5% 0.2% 1.0Other(Lychee) 43 37 86 134.3% 0.3% 0.6
allother 939 484 473 -2.2% 1.8% 1.5
Total 29,534 25,761 26,956 4.6% 100% 71.2
Source:ABS(2018)viaITCTrademap;FreshIntelligenceanalysis
2015/16 2016/17 2017/18
FreshFruitExportsto Vietnam2017/18 2017/18 2017/18changetoLY volshare Value
Value$AMillion 18.4 28.4 37.4 31.7%VolumeTonnes 5,425 8,182 8,942 9.3%A$perkg $3.39 $3.47 $4.18 20.5%
Tonnes Tonnes Tonnes A$million
TableGrapes 4,285 5,287 4,784 -9.5% 53.5% 22.4Oranges 966 2,623 3,450 31.5% 38.6% 7.2Cherries 0 - 403 4.5% 6.9Mandarins 170 273 300 10.2% 3.4% 0.8
allother 5 -0 4 0.0% 0.0
Total 5,425 8,182 8,942 9.3% 100% 37.4Source:ABS(2018)viaITCTrademap;FreshIntelligenceanalysis
2015/16 2016/17 2017/18

AHEIAFreshFruitandVegetableExport/ImportStatistics(2017/18)
©2018FreshIntelligenceConsulting 17
ThailandExports to Thailand increased17.5 per cent to 16,958 tonnesworth $51.3million.Mandarins andtable grapes were the main products in demand with strawberries increasing steadily. Cherriesalmostrecoveredto2016levelsaftertheadverse2017season.Tradewith the new protocols requiring cold treatment has been problematic for some industriessince2013,inparticularavocadoswherethecoldtreatmentrequirementeffectivelyshutdownthetrade.
FreshFruitExportsto Thailand2017/18 2017/18 2017/18changetoLY volshare Value
Value$AMillion 45.0 41.8 51.3 22.9%
VolumeTonnes 15,719 14,436 16,958 17.5%
A$perkg $2.87 $2.89 $3.03 4.6%
Tonnes Tonnes Tonnes A$million
Mandarins 7,024 7,884 9,426 19.6% 55.6% 20.7TableGrapes 6,219 4,659 5,263 13.0% 31.0% 20.1Strawberries 224 450 674 49.7% 4.0% 5.6Oranges 1,215 955 1,098 15.0% 6.5% 2.0Cherries 129 45 111 146.9% 0.7% 1.2Blueberries 20 36 28 -22.6% 0.2% 0.6Peaches&nectarines 85 77 95 22.8% 0.6% 0.5Apples 683 150 149 -0.5% 0.9% 0.4Pears 70 94 74 -21.0% 0.4% 0.1Plums 30 43 25 -40.4% 0.2% 0.1
allother 20 42 14 -65.8% 0.1% 0.1
Total 15,719 14,436 16,958 17.5% 100% 51.3Source:ABS(2018)viaITCTrademap;FreshIntelligenceanalysis
2015/16 2016/17 2017/18

AHEIAFreshFruitandVegetableExport/ImportStatistics(2017/18)
©2018FreshIntelligenceConsulting 18
UnitedArabEmiratesTheUAEisamajorexportdestinationandtradinghubfortheMiddleEastregionhoweverexportshavebeendecliningforthepastfewyearsasmoretradeisgoingdirecttoothergulfstatemarketsand/orchasinghigherreturns.
SaudiArabiaExportstoSaudiArabiahaveincreased97percentinfluencedmostlybycitrusthoughmostproductshavegrowth.ThegrowthispartiallydrivenbydirecttraderatherthantransitingthroughUnitedArabEmirates.
FreshFruitExportsto UnitedArabEmirates2017/18 2017/18 2017/18changetoLY volshare Value
Value$AMillion 71.2 59.5 50.0 -16.0%VolumeTonnes 33,472 27,215 24,907 -8.5%A$perkg $2.13 $2.19 $2.01 -8.2%
Tonnes Tonnes Tonnes A$million
TableGrapes 7,043 4,180 2,142 -48.8% 33.0% 6.4Melons 6,294 5,457 6,493 19.0% 100.0% 6.2Mandarins 6,260 4,804 3,845 -20.0% 59.2% 6.6Oranges 8,924 8,414 8,424 0.1% 129.7% 9.0Peaches&nectarines 2,343 1,957 1,773 -9.4% 27.3% 5.9Strawberries 590 760 859 13.1% 13.2% 6.0Mangoes 805 756 918 21.5% 14.1% 3.3Cherries 288 109 91 -16.1% 1.4% 0.9Apples 331 303 35 -88.4% 0.5% 0.1Apricots 232 120 73 -39.2% 1.1% 0.3
allother 360 355 252 -29.0% 1.0% 5.3
Total 33,472 27,215 24,907 -8.5% 100% 50.0Source:ABS(2018)viaITCTrademap;FreshIntelligenceanalysis
2015/16 2016/17 2017/18
FreshFruitExportsto SaudiArabia2017/18 2017/18 2017/18changetoLY volshare Value
Value$AMillion 9.5 10.0 13.6 35.3%VolumeTonnes 3,410 3,489 6,882 97.2%A$perkg $2.78 $2.87 $1.97 -31.4%
Tonnes Tonnes Tonnes A$million
Oranges 764 931 3,715 299.1% 54.0% 3.8Peaches&nectarines 707 991 1,329 34.1% 19.3% 3.1Mandarins 482 386 666 72.5% 9.7% 1.4Mangoes 148 188 281 49.5% 4.1% 1.2Strawberries 118 131 162 23.8% 2.4% 1.1TableGrapes 812 451 313 -30.7% 4.5% 1.0Cherries 98 76 134 75.5% 1.9% 0.8Apricots 151 136 106 -22.0% 1.5% 0.5
allother 130 199 176 -11.4% 2.6% 0.7
Total 3,410 3,489 6,882 97.2% 100% 13.6Source:ABS(2018)viaITCTrademap;FreshIntelligenceanalysis
2015/16 2016/17 2017/18
AHEIAFreshFruitandVegetableExport/ImportStatistics(2017/18)
©2018FreshIntelligenceConsulting 19
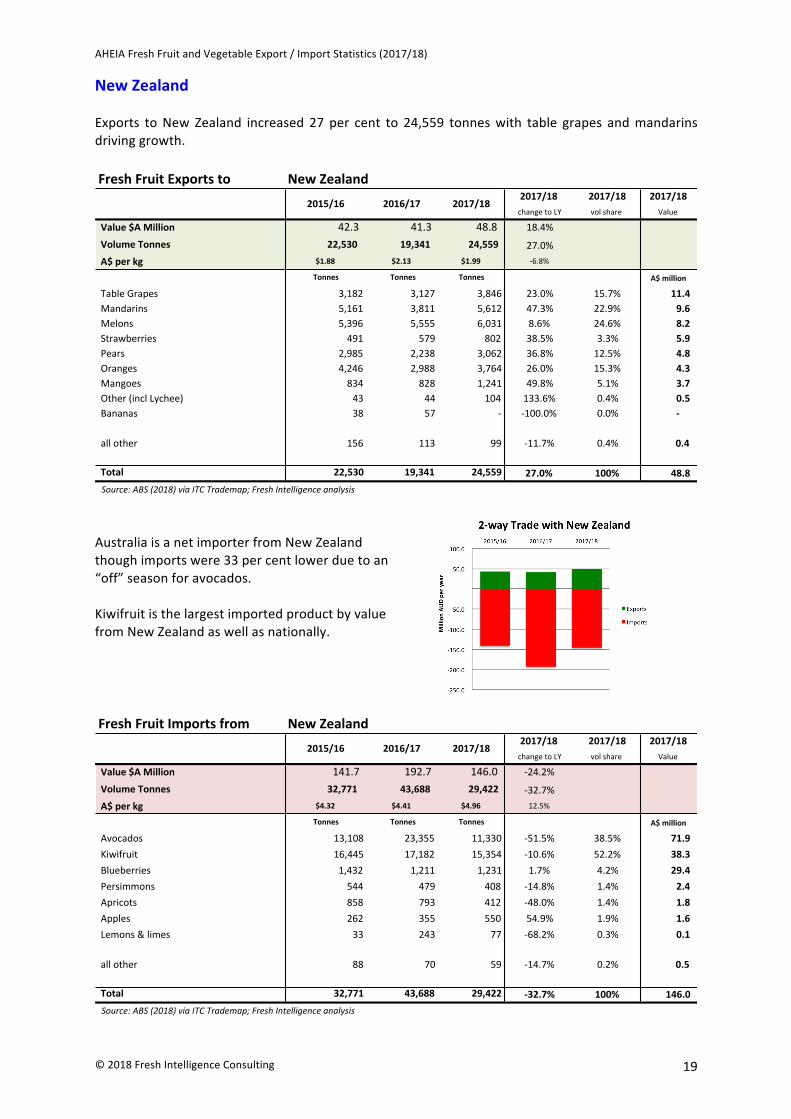
NewZealandExports toNewZealand increased 27 per cent to 24,559 tonneswith table grapes andmandarinsdrivinggrowth.
AustraliaisanetimporterfromNewZealandthoughimportswere33percentlowerduetoan“off”seasonforavocados.KiwifruitisthelargestimportedproductbyvaluefromNewZealandaswellasnationally.
FreshFruitExportsto NewZealand2017/18 2017/18 2017/18
changetoLY volshare Value
Value$AMillion 42.3 41.3 48.8 18.4%VolumeTonnes 22,530 19,341 24,559 27.0%A$perkg $1.88 $2.13 $1.99 -6.8%
Tonnes Tonnes Tonnes A$million
TableGrapes 3,182 3,127 3,846 23.0% 15.7% 11.4
Mandarins 5,161 3,811 5,612 47.3% 22.9% 9.6
Melons 5,396 5,555 6,031 8.6% 24.6% 8.2
Strawberries 491 579 802 38.5% 3.3% 5.9
Pears 2,985 2,238 3,062 36.8% 12.5% 4.8
Oranges 4,246 2,988 3,764 26.0% 15.3% 4.3
Mangoes 834 828 1,241 49.8% 5.1% 3.7
Other(inclLychee) 43 44 104 133.6% 0.4% 0.5
Bananas 38 57 - -100.0% 0.0% -
allother 156 113 99 -11.7% 0.4% 0.4
Total 22,530 19,341 24,559 27.0% 100% 48.8
Source:ABS(2018)viaITCTrademap;FreshIntelligenceanalysis
2015/16 2016/17 2017/18
FreshFruitImportsfrom NewZealand2017/18 2017/18 2017/18
changetoLY volshare Value
Value$AMillion 141.7 192.7 146.0 -24.2%VolumeTonnes 32,771 43,688 29,422 -32.7%A$perkg $4.32 $4.41 $4.96 12.5%
Tonnes Tonnes Tonnes A$million
Avocados 13,108 23,355 11,330 -51.5% 38.5% 71.9
Kiwifruit 16,445 17,182 15,354 -10.6% 52.2% 38.3
Blueberries 1,432 1,211 1,231 1.7% 4.2% 29.4
Persimmons 544 479 408 -14.8% 1.4% 2.4
Apricots 858 793 412 -48.0% 1.4% 1.8
Apples 262 355 550 54.9% 1.9% 1.6
Lemons&limes 33 243 77 -68.2% 0.3% 0.1
allother 88 70 59 -14.7% 0.2% 0.5
Total 32,771 43,688 29,422 -32.7% 100% 146.0
Source:ABS(2018)viaITCTrademap;FreshIntelligenceanalysis
2015/16 2016/17 2017/18

AHEIAFreshFruitandVegetableExport/ImportStatistics(2017/18)
©2018FreshIntelligenceConsulting 20
EuropeTrade to Europe increased 11.3 per cent to 3,504 tonnes driven by Pink Lady® apples to UK andNetherlands, and also kiwifruit to Germany. Other fruits lifted with small opportunistic volumesincludingsummerfruit,mangoesandcherries.
ImportsfromEurope,ofwhich93percentwaskiwifruitfromItalydipped3.2percent.Smallvolumesofcitrus,mostlymandarinsareimportedfromSpain.
FreshFruitExportsto EUROPE2017/18 2017/18 2017/18changetoLY volshare Value
Value$AMillion 7.1 8.6 8.8 1.7%VolumeTonnes 3,465 3,149 3,504 11.3%A$perkg $2.06 $2.75 $2.51 -8.6%
Tonnes Tonnes Tonnes A$million
Apples 699 1,327 1,523 14.7% 43.4% 3.73Kiwifruit 328 705 587 -16.8% 16.7% 1.80Mandarins 2,029 822 797 -3.0% 22.7% 1.25Oranges 208 184 347 88.1% 9.9% 0.79Peaches&nectarines 44 36 67 87.8% 1.9% 0.46Pears 48 - 123 ++ 3.5% 0.13Plums - 5 23 365.5% 0.6% 0.13Cherries 21 2 6 174.4% 0.2% 0.11Mangoes 1 4 8 93.5% 0.2% 0.03Blueberries 11 29 - -100.0% 0.0% -
allother 87 63 25 -60.5% 0.7% 0.35
Total 3,465 3,149 3,504 11.3% 100% 8.79Source:ABS(2018)viaITCTrademap;FreshIntelligenceanalysis
2015/16 2016/17 2017/18
FreshFruitImportsfrom EUROPE2017/18 2017/18 2017/18changetoLY volshare Value
Value$AMillion 13.5 12.7 17.0 33.8%VolumeTonnes 8,077 7,058 6,834 -3.2%A$perkg $1.67 $1.80 $2.49 38.2%
Tonnes Tonnes Tonnes A$million
Kiwifruit 7,387 6,969 6,348 -8.9% 92.9% 16.1Mandarins 445 23 389 1571.5% 5.7% 0.8Lemons&limes 196 20 23 14.9% 0.3% 0.0Oranges 50 45 72 59.1% 1.1% 0.1
Total 8,077 7,058 6,834 -3.2% 100% 17.0Source:ABS(2018)viaITCTrademap;FreshIntelligenceanalysis
2015/16 2016/17 2017/18
AHEIAFreshFruitandVegetableExport/ImportStatistics(2017/18)
©2018FreshIntelligenceConsulting 21
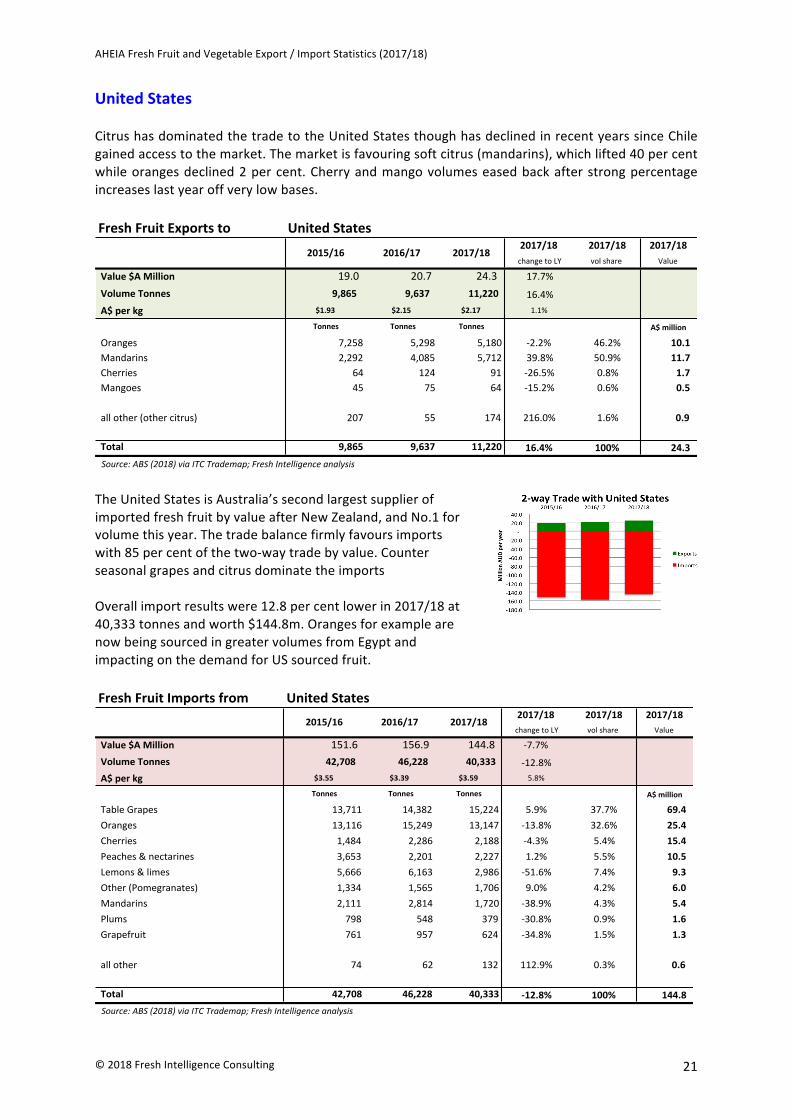
UnitedStatesCitrushasdominatedthetradetotheUnitedStatesthoughhasdeclinedinrecentyearssinceChilegainedaccesstothemarket.Themarketisfavouringsoftcitrus(mandarins),whichlifted40percentwhileorangesdeclined2percent.Cherryandmangovolumeseasedbackafterstrongpercentageincreaseslastyearoffverylowbases.
TheUnitedStatesisAustralia’ssecondlargestsupplierofimportedfreshfruitbyvalueafterNewZealand,andNo.1forvolumethisyear.Thetradebalancefirmlyfavoursimportswith85percentofthetwo-waytradebyvalue.CounterseasonalgrapesandcitrusdominatetheimportsOverallimportresultswere12.8percentlowerin2017/18at40,333tonnesandworth$144.8m.OrangesforexamplearenowbeingsourcedingreatervolumesfromEgyptandimpactingonthedemandforUSsourcedfruit.
FreshFruitExportsto UnitedStates2017/18 2017/18 2017/18changetoLY volshare Value
Value$AMillion 19.0 20.7 24.3 17.7%VolumeTonnes 9,865 9,637 11,220 16.4%A$perkg $1.93 $2.15 $2.17 1.1%
Tonnes Tonnes Tonnes A$million
Oranges 7,258 5,298 5,180 -2.2% 46.2% 10.1Mandarins 2,292 4,085 5,712 39.8% 50.9% 11.7Cherries 64 124 91 -26.5% 0.8% 1.7Mangoes 45 75 64 -15.2% 0.6% 0.5
allother(othercitrus) 207 55 174 216.0% 1.6% 0.9
Total 9,865 9,637 11,220 16.4% 100% 24.3Source:ABS(2018)viaITCTrademap;FreshIntelligenceanalysis
2015/16 2016/17 2017/18
FreshFruitImportsfrom UnitedStates2017/18 2017/18 2017/18changetoLY volshare Value
Value$AMillion 151.6 156.9 144.8 -7.7%VolumeTonnes 42,708 46,228 40,333 -12.8%A$perkg $3.55 $3.39 $3.59 5.8%
Tonnes Tonnes Tonnes A$million
TableGrapes 13,711 14,382 15,224 5.9% 37.7% 69.4Oranges 13,116 15,249 13,147 -13.8% 32.6% 25.4Cherries 1,484 2,286 2,188 -4.3% 5.4% 15.4Peaches&nectarines 3,653 2,201 2,227 1.2% 5.5% 10.5Lemons&limes 5,666 6,163 2,986 -51.6% 7.4% 9.3Other(Pomegranates) 1,334 1,565 1,706 9.0% 4.2% 6.0Mandarins 2,111 2,814 1,720 -38.9% 4.3% 5.4Plums 798 548 379 -30.8% 0.9% 1.6Grapefruit 761 957 624 -34.8% 1.5% 1.3
allother 74 62 132 112.9% 0.3% 0.6
Total 42,708 46,228 40,333 -12.8% 100% 144.8Source:ABS(2018)viaITCTrademap;FreshIntelligenceanalysis
2015/16 2016/17 2017/18

AHEIAFreshFruitandVegetableExport/ImportStatistics(2017/18)
©2018FreshIntelligenceConsulting 22
CanadaAlthough Canada declined by 5.3 per cent there were large differences between products. PearexportstoCanadajumped80percentforthebestresultinadecadewhilecitrusdeclinedaround18percentoverall.Mangoes,cherriesandplumsallrecordedincreasesoffsmallbases.
FreshFruitExportsto Canada2017/18 2017/18 2017/18
changetoLY volshare Value
Value$AMillion 10.0 13.7 14.0 1.6%VolumeTonnes 5,524 8,133 7,700 -5.3%A$perkg $1.81 $1.69 $1.81 7.4%
Tonnes Tonnes Tonnes A$million
Oranges 3,394 5,765 4,782 -17.0% 11444.0% 6.9
Pears 998 855 1,540 80.1% 3686.1% 2.9
Peaches&nectarines 48 281 245 -12.7% 97.7% 1.0
Mandarins 612 638 486 -23.8% 193.7% 0.9
Mangoes 142 92 143 55.2% 56.9% 0.7
Grapefruit 48 153 251 63.7% 100.0% 0.4
Apples - 2 42 ++ 16.7% 0.2
Cherries 55 3 15 388.5% 5.9% 0.2
Lemons&limes 147 148 111 -25.3% 44.1% 0.1
Plums 6 20 30 53.7% 12.1% 0.1
allother 74 175 55 -68.8% 0.7% 0.6
Total 5,524 8,133 7,700 -5.3% 100% 14.0
Source:ABS(2018)viaITCTrademap;FreshIntelligenceanalysis
2015/16 2016/17 2017/18

AHEIAFreshFruitandVegetableExport/ImportStatistics(2017/18)
©2018FreshIntelligenceConsulting 23
EgyptEgypthasfurtherstrengtheneditsimpactinthecitrustradeandsupplied7,846tonnesofcitrusworth$9.8min2017/18.Thiswasanincreaseof10.7percentbyvolume.
TherearenorecordedexportstoEgypt.
IsraelIsraelhasalsostartedtomakeastrongerimpactinthecitrustradeandsupplied1,385tonnesofcitrusworth$2.5min2017/18,anincreaseof12.7percentonthepreviousyear.
TherearenorecordedexportstoIsrael.
FreshFruitImportsfrom Egypt2017/18 2017/18 2017/18changetoLY volshare Value
Value$AMillion 2.2 9.2 9.8 6.8%VolumeTonnes 1,685 7,085 7,846 10.7%A$perkg $1.28 $1.30 $1.25 -3.6%
Tonnes Tonnes Tonnes A$million
Oranges 987 4,855 4,572 -5.8% 58.3% 4.5Lemons&limes 563 1,367 1,651 20.8% 21.0% 2.9Mandarins 136 862 1,425 65.2% 18.2% 2.2
allother - - 199 2.5% 0.2
Total 1,685 7,085 7,846 10.7% 100% 9.8Source:ABS(2018)viaITCTrademap;FreshIntelligenceanalysis
2015/16 2016/17 2017/18
FreshFruitImportsfrom Israel2017/18 2017/18 2017/18changetoLY volshare Value
Value$AMillion 2.0 2.0 2.5 23.9%VolumeTonnes 1,206 1,228 1,385 12.7%A$perkg $1.69 $1.67 $1.83 9.9%
Tonnes Tonnes Tonnes A$million
Mandarins 647 597 682 14.1% 49.2% 1.3Grapefruit 275 320 374 17.0% 27.0% 0.8Oranges 282 310 325 4.7% 23.5% 0.4
allother 1 1 4 435.4% 0.3% 0.0
Total 1,206 1,228 1,385 12.7% 100% 2.5Source:ABS(2018)viaITCTrademap;FreshIntelligenceanalysis
2015/16 2016/17 2017/18

AHEIAFreshFruitandVegetableExport/ImportStatistics(2017/18)
©2018FreshIntelligenceConsulting 24
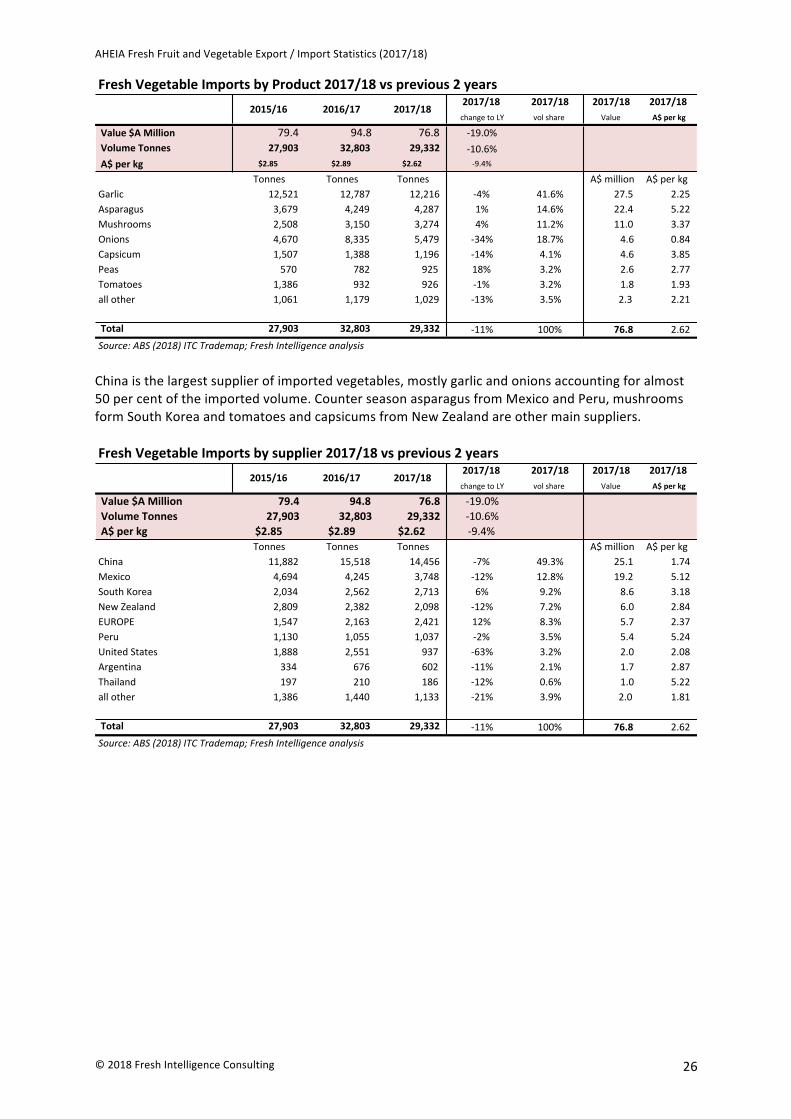
FreshVegetableExportsandImportsAustralianvegetableexportsincreased9percentbyvolumeto208,505tonnesin2017/18worth$262million.Carrotscontributedto54percentofthevolume,followedbypotatoesandonions.Asparaguswasthesecondlargestvegetableexportbyvaluealthoughfalling24percentinvolume.Therewasstrongvolumegrowthacrosssomeofthesmallervegetablelinesincludingbroccoli,beansandcelery.OnionsrecoveredsomeofthedeclinesofthepreviousyearalthoughwellbehindearlieryearswithaslowdownindemandfromEurope.AlltheoniongainsweremadeinAsianmarkets.The“allothercategory”includeshighvaluemushroomsandtruffles.
FreshVegetableExportbyProduct2017/18vsprevious2years2017/18 2017/18 2017/18 2017/18changetoLY volshare Value A$perkg
Value$AMillion 205.9 254.1 262.4 3.3%VolumeTonnes 208,237 191,652 208,505 8.8%A$perkg $0.99 $1.33 $1.26 -5.1%
Tonnes Tonnes Tonnes A$million A$perkgCarrots 100,214 103,335 111,833 8% 53.6% 97.8 0.87Asparagus 4,086 5,056 3,819 -24% 1.8% 28.7 7.52Potatoes(fresh) 37,212 34,800 37,343 7% 17.9% 28.6 0.77Onions 43,888 24,825 31,831 28% 15.3% 22.5 0.71Cauliflower&Broccoli 6,106 5,717 6,866 20% 3.3% 18.3 2.67Lettuce 1,315 1,503 1,377 -8% 0.7% 9.6 6.94Beans 1,787 1,603 1,856 16% 0.9% 7.8 4.21Celery 3,557 3,913 4,693 20% 2.3% 7.4 1.58OtherBrassicas 2,118 2,631 2,575 -2% 1.2% 3.3 1.28Tomatoes 939 530 828 56% 0.4% 3.1 3.77Pumpkins&Squash 1,869 2,089 2,121 1% 1.0% 3.1 1.45Capsicum 484 351 353 1% 0.2% 1.4 3.89allother 4,663 5,299 3,010 -43% 1.4% 30.8 10.21
Total 208,237 191,652 208,505 9% 100% 262.4 1.26Source:ABS(2018)ITCTrademap;FreshIntelligenceanalysis
2015/16 2016/17 2017/18
Carrots37%
Asparagus11%
Potatoes(fresh)11%
Onions9%Cauliflower&
Broccoli7%
LeAuce4%
Beans3%
Celery3%
OtherBrassicas1%
Tomatoes1%
Other13%
FreshVegetableExportsbyValue
AHEIAFreshFruitandVegetableExport/ImportStatistics(2017/18)
©2018FreshIntelligenceConsulting 25
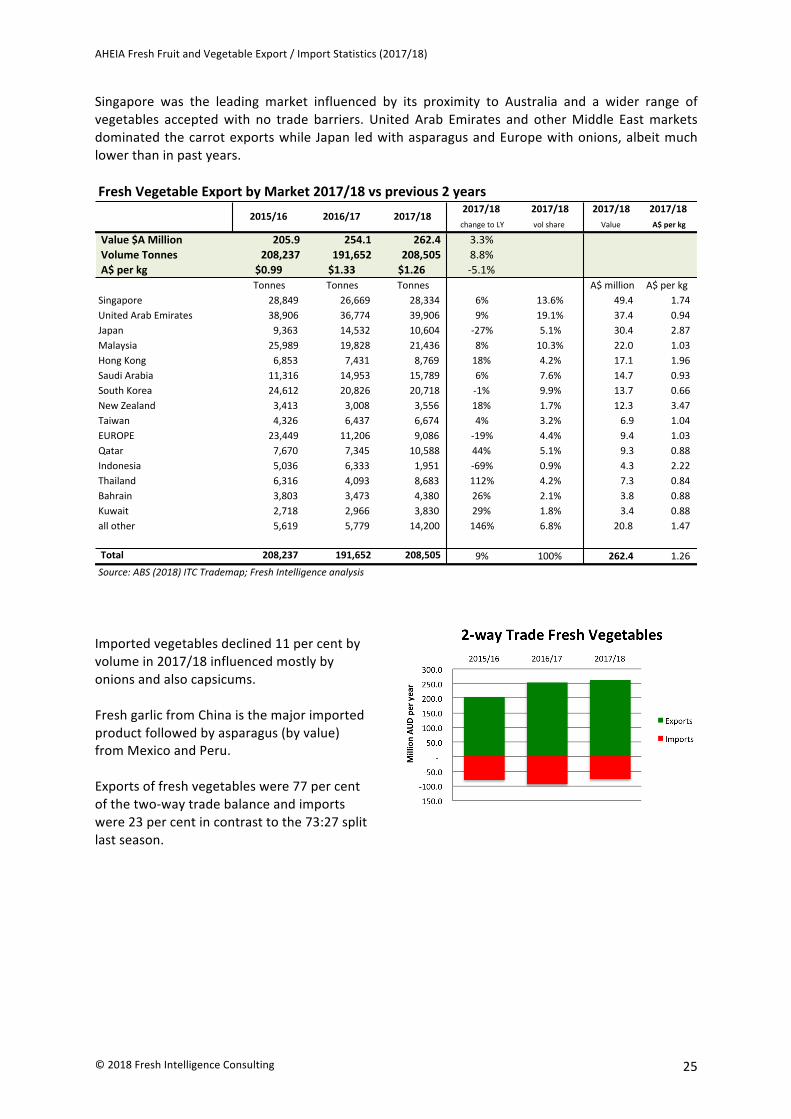
Singapore was the leading market influenced by its proximity to Australia and a wider range ofvegetables acceptedwith no trade barriers. United Arab Emirates and otherMiddle Eastmarketsdominatedthecarrotexportswhile Japan ledwithasparagusandEuropewithonions,albeitmuchlowerthaninpastyears.
Importedvegetablesdeclined11percentbyvolumein2017/18influencedmostlybyonionsandalsocapsicums.FreshgarlicfromChinaisthemajorimportedproductfollowedbyasparagus(byvalue)fromMexicoandPeru.Exportsoffreshvegetableswere77percentofthetwo-waytradebalanceandimportswere23percentincontrasttothe73:27splitlastseason.
FreshVegetableExportbyMarket2017/18vsprevious2years2017/18 2017/18 2017/18 2017/18changetoLY volshare Value A$perkg
Value$AMillion 205.9 254.1 262.4 3.3%VolumeTonnes 208,237 191,652 208,505 8.8%A$perkg $0.99 $1.33 $1.26 -5.1%
Tonnes Tonnes Tonnes A$million A$perkgSingapore 28,849 26,669 28,334 6% 13.6% 49.4 1.74UnitedArabEmirates 38,906 36,774 39,906 9% 19.1% 37.4 0.94Japan 9,363 14,532 10,604 -27% 5.1% 30.4 2.87Malaysia 25,989 19,828 21,436 8% 10.3% 22.0 1.03HongKong 6,853 7,431 8,769 18% 4.2% 17.1 1.96SaudiArabia 11,316 14,953 15,789 6% 7.6% 14.7 0.93SouthKorea 24,612 20,826 20,718 -1% 9.9% 13.7 0.66NewZealand 3,413 3,008 3,556 18% 1.7% 12.3 3.47Taiwan 4,326 6,437 6,674 4% 3.2% 6.9 1.04EUROPE 23,449 11,206 9,086 -19% 4.4% 9.4 1.03Qatar 7,670 7,345 10,588 44% 5.1% 9.3 0.88Indonesia 5,036 6,333 1,951 -69% 0.9% 4.3 2.22Thailand 6,316 4,093 8,683 112% 4.2% 7.3 0.84Bahrain 3,803 3,473 4,380 26% 2.1% 3.8 0.88Kuwait 2,718 2,966 3,830 29% 1.8% 3.4 0.88allother 5,619 5,779 14,200 146% 6.8% 20.8 1.47
Total 208,237 191,652 208,505 9% 100% 262.4 1.26Source:ABS(2018)ITCTrademap;FreshIntelligenceanalysis
2015/16 2016/17 2017/18
AHEIAFreshFruitandVegetableExport/ImportStatistics(2017/18)
©2018FreshIntelligenceConsulting 26
Chinaisthelargestsupplierofimportedvegetables,mostlygarlicandonionsaccountingforalmost50percentoftheimportedvolume.CounterseasonasparagusfromMexicoandPeru,mushroomsformSouthKoreaandtomatoesandcapsicumsfromNewZealandareothermainsuppliers.
FreshVegetableImportsbyProduct2017/18vsprevious2years2017/18 2017/18 2017/18 2017/18changetoLY volshare Value A$perkg
Value$AMillion 79.4 94.8 76.8 -19.0%VolumeTonnes 27,903 32,803 29,332 -10.6%A$perkg $2.85 $2.89 $2.62 -9.4%
Tonnes Tonnes Tonnes A$million A$perkgGarlic 12,521 12,787 12,216 -4% 41.6% 27.5 2.25Asparagus 3,679 4,249 4,287 1% 14.6% 22.4 5.22Mushrooms 2,508 3,150 3,274 4% 11.2% 11.0 3.37Onions 4,670 8,335 5,479 -34% 18.7% 4.6 0.84Capsicum 1,507 1,388 1,196 -14% 4.1% 4.6 3.85Peas 570 782 925 18% 3.2% 2.6 2.77Tomatoes 1,386 932 926 -1% 3.2% 1.8 1.93allother 1,061 1,179 1,029 -13% 3.5% 2.3 2.21
Total 27,903 32,803 29,332 -11% 100% 76.8 2.62Source:ABS(2018)ITCTrademap;FreshIntelligenceanalysis
2015/16 2016/17 2017/18
FreshVegetableImportsbysupplier2017/18vsprevious2years2017/18 2017/18 2017/18 2017/18changetoLY volshare Value A$perkg
Value$AMillion 79.4 94.8 76.8 -19.0%VolumeTonnes 27,903 32,803 29,332 -10.6%A$perkg $2.85 $2.89 $2.62 -9.4%
Tonnes Tonnes Tonnes A$million A$perkgChina 11,882 15,518 14,456 -7% 49.3% 25.1 1.74Mexico 4,694 4,245 3,748 -12% 12.8% 19.2 5.12SouthKorea 2,034 2,562 2,713 6% 9.2% 8.6 3.18NewZealand 2,809 2,382 2,098 -12% 7.2% 6.0 2.84EUROPE 1,547 2,163 2,421 12% 8.3% 5.7 2.37Peru 1,130 1,055 1,037 -2% 3.5% 5.4 5.24UnitedStates 1,888 2,551 937 -63% 3.2% 2.0 2.08Argentina 334 676 602 -11% 2.1% 1.7 2.87Thailand 197 210 186 -12% 0.6% 1.0 5.22allother 1,386 1,440 1,133 -21% 3.9% 2.0 1.81
Total 27,903 32,803 29,332 -11% 100% 76.8 2.62Source:ABS(2018)ITCTrademap;FreshIntelligenceanalysis
2015/16 2016/17 2017/18

AHEIAFreshFruitandVegetableExport/ImportStatistics(2017/18)
©2018FreshIntelligenceConsulting 27
SingaporeSingaporeisthelargestexportdestination(byvalue)forAustralianfreshvegetablesandissuppliedwith a much wider range than other markets. Singapore relies almost 100 per cent on importedproducetomeettheneedsofits7millionconsumers.Fresh vegetable exports to Singapore have increased 6.2 per cent to 28,334 tonnes worth $49.4millionwithcarrotsaccountingforalmosthalfthevolume.Arangeofsmaller,highervaluelinessuchasceleryandheadlettucerecordedstronggainsofsmallbases.
IndonesiaTradetoIndonesiadropped69percentto1,951tonnesduetoaccessissueswithpotatoes.Mostotherlineslessthan100tonnesandcarrotshavealmostdisappeared.
FreshVegetableExportsto Singapore2017/18 2017/18 2017/18changetoLY volshare Value
Value$AMillion 40.9 45.5 49.4 8.6%
VolumeTonnes 28,849 26,669 28,334 6.2%
A$perkg $1.42 $1.71 $1.74 2.2%
Tonnes Tonnes Tonnes A$million
Carrots 14,733 13,292 13,613 2.4% 48.0% 12.5Broccoli 4,128 4,227 4,889 15.7% 17.3% 12.5Lettuce 317 471 618 31.2% 2.2% 4.4Potatoes 1,645 1,707 1,876 9.9% 6.6% 2.7Celery 854 1,250 1,956 56.5% 6.9% 2.6Asparagus 346 307 313 2.2% 1.1% 2.2Pumpkins&squash 1,349 1,527 1,625 6.5% 5.7% 2.1HeadLettuce 166 118 323 172.7% 1.1% 1.2Tomatoes 154 138 222 60.9% 0.8% 1.1Onions 1,948 747 1,219 63.2% 4.3% 0.9Cabbages&brassicas 1,183 995 477 -52.1% 1.7% 0.7Spinach 50 48 67 41.0% 0.2% 0.5BrusselsSprouts 59 38 38 -1.4% 0.1% 0.2
allother 1,915 1,805 1,098 -39.2% 3.9% 5.7
Total 28,849 26,669 28,334 6.2% 100% 49.4Source:ABS(2018)viaITCTrademap;FreshIntelligenceanalysis
2015/16 2016/17 2017/18
FreshVegetableExportsto Indonesia2017/18 2017/18 2017/18changetoLY volshare Value
Value$AMillion 6.5 6.2 4.4 -29.8%VolumeTonnes 5,036 6,333 1,951 -69.2%A$perkg $1.29 $0.98 $2.23 127.8%
Tonnes Tonnes Tonnes A$million
Potatoes 1,980 5,278 1,366 -74.1% 70.0% 1.2Lettuce 52 90 67 -25.1% 3.5% 0.4Cabbages&brassicas 92 92 83 -9.3% 4.3% 0.3Tomatoes 38 30 33 12.1% 1.7% 0.2Broccoli 46 89 43 -51.8% 2.2% 0.2HeadLettuce 116 16 28 80.0% 1.4% 0.1Onions 234 338 182 -46.2% 9.3% 0.1Pumpkins&squash 96 86 49 -43.5% 2.5% 0.1Celery 50 74 55 -25.7% 2.8% 0.1Spinach 13 14 15 8.4% 0.8% 0.1Carrots 2,192 188 1 -99.3% 0.1% 0.0
allother 127 39 29 -26.5% 1.5% 1.5
Total 5,036 6,333 1,951 -69.2% 100% 4.4Source:ABS(2018)viaITCTrademap;FreshIntelligenceanalysis
2015/16 2016/17 2017/18

AHEIAFreshFruitandVegetableExport/ImportStatistics(2017/18)
©2018FreshIntelligenceConsulting 28
JapanExportstoJapandecreased27percentwithfallsof16–30percentinthemajorlinesandover90percentfallsinthesmallerlinesthathadbeenshowingsomepromisinggrowth.JapanisthemainexportmarketforAustralianasparagus.
SouthKoreaPotatoes account for 99per centofAustralian fresh vegetable exports to SouthKorea.Under theKAFTA (KoreaAustralia Free TradeAgreement) sinceDecember 2014Australia as a seasonal tarifffreeaccessforchippingpotatoesfromDecembertoAprilandthisoutcomehashelpeddriveexportvolumes.TheUnitedStatesistheonlyotherpotatosupplierandAustraliaholds60percentshareofthepotatoimportsforprocessing.Overall South Korea’s imports of fresh vegetables from all sources were 337,000 tonnes, withcarrots,mostlyfromChinaaccountingfor30percentofthetotalimportsoffreshvegetables.
Australiaimported2,709tonnesofmushroomsfromSouthKoreaworth$8.4million.
FreshVegetableExportsto Japan2017/18 2017/18 2017/18
changetoLY volshare Value
Value$AMillion 20.4 34.3 30.4 -11.2%VolumeTonnes 9,363 14,532 10,604 -27.0%A$perkg $2.17 $2.36 $2.87 21.7%
Tonnes Tonnes Tonnes A$million
Asparagus 3,222 4,085 2,861 -30.0% 27.0% 21.4
Onions 4,364 5,494 4,223 -23.1% 39.8% 3.3
Carrots 1,084 3,875 3,223 -16.8% 30.4% 3.0
Broccoli 479 812 159 -80.4% 1.5% 0.4
BrusselsSprouts 62 69 69 0.4% 0.7% 0.3
Leeks 57 57 34 -40.6% 0.3% 0.1
Celery 76 64 3 -95.8% 0.0% 0.0
Pumpkins&squash 13 47 4 -92.2% 0.0% 0.0
allother 5 29 29 -0.4% 0.3% 2.0
Total 9,363 14,532 10,604 -27.0% 100% 30.4
Source:ABS(2018)viaITCTrademap;FreshIntelligenceanalysis
2015/16 2016/17 2017/18
FreshVegetableExportsto SouthKorea2017/18 2017/18 2017/18
changetoLY volshare Value
Value$AMillion 15.0 13.2 13.7 3.9%VolumeTonnes 24,612 20,826 20,718 -0.5%A$perkg $0.61 $0.63 $0.66 4.4%
Tonnes Tonnes Tonnes A$million
Potatoes 24,269 20,634 20,519 -0.6% 99.0% 12.5
Asparagus 87 105 92 -12.2% 0.4% 0.7
BrusselsSprouts 113 83 104 25.9% 0.5% 0.4
Carrots 143 0 3 ++ 0.0% 0.0
allother 1 4 - 0.0% 0.0
Total 24,612 20,826 20,718 -0.5% 100% 13.7
Source:ABS(2018)viaITCTrademap;FreshIntelligenceanalysis
2015/16 2016/17 2017/18

AHEIAFreshFruitandVegetableExport/ImportStatistics(2017/18)
©2018FreshIntelligenceConsulting 29
MalaysiaMalaysia imports a wide range of vegetable products from Australia. The trade has reduced toaround20,000tonnesfromover60,000tonnesadecadeagoduetotheinfluenceofcheaperexportsfromChinaexports.Carrotsarethemainproductsuppliedwithover70percentshareofexports.In2017/18seasonexports lifted8.1percentto21,346tonneswithgoodgrowthfromcarrotsandalsosmallerlinesbroccoliandpumpkins.
HongKongExportsoffreshvegetablestoHongKongincreased18percentin2018to8,769tonneswithastronglift in onions, broccoli and lettuce. Very little, if any, fresh vegetables are re exported fromHongKongtoChinaincontrasttothefreshfruitpositionaccordingtoHongKongCustomsdata.
FreshVegetableExportsto Malaysia2017/18 2017/18 2017/18changetoLY volshare Value
Value$AMillion 22.0 20.9 22.0 5.6%VolumeTonnes 25,989 19,828 21,436 8.1%A$perkg $0.85 $1.05 $1.03 -2.3%
Tonnes Tonnes Tonnes A$million
Carrots 14,724 14,084 15,162 7.6% 70.7% 12.8Celery 2,149 1,915 1,921 0.3% 9.0% 2.7Potatoes 2,481 1,694 1,646 -2.8% 7.7% 2.0Onions 5,972 1,464 1,976 35.0% 9.2% 1.2Broccoli 210 212 302 42.5% 1.4% 0.9Pumpkins&squash 90 122 161 31.7% 0.7% 0.4Lettuce 87 95 74 -22.3% 0.3% 0.3Cabbages&brassicas 42 34 59 73.4% 0.3% 0.2Asparagus 24 36 33 -7.4% 0.2% 0.2
allother 212 172 102 -40.5% 0.5% 1.3
Total 25,989 19,828 21,436 8.1% 100% 22.0Source:ABS(2018)viaITCTrademap;FreshIntelligenceanalysis
2015/16 2016/17 2017/18
FreshVegetableExportsto HongKong2017/18 2017/18 2017/18
changetoLY volshare Value
Value$AMillion 7.3 15.7 17.2 9.7%VolumeTonnes 6,853 7,431 8,769 18.0%A$perkg $1.06 $2.11 $1.96 -7.1%
Tonnes Tonnes Tonnes A$million
Carrots 3,220 3,427 3,467 1.2% 39.5% 3.3
Lettuce 221 279 382 36.8% 4.4% 2.9
Potatoes 1,544 1,342 1,463 9.0% 16.7% 2.1
Asparagus 165 262 224 -14.4% 2.6% 2.0
Onions 986 882 2,037 131.0% 23.2% 1.5
Broccoli 96 149 223 50.3% 2.5% 0.8
Spinach 44 43 45 3.2% 0.5% 0.3
Celery 47 130 148 13.8% 1.7% 0.3
Pumpkins&squash 89 91 111 22.6% 1.3% 0.2
Tomatoes 67 45 46 2.1% 0.5% 0.2
allother 374 780 623 -20.2% 7.1% 3.7
Total 6,853 7,431 8,769 18.0% 100% 17.2
Source:ABS(2018)viaITCTrademap;FreshIntelligenceanalysis
2015/16 2016/17 2017/18

AHEIAFreshFruitandVegetableExport/ImportStatistics(2017/18)
©2018FreshIntelligenceConsulting 30
ChinaNinetonnesofasparaguswastheonlyrecordedfreshvegetableexporttoChinain2017/18.Chinaimportedaround5,000tonnesfromallsourcesincontrastto5milliontonnesexported.
Chinaisasupplierofgarlic,peasandonionstoAustralia.TheseimportsfromChinadeclined6.8percentto14,456tonnes,mostlygarlicandonionswithasmallvolumeofAsianstylefreshpeas.
Thetwo-waytradebalancewasheavilyimportweightedwith99.9percentand0.1percentexported.
FreshVegetableExportsto China2017/18 2017/18 2017/18changetoLY volshare Value
Value$AMillion 0.1 0.2 0.1 -72.3%VolumeTonnes 11 51 9 -82.9%A$perkg $4.88 $3.59 $5.84 62.3%
Tonnes Tonnes Tonnes A$million
Asparagus 11 5 9 100.0% 0.05Cabbages&brassicas - 17 - -100.0% 0.0% -
allother - 29 - 0.0% -
Total 11 51 9 -82.9% 100% 0.05Source:ABS(2018)viaITCTrademap;FreshIntelligenceanalysis
2015/16 2016/17 2017/18
FreshVegetableImportsfrom China2017/18 2017/18 2017/18
changetoLY volshare Value
Value$AMillion 29.7 37.2 25.1 -32.4%VolumeTonnes 11,882 15,518 14,456 -6.8%A$perkg $2.50 $2.39 $1.74 -27.4%
Tonnes Tonnes Tonnes A$million
Garlic 8,415 8,759 9,417 7.5% 65.1% 18.0
Onions 2,272 5,684 3,740 -34.2% 25.9% 2.5
Mushrooms 377 485 526 8.5% 3.6% 2.4
Peas 440 452 483 6.8% 3.3% 1.9
allother 378 138 290 110.6% 2.0% 0.4
Total 11,882 15,518 14,456 -6.8% 100% 25.1
Source:ABS(2018)viaITCTrademap;FreshIntelligenceanalysis
2015/16 2016/17 2017/18
-40.0
-35.0
-30.0
-25.0
-20.0
-15.0
-10.0
-5.0
-
5.02014/15 2015/16 2016/17
MillionAU
Dpe
ryear
2-wayTradewithChina
Exports
Imports

AHEIAFreshFruitandVegetableExport/ImportStatistics(2017/18)
©2018FreshIntelligenceConsulting 31
ThailandTrade to Thailand increased112per cent to 8,683 tonneswith a strong lift in carrots, onions andpotatoestofinishhigherthantheprevious2seasons.
TaiwanOnionexportstoTaiwanincreased144percentandaccountedfor82percentofthetotalimports.Despitethelargeincreaseoveralltradelifted3.2percentafterstrongdemandforcarrotsin2016/17followingthetyphoondamageabated.
Taiwansupplied15.3tonnesofmushroomsastheonlyimportproductrecorded.Thiswas5tonneslessthanlastyear.
FreshVegetableExportsto Thailand2017/18 2017/18 2017/18changetoLY volshare Value
Value$AMillion 4.8 4.4 7.3 66.8%VolumeTonnes 6,316 4,093 8,683 112.1%A$perkg $0.76 $1.06 $0.84 -21.4%
Tonnes Tonnes Tonnes A$million
Carrots 2,991 2,225 3,273 47.1% 37.7% 2.7Onions 2,629 1,125 3,201 184.5% 36.9% 1.9Potatoes 500 500 2,000 300.0% 23.0% 1.1Lettuce 35 62 55 -11.2% 0.6% 0.5Broccoli 88 83 88 6.2% 1.0% 0.3Spinach 17 14 13 -2.0% 0.2% 0.2Celery 22 36 39 8.6% 0.5% 0.1
allother 33 48 13 -72.8% 0.2% 0.5
Total 6,316 4,093 8,683 112.1% 100% 7.3Source:ABS(2018)viaITCTrademap;FreshIntelligenceanalysis
2015/16 2016/17 2017/18
FreshVegetableExportsto Taiwan2017/18 2017/18 2017/18changetoLY volshare Value
Value$AMillion 5.1 8.3 6.9 -16.9%VolumeTonnes 4,326 6,437 6,674 3.7%A$perkg $1.17 $1.30 $1.04 -19.9%
Tonnes Tonnes Tonnes A$million
Onions 1,818 2,247 5,495 144.5% 82.3% 3.4Asparagus 180 227 264 16.5% 4.0% 2.1Potatoes 1,347 939 571 -39.2% 8.6% 0.6Cabbages&brassicas 0 199 120 -39.8% 1.8% 0.3Broccoli 308 219 75 -65.6% 1.1% 0.2Carrots 659 2,575 138 -94.6% 2.1% 0.1
allother 13 31 10 -66.4% 0.2% 0.2
Total 4,326 6,437 6,674 3.7% 100% 6.9Source:ABS(2018)viaITCTrademap;FreshIntelligenceanalysis
2015/16 2016/17 2017/18
AHEIAFreshFruitandVegetableExport/ImportStatistics(2017/18)
©2018FreshIntelligenceConsulting 32
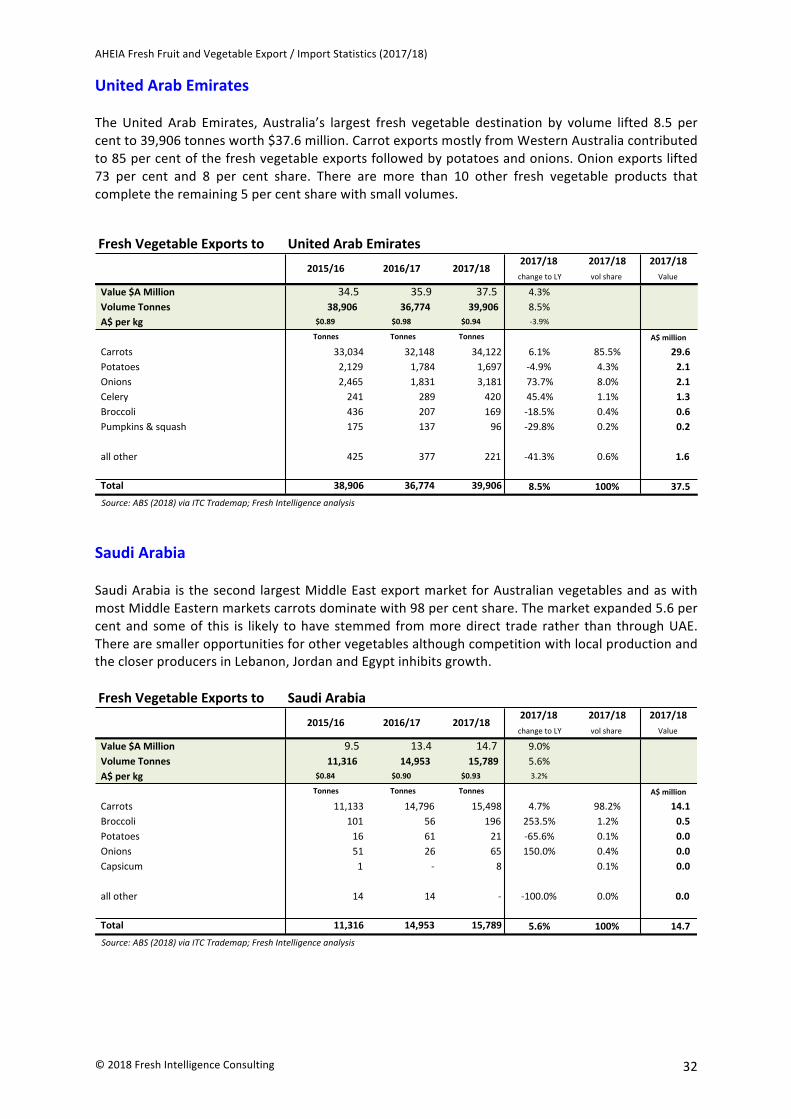
UnitedArabEmiratesTheUnited Arab Emirates, Australia’s largest fresh vegetable destination by volume lifted 8.5 percentto39,906tonnesworth$37.6million.CarrotexportsmostlyfromWesternAustraliacontributedto85percentofthefreshvegetableexportsfollowedbypotatoesandonions.Onionexportslifted73 per cent and 8 per cent share. There are more than 10 other fresh vegetable products thatcompletetheremaining5percentsharewithsmallvolumes.
SaudiArabiaSaudiArabia is thesecond largestMiddleEastexportmarket forAustralianvegetablesandaswithmostMiddleEasternmarketscarrotsdominatewith98percentshare.Themarketexpanded5.6percentand someof this is likely tohave stemmed frommoredirect trade rather than throughUAE.TherearesmalleropportunitiesforothervegetablesalthoughcompetitionwithlocalproductionandthecloserproducersinLebanon,JordanandEgyptinhibitsgrowth.
FreshVegetableExportsto UnitedArabEmirates2017/18 2017/18 2017/18changetoLY volshare Value
Value$AMillion 34.5 35.9 37.5 4.3%VolumeTonnes 38,906 36,774 39,906 8.5%A$perkg $0.89 $0.98 $0.94 -3.9%
Tonnes Tonnes Tonnes A$million
Carrots 33,034 32,148 34,122 6.1% 85.5% 29.6Potatoes 2,129 1,784 1,697 -4.9% 4.3% 2.1Onions 2,465 1,831 3,181 73.7% 8.0% 2.1Celery 241 289 420 45.4% 1.1% 1.3Broccoli 436 207 169 -18.5% 0.4% 0.6Pumpkins&squash 175 137 96 -29.8% 0.2% 0.2
allother 425 377 221 -41.3% 0.6% 1.6
Total 38,906 36,774 39,906 8.5% 100% 37.5Source:ABS(2018)viaITCTrademap;FreshIntelligenceanalysis
2015/16 2016/17 2017/18
FreshVegetableExportsto SaudiArabia2017/18 2017/18 2017/18
changetoLY volshare Value
Value$AMillion 9.5 13.4 14.7 9.0%VolumeTonnes 11,316 14,953 15,789 5.6%A$perkg $0.84 $0.90 $0.93 3.2%
Tonnes Tonnes Tonnes A$million
Carrots 11,133 14,796 15,498 4.7% 98.2% 14.1
Broccoli 101 56 196 253.5% 1.2% 0.5
Potatoes 16 61 21 -65.6% 0.1% 0.0
Onions 51 26 65 150.0% 0.4% 0.0
Capsicum 1 - 8 0.1% 0.0
allother 14 14 - -100.0% 0.0% 0.0
Total 11,316 14,953 15,789 5.6% 100% 14.7
Source:ABS(2018)viaITCTrademap;FreshIntelligenceanalysis
2015/16 2016/17 2017/18

AHEIAFreshFruitandVegetableExport/ImportStatistics(2017/18)
©2018FreshIntelligenceConsulting 33
BahrainKuwaitQatarCarrots dominate the trade to Bahrain, Kuwait and Qatar as they do with the main Middle Eastmarketswithupto95percentshareofexportstothesemarkets.
FreshVegetableExportsto Bahrain2017/18 2017/18 2017/18changetoLY volshare Value
Value$AMillion 3.5 3.3 3.8 16.0%VolumeTonnes 3,803 3,473 4,380 26.1%A$perkg $0.92 $0.95 $0.88 -8.0%
Tonnes Tonnes Tonnes A$million
Carrots 3,489 3,276 4,181 27.6% 95.5% 3.52Potatoes 41 38 38 0.2% 0.9% 0.09Broccoli 62 28 23 -17.1% 0.5% 0.09Onions 183 111 118 6.7% 2.7% 0.07Celery 17 12 12 -3.0% 0.3% 0.04
allother 10 9 9 0.2% 0.2% 0.03
Total 3,803 3,473 4,380 26.1% 100% 3.84Source:ABS(2018)viaITCTrademap;FreshIntelligenceanalysis
2015/16 2016/17 2017/18
FreshVegetableExportsto Kuwait2017/18 2017/18 2017/18changetoLY volshare Value
Value$AMillion 2.46 2.62 3.37 28.6%VolumeTonnes 2,718 2,966 3,830 29.1%A$perkg $0.90 $0.88 $0.88 -0.4%
Tonnes Tonnes Tonnes A$million
Carrots 2,420 2,849 3,503 23.0% 91.5% 2.85Broccoli 99 21 127 491.7% 3.3% 0.33Onions 169 80 185 130.0% 4.8% 0.14
allother 29 16 15 -3.0% 0.4% 0.05
Total 2,718 2,966 3,830 29.1% 100% 3.37Source:ABS(2018)viaITCTrademap;FreshIntelligenceanalysis
2015/16 2016/17 2017/18
FreshVegetableExportsto Qatar2017/18 2017/18 2017/18changetoLY volshare Value
Value$AMillion 6.2 6.7 9.3 38.2%VolumeTonnes 7,670 7,345 10,588 44.1%A$perkg $0.81 $0.92 $0.88 -4.1%
Tonnes Tonnes Tonnes A$million
Carrots 7,302 7,044 9,987 41.8% 94.3% 8.4Onions 111 122 429 251.4% 4.1% 0.3Broccoli 58 32 46 42.5% 0.4% 0.2Potatoes 123 113 90 -20.5% 0.8% 0.2
allother 77 34 37 7.5% 0.3% 0.2
Total 7,670 7,345 10,588 44.1% 100% 9.3Source:ABS(2018)viaITCTrademap;FreshIntelligenceanalysis
2015/16 2016/17 2017/18
AHEIAFreshFruitandVegetableExport/ImportStatistics(2017/18)
©2018FreshIntelligenceConsulting 34
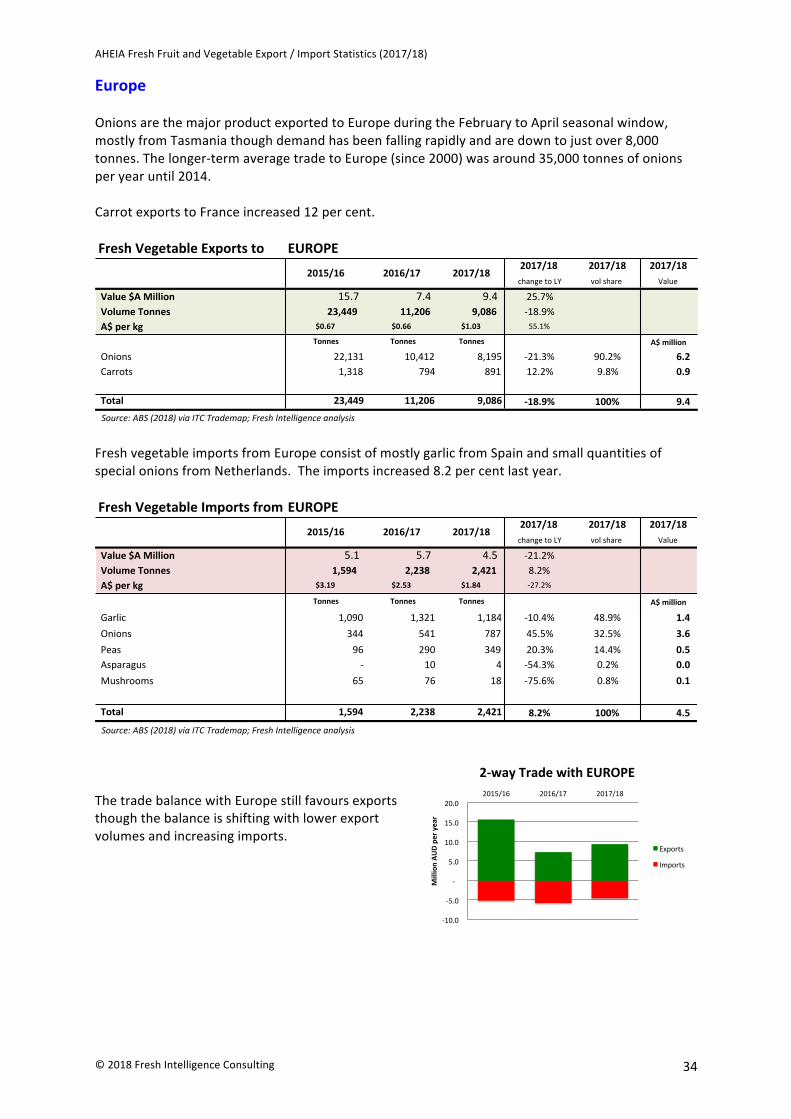
EuropeOnionsarethemajorproductexportedtoEuropeduringtheFebruarytoAprilseasonalwindow,mostlyfromTasmaniathoughdemandhasbeenfallingrapidlyandaredowntojustover8,000tonnes.Thelonger-termaveragetradetoEurope(since2000)wasaround35,000tonnesofonionsperyearuntil2014.CarrotexportstoFranceincreased12percent.
FreshvegetableimportsfromEuropeconsistofmostlygarlicfromSpainandsmallquantitiesofspecialonionsfromNetherlands.Theimportsincreased8.2percentlastyear.
ThetradebalancewithEuropestillfavoursexportsthoughthebalanceisshiftingwithlowerexportvolumesandincreasingimports.
FreshVegetableExportsto EUROPE2017/18 2017/18 2017/18changetoLY volshare Value
Value$AMillion 15.7 7.4 9.4 25.7%VolumeTonnes 23,449 11,206 9,086 -18.9%A$perkg $0.67 $0.66 $1.03 55.1%
Tonnes Tonnes Tonnes A$million
Onions 22,131 10,412 8,195 -21.3% 90.2% 6.2Carrots 1,318 794 891 12.2% 9.8% 0.9
Total 23,449 11,206 9,086 -18.9% 100% 9.4Source:ABS(2018)viaITCTrademap;FreshIntelligenceanalysis
2015/16 2016/17 2017/18
FreshVegetableImportsfrom EUROPE2017/18 2017/18 2017/18changetoLY volshare Value
Value$AMillion 5.1 5.7 4.5 -21.2%VolumeTonnes 1,594 2,238 2,421 8.2%A$perkg $3.19 $2.53 $1.84 -27.2%
Tonnes Tonnes Tonnes A$million
Garlic 1,090 1,321 1,184 -10.4% 48.9% 1.4Onions 344 541 787 45.5% 32.5% 3.6Peas 96 290 349 20.3% 14.4% 0.5Asparagus - 10 4 -54.3% 0.2% 0.0Mushrooms 65 76 18 -75.6% 0.8% 0.1
Total 1,594 2,238 2,421 8.2% 100% 4.5Source:ABS(2018)viaITCTrademap;FreshIntelligenceanalysis
2015/16 2016/17 2017/18
-10.0
-5.0
-
5.0
10.0
15.0
20.02015/16 2016/17 2017/18
MillionAU
Dpe
ryear
2-wayTradewithEUROPE
Exports
Imports

AHEIAFreshFruitandVegetableExport/ImportStatistics(2017/18)
©2018FreshIntelligenceConsulting 35
NewZealandTradetoNewZealandincreased18.2percentto3,556tonnesworth$12.4million.MostcapsicumandtomatoesenterNewZealandunderanirradiationprotocol.Tradehoweverisafractionofpastvolumes.Freshbeansaccountforover50percentofthefreshvegetableexports.Alargecomponentof“other”includesvegetables“notspecified”
CapsicumandtomatoesarealsothekeyimportedproductsbyAustraliafromNewZealand.
Inatwo-waytradebalancebyvaluebetweenAustraliaandNewZealand,exportstoNewZealandexceedimports67percentto33percent
FreshVegetableExportsto NewZealand2017/18 2017/18 2017/18changetoLY volshare Value
Value$AMillion 9.9 11.5 12.4 7.6%VolumeTonnes 3,413 3,008 3,556 18.2%A$perkg $2.91 $3.82 $3.47 -9.0%
Tonnes Tonnes Tonnes A$million
Beans 1,767 1,557 1,814 16.5% 51.0% 7.6Capsicum 357 201 167 -16.7% 4.7% 0.7Tomatoes 354 126 251 100.1% 7.1% 0.5Cucumbers 32 61 219 259.5% 6.2% 0.2Lettuce 6 49 3 -94.2% 0.1% 0.0
allother 895 1,015 1,101 8.5% 31.0% 3.3
Total 3,413 3,008 3,556 18.2% 100% 12.4Source:ABS(2018)viaITCTrademap;FreshIntelligenceanalysis (++)morethan500%increase
2015/16 2016/17 2017/18
FreshVegetableImportsfrom NewZealand2017/18 2017/18 2017/18changetoLY volshare Value
Value$AMillion 8.59 7.83 5.96 -23.8%VolumeTonnes 2,809 2,382 2,098 -11.9%A$perkg $3.06 $3.29 $2.84 -13.5%
Tonnes Tonnes Tonnes A$million
Capsicum 1,371 1,308 924 -29.4% 44.0% 4.01Tomatoes 1,386 922 926 0.5% 44.2% 1.79Onions 2 99 186 87.9% 8.9% 0.11Peas - 43 60 39.8% 2.9% 0.05Asparagus 38 6 2 -65.9% 0.1% 0.01Beans 2 - - 0.0% -
allother 10 4 - -100.0% 0.0% 0.01
Total 2,809 2,382 2,098 -11.9% 100% 5.96Source:AustralianBureauofStatistics;FreshIntelligenceanalysis
2015/16 2016/17 2017/18
-10.0
-5.0
-
5.0
10.0
15.02015/16 2016/17 2017/18
MillionAU
Dpe
ryear
2-wayTradewithNewZealand
Exports
Imports

AHEIAFreshFruitandVegetableExport/ImportStatistics(2017/18)
©2018FreshIntelligenceConsulting 36
UnitedStatesOnionsandAsparaguswereimportedfromtheUnitedStatestomeetseasonalandvarietynichesinadditiontosmallvolumesofgarlicandbeans.TherewerenomeasurableexportstotheUnitedStates.
MexicoAustraliaimportsasparagusfromMexicoandPerutomeetAustralia’s“outofseason”needs.GarlicisalsoimportedfromMexicothoughdeclinedover40percenteachyearoverpast2years.
PeruImportsofasparagusfromPerudeclinedamarginal1.7percentin2017/18andisthealternativeasparagussupplierservingaslightlydifferentwindowtoMexicomostlyfromMaytoAugust.
FreshVegetableImportsfrom UnitedStates2017/18 2017/18 2017/18changetoLY volshare Value
Value$AMillion 3.12 3.00 1.96 -34.7%VolumeTonnes 1,888 2,551 937 -63.3%A$perkg $1.65 $1.17 $2.09 77.7%
Tonnes Tonnes Tonnes A$million
Asparagus 116 75 172 130.2% 18.4% 0.81Onions 1,568 1,944 530 -72.7% 56.5% 0.63Garlic 28 149 22 -85.2% 2.3% 0.11Beans 167 360 116 -67.7% 12.4% 0.21allother 9 23 97 327.9% 10.3% 0.20
Total 1,888 2,551 937 -63.3% 100% 1.96Source:ABS(2018)viaITCTrademap;FreshIntelligenceanalysis
2015/16 2016/17 2017/18
FreshVegetableImportsfrom Mexico2017/18 2017/18 2017/18
changetoLY volshare Value
Value$AMillion 21.4 23.8 19.2 -19.4%VolumeTonnes 4,694 4,245 3,748 -11.7%A$perkg $4.55 $5.61 $5.12 -8.7%
Tonnes Tonnes Tonnes A$million
Asparagus 2,360 3,098 3,082 -0.5% 82.2% 16.1
Garlic 2,335 1,147 666 -41.9% 17.8% 3.1
Total 4,694 4,245 3,748 -11.7% 100% 19.2
Source:ABS(2018)viaITCTrademap;FreshIntelligenceanalysis
2015/16 2016/17 2017/18
FreshVegetableImportsfrom Peru2017/18 2017/18 2017/18changetoLY volshare Value
Value$AMillion 6.7 6.4 5.4 -15.5%VolumeTonnes 1,130 1,055 1,037 -1.7%A$perkg $5.90 $6.10 $5.25 -14.0%
Tonnes Tonnes Tonnes A$million
Asparagus 1,130 1,033 1,015 -1.7% 97.9% 5.3Garlic - 22 22 2.1% 0.1
Total 1,130 1,055 1,037 -1.7% 100% 5.4Source:ABS(2018)viaITCTrademap;FreshIntelligenceanalysis
2015/16 2016/17 2017/18

AHEIAFreshFruitandVegetableExport/ImportStatistics(2017/18)
©2018FreshIntelligenceConsulting 37
ReferencesInternationalTradeCentre–TradeMap-retrievedAugust2018fromwww.trademap.orgAsiafruitCongressStatisticsHandbookAugust2018Preparedby:WayneProwseFreshIntelligenceConsultingwayne@myfreshintelligence.comPh:040816406617thAugust2018