Tweet Analysis for Real-Time Event Detection and ... 2013 Dotnet Basepaper/Tweet...
13
Tweet Analysis for Real-Time Event Detection and Earthquake Reporting System Development Takeshi Sakaki, Makoto Okazaki, and Yutaka Matsuo Abstract—Twitter has received much attention recently. An important characteristic of Twitter is its real-time nature. We investigate the real-time interaction of events such as earthquakes in Twitter and propose an algorithm to monitor tweets and to detect a target event. To detect a target event, we devise a classifier of tweets based on features such as the keywords in a tweet, the number of words, and their context. Subsequently, we produce a probabilistic spatiotemporal model for the target event that can find the center of the event location. We regard each Twitter user as a sensor and apply particle filtering, which are widely used for location estimation. The particle filter works better than other comparable methods for estimating the locations of target events. As an application, we develop an earthquake reporting system for use in Japan. Because of the numerous earthquakes and the large number of Twitter users throughout the country, we can detect an earthquake with high probability (93 percent of earthquakes of Japan Meteorological Agency (JMA) seismic intensity scale 3 or more are detected) merely by monitoring tweets. Our system detects earthquakes promptly and notification is delivered much faster than JMA broadcast announcements. Index Terms—Twitter, event detection, social sensor, location estimation, earthquake Ç 1 INTRODUCTION T WITTER, a popular microblogging service, has received much attention recently. This online social network is used by millions of people around the world to remain socially connected to their friends, family members, and coworkers through their computers and mobile phones [1]. Twitter asks one question, “What’s happening?” Answers must be fewer than 140 characters. A status update message, called a tweet, is often used as a message to friends and colleagues. A user can follow other users; that user’s followers can read her tweets on a regular basis. A user who is being followed by another user need not necessarily reciprocate by following them back, which renders the links of the network as directed. Since its launch on July 2006, Twitter users have increased rapidly. The number of registered Twitter users exceeded 100 million in April 2010. The service is still adding about 300,000 users per day. 1 Currently, 190 million users use Twitter per month, generating 65 million tweets per day. 2 Many researchers have published their studies of Twitter to date, especially during the past year. Most studies can be classified into one of three groups: first, some researchers have sought to analyze the network structure of Twitter [2], [3], [4]. Second, some researchers have specifically examined characteristics of Twitter as a social medium [5], [6] . Third, some researchers and developers have tried to create new applications using Twitter [7], [8]. Twitter is categorized as a microblogging service. Microblogging is a form of blogging that enables users to send brief text updates or micromedia such as photographs or audio clips. Microblogging services other than Twitter include Tumblr, Plurk, Jaiku, identi.ca, and others. 3 Our study, which is based on the real-time nature of one social networking service, is applicable to other microblogging services, but we specifically examine Twitter in this study because of its popularity and data volume. An important characteristic that is common among microblogging services is their real-time nature. Although blog users typically update their blogs once every several days, Twitter users write tweets several times in a single day. Users can know how other users are doing and often what they are thinking about now, users repeatedly return to the site and check to see what other people are doing. Several important instances exemplify their real-time nat- ure: in the case of an extremely strong earthquake in Haiti, many pictures were transmitted through Twitter. People were thereby able to know the circumstances of damage in Haiti immediately. In another instance, when an airplane crash-landed on the Hudson River in New York, the first reports were published through Twitter and tumblr. In such a manner, numerous update results in numerous reports related to events. They include social events such as parties, baseball games, and presidential campaigns. They also include disastrous events such as storms, fires, traffic jams, riots, heavy rainfall, and earthquakes. Actually, Twitter is used for various real-time notification such as . The authors are with The University of Tokyo, 2-11-16 Eng. 9, Room 204, Yayoi Bunkyo-ku, Tokyo, Japan. E-mail: {sakaki, matsuo}@weblab.t.u-tokyo.ac.jp, [email protected]. Manuscript received 1 Mar. 2011; revised 16 Nov. 2011; accepted 13 Dec. 2011; published online 13 Feb. 2012. Recommended for acceptance by A. Tung. For information on obtaining reprints of this article, please send e-mail to: [email protected], and reference IEEECS Log Number TKDE-2011-03-0099. Digital Object Identifier no. 10.1109/TKDE.2012.29. 1. http://techcrunch.com/2010/06/08/twitter-190-million-users/. 2. http://mashable.com/2010/04/14/twitter-registered-users/. 3. www.tumblr.com, www.plurk.com, www.jaiku.com, identi.ca. IEEE TRANSACTIONS ON KNOWLEDGE AND DATA ENGINEERING VOL:25 NO:4 YEAR 2013
Transcript of Tweet Analysis for Real-Time Event Detection and ... 2013 Dotnet Basepaper/Tweet...

Tweet Analysis for Real-Time EventDetection and Earthquake Reporting
System DevelopmentTakeshi Sakaki, Makoto Okazaki, and Yutaka Matsuo
Abstract—Twitter has received much attention recently. An important characteristic of Twitter is its real-time nature. We investigate
the real-time interaction of events such as earthquakes in Twitter and propose an algorithm to monitor tweets and to detect a target
event. To detect a target event, we devise a classifier of tweets based on features such as the keywords in a tweet, the number of
words, and their context. Subsequently, we produce a probabilistic spatiotemporal model for the target event that can find the center of
the event location. We regard each Twitter user as a sensor and apply particle filtering, which are widely used for location estimation.
The particle filter works better than other comparable methods for estimating the locations of target events. As an application, we
develop an earthquake reporting system for use in Japan. Because of the numerous earthquakes and the large number of Twitter
users throughout the country, we can detect an earthquake with high probability (93 percent of earthquakes of Japan Meteorological
Agency (JMA) seismic intensity scale 3 or more are detected) merely by monitoring tweets. Our system detects earthquakes promptly
and notification is delivered much faster than JMA broadcast announcements.
Index Terms—Twitter, event detection, social sensor, location estimation, earthquake
Ç
1 INTRODUCTION
TWITTER, a popular microblogging service, has receivedmuch attention recently. This online social network is
used by millions of people around the world to remainsocially connected to their friends, family members, andcoworkers through their computers and mobile phones [1].Twitter asks one question, “What’s happening?” Answersmust be fewer than 140 characters. A status updatemessage, called a tweet, is often used as a message tofriends and colleagues. A user can follow other users; thatuser’s followers can read her tweets on a regular basis. Auser who is being followed by another user need notnecessarily reciprocate by following them back, whichrenders the links of the network as directed. Since itslaunch on July 2006, Twitter users have increased rapidly.The number of registered Twitter users exceeded 100 millionin April 2010. The service is still adding about 300,000 usersper day.1 Currently, 190 million users use Twitter permonth, generating 65 million tweets per day.2
Many researchers have published their studies of Twitterto date, especially during the past year. Most studies can beclassified into one of three groups: first, some researchershave sought to analyze the network structure of Twitter [2],[3], [4]. Second, some researchers have specifically examined
characteristics of Twitter as a social medium [5], [6] . Third,some researchers and developers have tried to create newapplications using Twitter [7], [8].
Twitter is categorized as a microblogging service.Microblogging is a form of blogging that enables users tosend brief text updates or micromedia such as photographsor audio clips. Microblogging services other than Twitterinclude Tumblr, Plurk, Jaiku, identi.ca, and others.3 Ourstudy, which is based on the real-time nature of one socialnetworking service, is applicable to other microbloggingservices, but we specifically examine Twitter in this studybecause of its popularity and data volume.
An important characteristic that is common amongmicroblogging services is their real-time nature. Althoughblog users typically update their blogs once every severaldays, Twitter users write tweets several times in a singleday. Users can know how other users are doing and oftenwhat they are thinking about now, users repeatedly return tothe site and check to see what other people are doing.Several important instances exemplify their real-time nat-ure: in the case of an extremely strong earthquake in Haiti,many pictures were transmitted through Twitter. Peoplewere thereby able to know the circumstances of damage inHaiti immediately. In another instance, when an airplanecrash-landed on the Hudson River in New York, the firstreports were published through Twitter and tumblr.
In such a manner, numerous update results in numerousreports related to events. They include social events such asparties, baseball games, and presidential campaigns. Theyalso include disastrous events such as storms, fires, trafficjams, riots, heavy rainfall, and earthquakes. Actually,Twitter is used for various real-time notification such as
. The authors are with The University of Tokyo, 2-11-16 Eng. 9, Room 204,Yayoi Bunkyo-ku, Tokyo, Japan.E-mail: {sakaki, matsuo}@weblab.t.u-tokyo.ac.jp, [email protected].
Manuscript received 1 Mar. 2011; revised 16 Nov. 2011; accepted 13 Dec.2011; published online 13 Feb. 2012.Recommended for acceptance by A. Tung.For information on obtaining reprints of this article, please send e-mail to:[email protected], and reference IEEECS Log Number TKDE-2011-03-0099.Digital Object Identifier no. 10.1109/TKDE.2012.29.
1. http://techcrunch.com/2010/06/08/twitter-190-million-users/.2. http://mashable.com/2010/04/14/twitter-registered-users/.
3. www.tumblr.com, www.plurk.com, www.jaiku.com, identi.ca.
IEEE TRANSACTIONS ON KNOWLEDGE AND DATA ENGINEERING VOL:25 NO:4 YEAR 2013
that necessary for help during a large-scale fire emergencyor live traffic updates.
Adam Ostrow, the Editor in Chief at Mashable, a socialmedia news blog, wrote in his blog about the interestingphenomenon of real-time media4:
Japan Earthquake Shakes Twitter Users ... And Beyonce: Earth-
quakes are one thing you can bet on being covered on Twitter first,
because, quite frankly, if the ground is shaking, you’re going to
tweet about it before it even registers with the USGS and long
before it gets reported by the media. That seems to be the case again
today, as the third earthquake in a week has hit Japan and its
surrounding islands, about an hour ago. The first user we can find
that tweeted about it was Ricardo Duran of Scottsdale, AZ, who,
judging from his Twitter feed, has been traveling the world,
arriving in Japan yesterday.
This post well represents the motivation of our study.The research question of our study is, “can we detect suchevent occurrence in real-time by monitoring tweets?”
This paper presents an investigation of the real-timenature of Twitter that is designed to ascertain whether wecan extract valid information from it. We propose an eventnotification system that monitors tweets and deliversnotification promptly using knowledge from the investiga-tion. In this research, we take three steps: first, we crawlnumerous tweets related to target events; second, wepropose probabilistic models to extract events from thosetweets and estimate locations of events; finally, we devel-oped an earthquake reporting system that extracts earth-quakes from Twitter and sends a message to registeredusers. Here, we explain our methods using an earthquakeas a target event.
First, to obtain tweets on the target event precisely, weapply semantic analysis of a tweet. For example, usersmight make tweets such as “Earthquake!” or “Now it isshaking,” for which earthquake or shaking could be key-words, but users might also make tweets such as “I amattending an Earthquake Conference,” or “Someone isshaking hands with my boss.” We prepare the trainingdata and devise a classifier using a Support Vector Machine(SVM) based on features such as keywords in a tweet, thenumber of words, and the context of target-event words.
After doing so, we obtain a probabilistic spatiotemporalmodel of an event. We then make a crucial assumption:each Twitter user is regarded as a sensor and each tweet assensory information. These virtual sensors, which we desig-nate as social sensors, are of a huge variety and have variouscharacteristics: some sensors are very active; others are not.A sensor might be inoperable or malfunctioning sometimes,as when a user is sleeping, or busy doing something else.Consequently, social sensors are very noisy compared toordinary physical sensors. Regarding each Twitter user as asensor, the event-detection problem can be reduced to oneof object detection and location estimation in a ubiquitous/pervasive computing environment in which we havenumerous location sensors: a user has a mobile device oran active badge in an environment where sensors areplaced. Through infrared communication or a WiFi signal,the user location is estimated as providing location-basedservices such as navigation and museum guides [9], [10].
We apply particle filters, which are widely used for locationestimation in ubiquitous/pervasive computing [11].
As an application, we develop an earthquake reportingsystem using Japanese tweets. Japan has numerous earth-quakes. Twitter users are similarly numerous and geogra-phically dispersed throughout the country. Therefore, it is
sometimes possible to detect an earthquake by monitoringtweets. Our system detects an earthquake occurrence andsends an e-mail, possibly before an earthquake actuallyarrives at a certain location: An earthquake propagates atabout 3-7 km/s. For that reason, a person who is 100 kmdistant from an earthquake is able to communicate and actfor about 20 s before the arrival of an earthquake wave.Moreover, strong earthquakes often cause tsunami, which
engender more catastrophic disasters than the earthquakesthemselves in distant and near places in relation to theearthquake epicenter, as did the Haiti earthquake in 2010and the Great Eastern Japan earthquake in 2011. Therefore,prompt notification of earthquake occurrences is extremelyimportant to decrease damage by tsunami. In many cases, itcould provide notification of tens of minutes or even hours
before a tsunami strikes a coastal area.The contributions of this paper are summarized as
follows:
. The paper provides an example of integration ofsemantic analysis and real-time nature of Twitter,and presents potential uses for Twitter data.
. For earthquake prediction and early warning, manystudies have been made in the seismology field. Thispaper presents an innovative social approach thathas not been reported before in the literature.
This paper is organized as described below. In the nextsection, we explain an investigation of Twitter users andearthquakes in the real world. Section 3 presents our
explanation of semantic analysis and sensory informationwith subsequent the spatiotemporal model in Section 4. InSection 5, we describe the experiments and evaluation ofevent detection. The earthquake reporting system isintroduced in Section 6. Section 7 is devoted to anexplanation of related works and discussion. Finally, weconclude the paper.
This paper extends the conference version and includessome elements from it [12].
2 INVESTIGATION
We choose earthquakes in Japan as target events, based on thepreliminary investigations. We explain them in this section.
First, we choose earthquakes as target events for thefollowing reasons:
1. seismic observations are conducted worldwide,which facilitates acquisition of earthquake informa-tion, which also makes it easy to validate theaccuracy of our event detection methodology; and
2. it is quite meaningful and valuable to detect earth-quakes in earthquake-prone regions.
Second, we choose Japan as the target area based on thefollowing investigation.4. http://mashable.com/2009/08/12/japan-earthquake/.

Fig. 1 portrays a map of Twitter users worldwide(obtained from UMBC eBiquity Research Group); Fig. 2depicts a map of earthquake occurrences worldwide (usingdata from Japan Meteorological Agency (JMA)). It isapparent that the only intersection of the two maps, thoseregions with many earthquakes and large Twitter users, isJapan. Other regions such as Indonesia, Turkey, Iran, Italy,and Pacific coastal US cities such as Los Angeles and SanFrancisco also roughly intersect, but their respectivedensities are much lower than that in Japan. Many earth-quake events occur in Japan and many Twitter usersobserve earthquakes in Japan, which means that socialsensors are distributed throughout the country.
We present a brief overview of Twitter in Japan: theJapanese version of Twitter was launched on April 2008. InFebruary 2008, Japan was the No. 2 country with respect toTwitter traffic.5 At the time of this writing, Japan has thesecond largest number of tweets (18 percent of all tweets areposted from Japan) in the world.
Therefore, we choose earthquakes in Japan as a targetevent because of the high density of Twitter users andearthquakes in Japan.
3 EVENT DETECTION
As described in this paper, we target event detection. Anevent is an arbitrary classification of a space-time region. Anevent might have actively participating agents, passivefactors, products, and a location in space/time [13]. Wetarget events such as earthquakes, typhoons, and trafficjams, which are readily apparent upon examination oftweets. These events have several properties.
1. They are of large scale (many users experience theevent).
2. They particularly influence the daily life of manypeople (for that reason, people are induced to tweetabout it).
3. They have both spatial and temporal regions (so thatreal-time location estimation is possible).
Such events include social events such as large parties,sports events, exhibitions, accidents, and political cam-paigns. They also include natural events such as storms,heavy rains, tornadoes, typhoons/hurricanes/cyclones, andearthquakes. We designate an event we would like to detectusing Twitter as a target event.
In this section, we explain how to detect a target event
using Twitter. First, we crawl tweets including keywords
related to a target event. From them, we extract tweets that
certainly refer to a target event using devices that have been
trained with machine learning. Second, we detect a target
event and estimate the location from those tweets by
treating Twitter users as “social sensors.”
3.1 Semantic Analysis of Tweets
To detect a target event from Twitter, we search from
Twitter and find useful tweets. Our method of acquiring
useful tweets for target event detection is portrayed in Fig. 3.Tweets might include mention of the target event. For
example, users might make tweets such as “Earthquake!” or
“Now it is shaking.” Consequently, earthquake or shaking
might be keywords (which we call query words). However,
users might also make tweets such as “I am attending an
Earthquake Conference.” or “Someone is shaking hands
with my boss.” Moreover, even if a tweet is referring to the
target event, it might not be appropriate as an event report.
For instance, a user makes tweets such as “The earthquake
yesterday was scary.” or “Three earthquakes in four days.
Japan scares me.” These tweets are truly descriptions of the
target event, but they are not real-time reports of the events.
Therefore, it is necessary to clarify that a tweet is truly
referring to an actual contemporaneous earthquake occur-
rence, which is denoted as a positive class.To classify a tweet as a positive class or a negative class,
we use a support vector machine [14], which is a widely
used machine-learning algorithm. By preparing positive
and negative examples as a training set, we can produce a
model to classify tweets automatically into positive and
negative categories.
Fig. 1. Twitter user map. Fig. 2. Earthquake map.
Fig. 3. Method to acquire tweets referred to a target event precisely.5. http://blog.twitter.com/2008/02/twitter-web-traffic-around-
world.html.

We prepare three groups of features for each tweet asdescribed below.
. Features A (statistical features): the number of wordsin a tweet message, and the position of the queryword within a tweet.
. Features B (keyword features): the words in a tweet.6
. Features C (word context features): the words beforeand after the query word.
We can give an illustrative example of these featuresusing the following sentence.
“I am in Japan, earthquake right now!”
(keyword: earthquake)
For this example, Features A, B, C are presented in Table 1.To process Japanese texts, morphological analysis is
conducted using Mecab,7 which separates sentences into aset of words. For English, we apply standard stop-wordelimination and stemming. We compare the usefulness ofthe features in the discussion in Section 5. Using theobtained model, we can classify whether a new tweetcorresponds to a positive class or a negative class.
3.2 Tweet as a Sensory Value
We can search the tweet and classify it into a positive class ifa user makes a tweet about a target event. In other words,the user functions as a sensor of the event. If she makes atweet about an earthquake occurrence, then it can beconsidered that she, as an “earthquake sensor,” returns apositive value. A tweet can therefore be regarded as a sensorreading. This crucial assumption enables application ofvarious methods related to sensory information.
Assumption 3.1. Each Twitter user is regarded as a sensor. Asensor detects a target event and makes a report probabilistically.
Fig. 4 presents an illustration of the correspondencebetween sensory data detection and tweet processing. Themotivations are the same for both cases: to detect a targetevent. Observation by sensors corresponds to an observa-tion by Twitter users. They are converted into values usinga classifier.
The virtual sensors (or social sensors) have variouscharacteristics: some sensors are activated (i.e., maketweets) only by specific events, although others areactivated by a wider range of events. The sensors are vastlynumerous: there are more than 100 million ’Twitter sensors’worldwide producing tweet information around the clock.A sensor might be inoperable or operating incorrectlysometimes (which means a user is not online, sleeping, or isbusy doing something else). For that reason, this social
sensor is noisier than ordinary physical sensors such aslocation sensors, thermal sensors, and motion sensors.Therefore, a probabilistic model is necessary to detect anevent, as described in the next section.
A tweet can be associated with a time and location: eachtweet has its post time, which is obtainable using a searchAPI. In fact, GPS data are attached to a tweet sometimes,such as when a user is using an iPhone. Alternatively, eachTwitter user makes a registration on their location in theuser profile. The registered location might not be thecurrent location of a tweet. However, we infer it that aperson is probably near the registered location. Some tweetsinclude place names in those bodies. Some researchersdescribe their efforts to extract place names from tweets as apart of Named Entity Recognition [15], [16]. However, theperformance derived from those efforts remains insufficientfor practical use (precision ranges from 0.6 to 0.8). For thepresent study, we use GPS data and the registered locationof a user. We do not use tweets for spatial analysis if alocation is not available; however, we use the tweetinformation for temporal analyses.
Assumption 3.2. Each tweet is associated with a time andlocation, which is a set of latitude and longitude coordinates.
By regarding a tweet as a sensory value associated withlocation information, the event detection problem is re-duced to detection of an object and its location based onsensor readings. Estimating an object’s location is arguablythe most fundamental sensing task in many ubiquitous andpervasive computing scenarios [11]. In this research field,some probabilistic models are proposed to detect eventsand estimate locations by dealing appropriately with sensorreadings. The next section explain how these probabilisticmodels are suited to our tasks of event detection andlocation estimation.
4 MODEL
For event detection and location estimation, we useprobabilistic models. In this section, we first describe eventdetection from time-series data. Then we describe thelocation estimation of a target event.
TABLE 1SVM Features of an Example Sentence
6. A tweet is usually short. Therefore, we use every word in a tweet byconverting it into a word ID.
7. http://mecab.sourceforge.net/.
Fig. 4. Correspondence between event detection from Twitter and objectdetection in a ubiquitous environment.

4.1 Temporal Model
Each tweet has its own post time. When a target eventoccurs, how do the sensors detect the event? We describethe temporal model of event detection.
First, we examine the actual data. Fig. 5 presents therespective quantities of tweets for a target event: anearthquake. It is apparent that spikes occur in the numberof tweets. Each corresponds to an event occurrence.Specifically regarding an earthquake, more than 10 earth-quakes occurred during the period.
The distribution is apparently an exponential distribu-tion. The probability density function of the exponentialdistribution is fðt;�Þ ¼ �e��t where t > 0 and � > 0. Theexponential distribution occurs naturally when describingthe lengths of the interarrival times in a homogeneousPoisson process.
In the Twitter case, we can infer that if a user detects anevent at time 0, then we can assume that the probability ofhis posting a tweet from t to �t is fixed as �. Then, the timeto produce a tweet can be regarded as having anexponential distribution. Therefore, even if a user detectsan event, she might not make a tweet immediately if she isnot online or if she is doing something else. She mightmake a post only after such problems are resolved.Therefore, it is reasonable that the distribution of thenumber of tweets follows an exponential distribution.Actually, the data fit an exponential distribution very well.We get � ¼ 0:34 on average,
To assess an alarm, we must calculate the reliability ofmultiple sensor values. For example, a user might producea false alarm by writing a tweet. It is also possible that theclassifier misclassifies a tweet into a positive class. We candesign the alarm probabilistically using the followingtwo facts.
. The false-positive ratio pf of a sensor is approxi-mately 0.35, as we demonstrate in Section 5.1.
. Sensors are assumed to be independent and identi-cally distributed (i.i.d.), as we explain in Section 4.3.
Assuming that we have n sensors, which producepositive signals, the probability of all n sensors returninga false alarm is pnf . Therefore, the probability of eventoccurrence can be estimated as 1� pnf . Given n0 sensors attime 0 and n0e
��t sensors at time t. Therefore, the number ofsensors we expect at time t is
Xttk¼0
n0e��tk ¼ n0ð1� e��ðtþ1ÞÞ=ð1� e��Þ:
Consequently, the probability of an event occurrence attime t is
poccurðtÞ ¼ 1� pn0ð1�e��ðtþ1ÞÞ=ð1�e��Þf : ð1Þ
We can calculate the probability of event occurrence ifwe set � ¼ 0:34 and pf ¼ 0:35.
4.2 Spatial Model
Each tweet is associated with a location. We describe a
method that can estimate the location of an event from
sensor readings. To define the problem of location estima-
tion, we consider the evolution of the state sequence fxt; t 2Ng of a target, given that xt ¼ ftðxt�1; utÞ; ft : Rn
t �Rnt !
Rnt where ft is a possibly nonlinear function of the state
xt�1. Furthermore, ut is an i.i.d. process noise sequence.
The objective of tracking is to estimate xt recursively
from measurements, as zt ¼ htðxt; ntÞ; ht : Rnt �Rn
t !Rnt
where ht is a possibly nonlinear function, and where nt is
an i.i.d. measurement noise sequence. From a Bayesian
perspective, the tracking problem is to calculate, recur-
sively, some degree of belief in the state xt at time t, given
data zt up to time t.Presuming that pðxt�1jzt�1Þ is available, the prediction
stage uses the following equation.
pðxtjzt�1Þ ¼Zpðxtjxt�1Þpðxt�1jzt�1Þdxt�1
Here, we use a Markov process of order one. Therefore, wecan assume that pðxtjxt�1; zt�1Þ ¼ pðxtjxt�1Þ.
In the update stage, Bayes’ rule is applied aspðxtjztÞ ¼ pðztjxtÞpðxtjzt�1Þ=pðztjzt�1Þ where the normal-
izing constant is pðztjzt�1Þ ¼RpðztjxtÞpðxtjzt�1Þdxt.
To solve the problem, several methods of Bayesian filtersare proposed such as Kalman filters, multihypothesistracking, grid-based and topological approaches, andparticle filters [11]. For this study, we use particle filters,both of which are widely used in location estimation.
4.2.1 Particle Filters
A particle filter is a probabilistic approximation algorithm
implementing a Bayes filter, and a member of the family of
sequential Monte Carlo methods. For location estimation, it
maintains a probability distribution for the location estima-
tion at time t, designated as the belief BelðxtÞ ¼ fxit; witg; i ¼1 . . .n. Each xit is a discrete hypothesis related to the object
location. The wit are nonnegative weights, called importance
factors, which sum to one.
The Sequential Importance Sampling (SIS) algorithm is a
Monte Carlo method that forms the basis for particle filters.
The SIS algorithm consists of recursive propagation of the
weights and support points as each measurement is
received sequentially.The algorithm is presented below.
1. Generation. Generate and weight a particle set,which means N discrete hypothesis
S0 ¼�s0
0; s10; s
20; . . . ; sN�1
0
�;
Fig. 5. Number of tweets related to earthquakes.

and allocate them evenly on the map:
particle sk0 ¼�xk0; y
k0; w
k0
�x : longitude; y : latitude; w : weight.
2. Resampling. Resample N particles from a particleset St using weights of respective particles andallocate them on the map. (We allow resampling ofmore than that of the same particles.).
3. Prediction. Predict the next state of a particle set Stfrom Newton’s motion equation
�xkt ; y
kt
�¼ xkt�1 þ vxt�1
�tþ axt�1
2�t2;
�ykt�1 þ vyt�1
�tþ ayt�1
2�t2
�ðvxt ; vytÞ ¼ ðvxt�1
þ axt�1; vyt�1
; ayt�1Þ
axt ¼ Nð0; �2Þ; ayt ¼ Nð0;�2Þ:
4. Weighing. Recalculate the weight of St by measure-ment mðmx;myÞ as follows:
dxkt ¼ mx � xkt ; dykt ¼ my � ykt
wkt ¼1
ðffiffiffiffiffiffi2�p
�Þ
� exp �ðdxkt
2 þ dykt2Þ
2�2
!:
5. Measurement. Calculate the current object locationoðxt; ytÞ by the average of sðxt; ytÞ 2 St.
6. Iteration. Iterate Steps 2, 3, 4, and 5 until convergence.
4.2.2 Consideration of Sensor Geographic Distribution
We must consider the sensor geographic distribution totreat readings of social sensors more precisely.
In location estimation by physical sensors, those sensorsare located evenly in many cases. We can treat sensorreadings equally in such situations. Actually, social sensorsare not placed evenly in many cases because social mediausers are concentrated in urban areas. In Japan, most userslive in Tokyo. Therefore, we should incorporate the geo-graphic distribution of social sensors into spatial models.
It is thought that there are fewer social sensors in areaswhere fewer Twitter users live. Consequently, those sensorshave lower probabilities to response value. In spite of suchlow probabilities, if a sensor in a less-populated areaproduce a positive value to one earthquake, then it can beinferred that the center of the earthquake is close to thatsensor. Therefore, we assume that sensor values in less-populated areas are more important than those in denselypopulated areas. Based on this assumption, we calculateweights of respective particles based on the geographicdistribution of social sensors.
We use a more advanced algorithm with resampling[17]. We use the weight distribution Dwðx; yÞ, as obtainedfrom the Twitter user distribution, to examine the biases ofuser locations.8 We customize the algorithm related toparticle filters as follows:
1. We collect Twitter users randomly along with theirlocation information.sjðxsj ; ysjÞðsj 2 SÞ : longitude and latitude of userj.Ns: Number of users we collect.
2. In the Generation step, we weight each particlebased on weight distribution Dwðxk; ykÞ after theyare allocated
dxk;sj ; dyk;sj� �
¼ xk � xsj ; yk � ysj� �
Dwðxk; ykÞ ¼XNs
j¼1
1
ðffiffiffiffiffiffi2�p
�Þ
� exp �ðdxk;sj2 þ dyk;sj2Þ
2�2
!:
3. In the Weighing step, we calculate the weights ofeach particle using the following equation:
wkt ¼ Dwðxkt ; ykt Þ �1
ðffiffiffiffiffiffi2�p
�Þ
� exp ��dxkt
2 þ dykt2�
2�2
!:
As described in this paper, we designate this customized
method as a weighted particle filter.
4.2.3 Techniques to Speed up the Process
As described in this paper, we want to estimate location ofevents quickly as soon as possible because one objective ofthis research is to develop a real-time earthquake detectionsystem. Therefore, we must decrease the time complexity ofmethods used for location estimation.
The time complexity of a normal particle filter isexpressed as OðNpNmÞ(Np, number of particles; Nm,number of observations). The time complexity of theweighted particle filter is expressed as OðNpNmNsÞ (Ns,number of sensors to calculate the geographic distribu-tion). In the pre-examination, we set Np ¼ 2;000, Nm ¼ 20,Ns ¼ 6,421. It takes less than 1 s to estimate the location ofan earthquake center using a normal particle filter. It takesless from 1 minute to 3 minute to estimate the location ofan earthquake center by weighted particle filter. Therefore,we want to decrease Ns to calculate the location ofearthquake centers more quickly.
As described in this paper, we sample some users from
all users to calculate the sensor geographic distribution and
produce a new set of S� users. We apply the following
three approaches.
. Sampling: sample Ns� users from S randomly anddesignate them as S�.
. Sampling and average:
- Sample msample users from S randomly andcalculate an average position for it (Palðxl; ylÞ)
Palðxl; ylÞ ¼1
msample
Xmsample
i¼1
xl;i;1
msample
Xmsample
i¼1
yl;i
!:
8. We sample tweets associated with locations and obtain a userdistribution that reflects the numbers of tweets in respective regions.
- Repeat step 1Ns� times and designate those pointsof average positions as S� ¼ Plðl ¼ 0 . . .Ns� ).
. Sampling and mean:
- Sample msample users from S randomly andcalculate a mean position of it(Pml
ðxl; ylÞ)
Pmlðxl; ylÞ ¼
1
2ðMaxðxl;iÞ þMinðxl;iÞ
�Þ
1
2ðMaxðyl;iÞ þMinðyl;iÞÞ
�:
- Repeat step 1 Ns� times and designate thosepoints of mean positions as S�.
4.3 Information Diffusion Related to a Real-TimeEvent
Some information related to an event diffuses throughTwitter. For example, if a user detects an earthquake andmakes a tweet about the earthquake, then a follower of thatuser might make tweets about that. This characteristic isimportant because, in our model, sensors might not bemutually independent, which would have an undesiredeffect in terms of event detection.
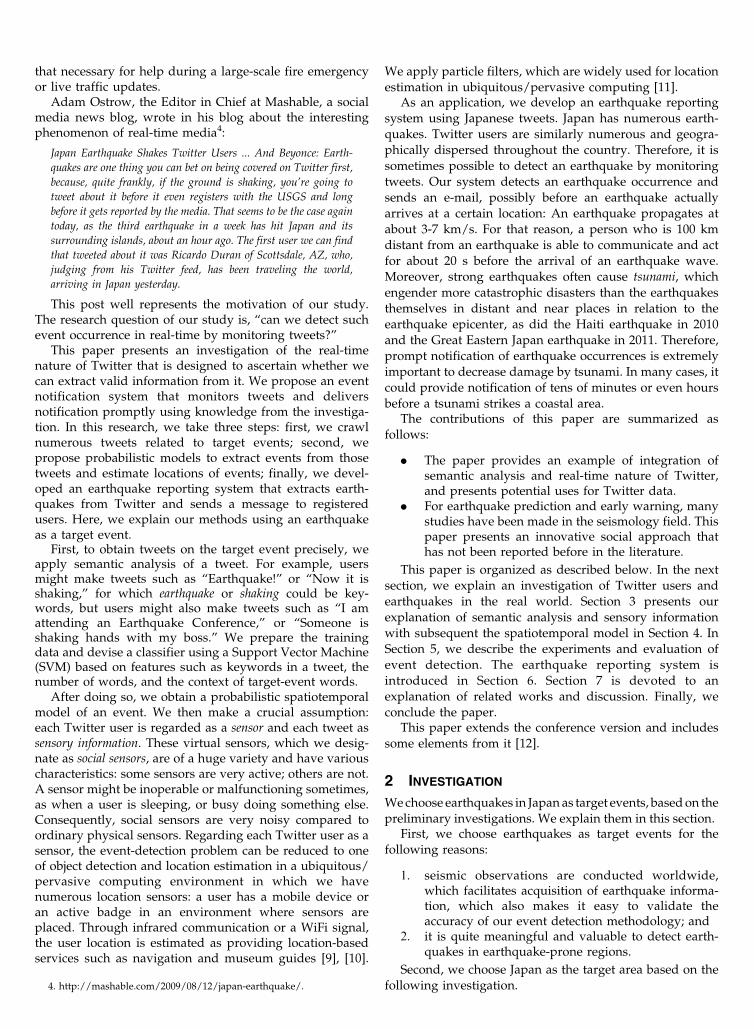
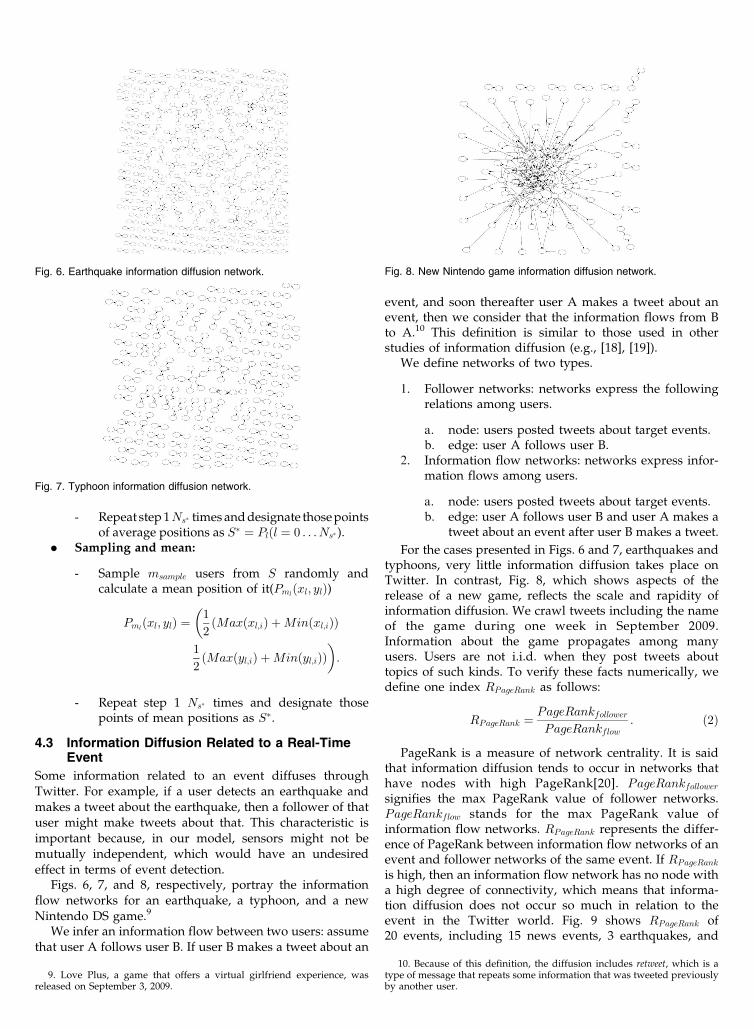
Figs. 6, 7, and 8, respectively, portray the informationflow networks for an earthquake, a typhoon, and a newNintendo DS game.9
We infer an information flow between two users: assumethat user A follows user B. If user B makes a tweet about an
event, and soon thereafter user A makes a tweet about anevent, then we consider that the information flows from Bto A.10 This definition is similar to those used in otherstudies of information diffusion (e.g., [18], [19]).
We define networks of two types.
1. Follower networks: networks express the followingrelations among users.
a. node: users posted tweets about target events.b. edge: user A follows user B.
2. Information flow networks: networks express infor-mation flows among users.
a. node: users posted tweets about target events.b. edge: user A follows user B and user A makes a
tweet about an event after user B makes a tweet.
For the cases presented in Figs. 6 and 7, earthquakes andtyphoons, very little information diffusion takes place onTwitter. In contrast, Fig. 8, which shows aspects of therelease of a new game, reflects the scale and rapidity ofinformation diffusion. We crawl tweets including the nameof the game during one week in September 2009.Information about the game propagates among manyusers. Users are not i.i.d. when they post tweets abouttopics of such kinds. To verify these facts numerically, wedefine one index RPageRank as follows:
RPageRank ¼PageRankfollowerPageRankflow
: ð2Þ
PageRank is a measure of network centrality. It is saidthat information diffusion tends to occur in networks thathave nodes with high PageRank[20]. PageRankfollowersignifies the max PageRank value of follower networks.PageRankflow stands for the max PageRank value ofinformation flow networks. RPageRank represents the differ-ence of PageRank between information flow networks of anevent and follower networks of the same event. If RPageRank
is high, then an information flow network has no node witha high degree of connectivity, which means that informa-tion diffusion does not occur so much in relation to theevent in the Twitter world. Fig. 9 shows RPageRank of20 events, including 15 news events, 3 earthquakes, and
Fig. 6. Earthquake information diffusion network. Fig. 8. New Nintendo game information diffusion network.
Fig. 7. Typhoon information diffusion network.
9. Love Plus, a game that offers a virtual girlfriend experience, wasreleased on September 3, 2009.
10. Because of this definition, the diffusion includes retweet, which is atype of message that repeats some information that was tweeted previouslyby another user.

2 typhoons. In Fig. 9, typhoons and earthquakes have high
RPageRank. This demonstrates that information diffusion
does not occur on earthquakes and typhoons.Therefore, we can assume that the sensors are i.i.d.
when considering real-time event detection such as
typhoons and earthquakes. Additionally, we must verify
sensors are i.i.d or not when we apply our proposed
method to some events.
5 EXPERIMENTS AND EVALUATION
In this section, we describe the experimentally obtained
results and evaluation of tweet classification and location
estimation.The whole algorithm is the following:
1. Given a set of queries Q for a target event.2. Put a query Q using search API every s seconds and
obtain tweets T .3. For each tweet t 2 T , obtain features A, B, and C.
Apply the classification to obtain value vt ¼ f0; 1g.4. If the enough number of tweets comes(poccur in
(1) exceeds 0.99 under the condition: 10 tweets in10 minutes; � ¼ 0:34; pf ¼ 0:35;) then proceed tostep 5.
5. For each tweet t 2 T , we obtain the latitude and thelongitude lt by 1) using the associated GPS location,2) making a query to Google Map for the registeredlocation for user ut. Set lt ¼ null if neither functions.
6. Calculate the estimated location of the event fromlt; t 2 T using normal particle filtering, particlefiltering with assigned weights, and particle filteringwith weights and sampling.
7. Send alert e-mails to registered users.
We prepare a set of queries Q for a target event. We first
search for tweets T including the query set Q from Twitter
every s seconds. We use a search API11 to search tweets. In the
earthquake case, we set Q ¼ f00earthquake00 and 00shaking00g;in the typhoon case, we set Q ¼ f00typhoon00g. We set s as 3 s.
After determining a classification and obtaining a positive
example, the system makes a calculation of a temporal and
spatial probabilistic model. The location information of each
tweet is obtained and used for location estimation of the
event. The earthquake reporting system explained in the next
section quickly sends an e-mail (usually mobile e-mail) to
registered users.
5.1 Evaluation by Semantic Analysis
For classification of tweets, we prepared 597 positiveexamples that report earthquake occurrence as a trainingset (the size of the training set is not large but we think itis enough because our event detection system performswell with satisfactory accuracy as we will describe later).The classification performance is presented in Table 2.We use two query words: earthquake and shaking. Perfor-mance results obtained using respective queries areshown. We used a linear kernel for SVM. We obtain thehighest F -value when we use feature A and all features.Surprisingly, features B and C do not contribute much tothe classification performance. When an earthquakeoccurs, a user becomes surprised and might produce avery short tweet. It is apparent that the recall is not ashigh as the precision. That result is attributable to theusage of query words in a different context than we hadintended. Sometimes it is difficult even for humans tojudge whether a tweet is reporting an actual earthquake ornot. Some examples are that a user might write “Is this anearthquake or a truck passing?” Overall, the classificationperformance is good considering that we can use multiplesensor readings as evidence for event detection.
5.2 Evaluation of Spatial Estimation
Fig. 10 presents the location estimation of an earthquakethat occurred on August 11. Many tweets originated fromover a wide region in Japan. The estimated location of theearthquake (shown as estimation by weighed particle filter)is close to the actual epicenter of the earthquake, whichshows the efficiency of the location estimation algorithm.Table 3 presents results of location estimation based on atotal of 621 tweets for 25 earthquakes that occurred duringAugust-October 2009. We compare results obtained usingthree particle filtering methods with the weighted averageand the median as a baseline. The weighted average simplytakes the average of latitudes and longitude on all thepositive tweets; median simply takes their median. Particlefilters of three kinds perform well compared to otherbaseline methods. Particle filter with weighting worksbetter than the normal particle filter. The performance ofparticle filter with weighting and sampling is similar to thatof the particle filter with weighting when Ns ¼ 100(Ns,number of samples) and sampling by mean value method.
Fig. 9. RPageRank of networks of earthquakes, typhoons, and newsevents.
11. search.twitter.com.
TABLE 2Classification Performance

In Figs. 12 and 13, data are shown for comparison of theweighted particle filter and the sampled particle filter witheach sampling method in performance and time complex-ity. Mean values work better than other sampling methodsdo. The performance of the sampled particle filter withmean value has a positive correlation with Ns; it convergesNs ¼ 300, which means that 5 percent of all sensors aresufficient for sampling. It takes 6:4 s for calculation bysampled particle filter with Ns ¼ 300; it takes 120 s forcalculation using the weighted particle filter. We canperform computations 20 times faster than before with onlya slight drop in performance.
Results show that if the center of the earthquake is in anoceanic area, it is more difficult to locate it precisely fromtweets. Similarly, it becomes more difficult to produce goodestimations in less-populated areas. That result is reason-able: all other things being equal, the greater the number ofsensors, the more precise the estimation will be.
Fig. 11 depicts a trajectory estimation of typhoon Melorbased on a total of 2,037 tweets. For an earthquake, thecenter is one location. However, for a typhoon, the centermoves, producing a trajectory. The relative performance of
several methods is presented in Table 3. The particle filterworks well and outputs a trajectory path resembling theactual path of the typhoon. (Tables in the SupplementalMaterial, which can be found on the Computer SocietyDigital Library at http://doi.ieeecomputersociety.org/10.1109/TKDE. 2012.29, present detailed figures of results.)
6 EVENT DETECTION SYSTEM
We developed earthquake detection systems using ourmethodology of event detection, “Toretter.” In this section,we present this system and explain its features.
6.1 Earthquake Reporting System
We developed an earthquake-reporting system using theevent detection algorithm. Earthquake information is muchmore valuable if it is received in real time. Given someamount of advanced warning, any person would be ableto turn off a stove or heater at home and then seekprotection under a desk or table if such a person were tohave several seconds’ notice before an earthquake actuallystrikes an area. It goes without saying that, for such awarning, earlier is better.
Vast amounts of work have been done on intermediate-term earthquake prediction in the seismology field (e.g.,[21]). Various attempts have also been undertaken toproduce short-term forecasts to realize an earthquakewarning system by observing electromagnetic emissions
Fig. 10. Earthquake location estimation based on tweets. Balloons showthe tweets related to an earthquake. The cross shows the earthquakeepicenter. Red represents early tweets; blue shows later tweets.
TABLE 3Location Estimation Accuracy of Earthquakes and a Typhoon Trajectory from Tweets
For each method, we present the difference of the estimated latitude and the longitude to the actual ones, and their euclidean distance. Smallerdistance reflects better performance. With the sampled particle filter, we use mean values for sampling method, and sampled 300 users.
Fig. 11. Typhoon trajectory estimation based on tweets.
Fig. 13. Time complexity of weighted particle filter and sampled particlefilters with each sampling method: x-axis, number of samples; y-axis,mean squared error.
Fig. 12. Performances of the weighted particle filter and the sampledparticle filters with respective sampling methods; x-axis: number ofsamples; y-axis: euclidean distance error.

from ground-based sensors and satellites [22]. In Japan, thegovernment has allocated a considerable amount of itsbudget to mitigating earthquake damage. In fact, anearthquake early warning service has been operated byJMA since 2007. It provides advance announcements of theestimated seismic intensities and expected arrival times.
6.2 Proposed System
The proposed system, called Toretter,12 has been operatedsince August 8, 2010. A system screenshot is depicted inFig. 14. Users can see the detection of past earthquakes.They can register their e-mails to receive notices of futureearthquake detection reports.
It alerts users and urges them to prepare for theimminent earthquake. It is hoped that a user receives thee-mail before the earthquake actually affects that area.
We evaluate various conditions under which alarms might
be sent to choose better parameters for our proposed system.
We set alarm conditions as Ntweet positive tweets comes in
10 minute. We evaluate those methods byPrecision ¼ Nearthquake
Nalarms
and Recall ¼ Nearthquake
Allearthquake(Nearthquake: Number of earthquakes
detected correctly, Nalarms: number of alarms, Allearthquake:
number of all earthquakes that occurred).
Fig. 15 shows the performance of our system in each
alarm condition using 1,136 earthquakes during 19 months
from Aug 2009 to Feb 2011. We evaluate our system when
we set Ntweet ¼ 5; 10; 20; 30; 40; 50; 60; 70; 80; 90; 110. Judging
from results in Fig. 15 , the precision and the recall of our
system is trade off. We detected 93 percent of earthquakes
that were stronger than JMA seismic intensity scale13 3 or
higher when we set Ntweet ¼ 10 (In the middle graph of
Fig. 15. However, the precision is very low, which means
the system produces many false-positive alarms in such
cases. While, if we set Ntweet ¼ 100, we can detect only
80 percent of earthquakes stronger than scale 3, but
75 percent of alarms are correct.We investigated the reasons underlying errors of our
system. These errors are divided into errors of two types.
The first type is the case of detecting one earthquake several
times. We designate such errors as “multiple detection.” The
second type includes cases other than “multiple detection.”
We designate this type as “incorrect detection.” Table 4
shows rates of multiple detection for each JMA seismic
intensity scale rating. From Table 4, large earthquakes
engender multiple detection. It is thought that people post
more tweets for a longer period after strong earthquakes.We ignore errors by multiple detection and recalculate
the precision of our system. (If people receive several
alarms in short time span, they can understand that those
alarm come from the same earthquake). These results are
presented as “Presented(Multi)” in Fig. 15. The precision
increase by about 20 percent after we remove an affection of
multiple detection errors.Judging from the objective of this research, our system
must detect all strong earthquakes (stronger than scale 4)
and produce fewer false-positive alarms. Therefore, we
should set Ntweet ¼ 40 to warn people to escape from a
series of events caused by the earthquake.
Fig. 15. Earthquake detection performance for 19 months from Aug2009 to Feb 2011. Top : performance for earthquakes more than scale2. Middle : performance for earthquakes more than scale 3. Bottom :performance for earthquakes more than scale 4. x-axis: the number oftweets need to make an alarm in 10 minutes.
Fig. 14. Screenshot of Toretter, an earthquake reporting system.
12. It means “we have taken it” in Japanese.13. The JMA seismic intensity scale is a measure used in Japan and
Taiwan to indicate earthquake strength at a certain location. Unlike theRichter magnitude scale, the JMA scale reflects the degree of shaking at apoint on the earth’s surface.
TABLE 4Earthquake Detection Performance for
Two Months from August 2009
“Multiple detection errors.”

Fig. 16 presents the frequency distribution of the time tosend notification of earthquakes by e-mail during one year,all of which our system detected. The first tweet of anearthquake is usually made within a minute or so. Thedelay can result from the time for posting a tweet by a user,the time to index the post in Twitter servers, and the time tomake queries using our system. Our system sent e-mailswithin a minute and half on average, and sent 13 percent ofthem within a minute. That delivery is far faster than therapid broadcasts of announcements of JMA, which arewidely broadcast on TV; on average, a JMA announcementis broadcast 6 minutes after an earthquake occurs.
Based on these results, we infer that our system probablyhas a high recall rate and medium precision. Sometimesthe system produces a false alarm when a strong earth-quake occurs or when several earthquakes occur during asingle day. The current system uses only a static conditionfor giving an alarm: “Ntweet tweets within 10 minutes.” Wemust change the use of this condition dynamically toincrease the precision of the system, particularly in terms ofthe repetition and intensity of earthquakes.
7 RELATED WORK
Twitter is an interesting example of the most recent type ofsocial media. Numerous researchers have examined Twitter.
Regarding similar research to that presented in thispaper, some researchers have attempted topic detectionusing Twitter. Cataldi et al. proposed a novel method todetect emerging topics using a keyword-based topic graph[23]. They succeeded in detecting news keywords that arepopular in Twitter. For instance, Eyjafjallajokull (a volcanoin Iceland) and Samaranch (the previous President of IOC,who died in April 2010). Marc et al. divided increasinglypopular keywords on Twitter into patterns of various kindsusing SOM, thereby demonstrating that Twitter userscontribute to the discussion of these trends.
Aside from the studies introduced in Section 1 and thesestudies, several others have been done. We classify studiesdealing with Twitter or data on Twitter into three groups.
First, some researchers specifically examine the networkstructure of Twitter and investigate Twitter networkfeatures of various kinds. Java et al. analyzed Twitter asearly as 2007. They described the social network of Twitterusers and investigated the motivations of Twitter users [2].Haewoon et al. crawled a vast amount of Twitter data,
analyzed the Twitter follower-following topology andranked users by Pagerank [4]. Huberman et al. analyzedmore than 300 thousand users. They discovered that therelation between friends (defined as a person to whom auser has directed posts using an “@” symbol) is the key tounderstanding interaction in Twitter [3].
Second, some researchers have examined characteristicsof Twitter as social media. Recently, Boyd et al. havecontinued their investigation of retweet activity, which is theTwitter-equivalent of e-mail forwarding, by which userspost messages that were originally posted by others [5].Tumasjan et al. crawled many tweets referring to theelection in Germany and attempted to predict the results ofthe election: which political parties would win the election[6]. �Oconnor extracts public opinion from Twitter usingsentiment analysis and reports the possibility of using aproposed method instead of polls [24].
Third, some studies elucidate the benefits of novelapplications of Twitter: Ebner and Schiefner establish amicroblogging community and studies how to use Twitteras a tool for mobile e-learning [25]. The integration of theSemantic Web and microblogging was described in aprevious report [26] in which a distributed architecture isproposed and the contents are aggregated.
In contrast to the small number of academic studies ofTwitter, numerous Twitter applications exist. Some areused for analyses of Twitter data. For example, Tweet-tronics14 provides an analysis of tweets related to brandsand products for marketing purposes. It can classifypositive and negative tweets, and it can identify influentialusers. The classification of tweets might be done similarlyto our algorithm. Web2express Digest15 is a website thatautodiscovers information from Twitter streaming data tofind real-time interesting conversations. It also uses naturallanguage processing and sentiment analysis to discoverinteresting topics, as we do in our study.
Various studies have analyzed web data (aside from thatof Twitter), particularly addressing its spatial aspects. Themost relevant study to ours is one by Backstrom et al. [27].That study used queries with location (obtained by IPaddresses), and presented a probabilistic framework forquantifying spatial variation. The model is based on adecomposition of the surface of the earth into small gridcells. The framework finds a query’s geographic center andspatial dispersion. Although the motivation is very similarto that which spurs our study, the events to be detecteddiffer. Some examples are that people might not make asearch query earthquake when they experience an earth-quake. Therefore, our approach complements their work.Similarly to our work, Mei et al. targeted blogs andanalyzed their spatiotemporal patterns [28]. They presentedexamples for Hurricane Katrina, Hurricane Rita, and theiPod Nano (Apple Computer Inc.). The motivation of thatstudy is similar to ours, but Twitter data are more timesensitive; our study examines even more time-critical eventssuch as earthquakes.
Some studies have specifically investigated collaborativebookmarking data, as Flickr provides, from a spatiotempor-al perspective: Serdyukov et al. describes investigations of
Fig. 16. Frequent distribution of the time to send alarm e-mail. (x-axis:time to send e-mail[sec] y-axis: frequency of earthquakes, alarm trigger:40 tweets in 10 minutes).
14. http://www.tweettronics.com.15. http://web2express.org.

generic methods for placing photographs from Flickr on the
world map [29]. Rattenbury et al. [30] specifically examines
the problem of extracting place and event semantics for tags
that are assigned to photographs on Flickr. They propose
scale-structure identification, which is a burst-detection
method based on scaled spatial and temporal segments.Location estimation studies are often done in the field of
ubiquitous computing. Estimating an object’s location is
arguably the most fundamental sensing task in many
ubiquitous and pervasive computing scenarios. Represent-
ing locations probabilistically provides a unified interface
for location information, which enables us to produce
applications that are independent of the sensors used, even
when using starkly different sensor types such as GPS and
infrared badges [11], or even Twitter. Kalman filters,
multihypothesis tracking, grid-based, and topological ap-
proaches, and particle filters are well-known algorithms
used for location estimation. Hightower and Borriello
described the application of particle filters to location
sensors deployed throughout a lab building [31]. More than
30 lab residents were tracked. Then their locations were
estimated accurately using the particle filter approach.
8 DISCUSSION
Many studies have been undertaken to monitor the social
situation by treating participants in social media, such as
those using Twitter, as social sensors. However, most such
studies are aimed at observation of long-term changes of
social situations. Our research is an early approach to use
Twitter as a social sensor for detection of real-time events.Additionally, it is meaningful that we apply methods
for event detection using ordinal physical sensors for event
detection by social sensors. The field of event detection
using physical sensors has already been developed.
Methods of many kinds exist in the field. Therefore, it is
possible that events of many kinds can be observed from
Twitter through application of those methods. Our
research has produced one of the first approaches to use
such methods.We intend to expand our system to detect events of
various kinds using Twitter.Our model includes the assumption that a single instance
of the target event exists. For example, we assume that
plural earthquakes or typhoons do not occur simulta-
neously. Although that assumption is reasonable for these
cases, it might not hold for other events such as traffic jams,
accidents, and rainbows. To realize multiple event detec-
tion, we must produce advanced probabilistic models that
can accommodate multiple event occurrences.A search query is important for seeking tweets that might
be relevant. For example, we set query terms as earthquake
and shaking because most tweets mentioning an earthquake
occurrence use either word. However, to improve the recall,
it is necessary to obtain a good set of queries. In fact,
advanced algorithms can be useful for query expansion,
which remains as a subject of our future work.
9 CONCLUSION
As described in this paper, we investigated the real-time
nature of Twitter, devoting particular attention to event
detection. Semantic analyses were applied to tweets to
classify them into a positive and a negative class. We
regard each Twitter user as a sensor, and set the problem
as detection of an event based on sensory observations.
Location estimation methods such as particle filtering are
used to estimate the locations of events. As an application,
we developed an earthquake reporting system, which is a
novel approach to notify people promptly of an earth-
quake event.Microblogging has real-time characteristics that distin-
guish it from other social media such as blogs and
collaborative bookmarks. As described in this paper, we
presented an example that leverages the real-time nature of
Twitter to make it useful in solving an important social
problem: natural disasters. It is hoped that this paper will
provide some insight into the future integration of semantic
analysis with microblogging data.
REFERENCES
[1] M. Sarah, C. Abdur, H. Gregor, L. Ben, and M. Roger, “Twitterand the Micro-Messaging Revolution,” technical report, O’ReillyRadar, 2008.
[2] A. Java, X. Song, T. Finin, and B. Tseng, “Why We Twitter:Understanding Microblogging Usage and Communities,” Proc.Ninth WebKDD and First SNA-KDD Workshop Web Mining andSocial Network Analysis (WebKDD/SNA-KDD ’07), pp. 56-65, 2007.
[3] B. Huberman, D. Romero, and F. Wu, “Social Networks thatMatter: Twitter Under the Microscope,” ArXiv E-Prints, http://arxiv.org/abs/0812.1045, Dec. 2008.
[4] H. Kwak, C. Lee, H. Park, and S. Moon, “What is Twitter, A SocialNetwork or A News Media?” Proc. 19th Int’l Conf. World Wide Web(WWW ’10), pp. 591-600, 2010.
[5] G.L. Danah Boyd and S. Golder, “Tweet, Tweet, Retweet:Conversational Aspects of Retweeting on Twitter,” Proc. 43rdHawaii Int’l Conf. System Sciences (HICSS-43), 2010.
[6] A. Tumasjan, T.O. Sprenger, P.G. Sandner, and I.M. Welpe,“Predicting Elections with Twitter: What 140 Characters RevealAbout Political Sentiment,” Proc. Fourth Int’l AAAI Conf. Weblogsand Social Media (ICWSM), 2010.
[7] P. Galagan, “Twitter as a Learning Tool. Really,” ASTD LearningCircuits, p. 13, 2009.
[8] K. Borau, C. Ullrich, J. Feng, and R. Shen, “Microblogging forLanguage Learning: Using Twitter to Train Communicative andCultural Competence,” Proc. Eighth Int’l Conf. Advances in WebBased Learning (ICWL ’09), pp. 78-87, 2009.
[9] J. Hightower and G. Borriello, “Location Systems for UbiquitousComputing,” Computer, vol. 34, no. 8, pp. 57-66, 2001.
[10] M. Weiser, “The Computer for the Twenty-First Century,”Scientific Am., vol. 265, no. 3, pp. 94-104, 1991.
[11] V. Fox, J. Hightower, L. Liao, D. Schulz, and G. Borriello,“Bayesian Filtering for Location Estimation,” IEEE PervasiveComputing, vol. 2, no. 3, pp. 24-33, July-Sept. 2003.
[12] T. Sakaki, M. Okazaki, and Y. Matsuo, “Earthquake ShakesTwitter Users: Real-Time Event Detection by Social Sensors,”Proc. 19th Int’l Conf. World Wide Web (WWW ’10), pp. 851-860,2010.
[13] Y. Raimond and S. Abdallah, “The Event Ontology,” http://motools.sf.net/event/event.html, 2007.
[14] T. Joachims, “Text Categorization with Suport Vector Machines:Learning with Many Relevant Features,” Proc. 10th European Conf.Machine Learning (ECML ’98), pp. 137-142, 1998.
[15] X. Liu, S. Zhang, F. Wei, and M. Zhou, “Recognizing NamedEntities in Tweets,” Proc. 49th Ann. Meeting of the Assoc. forComputational Linguistics: Human Language Technologies (HLT ’11),pp. 359-367, June 2011.

[16] A. Ritter, S. Clark Mausam, and O. Etzioni, “Named EntityRecognition in Tweets: An Experimental Study,” Proc. Conf.Empirical Methods in Natural Language Processing, 2011.
[17] M. Arulampalam, S. Maskell, N. Gordon, and T. Clapp, “ATutorial on Particle Filters for Online Nonlinear/Non-GaussianBayesian Tracking,” IEEE Trans. Signal Processing, vol. 50, no. 2,pp. 174-188, Feb. 2002.
[18] J. Leskovec, L.A. Adamic, and B.A. Huberman, “The Dynamics ofViral Marketing,” Proc. Seventh ACM Conf. Electronic Commerce (EC’06), pp. 228-237, 2006.
[19] Y. Matsuo and H. Yamamoto, “Community Gravity: MeasuringBidirectional Effects by Trust and Rating on Online SocialNetworks,” Proc. 18th Int’l Conf. World Wide Web (WWW ’09),pp. 751-760, 2009.
[20] W. Zhu, C. Chen, and R.B. Allen, “Analyzing the Propagation ofInfluence and Concept Evolution in Enterprise Social NetworksThrough Centrality and Latent Semantic Analysis,” Proc. 12thPacific-Asia Conf. Advances in Knowledge Discovery and Data Mining(PAKDD ’08), pp. 1090-1098, 2008.
[21] E. Scordilis, C. Papazachos, G. Karakaisis, and V. Karakostas,“Accelerating Seismic Crustal Deformation before Strong Main-shocks in Adriatic and Its Importance for Earthquake Prediction,”J. Seismology, vol. 8, pp. 57-70, http://dx.doi.org/10.1023/B:JOSE.0000009504.69449.48, 2004.
[22] T. Bleier and F. Freund, “Earthquake [earthquake warningsystems],” IEEE Spectrum, vol. 42, no. 12, pp. 22-27, Dec. 2005.
[23] M. Cataldi, L. Di Caro, and C. Schifanella, “Emerging TopicDetection on Twitter Based on Temporal and Social TermsEvaluation,” Proc. 10th Int’l Workshop Multimedia Data Mining(MDMKDD ’10), pp. 1-10, 2010.
[24] B. O’Connor, R. Balasubramanyan, B.R. Routledge, and N.A.Smith, “From Tweets to Polls: Linking Text Sentiment to PublicOpinion Time Series,” Proc. Int’l AAAI Conf. Weblogs and SocialMedia, 2010.
[25] M. Ebner and M. Schiefner, “Microblogging - More than Fun?”Proc. IADIS Mobile Learning Conf., pp. 155-159, 2008.
[26] A. Passant, T. Hastrup, U. Bojars, and J. Breslin, “Microblogging:A Semantic Web and Distributed Approach,” Proc. Fourth Work-shop Scripting for the Semantic Web (SFSW ’08), http://data.semanticweb.org/workshop/scripting/2008/paper/11, 2008.
[27] L. Backstrom, J. Kleinberg, R. Kumar, and J. Novak, “SpatialVariation in Search Engine Queries,” Proc. 17th Int’l Conf. WorldWide Web (WWW ’08), pp. 357-366, 2008.
[28] Q. Mei, C. Liu, H. Su, and C. Zhai, “A Probabilistic Approach toSpatiotemporal Theme Pattern Mining on Weblogs,” Proc. 15thInt’l Conf. World Wide Web (WWW ’06), pp. 533-542, 2006.
[29] P. Serdyukov, V. Murdock, and R. van Zwol, “Placing FlickrPhotos on a Map,” Proc. 32nd Int’l ACM SIGIR Conf. Research andDevelopment in Information Retrieval (SIGIR ’09), pp. 484-491, 2009.
[30] T. Rattenbury, N. Good, and M. Naaman, “Towards AutomaticExtraction of Event and Place Semantics from Flickr Tags,” Proc.30th Ann. Int’l ACM SIGIR Conf. Research and Development inInformation Retrieval (SIGIR ’07), pp. 103-110, 2007.
[31] J. Hightower and G. Borriello, “Particle Filters for LocationEstimation in Ubiquitous Computing: A Case Study,” Proc. Int’lConf. Ubiquitous Computing (UbiComp ’04), pp. 88-106, 2004.
Takeshi Sakaki received the BS and MSdegrees from the University of Tokyo, Japan,in 2004 and 2006, respectively. Currently, he isworking toward the PhD degree from theUniversity of Tokyo, Japan. His research inter-ests include natural language processing, Webmining, and artificial intelligence.
Makoto Okazaki received the BS degree fromthe University of Tokyo, Japan, in 2010. Hisresearch interests include Web mining, datamining, and artificial intelligence.
Yutaka Matsuo received the BS, MS, and PhDdegrees from the University of Tokyo, in 1997,1999, and 2002, respectively. He is an associateprofessor at the Institute of Engineering Innova-tion, The University of Tokyo, Japan. He joinedNational Institute of Advanced Industrial Scienceand Technology (AIST) from 2002 to 2007. He isinterested in social network mining, text proces-sing, and semantic web in the context of artificialintelligence research.
. For more information on this or any other computing topic,please visit our Digital Library at www.computer.org/publications/dlib.