The Shift from U.S. Production of Commodity Petrochemicals to … · petrochemical-producing...
162
,THE SHIFT FROM U.S. PRODUCTION OF COMMODITY PETROCHEMICALS TO VALUE-ADDED SPECIAL TY CHEMICAL PRODUCTS AND THE POSSIBLE IMPACT ON U.S. TRADE Report on Investigation No. 332-183 Under Section · 332{b) of the Tariff Act of 1930 0 USITC PUBLICATION 16 77 APRIL 1985 United States International Trade Commission I Washington, D.C. 20438
Transcript of The Shift from U.S. Production of Commodity Petrochemicals to … · petrochemical-producing...
,THE SHIFT FROM U.S. PRODUCTION OF COMMODITY PETROCHEMICALS TO VALUE-ADDED SPECIAL TY CHEMICAL PRODUCTS AND THE POSSIBLE IMPACT ON U.S. TRADE
Report on Investigation No. 332-183 Under Section · 332{b) of the Tariff Act of 1930
0
USITC PUBLICATION 16 77
APRIL 1985
United States International Trade Commission I Washington, D.C. 20438
UNITED STATES INTERNATIONAL TRADE COMMISSION
COMMISSIONERS
Paula Stern, Chairwoman
Susan W. Llebeler, Vice Chairman .
Alfred E. Eckes Seeley G. Lodwick
David a. Rohr
Prepared principally by
Eric Land, Project Leader
Edward J. Matusik, Jr.
Edward J. Taylor
Office of Industries
Acting Director, Vern Simpson
Address all communications to
Kenneth R._ Mason, Secretary to the Commission U11ited S~ates International Trade Commission
·w ashington, DC 20436
PREFACE
On April 5, 1984, the United States International Trade Commission, in accordance with the provisions of section 332(b) of the Tariff Act of 1930 (19 U.S.C. 1332(b)), instituted investigation No. 332-183 on its own motion for the purpose of assessing the shift from U.S. production of commodity petrochemicals to value-added chemical products and the possible impact on U.S. trade. Notice of the investigation was published in the April 18, 1984 issue of the Federal Register (49 F.R. 15286). Information for this report was obtained from Commission fieldwork, industry submissions and publications, the Commission.files, other Government agencies, and other sources. This report assembles and presents, in a readily usable form, information and data, from diverse sources, on the changing competitive position of the United States and other nations in the world petrochemical market.
The U.S. petrochemical industry remains the largest producer of commodity petrochemicals, specialty chemicals, and all other petrochemical industry products. However, developments in certain conventional energy-rich nations could impact the future direction of the U.S. industry and ~hange its strategic goals. Nevertheless, the U.S. industry is expected to retain its ~nhere~t commodity petrochemical orientation, and also to develop a strong specialty chemical indust~y position.
This report presents the findings of the Commission's investigation. It includes analyses of the factors that influence the U.S. petrochemical industry, such as U.S. demand, production, consumption, and trade, as well as information concerning the petrochemical industries of other traditional petrochemical-producing nations. The report also discusses the current status of commodity petrochemic;:al development in conventional energy-rich nations. Using the co.llected information concerning the changing world petrochemical situation, this report examines and assesses the changes expected to occur in the U.S. petrochemical industry and quantifies the possible future impacts on U.S. industry output and employment using the U.S. Department of Labor's input-output model of the U.S. economy.

iii
. CONTENTS
Executive summary----------------------------------------------------------U. S. petrochemical industry status---------------------------------------
Cornmodity ·petrochemicals-------~·-------------------------------------IndustrY structure------------------------------------------------Competitive status: .
Background-------------:.... _____ ·:_ ___ :._ ____________________________ _
Recent .developments: .
::~~!~:~================================================== Anunonia--~-----...:--------~------------:_ ___________________ _ Specialty chemicals---------:---------:_---~-~-------~-----~------------.. industry structure---------.-:.._ __ .:_:_ __ '."".:_ ___
7.:.. ____ _. __________________ _
Competitive status....: ____________ -:- ___ :_ ___________ :_ _________________ _
Oilfield chemicals---:_ ____ .:_.:_ ___ ~-----~------------------------Electronics chemicals-------------------,---------------------Spec ial ty polymers--------------------------------------------Diagnostic chemical~.:_ __________________ ;_ __ -=---------------------Cataly~ts--:....-----.:..------------~------~---~-------------------
World petrochemical industry development---------------------------------Traditional commodity petrochemical producers:
Western Europe--------------~----------------~--------------------· Bas is for development------:__: ______________ :_ _________________ _
Current competitiv~ status-----:-------------------------------West Germany----------------------------------------------
. I
France---------------------------------------------------. . . . .
United Kingdom---....:---------------------------------------O~her Weste~ European countries---:-----~-----------------
Japari: . · Basis for development-------:--------------~--------------------... , . . . . . . ( . ' .
·· · Current· competitive status"'.""'.""----------------------------------Conventional energy-rich nations:
Canada~~~-------~-------~-------------------~---------------------Basis for develo.pment---------------------------------------:--
., Current ;competitive statU$-..::_~---------------"'."-----------------Saudl Arabia:·.. : . . . . . · .. :
Bas is for development...:.'. _ _: ___ ..:._...,. _____ · __ _:~-----------------------· current comp°eti ti ve "s\~~us--~---.---:------------.,.---------------
vii 1 9
12
16
21 25 30 33 34 36 37 39 40 43 45 48
49 49 49 50 52 53 54
55 55
59 59 60
62 62
Other conventional energy:-rich nations: . .: . _K~xfoo---:---·--.~~-:--:----;:.--.-""'...:_..:. _ _,:7~:~.:.:_,,,, _______ _:_:------.---------- 64 .Kiddle East nations--------------:~-,-------------:-------------- 65
U.S.
. -Niged~~ - _._ __ ..:.::._-:_--.~.~~~-·.:.~'----'-: __ _:_~~:-·:_ _______ '."" ___ :-------------- 6 1
· Far East nations------,-----,-----------------~---------------- 68
Nonm:~!~!t e~~{~:~~~=========~======~'=j~===·=·===========================. .. ~~ People's Repub lie of. China~--~----:----:._~~--~----~-~-;---,...--,...--...,------ 7 2
~~tro~hemica1.· ~t:tditstry s~rat~giei;_:....--:--~-,-:....-:-_~_;,...·-· __ --:---:---,------------ 7 5 Diversification: ·
Geographic diversification---------------------------------------Vertical diversification:_----------------------------------------Horizontal diversification----------------------------------------
Other strategies-----------------------------------------------~-------.:.·......... .._ . .._ ·. . ... • ···.. -:.·- · ... .:.·
77 78 81
'83
iv
CONTENTS
World trade patterns: Overview----- - ----------- - - -----------------------------------:--:----·---- 8 7 U.S. trade------------------------------------------------------------ 91
U.S. merchandise trade-------------------------------------------- 91 Imports of merchandise-------------------------.--------------- 96 Exports of merchandise--------------------7------------------- 96
U.S. chemical trade----------------------------_:___________________ 97 Ethylene and its derivatives------------;----------------~---- 99 Methanol------------:_----------------------------------------- 106 Ammonia---------~------------------------------------:-:-~------ 111
Possible implications of a shift from U.S. production of commodity petrochemicals to value-added specialty chemicals~------------~-~------------ 116
1.
2.
3.,. 4. 5. 6. 7. 8. 9 •.
10. 11. 12. 13.
14.
15.
Future supply-demand scenarios---------------------------------------- 117 Commodity petrochemicals------------------------------------------ 117 Specialty chemicals--------------------------:----~---------------- 128 Integrated scenarios----------------------~----------------------- lj3
Quantitative impacts of hypothetical changes on the U.S. industrial economy: . , "
Input/Output model--------------__: _____________________ :.. ___ ..., _____ :_:___ 134
Changes in industry output-------------------:-L-:,----7_:~_: __ ·~------- 134 Changes in industry employment---_:-------------------------------- 135 Quantitative impact of "shift"---------------------;--_________ :._____ 135
Figures
Distribution of major petrochemical feedstocks to produce.ethylene in the United States----------------------------------------------
Major commodity petrochemicals produced from natural. gas-based feedstocks, and their derivatives---------------------,-------:-.7 --------:-
Ethylene: Feedstock cost and unit sales value indexes-----;---------Ethane: U.S. domestic demand---------------------------------------Methanol: Feedstock cost and u~it s~les value indexes--------------Ammonia: Feedstock cost and unit sales value indexes-·--7-----------Share of sales of product line by Company "A"------------------------Value of sales of product lines by Company "A'; ________ _:_ _____________ _
Share of sales of product line by Company "B":._------------:------------Value of sales of product lines by Company "B"---------:_ __ ~:._ ________ _ Merchandise: U.S. imports, exports, and trade deficit, 1977-83------Chemicals: U.S. imports, exports, and trade surplus, 1977-83--------0rganic chemicals: U.S. balance of trade with commodity petro-
chemical producing areas, 19 7 7-83--------------------..:.-----:--::---:----Chemicals: Chemical-producing nations share of the world exports,
1983--------_: ___________________________________________ :_~---------
Share of chemicals and allied products industry represente~ by commodity petrochemicals and specialty chemicals, 1980---~------
10
13 22 24 28 32 79 80 82 84 92 98
100
101
138
v
CONTENTS
16. Share of chemicals and allied products industry represented by . commodity petrochemicals and specialty chemicals, as projected by
- the· Department of Labor I/O model, 1985------~--------------~----~- 139 17. Share of chemicals. and allied products industry represente.d by .
commodity petrochemicals and specialty chemicals, as projected by . . · · the Department of Labor I/O model, 1990-----------------.;_----'---~-- 140
18. - Share of chemicals and allied products industry represented by . ·commodity ·petrochemicals and.specialty chemicals,' as projected by the Department of Labor 1/0 model, 1995---------------.:.____________ 141
Tables
1. ·Ethylene, methanol, and ammonia: U.S. production, 1955, 1960, 1965, ·i970-8·3~---.:.--.,-------·---------------------------:... ___________ :_·----~·-
2. -·Ethlyene, methanol, and ammonia: Apparent domestic consumption, 1955, 1;960, 1965 ,· and 1970-'83~--------.:. _____________________ :.:. ___ _. __
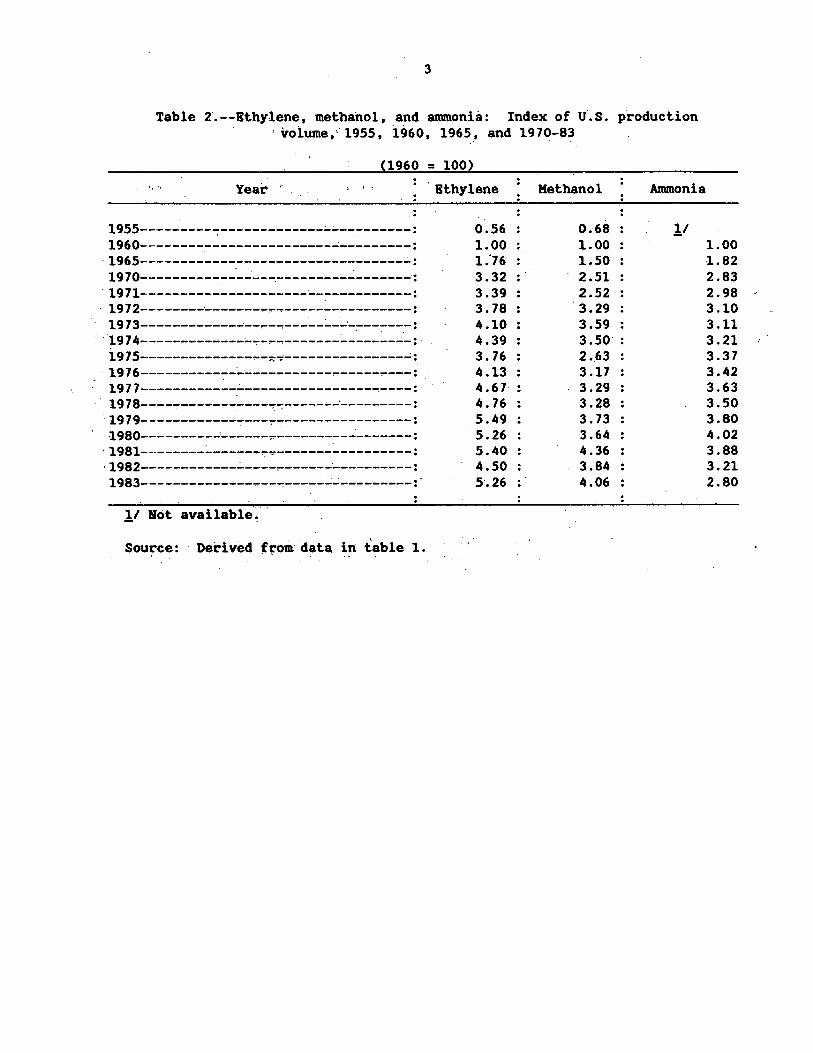
3. Ethylene, methanol, and ammonia: Index of U.S. production volume 'based on 1'960=100; 1955, 1960, 1965, and· 1970-83-------:... ____ _::_ ____ _
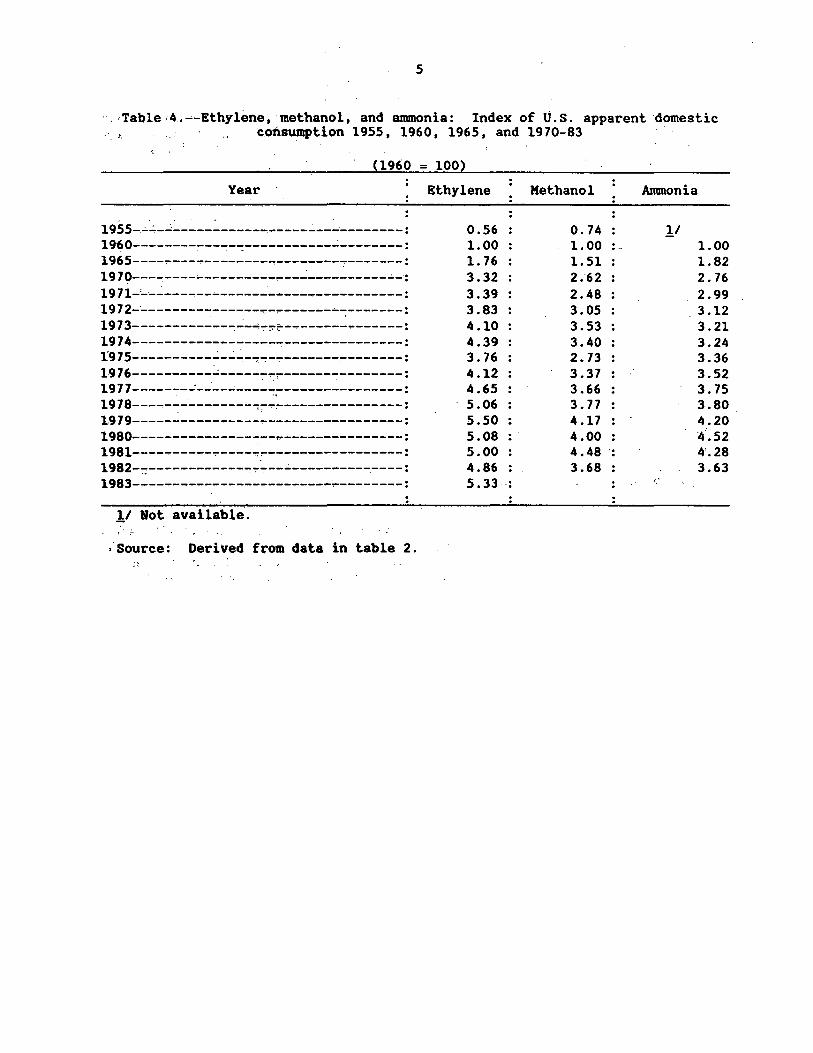
4. · Ethylene:, methariot, . and ammonia: U.S. apparent consumption' based on 1960:100; 1955 t 1960 I 19'65·, arid 19 70-83---C...------------------------
' .5 .. · ·chemicals: u--. s. and world• exports, 1960:._83-_:_ __ _:_ ___ -________ .:.._...:::.::.... ____ _
6·. Sales value of chemic'al industry production in Western Europe, Japan and· the -United States, 1960-83:... ______ ._.:..._~_:_ ______________ .:_ ___ __; _____ _
7. Crude- 'petroleum:' Refiner acquisition cost, 1970-83-----------------.~ 8. · Crude petroleum and-"natural gas: (J.S. average annual wellhead price,
1955-83---'-'---~~--------~ __ ..:_ ____ :_ _________ ~ ____ ;... __ _. ____ .:._.;.. ________ _
9 .: >catalysts: Industrial process users and associated products...:-.:..:... __ _:(·~ 10. Merchandise:· Net trade balance as reported by traditional petro-
chemical. producers, 19 7 2~83--------'------.:..:... ___ .:__: _________ . _____ ·.:... __ :... __
11. - Chemicals: Net trade balance as reported by traditional· p'etro-chemical- producers, 1972-83.:...---~-:... __ _..:. ___ .:_ ____________ . __ :.._.:..-·--------
12. Merchandise: Exports from traditional petrochemical-producing . . ·. - areas.,: 1970.!..83---.:.::.... ___________________ .:.._· ____ .:_ ____________________ . __
13. Chemicals;.. Exports -from traditional petrochemical-producing areas, ·'' ., ·1.9 70-83-----~------------.;_ _____________ ·_.:. ___ _._. _______ :_ _______ .:. ___ ;__;...
14 .- Merchandise: U .·s; imports and exports to major trading partners, . . 1963, 196 7, 1972, and 1977-83, and estimated growth rates 1979-83--
15. Chemicals: U.S. imports and exports to major trading partners, -,_,,·· 1963; 196 7, 19•7·2, and 1977-83, and estimated growth rates .1979-83.:...·_
16.- Polyethylene resins:· u·:s. exi:>orts· of domestic merchandise~ by prin-cipal~markets, 1979-83-----..:.-----------------c-...:. _____ :- __ ;... ___ _...:. _____ ...:_
17 .. -Ethylene oxide: u. s. exports of domestic merchandise I by principal markets. 19 79-83-· __ .:._ ___ .:_ ________ ..:_ __________ _. ___ .;, _________ ..:_ __________ .2_ , -
18. ·Ethylene dichloride: U.S. exports.of domestic merchandise, by prin-: c.ipal markets, 1979-83----------=-----:.:. _____________ .:_ ________________ :.:.
2
3
4
5 16
17 18
19 47
88
89
93
93
94
95
102
103
104
vi
CONTENTS
19. Ethylene glycol: U.S. exports of domestic merchandise, by principal markets, 1979-83---------------------------------~----------------- 105
20. Polyethylene resins: u.s imports for consumption, by principal sources, 1979-83------------~--------------------~----...:-~---------- 107
21. Ethylene oxide: U.S imports for consumption, by principal sources, 1979-83--------------------------------~--------------------------- 108
22. Ethylene dichloride: U.S imports for consumption, by.principal sources, 1979-83------------------~-------~------,------------------ 109
23. Ethylene glycol: U.S imports for consumption, by principal sources, 1979-83------------------------------------------------------------ 110
24. Methanol: U.S. exports of .domestic merchandise, by principal markets, 19 79-83--------------------------------------------· ------- 112
25. Methanol: u.s imports for consumption, by pr~ncipal sources, 19 7 9-83.--------'-----------,------------------...:.--------,----------:------ 113
26. Anhydrous ammonia: U.S. exports of domestic merchandise, by principal markets, 1979-83------7-------------,-7----------~------------------ 114
27. Anhydrous anunonia: u.s imports for consumptiop, by principal sources, 1979-83--------------------~---------~-------------:------,---------- 115
28. Principal assumption for the commodity petrochemical scenarios------- 118 29. Sector 46; Industrial chemicals: . Time-series data for input-output
·industries, output and employment, 1958-83------"'---------:---------- 120 30. Sector 47; Agricultural chemicals: Time-series data for input-output
industries, output and employment, 1958-83-----...:------------------- 121 31. Sector 49; Plastics materials and synthetic rubber:· Time-series data
for input-output industries, output and employment, 1958-83----·---- 122 32. Commodity petrochemicals: Actual demand, 1980, and projected demand
under Scenarios I, II, and III: 1985, 1990, and 1995--------------- 123 33. Industr_ial chemicals: U.S. imports, exports,. and balance of trade,.
1979-83---------------------------~-------:---7~-----------~-------~ 124 34. Agricultural chemicals: U.S. imports, exports.,. and balance of trade,
1979-83-------------------------------------------:---------...,------- 125 35. Plastics resins: U.S. imports, exports, and balance· of trade,
1979-83-----------------------------------------------------------'-- 126 36. Commodity petrochemicals: U.S. imports, exports,.balance of trade
~ctual data, 1980; and projected data, 1985·and 19907"-------------- 127 37. Sector 48; Chemical products, n.e.c.: Time-series data for input-
output industries, output and employment, 1958-83------~--~~------- 129 38. Chemical products: U.S. imports, exports, and balance of. trade,
1979-83---------------·---------------------~------'-------------'------ 131 39. Specialty chemicals: U.S. imports, exports., and balance or trade,
. actual data 1980; and projected data, 1985 and 1990---------------- 132 40. Petrochemicals sectors: U.S. imports, exports, and balance, or trade,
actual data 1980; and projected data, 1985 and 1990---------------- 133 41. U.S. economic output changes derived from I/O model and demand
scenarios, 1985, 1990, and 1995--------~--------------------------- 136 42. U.S. industry employment changes derived from 1/0 model and demand
. scenarios, 1985, 1990, and 1995-----------· ____ .:_____________________ 137
vii
~XECUTIVE SUMMARY ~ . . . ..... . . .. . -· ...... . .
The>u.s. petrochemical industry has entered a period of numerous changes, which are expected to have a lasting impact on it's structure and strategic orientation. These.changes are related primarily to the two crude petroleum price shocks during the 1970's, which resulted in decreased demand growth rates for commodity petrochemicals, as the worldwide recession and energy conservation tempered demand. Also, the development of state-of-the-art commodity petrochemical production capacity in nations advantaged in terms of both feedstock c.ost and -feedstock availability increased the supply of these materials. This supply/_demand imbalance led to declining profitability for commodity petrochemical producers located in the United States, as well as other traditional petrochemical-produclng areas of the world during 1979-85.
. .
Petrochemical industry-analysts uniformly recommended that certain petrochemical. producers, ·which traditionally have been strategically oriented purely toward prod\Jction of commodity petrochemicals, ~lter their strategic outlook and take advantage of the burgeoning demand for specialty chemicals. Commodity petrochemicals, derived principally from crude petroleum-based feedstocks and natural gas-based feedstocks, are the building block . . . . petrochemicals for 11UJch of the world's chemical products industries. !I These commoditi petrochemicals are sold primarily on a price basis, and all of the commoditY; petrochemical production from any of the diverse sources is considered ·to·· be ·of" equivalent· quality. ·· · · '
Specialty chemicals, meanwhile, comprise a significant, albeit somewhat arcane segment of the. U .. s. chemical industry. Specialty· chemicals are high value-added items, often t>roduced to customer specifications, and ·sold on a performance basis.
~- . ' . . . . '. . .) ~i •• ·. f • • .: ' •
, . , 'l'he,«follo.wing .are t-he·maj'or findings of t~e .cornmission's '_irivestigatio~:. ' , 1 ' ! • ~, , , • • I "f. , ~ ' ;' : ~ , •, ·.: • , • • , 'f •, . 1 ' :' '~ .: '
1. U.S. 'PETROCHEMICAL INDUSTRY. STATUS' · , ' ' . i ': .. ,·.:; : . .": _. ; .. . .. .• ") }~ \ . ' . . .·. :.. t .. . •·.. . '.1 ' '. >:
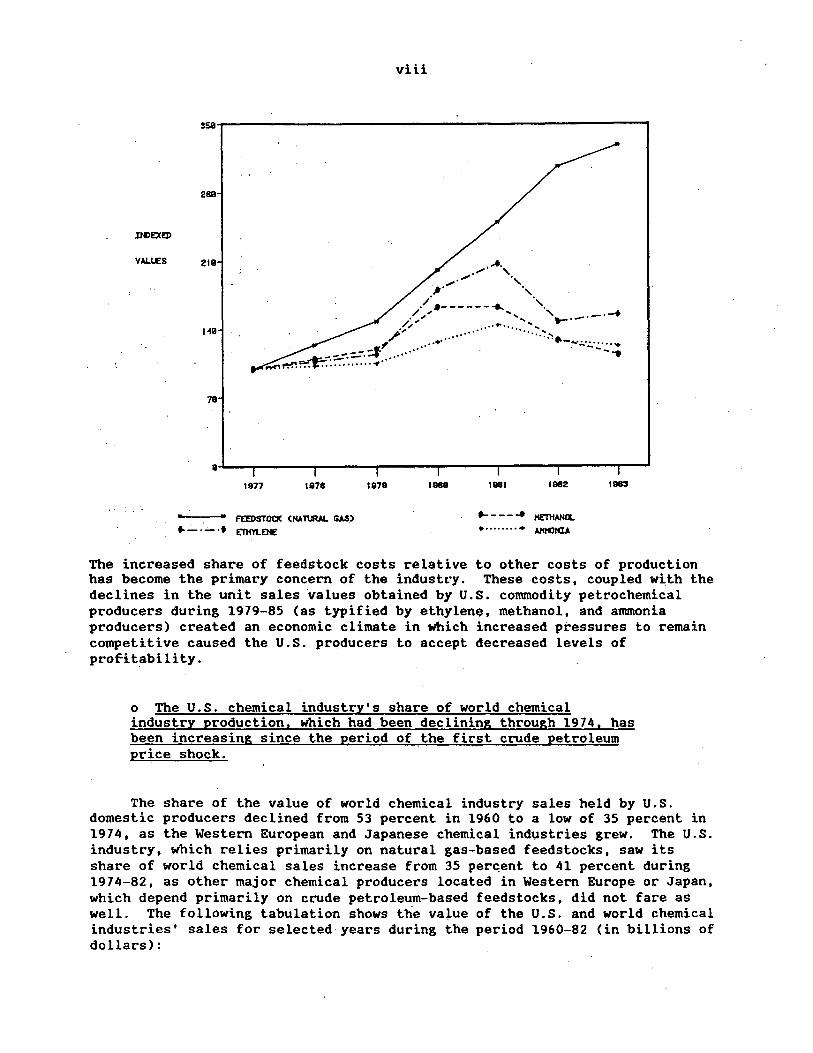
o Energy and, f.eedstock.:.costs "'Of·. Ui-S. producers of coriuriodlty petrochemicals increased by almost 229 percent during 1977-83, while unit sales values increased by only 24 percent (anunonia) to 71 percent (ethylene).
•. ~ -. ·' 'i . .. ... : ·:. . - .. .
The foliowfn:g--f~gur~«,s}low'~:r.:.i.'ndexed values for.·f'eedstock- ~osts and ·unit sales value for.three major commodity petrochemicals--ethylene, methanol:, and ammonia.
·.:.
!I This st,µdy .. concentrates on· those· coriunodity petrocheinicals' which· are deriv~,4vf~.om;natura1 gas feedstocks; :;
IK>EXEJ>
VALLES
viii
2811
..... ·"' ' ..-·""' ., ,. .,
219
./··------..... ·,, ·~"""" ............ '.,_.--.-·-+
t-49 /l" ....................... ~:-.~.~ .. - .. _ ........ ... . . , ... ·· --:::.:-.:::.::.f ..... ·· . --- ... o.n~~: ......... ..,.·
FEEl>STOCIC CNATURAL GAS.> .. _:_ .'.;... 't ETHYLENE
..... - - - ... HE"llfANCl.
......... + Al'IHONIA
The increased share of feedstock costs rel$tive to other costs of production has become the primary concern of the industry. These costs, coupled with the declines in the unit sales values obtained by U.S. commodity petrochemical producers during 1979-85 (as typified by ethylen~. methanol, and ammonia producers) created an economic climate in which increased pressures to remain competitive caused the U.S. producers to accept decreased levels of profitability.
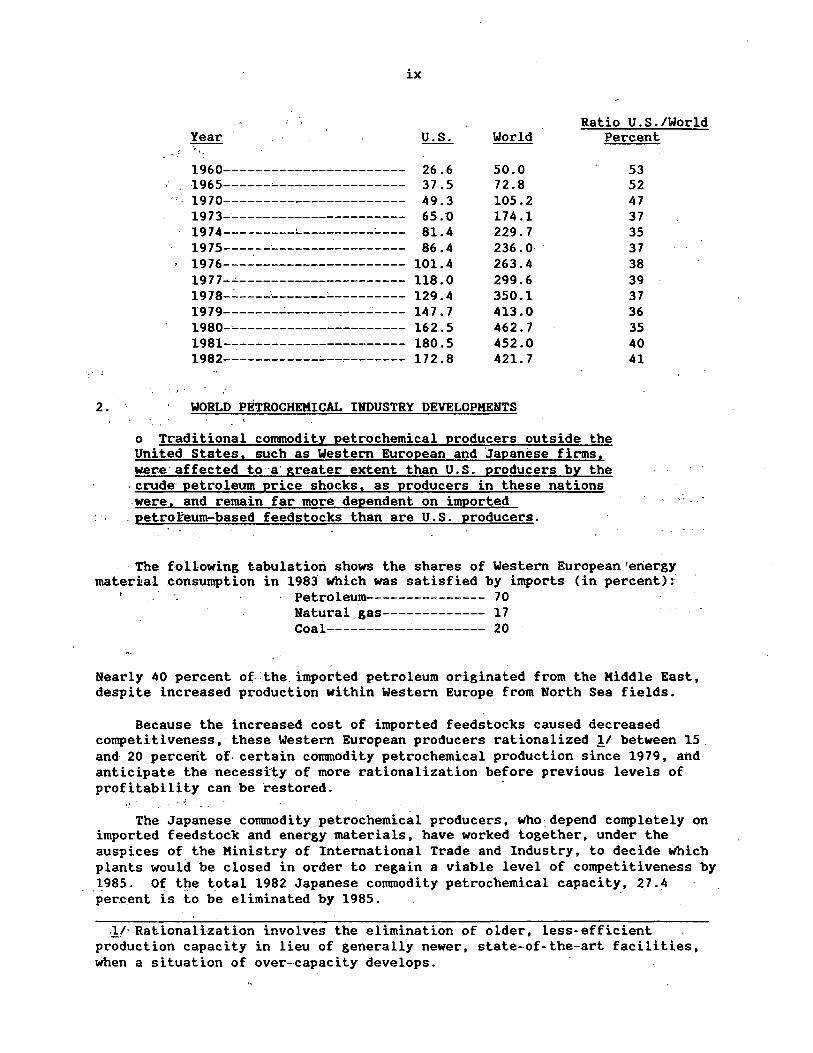
o The U.S. chemical industry's share of world chemical industry production, which had been declining through 1974, has been increasing since the period of the first crude petroleum price shock.
The share of the value of world chemical industry sales held by U.S. domestic producers declined from 53 percent in 1960 to a low of 35 percent in 1974, as the Western European and Japanese chemical industries grew. The U.S. industry, which relies primarily on natural gas-based feedstocks, saw its share of world chemical sales increase from 35 per~ent to 41 percent during 1974-82, as other major chemical producers located in Western Europe or Japan, which depend primarily on crude petroleum-based feedstocks, did not fare as well. The following tabulation shows the value of the U.S. and world chemical industries' sales for selected years during the period 1960-82 (in billions of dollars):
2.
ix
Ratio U.S./World Percent
1960-----------------------1965------~----------------
., 1970-----------------------1973-'-------~--------------
1974---------~---------~---
. i.
1975-----------------------1976-----------------------1977·~---------------------
19 7 8-~----·--------'----------1979-------~------~---~----
1980-'----------------------1981-~---------------------
1982------------'---~-------
26.6 37.5 49.3 65.0 81.4 86.4
101.4 118.0 129.4 147. 7 162.5 180.5 172.8
50.0 72.8 105.2 174.1 229.7 236 .o' 263.4 299.6 350.1 413.0 462.7 452.0 421.7
WORLD PETROCHEMICAL INDUSTRY DEVELOPMENTS
o Traditional commodity petrochemical producers outside the United States, such as Western European and Japanese firms, wer.e·affected to a· greater extent than U.S. producers by the
-crude petroleum price shocks, as producers in these nations -.were, and remain far more dependent on imported
.- petrofeum-based feedstocks than are U.S. producers. ·' .·
53 52 47 37 35 37 38 39 37 36 35 40 41
- The following tabulation shows the shares of Western European 1eriergy material consumption in 1983 which was satisfied by imports (in percent):
Petroleum--------------- 70 Natural gas------------- 17 Coal----------~--------- 20
Nearly 40 percent of ;the_ imported petroleum originated from the Kiddle East, despite increased production within Western Europe from North Sea fields.
Because the increased cost of imported feedstocks caused decreased competitiveness,· these Western European producers rationalized !I between 15. and 20 percent of- certain commodity petrochemical production since 1979, and anticipate the necessity of more rationalization before previous levels of profitability can be restored.
The Japanese commodity petrochemical producers, who-depend completely on imported feedstock and energy materials, have worked together, under the auspices of the Ministry of International Trade and Industry, to decide which plants would be closed in order to regain a viable level of competitiveness by .1985. Of the t_otal 1982 Japanese commodity petrochemical capacity, 27.4 per.cent is to be eliminated by 1985.
JI· Rationalization involves the elimination of older, less-efficient production capacity in lieu of generally newer, state-of-the-art facilities, when a situation of over-capacity develops.
x
o Commodity petrochemical development in conventional .energy-rich nations (CERN's)!/ is progressing, adding more competitive pressure to the already over~supplied world markets.
As reported in USITC Publication 1370, The Probable Impact on the U.S. Petrochemical Industry of the Expanding Petrochemical Industries in Conventional Energy-Rich Nations, during 1979-81 a significant number of CERN'S initiated programs to develop world-scale commodity petrochemical industries in an effort to build an industrial base for their economies. Kuch of the petrochemical production, based on low-cost available natural gas feedstock has begun entering the world market. Because these nations have not yet developed significant demand for these commodity petrochemicals in their domestic markets, as much as 90 percent of their production is expected to be exported to markets such as the United States, West~rn Euro~e, or Japan.
The Canadian commodity petrochemical industry development, located in the natural gas-rich Province of Alberta, is expected to enable Canadian producers to double their 1980 share of th~ world market for certain petrochemicals by 1990, particularly ethylene ~erivatives. Canadian methanol producers also expect to increase their domestic capacity thre.e'--fold between 1980 and 1990.
Commodity petrochemical deveiopment in saud:i ~~·~b.ia based .on. low-cost, available feedstocks has been advancing at a fa.star pace than originally anticipated. The Saudi facilities, which are among the most efficient and modern plants in the world, and the marke.ting agreements wi:th joint venture partners from the United States, Western Europe, and ·Japan~ prc>"vide the Saudi producers with additional compet~tive advantages in t:he world ·market.·
The development of additional commodity .petrochemical capacity in other CERN's, such as Mexico and Nigeria, ·is progressing at a' slower rate, QUt are likely'to increase worid commodity petrochemical capacity by a significant amount during 1990-95. ~/ ·
o Energy and feedstock self-sufficiency highlight the nonmarket economies' potential for futur~ commodity petrochemical development.
The major motivational force behind the plans for the development of. export-oriented commodity petrochemical industries in tlte CERN'$ is t~~ need· for foreign capital to purchase agricultural products from.Western nations. The Soviet Union, with more than one-·third of the world• s proven reset".ves of natural gas available for use as a feedstock, now is reported to have the fourth largest chemical industry in the world.
1/ The term "CERN's" was coined to represent nations which ar~ advantaged in te~ of price and availability of crude petroleum and natural gas.
J;_I "Remedying Petrochemical Excesses," Chemical Week, Ja,n. 2/9, 1985, pp. 26-27.
xi
Because of its increasing agricultural requirements, the People's Repu'Dlic · of China is ·curren.tly the third largest producer of fertilizers in the world.· Other commodity petrochemical 'indu.strial expansion planned in China is just beginning/ as. chemical product substitution for items produced by "cottage ·industries" is' creating the new demand for such commodity petrochemicals as plastics res-ins and syn,theti~ rubber. These demands are expected "to be satisfied by increasing· d·omestic ·production capacity.
3. POSSIBLE STRATEGIES AVAILABLE TO THE U.S. PETROCHEMICALS INDUSTRY
· o Changes· in· strategi'c ·goals for those producers of conunodity ·petrochemicafs located in traditional petrochemical'-producing ·nations have been· universally recommended.by representatives of these nations' private and public sectors .
. i
While the Japanese petrochemical industry has had legislated Government cooperation in its efforts"to rationalize commodj.ty petrochemical capacity and
·-regain a deslreable level of profitabiiitf, both·u~s. ·and Western European petrochemical.indus'try analysts have· addressed the need for two major changes in the petrochemical industries basedin'these nations. The first would be a rationalization of existing comm~dity·petrochemical capacity iri order to bring capacity closer·to cu~rent 'levels of commcidity petrochemical demand. The second',· and 'most often discussed· strategy; would be a shift of emphasis from production of commodity petrochemicals.to value-added specialty chemical products. This shift would be expected to reestablish a reliance within the U.S. petrochemical industry on the special talents, ·which en~bled the U.S industry to become a world leader,· primarily its preemj.nence in technological development ;and ~nnovation. ~- · , .
Although much commodity petrochemical capacit·y' has been 'rationalized in the United States and Western Europe since 1979, there still remains more available capacity ~ban demand. With commodity petrochemicals produced in CERN'S.beginning ·to enter the·world markets,·changes in· the strategic orientation of many of the firms comprising the U.S. petrochemical industry have been ·reported in the trade literature. !I · ·
o Alternatives to complete changes in strategic orientation include such strategies as':geographic, vertical, or horizontal diversification, or any combination of ·these strategies appropriate.to the structure and organization of the firm in question:·
: .
!I "How old Strategies Now Are Changing," Chemical Week, Oct. 26, 1983, pp. 50-52.
xii
The availability of several distinct strategic avenues provides the U.S. chemical industry with multiple possibilities in terms of designing a tailormade program for one particular company. Major U.S. commodity petrochemical producers have used one or more of these major routes in their attempt to regain levels of profitability currently unachievable by maintaining traditional business strategies for commodity petrochemicals. The most common strategies now being employed by U.S. commodity petrochemical producers in the domestic market are: · (1) rationalization; (2) diversification~ ei'ther vertical, horizontal, or even geographic; and (3) seeking a niche within well-bounded commodity/specialty areas.,
However, other strategies which.involve increasing interest in offshore production-,· licensing of proprietary technology to secondary users·, and using the joint-venture avenue for entrance into new areas, thus allowing the risk for new projects to be absorbed by more than one f inn, have also become increasingly common. In particular, U.S.-based producers with investments in commodity petrochemical capacity in CERN's are seen by many analysts as being· in the most enviable position of all producers who have remained. committed to retaining their commodity petrochemical orientation .
. The open~door U. s. investment posture, which allows virtually unrestricted foreign investment in the U.S. chemical industry, is, however, not · reciproclilly avail.able to U.S. investors in certairi major commodity petrochemical-producing nations. U.S. petrochemical industry representatives h~ve made public their fears that an increasing number of foreign governments will .. prohibit foreign investment, thus further restricting U.S. chemical · industr~ op.~ions vis-a-vis the other major chemical-producing nations.
o -The reported "shift" from a strategic commodity petrochemical production orientation to a specialty chemical production strategy among U.S. producers may not exist to the extent generally believed.
'·Although there are some U.S. commodity petrochemical companies which, because of the changing world energy and feedstock environment, have made strategic decisions to change their corporate structure by divesting or curtailing unprofitable operations and absorbing more profitable operations, these decisions have, in most cases, not been derived from a specific desire to alter their strategic orientation. The majority of U.S. commodity petrochemical producers in 1985 retain the same strategic orientation they had in 1974. The increase in the number and the share of the petrochemical ~perations which produce specialty chemicals is seen as a natural progression for these firms, as they seek to develop or acquire subsidiaries which can function as less competitive in-house outlets for their commodity petrochemical production,thereby increasing the value of their commodity petrochemical output .. Also, most of the commodity petrochemical producers entering the specialty chemicals market are doing so by acquisition of existing companies, and not by the creation of new businesses.
4 .
,, _ xiii
POSSIBLE IMPLICATIONS OF CHANGES IN THE U.S. PETROCHEMICAL INDUSTRY
. _,~:'d- Three alternate demand scenarios .for petrochemicals were
... cons-trucle·d to be- used as input into the Department of Labor's Input/output Model of the U.S. Economy. 1/ The results of this exercise :were anticipated:. ·changes in industrial output, employ..:.' ment, and trade balances for the commodity petrochemical sectors, the specialty,chemical sectors, the chemical and ., allied products industry, and the effects on the U.S. econom~ as a· whole.
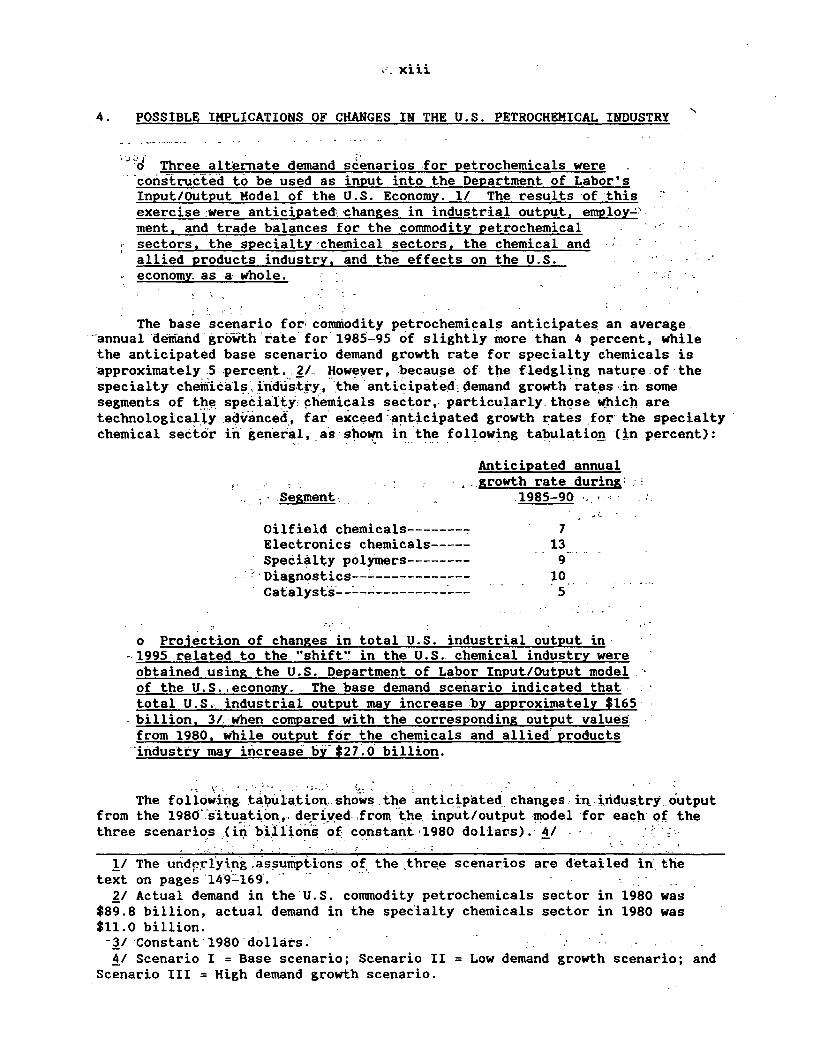
The base scenario for, conmiodity petrochemi~als an~icipate~ an average. ··annual aemand groWth "rate' for 1985-95 of slightly more than 4 percent, while the anticipated base scenario demand growth rate for specialty chemicals is approximately 5 .percent .. 21.. However, becau_se of the fledgling nature. of· the specialty cheiliic~ls' indtisti'.y, -._the .. anticipated: demand growth. rates. in. some segments of th~ speclal£y; -~l\emicals sector,- particularly. thQSe .Wbic}l are technologicaliy adv.anced_, far exceed :a~ticipated growth ~ates ,fo~" the specialty . chemical sector in· gen.erat, a·s ·· sbo~ in the· following tabulation Cin percent):
. . . ·- .. . . .. . . ~ . . . . . . --
Anticipated annual
.Segment. . __ growth rate during: .: :
1985-90 " f
Oilfield chemicals-------~ Electronics chemicals----Special ty polymers--------
·. - ' ·Diagnostics--:_ ___________ _ catalysts--:... _ _: _________ :_ __
7 13
9 10 - 5·
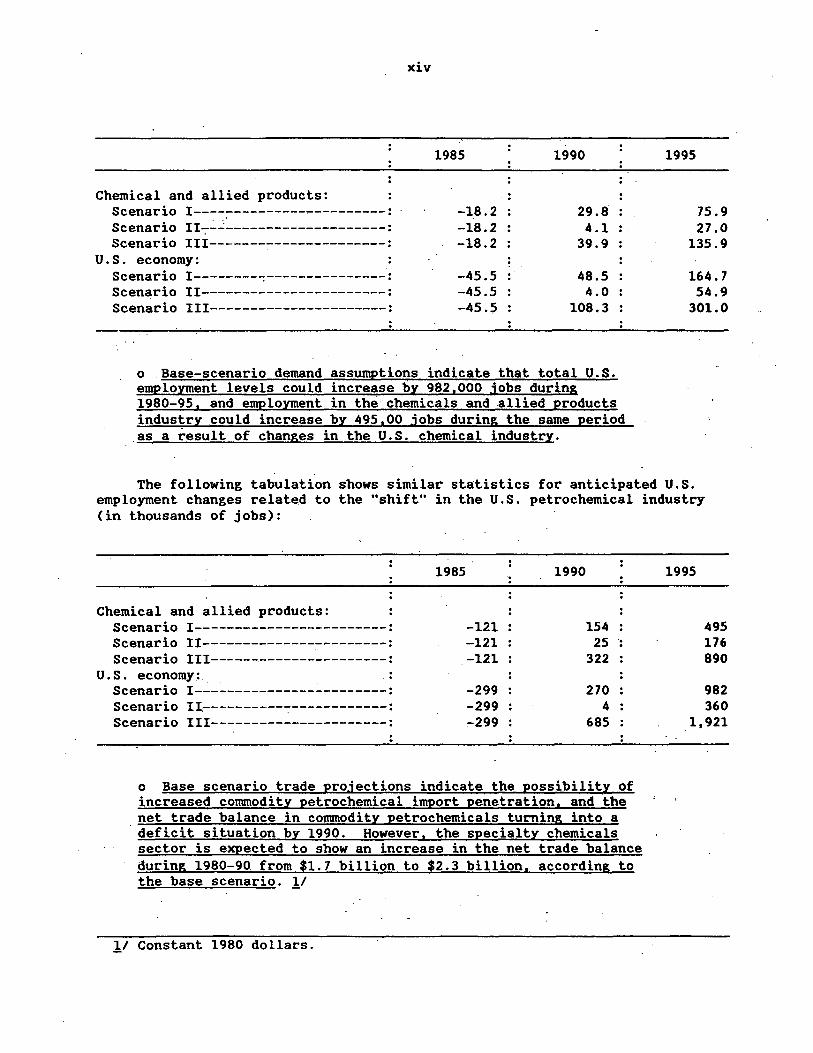
o Projection of changes in total U.S. industrial output in .. 1995 related to the "shift•• in the U.S. chemical industry were
obtained using the U.S. Department of Labor Input/output model .. of the U.S •. economy. The base demand scenario indicated that total U.S. industrial output may increase.by approximately $165. ·
. billion, 3/ when compared with the corresponding output values. from 1980, while output for the chemicals and allied' products
··indus"tt•y may increase bf$27~0 billion.
The follo~it:i~· ~£~~·l:a.tt~.:i ... sh~;~. the: antlc!pated. changes: ill i,.ridus.try. Output from the 198Cf.s1tu~t~cm,-. d~ri_v:ed ,from ·the .. input/output ·11\odel ·for each· o~ the three scenarios (iri blli.ions of constant ·1980 dollar.s) .· 4/ · .: .. ~ : ._ ... ·. - ·. . ... -- . -
~-. • -:. • • !: • • ~ • • . ;
.!I The uri.dr..rfying :as13umpffons _of. the ,three scenarios are detailed in_ the text on pages ·149:....169". - - · .. · ·
~I Actual demand in the U.S. commodity petrochemicals sector in 1980 was $89.8 billion, actual demand in the spec'ialty chemicals sector in 1980 was $11.0 billion. "~/ .. Constant· 1980 dollars.· ~I Scenario I = Base scenario; Scenario II = Low demand growth scenario; and
Scenario III = High demand growth scenario.
xiv
1985 1990
Chemical and allied products: Scenario I----~-------------------: -18.2 29.8. Scenario II7~~--------------------: -18.2 4.1 .. Scenario III----------------------: -18.2 39.9
U.S. economy: Scenario I--------~---------------: -45.5 48.5 Scenario II-----------------------: -45.5 4.0 Scenario III----------------------: -45.5 108.3
o Base-scenario demand assumptions indicate that total U.S. employment levels could increase by 982,000 jobs during 1980-95, and employment in thechemicals and allied products industry .could increase by 495,00 jobs during the same period
.as a result of changes in the U.S. chemical industry.
1995
75.9 27.0
135.9
164.7 54.9
301.0
The following tabulation shows similar statistics for anticipated U.S. employment changes related to the "shift" in the U.S. petrochemical industry (in thousands of jobs):
1985 1990
Chemical and allied products: Scenario I------------------------: -121 154 Scenario II-----------------------: -121 25 .• . Scenario III----------------------: -121 322
U.S. economy: Scenario I------------------------: -299 270 Scenario II,---------~------------: -299 4 Scenario III----------------------: -299 685
o Base scenario trade projections indicate the possibility of increased corranodity petrochemical import penetration, and the net trade balance in conunodity petrochemicals turning into a
· deficit situation by 1990. However, the specialty chemicals sector is expected to show an increase in the net trade balance during 1980-90 from $1.7 billion to $2.3 billion, according to the base scenario. 11
11 Constant 1980 dollars.
1995
495 176 890
982 360
1,921
xv
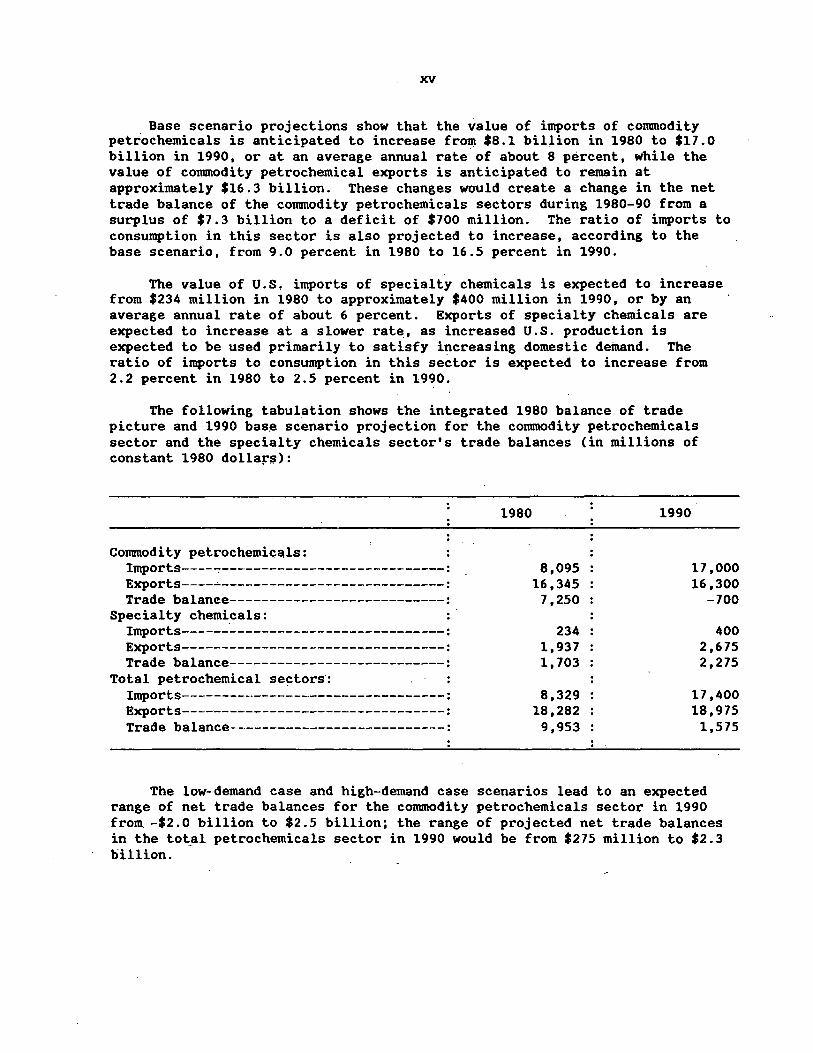
Base scenario projections show that the value of imports of commodity petrochemicals is anticipated to increase from $8.1 billion in 1980 to $17.0 billion in 1990, or at an average annual rate of about 8 percent, while the value of commodity petrochemical exports is anticipated to remain at approximately $16.3 billion. These changes would create a change in the net trade balance of the commodity petrochemicals sectors during 1980-90 from a surplus of $7.3 billion to a deficit of $700 million. The ratio of imports to consumption in this sector is also projected to increase, according to the base scenario, from 9.0 percent in 1980 to 16.5 percent in 1990.
The value of U.S. imports of specialty chemicals is expected to increase from $234 million in 1980 to approximately $400 million in 1990, or by an average annual rate of about 6 percent. Exports of specialty chemicals are expected to increase at a slower rate, as increased U.S. production is expected to be used primarily to satisfy increasing domestic deinand. The ratio of imports to consumption in this sector is expected to increase from 2.2 percent in 1980 to 2.5 percent in 1990.
The following tabulation shows the integrated 1980 balance of trade picture and 1990 base scenario projection for the commodity petrochemicals sector and the specialty chemicals sector's trade balances (in millions of constant 1980 dollars>:
1980 1990
Commodity petrochemicals: Imports----~----------------------------: 8,095 17,000 Exports----~----------------------------: 16,345 16,300 Trade balanee---------------------------: 7,250 -700
Specialty chemicals: Imports------·---------------------------: 234 400 Exports---------------------------------: 1,937 2,675 Trade balance---------------------------: 1,703 2,275
Total petrochemical se~tors: Imports---------------------------------: 8,329 17 ,400 Exports---------------------------------: 18,282 18,975 Trade balance---------------------------: 9,953 1,575
The low--demand case and high-demand case scenarios lead to an expected range of net trade balances for the commodity petrochemicals sector in 1990 from. -$2.0 billion to $2.5 billion; the range of projected net trade balances in the tot_al petrochemicals sector in 1990 would be from $275 million to $2.3 billion.

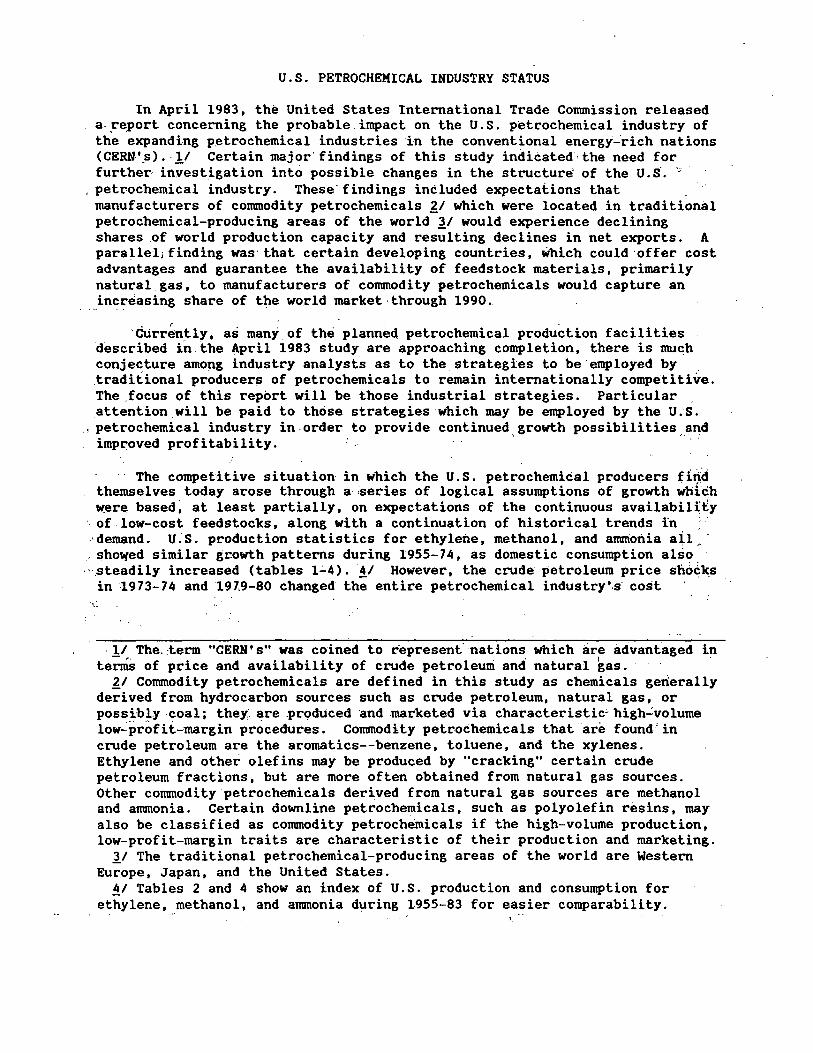
U.S. PETROCHEMICAL INDUSTRY STATUS
In April 1983, the United States International Trade Commission released a .. ~~port concerning the probable. impact on the U. s. petrochemical industry of the expanding petrochemical industries in the conventional energy-..:rich nations (CERN'.s). · 11 Certain major· findings of this study indieated, the need for further· investigation into possible changes in the structure' of the U. s', '.;: petrochemical industry. Thesefindings inCluded expectations that manufacturers of commodity petrochemicals £1 which were located in traditional petrochemical-producing areas of the world i1 would experience declining shares of world production capacity and resulting declines in net exports. A parallel; finding was· that certain developing countries, which could·offer cost advantages and guarantee the availability of feedstock materials, primarily natural gas, to manufacturers of commodity petrochemicals would capture an
.. increasing sh~re of the world market ·through 1990 ..
'Currently, as many_of the planned petrochemical production facilities aescribed in.the April 1983 study are approaching completion, there is much conjecture among industry analysts as to the strategies to be employed by . . traditional producers of petrochemicals to remain internationally competitive. The .focus of this report will be those industrial strategies. Particular . attention.will be paid to those strategies·which may be employed by the U.S.
, petrochemical indust~y in.order to provide continued growth possibilities and imp{'oved profitability. ' ·· ·
· · The competitive situation in which the U.S. petrochemiCal producers firid themselves today arose through a;series of logical assumptions of growth which were based~ at least partially, on expectations of the continuous availability
· of. low-cost feedstocks, along with a continuation of historical trends in : · "demand. u;s. production statistics for ethylene, methanol, and ammonia ail~· . sho~ed similar gcowth patterns during 1955-74, as domestic consumption alSo ·· ·
"·.steadily increased (tables 1.:...4). ~/ However, the crude petroleum price shock.s in -1973-74 and 197.9-80 changed the entire petrochemical industry•.s· cost
··~:
·,!I The. :term "CERN's" was coined to represent' nations which ar~ advantaged in terms of price and availability of crude petroleum and natural gas.
£1 Commodity petrochemicals are defined in this study as chemicals generally derived from hydrocarbon sources such as crude petroleum, natural gas, or possibly ·coal; they ~re .pr9duced and marketed via characteristic'· high_:volume low..:profit-margin procedures. Commodity petrochemicals that.are found' in crude petroleum are the aromatics--benzene, toluene, and the xylenes. Ethylene and other olefins may be produced by "cracking" certain crude petroleum fractions, but are more often obtained from natural gas sources. Other commodity petrochemicals derived from natural gas sources are methanol and ammonia. Certain downline petrochemicals, such as polyolefin resins, may also be classified as commodity petrochemicals if the high-volume production, low-profit-margin traits are characteristic of their production and marketing.
3/ The traditional petrochemical-producing areas of the world are Western Europe, Japan, and the United States.
~I Tables 2 and 4 show an index of U.S. production and consumption for ethylene, methanol, and ammonia during 1955-83 for easier comparability.
2
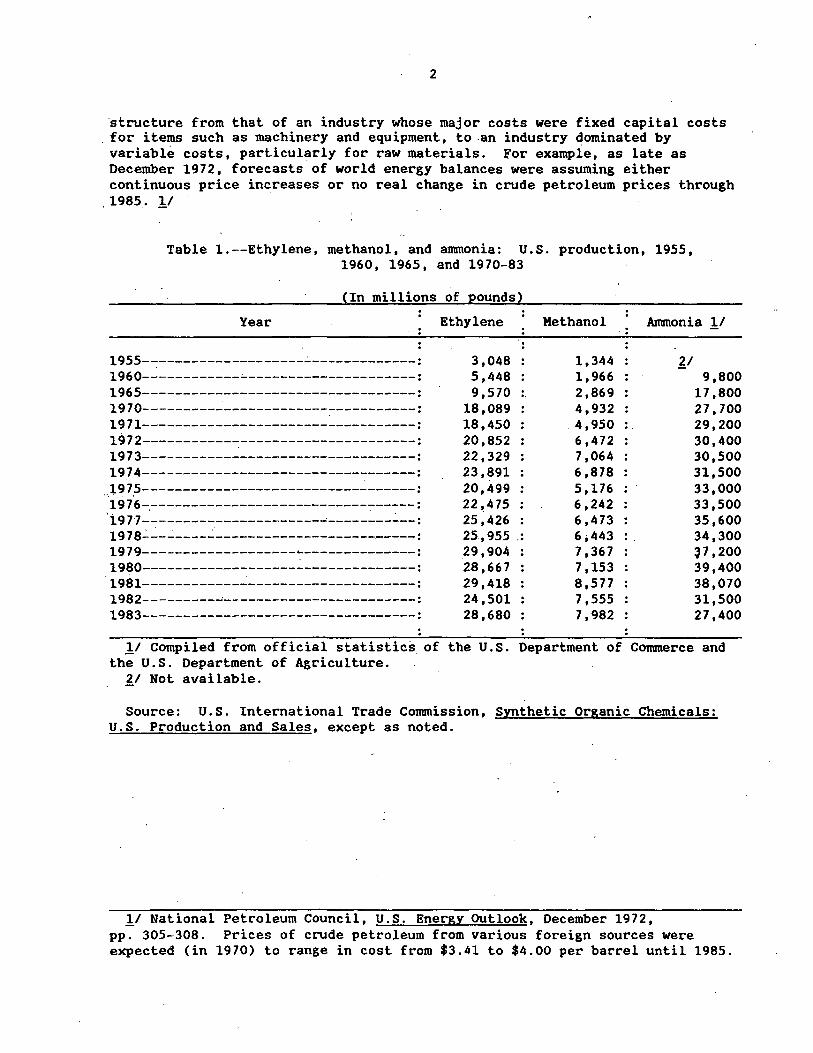
structure from that of an industry whose major costs were fixed capital costs . for items such as machinery and equipment, to -an industry dominated by variable costs, particularly for raw materials. ~or exampie, as late as December 1972, forecasts of world energy balances were assuming either continuous price increases or no real change in crude petroleum prices through 1985 .. !/
Table 1.--Ethylene, methanol, and ammonia: U.S. production, 1955, 1960, 1965, and 1970-83
(In millions of pounds)
Year Ethylene Methanol Ammonia .!I
1955--:-------------------~-------------: 1960------------~---------------------:
1965----------------------------------: 1970----------------------------------: 1971----------------------------------: 1972----------------------------------: 1973----------------------------------: 1974----------------------------------: 1975----------------------------------: 1°9 7 6-.----------------------------:------: 1971----------------------~-----------: 19 78..:._ __ _: ____ ..:. ____________________ , _____ :
1979-------------------~--------------: 1980----------------------------------: 1981------:-----------------------------: 1982---------~------------------------:
1983----------------------------------:
3,048 5,448
· . .
9 ,570 .. 18,089 18,450 20,852 22,329 23,891 20,499 22~475 25,426 25,955 .: .29 ,904 28,667 29,418 24,501 28,680
1,344 1,966 2,869 4,932 4. 950 .. 6,472 7,064 6,878 5, 176 6,242 6,473 6;443 : . 7,367 7,153 8,577 7,555 7,982
11 9,800
17 ,800 27,700 29,200 30,400 30,500 31,500 33,000 33,500 35. 600 34,300 ~7,200 39,400 38,070 31,500 27,400
.!I Compiled from official statistics of the U.S. Department of Commerce and the U.S. Department of Agriculture.
11 Not available.
Source: U.S. International Trade Commission, Synthetic Organic Chemicals: U.S. Production and Sales, except as noted .
.!/ National Petroleum Council, U.S. Energy Outlook, December 1972, pp. 305-308. Prices of crude petroleum from various foreign sources were expected (in 1970) to range in cost from $3.41 to $4.00 per barrel until 1985.
3
Table 2.--Ethylene, methanol, and anunon1a: Index of U.S. production ' volume,: 1955' l960, 1965_, and 1970-83
(1960 = 100) .. -. Year ' 'Ethylene
. . . •
1955---------~------------.:..~~---------:
1960------------------------...:---------: , 1965-----· ____________________________ ..;.:
1970----------------~---------~-------: . 1971---------------------~------------: . 1972----------------,.------------------:
19 7 3---------------... --:---~-:.......:_·_:---'.'"'--.-: . ·1974 _____________ ...;,.._,..._, _______ :.._ ________ :
19 7 5---------------,..,,,.~·---------------...;: 1976----------...:-· ____________ _;.,.. ____ .,.. ___ : .·
1977------------.:..-----------------:----: 1978----,.-------'.'"'----,..~-----~...:---------:
1979----------------------------------: 1980---------...:·------,,----------..;, _______ :
·1981--------:.._ __ .:_ ___ ,...~-----------------: . 1982------------.:..--.... -,-------·----------: 1983------------------:------.:..---------:·
!I Hot available~·
source: · Derived from 'data. in: table 1.
0.56 1.00 1.
0
76 3.32 : . 3.39 3.78 4.10 4.39 3.76 4.13 4.67 4.76 5.49 5.26 5.40 4.50 5.26
Methanol
0.68 1.00 1.50 2.51 2.52
. 3.29 3.59 3 .so· : 2 •. 63 3.17 3.29 3.~8
3.73 3.64 4.36 3.84 4.06
Ammonia
!I 1.00 1.82 2.83 2.98 , 3.10 3.11 3.21 3.37 3.42 3.63 3.50 3.80 4.02 3.88 3.21 2.80
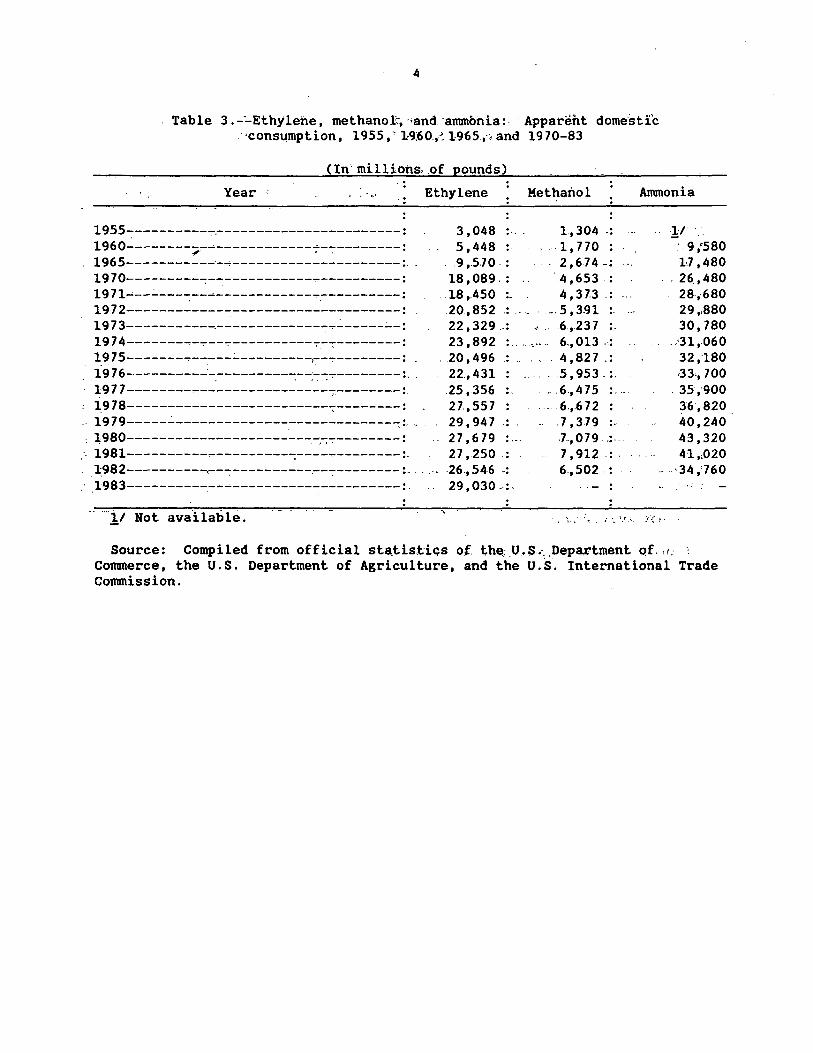
Table 3 .-"'-Ethylene, methanol:·, ·1and ·ammonia: · App;:irent dome·sti'c ·cons~mption, 1955,·· 1:9:60.,>.1965,-; and 1970-83
(In· millions, .of pounds)
Year.: .. · •.. Ethylene Methanol Ammonia
1955-----------,----------------------- : 1960--------~--------------~-~--------:
1965-----------·--;--------------------- :. 1970----------,--:-----------...,-----------: 19 71_. __ .:_ ___ -:---------------...,-.----------: 1972----------------------------------: 1973-...,------------------------...,-~-------: 1974-------...,.--:---:-----------~--:---------:
1_9 7 5-------...,.---:--.:..---------,:----:--------: . 19 76-----------.----------:--:-:-:-;---------: ... 1977-------------------------7--------~
1978-------------------------.--------: . 1979-----.:...----------------------------:~ -: 1980-----------------------.~.-;-:---------:
·" 1981----------,.-----------:----..,.-------- :. . . J.:982----------.:--:---:----------.--:-:--------- : .. ,1983----------------------------------:.
· ... ii Not ava'ilable.
3,048 ···-.
5,448 " .9 ,.5.70. :
18,089.: .. . 18 ,.450 ·-
20,852 .. 22' 329 .. :. 23,892 ...
.20,496 .. 22.,431
.25 ,356 .. 27.,557 29,947 .. 27,679 ... 27 ,.250 : -26., 546 -·. 29,030-:.
1., 304 .. . ..
.1, 770 : 2,674 -! .. ,
4,653 : 4 '3 7.3 .. ...
... 5 '3.91 .. ... .6.,.23 7 .. 6.,013 .: 4,827 .. 5,953 ...
.6.,475 . ....
.6.,672
. 7 '379 .. .1., 079. , ... 7,912 ... 6.,502 . .
]J '. 9 ,'580 H,480
.. 26_,480 28·,680 29 ,,880 30,780
. •31,060 32,180 ,33,, 700
. 35 .. 900 36 ,820. 40,240 43,320 41,,020
.. •34' 760
, ·.;.. "' ; :. •.r J ( ~,
Source: Compiled from official st~tist:ic;s of t;.he. U.$.-. Department Qf. ,1:
Commerce, the U.S. Department of Agriculture, and the U.S. International Trade Commission.
5
· .'Table-4.-'-Ethylene, methanol, and ammonia: Index of U.S. apparent domestic ··. ... consumption 1955, 1960, 1965, and 1970-83
(1960 = 100)
Year
. . - ~
1955--'-.;.--'------------,.-----------------: 1960-----------~-~-----------~--------: 1965----~-----------------------------: 1970----,--------------~--~-----------'-~: 1971-'~~~------------~-----------------: 1972-~--------------~-~-------~-------: 1973-------------..:.-~...,7~-------------~-: 1974------------------,-,---------------: 1"975----------..:.-..:.~--::-:---:----------------: 1-9 7 6----------...;-----:--:-;----------------: 1977-------...;----~-----~---------------: 1978-----~---------~~-----------------: 1979----------------------------------: 1980------------------~---------------: 1981----------...,-----...,-----------------: 1982-~-------------":"~--~----------,----: 1983-------------~-----------~--------:
!I Not available.
, Source: Derived from data in table 2.
Ethylene
0.56 1.00 1. 76 3.32 3.39 3.83 4.10 4.39 3.76 4.12 4.65 5.06 5.50 5 .08 .. 5.00 4.86 5. 33 ·!
Methanol
o. 74 1.00 .. 1.51 2.-62 2.48 3.05 3.53 3.40 2. 73 3.37 3.66 3. 77 4.17 4.00 4 .48 .. 3.68
Ammonia
!I
,_.
1.00 1.82 2.76 2.99
. 3.12 3.21 3.24 3.36 3.52 3. 75 3.80 4.20 1a·.52 4;.28 3.63
6
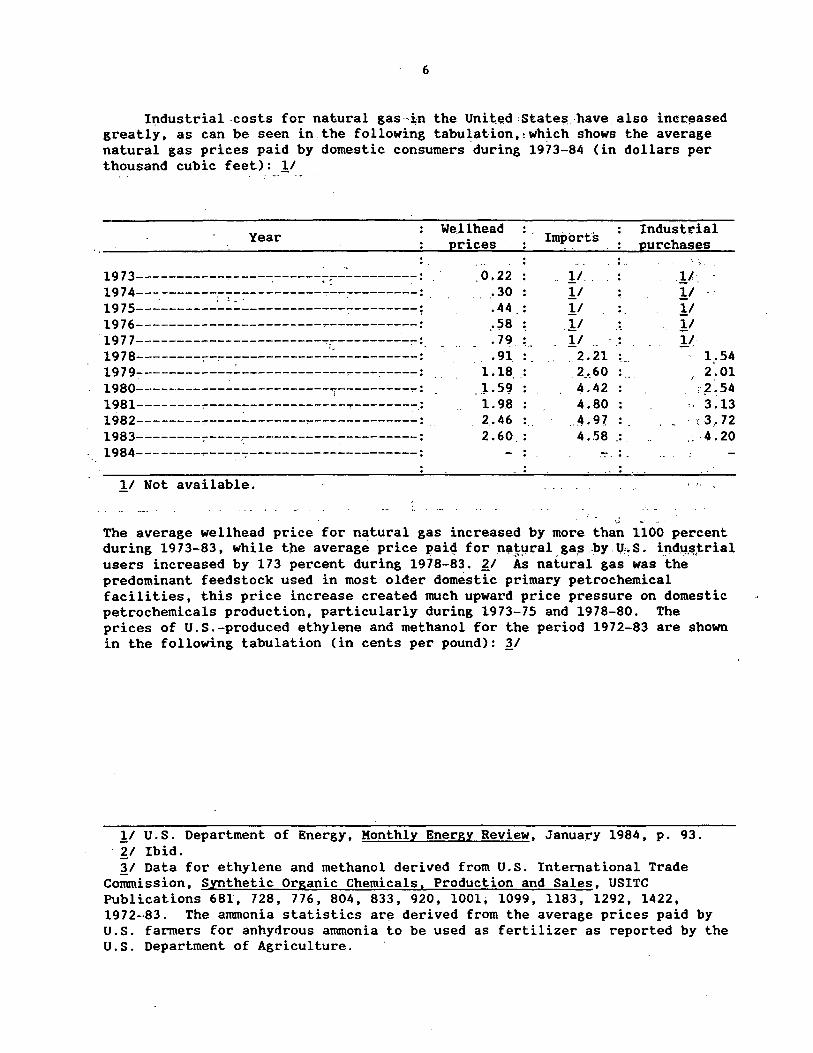
lt:tdustrial -costs for natural gas ··:i;n the United :States. have. also incr.!3ased greatly, as can be seen in the following tabulation, !·Which shows the average natural gas prices paid by domestic consumers ·during 1973-84 (in dollars per thousand cubic feet): .!I
Year . ..
1973-----------~----~------~:----------:
i: ~ :==========;=~=======================; . 1976-----------------------------------: 1977-----------------------~~---------~: ·-1978--------~--------------------------:
1979------------~-------------~---~---~: i980------------------------~---------r: 1981--------.,.-----~------------.,--------~.:
1982--------~------------~-------------:
1983--------~----~-----------~---------:
1984--------~----~---------------------:
We.llhead prices
0.22 . 30 .44 ... ~8 .79 .91.
1.18 .J.5c;J 1.98 2 .. 46 2.60
· · Imj>Ort·s
...
_!/. .!I .!I .!I .!I
. . ..
2. 21 ·~-· 2_._60 4.42 4.80
... 4.97. 4 • .58 .•.
Industrial purchases
.]/" . !I !I !I y
1,.54 2.01 ,~.54
3.13 . r. 3, 72 ;. -4.20
.!I Not available. · " ;
; - ._,
The average wellhead price for natural gas increased by more than 1100 percent during 19 73-83, while the average price pai" for n;;l~~ral. ga,s .by. U:'. s. ind':J.~,trial users increased by 173 percent during 1978-83. ~/ As natural gas was the predominant feedstock used in most older domestic primary petrochemical facilities, this price increase created much upward price pressure on domestic petrochemicals production, particularly during 1973-75 and 1978-80. The prices of U.S.-produced ethylene and methanol for the period 1972-83 are shown in the following tabulation (in cents per pound): ~/
.!I U.S. Department of Energy, Monthly Energy Review, January 1984, p. 93. ·~I Ibid. ~I Data for ethylene and methanol derived from U.S. International Trade
Commission, Synthetic Organic Chemicals, Production and Sales, USITC Publications 681", 728, 776, 804, 833, 920, 1001; 1099, 1183, 1292, 1422, 1972--83. The ammonia statistics are derived from the average prices paid by U.S. farmers for anhydrous ammonia to be used as fertilizer as reported by the U.S. Department of Agriculture.
7
Year Ethylene ·Methanol ..
Ammonia
1972----------------~-------------------:
' 1973------------------------------------: 1974----------------------------------~-:·
1975--7------~--------------------------: 1976-------------------------~----------: 1977------------------------------------: 1978------------------------------------: 1979---~--------------------------------:
1980------------------------------------: 1981-----------------------~------------: 1982---------------------------------~--:
1983 !/-------------~-------------------: 1984 !/---------~-----------------------:
l/ Estimated. ?:_/ Not available.
3.0 3.3 7.5 8.8
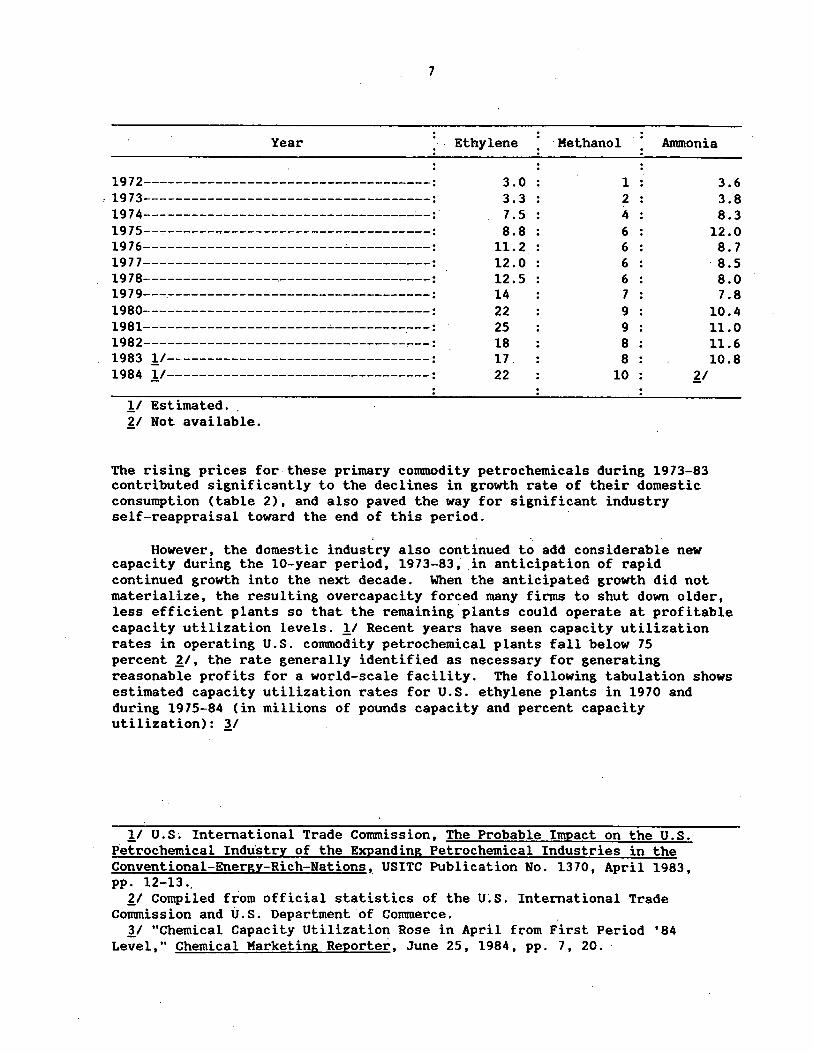
11.2 12.0 12.5 14 22 25 18 17. 22
1 2 4 6 6 6 6 7 9 9 8 8
10 ?:_/
The rising prices for-these primary commodity petrochemicals during 1973-83 contributed significantly to the declines in growth rate of their domestic consumption (table 2), and also paved the way for significant industry self-reappraisal toward the end of this period.
3.6 3.8 8.3
12.0 8. 7
. 8 .5 8.0 7 .8
10.4 11.0 11.6 10.8
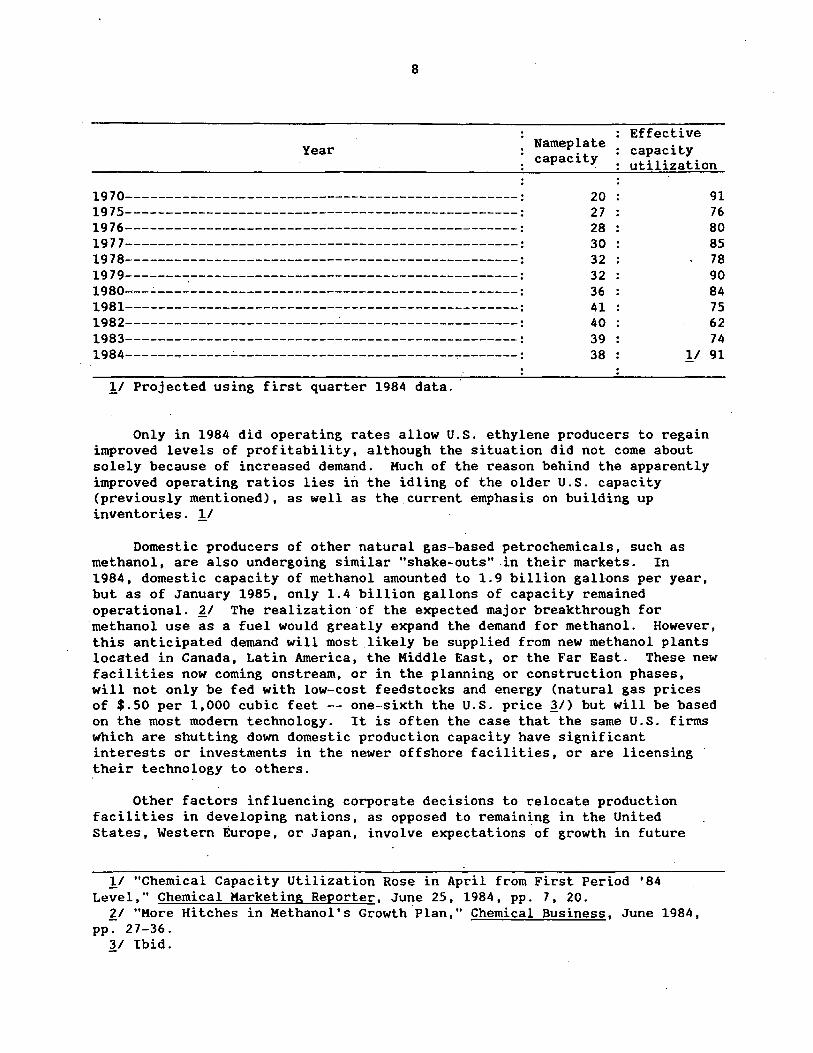
However, the domestic industry also continued to add considerable new capacity during the 10-year period, 1973-83, _in anticipation of rapid continued growth into the next decade. When the anticipated growth did not materialize, the resulting overcapacity forced many firms to shut down older, less efficient plants so that the remaining.plants could operate at profitable capacity utilization levels. l/ Recent years have seen capacity utilization rates in operating U.S. commodity petrochemical plants fall below 75 percent?:_/, the rate generally identified as necessary for generating reasonable profits for a world-scale facility. The following tabulation shows estimated capacity utilization rates for U.S. ethylene plants in 1970 and during 1975-84 (in millions of pounds capacity and percent capacity utilization): 'J./
!I u.s~ International Trade Commission, The Probable Impact on the U.S. Petrochemical Indu'stry of the Expanding Petrochemical Industries in the Conventional-Energy-Rich-Nations, USITC Publication No. 1370, April 1983, pp. 12-13.,
?:.I Compiled from official statistics of the u~s. International Trade Commission and U.S. Department of Commerce.
'J_/ "Chemical Capacity Utilization Rose in April from First Period '84 Level," Chemical Marketing Reporter, June 25, 1984, pp. 7, 20. ·
8
Year Nameplate Effective capacity capacity utilization
1970-------------------------------------------------: 1975-------------------------------------------------: 1976-------------------------------------------------: 1977-------------------------------------------------: 1978-------------------------------------------------: 1979-------~-----------------------------------------: 1980~--~---------------------------------------------: 1981-------------------------------------------------: 1982--------------------------~----------------------: 1983-------------------------------------------------: 1984-------------~---------------------------~-------:
11 Projected using first quarter 1984 data.
20 27 28 30 32 32 36 41 40 39 38 1/
Only in 1984 did operating rates allow U.S. ethylene producers to regain improved levels of profitability, although the situation did not come about solely because of increased demand. Much of the reason behind the apparently improved operating ratios lies in the idling of the older U.S. capacity (previously mentioned), as well as the.current emphasis on building up inventories. !/
Domestic producers of other natural gas-based petrochemicals, such as methanol, are also undergoing similar "shake-outs" .in their markets. In
91 76 80 85 78 90 84 75 62 74 91
1984, domestic capacity of methanol amounted to 1.9 billion gallons per year, but as of January 1985, only 1.4 billion gallons of capacity remained operational. ~/ The realization of the expected major breakthrough for methanol use as a fuel would greatly expand the demand for methanol. However, this anticipated demand will most likely be supplied from new methanol plants located in Canada, Latin America, the Middle East, or the Far East. These new facilities now coming onstream, or in the planning or construction phases, will not only be fed with low-cost f eedstocks and energy (natural gas prices of $.50 per 1,000 cubic feet -- one-sixth the U.S. price 11) but will be based on the most modern technology. It is often the case that the same U.S. firms which are shutting down domestic production capacity have significant interests or investments in the newer offshore facilities, or are licensing their technology to others.
Other factors influencing corporate decisions to relocate production facilities in developing nations, as opposed to remaining in the United States, Western Europe, or Japan, involve expectations of growth in future
ll "Chemical Capacity Utilization Rose in April from First Period '84 Level," Chemical Marketing Reporter, June 25, 1984, pp. 7, 20.
'l:_I "More Hitches in Methanol's Growth Plan," Chemical Business, June 1984, pp. 27-36.
11 Ibid.
9 .
markets. Markets in developed areas of the world for certain petrochemicals and their products, primarily plastics, are seen as mature. These markets are expected to exhibit slow, steady, but not extremely profitable growth patterns . .!/ Markets in developing areas of the world, however, are expected to have the most p"otential for: demand growth for petrochemical products such as plastics and s)rnthetic fiber's. Therefor€, plants are being built where both the feedstoc:ks are located and significant market gr~Wt.h is anticipated
t~ -
in the futur.e.
· ·. Corranodity Petrocnemi·ca'ls""
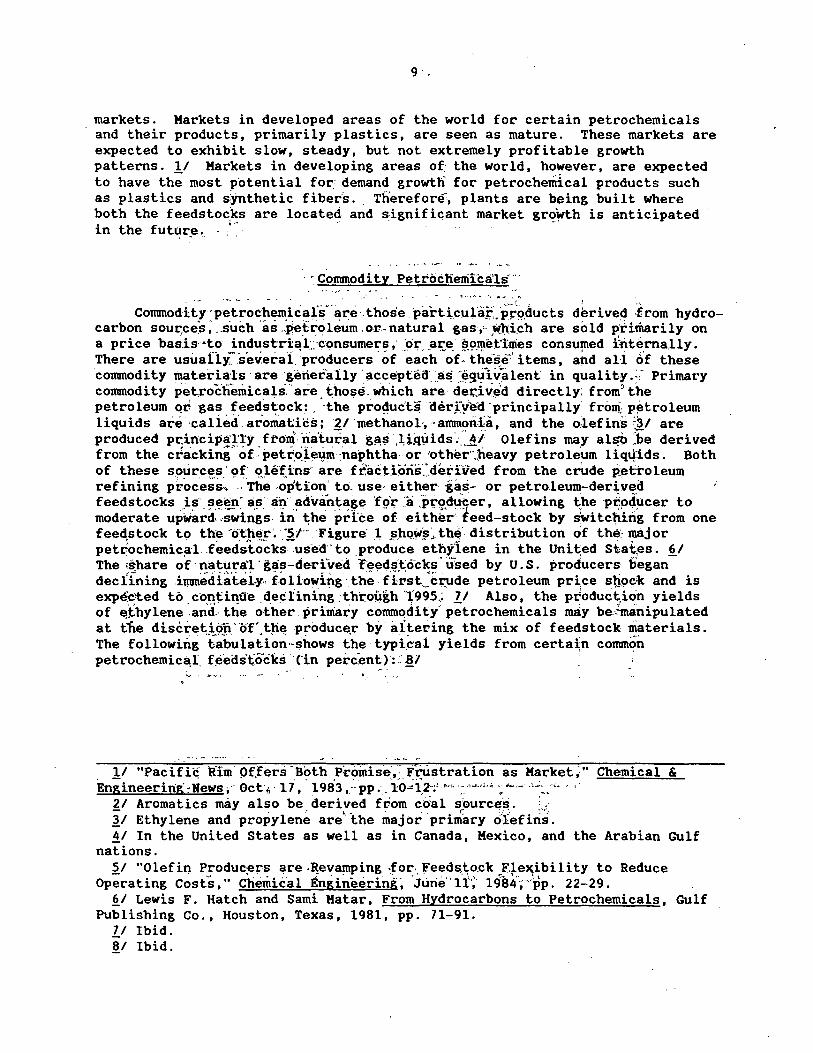
Corranodit~ ·petrochemicai~i.are. those parti,cu1·a_~:.:1>·~0.ducts d~rived .from hydrocarbon sou~ce:S ~ .. s.uch ·as ··Pe~roleum .or,. .. natural gas•' ,~qi.ch are sold P,rimarily on a price basis·Ato industrt~l.::·consumers ,· j>r .. ar..e. ~9~et'iuies consu¥1ed interna.lly. There are usuaflj'.~ several. producers . of each of· thes~t items, and ali o'f these corranodity materials are ··generally· a~ceptea· ... a~ )~g~1~lent in quality.:,· Primary corranodity petrochemicals.'' are. those. which are der;:iv.ed directly: from" the petroleum Qr. gas. f.eed_s~ock: . ·the pro~uc·t~ (jer_fy'ed ·principally froni: p~troleum liquids are ·called .aromatiCs; ·21 methanol·, ·arranorila, and the olefins :31 are produced pr.incipa'l'ty ftom:nalu;al g~~ .u~µids·.~·~.~/ Olefins may al~ ~be derived from the ctacking ... of.: petC:oJ~\im :naphtha or 'otber ... heavy petroleum liqt¥ids. Both of these sources. of• Qle'fins· are fc''a~tlons:.~.derived from the crude petroleum refining pi-oce~s~. · .. rile -~p'tion' to. use· either ·gas- or petroleum-deri~ea feedstocks Js·_s~~!( a.~- ail advan~age 'frir; :a .Pi-~.d~~er, allowing t_he ptpdµcer to moderate upward~:-swings in' t;.lie pri:ce of eith~r feed-stock by s'witc~rig from one feed,stock to th~ ·o:t!\~.r .. ·~/"' Fi,gtc1re· .1 §:hQ.~~~-thf distribution of the~ ~jor petrochemic.al .feedstocks- used·· to _produce ethylene in the Unit;ed Stat.es. ~I The •share of ·natural. gas:....derfved reeds'tcfoks. used by U.S. producers· b:egan deciining irranedi.a'f.ei.y,, followi.itg · t~: ii~st .. :~p.1de petroleum pr~ce sti.<>ck and is expeC!ted to. coAti~ae .d_eciining .th['.o(lgh 'l,'995~; 11 Also, the produc~i~n yields of ~.£hylene .and. the other primary conunqdity· petrochemicals may be·~"manipulated at tlle discretJj>fl.'cff'.t}'i~ produc~r by al~ering the mix of feedstock materials. The following tabulation··shows the· typi.ca1 yields from certain corranon petrochemica,l. f¢eds't'ocks C"in percent)·::· ~I
•.
!I "Pacifi~ lfim· Pf.fers ·aoth P:romise:,: Frustration as Market/' Chemical & En~ineer1·n·<>'-News··· Oct•· li · 1983 .'.pp; ·1·0...:-12-:···"· ..... ,_,,,,.,, · ..... - .• ..:, -·~ '·· = ... ~===.:..:y~ .... -==· ·' t •. .- ~ •. v "'·':
?,_/ Aromatics may also be. derived frcom c(>:al s~ourc~~. !< ~/Ethylene and propylene are"the major.primary 0.lefiris. ~/ In the United States as well as in Canada, Mexico, and the Arabian Gulf
nations. ~/ "Olefi"Q Produc;ef~ are ·~eva~ing .for., feeds,t;.o.ck X-~e~ibility to Reduce
Operating costs," Chemie.al Engineering~ Jurie·· 11:·;· 1984'·;···pp. 22-29. ~I Lewis F. Hatch and Sami Matar, From Hydrocarbons to Petrochemicals, Gulf
Publishing Co., Houston, Texas, 1981, pp. 71-91. LI Ibid. ~/ Ibid.

a i ~·
" Cl ~ ~ ~ ~· {'j
~ ~ k lU C:i <Ii
1350
1200
1050
900
750
600
450
300
150
Figure 1.--Distdbution of major p~trochemical feedstocks to produce ethylene in the United State~
GAS OIL
NAPHTllA
BUTANE
PROPANE
EtliANE.
:::; O• I I b I I I 11 I I I I I II I I I II I I I I I II I .! I II I I • I • • . - --
79 BO 81 92 83 84 85 86 87 98 . 89 90 91 92 93 94 95
YEA~ 19-·
-0
11
Feedstock Ethylene P·ropylene Butadiene Aromatics
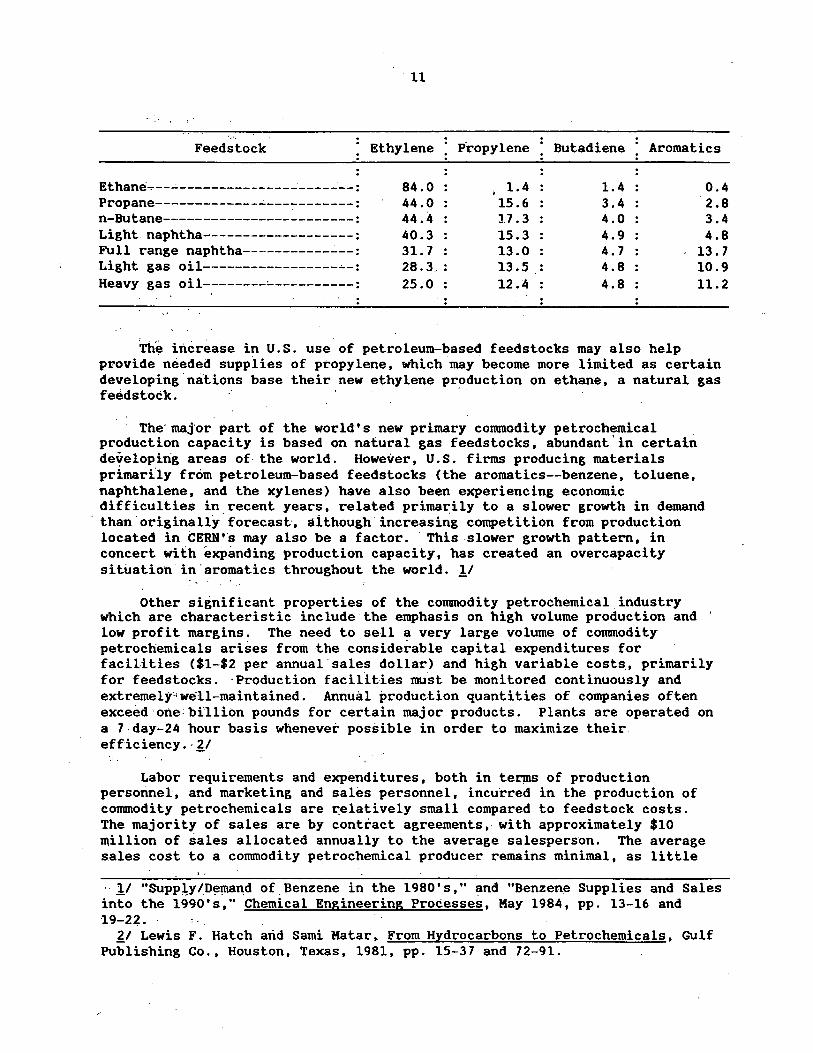
Ethane~-------------------------: 84.0 1.4 1.4 0.4 Propane-------------~-----------: 44.0 15.6 3.4 2.8 n-Butane------------------------: 44.4 17.3 4.0 3.4 Light naphtha~------------------: 40.3 15.3 4.9 4.8 Full range naphtha-----------~--: 31. 7 13.0 4.7 13.7 Light gas oil-----------------~-: 28.3 13.5 4.8 10.9 Heavy gas oil--------~----------: 25.0 12.4 4.8 11.2 ..
Th~ increase in U.S. use of petroleum-based feedstocks may also help provide needed supplies of propylene, which may become more limited as certain developing nations base their new ethylene pr~duction on ethane, a natural gas feedstock.
The·maJor part of the world's new primary conunodity petrochemical production capacity is based on natural gas feedstocks, abundant' in certain developing areas of the world. However, U.S. firms producing materials primartly from petroleum-based feedstocks (the aromatics--benzene, toluene, naphthalene, and the xylenes) have also been experiencing economic difficulties in.recent years, related primarily to a slower growth in demand than· originally forecast·, although· increasing competition from production located in CERN;·s may also be a factor. This slower growth pattern, in concert with exi>anding production capacity, has created an overcapacity situation in' aromatics throughout the world. ·!/
Other significant properties of the conunodity petrochemical.industry which are characteristic include the emphasis on high volume production and low profit margins. The need to sell a very large volume of conunodity petrochemicals arises from the considerable capital expenditures for facilities ($1-$2 per annual· sales dollar) and high variable costs .• primarily for feeds.tocks. ·Production facilities must be monitored continuously and extremely•well-maintained. Annual production quantities of companies often exceed·one:billion pounds for certain major products. Plants are operated on a 7 day-24 hour basis whenever possible in order to maximize their efficiency.· ZI
Labor requirements and expenditures, both in terµIS of production personnel, and marketing and sales personnel, incurred in the production of conunodity petrochemicals are ~elatively small compared to feedstock costs. The majority of sales are by contract agreements,. with approximately $10 million of sales allocated annually to the average salesperson. The average s_ales cost to a conunodity petrochemical producer remains minimal, as little
· !I "Supp~y/.D~mand of. Benzene in the 1980' s," and "Benzene Supplies and Sales into the 1990's," Chemical Engineering Processes, May 1984, pp. 13-16 and 19-22. "
ZI Lewis F. Hatch arid Sarni Matar. From Hydrocarbons to Petrochemicals, Gulf Publishing Co., Houston, Texas, 1981, pp. 15-37 and 72-91.
12
advertising is necessary for promotion. Only an estimated industry-wide average of 10 percent of each sales dollar is allocated for marketing expenses. !/
Figure 2 is a flow chart showing the progression of major commodity petrochemicals and their derivatives which may be produced from natural gasbased feedstocks.
Industry Structure
The structure of the domestic industry that produces commodity petrochemicals is extremely heterogeneous. There are major producers of these commodities whose operations are located entirely within the confines of the continental United States, while other domestic firms have operations and facilities located throughout the world. There are .a few producers which, by choice, have limited their lines of production, and have not integrated forward into the production of value-added products; many more are integrated both horizontally and vertically. Those firms which exemplify a "typical" vertically integrated petrochemical producer may be refiners which use their hydrocarbon feedstocks to produce primary commodity petrochemicals. This production is often used internally by the vertically integrated firm as part of a general schemata to produce down-line value-added petrochemical products, such as plastics or fibers.
Producers that are horizontally integrated generally use their primary commodity petrochemicals to produce a wide range of value-added products. Such firms may produce any number of value-added products--surfactants, p1oetieD 1 fertiliaere, Gnd n1nthetic rubber are examples of common areas of diversification traditionally chosen by primary commodity petrochemical manufacturers. ~/
Another major difference among U.S. manufacturers of commodity pet~~chemicals is their primary production orientation, be it as a petroleum company or a chemical company. For example, in the United States the share of ethylene capacity owned by petroleum-oriented companies was 54 percent in 1983, up from only 43 percent in 1976. Therefore, these firms may have a greater role in determining the direction of the U.S. commodity petrochemical industry than either of two other chemical-oriented groups. Those chemical producers who are vertically integrated comprise one of these groups and may be considered major chemical companies. The second chemical group is made up of smaller, less integrated firms, which generally need to purchase their feedstocks, not having direct access as do the petroleum companies and the
l/ Ibid, and United Nations Industrial Development Organization, Second World-Wide Study on the Petrochemical Industry: Process of Restructuring, Kay 1981, pp. 114-133.
~I U.S. International Trade Commission, Study of the Petrochemical Industries in the Countries of the Northern Portion of the Western Hemisphere, USITC Publication 1123, January 1981, pp. 1-18.

-,
' .
tr;.
F:igur~t 2.-.'..M~j~r 'ccimm~~:i{y:·:petrochemicai~ produced · .. ·. · feeds_~ocks: •. ·and -their derivat~ves •. !/
' from natural gas-base~
. , ... . ' .. ..,
· ~.is.ic Jntermedi •te Final
r· ~- ."'
M0
ethan.ol
Ammonia
Etfo· Jene .
Prop)'lene
t-. ,#,
... :
·~
I I I I . ti Urea
. .
Ethylene Dichloride
Et~ylene: Ox'i,de·
'I l I II I ~ :Eth)·l.:Benzene
• 11 1 ,. Acr>·l~nitriJe
., '·
. ~·· . ..... 1.":
Ac•tic A~id
"Fo~ma i deh)·de
V.CM
E.th}' lene Glycol
Styren~
HOPE
LOPE
PET
Polyprop)'lene
Polysty~ene
PVC
SBR
Vinyl Acetate
ABS
Resins
Pol.yest!!r Fibers• .. ~··
Acrylic· Fibers
... ;.:::....,. - . ~ .·~ Solvt"nts ,] .~ :•·('
-- . .~ . .... ".• .,,
1/ HDPE=high-density polyethylene; LDPE=low-density polyethylene; PET=polyethyle te~ephthalate; PVC=polyvinyl chloride; and ABS=acrylonitrile-butadiene-styrene.
.... (,,.J
( ..
14
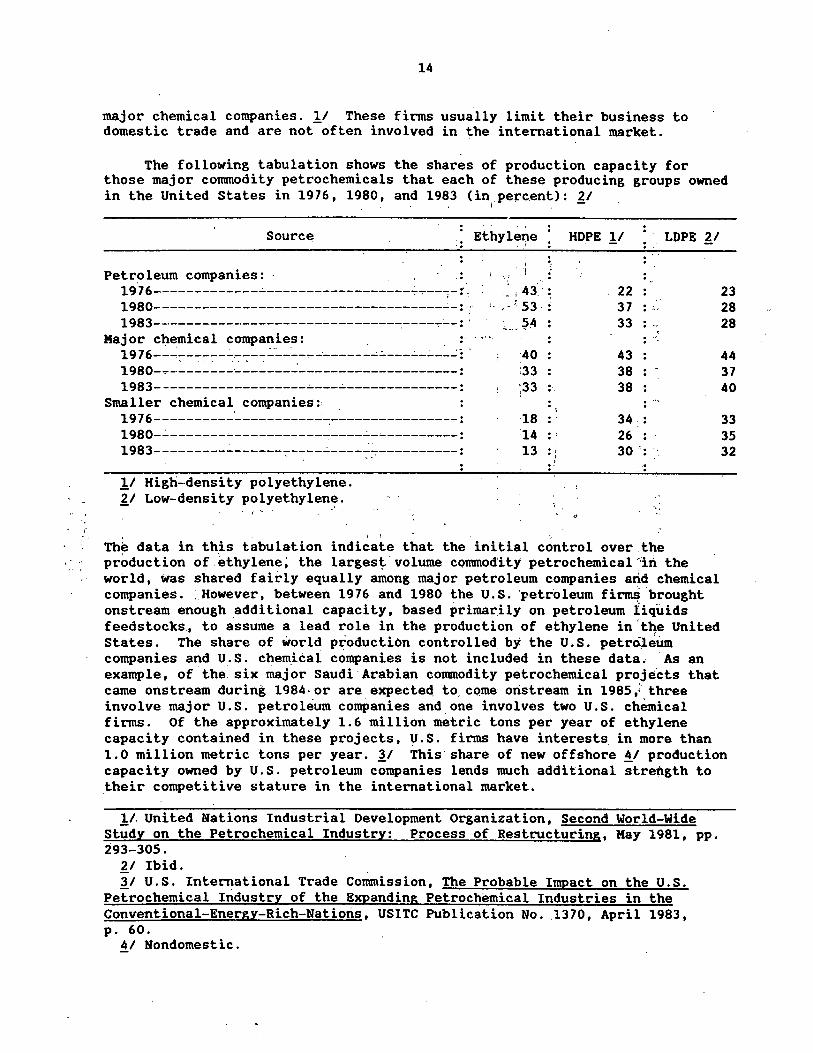
major chemical companies. l/ These firms usually limit their business to domestic trade and are not often involved in the international market.
The following tabulation shows the shares of production capacity for those major commodity petrochemicals that each of these producing groups owned in the United States in 1976, 1980, and 1983 (in _perc.ent): 21
i -
.. Sourc~ : : Ethylet;te
Petroleum companies: · . ;
19j6--------------'------------------~~--~-:~ - ! 43:.: 1980------------------------------------_;- :· :· 1983----------------------'---------:----~--:.
'· ,· < 53
Maj or c~emical companies: . . ·· · , .. 19 76--...::-----:----:--:--:.:.::..._~ _________ ..;;.. ___ .:__.:_ __ _;: '
1980-7--------~------_:--------------------: 1983-------------------~----'--------------:
Smaller chemical companies: . 1976----------~-----------::...---------------: 1980-.:_ ________________________ ..;_~---------:
1983---------_: ______ 7-----'----~~----------:
ll High-density polyethylene. Z.,I Low-density polyethylen~.
40 ;33 ;33
·18 :14 13
• . .. : : ' ., . ' .
;
HOPE l/ ... LOPE Z.,/
22 23 37 .. 28 . '·• 33 ... 28 . 43 44 38 37 38 40 . ·•-. . 34 . 33 .. 26 : 35 30 ': 32
. . ...
" ...
The data in this tabulation indicate that the initial control over the production of.ethylene; the larges~·volume conunod'ity petrochemical:'in the world, was shared fairly equally among major petroleum companies arid chemical companies .. However, between 1976 and 1980 the U.S. ·petroleum fi~ ·brought onstream enough additional capacity, based primarily on petroleum liquids feed stocks., to assume a lead role in the production of ethylene in. t~e United states. The share of world production controlled. by the u.s. petrnieum companies and U.S. chem.ical companies is not included in these data. ·As an example, of the six major Saudi·Arabian commodity petrochemical projects that came onstream during 1984· or are expected to. come oristream in 1985,; three involve major U.S. petroleum companies and.one involves two U.S. chemical firms. Of the approximately 1.6 million metric tons per year of ethylene capacity contained in these projects, U.S. firms have interests. in more than 1.0 million metric tons per year. i1 This share of new offshore !I production capacity owned by U.S. petroleum companies lends much additional strength to .their competitive stature in the international market.
l/. United Nations Industrial Development Organization, Second World-Wide Study on the Petrochemical Industry: Process of Restructuring, Hay 1981, pp. 293-305.
Z.,I Ibid. 31 U.S. International Trade Commission, The Probable Impact on the U.S.
Petrochemical Industry of the Expanding Petrochemical Industries in the Conventional-Energy-Rich-Nations, USITC Publication No .. 1370, April 1983, p. 60.
!I Nondomestic.
15
In addition to the multinational operations owned by U.S. firms, there are a number of foreign-based multinational companies that have built U.S. domestic facilities, or bought smaller U.S. firms with domestic production in ,the~r.. O"fll ~fforts :.to integrate and diversify. ·In ~ost cases, these foreign .fl~ .are :ba~·ed .. ~in devetoped nations; European:-based firms are prominent among multlnationais ·with, significant;.. operations in .the United States.. West ., G~rmatiy, ·the· United Kingdom, Switzerland, . and. the Netherlands . toge.ther accoun't~~ for .more than. 7J percent ·Of all foreign multination~l investment in the :u.s. chemical industry in 1982. 11 The .total.value of foreign investment in :t'h.e U,.s.: chemical.,i'.n4ustry, as estimated by ;the Departµi.ent of coIT!merce, was approx~f!l8te'iy ,$9 .• 3.billion in 1982 ... :?:./.This.represents an incr.ease .of 10 .· percen't when· co~ared !"i th f,oreign investment· in the u .'s. chemical industry in 1981.' . . ' . • . ,, .
The open~dooF U. S_. . il,1yestmen~ posture. which _allows virtually unrestricted foreign investment in the U.S. chemical industry, is, however, not reciprocally· available to U.S. investors in certain major corranodity pe·t-rochem~ca~:-pro·ducing nations. ~i ·· PEMEX, the national energy and chemical company. in M.exico restrilcts ·foreign investment in most chemicals to less than
'40 ji'ercent:..- a,H.hough---the primary petrochemical industry, as defined by PEMEX, is owned and run totally by PEMEX, with no foreign investment allowed . . F~ance's largest chemical manufacturers have been nationalized and no !inv:estment opportuniti~s for the U.S. domestic industry are available. The ,Canadian petrochemical industry is also somewhat resistant to foreign Jnv:estment as legislat~d·in Canada's Foreign Investment Review Act and N~tional Energy Act. !I u.-s. petrochemical industry representatives have made _public their fears that an increasing number of foreign governments will ~prohibit foreign investment, thus further restricting U.~. chemical industry options vis-a-vis the .. other major chemical-producing nations. ~I .. -;: ·.
At the present·time, the U.S. industry.is facing increased competition in foi:eign markets from P.roduction facilities located in nations. which have s~gnificant cost advantages when compared with U.S. firms with U.S. domestic plants. Foreign firms .are also capturing muc~ of the U.S. domestic market ti,.rough acquisitions of. U.S. production facilities. ~/ Together, these
-:problems are forcing u ._s. conunodity petrochemical producers to encourage . strategic planning proc~s.ses. These prqcesses would help improve and streamline the individual producer's structure and efficiency, thereby aiding .the efforts to rema~n .competitive in the international market.
' ' ~ .
J/ "The Growing PP: 46-54 . . lJ Ibid. -- 'JJ . Ibf~.
Presence of Non-U. S .. Owners," Chemical Week, Oct. 12,. 1983,
.·· ... !I Ibi~, pp. 46-47 .
.. _ ~i .Ibid. -- I c • - .
~/.Ibid, and _U.S .. ,I_nt~rnational .Tra4e ComlJlission, The Probable Impact on the U.S. Petrochemical 1Indus.try of the Expanding Petrochemical Industries in the Conventional-Energy-Rich-Nations, l1SITC Publication No. 1370, April 1983, pp. 15-37. .: ..
16
Competitive Status
Background
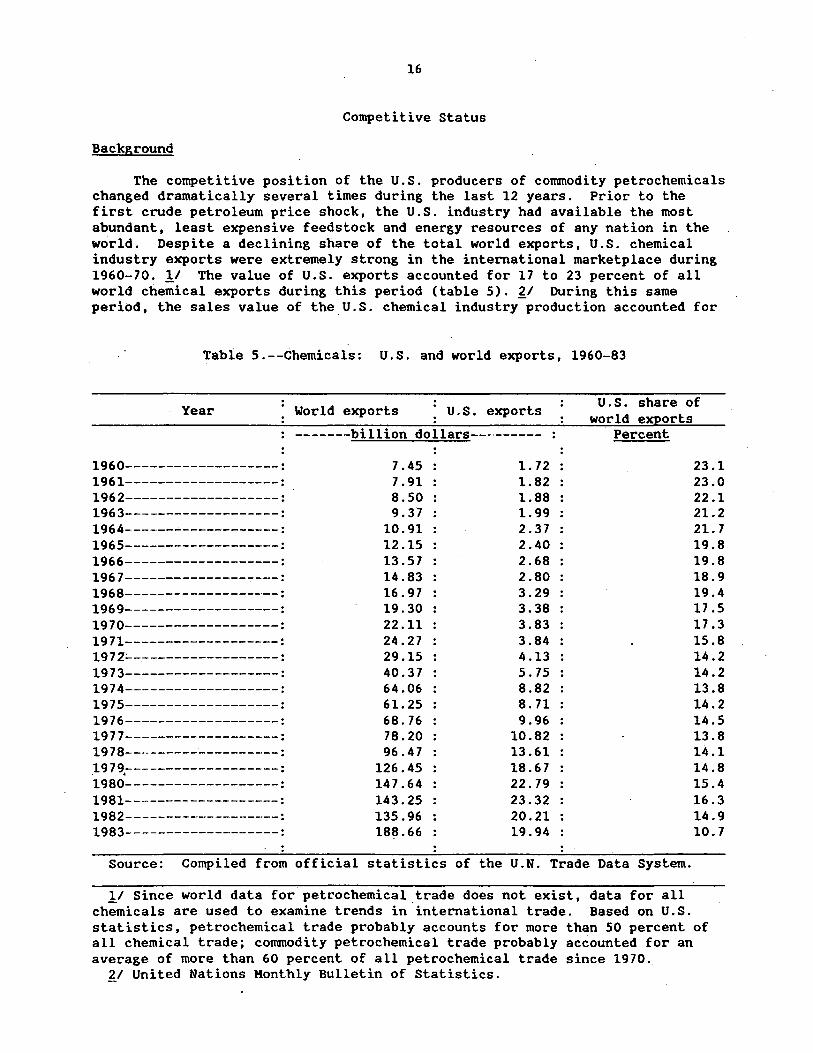
The competitive position of the U.S. producers of commodity petrochemicals changed dramatically several times during the last 12 years. Prior to the first crude petroleum price shock, the U.S. industry had available the most abundant, least expensive feedstock and energy resources of any nation in the world. Despite a declining share of the total world exports, U.S. chemical industry exports were extremely strong in the international marketplace during 1960-70. !I The value of U.S. exports accounted for 17 to 23 percent of all world chemical exports during this period (table 5). ~/ During this same period, the sales value of the_U.S. chemical industry production accounted for
Table 5.--Chemicals: U.S. and world exports, 1960-83
Year
1960-------------------: 1961-------------------: 1962-------------------: 1963-------------------: 1964------~------------:
1965-------------------: 1966-------------------: 1967-------------------: 1968-------------------: 1969-------------------: 1970-~-----------------:
1971-------------------: 1972~~-----------------:
1973-------------------: 1974-------------------: 1975-------------------: 1976-------------------: 1977-------------------: 1978-------------------: 197~-------------------: 1980-------------------: 1981-------------------: 1982-------------------: 1983-------------------:
World exports U.S. exports
-------billion dollars---------
7.45 1. 72 7.91 1.82 8.50 1.88 9.37 1.99
10.91 2.37 12.15 2.40 13.57 2.68 14.83 2.80 16.97 3.29 19.30 3.38 22.11 3.83 24.27 3.84 29.15 4.13 40.37 5. 75 64.06 8.82 61.25 8. 71 68.76 9.96 78.20 10.82 96.47 13.61
126.45 18.67 147.64 22.79 143.25 23.32 135.96 20.21 18~.66 19.94
U.S. share of world exports
Percent
23.1 23.0 22.1 21.2 21. 7 19.8 19.8 18.9 19.4 17.5 17.3 15.8 14.2 14.2 13.8 14.2 14.5 13.8 14.1 14.8 15.4 16.3 14.9 10.7
Source: Compiled from official statistics of the U.N. Trade Data System.
!I Since world data for petrochemical.trade does not exist, data for all chemicals are used to examine trends in international trade. Based on U.S. statistics, petrochemical trade probably accounts for more than 50 percent of all chemical trade; commodity petrochemical trade probably accounted for an average of more than 60 percent of all petrochemical trade since 1970.
II United Nations Monthly Bulletin of Statistics.
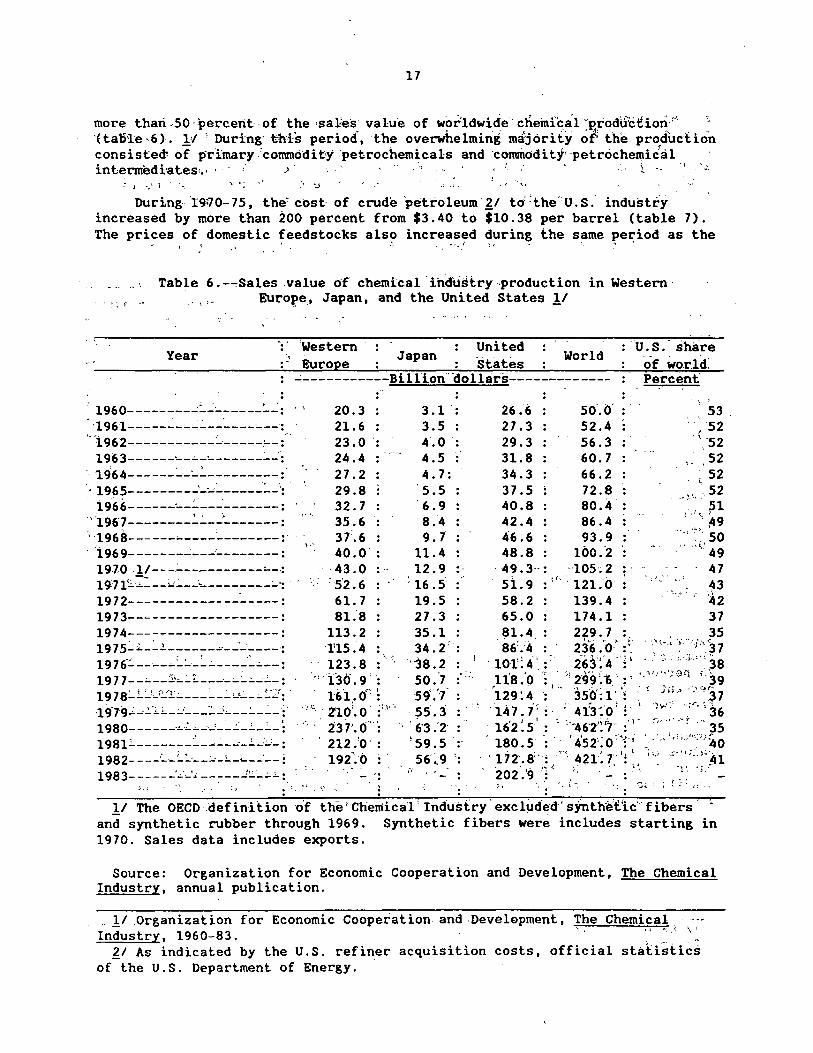
17
more thari -50 ·percent ·Of the •saJ!e·s valu·e of worldwide. chemfoal ,P,rod\fof.ion·'·' ~, ·ctalH.e ·.6). 1:/ ' During· ~his period·, the overwhelming majority of; the production consiste~ of 15ri.'mary 'commodity :petrochemicals and ·commoditf' ·petrochemidal intermedi'ates, .. · · : -' · · · ·, '· · · · t ··
J ·,· i ~ · .... '
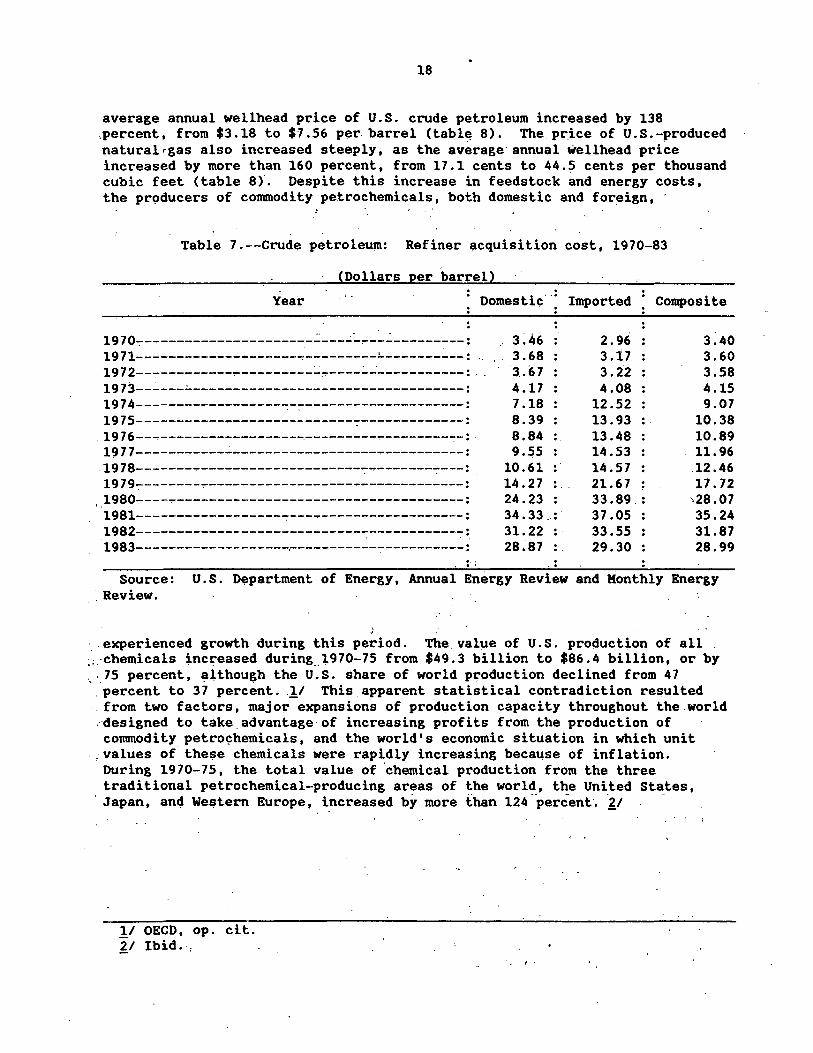
Duri.ng· t9l70-75, the~ cost of crude 'petroleum·.~/ t<i =the· u. s ." indu~tr.y increased by more than 200 percent from $3.40 to $10.38 per barrel (table 7). The prices of domestic feedstocks also increased during the same period as the
• -~ •• ~ • ~ # • ... •
. . ~ ; ,. . .. Table 6. -~Sales value of chemical ·industry --production in Western ·
. , , _ EuroP,e.. Japan, and the United States !/
Year . Western · United , Japan .. . . . World
··· ·Europe : States : ~-----------Billio~~oll~r~-------------
u.s.· share of worlcS: Percent'
.!_/ The OECD definition o·f the• Chentica1' Industry· exclj,ided" sioth-et.'ic'· fibers· · and synthetic rubber through 1969. Synthetic fibers were includes starting in 1970. Sales data includes exports.
Source: Organization for Economic Cooperation and Development, The Chemical Industry, annual publication .
.. .!_/ Organization for Economic Cooperation and -Development, The Chemical .. ' . " ... ( \ '. Industry, 1960-83.
~I As indicated by the U.S. refiner acquisition costs, official statistics of the U.S. Department of Energy.
18
average annual wellhead price of U.S. crude petroleum increased by 138 ,percent, from $3.18 to $-7.56 per barrel (tabl~ 8). The. price of U.S.-produced naturalrgas also increased steeply, as the average· annual wellhead price increased by more than 160 percent, from 17.1 cents to 44.5 cents per thousand cubic feet (table 8). Despite this increase in feedstock and energy costs, the prod1,1cers of conunodity petrochemicals, both domestic and foreign,
Table 7.--Crude petroleum: Refiner ~cquisition cost, 1970-83
(Dollars per barrel) . Year Domestic··: Imported Composite
19707---------------------~-----~--~---------: 1971--------------------~---------~----------: 19 7 2---:----------~---------·:...:""·----:._-· ____ "'." ______ : .. 1973--~---~----------------------------------: 1974------------------7-~--------------------:
1975---------------------------7-------------: 1976---------------------------------------~-: 1977-----------------------------------------: .1978----------------------------"'."--------7---: . 1979-:--------~--------------------------------: 1980-----------------------------------------: 1981-----------"'."------~---~------------------:
1982-----------------------~----~-----------7: 1983-------------------.------------:-----------: . . . '
3:46 3.68 3.67 4.17 : 7.18 8.39 8.84 9.55
10.61 : 14.27 .... 24.23 34. 33 ": 31.22 28~87
: . . . ..
2.96 3.40 3.i7 3.60 3.t2 3.58 4.08 4.15
12.52 9.07 13.93 . 10.38 13.48 10.89 14.53 11.96 14.57 .12.46 21.67 17. 72 33.89. ,28 .07 37.05 35.24 33.55 31.87 29.30 28.99
Source: U.S. Department of Energy, Annual Energy Review and Monthly Energy . Review.
,
·.experienced growth during this period. The. value of U.S. production of all , ;·;·chemicals inc~eased during __ 1970-75 from $49.3 billion to $86.4 billion, or by ~· 75 percent, ~lthough the U.S. share of world p~oduction declined from 47 . percent to 3 7 percent. J/ This apparent statistical contradiction resulted
·.from two factors, major expansions of production capacity throughout the world .·designed to take. advantage· of increasing profits from the production of conunodity petro~hemicals, and the world's economic situation in which unit
. ,-values of these ~hemicals were rapidly increasing because of inflation. During 1970-75, the total value of ·chemical production from the three traditional petrochemical-producing areas of the world, the United States, .Japan, an" We~tern Europe, increased by more than 124 .. percent-. ·21 ·
!I OECD, op. cit. ~./ Ibid. ,
·• l.
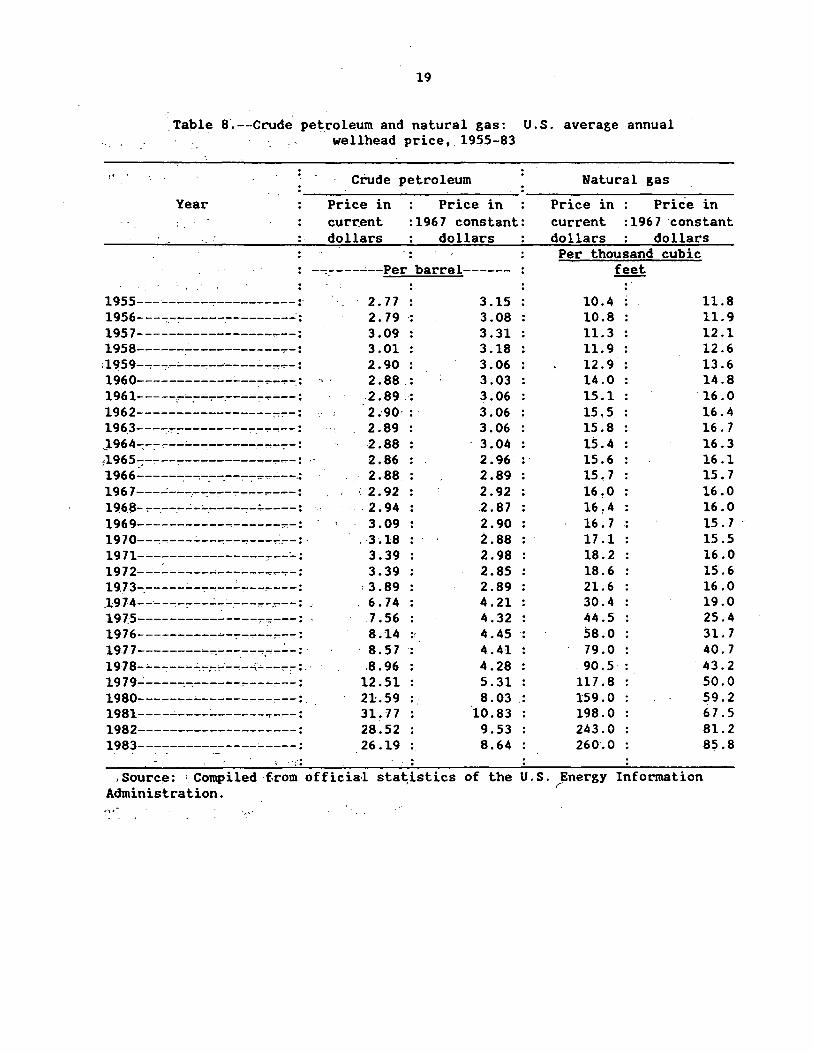
19
. Table 8.; --Crude pet_roleum and natural gas: U.S. average annual wellhead price, 1955-83
Year
1955---~------:----------~ 1956----:---------:-------~:
1957------------------:--: 1958------~-----------.,--: ;1959--::--:---:...---,------.:..-,..,.,.-: 1960---------------:::-----:-:~ 1961-----_.,-'-_--::;--.----:-... ---: 1962------------------::-::-: 196.3----.-:---------,.._-.,-..,--: J 964-:.-:-.,..--:...--------.--,-.,--: a965~----....,---------..,-.,..--: 1966------:--:-:--:---::-:-,.-----.: 1967---..:,---:--:-:--.,----,----: 196.8- -:--.--.-...:-'-.-----:-:..----: 1969----------------,--~-:
1970---:~---~--....,---,---~--:
1971----------------.,..--:~!
1972---~------------~----: 1973-:-----~-.,..---.:...,..--,..---: .19.74--·---:-:---..:.-:-----,..-::---: . 19 7.5----.,-----------..,.,,----: 1976---------....,~- .... -.---,..--: 1977----------:'---_--_,,..,_.:.._:. 1978-'---:----...:-~~-....,-~...:--.,..-:,
1979..:.-----.-.------,-------: 1980-------:...------------~. 1981----~----..:.------~---:
1982----------------'----: 1983---------------;...----:
Crude petroleum
Price in Price in current :1967 constant: dollars dollars
-~:----~--Per barrel------
2. 77 2. 79 ,. 3.09 3.01 2.90 2.88 • 2·.89 .• 2.-90·:. 2.89 2.88 2.86 2.88
' 2.92 . 2.94 3.09
. ·3.18 3.39 3.39
: 3.89 6.74 7.56 8.14 •. 8.57 •
.. 8.96 12.51 21:.59 •. 31.77 28.52 26.19
3.15 3.08 3.31 3.18 3.06 3.03 3.06 3.06 3.06
. 3.04 2.96 • 2.89 2.92 2.87 2.90 2.88 2.98 2.85 2.89 4.21 4.32 4.45 • 4.41 4.28 5.31 8.03 .
'10.83 9.53 8.64
Natural gas
Price in Price in current :1967 ·constant dollars dollars Per thousand cubic
feet .. 10.4 11.8 10.8 11.9 11.3 12.1 11.9 12.6 12.9 13.6 14.0 14.8 15.1 16.0 15,5 16.4 15.8 16.7 15.4 16.3 15.6 16.1 15. 7 15.7 16!0 16.0 16.4 16.0 16.7 .. 15. 7 -17.1 15.5 18.2 16.0 18.6 15.6 21.6 16.0 30.4 19.0 44.5 25.4 58.0 31. 7 79.0 40.7 90.5·: 43.2
117 .8 50.0 159.0 59.2 198.0 6 7 .5 243.0 81.2 260·.o 85.8
,Sourc~: , Compiled ·f.rom official stat,istics of the U.S. Energy Information r Administration.
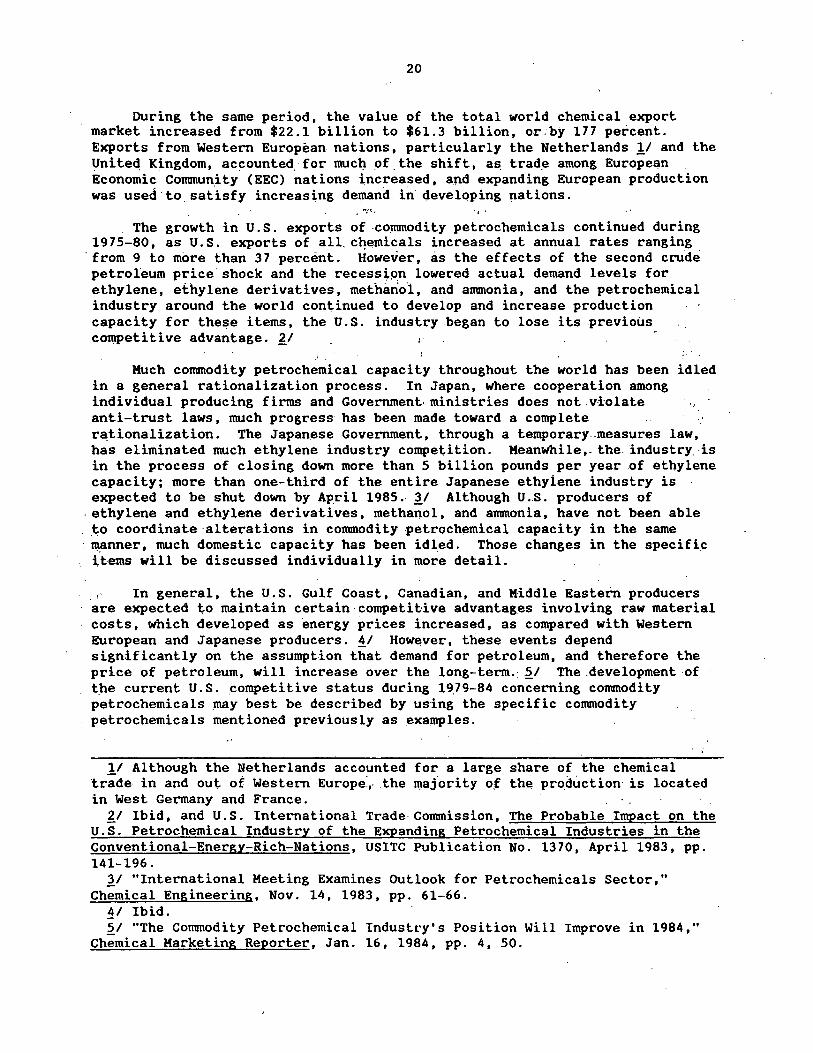
20
During the same period, the value of the total world chemical export market increased from $22 .1 billion to $6L 3 billion, or. by 177 percent. Exports from Western European nations, particularly the Netherlands 11 and the United Kingdom, accounted. for muc~ of.the shift, as trad~ among Europe~n Economic Community (EEC) nations ~ncreased, a~d expanding European production was used· to sat.isfy increasing demand in develQping nations.
''"/t, ., . The growth in U.S. exports of -commodity petrochemicals continued during
1975-80, as U.S. exports of all. c~emicals increased at annual rates ranging ·from 9 to more than 37 percent. However, as the effects of the second crude petroleum price· shock and the recess~~m lowered actual demand levels for ethylene, ethylene derivatives, methanol, and ammonia, and the petrochemical industry around the world continued to develop and increase production capacity for these items, the U.S. industry began to lose its previous competitive advantage. £1 ,
.·. Kuch commodity petrochemical capacity throughout the world has been idled
in a general rationalization process. In. Japan, where cooperation among ., individual producing firms and Government-ministries does not v~olate
anti-trust laws, much progress has been made toward a complete r~tionalization. The Japanese Government, through a temporary.measures law, bas eliminated much ethylene industry competition. Meanwhile,. the.industry is in the process of closing down more than .5 billion pounds per year of ethylene capacity; more than one-third of the entire Japanese ethyiene industry is expected to be shut down by Ap_ril 1985 ... ~/ Although U .. s. producers of
.ethylene and ethylene derivatives, methanol, and ammonia, have not been able ~o coordinate·alterations in commodity petrochemical capacity in the same
· ~nner, much domestic capacity bas been idled. Those changes in the specific items will be discussed individually in more detail.
r' In general, the U.S. Gulf Coast, Canadian, and Middle Eastern producers are expected to maintain certain competitive advantages involving raw material costs, which developed as energy prices increased, as compared with Western European and Japanese producers. !I However, these events depend significantly on the assumption that demand for petroleum, and therefore the price of petroleum, will increase over the long-term.:~/ The.development of t_he current U.S. competitive status during 19.79-84 concerning commodity petrochemicals 11\ay best be described by using the specific commodity petrochemicals mentioned previously as _examples.
11 Although the Netherlands accounted for a large share of the chemical trade in and out of Western -Europe:, .. the ll)aJori ty o~ the pro_duction· is located in West Germany and France.
£1 Ibid, and U.S. International Trade· Commission, The Probable Impact on the U.S. Petrochemical Industry of the Expanding Petrochemical Industries in the Conventional-Energy-Rich-Nations, USITC Publication No. 1370, April 1983, pp. 141-196.
'JI "International Meeting Examines Outlook for Petrochemicals Sector," Chemical Engineering, Nov. 14, 1983, pp. 61-66.
!I Ibid. ~I "The Commodity Petrochemical Industry's Position Will Improve in 1984,"
Chemical Marketing Reporter, Jan. 16, 1984, pp. 4, 50.
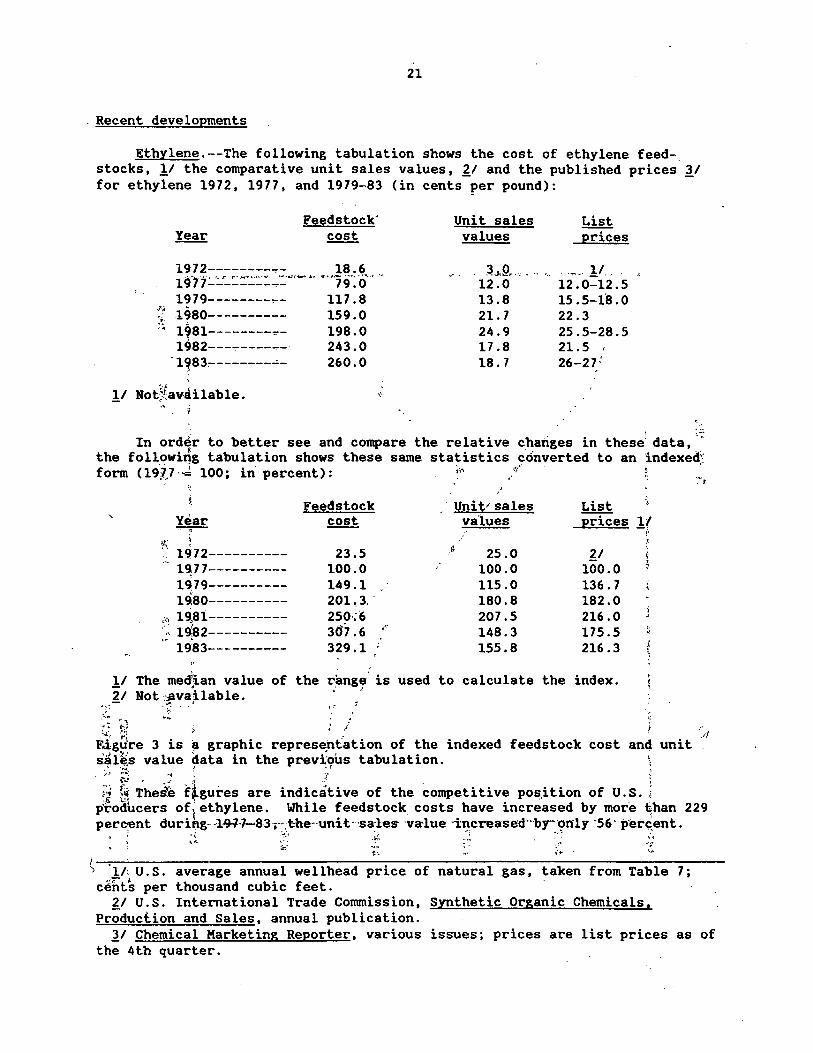
21
. Recent developments
Ethylene.--The following tabulation shows the cost of ethylene feedstocks, !I the comparative unit sales values, £1 and the published prices i1 for ethylene 1972, 1977, and 1979-83 (in cents per pound):
1979--------:-J'~ 1980---------:~: .. 1981--------~-
1982---.,-------·1~83,.... _______ ...;._
!I Not;tav-liilable.
Feedstock· cost
117 .8 159.0 198.0 243.0 260.0
·~-
Unit sales values
. ~,,.Q,.,' ., "• 12.0 13.8 21. 7 24.9 17.8 18.7
List prices
. ·~- !I .. 12.0-12.5 15.5-18.o 22.3 25.5-28.5 21.5 ' 26-27:
In order to better see and compare the relative changes in these' data,·-~'. the followirlg tabulation shows these same statistics converted to an indexed\ form (19;7)-"'4 lOOi in percent): ,;, </
Year -.-,-'(;_ ~
1972----------1~77----------1979---------lcl80----------
.;;. 19,8i---------. 19:82----------1983----------
Feedstock cost
23.5 ·100.0 149.1 201,3 ... 250·;6 307. 6 ,, .
329.1
Unit-" sales List values prices
~ 25.0 ~/ 100.0 100.0 115.0 136. 7 180.8 182.0 207.5 216.0 148.3 175.5 155.8 216.3
!I The med:ian value of the rangf;J is used to calculate the index. £1 Not .·Slvai. lab le. · ,
i ~ '; - "'! • ~ ·~
; :~... .. "#
·.~.
1/ -~
l
~; t~ / 0
ii! &igure 3 is ~ graphic representation of the indexed feedstock cost and unit s'81i;s value data in the previous tabulation . . ::~ ·::£.. =-i .' :. !
"'"' .. ,,.. . -~
)_i t, Thetfe f~gures are ind~c~tive of the competitiv? po~:ition of U.S.; producers o~ 1 ethylene. While ~eedstock costs.have increased by more_t,han 229 percent duru:tg· -·1·9-H-83 0-·;t-he--um.t-·sa-les ·va·lue "l:ncrea-sed--·by-·~1\ly "56' p·er~ent.
~ f ~~. :~:. -~ .. :~ ·~~~· ,'t
;h' ~~. ; . ..::1· -:~
S '11: U.S. average annual wellhead price of natural gas, taken from Table 7; ,;;;- j
cents per thousand cubic feet. £1 U.S. International Trade Commission, Synthetic Organic Chemicals,
Production and Sales, annual publication. ll Chemical Marketing Reporter, various issues; prices are list prices as of
the 4th quarter.
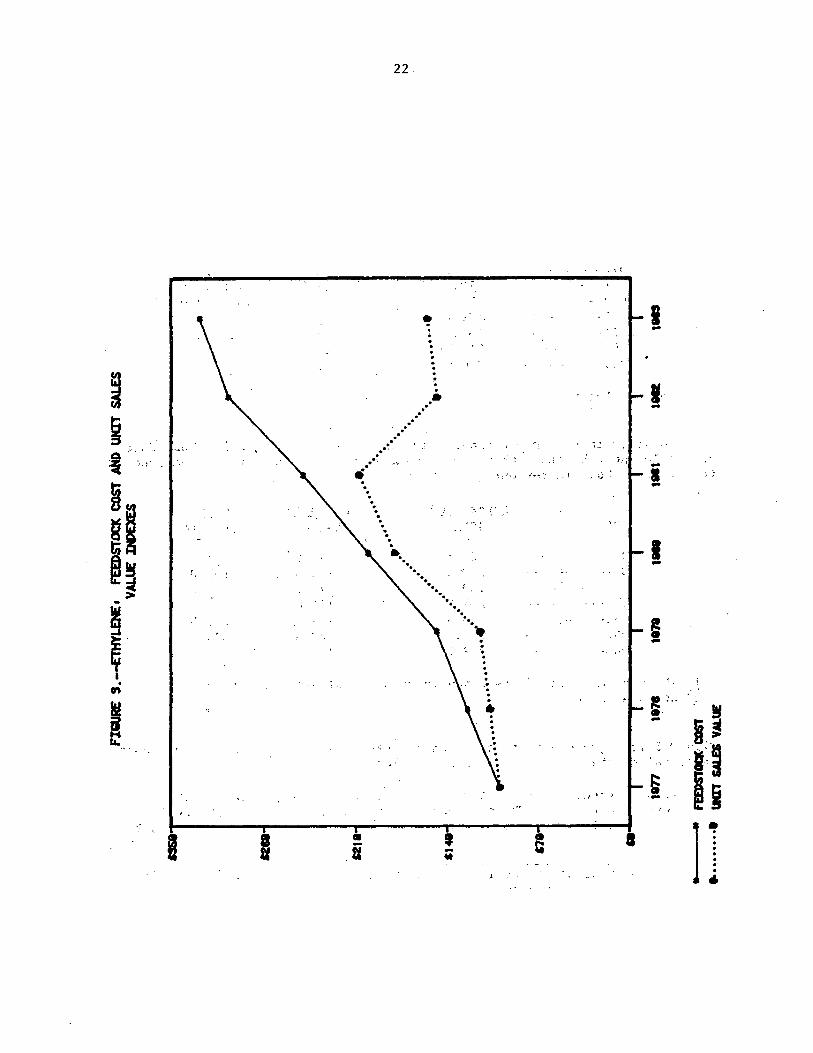
~ g Q
:.·. < •• ... . '
~ I• ~
u 11 ~ ' '
> -~ ey I .
ft
I ...
I
22
~-··· .· .··· •.. •: .... . . . . . . . . . . . . . • ..
.··
·· ..
• . . . . : . . . . . . . . . • . ··
I -
I· -' • . I~·
. :; ... ;
·~; ... .. { . .,,. ~· -. / ' ~; . -i -"-: •..
. ..
····.:
I -··... ( .
. ·: '
,·
at -.U
··. . .
'···~ .... .
. · ~ - ' ~ . . . . ., .... ·. . . • . .
.. , .. !- .;
! -. .. . llliii. ..... . • . !!I
~ i.~ '. ' .. ·~ . ''. . .. ~
.. . II
§: h I
I 1
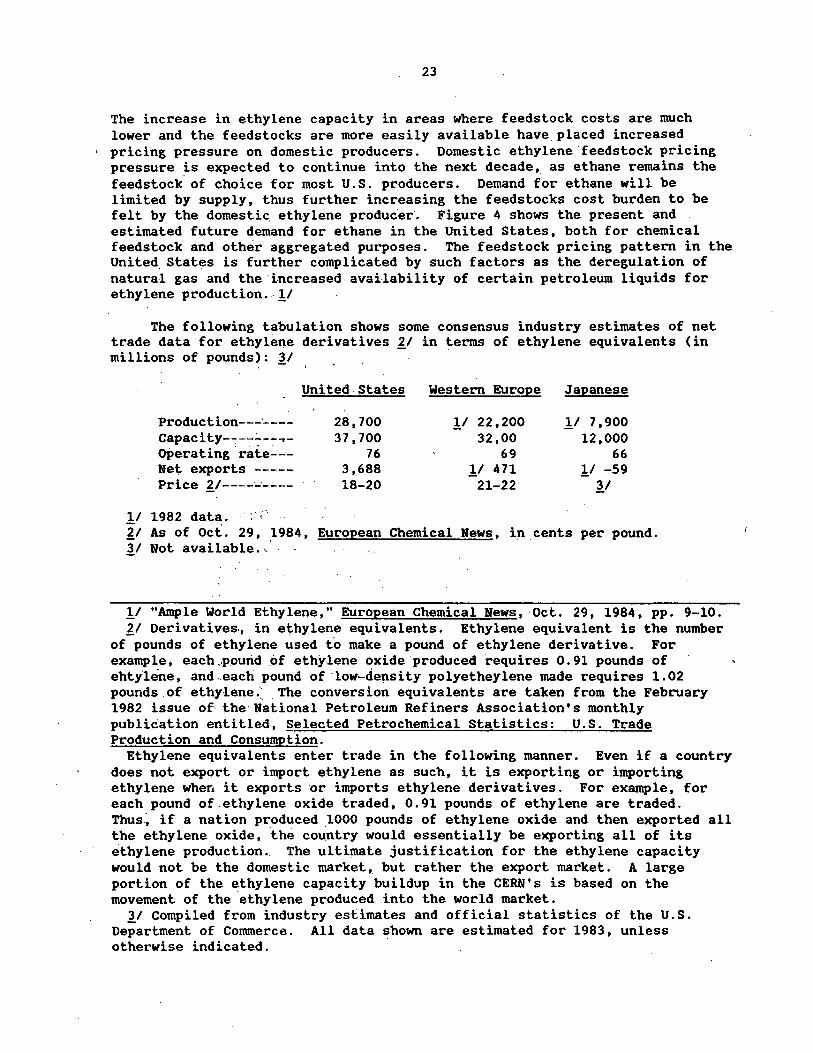
23
The increase in ethylene capacity in areas where feedstock costs are much lower and the feedstocks are more easily avaiiable have placed increased
• pricing pressure on domestic producers. Domestic ethylene feedstock pricing pressure is expected to continue into the next decade, as ethane remains the feedstock of choice for most U.S. producers. Demand for ethane will be limited by supply, thus further increasing the feedstocks cost burden to be felt by the domestic, ethylene produc.er·. Figure 4 shows the present and estimated future demand for ethane in the United States, both for chemical feedstock and other aggregated purposes. The feedstock pricing pattern in the United. Stat~s is further complicated by such factors as the deregulation of natural gas and the·increasedavailability of certain petroleum liquids for ethylene production ... .!I
The following tabulation shows some consensus industry estimates of net trade data for ethylene derivatives ~/ in terms of ethylene equivalents (in millions of pounds): i1
Production---·---Capacity-~--~--~operating rate~-Net exports ----Price ~/~---~·-'---
United States
28,100 37,700
76 3,688 18-20
Western Europe
_!/ 22,200 32,00
69 .!I 471
21-22
Japanese
.!I 7,900 12,000
66 .!I -59
3/
.!I 1982 data. · :: ' ~I As of Oct. 29, 1984, European Chemical News, in.cents per pound. i1 Not available. , ·
.!I "Ample World Ethylene," European Chemical News, ·Oct. 29, 1984, pp. 9-10. ~I Derivatives., in ethylene equivalents. Ethylene equivalent is the number
of pounds of ethylene used to make a pound of ethylene derivative. For example, each .. pourid of ethylene oxide produced requires 0. 91 pounds of ehtylene, and each pound of low.,...density polyetheylene made requires 1.02 pounds of ethylene: .. The conversion equivalents are taken from the February 1982 issue of' the· National Petroleum Refiners Association's monthly publication entitled, Selected Petrochemical Statistics: U.S. Trade Production and Consumption.
Ethylene equivalents enter trade in the following manner. Even if a country does not export or import ethylene as such, it is exporting or importing ethylene when it exports ·or imports ethylene derivatives. For example, for each pound of .ethylene oxide traded, 0.91 pounds of ethylene are traded. Thus.~ if a nation produced 1000 pounds of ethylene oxide and then exported all the ethylene oxide, the coU:ntry would essentially be exporting all of its ethylene production. The ultimate justification for the ethylene capacity would not be the domestic market, but rather the export market. A large portion of the ethylene capacity buildup in the CERN's is based on the movement of the ethylene produced into the world market.
i1 Compiled from industry estimates and official statistics of the U.S. Department of Commerce. All data shown are estimated for 1983, unless otherwise indicated.
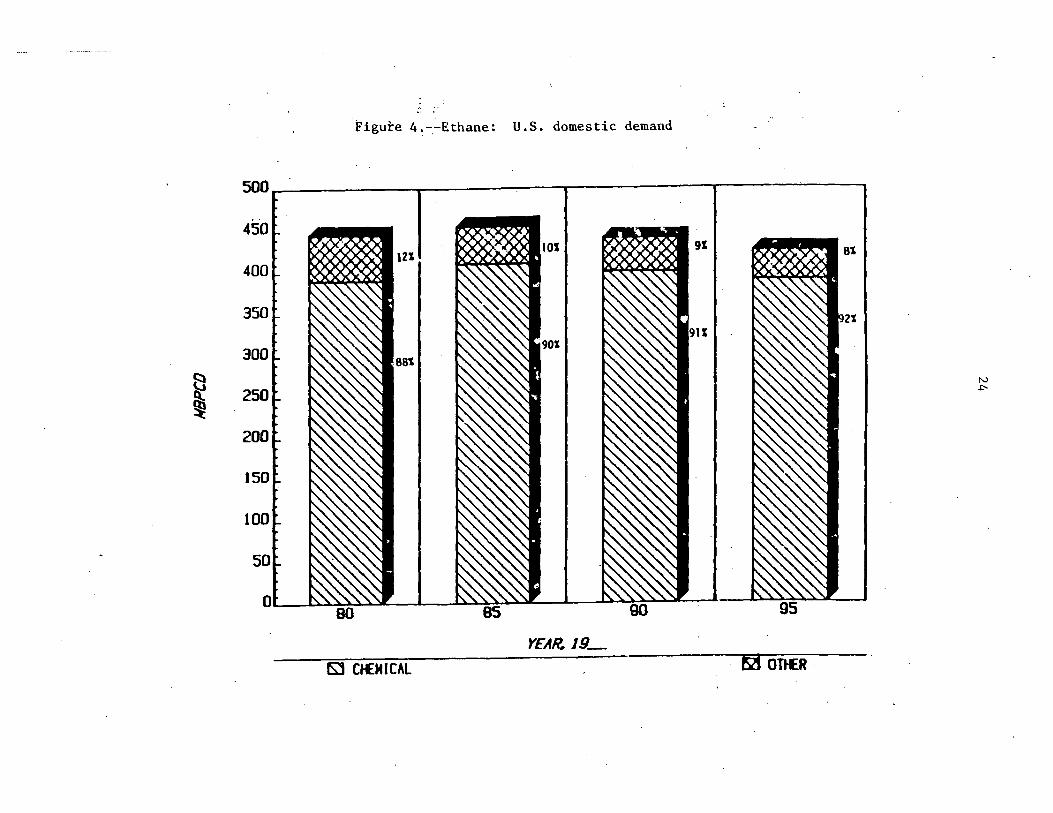
a al ~
Figure 4~--Ethane: U.S. domestic demand
500.--~~~~~--~~~~~--~~~~~....-~--~~~-
450 ~}'..A.JI.AA.~ 121 81
400
350 21
300
250
200
150
100
50
Qt ~ I l\'Y•·LJ.">,)>'\r I !).).'>),'>'" I D >. ">» > > v I
es
YEAR. 19_
~ CHEMICAL M OTtER
N .t:--
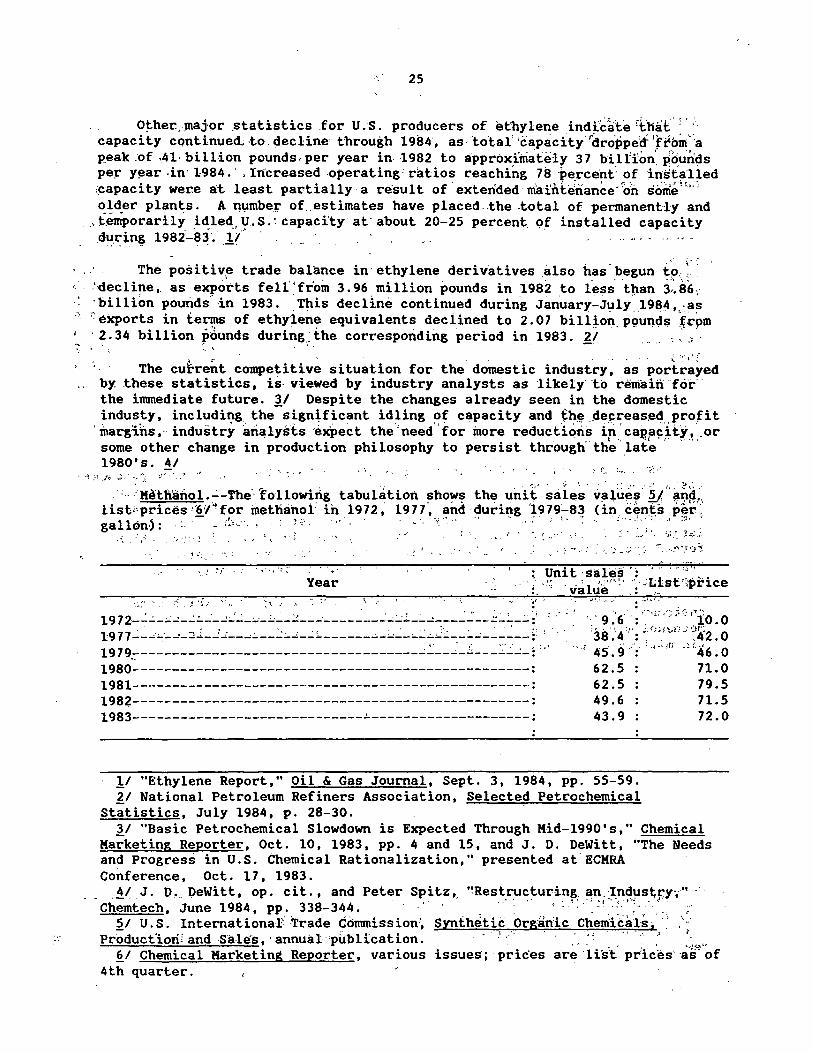
25
O~her. .. ,major _statistics .for U .·s. producers of ethylene indi~~te 'tna( '. ;. capacity continued.. ·to. ciecHne through 1984·, as· total' 'capacity r~koppe'cf 'ftl>m···a P-eak .of ,41. billion pounds.· per year in 1982 to approximately 37 bilHon~ pC>u.nds pe~ y~ar ·in· 1984. · , Increased operating' ratios reaching 78 pe_rcent: of in~ia·1ied ;~apacity were. at least partially a re·sult of exterided·rria1ntenance·;on s'6ili~·i,,::. older plani'.,s. A rn,1mber of.estimates have placed. the .total of permanently and
. , fenli>orarily idled U.S.'. capaci'ty· at· about 20-25 percent. of installed capacity d~.~inJ? 1982.:..8~. _i/·· · ·
.' v ·:· The positi~.~ trade bala~ce in· ethylene derivatives .also h_as._begun f:.?·:,i.
• ... 'decline,. as exports fell'fr'om 3.96 million pounds in 1982 to less t~an 3,.86, ' ·billion pounds .. in 1983. This decline continued during January-July 19~4 •. -as ·' ·~exports in terr,ns of ethyiene equivalents deciined to 2. 07 bilq.on_ pQunc;!s (r\>m
· 2. 34 billion p6unds during_.: _the correspond fog period in 1983. '~/ ..... . _: ;: · . .. '·
~ .· ;1 :. The cu~re~t competitive situation for the domestic industry, as portrayed
.. by. .these statistics, is- viewed by industry analysts as likely· ·to remain for· the inunediate future. 3/ Despite the changes already seen in the domestic industy, includii:tg. the-sign~ficant idling !'f capacity and th~ .de.~~eas~ct_profit
'margitls ,. industry analysts ·ex'pect the 'need. for more reductions ip. C~J?fl~~tt~ ;·or some other change in production philosophy to persist through the _late 1980' s. !I . . .. ::. '··· ·;':··· . ·~.!i_t::-·;;. .-;•,··:) .~ .•. ,
. "'..' ~
. : · ·KethanoL..:.-The·· following tabulation shows the unit s8les list''Prices '!'/"for methanol: In 1972, 1977', and ·during 'i979:....a3 gallon): ... - .. ~-,,.. .. , -~~=· · · -·- ··1.·•.·• ·• --.,·:· '•· •
• ; • • \ < .i I • ,•·' :• ~. ~' • •, : . ~ ' . ... . ,,_. I ". ;.I~..' !-A~ .: .
. ., ? .. ·: '. . ·~, : . ' . '.· ···.: ~ '. ·.;. _:) '"_:- ~.:··.~ ... ~:!';~
·. -· ~ t. : .. · .• ·1 :· . . ...
Year ..... ~ ·l · .,. ··i J' ). ... ~· '; '•'. ...~·-~-- • ~''"'·
~: ~ ~::~= =~~=;~==·~~~=~=~==~=~~=========~==c;J===~==~= ~== ~: .. · .. ·. . . jf: . ~ : ~· :.~;: '.: :;~~: ~ 197~~-----------------------------------~---~-~---~-~-: 45.9 : 46.0 1980--~-----------------------------------------------: 62.5 71.0 1981--------------------------------------------------: 62.5 79.5 1982--------------------------------------------------: 49.6 71.5 1983-----------------------------~--------------------: 43.9 72.0
.!I "Ethylene Report," Oil & Gas Journal, Sept. 3, 1984, pp. 55-59. ~I National Petroleum Refiners Association, Selected Petrochemical
Statistics, July 1984, p. 28-30. 11 "Basic Petrochemical Slowdown is Expected Through Kid-1990's," Chemical
Marketing Reporter, Oct. 10, 1983, pp. 4 and 15, and J. D. DeWitt, "The Needs and Progress in U.S. Chemical Rationalization," presented atECKRA Conference, Oct. 17, 1983.
4/ J. D. DeWitt, op. cit., and Peter Spitz, '!Restructuring. an.-Indust,ry·/' · · ·- • ••• - • w • ,· • ~ ~ - ; .. ·I.,-.. ,· . .: . •-!'.
Chemtech, June 1984, pp. 338-344. · · · , · · • ' · · · . · . · ~-- :- , · ., ;-51 U.S. International' ·Trade Ccimmission-~ Synthetic Or&an'ic Chemiclils; '. .'.·
Pr;;duct1orii and Sales,· anm.ial 'publication. · ·· · ·' -·· · · " ·· - · ·' ' ~I Chemical Marketing Reporter, various issues·; prices ar~- lis't' prtc.es· ·a"ii~·~f
4th quarter.
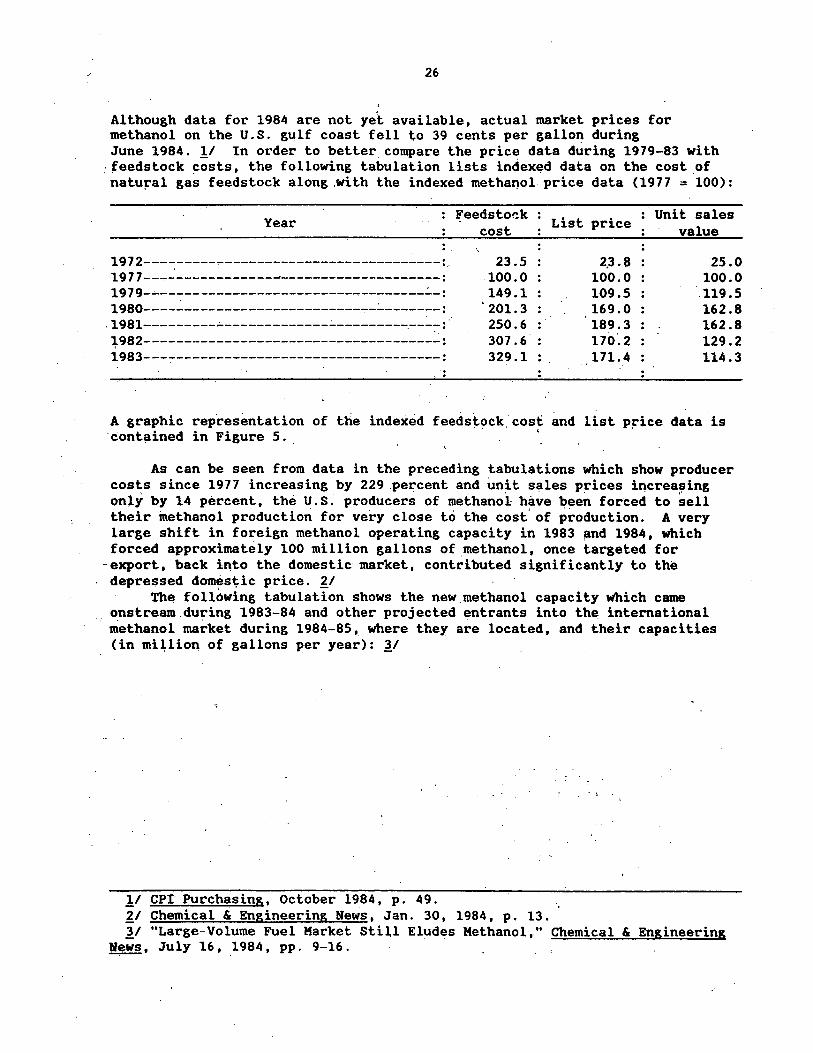
26
. Although data for 1984 are not yet available, actual market prices for methanol on the U.S. gulf coast fell to 39 cents per gallon during June 1984. !I In order to better. compare the price data during 1979-83 with
:feedstock costs, the following tabulation lists indexed data on the cost .of natu~al gas feedstock along ,with the indexed methanol price data (1977 = 100):
Year Feedstock List price Unit sales
1972-------------------------------------:, 1977----------------~--------------------: 1979-~---------------------------------~-: 1980---------------------------~-~-------: .1981---------~-------------~--------~----:
l982-------------------------------------: 1983---~---------------------------------:
cost
23.5 100.0 149.1
• 201. 3 250.6 307.6 329.1 :
value
2,3.8 25.0 100.0 100.0 109.5 119.5 169.0 162.8 189.3 162.8 110·.2 129.2 171.4 114.3
A graphic rep.resentation of the indexed feeds~ock ·cos~ and list p~ice data is cont~ined in Figure 5.
As can be seen from data in the preceding tabulations which show producer cos~s since 1977 increasing by 229 .percent and unit sales prices increa~ing only by 14 percent, the U.S. producers of methanol have been forced to sell their methanol production for very close to the cost' of production. A very large shift in foreign methanol operating capacity in 1983 ~nd 1984, which forced approximately 100 million gallons of methanol, once targeted for
-export, back into the domestic· market, contributed significantly to the depressed domes~ic price. ~/
The foll6wing tabulation shows the new.methanol capacity which came onstream,during 1983-84 and other projected entrants into the international methanol market during 1984-85, where they are located, and their capacities (in mi~lion'of gallons per year): i1
''
!/ CPI' Purchasing, October 1984, p. 49. ~I Chemical & Engineering News, Jan. 30, 1984, p. 13. it "Large-Volume Fuel Market Still Eludes Methanol," Chemical & Engineering
News, July 16, 1984, pp. 9-16.
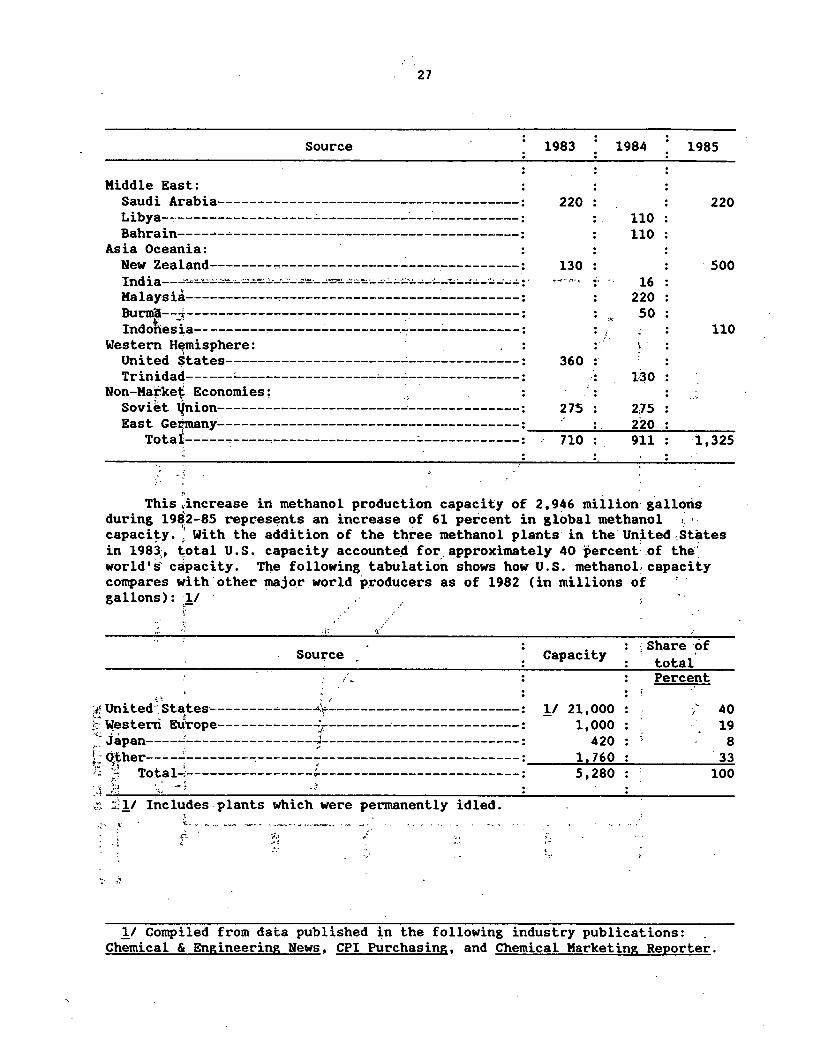
27
Source 1983 1984 1985
220 220 110 110
130 . 500 .. 16 220
:;: .50
/. 110 .. 360 :·
1·~0
275 2l5 . - 220
710 911
.. ·~
,. This ,increase in methanol production capacity of 2,946 million· gallons
during 19~2-85 repres~nts an increase of 61 percent in global methanol ,: · capacity.'! With the addition of the three methanol plants in the· united fstates in 1983.:. ~otal U.S. capacity accounte4 for:approximately 40 percent:_of the'. world's~ capacity. Tl).e following tabulation shows how U.S. methanol:· capacity compares with other major world producers as of 1982 (in millions of gallons): :!I
~
Sout;ce Capacity Share ·of total Percent
i.'l United;:·~St~tes·-·--------'-----...:<:--~-----------------------: !I 21, 000 40 !.:- Western Et.i'rope--- ---------..:;:--------------------------: 1, ooo 19
. ~~;::~~~~ii================t=========================:~~~!--:i-:-~~~~~~~-1~~~~ ~--l )~~ -~. ~-~ -J
:.~ i!I Includes -plants which were permanently idled. ' .; ·' \.:.. .............. .......
'
t~
11 Compiled from data published in the following industry publications: Chemical & Engineering News, CPI Purchasing, and Chemical Marketing Reporter.
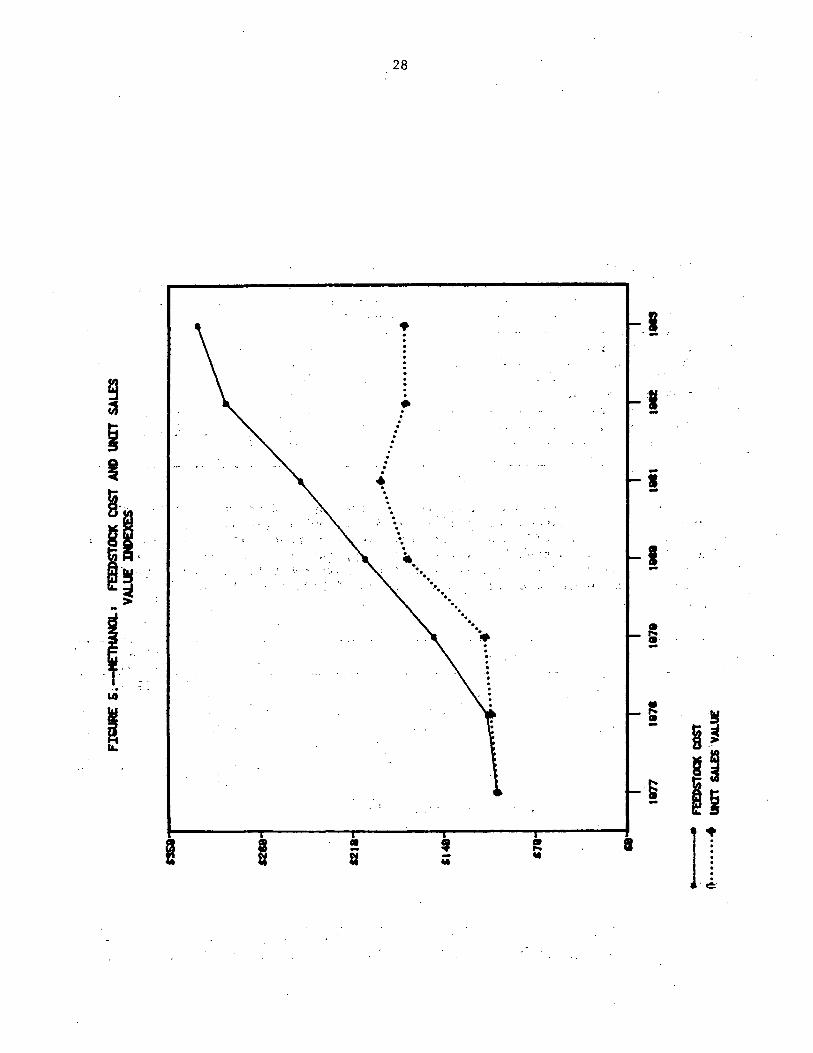
'I :.
: ~ ·.. .,_
·• UI
I
I C9 -u
28
• . .
. . . . . ~
. .
. . . . . .
. . . . . . . . . . • . . .. .
.. ._, . . . . . . .. ··~. . ·. ·.•.. . .
·· ... ·. ·. • • •• . .
•· . . . . . .. . .
I . ... ·
. I . -. -
I -• • ~ I .
I -~ ~ .' " -
~ et· -
~ Cl -
Q -I
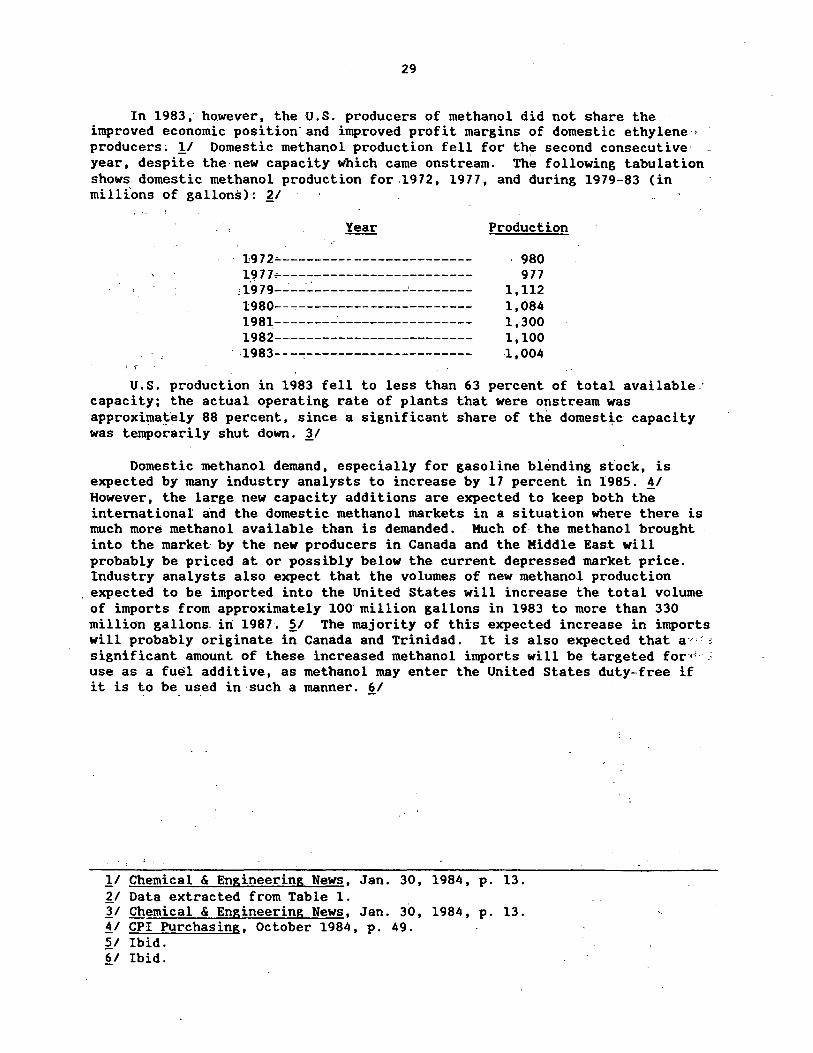
29
In 1983 ,- . however, the U.S. producers of methanol did not share the ·improved economic position· and improved profit margins of domestic ethylene-· producers. 11 Domestic methanol production fell for the second consecutive year, despite the new capacity which came onstream. The following tabulation shows domestic methanol production for.1972, 1977, and duririg 1979-83 (in millions of gallons): ~/
1972~------------------------
1977~------------------------; 1'9 79_..:.._~·.:_ ____________ , _______ _
1980--~----------------------1981-------~-----~-----------1982-------------------------1983---~---------------------
Production
' 980 977
1, 112 1,084 1,300 1,100 ·1,004
U.S. production in 1983 fell to less than 63 percent of total available: capacity; the actual operating rate of plants that were onstream was approxima~ely 88 percent, since a significant share of the domest~c capacity was temporarily shut down. 11
Domestic methanol demand, especially for gasoline blending stock, is expec-ted by many industry analysts to increase by 17 percent in 1985. 4/ However, the large new capacity additions are expected to keep both the international and the domestic methanol markets in a situation where there is much more methanol available than is demanded. Kuch of the methanol brought into the market by the new producers in Canada and the Middle East will probably be priced at or possibly below the current depressed market price. Industry analysts also expect that the volumes of new methanol production
. expected to be imported into the United States will increase the total volume of imports from approximately 100 million gallons in 1983 to more than 330 million gallons. iri 1987. ~/ The majority of this expected increase in imports will probably originate in Canada and Trinidad. It is also expected that a··· ' significant amount of these increased methanol imports will be targeted for«;· _: use as a fuel additive, as methanol may enter the United States duty-free if it is to be used in such a manner. 6/ . . -
l .
11 Chemical & Engineering News, Jan. 30, 1984, p. 13. £1 Data extracted from Table 1. 11 Chemical & Engineering News, Jan. 30, 1984, p. 13. 4/ CPI Purchasing, October 1984, p. 49. ~I Ibid. §_I Ibid.
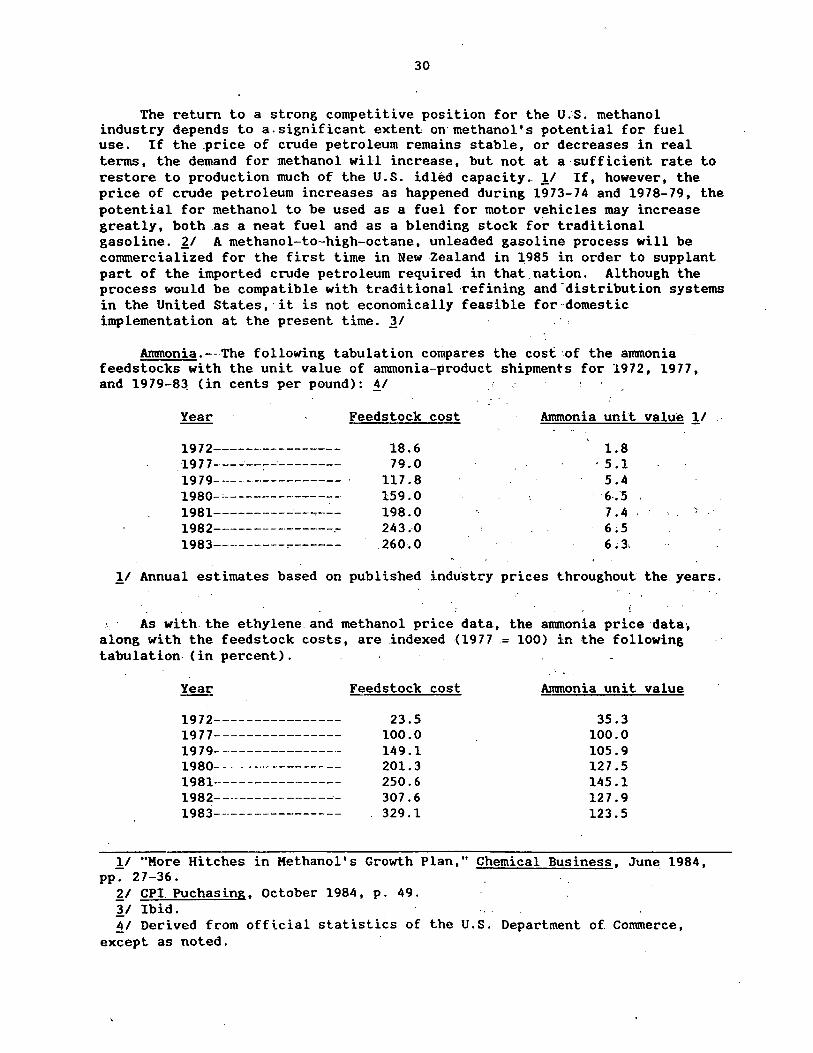
30
The return to a strong competitive position for the U;S. methanol industry depends to a.significant extent on-methanol's potential for fuel use. If the .price of crude petroleum remains stable, or decreases in real terms, the demand for methanol will increase, but not at a·sufficietit rate to restore to production much of the U.S. idled capacity .. ll If, however, the price of crude petroleum increases as happened during 1973-74 and 1978-79, the potential for methanol to be used as a fuel for motor vehicles may increase greatly, both .as a neat fuel and as a blending stock for traditional gasoline. £1 A methanol-to-high-octane, unleaded gasoline process will be commercialized for the first time in New ·Zealand in i985 in order to supplant part of the imported crude petroleum required in that.nation. Although the process would be compatible with traditional ·refining and-distribution systems in the United States,·it is not economically feasible for-domestic implementation at the present time. 11
Anunonia.--The following tabulation compares the cost·of the ammonia feedstocks with the unit value of ammonia-product shipments for 1972, 1977, and 1979-8~ (in cents per pound): ~/
Feedstock cost
1972----------------_ 1977---~--~~--------1979---------------- . 1980-~--------------
1981---------~--~---
1982---------------~
1983--------~~------
18.6 79.0
117.8 159.0 198.0 243.0
.260·.0
Ammonia unit value l/
1.8 '5 .1
5.4 6-."5 7.4 6;5 6 ~3·
ll Annual estimates based on published industry prices throughout the years.
As with.the ethylene and methanol price data, the ammonia price data, along with the feedstock costs, are indexed (1977 = 100) in the following tabulation- (in percent).
1972----------------197 7----------------1979----------------1980--- - ------------1981----------------1982----------- ---------1983----- -----------
Feedstock cost
23.5 100.0 149.1 201.3 250.6 307.6 329.1
Ammonia unit value
35.3 100.0 105.9 127.5 145.1 127.9 123.5
ll "Kore Hitches in Methanol's Growth Plan," Chemical Business, June 1984, pp. 27-36.
£1 CPI Puchasing, October: 1984, p. 49. 3/ Ibid. ~I Derived fr:om official statistics of the U.S. Department of Conunerce,
except as noted.
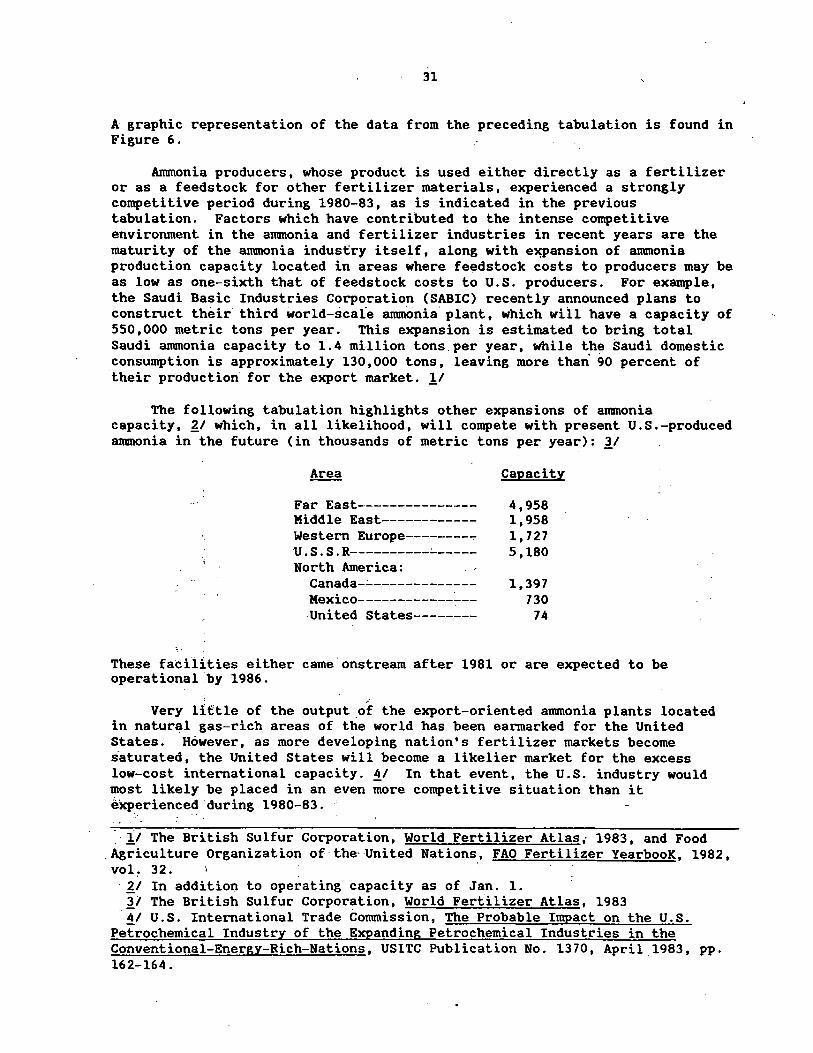
31
A graphic representation of the data from the preceding tabulation is found in Figure 6.
Anunonia producers, whose product is used either directly as a fertilizer or as a feedstock for other fertilizer materials, experienced a strongly competitive period during 1980-83, as is indicated in the previous tabulation. Factors which have contributed to the intense competitive environment in the ammonia and fertilizer industries in recent years are the maturity of the ammonia industry itself, along with e'Wansion of ammonia production capacity located in areas where feedstock costs to producers may be as low as one-sixth that of feedstock costs to U.S. producers. For example, the Saudi Basic Industries Corporation (SABIC) recently announced plans to construct their third world-scafe ammonia' plant, which will have a capacity of 550,000 metric tons per year. This expansion is estimated to bring total Saudi ammonia capacity to 1.4 million tons per year, while the Saudi domestic consumption is approximately 130,000 tons, leaving more than 9o percent of their production for the export market. !I
The following tabulation highlights other expansions of ammonia capacity, i1 which, in all likelihood, will compete with present U.S.-produced anunonia in the future (in thousands of metric tons per year): i1
Far East--------------Kidd le East-----------Western Europe--------~ 'U.S.S.R----------~-----
North America: Canada-~------------Mexico------------~-United States--------
Capacity
4,958 :L,958 1,727 5,180
1,397 730
74
These facilities either came'onstream after 1981 or are expected to be operational .by 1986.
,, Very little of the output .of the export-oriented ammonia plants located
in natural gas-rich areas of the world has been earmarked for the United States. However, as more developing nation's fertilizer markets become s·aturated, the United States will become a likelier market for the excess low-cost international capacity. !I In that event, the U.S. industry would most likely be placed in an even more competitive situation than it e)cperienced during 1980-83 .
. · !/ The British Sulfur Corporation, World Fertilizer Atlas; 1983, and Food ,Agriculture Organization of-the· United Nations, FAO Fertilizer YearbooK, 1982, vol~ 32. · £1 In addition to operating capacity as of Jan. 1. i1 The British Sulfur Corporation, World Fertilizer Atlas, 1983 4/ U.S. International Trade Commission, The Probable Impact on the U.S.
Petrochemical Industry of the Expanding Petrochemical Industries in the Conventional-Energy-Rich-Nations, USITC Publication No. 1370, April 1983, pp. 162-164.
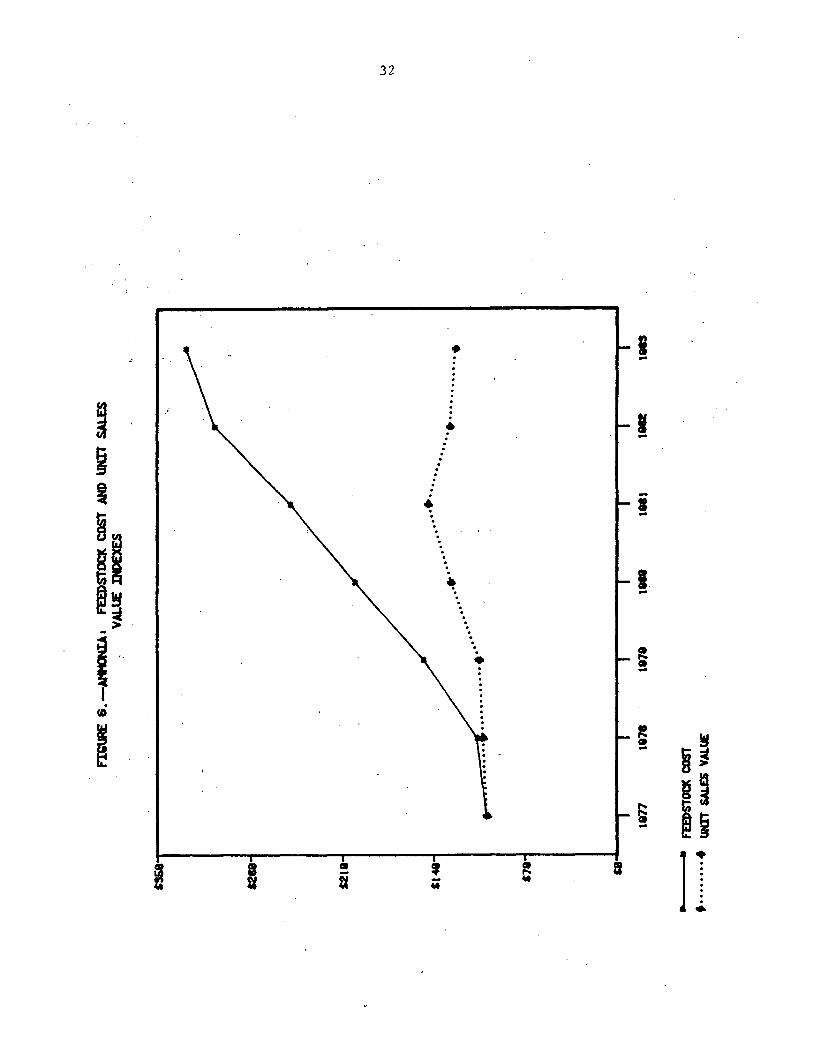
32
• I : -. . . . :
~ .
; : . I • .. -g . . . Q . ~
. . -• I .
til . -. .
~ . ~ I
~a -. . . . >· . . -
' . .
~ '· • Cit . -. . : . . co . .
~ . .
~ Cit !!I -
ft :
~ u -• ' •
11 - ,... u - ... ...
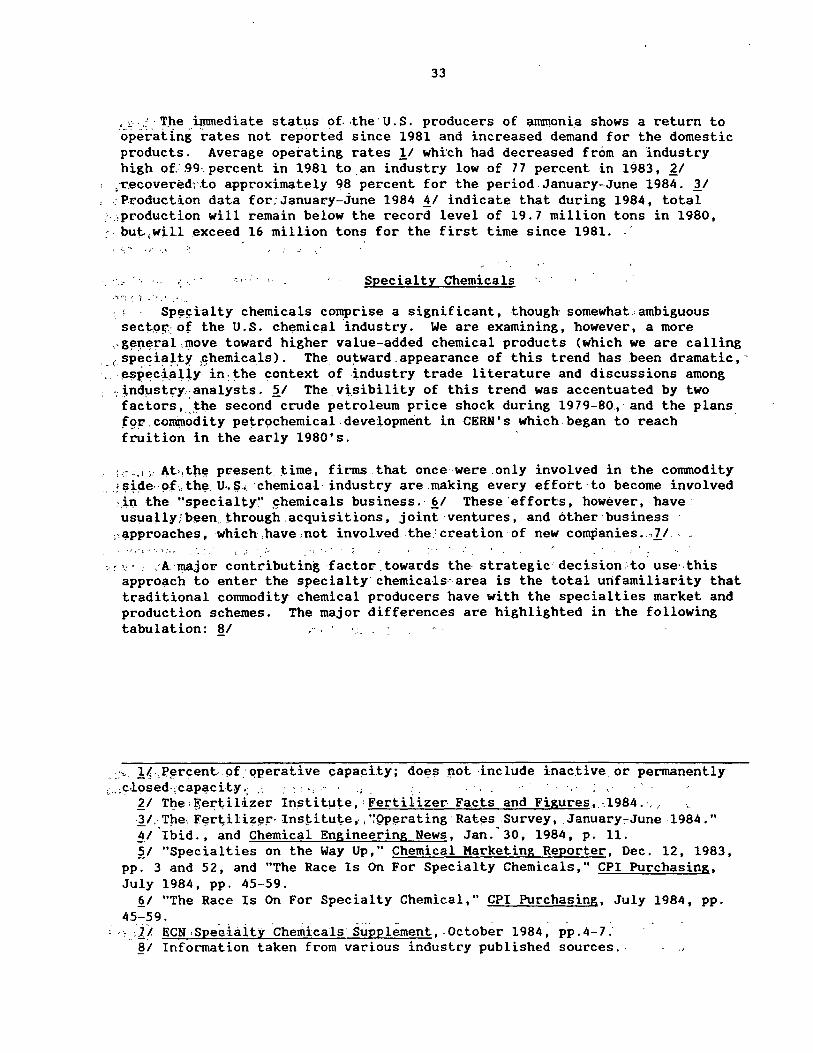
33
• :c· .. :' · T.he immediate status of. ·the· U.S. producers of anut\oni.a shows a return to 'operating rates not reported since 1981 and increased demand for the domestic products. Average operating rates 11 whi·ch had decreased from an industry high of.· .99·. percent in 1981 to_ an industry low of 77 percent in 1983, ~I
;r.ecovered:-.to approximately 98 percent for the period. January..:..June 1984. ~/ -: P-roduction data for: January-june 1984 ii indicate that during 1984, total
:·;production will remain below the record level of 19. 7 million tons in 1980, :·. b~t .. will exceed 16 mill.ion tons for the first time since 198L
'.. ,, \
.·_:: Specialty Chemicals
...... ;: ·1 -··.· .·: .•
: r Spe~ialty chemicals comprise a significant, though somewhaL ambiguous sect.a~: of the U.S. chemicl:ll ·industry. We are examining, however, a more
,.g~n~ral,move toward higher value-added chemical products (which we are calling 1 specialty .~hemicals). The ou~ward .appearance of this trend has .been dramatic, -
: ·:~spec-~~-liy. in: ~he. context of -industry trade literature and discussions among ~- ~ndµst~y.--analysts. ~I The. visibility of this trend was accentuated by two factors; ·the second crude petroleum price shock during 1979-80, and the plans f 9p. conunQdity petrc;>chemical . deve·topment in CERN• s which began to reach · fruition in the early 1980's.
'.->.i ,_ At .. tp~ pr:-esent. time, firms that once were .only involved in the conunodity : s~~e· of., the. u .. ~· ·chemical industry are making every effort· to become involved j,.n the "specialty~· .c.hemicals business.· §_I These ·efforts, however, -have usuaUy;b~enthrough acquisitions, joint·ventures, and 6ther 1 business
,: ~pproach~s, .which ,have ,not involved . the: creation· of new companies~ ... z1. · .,•,'{··· ...... .
! , .• ·-- •
:- , '-: · .. ·A 'lt13jou contributing factou. towards the- strategic· decision -to use-. this approach to enter the specialty chemicals.-area is the total unfamiliarity that traditional conunodity chemical producers have with the specialties market and production schemes. The major differences are highlighted in the following tabulation: §_I
. :> !~ .P~rcent. 9f_·qperative capa~ity; do~s not include inac.tiv~ or permanently ;: .. :c-losed-,cap~city.; .. ·: · ., · · .. . -. .
~I Tl:ie' ~ertil!i..zer, Institµt,.e, 'Fertilizer Facts and Figures, -.1984.", -11. The-. f~rt,iliz~~- lns!;.itute,-, ·:9p~rating Rates .Survey, January7'June 1984." ii ·Ibid., and Chemical Engineering News, Jan.'30, 1984, p. 11. ~I "Specialties on the Way Up," Chemical Marketing Reporter, Dec. 12, 1983,
pp. 3 and 52, and "The Race Is On For Specialty Chemicals," CPI Purchasing, July 1984, pp. 45-59.
§_I "The Race Is On For Specialty Chemical," CPI Purchasing, July 1984, pp. 45-59. ·, )./ ECN·Spea-iaity.chemicalssupplement, October 1984; pp.4-7.'
Bl Information taken from various industry published sources ..
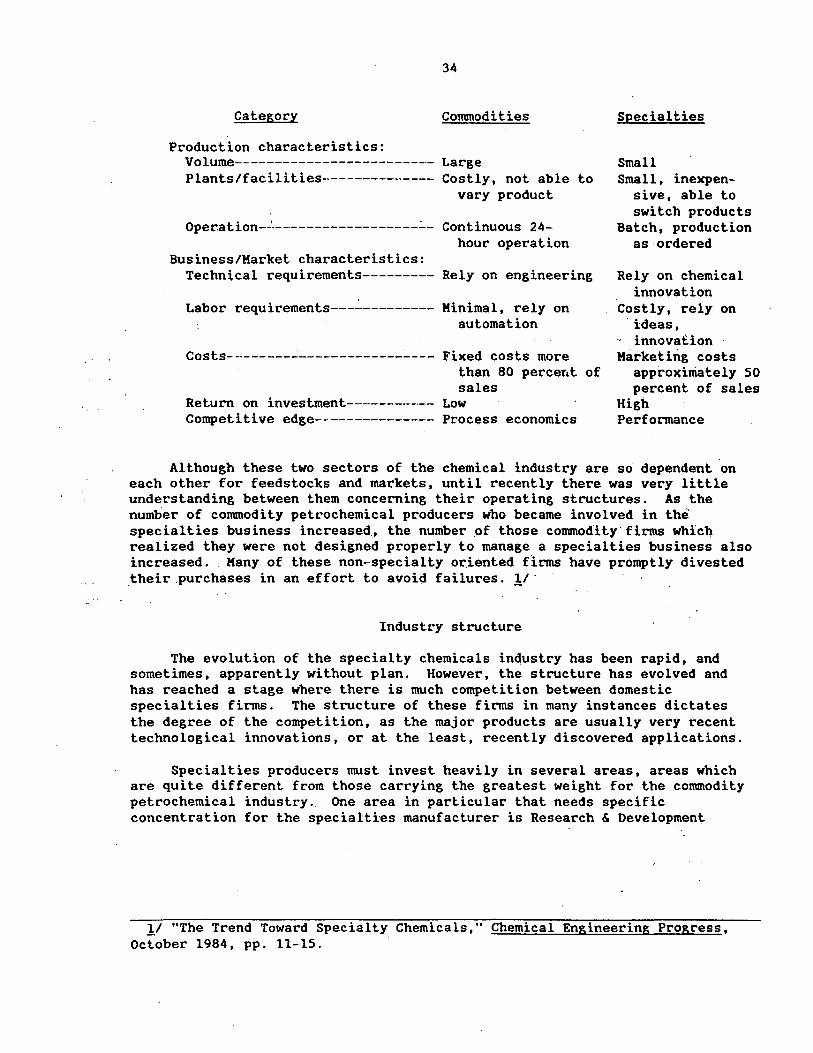
34
Category Commodities
Production characteristics: Volume------------------------·- Large Plants/facilities-------------- Costly, not able to
vary product
Oper.ation--'·------------------.:..- Continuous 24-hour operation
Business/Market characteristics: Technical requirements--------- Rely on engineering
Labor requirements---~--------- Minimal, rely on automation
Costs--------------------------- Fixed costs more than 80 percer1t of sales
Return on investment----------- Low Competitive edge--------------- Process economics
Specialties
Small Small, inexpen
sive, able to switch products
Batch, production as ordered
Rely on chemical innovation
Costly, rely on ·ideas,
- innovation Marketing costs
approximately 50 percent of sales
High Performance
Although these two sectors of the chemical industry are so dependent on each other for feedstocks and markets, until recently there was very little understanding between them concerning their operating structures. As the number of commodity petrochemical producers who became involved in the specialties business increased., the number of those commodity· firms ·which realized they were not designed properly to manage a specialties business also increased .. Many of these non-specialty oriented firms have promptly divested .their;purchases in an effort to avoid failures. !I·
Industry structure
The evolution of the specialty chemicals inqustry has been rapid, and sometimes, apparently without plan. However, the structure has evolved and has reached a stage where there is much competition between domestic specialties firms. The structure of these firms in many instances dictates the degree of the competition, as the major products are usually very recent technological innovations, or at the least, recently discovered applications.
Specialties producers must invest heavily in several areas, areas which are quite different from those carrying the greatest weight for the commodity petrochemical industry. One area in particular that needs specific concentration for the specialties manufacturer is Research & Development
ll "The Trend Toward Specialty Chemicals," Chemical Engineering Progress, October 1984, pp. 11-15.
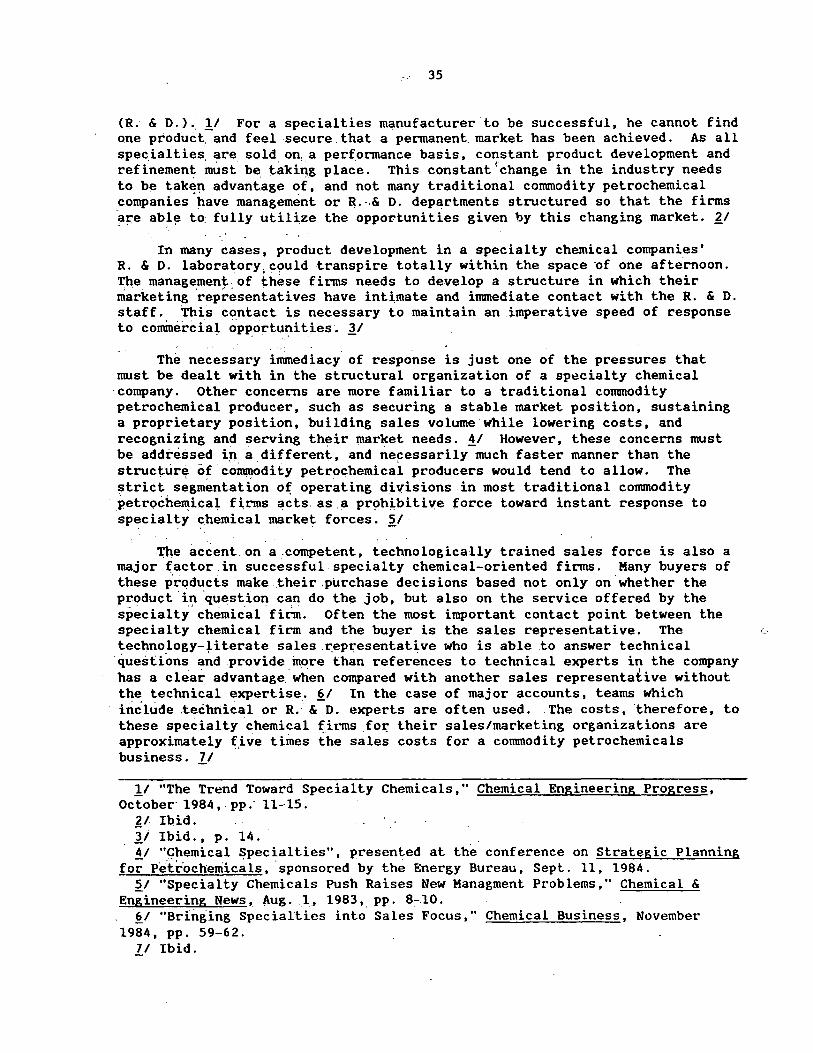
35
(R. & D.) .. .!I For a specialties manufacturer ·to be successful, he cannot find one product, and feel secure that a permanent. market has been achieved. As all speciai ties. are sold on, a p.erf.ormance basis, constant product development and refinement miast be taking place. This constantfchange in the industry needs to be tak~~ advantage of, and not many traditional commodity petrochemical companies have management or ~.-.& D. departments structured so that the firms at:e abl~ to~ fully utilize the opportunities given by this changing market. ~/
In many cases, product development in a specialty chemical companies' R. & O. laboratory, could transpire totally within the space of one afternoon. The management.of these firms needs to develop a structure in which their marketing 'rep~esentatives have intimate and immediate contact with the R. & D. staff. This contact is. necessary to maintain an imperative speed of response to commercial opportunities. 3/
• ! .• • _. -
The necessary immediacy of response is just one of the pressures that must be dealt with in the structural organization of a sp~cialty chemical company. Other concerns are more familiar to a traditional cornmodity petrochemical producer, such as securing a stable market position, sustaining a proprietary position, building sales volume while lowering costs, and recognizing and serving their market needs. !I However, these concerns must be addressed i~ a.different, and ne~essarily much faster manner than the structure of COlll!llOdity petrochemical producers would tend to allow. The strict segmentation o~ operating divisions in most traditional commodity petroche~ical firms ~cts. as.a pr?h~bitive force toward instant response to specialty ~hemical market forces. ~/
'1'.he accent.on a.competent, technologically trained sales force is also a major factor.in successful specialty chemical-oriented firms. Many buyers of these products m;:ake their.purchase decisions based not only on.whether the pcoduct.in ·qu~stion can do th~ job, but also on the service offered by the specialty' chemical.firm. Often the most important contact point between the specialty chemical firm and the buyer is the sales representative. The (· technology-literate sales .~epresentative who is able .to answer technical
'questions a.:id provide more than references to technical experts in the company . • . . , . . I
has a clea~ advantage. when compared with another sales representative without the technical expertise. §_/ In the case of major accounts, teams which include ,technical or R. & D. experts are often used. The costs, therefore, to these specialty chemical firms f ot; their sales/marketing organizations are approximately (ive times the sales costs for a conunodity petrochemicals business. ll
1J "The Trend Toward Specialty Chemicals," Chemical Engineering Progress, October· 1984, pp.· 11-15.
'!,_/. I~id. 11 Ibid., p. 14. !I "~hemical !?pecialties", presented at the conference on Strategic Planning
for Pe.trochetriicals, ·sponsored by the Energy Bureau, Sept. 11, 1984. ~I "Specialty Chemicals Push Raises New Managment Problems," Chemical &
Engineering News, 4\ug. 1, 1983,. pp. 8-10. §_I "Bringing Specialties into Sales Focus," Chemical Business, November
1984, pp. 59-62. ll Ibid.
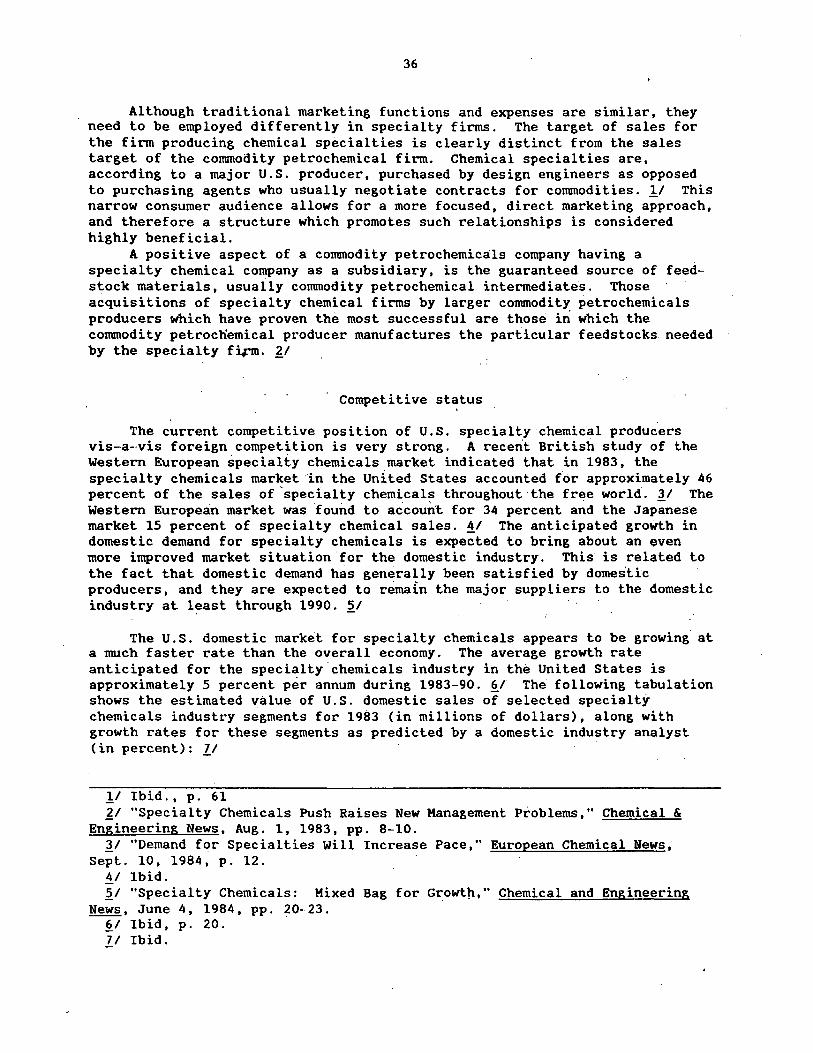
36
Although traditional marketing functions and expenses are similar, they need to be employed differently in specialty firms. The target of sales for the firm producing chemical specialties is clearly distinct from the sales target of the commodity petrochemical firm. Chemical specialties are, according to a major U.S. producer, purchased by design engineers as opposed to purchasing agents who usually negotiate contracts for commodities. 11 This narrow consumer audience allows for a more focused, direct marketing approach, and therefore a structure which promotes such relationships is considered highly beneficial.
A positive aspect of a commodity petrochemicals company having a specialty chemical company as a subsidiary, is the guaranteed source of feedstock materials, usually commodity petrochemical intermediates. Those acquisitions of specialty chemical firms by larger commodity petrochemicals producers which have proven the most successful are those in which the commodity petrocnemical producer manufactures the particular feedstocks needed by the specialty f i+ro. ~I
' Competitive status
The current competitive position of U.S. specialty chemical producers vis-a--vis foreign competition is very strong. A recent British study of the Western European specialty chemicals market indicated that in 1983, the specialty chemicals market iri the United States accounted for approximately 46 percent of the sales of-specialty chemicals throughout the free world. 'JI The Western European market was found to accouilt for 34 percent and the Japanese market 15 percent of specialty chemical sales. !I The anticipated growth in domestic demand for specialty chemicals is expected to bring about an even more improved market situation for the domestic industry. This is related to the fact that domestic demand has generally been satisfied by domeslic producers, and they are expected to remain the major suppliers to the domestic industry at l~ast through 1990. 21
The U.S. domestic market for specialty chemicals appears to be growing at a much faster rate than the overall economy. The average growth rate anticipated for the specialty.chemicals industry in the United States is approximately 5 percent per annum during 1983-90. §_I The following tabulation shows the estimated value of U.S. domestic sales of selected specialty chemicals industry segments for 1983 (in millions of dollars), along with growth rates for these segments as predicted by a domestic industry analyst (in percent): ll
ll Ibid. , p. 61 lJ "Specialty Chemicals Push Raises New Management Problems," Chemical &
Engineering News, Aug. 1, 1983, pp. 8-10. 'JI "Demand for Specialties Will Increase Pace," European Chemical News,
Sept. 10, 1984, p. 12. 41 Ibid. ~I "Specialty Chemicals: Mixed Bag for Growl~," Chemical and Engineering
News, June 4, 1984, pp. 20-23. §_I Ibid, p. 20. 71 Ibid.
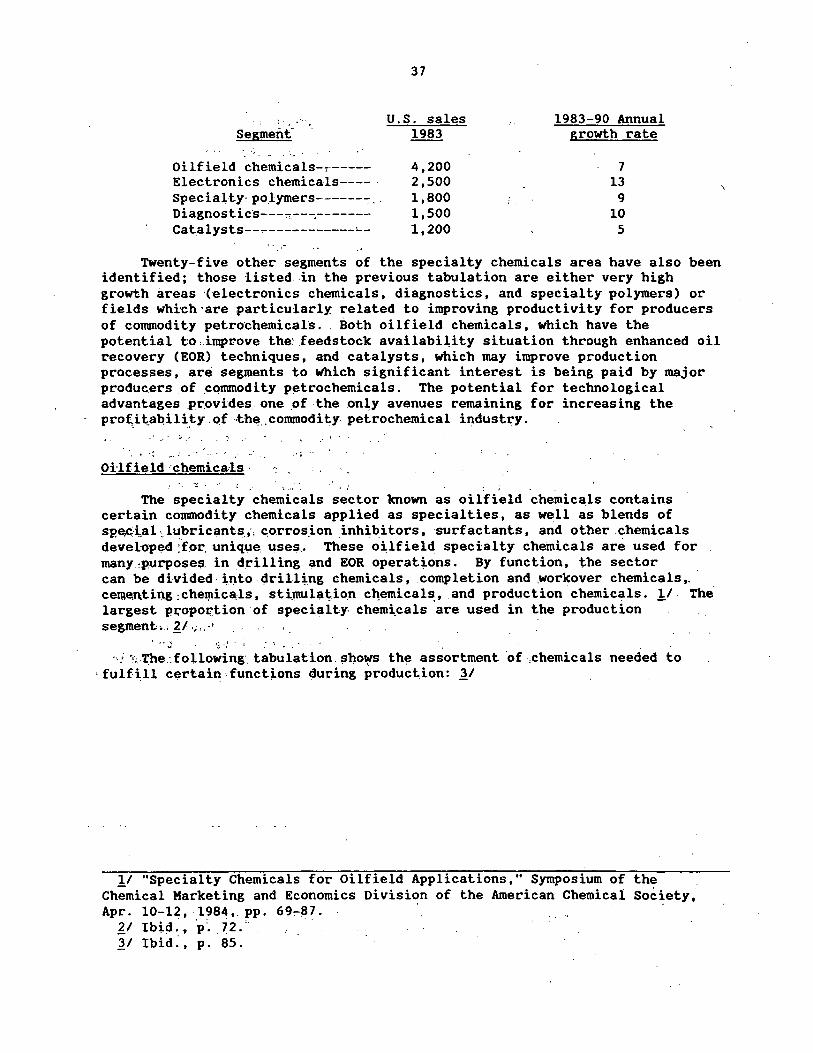
.. Segment-
-. '~ . .. . ~-.. . Oilfield chemicals-,.-----Electronics chemicals---- · Specialty· po.lymers-------:- .. Diagnostic·s---c:---.------Cat.alysts-.,..,...-----------:....-
37
U.S. sales 1983
4,200 2,500 1,800 1,500 1,200
1983-90 Annual growth rate
7 13
9 10
5
Twenty-five other segments of the specialty chemicals area have also been identified; those listed.in the previous tabulation are either very high growth areas {electronics chemicals, diagnostics, and specialty polymers) or fields whi-ch ·are .particularly: related to improving productivity for producers of commodity petro·chemicah .. Both oilfield chemicals, which have the potential to :.improve the· feedstock availabiiity situation through enhanced oil recovery (EOR) techniques, and catalysts, which may improve production processes, are segments to which significant interest is being paid by major producers of commodity petrochemicals. The potential for technological advantages .Pr.ovides. one .of the on~y avenues remaining for increasing the prof,i t:.a~i 1 i~y. ~f -th~ .. commodity. petrochemical industry.
,· -·. :...; ; .·
'·: .... : . OHfield·chemicals·
. : ' . The specialty chemicals sector known as oilfield chemica.ls contains
certain commodity chemicals applied as specialties, as we.11 as blends of sp,~'i,,,al ., lubricants_,, ~orros.ion inhibitors, surfactants, and other .chemicals developed :'for. uniqµe uses.. These oi,lfield specialty chemicals are used for many :.purposes. in drilling and EOR operations. By function, the sector can be divided. ~t)to. "rilltng chemicals, completion and .workover chemicals,. · cem~ntit)g :chel!lica:ls, stiJllUlat;,io.n c}!emical~, and production chemicals. !/ The· largest pI;"opoi:tion of specialty. chemi_cals are used in the production segment •. ,~/.,;,,·'
... j i:;·,' . ; • ;
·-.: '::.'l'.he.:following· tabulation. shows the assortment ·of ,chemicals needed to 0 fulfill certain:funct~ons duri~g produc~ion: ll
!I "Specialty Chemicals for Oilfield Applications," Symposium of the Chemical Marketing and Economics Division of the American Chemical Society, Apr. 10-12, ·_1984, pp. 69,.-87.
!I Ibid.~ p: .12.-3/ Ibid~, p. 85.
'
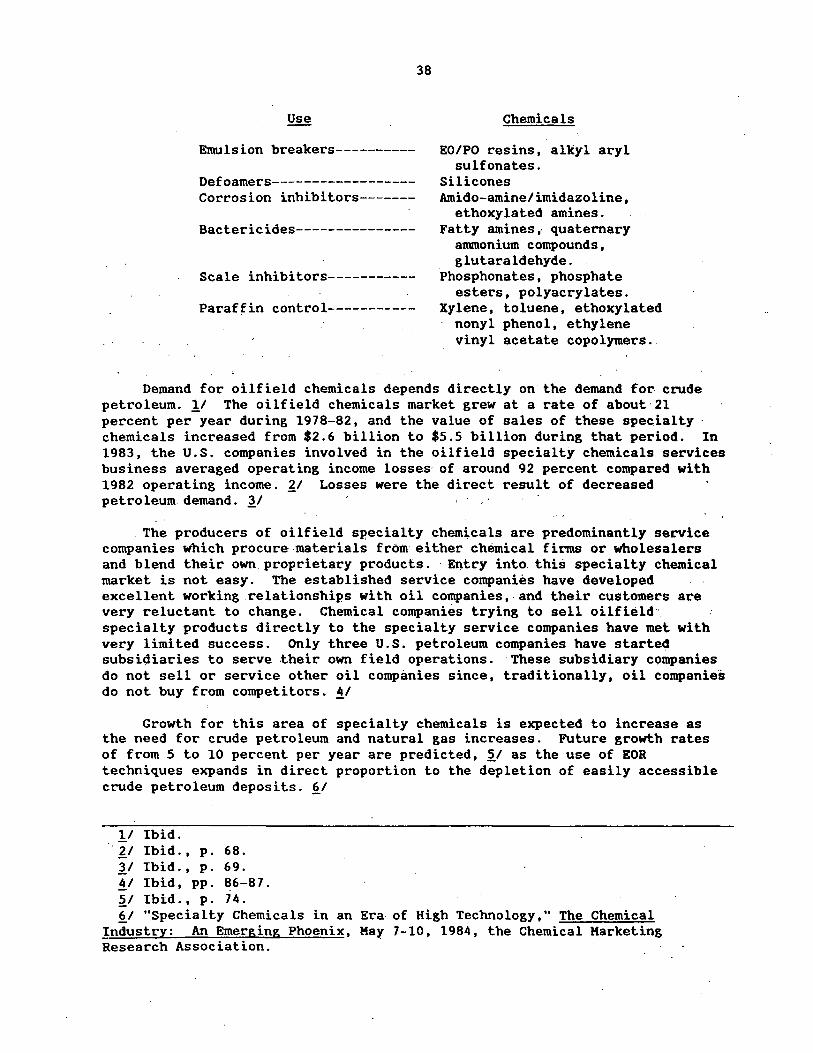
Emulsion breakers----------
Defoamers-----------------Corrosion inhibitors-------
Bactericides---------------
Scale inhibitors-----------
Paraffin control-----------
38
Chemicals
EO/PO resins, alkyl aryl sulfonates.
Silicones Amido-amine/imidazoline,
ethoxylated amines. Fatty amines,. quaternary
anunonium compounds, glutaraldehyde.
Phosphonates, phosphate esters, polyacrylates.
Xylene, toluene, ethoxylated nonyl phenol, ethylene vinyl acetate copolymers.
Demand for oilfield chemicals depends directly on the demand for crude petroleum. !I The oilfield chemicals market grew at a rate of about·21 percent per year during 1978-82, and the value of sales of these specialty· chemicals increased from $2.6 billion to $5.5 billion during that period. In 1983, the U.S. companies involved in the oilfield specialty chemicals services business averaged operating income losses· of around 92 percent compared with 1982 operating income. ~/ Losses were the direct result of decreased petroleum demand. 11
. The producers of oilfield specialty chem~cals are predominantly service companies which procure-materials from either chemical firms or wholesalers and blend their own proprietary products. ·Entry into this specialty chemical market is not easy. The established service companies have developed excellent working relationships with oil companies, and their customers are very reluctant to change. Chemical companies trying to sell oilfield· specialty products directly to the specialty service companies have met with very limited success. Only three U.S. petroleum companies have starte~ subsidiaries to serve .their own field operations. ·These subsidiary companies do not sell or service other oil companies since, traditionally, oil companies do not buy from competitors. ii
Growth for this area of specialty chemicals is expected to increase as the need for crude petroleum and natural gas increases. Future growth rates of from 5 to 10 percent per year are predicted, ~I as the use of EOR techniques expands in direct proportion to the depletion of easily accessible crude petroleum deposits. ii
1/ Ibid. ·. 21 Ibid., p. 68.
11 Ibid. I p. 69. ii Ibid, pp. 86-87. ~I Ibid. I p. 74. 6/ "Specialty Chemicals in an Era- of High Technology," The Chemical
Industry: An Emerging Phoenix, May 7-10, 1984, the Chemical Marketing Research Association.
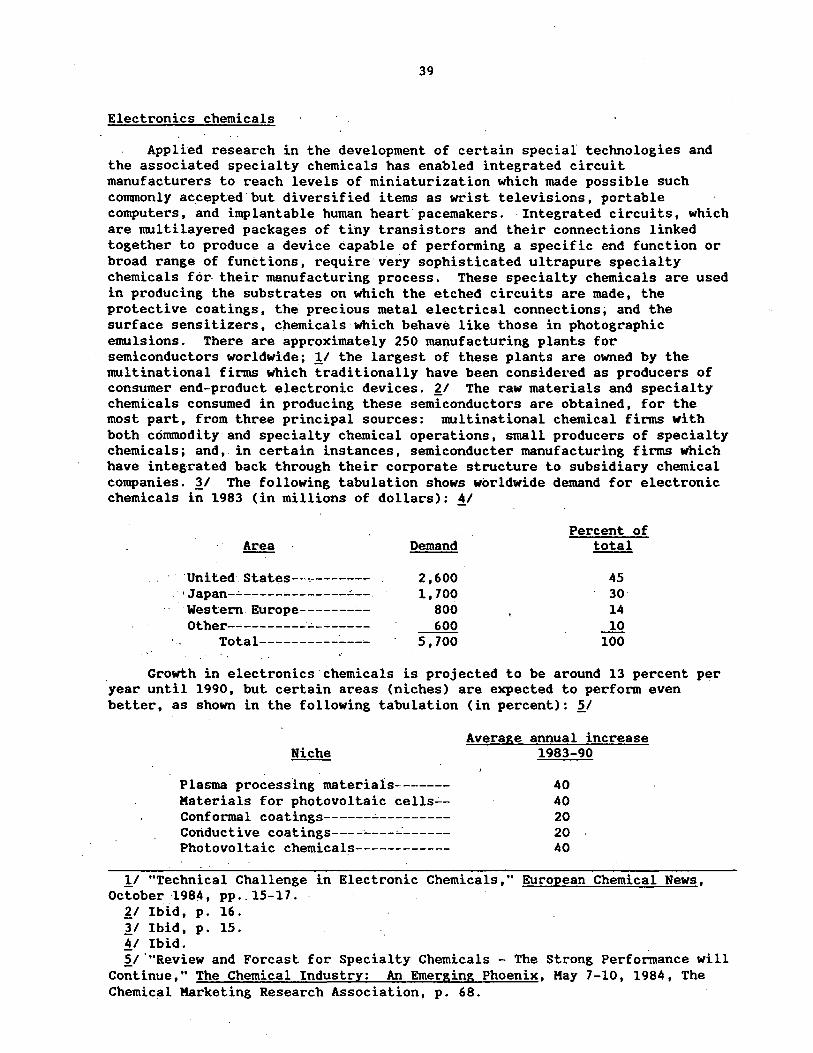
39
Electronics chemicals
Applied research in the development of certain special technologies and the associated specialty chemicals has enabled integrated circuit manufacturers to reach levels of miniaturization which made possible such conunonly ac_cepted ·but diversified items as wrist televisions, portable computers, and implantable human heart pacemakers. Integrated circuits, which are multilayered packages of tiny transistors and their connections linked together to produce a device capable of performing a specific end function or broad range of functions, require very sophisticated ultrapure specialty chemicals for- their manufacturing process. These specialty chemicals are used in producing the substrates on which the etched circuits are made, the protective coatings, the precious metal electrical connections; and the surface sensitizers, chemicals which behave like those in photographic emulsions. There are approximately 250 ma~ufacturing plants for semiconductors worldwide; 11 the largest of these plants are owned by the multinational firms which traditionally have been considered as producers of consumer end-product electronic devices. £1 The raw materials and specialty chemicals consumed in producing these semiconductors are obtained, for the most part, from three principal sources: multinational chemical firms with both conunodity and specialty chemical operations, small producers of specialty chemicals; and, in certain instances, semiconducter manufacturing firms which have integrated back through their corporate structure to subsidiary chemical companies. 11 The following tabulation shows worldwide demand for electronic chemicals in 1983 (in millions of dollars): !I
Demand Percent of
total
United States--~----~--.. ' Japan--=---------------.::.--.
WesternEurope---------Other--'--·-------;,;.. ______ _
Total--------------
2,600 1,700
800 ___!QQ 5,700
45 30 14 10
100
Growth in electronics chemicals is projected to be around 13 percent per year until 1990, but certain areas (niches) are expected to perform even better, as shown in the following tabulation (in percent): 21
Average annual increase Niche 1983-90
Plasma processing materiais------- 40 Materials for photovoltaic cells~- 40 Conformal coatings------;.;.._________ 20 Conductive coatings--------'-------- 20 Photovoltaic chemicals------------ 40
11 "Technical Challenge in Electronic Chemicals," European Chemical News, October_l984, pp .. 15-17.
£1 Ibid, p. 16. 11 Ibid, p. 15. !I Ibid. ~/."Review and Forcast for Specialty Chemicals - The Strong Performance will
Continue," The Chemical Industry: An Emerging Phoenix, Kay 7-10, 1984, The Chemical Marketing Research Association, p. 68.
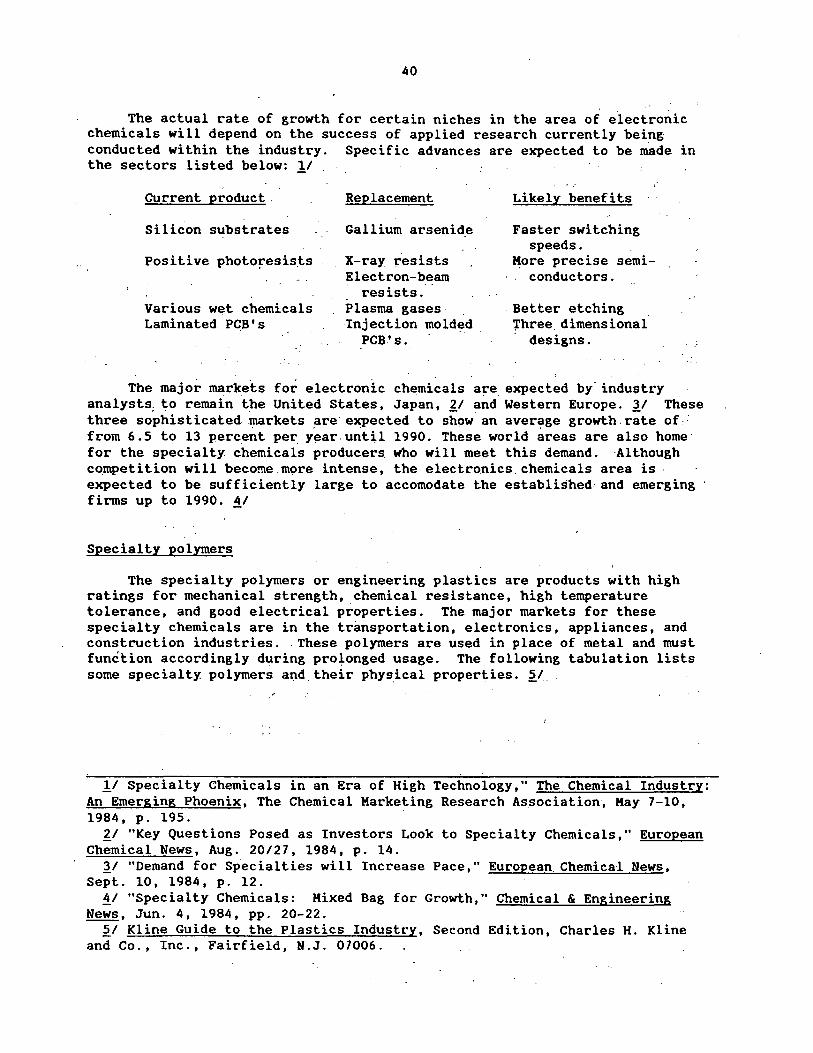
40
The actual rate of growth for certain niches in the area of electronic chemicals will depend on the success of applied research currently being conducted within the industry. Specific advances are expected to be made in the sectors listed below: 11
current product.
Silicon substrates
Positive photoF'esists
Various w~t chemicals Laminated PCB's
Replacement
Gallium arsenid_e
X-ray resists Electron-beam
resists. Plasma gases . Injection molded
PCB-'s.
Likely benefits
Faster switching speeds.
~ore precise semiconductors.
Better etching Three dimensional : designs.
The major markets for electronic chemicals are. expected by· industry analysts; to remain the United States, Japan, ~/ and Western Europe. 11 These three sophisticated markets .are expected to sh9w an averl!lge growth. rate of.· from 6. 5 to 13 perc_ent per. y~ar. until 1990. These world areas are also home· for the specialty chemicals producers who will meet this demand. ·Although competition will become more intense, the electronics. chemicals area is. · expected to be sufficiently large to accomodate the established, and emerging · firms up to 1990. !I
Specialty polymers
The specialty polymers or engineering plastics are products with high ratings for mechanical strength, chemical resistance, high temperature tolerance, and good electrical properties. The major markets for these specialty chemicals are in the transportation, electronics, appliances, and construction industries. These polymers are used in place of metal and must function accordingly during prolonged usage. The following tabulation lists some specialty: polymers at)d. their phys_ical properties. ~/.
11 Specialty Chemicals in an Era of High Technology," The Chemical Industry: An Emerging Phoenix, The Chemical Marketing Research Association, Kay 7-10, 1984, p. 195.
~I "Key Questions Posed as Investors Look to Specialty Chemicals," European Chemical News, Aug. 20/27, 1984, p. 14.
11 "Demand for Specialties will Increase Pace," European. Chemical News, Sept. 10, 1984, p. 12.
11 "Specialty Chemicals: Mixed Bag for Growth," Chemical & Engineering News, Jun. 4, 1984, pp. 20-22.
~I Kline Guide to the Plastics Industry, Second Edition, Charles H. Kline and Co., Inc., Fairfield, N.J. 07006.
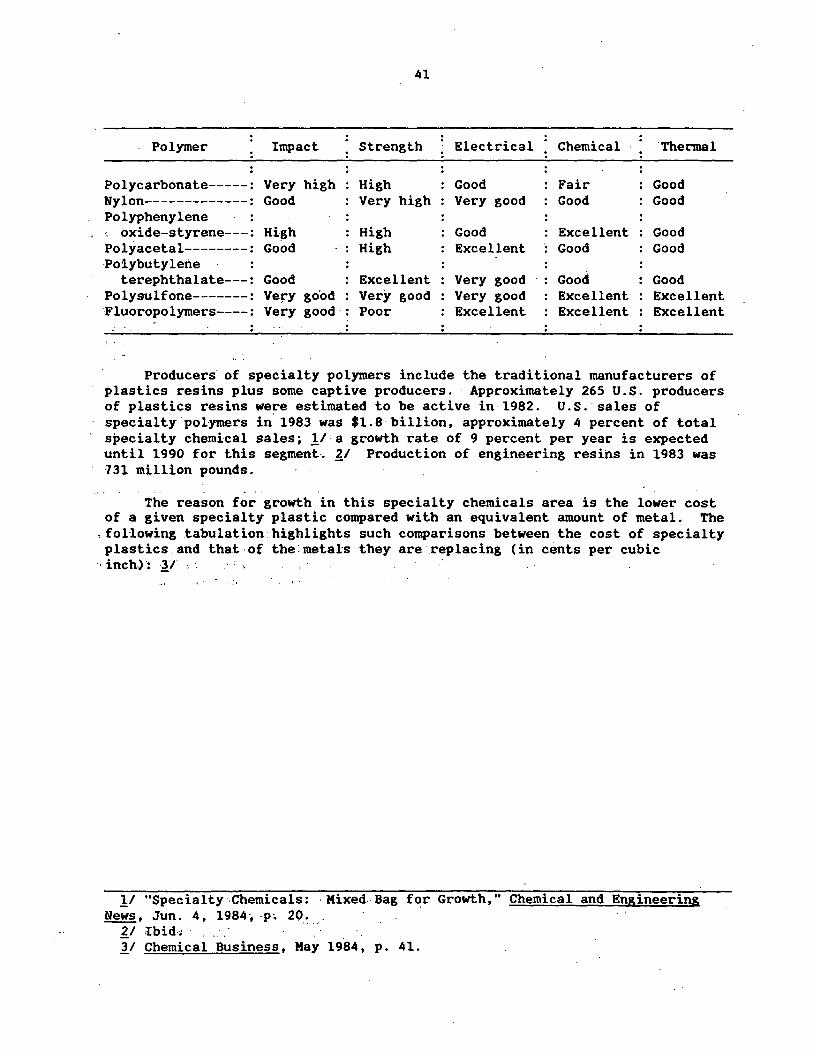
41
Polymer Impact Strength Electrical Chemical "Thermal
Polycarbonate-----: Very high High Good Fair Good Nylon-------------: Good Very high Very good Good Good Polyphenylene ·- oxide-styrene---: High High Good Excellent Good Polyacetal--------: Good : High Excellent Good Good Poiybutylene
terephthalate---: Good Excellent Very good ... Good Good Polysulfone-------: very go"od Very good Very good Excellent Excellent :Fluoropo lymers----: Very good· Poor Excellent Excellent Excellent
..
Producers of specialty polymers include the traditional manufacturers of plastics resins plus some captive producers. Approximately 265 U.S. producers of plastics resins were estimated to be active in 1982. U.S. sales of specialty polymers in' 1983 was $1.8· billion, approximately 4 percent of total specialty chemical sales; 1/ a growth rate of 9 percent per year is expected until 1990 for this segment·. ~_/ Production of engineering resins in 1983 was ·731 million pounds.
The reason for growth in this specialty chemicals area is the lower cost of a given specialty plastic compared with an equivalent amount of metal. The
, following tabulation· highlights such comparisons between the cost of specialty plastics and that·Of the:metals they are .replacing (in cents per cubic
·· inch.): 11 . . · · -
.!I "Specialty.chemicals: ·Mixed.Bag for Growth," Chemical and Engineering News, Jun. 4, 1984·, ·P• 20_~ _.
£1 Ibid·: 11 Chemical Business, May 1984, p. 41.
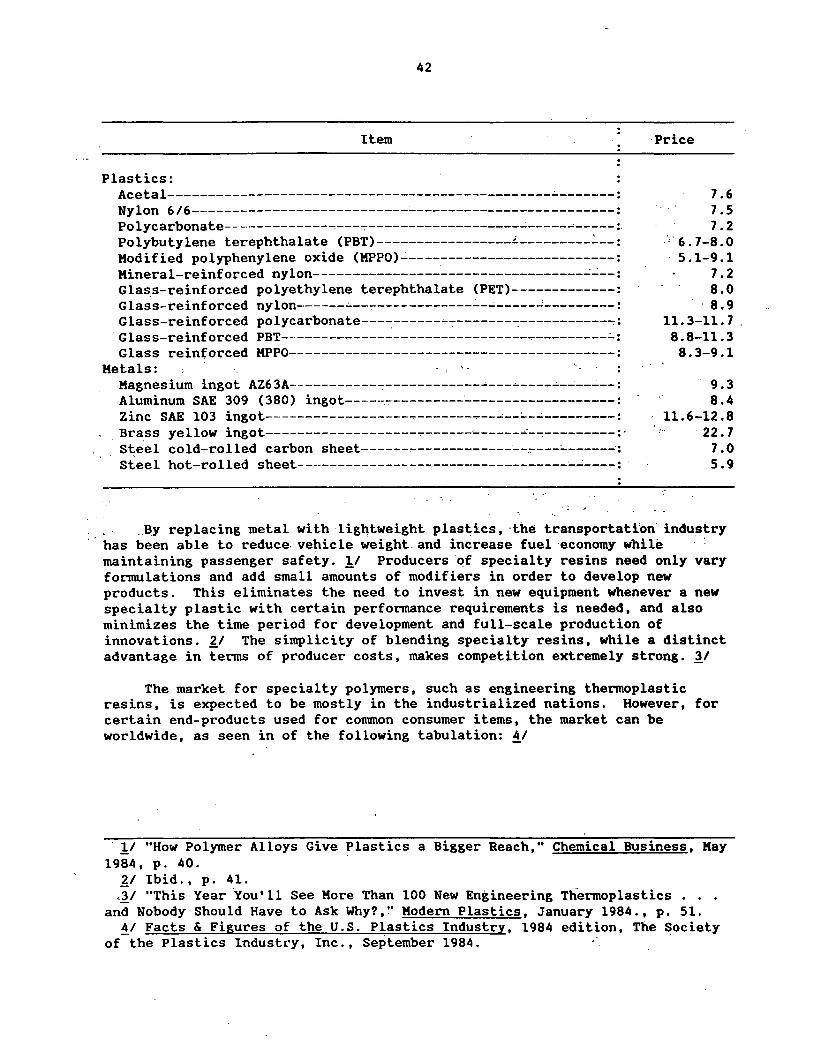
42
Item
Plastics: Acetal------------------------------------------------~-------:
Nylon 6/6------------------------------------------------------: Polycarbonate-------------~---~-------------------------------:.
Polybutylene terephthalate (PBT)-----------------L---------~--: Modified polyphenylene oxide (MPPO)---------------------------: Mineral--reinforced nylon----------------------------------~~--: Glass-reinforced polyethylene terephthalate (PET)-------------: Glass-reinforced nylon------~--,_------------~-------~---------~ Glass-reinforced polycarbonate---~------~~--~----~-----------~: Glass-reinforced PBT------------------------------------------~: Glass reinforced MPPO-----------------------------------------:
Metals: '· Magnesium ingot AZ63A-----------~------------•--------•-------: Aluminum SAE 309 ( 380) ingot-------:-----------·-------------------: Zinc SAE 103 ingot------------------~----------~--;_-~---------: Brass yellow ingot-------------------~------~-----~-~---------:' Steel cold-rolled carbon sheet------,-------------·--·"'" ___ :_ ______ : Steel hot-rolled sheet----------------------------------~~---~: ·
·Price
7.6 7.5 7.2
.,. 6. 7-8 .o · ·5 .1-9 .1
7.2 8.0
. 8. 9 11.3-11. 7 . 8.8-11.3 8.3-9.1
9.3 8.4
. 11.6-12.8 :• . 22. 7
7 .o 5.9
.. BY replacing metal with lightweight plastics, ·the transportation· industry has been able to reduce. vehicle weight.and increase fuel ·economy while . maintaining passenger safety. !I Producers of specialty resins need only vary formulations and add small amounts of modifiers in order to develop new products. This eliminates the need to invest in new equipment whenever a new specialty plastic with certain performance requirements is needed, and also minimizes the time period for development and full-scale production of innovations. £1 The simplicity of blending specialty resins, while a distinct advantage in terms of producer costs, makes competition extremely strong. ll
The market for specialty polymers, such as engineering thermoplastic resins, is expected to be mostly in the industrialized nations. However, for certain end-products used for conunon consumer items, the market can be worldwide, as seen in of the following tabulation: !I
!I "How Polymer Alloys Give Plastics a Bigger Reach," Chemical Business, Hay 1984, p. 40.
£1 Ibid., p. 41. ,l/ "This Year ·You'll See More Than 100 New Engineering Thermoplastics
and Nobody Should Have to Ask Why?,~· Modern Plastics, January 1984., p. 51. !I Facts & Figures of the U.S. Plastics Industry, 1984 edition, The ~ociety
of the Plastics Industry, Inc., September 1984.
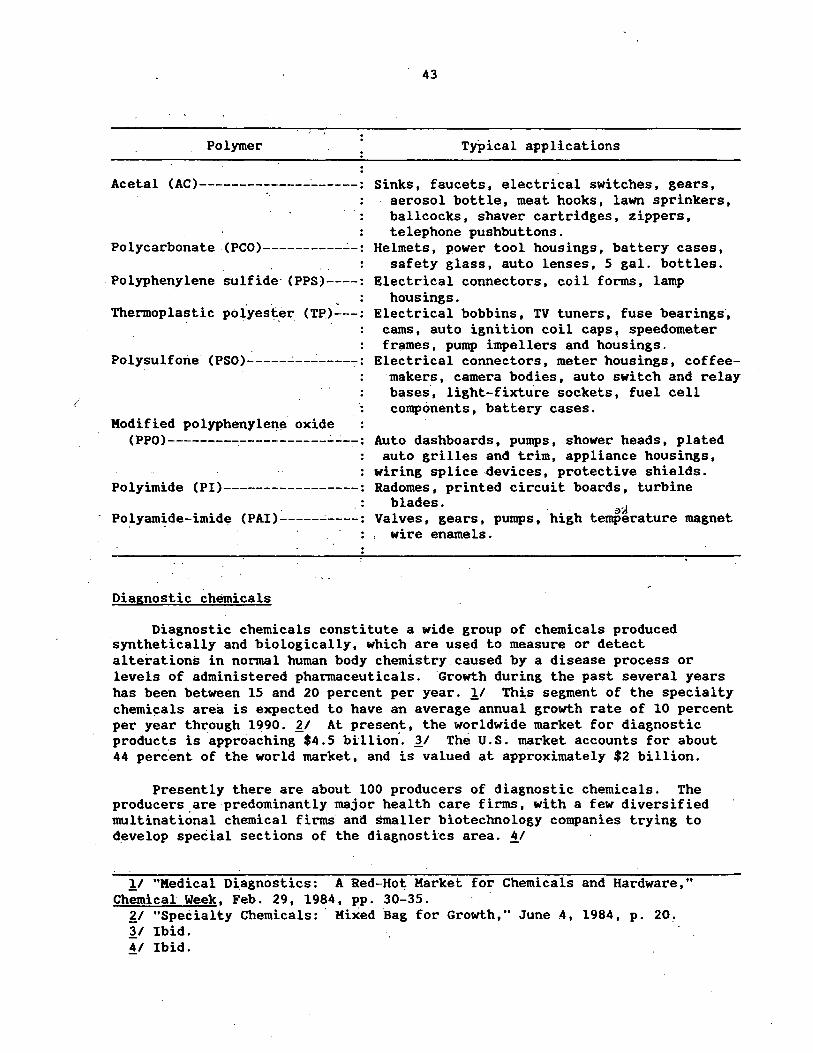
Polymer
Acetal (AC)--------------·------:
Polycarbonate (PCO)----------~-:
Polyphenylene sulfide· (PPS)----:
Thermoplastic polyes~.er (TPJ---:
Polysulfone· (PS0)-----~-------7:
Modified polyphenyle~e oxide (PPO)------~-~-----------~--~:
Polyimide (PI)-----------------:
43
Typical applications
Sinks, faucets, electrical switches, gears, aerosol bottle, meat hooks, lawn sprinkers, ballcocks, shaver cartridges, zippers, telephone pushbuttons.
Helmets, power tool housings, battery cases, safety glass, auto lenses, 5 gal. bottles.
Electrical connectors, coil forms, lamp housings.
Electrical bobbins, TV tuners, fuse bearings·, cams, auto ignition coil caps, speedometer frames, pump impellers and housings.
Electrical connectors, meter housings, coffeemakers, camera bodies, auto switch and relay bases, light-fixture sockets, fuel cell components, battery cases.
Auto dashboards, pumps, shower heads, plated auto grilles and trim, appliance housings,
wiring splice .devices, protective shields. Radomes, printed circuit boards, turbine
blades. '3JI - Po.lyam~de-imid~ (PAI)~----~----: Valves, gears, pumps, high temperature magnet
, wire enamels.
Diagnostic chemicals
Diagnostic chemicals constitute a wide group of chemicals produced synthetically and biologically, which are used to measure or detect alterations in normal human body chemistry caused by a disease process or levels of administered pharmaceuticals. Growth during the past several years has been between 15 and 20 percent per year. 11 This segment of the specialty chemi~als area is expected to have an average annual growth rate of 10 percent per year through 1~90. £1 At present, the worldwide market for diagnostic products is approaching $4.5 billion. ~/ The U.S. market accounts for about 44 perc'ent of the world market, and is valued at approximately $2 billion.
Presently there are about 100 producers of diagnostic chemicals. The producers are·predominantly major health care firms, with a few diversified multinational chemical firms and smaller biotechnology companies trying to d.evelop special sections of the diagnostics area. !I
11 "Medical Diagnostics: A Red-Ho~ Market for Chemicals and Hardware," Chemical Week, Feb. 29, 1984, pp. 30-35.
£1 "SpeCialty Chemicals: Mixed Bag for Growth," June 4, 1984, p. 20. ~I Ibid. !I Ibid.
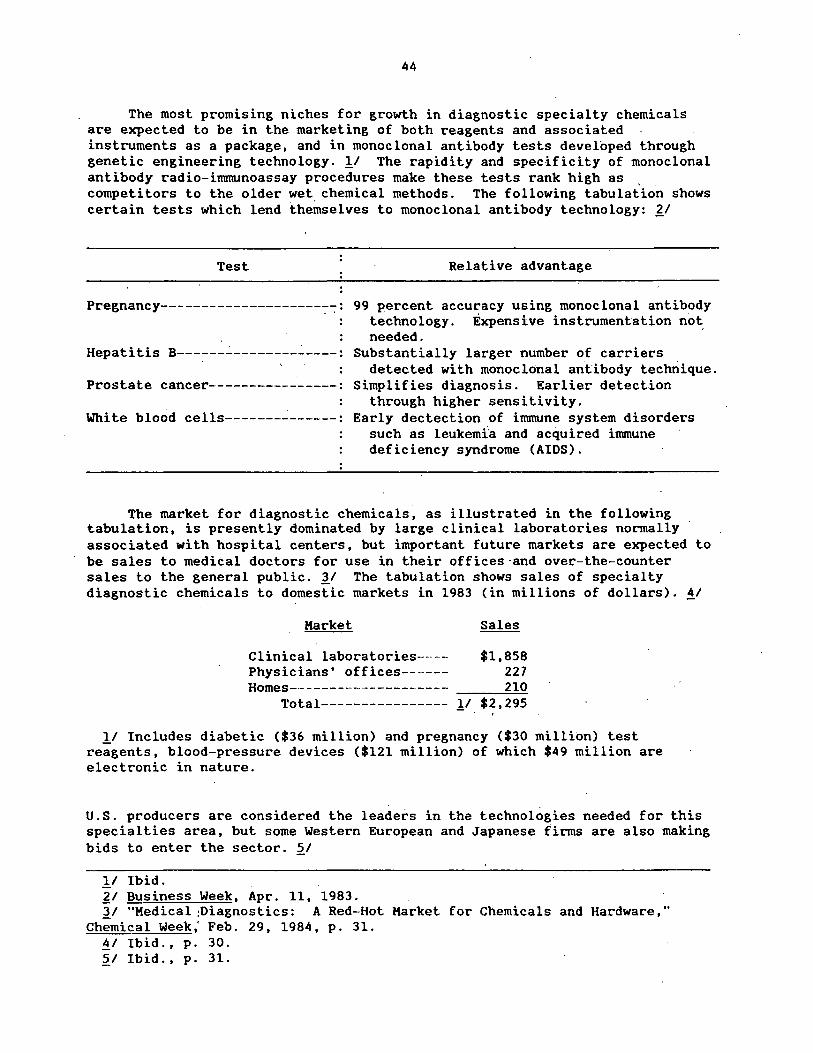
44
The most promising niches for growth in diagnostic specialty chemicals are expected to be in the marketing of both reagents and associated instruments as a package, and in monoclonal antibody tests developed through genetic engineering technology. 11 The rapidity and specificity of monoclonal antibody radio-inununoassay procedures make these tests rank high as . competitors to the older wet. chemical methods. The following tabulation shows certain tests which lend themselves to monoclonal antibody technology: £1
Test
Pregnancy--------------------~~:
Hepatitis B------~--------~----:
Prostate cancer----------------:
White blood cells--------------:
Relative advantage
99 percent accuracy using monoclonal antibody technology. Expensive instrumentation not needed.
Substantially larger number of carriers detected with monoclonal antibody technique.
Simplifies diagnosis. Earlier detection through higher sensitivity.
Early dectection of inunune system disorders such as leukemi'a and acquired inunune deficiency syndrome (AIDS).
The market for diagnostic chemicals, as illustrated in the following tabulation 0 is presently dominated by large clinical laboratories normally associated with hospital centers, but important future markets are expected to be sales to medical doctors for use in their offices-and over-the-counter sales to the general public. JI The tabulation shows sales of specialty diagnostic chemicals to domestic markets in 1983 (in millions of dollars). 4/
Market
Clinical laboratories---- $1,858 Physicians' offices------ 227 Homes-------------------..:..- ____ 2_1_0
Total---------------- !I $2,295
l/ Includes diabetic ($36 million) and pregnancy ($30 million) test reagents, blood-pressure devices ($121 million) of which $49 million are electronic in nature.
U.S. producers are considered the leaders in the technologies needed for this specialties area, but some Western European and Japanese firms are also making bids to enter the sector. ~/
.!I Ibid. 21 Business Week, Apr. 11, 1983. JI "Medical :Diagnostics: A Red-Hot Market for Chemicals and Hardware,"
Chemical Week; Feb. 29, 1984, p. 31. ~/ Ibid., p. 30. 51 Ibid., p. 31.
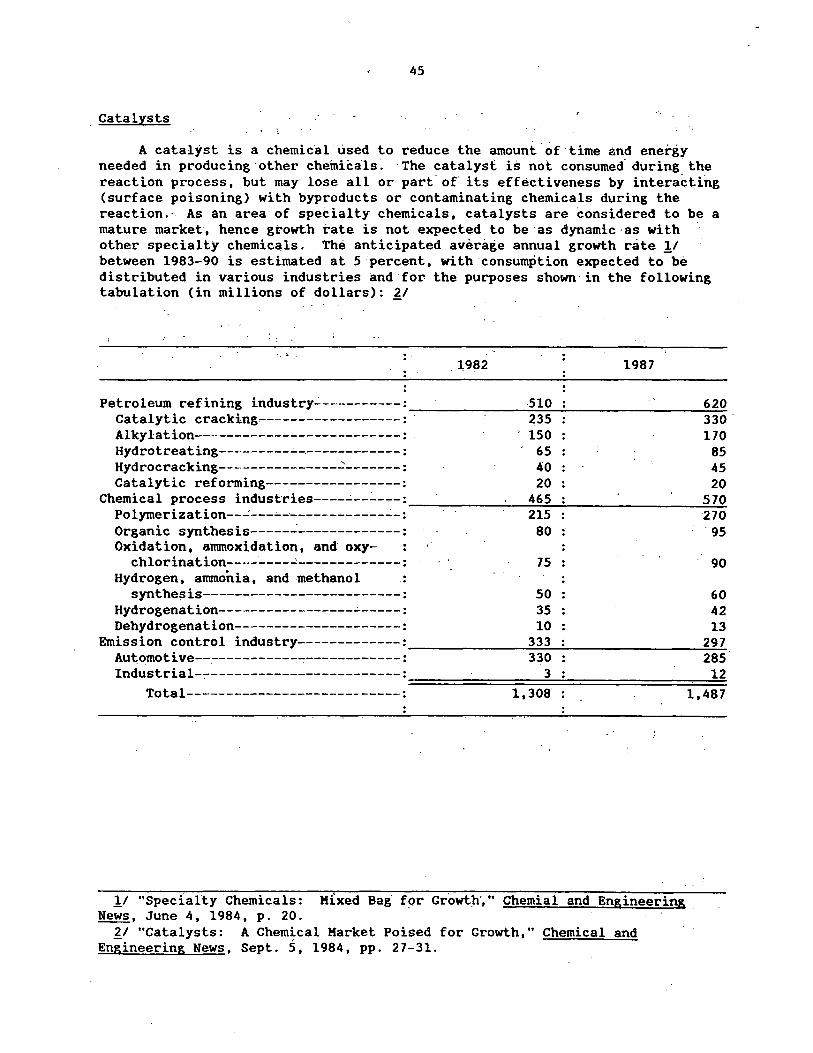
45
Catalysts
A catalyst is a chemical used to reduce the amount of'time 8nd energy needed in producing other chemiCals~ ·The catalyst is not consumed· during the reaction process, but may lose all or part.of· its effectiveness by interacting (surface poisoning) with byproducts or contaminating chemicals during the reaction.· As an area of specialty chemicals, catalysts are considered to be a mature market, hence growth rate is not expected to be as dynamic·as with other specialty chemic~ls. The anticipated average annual growth rate !/ between 1983-90 is estimated at 5 percent, with consumption expected to be distributed in various industries and·for the purposes shown in the following tabulation (in millions of dollars): ~/
... . 1982 1987
Petroleum refining industry-----------: 510 620 ~~~~~~~~~~~~~~~~~~~~
Catalytic cracking------------------:: Z35 330 · Alkylation--------------------------: 150 170 Hydrotreating---------.:..-------------: 65 85 Hydrocracking---------------~-------: 40 45 Catalytic reforming-----------------: 20 20
Chemical process industries----..:.------: 465 570 ~~~~~~~......;..~--'-~~~~~~~~-=-.:...=;.
Polymerization--...:---.:...-----------"'--...:-: 215 270 Organic synthesis-----~-------------: 80 95 Oxidation. ammoxidation. and oxy-
chlorination----:_----'-------------: 75 90 Hydrogen, ammonia, and methanol
synthesis-------------------------: 50 60 Hydrogenation-----------------~-----: 35 42 Dehydrogenation---------------------: 10 13
Emission control industry-------------: 333 297 ~~~~~~~--=-..;;...;;..--=-~~~~~~~~--=~
Automotive--~---------~-------------: 330 285 Industrial--------------------------: 3 12 ================================ Total---------------------------: 1,308 1,487
!./ "Specialty Chemicals: K:lxed Bag f~r Growth'," Chemial and Engineering News, June 4, 1984, p. 20.
'lJ "Catalysts: A Chemical Market Poised for Growth," Chemical and Engineering News, Sept. 5, 1984, pp. 27-31.
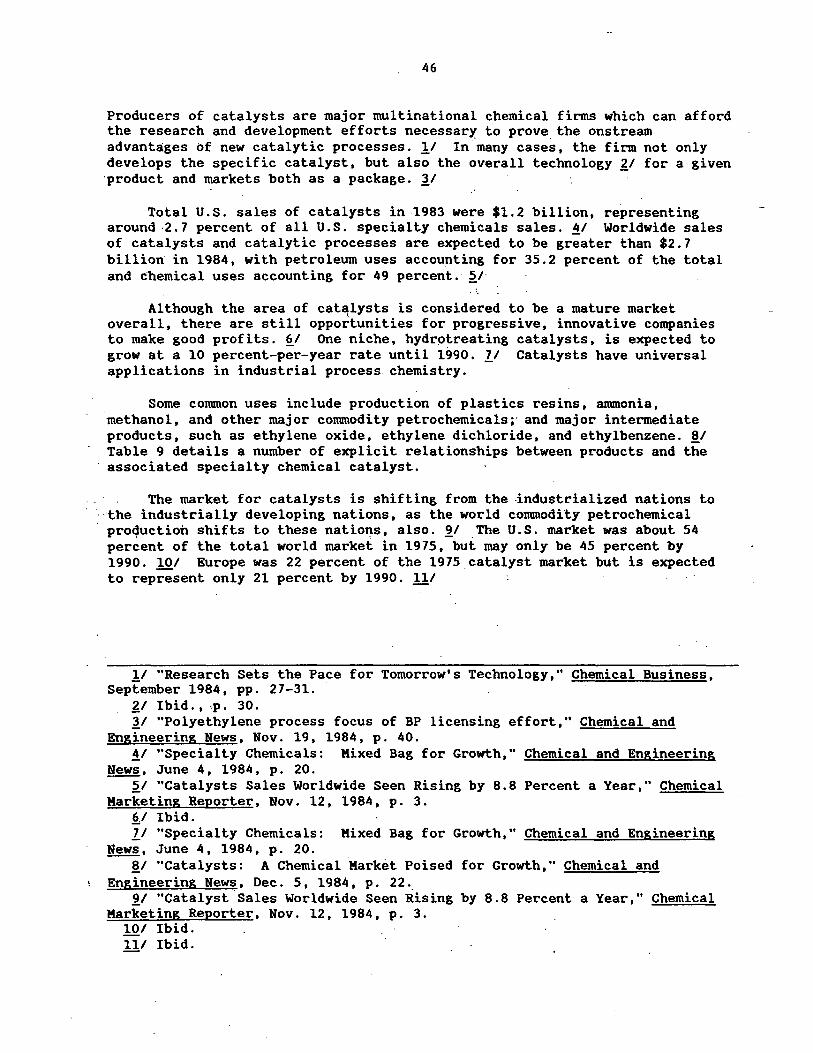
46
Producers of catalysts are major multinational chemical firms which can afford the research and development efforts necessary to prove the onstream advantages of new catalytic processes. 11 In many cases, the firm not only develops the specific catalyst, but also the overall technology z1 for a given ·product and markets both as a package. ~I
Total U.S. sales of catalysts in 1983 were $1.2 billion, representing around ·2.7 percent of all U.S. specialty chemicals sales. ii Worldwide sales of catalysts and catalytic processes are expected to be greater than $2.7 billion· in 1984, with petroleum uses accounting for 35.2 percent of the total and chemical uses accounting for 49 percent. ~I·
.... Although the area of catalysts is considered to be a mature market
overall, there are still oppo~tunities for progressive, innovative companies to make good profits. ~I One niche, hydrotreating catalysts, is expected to grow at a 10 percent-per-year rate until 1990. II Catalysts have universal applications in industrial process chemistry.
Some common uses include production of plastics resins, anunonia, methanol, and other major commodity petrochemicals;· and major intermediate products, such as ethylene oxide, ethylene dichloride, and ethylbenzene. !I Table 9 details a number of explicit relationships between products and the
· associated specialty chemical catalyst.
The market for catalysts is shifting from the .industrialized nations to ··the industrially developing nations, as the world commodity petrochemical
pro4uction shifts to these nations, also. ~I The U.S. market was about 54 percent of the total world market in 1975, but may only be 45 percent by 1990. 101 Europe was 22 percent of the 1975 catalyst market but is expected to represent only 21 percent by 1990. 111
11 "Research Sets the Pace for Tomorrow's Technology," Chemical Business, September 1984, pp. 27-31.
ZI Ibid. , ·;p. 30. ~I "Polyethylene process focus of BP licensing effort,•• Chemical and
Engineering News, Nov. 19, 1984, p. 40. ii "Specialty Chemicals: Mixed Bag for Growth," Chemical and Engineering
News, June 4, 1984, p. 20. ~I "Catalysts Sales Worldwide Seen Rising by 8.8 Percent a Year," Chemical
Marketing Reporter, Nov. 12, 1984, p. 3. ~I Ibid. ll "Specialty Chemicals: Mixed Bag for Growth," Chemical and Engineering
News, June 4, 1984, p. 20. !I "Catalysts: A Chemical Market Poised for Growth," Chemical and
Engineering News, Dec. 5, 1984, p. 22. 91 "Catalyst ·sales Worldwide Seen Rising by 8.8 Percent a Year," Chemical
Marketing Reporter, Nov. 12, 1984, p. 3. 101 Ibid. 11/ Ibid.
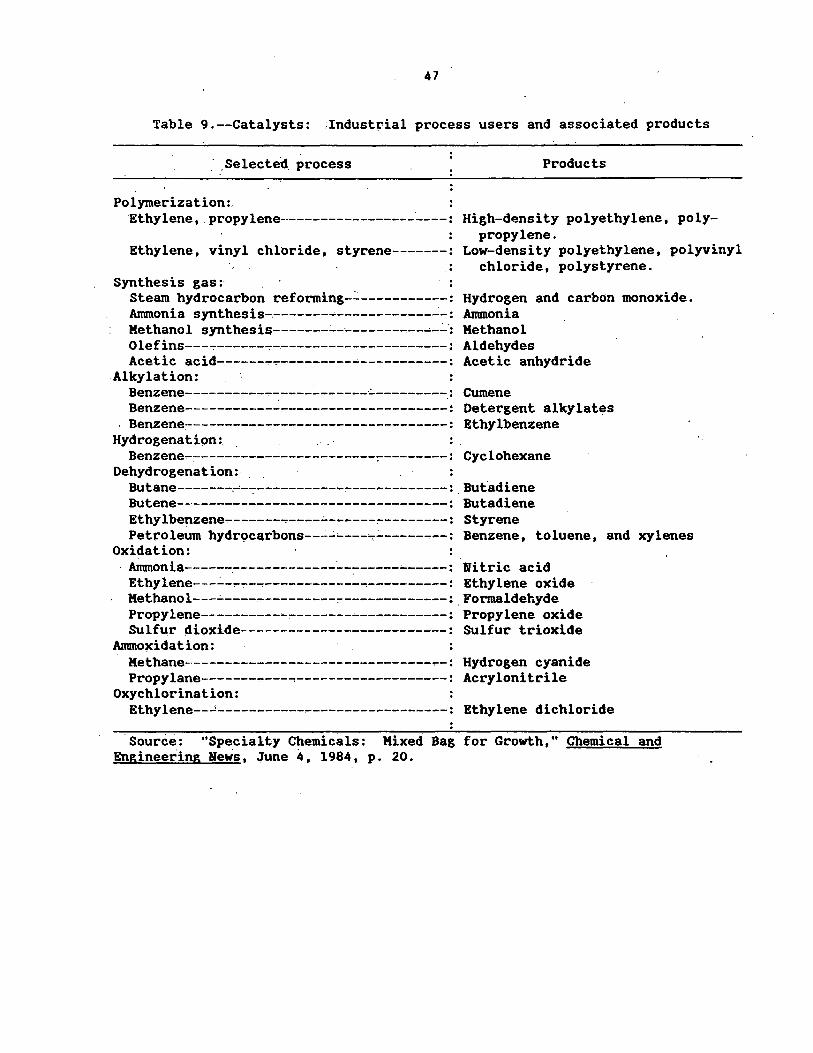
47
Table 9.--Catalysts: ,Indust~ial process users and associated products
· .Selected process
Polymerization:, Ethylene •. propylene-·----------------·----:
Ethylene, vinyl chloride, styrene-------:
Synthesis gas: Steam hydrocarbon reforming-~-----------: Anunonia synthesis-.--------------------..:-: Methanol synthesis-------:..--------...,----~: Olefins---~------~----------------------: Acetic acid------,..~---------------------:
Alkylation:
Products
High-density polyethylene, polypropylene.
Low-density polyethylene, polyvinyl chloride, polystyrene.
Hydrogen and carbon monoxide. Anunonia Methanol Aldehydes Acetic anhydride
Benzene-----------------------~---------.: Cumene Benzene---------------------------------: Detergent alkylat~s Benzene~----------,----------------------: Ethylbenzene
Hydrogenation: .. Benzene,------------------------:---------: Cyclohexane
Dehydrogenation: . Butane-------.-'-7 -----------,-------------: . Butadiene Butene-----:-----------------------------: Butadiene Ethylbenzene-------~-,..--~------,---------: Styrene Petroleum hydr9carbons---:..~---,:..--------: Benzene, toluene, and xylenes
Oxidation: · Anunonia------.---------------~-------'------: Nitric acid
Ethylene---:..-,...,..-...,-------------,----------: Ethylene oxide Methanol---~----,----------:--------------:.Formaldehyde Propylene-----------,--------'------------: Propylene oxide Sulfur dioxide--------------------------: Sulfur trioxide
Anunoxidation: Methane----------------------------------: Hydrogen cyanide Propylane-----------~-------------------: Acrylonitrile
Oxychlorination: Ethylene--~-----------------------------: Ethylene dichloride
·source: "Specialty Chemicals: Mixed Bag for Growth," Chemical and Engineering News, June 4, 1984, p. 20.

48
WORLD PETROCHEMICAL INDUSTRY' DEVELOPMENT
The full effects of the 1973-74 OPEC embargo.and subsequent price increases fo~ crude p~troleum triggered by the. 1979 Iranian crisis were not transposed into the economic situation of the world petrochemical industry until around 1980, as most cost increases for the producers were passed directly to consumers of the products with relatively smaH negativ~ market reactions during the 1970's;
The combination of lowered demand for products of crude petroleum and higher petroleum prices had a more'immediate impact on those industrial nations which ·Were· totally without a domestic supply .of crude matetialS. !i ·'western Europe and Japan were impacted.to a greater extent by the first 'crude petroleum price shock than was the Un.ited States. £1 The decisions ·necessary to be made throughout the world's petrochemical industry were to·what extent commodity petrochemical capacity needed to be rationalized in order· to remain competitive. These plant closures, streamlining, and modernizations would be expected to reestablish the industry on a firmer base. ll
As rationalization proceeded, the OPEC nations began feeling the combined effects of reduced income from diminished crude petroleum sales from declining demand and the loss of a sizeable proportion of the world crude petroleum market to non-OPEC producers. In order to diversify their base of production, they sought to integrate downst·ream into production of commodity petrochemicals. ~/ Through joint venture agreements· with multiriational corporations, massive worldscale· plants were planned to produce ethylene, ammonia:, and methanol from natural gas normally flared during production of· crude petroleum. This decision to enter areas of the downstream market by · using readily available and comparatively inexpensive feedstocks signaled to present world-scale producers of these same products that further restructuring was essential if their industries were to remain viable. ~/ The combined circumstances of exaggerated raw material costs, increasing· inflation, and the future presence of CERN's as commodity petrocnemical producers have set the scenario ~/ for industrialized nations to consider alternate strategies.
r: •.
!I "Petroch.emicals: The Future Means Change~''.. Hydrocarbon ·Processing, November 1983, pp. 23-25.
£1 Ibid. 1.1 "NPRA Offers a U.S. View on Petrochemicals," Manufacturing Chemist, Hay
1983, pp. 45-47, and "Restructuring," Chemical Week, Oct. 26, 1983,· pp. 26-28. ~I U.S. International Trade Commission, The Probable Impact on the U.S.
Petrochemical Industry of the Expanding Petrochemical Industries in the Conventional Energy Rich Nations, USITC Publication 1370, April 1983, pp. 37-140.
~I "NPRA Offers a U.S. View on Petrochemicals," Manufacturing Chemist, Hay 1983, pp. 45-47, and "Restructuring," Chemical Week, Oct. 26, 1983, pp. 26-28.
~I U.S. International Trade Commission, The Probable Impact on the U.S. Petrochemical Industry of the Expanding Petrochemical Industries in the Conventional Energy Rich Nations, USITC Publication 1370, April 1983.
49
Traditional Conunodity Petrochemical Producers
Western Europe
The traditional major suppliers of basic conunodity petrochemicals in Western Europe are France, Italy, Spain, West Germany, the.Netherlands, and the United Kingdom. With the discovery of the large petroleum and natural gas reserves in the North Sea, the Scandinavian countr1es have also become major producers of the same basic commodities. !I
Basis for development
Western Europe, along with Japan and the United States,· has ·a sophisticated market for petrochemicals. But, like Japan, Western Europe lacks the natural:resources to be totally independent in feedstocks.' Hence, as a direct result of the two major crude petroleum crises of the 1970's, changes have bad to be made in Western Europe's industrial structure. !I
According to a· briefing paper from the Briefing Services of the British Government, Western Europe is still very dependent on imported energy sources. ~/ The report states that 70 percent of Western European net petroleum consumption, 17 percent of its natural gas consumption, and 20 percent of its coal consumption in 1983 needed to be imported. About 40 percent of the imported crude petroleum was from the Kiddle East.
Western European petrochemical.production is based primarily on petroleumderived heavy liquids feedstocks.· Although some facilities are capable of utilizing both natural gas liquids or naphtha (a petroleum-derived feedstock), the necessity to import these materials leaves Europe in an unfavorable competitive situation when compared with the Kiddl~ Eastern natural gas-based industries. 'J_l
Current competitive status
The new production facilities in the CERN's, plus overcapacity in basic commodity petrochemicals throughout the world, demanded that the·west European industry close certain plants. !!I Between 1979 and 1983·, 2. 7 million metric tons per year of ethylene cracker facilities were closed in Western Europe. The facilities clbsed .are shown in the following tabulation (in thousands of metric tons-per-year). ~/
. '
!I "Recovery Is Underway but Overcapacity Remains a Problem," Chemical & Engineering News, Dec. 19, 1983, pp. 32-36.
~I "European Petrochemical Producers Face Kore Modest Growth," Chemical & Engineering News, Nov. 5, 1984, pp. 15 and 16.
'J_/ August 1984 briefing paper, Briefing Services, Government and Pubiic Affairs Department, Britannia House, Koor Lane, London, EC2Y9BU, England.
!!I "Call for Unity Against Impending Gulf Imports," Manufacturing Chemist, July 1984, p. 7. ,
~/ "Chop Chop Europe," Manufacturing Chemist, August 1983, pp. 38-41.
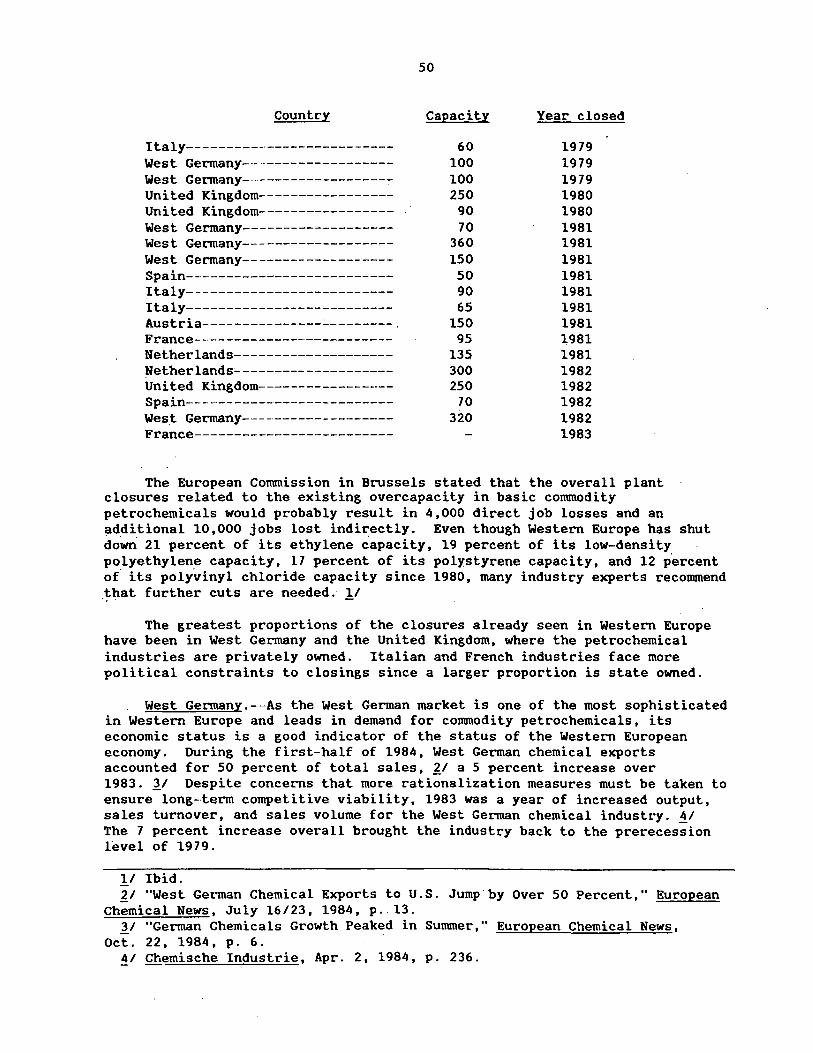
Country
Italy--------------------------West Germany--------------------West Germany------------------United Kingdom----------------United Kingdom----------------West Germany------------------West Germany------------------West Germany-------------------Spain--------------------------Italy-------------------------Italy-------------------------Austria---------------~--------. France-------------------------Netherlands--- ----------------Netherlands~------------------Uni ted Kingdom------------------Spain--------------------------West Germany-------------------France-------------------------
50
Capacity
60 100 100 250
90 70
360 150 50 90 65
150 95
135 300 250
70 3iO
Year closed
1979 1979 1979 1980 1980 1981 1981 1981 1981 1981 1981 1981 1981 1981 1982 1982 1982 1982 1983
The European Commission in Brussels stated that the overall plant closures related to the existing overcapacity in basic commodity petrochemicals would probably result in 4,000 direct job losses and an ~dditional 10,000 jobs lost indirectly. Even though Western Europe has shut dow" 21 percent of its ethylene capacity. 19 percent of its low-density polyethylene capacity, 17 percent of its polystyrene capacity, and 12 p.ercent of its polyvinyl chloride capacity since 1980, many industry experts recommend that further cuts are needed. 1/ .. -
The greatest proportions of the closures already seen in Western Europe have been in West Germany and the United Kingdom, where the petrochemical industries are privately owned. Italian and French industries face more political constraints to closings since a larger proportion is state owned.
West Germany.--As the West German market is one of the most sophisticated in Western Europe and leads in demand for commodity petrochemicals, its economic status is a good indicator of the status of the Western European economy. During the first-half of 1984, West German chemical exports accounted for 50 percent of total sales, ~/ a 5 percent increase over 1983. 11 Despite concerns that more rationalization measures must be taken to ensure long-term competitive viability, 1983 was a year of increased output, sales turnover, and sales volume for the West German chemical industry. !I The 7 percent increase overall brought the industry back to the prerecession Level of 1979.
1/ Ibid. 2,_I "West German Chemical Exports to U.S. Jump.by Over 50 Percent," European
Chemical News, July 16/23, 1984, p. 13. 3/ "German Chemicals Growth Peaked in Sununer," European Chemical News,
Oct. 22, 1984, p. 6. 4/ Chemische Industrie, Apr. 2, 1984, p. 236.
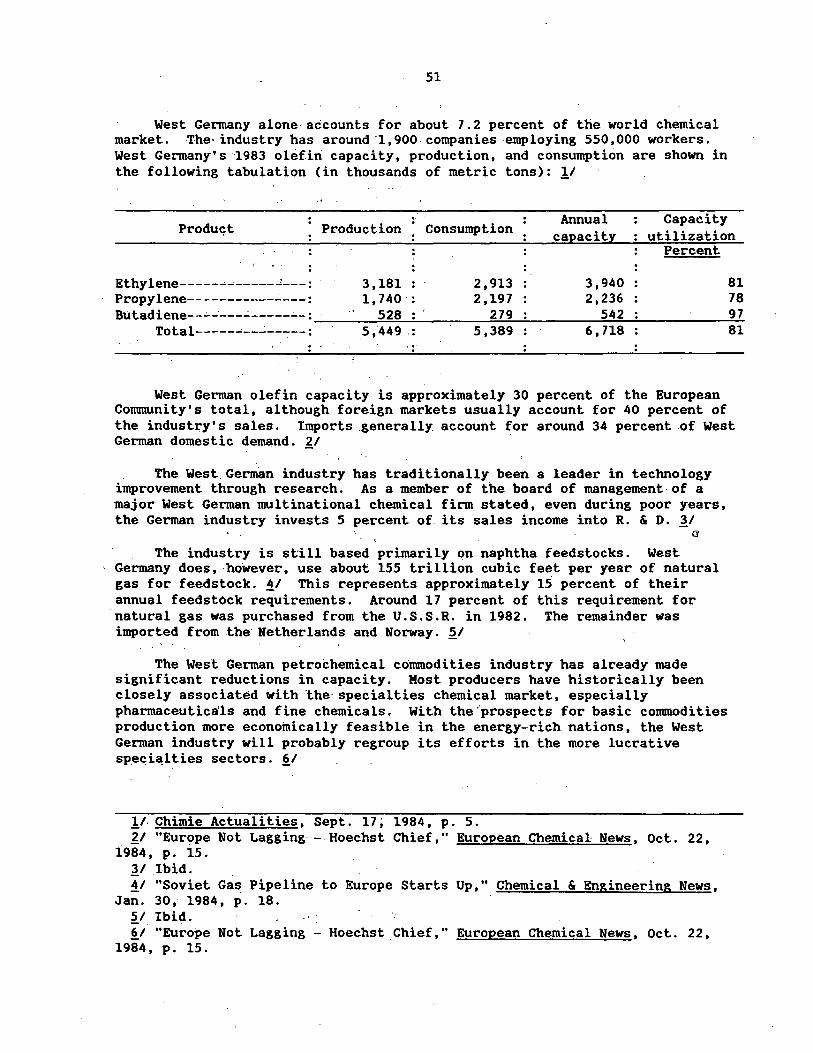
51
West Germany alone-accounts for about 7.2 percent of the world chemical market. The· industry has around ·1,900 companies employing 550,000 workers. West Germany's ·1983 olefin capacity, production, and consumption are shown in the following tabulation (in thousands of metric tons): 11
Produ~t Production Consumption Annual
capacity Capacity
utilization Percent
Ethylene-----~------~---: 3,181 2,913 3,940 81 Propylene---------------: 1,740·: 2,197 2,236 78 BUtadiene--~~---~-----~-:~~~.......::5~2~8:........:.:~~~~~2~7~9:......:.~~~~~5~4~2~~~~~~~9~7
Total-----~-----7--: 5,~49 : 5,389 6,718 81
West German olefin capacity is approximately 30 percent of the European Corranunity's total, although foreign markets usually account for 40 percent of the industry's sales. Imports generally account for around 34 percent .of West German domestic demand. ?:/ ·
The West German industry has traditionally been a leader in technology improvement through research. As a member of the board of management of a major West German multinational chemical firm stated, even during poor years, the German industry invests 5 percent of its sales income into R. & D. ~/
The industry is still based primarily on naphtha feedstocks. West Germany does, however, use about 155 trillion cubic feet per year of natural gas for feedstock. !I This represents approximately lS percent of their annual feedstock requirements. Around 17 percent of this requirement for natural gas was purchased from the U.S.S.R. in 1982. The remainder was imported from the Netherlands and Norway. ~/
The West German petrochemical corranodities industry has already made significant reductions in capacity. Most producers have historically been closely associated with the· specialties chemical market, especially pharmaceutica'ls and fine chemicals. With the 'prospects for basic conunodities production more economically feasible in the energy-rich nations, the West German industry will probably regroup its efforts in the more lucrative speci~lties sectors. ~/
ll· Chimie Actualities, Sept. 17; 1984, p. 5. ?:/ "Europe Not Lagging -Hoechst Chief," European Chemical News, Oct. 22,
1984, p. 15. ~/ Ibid. !I "Soviet Gas Pipeline to Europe Starts Up," Chemical & Engineering News,
Jan. 30, 1984, p. 18. 51 Ibid. ~I "~rope Not Lagging - Hoechst.Chief," European Chemical News, Oct. 22,
1984, p. 15.
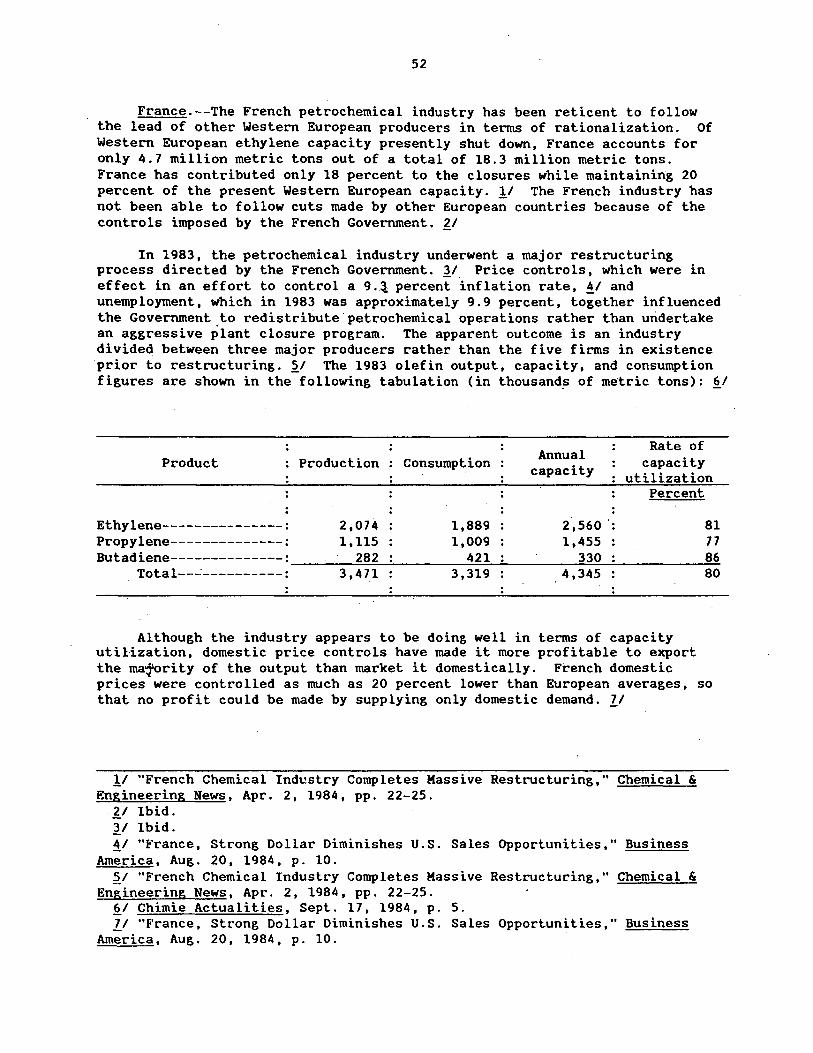
52
France.--The French petrochemical industry has been reticent to follow the lead of other Western European producers in terms of rationalization. Of Western European ethylene capacity presently shut down, France accounts for only 4.7 million metric tons out of a total of 18.3 million metric tons. France has contributed only 18 percent to the closures while maintaining 20 percent of the present Western European capacity. !I The French industry has not been able to follow cuts made by other European countries because of the controls imposed by the French Government. £1
In 1983, the petrochemical industry underwent a major restructuring process directed by the French Government. 11 Price controls, which were in effect in an effort to control a 9.~ percent inflation rate, !I and unemployment, which in 1983 was approximately 9.9 percent, together influenced the Government to redistribute.petrochemical operations rather than undertake an aggressive plant closure program. The apparent outcome is an industry divided between three major producers rather than the five firms in existence prior to restructuring. ~/ The 1983 olefin output, capacity, and consumption figures are shown in the following tabulation (in thousand_s of metric tons): fl/
Rate of Annual Product Production Consumption capacity capacity
utilization Percent
Ethylene---------------: 2;074 1,889 2,560 ·: 81 Propylene--------------: 1,115 1,009 1,455 77 Butadiene--------------: 282 421 330 86
Total--~----------: 3,471 3,319 4,345 80
Although the industry appears to be doing well in terms of capacity utilization, domestic price controls have made it more profitable to export the ma1ority of the output than market it domestically. French domestic prices were controlled as much as 20 percent lower than European averages, so that no profit could be made by supplying only domestic demand. ll
!I "French Chemical Industry Completes Massive Restructuring," Chemical & Engineering News, Apr. 2, 1984, pp. 22-25.
2/ Ibid. 'J/ Ibid. ~I "France, Strong Dollar Diminishes U.S. Sales Opportunities," Business
America, Aug. 20, 1984, p. 10. ~I "French Chemical Industry Completes Massive Restructuring," Chemical &
Engineering News, Apr. 2, 1984, pp. 22-25. ~I Chimie Actualities, Sept. 17, 1984, p. 5. ll "France, Strong Dollar Diminishes U.S. Sales Opportunities," Business
America, Aug. 20, 1984, p. 10.
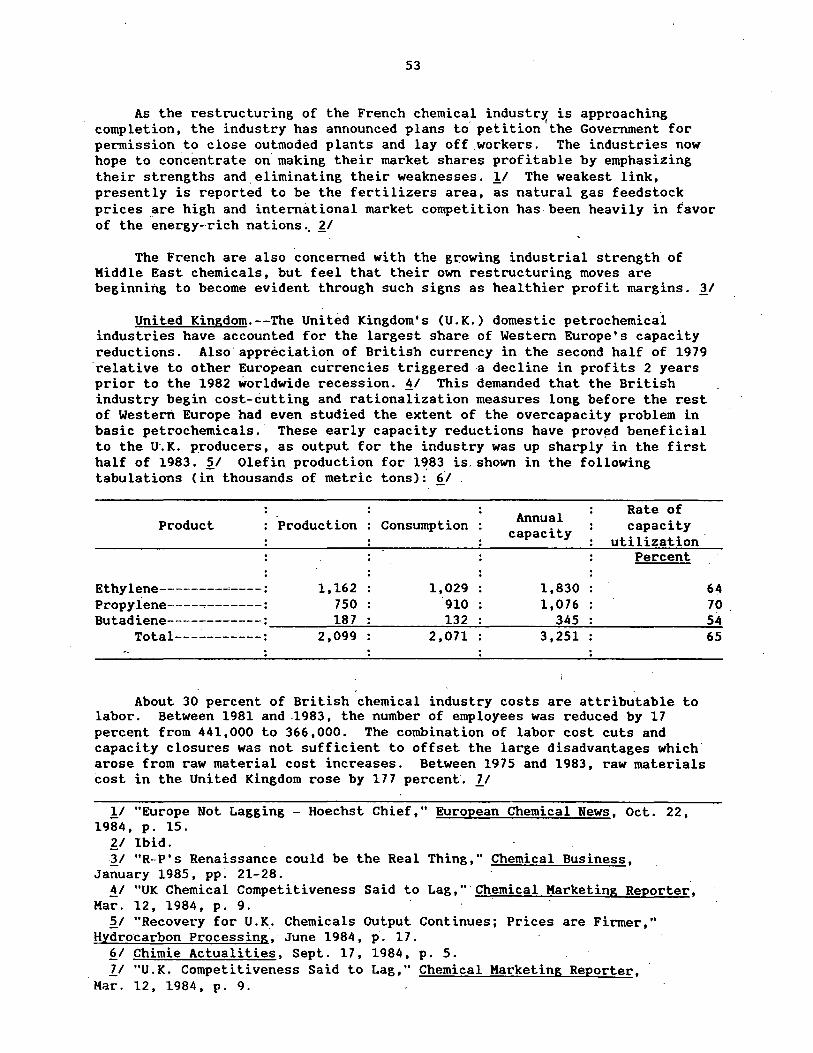
53
As the restructuring of the French chemical industry is approaching completion, the industry has announced plans to. petition
1the Government for
permission to close outmoded plants and lay off .workers. The industries now hope to concentrate on making their market shares profitable by emphasizing their strengths and.eliminating their weaknesses. 11 The weakest link, presently is reported to be the fertilizers area, as natural gas feedstock prices _are high and international market competition has been heavily in favor of the energy-rich nations .. 'l:_I
The French are also concerned with the growing industrial strength of Middle East chemicals, but feel that their own restructuring moves are beginning to become evident through such signs as healthier profit margins. ~/
United Kingdom.--The United Kingdom's (U.K.) domestic petrochemical industries have accounted for the largest share of Western Europe's capacity reductions. Also appreciation of British currency in the second half of 1979 relative to other European currencies triggered -a decline in profits 2 years prior to the 1982 worldwide recession. !I This demanded that the British industry begin cost-cutting and rationalization measures long before the rest of Western Europe had even studied the extent of the overcapacity problem in basic petrochemicals. These early capacity reductions have prov~d beneficial to the U. K. p_roducers, as output for the industry was up sharply in the first half of 1983. ~/ Olefin production for 1983 is. shown in the following tabulations (in thousands of metric tons):' §../
Product Production
Ethylene--------~----: 1,162 Propylene-----~-------: 750 Butadiene------------: 187
Total-----------: 2,099
Consumption
1,029 910 132
2,071
Annual capacity
1,830 1,076
345 3,251
Rate of capacity
utilization · Percent
About 30 percent of British chemical industry costs are attributable to labor. Between 1981 and .1983, the number of employees was reduced by 17 percent from 441,000 to 366,000. The combination of labor cost cuts and capacity closures was not sufficient to offset the large disadvantages which arose from raw material cost increases. Between 1975 and 1983, raw materials cost in the United Kingdom rose by 177 percent. ll
ll "Europe Not Lagging - Hoechst Chief," European Chemical News, Oct. 22, 1984, p. 15.
'l:_I Ibid. 31 "R-P's Renaissance could be the Real Thing," Chemical Business,
January 1985, pp. 21-28. !I "UK Chemical Competitiveness Said to Lag," Chemical Marketing Reporter,
Mar. 12, 1984, p. 9. ~I "Recovery for U. K_. Chemicals OUtput Continues; Prices are Firmer,"
Hydro·carbon Processing. June 1984. p. 17. ~I Chimie Actualities, Sept. 17, 1984, p. 5. ll "U.K. Competitiveness Said to Lag," Chemical Marketing Reporter,
Kar. 12, 1984, p. 9.
64 70 54 65
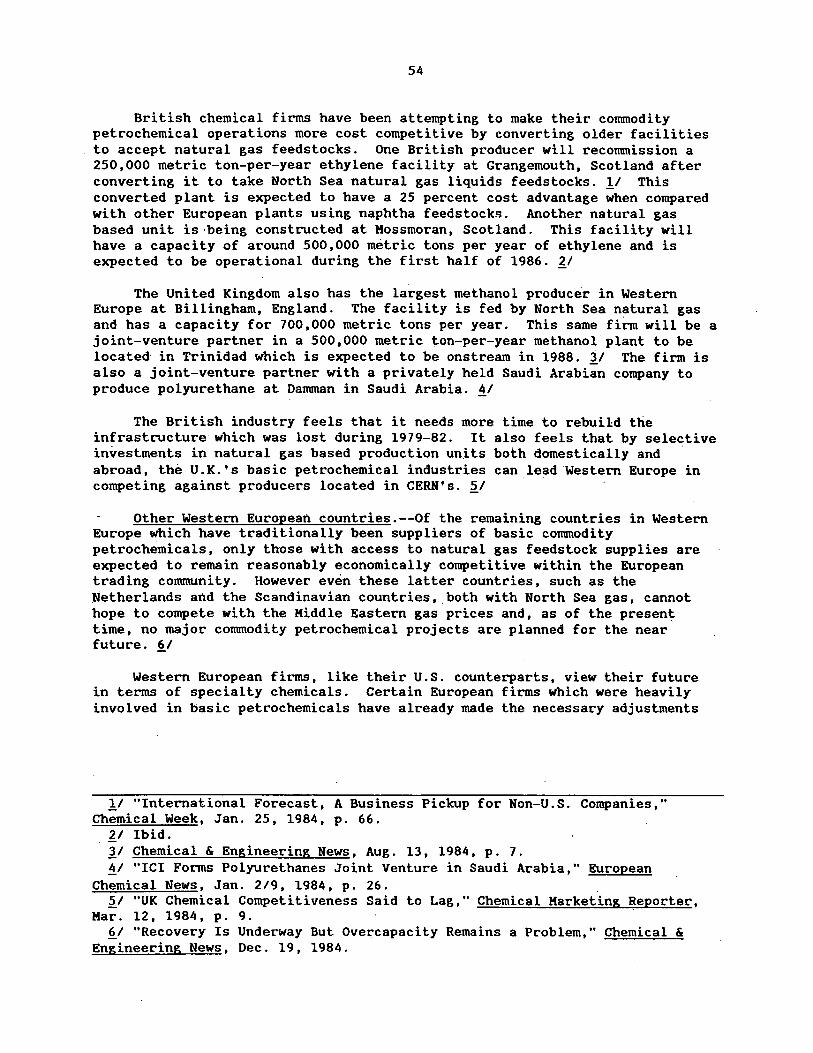
54
British chemical firms have been attempting to make their commodity petrochemical operations more cost competitive by converting older facilities to accept natural gas feedstocks. One British producer will recommission a 250,000 metric ton-per-year ethylene facility at Grangemouth, Scotland after converting it to take North Sea natural gas liquids feedstocks. 11 This converted plant is expected to have a 25 percent cost advantage when compared with other European plants using naphtha feedstocks. Another natural gas based unit is ·being constructed at Mossmoran, Scotland. This facility will have a capacity of around 500,000 metric tons per year of ethylene and is expected to be operational during the first half of 1986. £1
The United Kingdom also has the largest methanol producer in Western Europe at Billingham, England. The facility is fed by North Sea natural gas and has a capacity for 700,000 metric tons per year. This same firm will be a joint-venture partner in a 500,000 metric ton-per-year methanol plant to be located· in Trinidad which is expected to be onstream in 1988 .. ~/ The firm is also a joint-venture partner with a privately held Saudi Arabian company to produce polyurethane at Danunan in Saudi Arabia. ii
The British industry feels that it needs more time to rebuild the infrastructure which was lost during 1979-82. It also feels that by selective investments in natural gas based production un.its both domestically and abroad, the U.K.'s basic petrochemical industries can lead Western Europe in competing against producers located in CERN's. ~I
Other Western European countries.--Of the remaining countries in Western Europe which have traditionally been suppliers of basic commodity petrochemicals, only those with access to natural gas feedstock supplies are expected to remain reasonably economically competitive within the European trading community. However even these latter countries, such as the Netherlands and the Scandinavian countries, _both with North Sea gas, cannot hope to compete with the Middle Eastern gas prices and, as of the present time, no major commodity petrochemical projects are planned for the near future. §_/
Western European firms, like their U.S. counterparts, view their future in terms of specialty chemicals. Certain European firms which were heavily involved in basic petrochemicals have already made the necessary adjustments
11 "International Forecast, A Business Pickup for Non-U.S. Companies," Chemical Week, Jan. 25, 1984, p. 66.
'!J Ibid. 11 Chemical & Engineering News, Aug. 13, 1984, p. 7. ii "ICI Forms Polyurethanes Joint Venture in Saudi Arabia," European
Chemical News, Jan. 219, 1984, p. 26. ~I "UK Chemical Competitiveness Said to Lag," Chemical Marketing Reporter,
Mar. 12, 1984, p. 9. ~I "Recovery Is Underway But Ovet;"capacity Remains a Problem," Chemical &
Engineering News, Dec. 19, 1984.
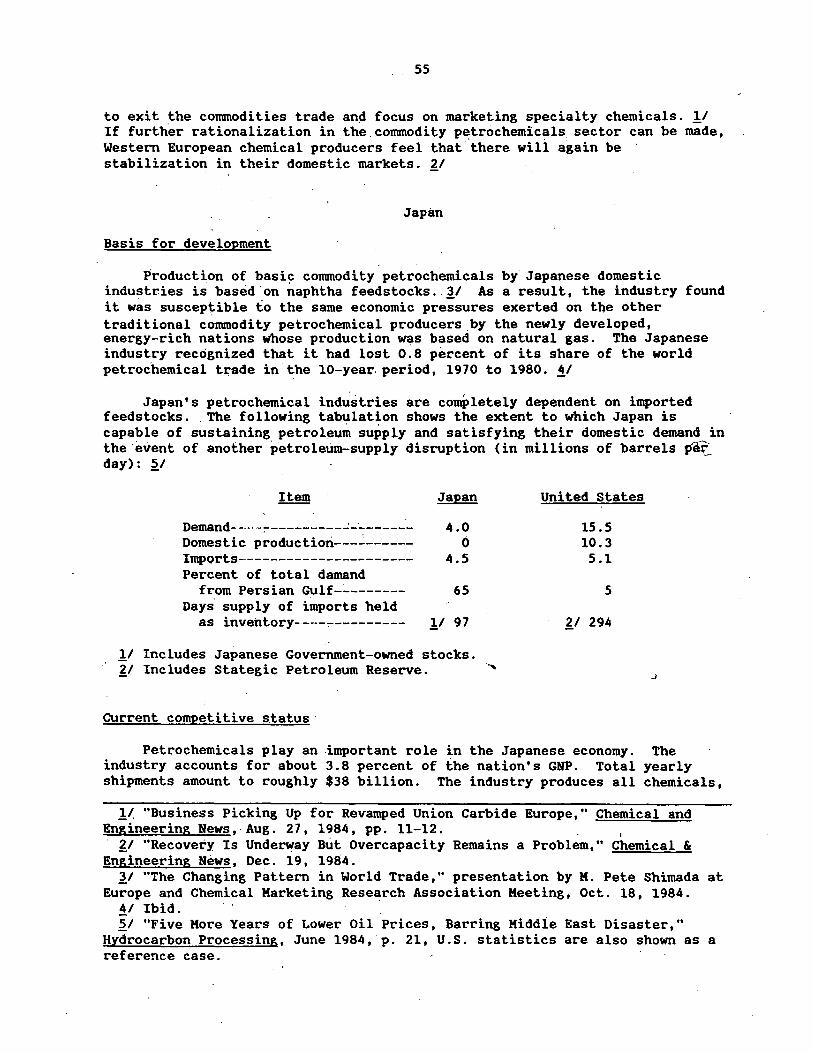
55
to exit the commodities trade an~ focus on marketing specialty chemicals. !I If further rationalization in the.commodity p~trochemicals sector can be made, Western European chemical producers feel that there will again be ' stabilization in their domestic markets. ZI
Japan
Basis for development
Production of basi~ commodity petrochemicals by Japanese domestic industries is based on naphtha feedstocks. i1 As a result, the industry found it was susceptible to the same economic pressures exerted on the other traditional commodity petrochemical producers_by the newly developed, energy-rich nations whose production was based on natural gas. The Japanese industry recognized that it had lost 0.8 percent of its share of the world petrochemical trade in the 10-year. period, 1970 to 1980. !I
Japan's petrochemical industries are coml>letely dependent on imported feedstocks. _The following tabulation shows the extent to which Japan is capable of sustaining petroleum supply and satisfying their domestic demand in the event of another petroleum-supply disruption (in millions of barrels ~ day): ~/
Demand----,----------~-~------ 4.0 Domestic production---~-----~ 0 Imports---------------------- 4.5 Percent of total damand
from Persian Gulf-~------- 65 Days supply of imports held
as inventory----,---------- !I 97
!I Includes Japanese Government-owned stocks. ZI Includes Stategic Petroleum Reserve.
Current competitive status -
United States
15.5 10.3 5.1
5
ZI 294
Petrochemicals play an -important role in the Japanese economy. The industry accounts for about 3.8 percent of the nation's GNP. Total yearly shipments amount to roughly $38 billion. The industry produces all chemicals,
!/ "Business Picking Up for Revamped Union Carbide Europe," Chemical and Engineering News, Aug. 27, 1984, pp. 11-12. ,
z1 "Recovery Is Underway But Overcapacity Remains a Problem," Chemical & Engineering News, Dec. 19, 1984.
i1 "The Changing Pattern in World Trade," presentation by M. Pete Shimada at Europe and Chemical Marketing Research Association Meeting, Oct. 18, 1984.
!I Ibid. ~I "Five More Years of Lower Oil Prices, Barring Middie East Disaster,"
Hydrocarbon Processing, June 1984, p. 21, U.S. statistics are also shown as a reference case.
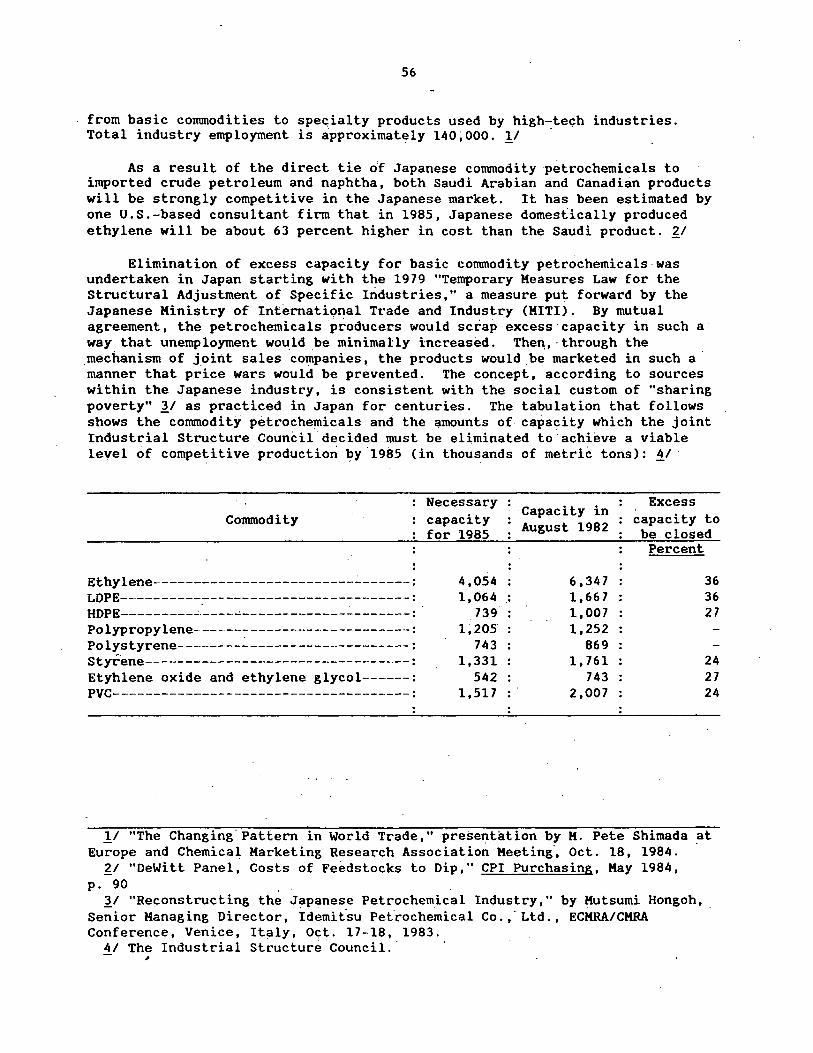
56
from basic commodities to spe~ialty products used by high-te~h industries. Total industry employment is approximately 140;000. 11 ·
As a result of the direct tie o:f Japanese commodity petrochemicals to imported crude petroleum and naphtha, both Saudi Arabian and Canadian products will be strongly competitive in the Japanese market. It has been estimated by one U.S.-based consultant firm that in 1985, Japanese domestically produced ethylene will be about 63 percent higher in cost than the Saudi product. ~/
Elimination of excess capacity for basic commodity petrochemicals-was undertaken in Japan starting with the 1979 "Temporary Measures Law for the Structural Adjustment of Specific Industries," a measure put forward by the Japanese Ministry of International Trade and Industry (KIT!). By mutual agreement, the petrochemicals producers would scrap excess capacity in such a way that unemployment would _be minimally increased. The~, ·through the mechanism of joint sales companies~ the products would _be marketed in such a· manner that price wars would be prevented. The concept, according to sources within the Japanese industry, is consistent with the social custom of "sharing poverty" '}/ as practiced in Japan for centuries. The tabulation that follows shows the commodity petroche~icals and the amounts of. capacity which the joint Industrial Structure Council decided must be eliminated to·achieve a viable level of competitive production by 1985 (in thousands of metric tons): !!/ •
Necessary Excess Commodity
Capacity in capacity capacity to August 1982 for 1985 be closed
Ethylene--------------------------------: LOPE------------------------------------: HOPE---------~----~---------------------:
Polypropylene------~--------------------: Polystyrene-----------------------------: styr.ene-- -------------------------------: Etyhlene oxide and ethylene glycol------: PVC-------------------------------------:
4,054 1,064
739 1;2os
743 1,331
542 1,517
Percent
6,347 36 : 1,667 36
1,007 27 1,252
869 1,761 24
743 27 2,007 24
11 "The Changing.Pattern in World Trade," preseJ1t8tion by K. Pete Shimada at Europe and Chemical Marketing Research Association Meeting', Oct. 18, 1984.
~I "DeWitt Panel, Costs of Feedstocks to Dip," CPI Purchasing, May 1984, p. 90 .
3/ "Reconstructing the Japanese Petrochemical Industry," by Mutsumi Hongoh, Se;:;:ior Managing Director, Idernit.su PetC"ochemical Co. ,' Ltd. , ECKRA/CKRA Conference, Venice, Italy, Oct. 17-18, 1983.
4/ The Industrial Structure Council.· - ~
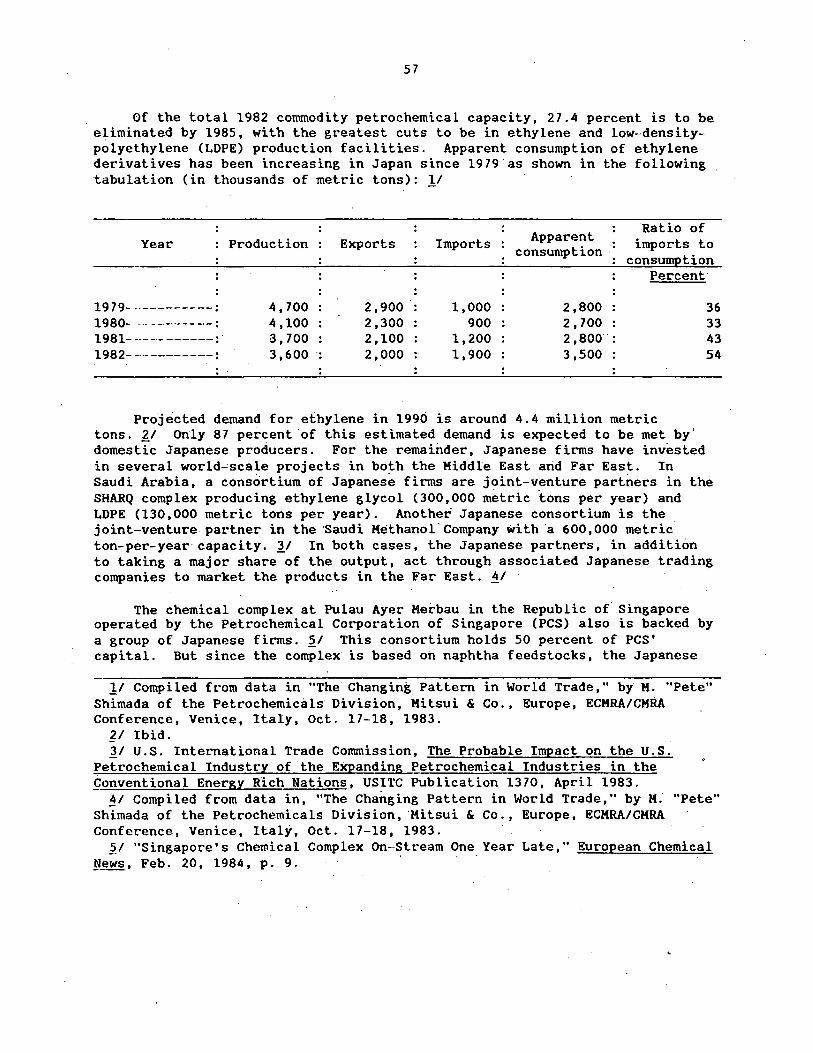
57
Of the total 1982 commodity pett"ochemical capacity, 27.4 peC"cent is to be eliminated by 1985, with the gt"eatest cuts to be in ethylene and low-densitypolyethylene (LOPE) pt"oduction facilities. AppaC"ent consumption of ethylene det"ivatives has been inct"easing in Japan since 1979'as shown in the following tabulation (in thousands of mett"ic tons): 11 ·
AppaC"ent Ratio of Year Production Exports Imports imports to consumption consumption
Percent·
1979-----------: 4,700 2,900 1,000 2,800 36 1980-----------: 4,100 2,300 900 2,700 33 1981-----------: 3,700 2,100 1,200 2,800 43 1982-----------: 3,600 . 2,000 1,900 3,500 54
Projected demand foe" ethylene in 1990 is around 4.4 million metric tons. 2/ Only 87 percent 'of this estimated demand is expected to be met by' domestic Japanese pt"oducers. For the remainder, Japanese firms have invested in several world~scale projects in both the Kiddle East arid Far East. In Saudi Arabia, a consortium of Japanese firms are joint-v.enture partners in t~e SHARQ complex producing ethylene glycol (300,000 mett"ic tons per year) and LOPE (130,000 metric tons per year). Another Japanese consortium is the joint-venture partner in the ·saudi Methanol.Company with a 600,000 mett"ic ton-per-year capacity. ll In both cases, the Japanese partners, in addition to taking a major share of the output, act through associated Japanese trading companies to market the pC"oducts in the Far East. !!I ·
The chemical complex at Pulau Ayer Merbau in the Republic of· Singapore operated by the Petrochemical Corporation of Singapore (PCS) also is backed by a group of Japanese firms. ~/ This consortium holds 50 percent of PCS' capital. But since the complex is based on naphtha feedstocks, the Japanese
11 Compiled from data in "The Changing Pattern in Wodd Trade," by K. "Pete" Shimada of the Petrochemicals· Division, Mitsui & Co., Europe, ECMRA/CMRA Conference, Venice, Italy, Oct. 17-18, 1983.
'J:I Ibid. 11 U.S. International Trade Conunission, The Probable Impact on the U.S.
Petrochemical Industry of the EXJlanding Petrochemical Industries in the Conventional Energy Rich Nations. usn·c Publication 13 70, April 1983.
f!I Compiled from data in, "The Changing Pattern in World Trade," by M. "Pete" Shimada of the Petrochemicals Division, Mitsui & Co., Europe, ECMRA/CMRA Conference, Venice, Italy, Oct. 17-18, 1983.
'j_I "Singapore's Chemical Complex On-·Stt·eam One Year Late," European Chemical ~ews, Feb. 20, 1984, p. 9.

58
interests have been reluctant to commit themselves to a firm percentage of imports from the operation. !I
A more economically promising venture for Japanese investors· could be in Malaysia. Malaysia is seeking a Japanese part~er to invest in a 200,000 metric ton-per-year ethylene plant that could be built and onstream by 1990. £1 This plant would use low-priced natural gas as a feedstock and hence be more competitive th~n the Singapore complex.
By overall industry cooperation, Japan is successfully reducing its excess capacity for certain commodity petrochemicals.· Also, through the marketing tactics of its trading companies, the nation has been able to secure
.new markets and firm relationships with old trading partners. ll
The Japanese trading company is a unique facility for establishing Japanese-foreign industrial trade relationships. They are staffed by graduates of a special Japanese trading university which schools _students in marketing, languages, and customs. !/ These graduates are then rotated worldwide acting as international trading specialists. The structure of these trading companies has allowed Japanese manufacturers to circumvent dealing directly with their customers, and therefore, they do not have to maintain an ex~ensive marketing s~aff. The trading companies also provide a mechanism for international marketing of products made by small capacity Japanese firms, P.ence, opening world markets to these smaller industries which could not afford independent foreign offices. ~/
At present, the chemical sector of the Japanese·economy is reported to be doing extremely well. Production in the petrochemicals sector in the first half of 1984 averaged 22 percen~.ahead of output. in 1982. The restructuring of the ethylene industry has been very successful,, and the 1984 economic improvement has made it necessary to increase imports of ethylene on an emergency basis. ~/ The industry still intends to complete its. planned capacity reductions for 1985. ll
The Japanese Government has remained cognizant of the fact that Japan possesses no petroleum resource base. The restructuring of its petrochemical industry appears to leave a margin for growth· which is consistent with projected increases in demand and shows that Japan has no interest in attempting to compete with the lower cost products coming out of energy-rich
!I Ibid. '£1 "Petronas Invites Japan to Invest in Malaysia," European Chemical News,
March 26, 1984, p. 22. ll U.S. International Trade Commissio.n, The Probable Impact on the U.S.
Petrochemical Industry of the Expanding Petrochemical Industries in the Conventional Energy Rich Nations, USITC Publication 1370, April 1983.
·4/ Ibid. ~I "Japan is Displacing the United States As Saudi .Arabia's Leading
Supplier; Many Possible Reasons Are Cited," Business America, June 25, 1984, pp. 14-15.
~I "Lusty Economy Revives Japanese Chemicals," Chemical & Engineering News, Aug. 6, 1984, p. 9.
71 Ibid.
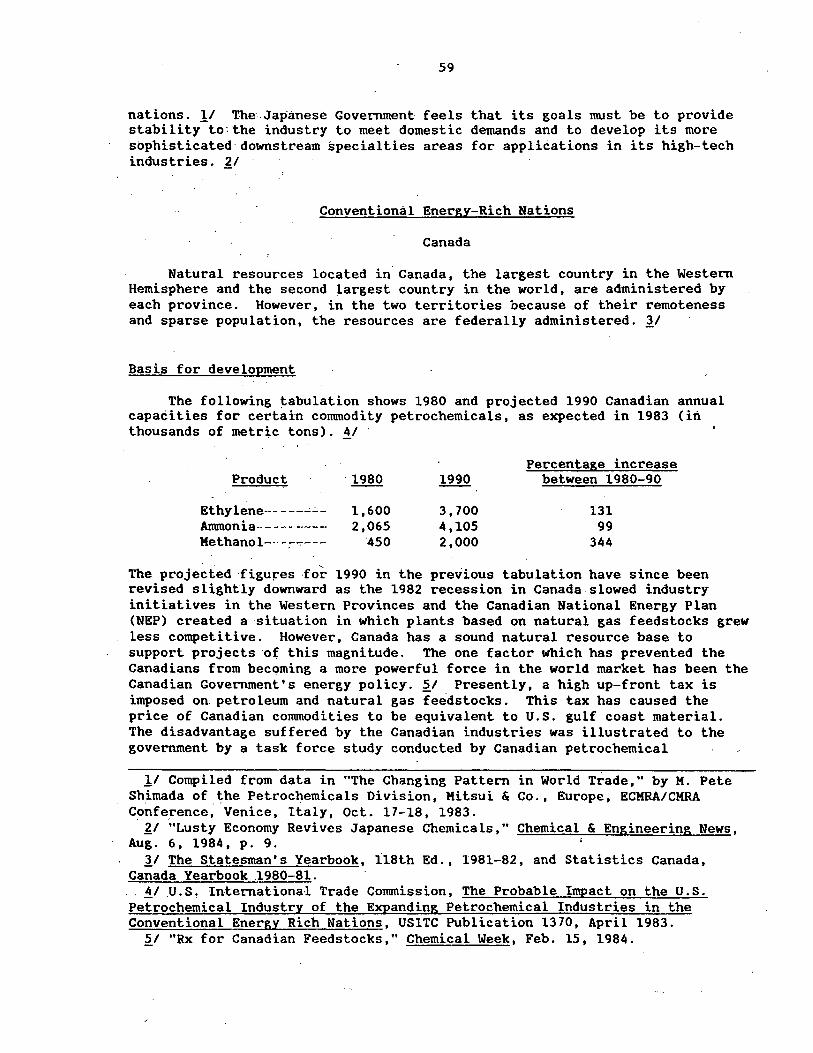
59
nations. !I The· Japanese Government feels that its goals must be to provide stability to: the industry to meet domestic demands and to develop its more sophisticated downstream specialties areas for applications in its high-tech industries. J:.I
Conventional Energy-Rich Nations
Canada
Natural resource.s located in Canada, the largest country in the Western Hemisphere and the second iargest country in the world, are administered by each province. However, in the two territories because of their remoteness and sparse population, the resources are federally administered. 11
Basis for development
The following tabulation shows 1980 and projected 1990 Canadian annual capacities for certain commodity petrochemicals, as expected in 1983 (in thousands of metric tons). !I
Product
Ethylene-----·--"~
Ammonia-------~Methanol---~:-...,.---
. 1980
1,600 2,065
'450
3, 700 4,105 2,000
Percentage increase between 1980-90
131 99
344
The projected figures fo~ 1990 in the previous tabulation have since been revised slightly downward as the 1982 recession in Canada slowed industry initiatives in the Western Provinces and the Canadian National Energy Plan (NEP) created a situation in which plants based on natural gas feedstocks grew less competitive. However, Canada has a sound natural resource base to support projects o( this magnitude. The one factor which has prevented the Canadians from becqming a more powerful force in the world market has been the Canadian Government's energy policy. ~/ Presently, a high up-front tax is imposed on petroleum and natural gas feedstocks. This tax has caused the price of Canadian commodities to be equivalent to U.S. gulf coast material. The disadvantage suffered by the Canadian industries was illustrated to the government by a task force study conducted by Canadian petrochemical
!I Compiled from data in "The Changing Pattern Shimada of the Petrochemicals Division, Mitsui & C~nfe~ence~ ·Venice, Italy, Oct. 17-18, 1983.
in World Trade," by M. Pete Co., Europe, ECMRA/CMRA
?:./ "Lusty Economy Revives Japanese Chemicals," Chemical & Engineering News, Aug. 6, 1984, p. 9.
11 The Statesman's Yearbook, ll8th Ed., 1981~82, and Statistics Canada, Canada Yearbook .1980-81.
!I U.S, International Trade Commission, The Probable Impact on the U.S. Petrochemical Industry of the Expanding Petrochemical Industries in the Conventional Energy Rich Nations, US ITC Publication 13 70, April 1983.
~I "Rx for Canadian Feedstocks," Chemical Week, Feb. 15, 1984.
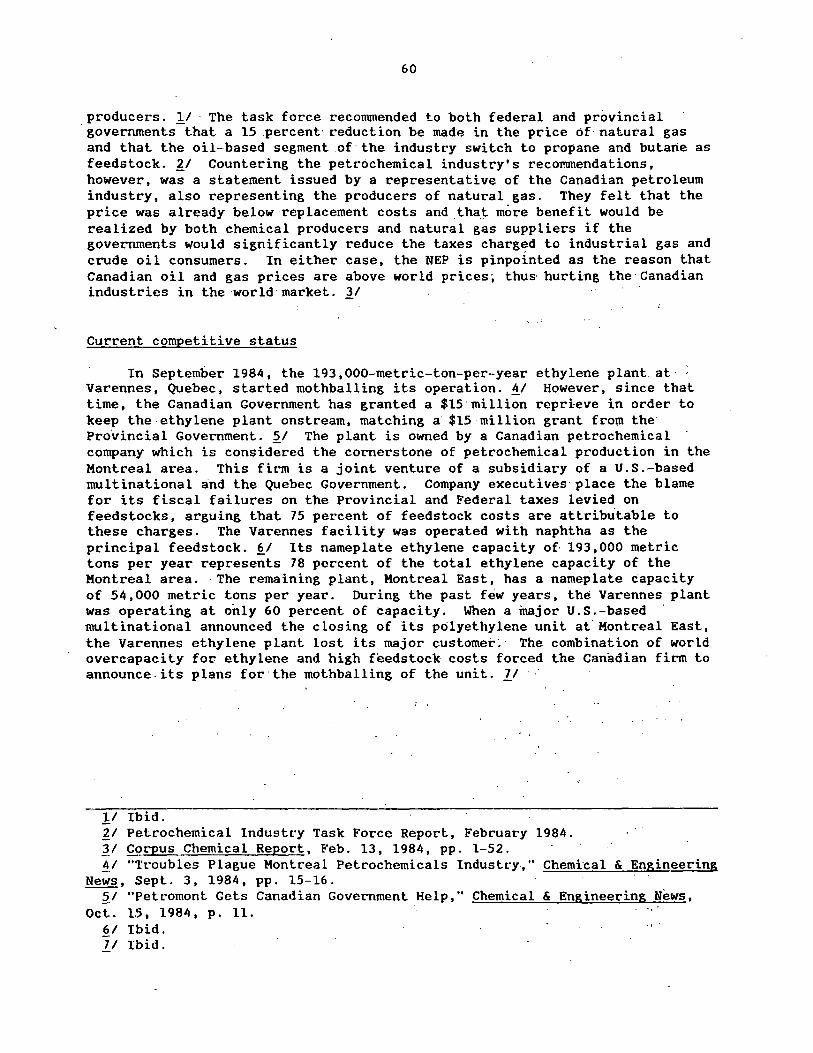
60
producers. 1/ The task force recommended to both federal and provincial governments-that a 15 percent· reduction be made in the price of·natuFal gas and that the oil-based segment .of· the industry switch to propane and butane as feedstock. ~/ Countering the petrochemical industry's recommendations, however, was a statement issued by a representative of the Canadian petroleum industry, also representing the producers of natural gas. They felt that the price was already below replacement costs and.that more benefit would be realized by both chemical producers and natural gas suppliers if the governments would significantly reduce the taxes charged to industrial gas and crude oil consumers. In either case, the NEP is pinpointed as the reason that Canadian oil and gas prices are above world prices 0 thus· hurting the Canadian industries in the world·market. ~/
Current competitive status
In September 1984, the 193,000-metric-ton-per-year ethylene plant at· Varennes, Quebec, started mothballing its operation. !I However, since that time, the Canadian Government has granted a $15 million reprieve in order to keep the-ethylene plant onstream, matching a $15 million grant from the Pro'vincial Government. ~/ The plant is owned by a Canadian petrochemical company which is considered the cornerstone of petrochemical production in the Montreal area. This firm is a joint venture of a subsidiary of a U.S.-based multinational and the Quebec Government. Company executives· place the blame for its fiscal failures on the Provincial and Federal taxes levied on feedstocks, arguing that 75 percent of feedstock costs are attribu.table to these charges. The Varennes facility was operated with naphtha as the principal feedstock. §_/ Its nameplate ethylene capacity of. 193,000 metric tons per year represents 78 percent of the total ethylene capacity of the Montreal area. The remaining plant, Montreal East, has a nameplate capacity of 54,000 metric tons per year. During the past few years, the Varennes plant was operating at only 60 percent of capacity. When a major U.S.-based . multinational announced the closing of its polyethylene unit at Montreal East, the Varennes ethylene plant lost its major customer> The combination of world overcapacity for ethylene and high feedstock costs forced the Canadian firm to announce.its plans for the mothballing of the unit. ll
11 Ibid. 21 Petrochemical Industry Task Force Report, February 1984. 31 Corpus Chemical Report, F'eb. 13, 1984, pp. 1-52. 4/ "Troubles Plague Montt"eal Pett"ochemicals Industry," Chemical & Engineering
News, Sept. 3, 1984, pp. 15-16. ~J "Petromont Gets Canadian Government Help," Chemical & Engineering News,
Oct. 15, 1984, p. 11. 6/ Ibid. 71 Ibid.
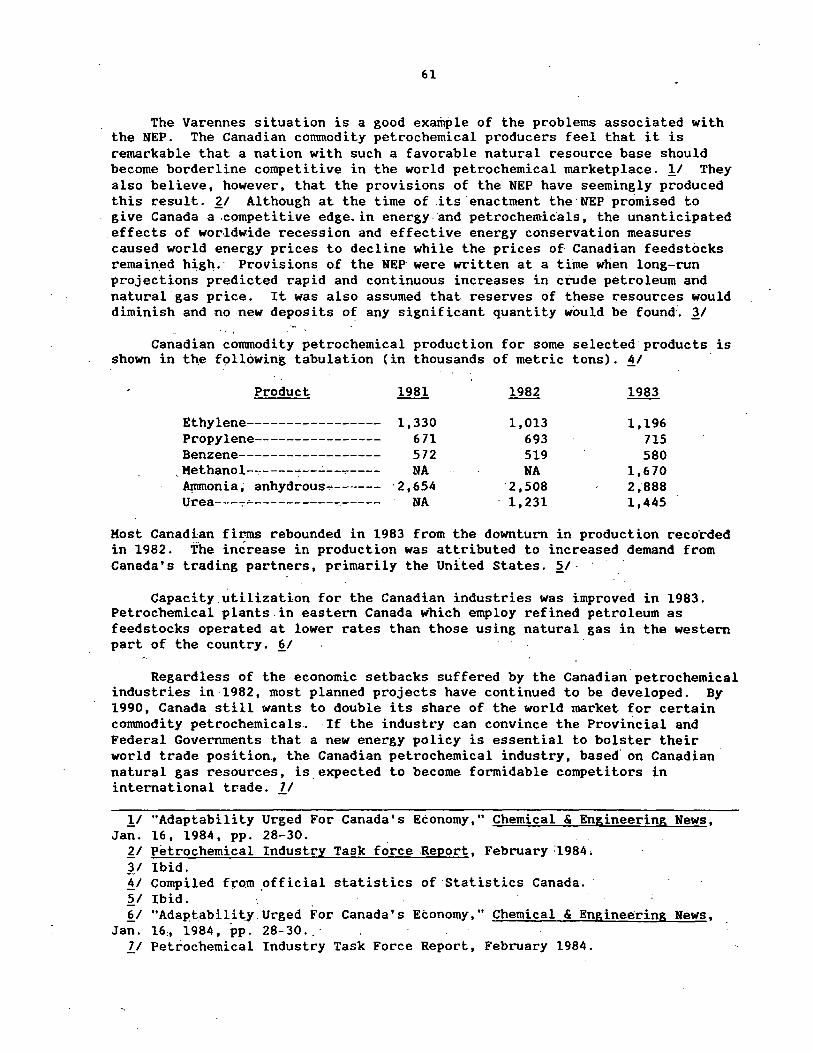
61
The Varennes situation is a good example of the problems associated with the NEP. The Canadian commodity petrochemical producers feel that it is remarkable that a nation with such a favorable natural resource base should become borderline competitive in the world petrochemical marketplace. !I They also believe, however, that the provisions of the NEP have seemingly produced this result. ~I Although at the time of its enactment the NEP promised to give Canada a .competitive edge. in energy. ·and petrochemicals, the unanticipated effects of worldwide recession and effective energy conservation measures caused world energy prices to decline while the prices of Canadian feedstocks remained h~g1'. · Provisions. of the NEP were written at a time when long-run projections predicted rapid and continuous increases in crude petroleum and natural gas price. It was also assumed that reserves of these resources would diminish and no new deposits of any significant quantity would be found. ~I
Canadian commodity petrochemical production for some selected products is shown in th~ following tabulation (in thousands of metric tons). !I
Product 1981 1982 1983
Ethylene----------------- 1,330 1,013 1,196 Propylene--~------------- 671 693 715 Benzene------------------ 572 519 580 Kethanol-7----~-----~---- NA NA 1,670 A!nmonia~ anhydrous~------ ·2,654 ·2,508 2;888 Urea---7~----------~----- NA 1,231 1,445
Kost Canadian firms rebounded in 1983 from the downturn in production recorded in 1982. The increase in production was attributed to increased demand from Canada's trading partners, primarily the united States. ~I-
Capacity.utilization for the Canadian industries was improved in 1983. Petrochemical plants in.eastern Canada which employ refined petroleum as feedstocks operated at lower rates than those using natural gas in the western part of the country. ~I
Regardless of the economic setbacks suffered by the Canadian petrochemical industries in 1982, most planned projects have continued to be developed. By 1990, Canada still wants to double its share of the world market for certain commodity petrochemicals.. If the industt·y can convince the Provincial and Federal Governments that a new energy policy is essential to bolster their world trade position, the Canadian petrochemical industry, based· on Canadian· natural gas resources, is.expected to become formidable competitors in international trade. II
!I "Adaptability Urged For Canada's Economy," Chemical & Engineering News, Jan. 16, 1984, pp. 28-30.
21 Petrochemical industry Task force Report, February :1984. 'JI Ibid. 41 Compiled from .official statistics of ·statistics Canada. · 51 Ibid. 61 "Adaptabilit:,y.Urged For Canada's Economy," Chemical & Engineering News,
Jan. 16, 1984, pp. 28-30 .. · 71 Petrochemical Industry Task Force Report, February 1984.
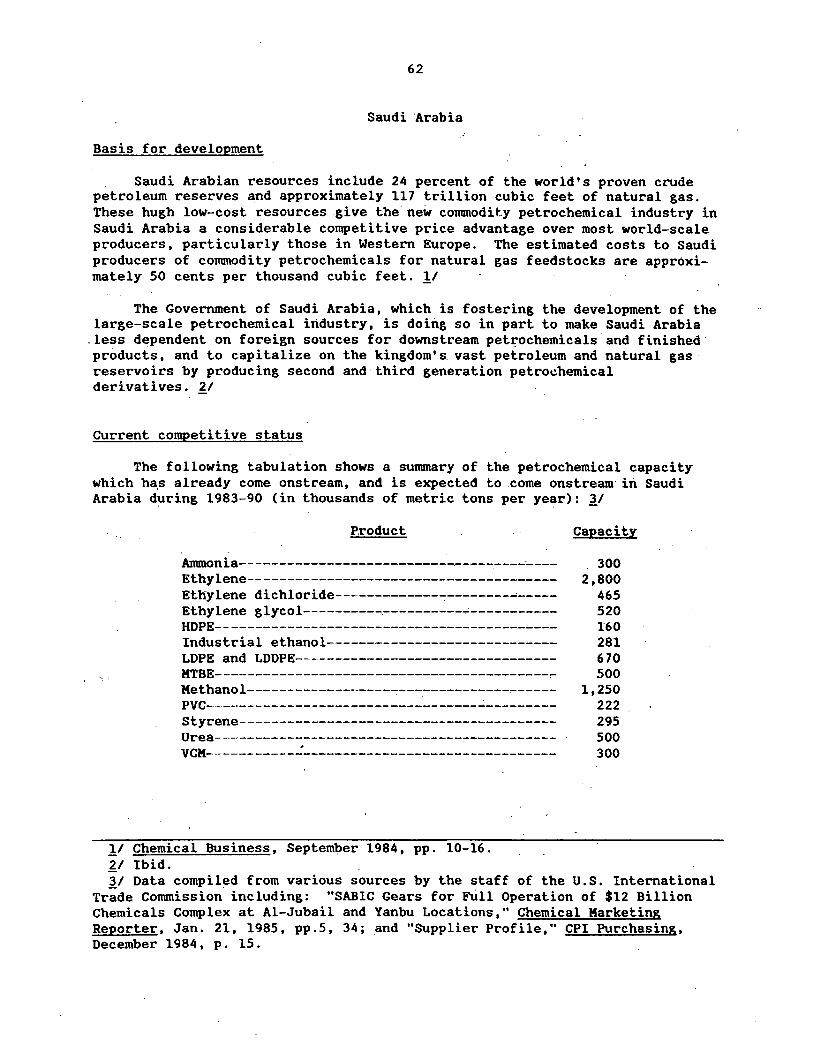
62
Saudi Arabia
Basis for development
Saudi Arabian resources include 24 percent of the world's proven crude petroleum reserves and approximately 117 trillion cubic feet of natural gas. These hugh low-cost resources give the· new conunodit.y petrochemical industry in Saudi Arabia a considerable competitive price advantage over most world-scale producers, particularly those in Western Europe. The estimated costs to Saudi producers of conunodity petrochemicals for natural gas feedstocks are approximately 50 cents per thousand cubic feet. 11
The Government of Saudi Arabia, which is fostering the development of the large-scale petrochemical industry, is doing so in part to make Saudi Arabia
.less dependent on foreign sources for downstream pet~ochemicals and finished· products, and to capitalize on the kingdom's vast petroleum and natural gas· reservoirs by producing second and third generation petro~hemical derivatives. ~/
Current competitive status
The following tabulation shows a sununary of the petrochemical capacity which ha,s already come onstream, and is expected to come onstream· in Saudi Arabia during 1983-90 (in thousands of metric tons per year): }/
"·.
Product
Antmonia---------------------------.---------·---Ethylene-- -------------------------------------Ethylene dichloride-------------~-~------~-----Ethylene glycol---------------------..: __________ _ HDPE-------------------------------------------Industrial ethanol----------------------------LDPE and LDDPE---------------------------------HTBE------------------------------------------~ Hethanol----------------------------------,-----PVC----------------------------------~--------Styrene---------------------------------------Urea-------------------------------~----------
VCH------------~--------------------------------
11 Chemical Business, September 1984, pp. 10-16. 21 Ibid.
Capacity
300 2,800
465 520 160 281 670 500
1,250 222 295 500 300
'J_/ Data compiled from various sources by the staff of the U.S. International Trade Conunission including: "SABIC Gears for FUll Operation of $12 Billion Chemicals Complex at Al-Jubail and Yanbu Locations," Chemical Marketing Reporter, Jan. 21, 1985, pp.5, 34; _and "Supplier Profile," CPI Purchasing, December 1984, p. 15.
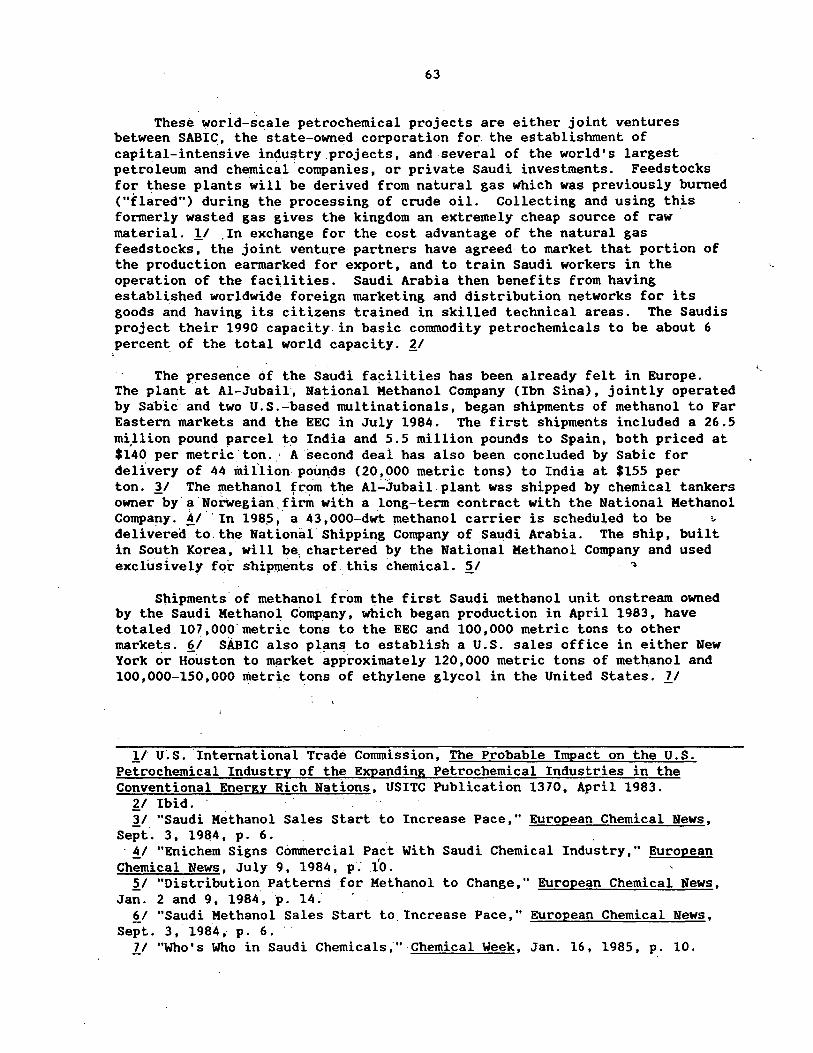
63
These world-scale petrochemical projects are either joint ventures between SABIC, the state-owned corporation for. the establishment of capital-intensive industry projects, and several of the world's largest · petroleum and chemical.companies, or private Saudi investments. Feedstocks for these plants will be derived from natural gas which was previously burned ("fl~red") during the processing of crude oil. Collecting and using this formerly wasted gas gives the kingdom an extremely cheap source of raw material. !I .In exchange for the cost advantage of the natural gas feedstocks, the joint ventu.re partners have agreed to market that portion of the production earmarked for export, and to train Saudi workers in the operation of the facilities. Saudi Arabia then benefits from having established worldwide foreign marketing and distribution networks for its goods and having its citizens trained in skilled technical areas. The Saudis project their 1990 capacity in basic commodity petrochemicals to be about 6 percent of the total world capacity. !I
The presence of the Saudi facilities has been already felt in Europe. The plant at Al-Jubail·, National Methanol Company (Ibn Sina), jointly operated by sa:blc" and two U.S._;based multinationals, began shipments of methanol to Far Eastern markets and the EEC in July 1984. The first shipments included a 26.5 million pound parcel t~ India and 5.5 million pounds to Spain, both priced at $i40 per metric· ton. ··.A s.econd deal has also been concluded by Sabic for delivery of 44 miflion· poirn~ds (20,000 metric tons) to India at $155 per ton. i1 The i:nethanol from the Al..:.:Jubail.plant was shipped by chemical tankers owner by· a ·Norwegian._firm with a long-term contract with the National Methanol Company. ~/"In 1985, a 43 ,000-dWt methanol carrier is schedu],.ed to be " delivered to.the National.Shipping Company of Saudi Arabia. The ship, built in South Korea, will be. chartered by the National Methanol Company and used exclU.sively for shipi:nents of this chemical. ~/ -i
Shipments of methanol from the first Saudi methanol unit onstrearn owned by the Saudi Methanol Comp_any, which began production in April 1983, have totaled 107,000 metric tons to the EEC and 100,000 metric tons to other markets. 6/ SABIC also plans to establish a U.S. sales office in either New York or Houston to ll\ilrket approximately 120,000 metric tons of met~anol and 100,000-150,000 metric tons of ethylene glycol in the United States. ll
!I U~S. International Trade Conunission, The Probable Impact on the U.S. Petrochemical Industry of the Expanding Petrochemical Industries in the Conventional Energy Rich Nations, USITC Publication 1370, April 1983.
!I Ibid. . . it. "Saudi Methanol Sales Start to Increase Pace," European Chemical News,
Sept. 3, 1984, p. 6. . · 4/ "Enichem Signs Commercial Pact With Saudi Chemical Industry," European
Ch;mical News, July 9, 1984, p: 1'0. ~/ "Distribution_ Patterns for Methanol to Change," European Chemical News,
Jan. 2 and 9, 1984, p. 14. !!_I "Saudi Methanol Sales Start to. Increase Pace," European Chemical News,
Sept. 3, 1984, p. 6. ll "Who's Who in Saudi Chemicals,"·Chemical Week, Jan. 16, 1985, p. 10.
<.
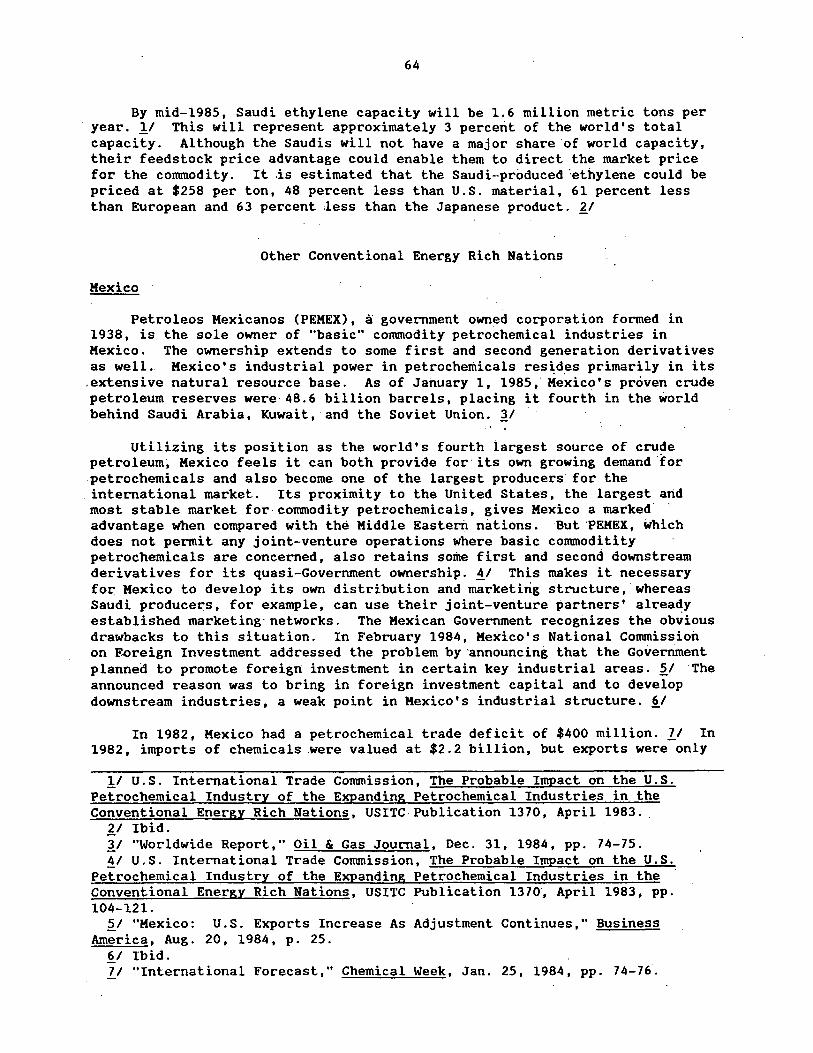
64
By mid-1985, Saudi ethylene capacity will be 1.6 million metric tons per year. 11 This will represent approximately 3 percent of the world's total capacity. Although the Saudis will not have a major share·of world capacity, their feedstock price advantage could enable them to direct the market price for the comrnodity. It .is estimated that the Saudi-produced :ethylene could be priced at $258 per ton, 48 percent less than U.S. material, 61 percent less than European and 63 percent :less than the Japanese product. ~/
Other Conventional Energy Rich Nations
Mexico
Petroleos Mexicanos (PEMEX), a government owned corporation formed in 1938, is the sole owner of "basic" commodity petrochemical industries in Mexico. The ownership extends to some first and second generation derivatives as well. Mexico's industrial power in petrochemicals resides primarily in its
.extensive natural resource base. As of January 1, 1985, Mexico's proven crude petroleum reserves were·48.6 billion barrels, placing it fourth in the world behind Saudi Arabia, Kuwait, ·and the Soviet Union. 11
Utilizing its position as the world's fourth largest source of crude petroleum, Mexico feels it can both provide for· its own growing demand 'for petrochemicals and also become one of the largest producers· for the
. international market. Its proximity to the United States, the largest atid most stable market for conunodity petrochemicals, gives Mexico a marked advantage when compared with the Middle Eastern nations. But 'PEMEX, which does not permit any joint-venture operations where basic comrnoditity petrochemicals are concerned, also retains some first and second downstream derivatives for its quasi-Government ownership. ii This makes it necessary fo~ Mexico to develop its own distribution and marketing structure, whereas Saudi producers, for example, can use their joint-veriture partners' alrea~y established marketing· networks. The Mexican Government recognizes the obvious drawbacks to this situation. In February 1984, Mexico's National Commission on F~reign Investment addressed the problem by ·announcing that the Government planned to promote foreign investment in certain key industrial areas. ~I The announced reason was to bring in foreign investment capital and to develop downstream industries, a weak point in Mexico's industrial structure. ~I
In 1982, Mexico had a petrochemical trade deficit of $400 million. ll In 1982, imports of chemicals .were valued at $2.2 billion, but exports were only
11 U.S. International Trade Commission, The Probable Impact on the U.S. Petrochemical Industry of the Expanding Petrochemical Industries in the Conventional Energy Rich Nations, USITC·Publication 1370, April 1983.
~I Ibid. 11 "Worldwide Report," Oil & Gas Journal, Dec. 31, 1984, pp. 74-75. ii U.S. International Trade Commission, The Probable Impact on the U.S.
Petrochemical Industry of the Expanding Petrochemical Industries in the · Conventional Energy Rich Nations, USITC Publication 1370, April 1983, pp. 104-121.
2_1 "Mexico: U.S. Exports Increase As Adjustment Continues," Business America, Aug. 20, 1984, p. 25.
~I Ibid. 71 "International Forecast," Chemical Week, Jan. 25, 1984, pp. 74-76.
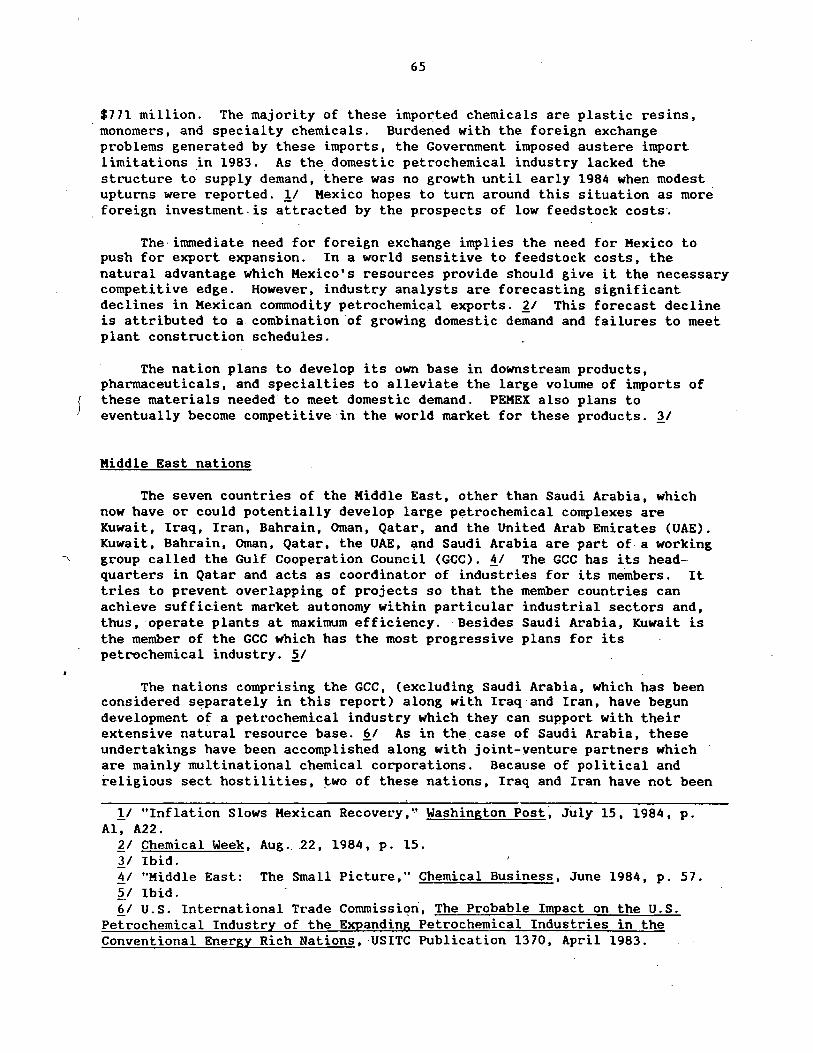
65
$771 million. The majority of these imported chemicals are plastic resins, ·monomers, and specialty chemicals. Burdened with the foreign exchange
problems generated by these imports, the Government imposed austere import limitations .in 1983. As the. domestic petrochemical industry lacked the structure to supply demand, there was no growth until early 1984 when modest upturns were reported. !I Mexico hopes to turn around this situation as more foreign investment. is attracted by the p.rospects of low feedstock costs-.
The inunediate need for foreign exchange implies the need for Mexico to push for export expansion. In a world sensitive to feedstock costs, the natural advantage which Mexico's resources provide should give it the necessary competitive edge. However, industry analysts are forecasting significant declines in Mexican conunodity petrochemical exports. 'l,_/ This forecast decline is attributed to a combination ·of growing domestic demand and failures to meet plant construction schedules.
The nation plans to develop its own base in downstream products, pharmaceuticals, and specialties to alleviate the large volume of imports of these materials needed to meet domestic demand. PEMEX also plans to eventually become competitive in the world market for these products. 11
Middle East nations
The seven countries of the Middle East, other than Saudi Arabia, which now have or could potentially develop large petrochemical complexes are Kuwait, Iraq, Iran, Bahrain, Oinan, Qatar, and the United Arab Emirates (UAE). Kuwait, Bahrain, Oinan, Qatar, the UAE, ~nd Saudi Arabia are part of. a working
' group called the Gulf Cooperation Council (GCC). !!I The GCC has its headquarters in Qatar and acts as coordinator of industries for its members. It tries to prevent overlapping of projects so that the member countries can achieve sufficient market autonomy within particular industrial sectors and, thus, operate plants at maximum efficiency. Besides Saudi Arabia, Kuwait is the member of the GCC which has the most progressive plans for its petC'Ochemical industry. ~/
The nations comprising the GCC, (excluding Saudi Arabia, which has been considered separately in this report) along with Iraq and Iran, have begun development of a petrochemical industry which they can support with their extensive natural resource base. ~/ As in the case of Saudi Arabia, these undertakings have been accomplished along with joint-venture partners which are mainly multinational chemical corporations. Because of political and religious sect hostilities, ~WO of these nations, Iraq and Iran have not been
!I "Inflation Slows Mexican Recovery,•• Washington Post~ July 15, 1984, p. Al, A22.
~I Chemical Week, Aug. 22, 1984, p. 15. 31 Ibid. fl/ "Middle East: The Small Picture," Chemical Business, June 1984, p. 51. ii Ibid. 6/ U.S. International Trade Commissi~n, The Probable Impact on the U.S.
Petrochemical Industry of the Expanding Petrochemical Industries in the Conventional Energy Rich Nations, USITC Publication 1370, April 1983.
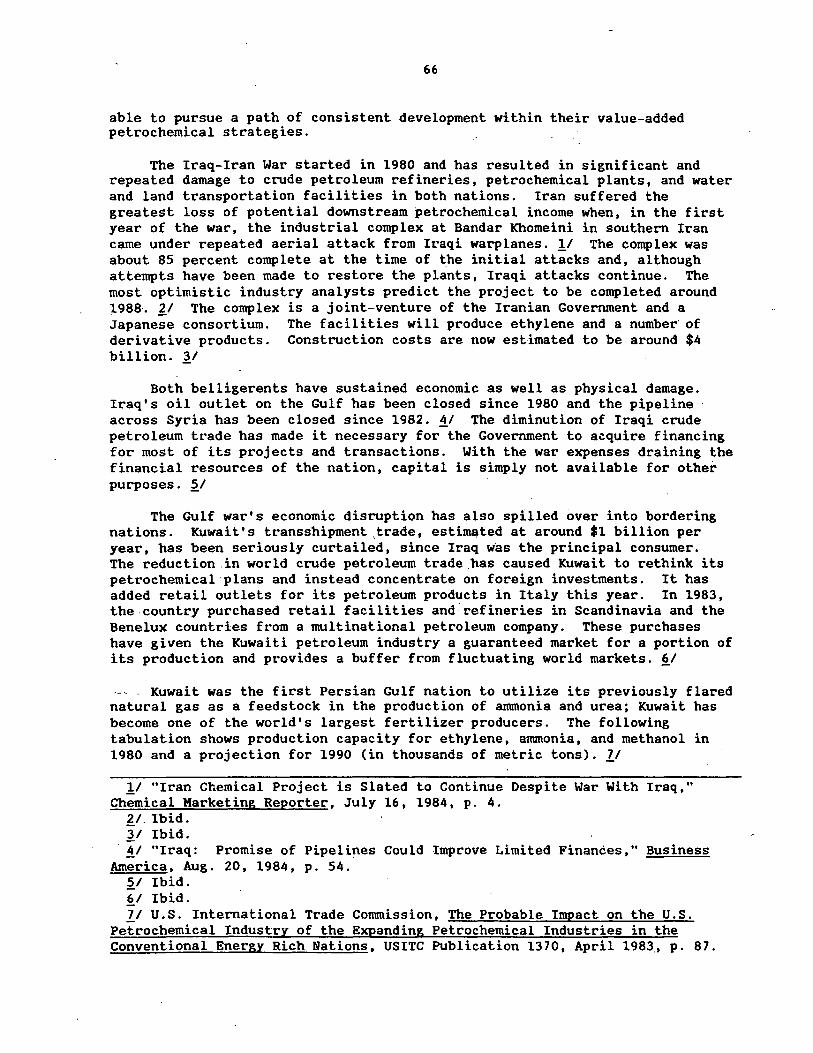
66
able to pursue a path of consistent development within their value-added petrochemical strategies.
The Iraq-Iran War started in 1980 and has resulted in significant and repeated damage to crude petroleum refineries, petrochemical plants, and water and land transportation facilities in both nations. Iran suffered the greatest loss of potential downstream petrochemical income when, in the first year of the war, the industrial complex at Bandar Khomeini in southern Iran came under repeated aerial attack from Iraqi warplanes. 11 The complex was about 85 percent complete at the time of the initial attacks and, although attempts have been made to restore the plants, Iraqi attacks continue. The most optimistic industry analysts predict the project to be completed around 1988·. ·~/ The complex is a joint-venture of the Iranian Government and a Japanese consortium. The facilities will produce ethylene and a number· of derivative products. Construction costs are now estimated to be around $4 billion .. ~/
Both belligerents have sustained economic as well as physical damage. Iraq's oil outlet on the Gulf has been closed since 1980 and the pipeline across Syria has been closed since 1982. ii The diminution of Iraqi crude petroleum trade has made it necessary for the Government to acquire financing for most of its projects and transactions. With the war expenses draining the financial resources of the nation, capital is simply not available for other purposes. ~I
The Gulf war's economic disruption has also spilled over into bordering nations. Kuwait's transshipment ,trade, estimated at around $1 billion per year, has been seriously curtailed, since Iraq was the principal consumer. The reduction.in world crude petroleum trade has caused Kuwait to rethink its petrochemical plans and instead concentrate on foreign investments. It has added retail outlets for its petroleum products in Italy this year. In 1983, the country purchased retail facilities and refineries in Scandinavia and the Benelux countries from a multinational petroleum company. These purchases have given the Kuwaiti petroleum industry a guaranteed market for a portion of its production and provides a buffer from fluctuating world markets. ii
...... Kuwait was the first Persian Gulf nation to utilize its previously flared natural gas as a feedstock in the production of anunonia and urea; Kuwait has become one of the world's largest fertilizer producers. The following tabulation shows production capacity for ethylene, ammonia, and methanol in 1980 and a projection for 1990 (in thousands of metric tons). ll
11 "Iran Chemical Project is Slated to Continue Despite War With Iraq," Chemical Marketing Reporter, July 16, 1984, p. 4.
~I. Ibid. ~I Ibid.
· ii "Iraq: Promise of Pipelines Could Improve Limited Finances," Business America, Aug. 20, 1984, p. 54.
~I Ibid. ii Ibid. ll U.S. International Trade Conunission, The Probable Impact on the U.S.
Petrochemical Industry of the Expanding Petrochemical Industries in the Conventional Energy Rich Nations, USITC Publication 1370, April 1983., p. 87.
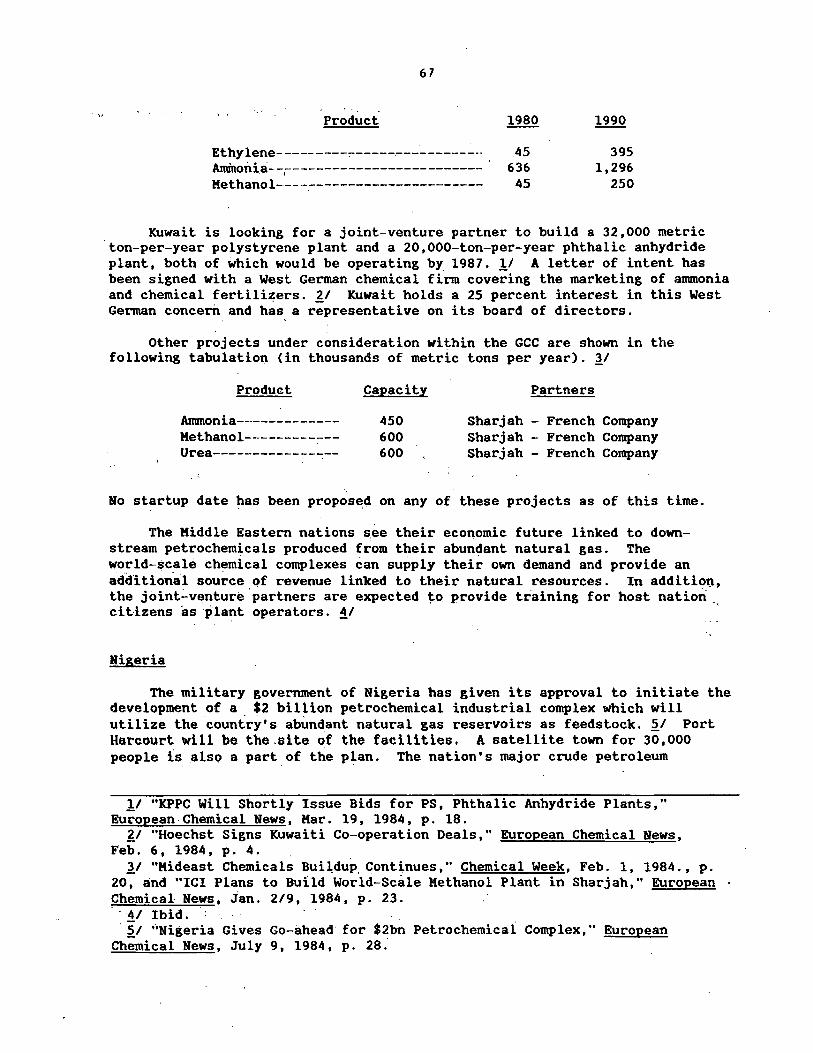
. "
67
Product
Ethylene---.,-------:------------------ . 45 Ammoni.a- -.------------------------- · 6 36 Methanol-------------------------- 45
395 1,296
250
Kuwait is looking for a joint-venture partner to build a 32,000 metric ·ton-per-year polystyrene plant and a 20,000-ton-per-year phthalic anhydride plant, both of which would be operating by 1987. !I A letter of intent has been signed with a West German chemical firm covering the marketing of anunonia and chemical fertili~ers. ZI Kuwait holds a 25 percent interest in this West German concern and has a representative on its board of directors.
Other projects under consideration within the GCC are shown in the following tabulation (in thousands of metric tons per year). ll
Product
Anunonia-------------Kethanol--------:-:--Urea-------~-----:---
Capacity
450 600 600
Partners
Sharjah - French Company Sharjah - French Company Sharjah - French Company
No startup date ~as been propos~d on any of these projects as of this time.
The Kiddle Eastern nations s.ee their economic future linked to downstream petrochemicals produced from their abun~ant natural gas. The world-scale chemical complexes can supply their own demand and provide an additional source of revenue linked to their natural resources. In addition, the joint~venture'partners are expected ~o provide training for host nation citizens as ·plant.operators. !I
Nigeria
The military government of Nigeria has given its approval to initiate the development of a . $2 billion petrochemical industrial complex which will utilize the country's abund.ant natural gas reservoirs as feedstock. ~/ Port Harcourt will be the.site of the facilities. A satellite town for 30,000 people ts also a part of the plan. The nation's major crude petroleum
!I "KPPC Will Shortly Issue Bids for-PS, Phthalic Anhydride Plants," European Chemical News, Kar. 19, 1984, p. 18.
£1 "Hoechst Signs Kuwaiti Co-operation Deals," European Chemical News, Feb. 6, 1984, p. 4. ll "Mideast Chemicals Buil,dup. Continues," Chemical Week, Feb. 1, 1984., p.
20, and "IC! Plans to Build World-Sc8le Methanol Plant in Sharjah," European Chemical News, Jan. 2/9, 1984, p. 23 . . - !I Ibid.
~I ''Nigeria Gives Go-ahead· for $2bn Petrochemical Complex," European Chemical News, July 9, 1984, p. 2a:
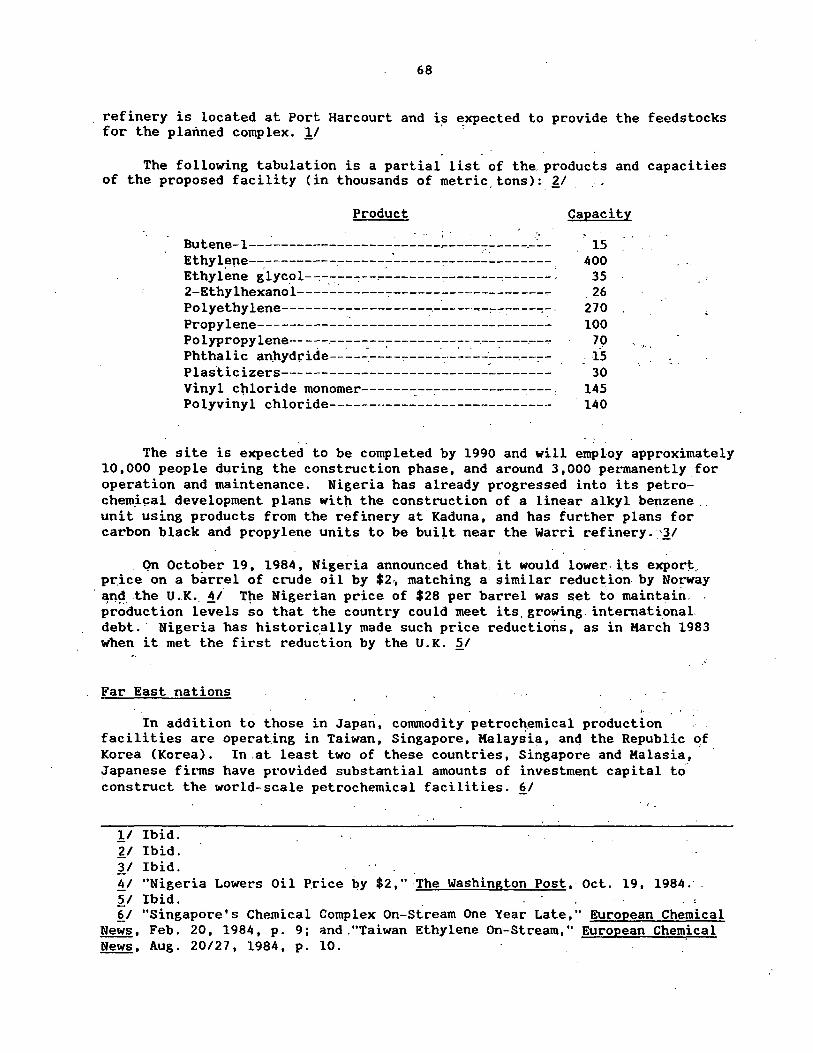
68
refinery is located at Port Harcourt and is ~xpected to provide the feedstocks for the planned complex. !/
The following tabulation is a partial list of the. products and capacities of the proposed facility (in thousands of metric. tons): ~/
Product . ' .
Butene-1------------------------------"7 _______ :__ Ethylene------------------· ____________ :__:._ ______ _
'.. . . . '
Ethylene glycol--:-.-:--"'.'--,..-------:--------:------. 2-Ethylhexanol------------:-----------·---------.,.. Po lye thy lene-------------------.-·-- ---...,-:--:------;- . Propylene-----------~-------------------------Po lypropy lene-- --------------------- -------.--:.,. PhthaliC an.hydride--:__ _ _: __ :__.,..-----:-·-:__: __ :-.:..--:--:--Plasticizers---------------------------------Vinyl cploride monomer------~--:---------------, Polyvinyl chloride----------------------------
Capacity
15 400
35 26
270 100
70 . 15
30 145
. 140
·. •/,,
The site is expected to be completed by 1990 and will employ approximately 10,000 people during the construction phase. and around 3,000 permanently for operation and maintenance. Nigeria has already progressed into its petrochem_i~al development plans with the construction of a linear alkyl benzene .. unit using products from the refinery at Kaduna. and has further plans for carbon black and propylene units to be buiit near the Warri refinery. ·~/
Qn October 19. 1984. Nigeria announced that. it would lower. its export-_ price on a barrel of crude oil by $2-. matching a similar reduction by Norway
· ~ri.!3 .. the U.K .. ~_/ ~e Nigerian price of $28 per barrel was set to maintain .. production levels so that the country could meet its. growing. internati_onal. debt.· Nigeria has historically made such price reductions, as in March 1983 when it met the first reduction by the U.K. ~/
Far East nations
In addition to those in Japan. conunodity petroc~emical production facilities are operat.ing in Taiwan. Singapore, Malaysia, and the Republic of Korea (Korea). In at least two of these countries, Singapore and Malasia, Japanese firms have provided substantial amounts of investment capital to construct the world-scale petrochemical facilities. §_/
]J Ibid. ~I Ibid. '}_/ Ibid. fl/ "Nigeria Lowers Oil P.rice by $2," ·The Washington Post, Oct. 19, 1984.·. ~I Ibid. . . §_/ "Singapore's Chemical Complex On-Stream One Year Late," European Chemical
News. Feb. 20, 1984. p. 9; and ."Taiwan Ethylene On-Stream," European Chem_ical News, Aug. 20/27, 1984, p. 10.
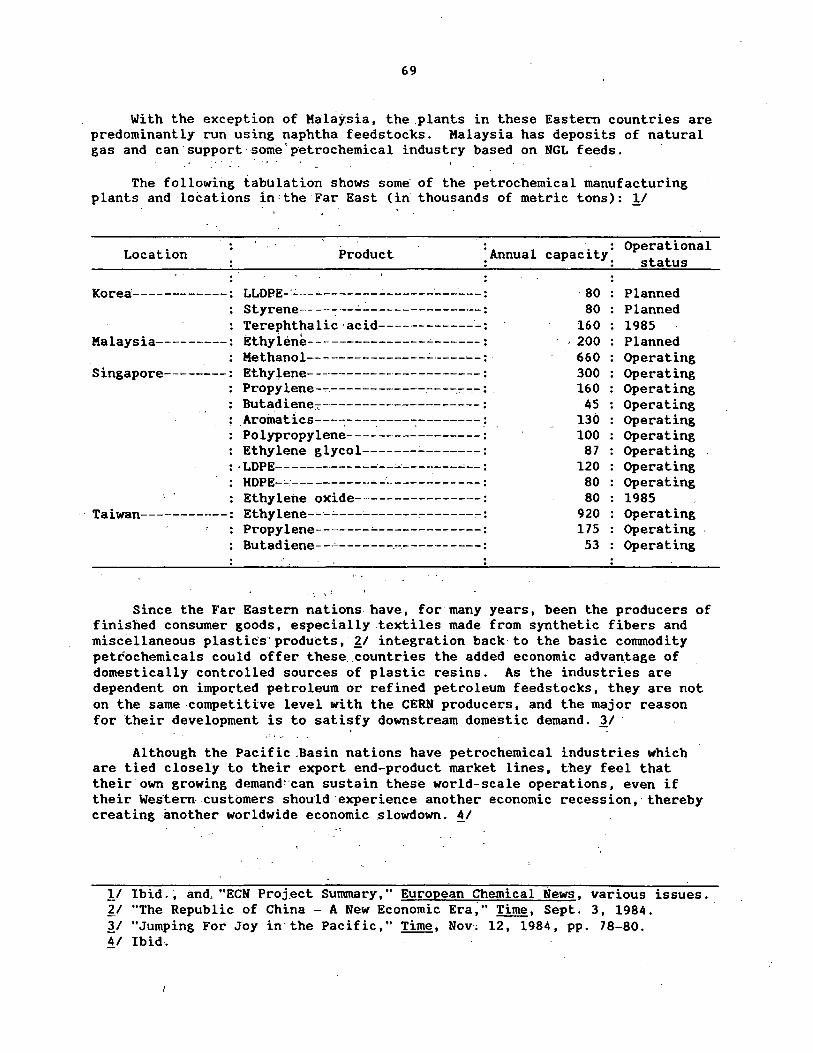
69
With the exception of Malaysia, the plants in these Eastern countries are predominantly run using naphtha feedstocks. Malaysia has deposits of natural gas and can· support· some' p·etrochemical industry based on NGL feeds.
The following tabulation shows some of the petrochemical manufacturing plants and locations in:the Far East (in thousands of metric tons): !I
Location Product Operational
:Annual capacity· status
Korea------------: LLOPE-·..:. ___ .;_ ______________ . ___ . ___ : 80 Planned Styrene----~--.:..---------------: 80 Planned Terephthalic ·acid--------------: 160 1985
Malaysia---------: Ethyiene---------------~------: 200 Planned Methanol---------------.:..------: 660 Operating
Singapore--------: Ethylene---·--------------------: 300 Operating Propylene-.,.-.------------,----:--:-: 160 Operating Butadiene:;:---------------------: 45 Operating Aromatics---~---~----~--------: 130 Operating Polypropylene-----------------: 100 Operating Ethylene glycol---------------: 87 Operating
: -LOPE----------------:...·--------'--: 120 Operating HOPE-'-:----------.:..-'------------: 80 Operating Ethylene oxide--··---------------: 80 1985
Taiwan-----------: Ethylene-'---"----'-------,-------,.-: 920 Operating Propylene-------'--------------: 175 Operating Butadiene---~---------- ----- ----: 53 Operating
Since the Far Eastern nations. have, for many years, been the producers of finished consumer goods, especially textiles made from synthetic fibers and miscellaneous plasties·products, £!integration back· to the basic corranodity petrochemicals could offer these .countr_ies the added economic advantage of domestically controlled sources of plastic resins. As the industries are dependent on imported petroleum or refined petroleum feedstocks, they are not on the same competitive level with the CERN producers, and the major reason for "their development is to satisfy downstream domestic demand. 'J.I ·
Although the Pacific.Basin nations have petrochemical industries which are tied closely to their export end-product market lines, they feel that their own growing demand!·can sustain these world-scale operations, even if their Wes·tern .customers should ·experience another economic recession,· thereby creating another worldwide economic .slowdown. !I
!I Ibid.~ and .. "ECN Proj_ect Surranary," European Chemical News, various issues. 21 "The Republic of China - A New Economic Era~" Time, Sept. 3, 1984. 'J.I "Jumping For Joy in· the Pacific," Time, Nov·; 12, 1984, pp. 78-80. 4/ Ibid.
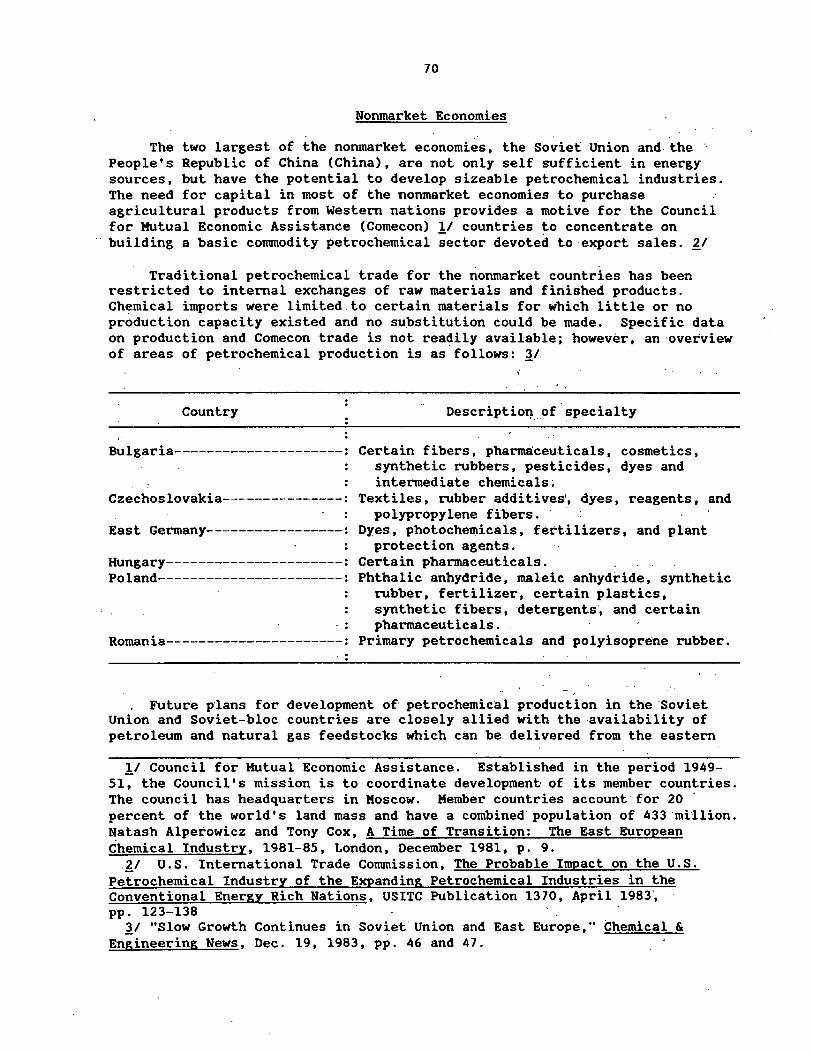
70
Norunarket Economies
The two largest of the nonmarket economies, the Soviet Union and, the People's Republic of China (China), are not only self sufficient in energy sources, but have the potential to develop sizeable petrochemical industries. The need for capital in most of the norunarket economies to purchase agricultural products from Western nations provides a motive for the Council for Mutual Economic Assistance (Comecon) 1/ countries to concentrate on building a basic commodity petrochemical ;ector devoted to export sales. ~/
Traditional petrochemical trade for the nonmarket countries has been restricted to internal exchanges of raw materials and finished products. Ch~mical imports were limited to certain materials for which little or no production capacity existed and no su~stitution could be made. Specific data on production and Comecon trade is not readily available; however, an ·overview of areas of petrochemical production is as follows: 11
Country Description of.specialty
Bulgaria---------------------: Certain fibers, pharmaceuticals, cosmetics, synthetic rubbers, pesticides, dyes and intermediate chemicals;
Czechoslovakia---------------: Textiles, rubber additives', dyes, reagents, and polypropylene fibers.
East Germany-----------------: Dyes, photochemicals, fertilizers, and plant protection agents.
Hungary----------------------: Certain pharmaceuticals. Poland-----------------------: Phthalic anhydride, maleic anhydride, synthetic
rubber, fertilizer, certain plastics, synthetic fibers, detergents·, and certain pharmaceuticals.
Romania----------------------: Primary petrochemicals and polyisoprene rubber.
Future plans for development of petrochemic·a1 production in the Soviet Union and Soviet-bloc countries are closely allied with the availability of petroleum and natural gas feedstocks which can be delivered from the eastern
],/.Council for Mutual Economic Assistance. Established in the period 1949-51, the Council's mission is to coordinate developmenb of its member countries. The council has headquarters in Moscow. Member countries account·for 20 percent of the world's land mass and have a combined population of 433'mHlion. Natash Alperowicz and Tony Cox, A Time of Transition: The East European Chemical Industry, 1981-85, London, December 1981, p. 9 .
. ~/ U.S. International Trade Commission, The Probable Impact on the U.S. Petrochemical Industry of the Expanding Petrochemical Industries in the Conventional Energy Rich Nations, US ITC Publication 13 70, April 1983', pp. 123-138 . '
31 "Slow Growth Continues in Soviet.Union and East Europe," Chemical & Engineering News, Dec. 19, 1983, pp. 46 and 47.
71
. . Soviet Union Via a r~cen:tly installed system of pipelines. The council has recomn\itted it'self to improving the quality of industrial production within its membership. l/ . . . -
Soviet Union
The Soviet Un1on has large deposits of minerals, crude petroleum, natural gas and coa'l. The Soviet Union's proven crude petroleum reserves are estimated to be approximately 63 trillion barrels; Soviet Union natural gas reserves, which represent more than one-third of the world's proven reserves, total approximately 1.45 quadrillion cubic feet. i1 At current production rates, these reserves could provide the Soviets with a 70-year supply of natural gas.
It has been the policy of the Soviet Union to preferentially provide its allies with low-cost crude petroleum. However, with production costs rising and an increasing need for hard currency, more crude petroleum is being allocated for sale to Western markets. 3/ Soviet-produced natural gas is also . . - , b~ing diverted to the Western nations in order to increase currency reserves. The Siberian pipeline, which began operation on January 1, 1984, is expected to bring an estimated 35 billion cubic feet of natural gas into Western Europe in 1984. !I
The Soviet Union's chemical industry is estimated to be the fourth largest in the world. ~/ Production problems associated with outdated facilities have been mainly responsible for the industry's historical performance. §:./ A second cause has been the lack of cooperation between various Government ministries.that must work together to construct plants and assure their continued operation. One such examj>le is the proposed ethylene and formalin plants at the Tomsk petrochemical complex. 11 A' . .
11 O.s. International Trade Commission, The Probable Impact on the U.S. Petrochemical Industry of the Expanding Petrochemical Industries in the Conventional Energy Rich Nations, USITC Publication 1370, April 1983, pp. 123-138 .
~./ "CHEA Summit Offers Few Solutions to Region's Problems," Business America~ Aug. · 20. 1984 • pp. · 18-20.
'JI "Worldwide Report," Oil &'Gas Journal, Dec. 3l, 1984, pp. 73-74. !I New York Times, Sept. 17, 1984, p. 6. ~/ "Soviet Gas Pipeline" to Europe Starts Up," Chemical and Engineering News,
Jan. 30~ 1984, p. 18. §:./ "Ethylene and Formalin Plants at the Tomsk Petrochemical Complex Have
Been Hit by Serious Delays," European Chemical News, Sept. 26, 1983, p. 21. §:./Newspaper Enterprise Association, Inc., The World Almanac and Book of
Facts: 1982, 1981, p. 587 . . -11 "Soviets Could Drown World in Petroleum With Properly Upgraded
Technology," Hydrocarbon Processing, January 1984, p. 23.
72
The Soviet Union, even with the problems associated ·with outdated technology, did show a 6 percent increase in chemical and petrochemical production in 1983 compared with production in 1982. 1/ The following tabulation shows the production.volume of certain pet~ochemical products in 1983 and the increase compared with production in 1982 (in thousands of metric tons): '/:_/
Fertilizers------------Pesticides-------------Plastics---------------Synthetic fibers---------Detergents--:... ________ _: __
29,700 600
4,400 1,400 1,100
Production increase 1982 to .1983
Percent
·11 4 9
10 3 ..
The Soviets are aware of the. problems facing their petrochemical industry and have set goals to upgrade and expand their production to satisfy Comecon demand and increase exports to Western countries, especially in the area of . basic conunodity petrochemicals. Modernization of some synthetic fibers plants has also been planned in cooperation with a major British fibers producer .. ~/ The Soviet Union also is continuing to plan and build new facilities for petrochemicals conunodities. !I
People's Republic of China
Although deposits of crude petroleum and natural gas are known to exist in 'People's Republic of China (China), very little is known about the exten~ of these deposits. Recently, two Western energy companies have located crude petroleum in the South China Sea, and another We~tern·company has discovered an offshore field.of natural gas.~/
.. In keeping with China's demand for agricultural products, China's fertilizer production was 13.8 million metric tons in 1983, and 1984 production will be even greater. §_/ China is the third largest producer of fertilizers behind the United States and the Soviet Union. During the past 34 years, China• s chemical fertilizer production 'has grown by .28 percent per year, and China now has more than 1,300 chemical fertilizer plants. New petrochemical complexes, such as the expansion proposed in Shanghai and
1/ "Chemical and Petrochemial output Rose 63 in 1983 vs 1982," European Chemical News, Feb. 13, 1984, p. 10.
'/:_/ Europa Chemie, Feb. 23, 1984, p. 85. '}_/ "USSR Chemical Plants Moderniz~d by Courtaulds," Chemical Marketing
Reporter, Aug. 13, 1984, p. 11. !I "Soviet Union Revives Major Acrylates Project in Dzerzhinsk," European
Chemical News, Mar. 26, 1984, p. 22, and "Tecnimont Wins Order to Build Soviet Polycarbonates Plant," European Chemical News, Mar. 5, 1984, p. 18.
~I "Arco Chinese Plan," European Chemical News, Sept. 24, 1984, p. 26. 6/ Beijing Review.
73
Zhenha,i ,. incl~d.e pJ~ri~s._ ~o. prod~.ce. ·:3,00 ,.000.;met.~ic tons _per- year -of ammonia and . ,5A<?-.~~.OO · rcu~.t:r.ic. to,ns .. p~~ ye~r. o,t u~~.a. !I, :· > . · · , .. •· · . . . •
. ' : .~ - , . ; ., . • .. ; i .. . . . : • . . \: • : . ..... . .
Fertilize~ d~mand i~ o~iy one area where basic petrochemicals have potential growth in China. Industrialization on a Western seal~ is just beginning, and the basic substitution of products made using commodity petrochemicals replacing items made by traditional "cottage industries" has also begun. ~/ The new petrochemicals complex expansions at Shanghai will house a 300,000 metric ton per year polyester plant, while 3 plants located at Jianjsu, Shangdong, and Daqing will produce 300,000 metric tons per year of ethylene. 11 ~hina's present capacities for some basic commodity petrochemicals are as follows (in thousands of metric tons per year): !I
Product
Ethylene----··--------------------Other plastics resins------------Polyolefins----------------------Syntheti.c rubber----------------- ---
Capacity
600 500 400 140
Proposed expansions of commodity petrochemical and petrochemical product capacity which are receiving high priority are shown in the following tabulation (in thousands of metric tons per year): ~/
Product
Polyethylene--------------------Polypropylene----------------Polyester--------------------Byproducts-------------------Certain Plastics-----~-------Synthetic Rubber--·-----------Intermediates----------------Other Petrochemicals----------
Location
Liaowang Liaowang Liaowang Liaowang Nanjing
Nanjing Nanjing
Capacity
70 70
130 300 200·
40 900
Even with the massive expansions and additions planned, Chinese demand will still exceed supply; therefore, Chinese consumers.are expected to depend on imports to supplement shortages and provide products not domestically produced. ~/ The overall planning and manage~ent is to be directed by China Petrochemical (Sinochem) acting on a ministerial level directly under the state council. The new agency must coordinate the development in line with the national goal of quadrupling gross domestic production by the end of this century. Certain moves have been made to accelerate the technology transfer
.!I "China: Has Ordered 42 Petrochemical Plants from the Western World as Part of a $3 Billion Expansion Programme Started in 1979," European Chemical News, Sept. 10, 1984, p. 4.
~/ Ibid. '}_/ Ibid. !I Chemical Week, Jan. 25, 1984, p. 73. 51 Ibid., pp~ 72-73. ~/-"Chinese· Leftists Take the ·•Free' OUt of Enterprise·,'' The Wall Street
Journal, Nov. 6, 1984.

74
.from firms in the Western world, but vestiges of a more austere China still remain. 11 In spite of some resistance, the Chinese Government seems conunitted to making the adjustments needed to modernize the Chinese industries. ll
11 Ibid. ~I Ibid.
75
U.S. PETROCHEMICAL INDUSTRY STRATEGIES
The process of strategic planning within the U.S. chemical industry has become increasingly more important as production cost and feedstock availability advantages migrate from the United States and other traditional conunodity petrochemical producers to conventional energy-rich developing regions of the world. The development of the strategic planning process itself occurred in the United States, and is most often attributed to Robert McNamara, then an executive with a major U.S. automobile manufacturer. !I His belief that short-term planning, as it was then practiced by the U.S. industry (through the 1940's) ·was beneficial to a limited extent, but that a group of planners solely dedicated to the mission of long-range forecasting should exist, adjacent to the line functions in the corporate structure, and act as advisors to the highest level of corporate management. Since the innovation of the strategic planning group, various methods designed to provide insight ·into the future have evolved, a few of which have proven to be better at forecasting than the others. However, the technical nature and bases for these methods precludes entering into any prolonged discussions concerning their derivations or the steps and processes used to accomplish their purposes. 'l:.I
A typical strategic p'ianning exercise needs to be undertaken in a logical, orderly fashion. Initially, strategic issues need to be properly identified. Misidentification inevitably leads to invalid reasoning and improper conclusions based on the misinformation. Methods of strategic issue identification include environmental scanning and monitoring of trends, and events or developments observed or reported in the media. ~/ These trends may be identified in the context of changes in the attitudes and behaviors of the general public; shifts in activities of groups such as stockholders, ~enders, employees, or competitors; and changes in fiscal or monetary policy. Often, changes in Government policy on either the Federal, State, or local l'evels key the awareness of industry to certain strategic issues. ~4/ Scientific and technical innovations.are also especially important indicators for any segment of the chemical industry to monitor.
The strategic planning function within a large corporation, such as a producer of conunodity petrochemi~als, should be separated from the economic forecasting' function within the same corporation. These functions, although often dependent on one another for information, need to be practiced independently, as the reliance of each function on different sets of assumptions and relationships between external factors can create inaccuracies. The planning function, which takes into consideration multiple responses'in the event of changes in certain underlying factors, could lose a significant portion of its valu~ if economic forecasts were accepted without greater examination of the contributing factors. ~/ The specific goals of the strategic planning function also need to be explicitly set so that an accurate
11 Peter Lorange and Richard Vancil, Strategic Planning Systems, 1977, pp. ix-xv.
'J:.I Ibid., pp. 139-150. ~I Lynn H~ Hall. Issues Management: Decision Support in the Context of
Environmental Uncertainty, presentation at Chemical Marketing Research Association Meeting, Sept. 22, 1980.
~/ Ibid. ~/ Peter F. Drucker, Management: Tasks, Responsibilities, Practices, pp.
121-12.9.
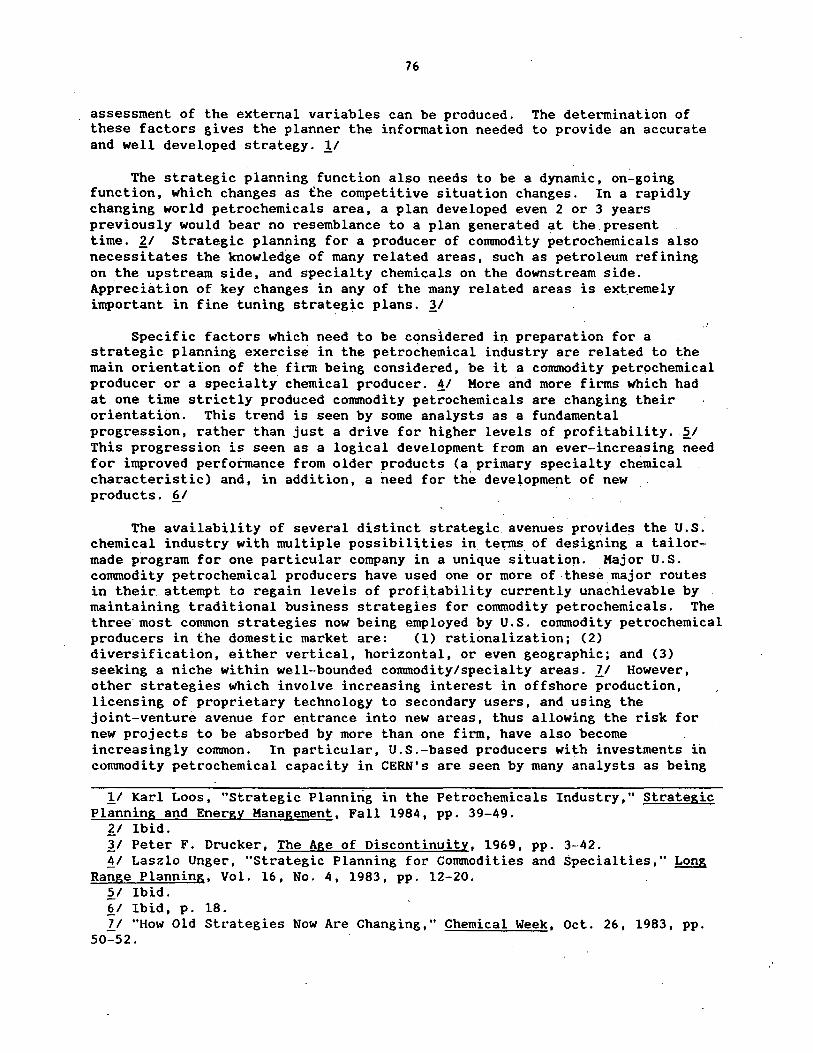
76
assessment of the external variables can be produced. The determination of these factors gives the planner the information needed to provide an accurate and well developed strategy. 11
The strategic planning function also needs to be a dynamic, on-going function, which changes as the competitive situation changes. In a rapidly changing world petrochemicals area, a plan developed even 2 or 3 years previously would bear no resemblance to a plan generated at the present time. £1 Strategic planning for a producer of commodity petrochemicals also necessitates the knowledge of many related areas, such as petroleum refining on the upstream side, and specialty chemicals on the downstream side. Appreciation of key changes in any of the many related areas is ex~remely important in fine tuning strategic plans. 11
.I
Specific factors which need to be considered in preparation for a strategic planning exercise in the petrochemical industry are related to the main orientation of the firm being considered, be it a commodity petrochemical producer or a specialty chemical producer. !I More and more firms which had at one time strictly produced commodity petrochemicals are changing their orientation. This trend is seen by some analysts as a fundamental progression, rather than just a drive for higher levels of profitability. ~/ This progression is seen as a logical development from an ever-increasing need for improved performance from older products (a primary specialty chemical characteristic) and, in addition, a need for the deveiopment of new . products. §_I
The availability of several distinct strategic. avenues provides the U.S. chemical industry with multiple possibilities in terms of designing a tailormade program for one particular company in a unique situatiori. Major U.S. commodity petrochemical producers have used one or more of these major routes in their. attempt to regain levels of prof~tability currently unachievable by maintaining traditional business strategies for commodity petrochemicals. The three most conunon strategies now being employed by U.S. commodity petrochemical producers in the domestic market are: (1) rationalization; (2) diversification, either vertical, horizontal, or even geographic; and (3) seeking a niche within well-bounded commodity/specialty areas. ll However, other strategies which involve increasing interest in offshore production, licensing of proprietary technology to secondary users, and using the joint-venture avenue for entrance into new areas, thus allowing the risk for new projects to be absorbed by more than one firm, have also become increasingly common. In particular, U.S.-based producers with investments in commodity petrochemical capacity in CERN's are seen by many analysts as being
!_I Karl Loos, "Strategic Planning in the Petrochemicals Industry," Strategic Planning and Energy Management, Fall 1984, pp. 39-49.
21 Ibid. 11 Peter F. Drucker, The Age of Discontinuity, 1969, pp. 3-42. 11 Laszlo Unger, "Strategic Planning for Commodities and Specialties," Long
Range Planning, Vol. 16, No. 4, 1983, pp. 12-20. ~I Ibid. §_I Ibid, p. 18. 71 "How Old Strategies Now Are Changing," Chemical Week, Oct. 26, 1983, pp.
50-52.
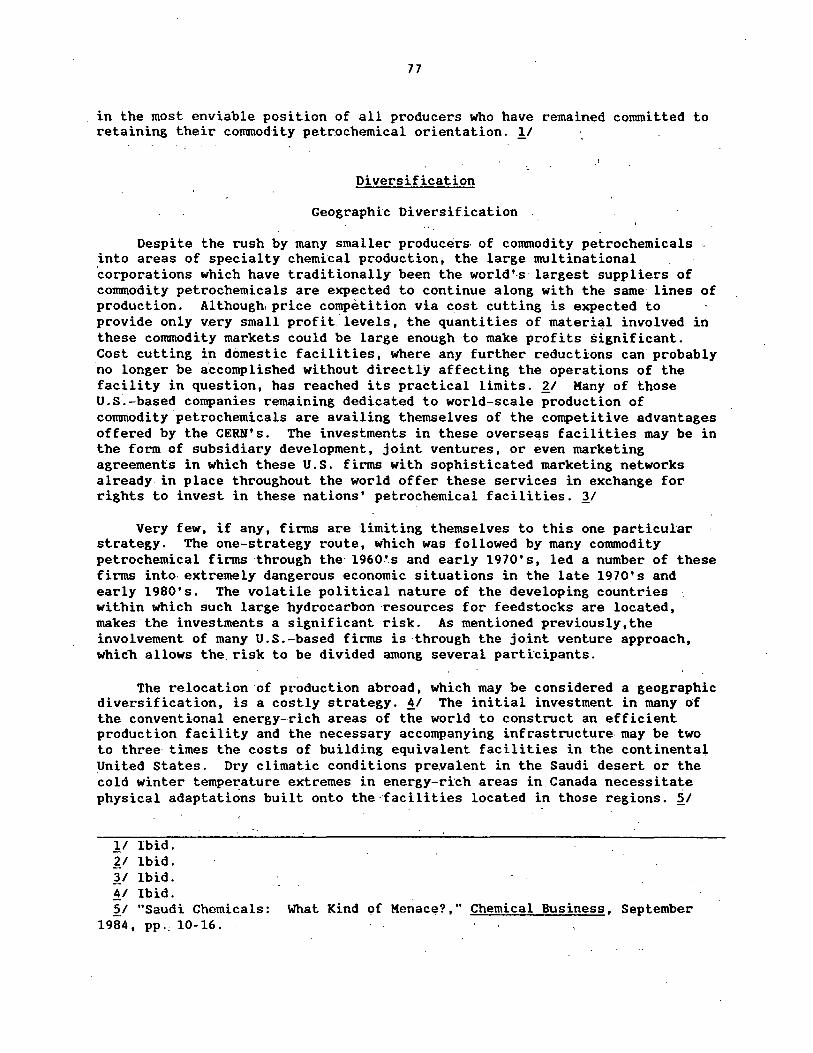
77
in the most enviable position of all producers who have remained committed to retaining their commodity petr.ochemical orientation. 11
Diversification
Geographic Diversification
Despite the rush by many smaller producers of commodity petrochemicals into areas of specialty chemical production, the large multinational corporations which have traditionally been the world'-s largest suppliers of commodity petrochemicals are expected to continue along with the same lines of production. Although, price competition via cost cutting is expected to provide only very small profit.levels, the quantities of material involved in these commodity markets could be large enough to make profits significant. Cost cutting in domestic facilities, where any further reductions can probably no longer be accomplished without directly affecting the operations of the facility in question, has reached its practical limits. 11 Many of those U.S.-based companies remaining dedicated to world-scale production of commodity petrochemicals are availing themselves of the competitive advantages offered by the CERN's. The investments in.these overseas facilities may be in the form of subsidiary development, joint ventures, or even marketing agreements in which these U.S. firms with sophisticated marketing networks already in place throughout the world offer these services in exchange for rights to invest in these nations' petrochemical facilities. ~/
Very few, if any, firms are limiting themselves to this one particular strategy. The one-strategy route, which was followed by many commodity petrochemical firms through the 1960~s and early 1970's, led a number of these firms into- extremely dangerous economic situations in the late 1970's and early 1980's. The volatile political nature of the developing countries within which such large hydrocarbon -resources for feedstocks are located, makes the investments a significant risk. As mentioned previously,the involvement of many U.S.-based firms is ·through the joint venture approach, whiCh allows the. risk to be divided among several participants.
The relocation·of production abroad, which may be considered a geographic diversification, is a costly strategy. !I The initial investment in many C)f the conventional energy-rich areas of the world to construct an efficient production facility and the necessary accompanying infrastructure. may be two to three times the costs of building equivalent facilities in the continentai United States. Dry climatic conditions prevalent in the Saudi desert or the cold winter temperature extremes in energy-rich areas in Canada necessitate physical adaptations built onto the ··facilities located in those regions. ~I
1/ Ibid. 21 Ibid. 3/ Ibid. !I Ibid. 51 "Saudi Chemicals: What Kind c;>f Menace?," Chemical Business, September
1984, pp., 10-16.
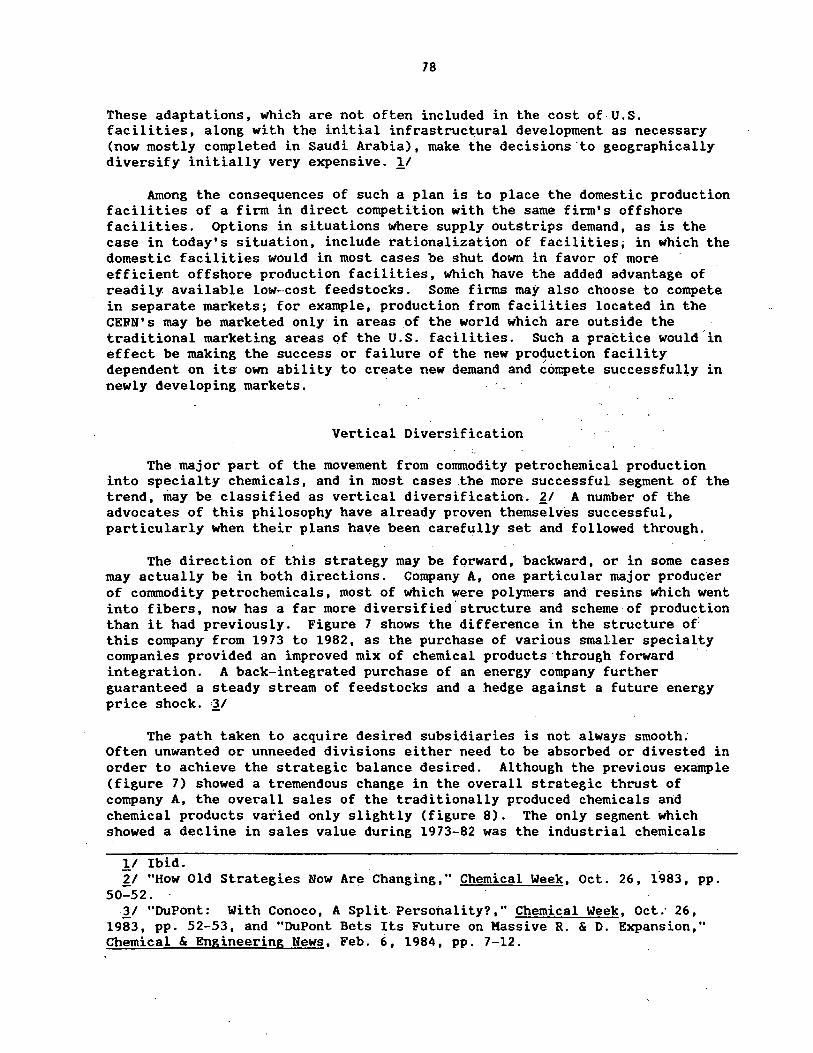
78
These adaptations, which are not often included in the cost of-U.S. facilities, along with the initial infrastruc~ural deveiopment as necessary (now mostly completed in Saudi Arabia), make the decisions·to geographically diversify initially very expensive. !I
Among the consequences of such a plan is to place the domestic production facilities of a firm in direct competition with the same firm's offshore facilities. Options in situations where supply outstrips demand, as is the case in today's situation, include rationalization of facilities; in which the domestic facilities would in most cases be shut down in favor of more efficient offshore production facilities, which have the added advantage of readily available low-cost feedstocks. Some firms may also ch~ose to compete in separate markets; for example, production from facilities located in the CEBN's may be marketed only in areas of the world which are outside the traditional marketing areas of the U.S. facilities. Such a practice would in effect be making the success or failure of the new production facility dependent on its own ability to create new demand and ~ow.pete successfully in newly developing markets.
Vertical Diversification
The.major part of the movement from commodity petrochemical production into specialty chemicals, and in most cases .the more successful segment of the trend, may be classified as vertical diversification. i1 A number of the advocates of this philosophy have already proven themselves successful, particularly when their plans ha~e been carefully set and followed through.
The direction of this strategy may be forward, backward, or in some cases may actually be in both directions. Company A, one particular major produc·er of commodity petrochemicals, most of which were polymers and resins which went into fibers, now has a far more diversified structure and scheme of production than it had previously. Figure 7 shows the difference in the structure of this company from 1973 to 1982, as the purchase of various smaller specialty companies provided an improved mix of chemical products:through forward · integration. A back-integrated purchase of an energy company further guaranteed a steady stream of f eedstocks and a hedge against a future energy price shock. ;l/
The path taken to acquire desired subsidiaries is not always smooth. Often unwanted or unneeded divisions either need to be absorbed or divested in order to achieve the strategic balance desired. Although the previous example (figure 7) showed a tremendous change in the overall strategic thrust of company A, the overall sales of the traditionally produced chemicals and chemical products varied only slightly (figure 8). The only segment which showed a decline in sales value during 1973-82 was the industrial chemicals
!I Ibid. 2/ "How Old Strategies Now Are Changing," Chemical Week, Oct. 26, 1983, pp.
50-52. '}_/ "DuPont: With Conoco, A Split. Personality?," Chemical Week, Oct: 26,
1983, pp. 52-53, and "DuPont Bets Its Future on Massive R. & D. Expansion," Chemical & Engineering News, Feb. 6, 1984, pp. 7-12.

79
i -
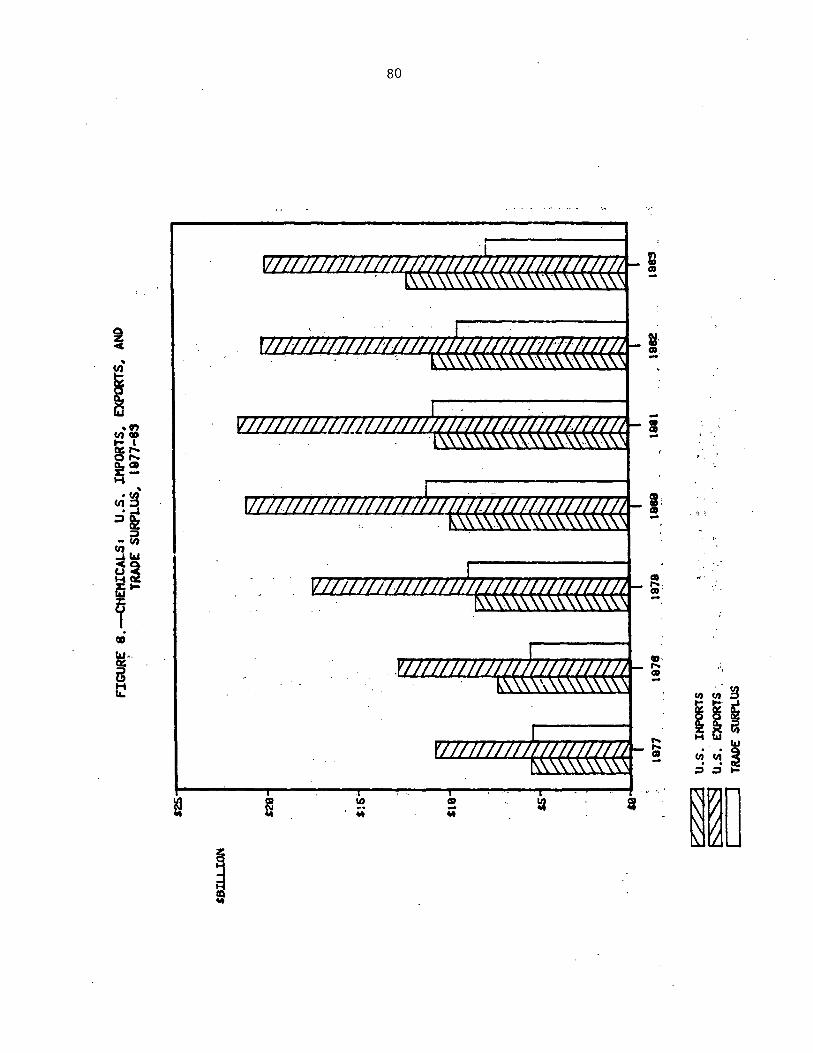
80
~ U· GI -..
I -.. " • GI Cl) QO -t- I °',... Q,...
~~ 1-i ,. ui~ I: ;;~
GI ·~ ~ -j
- Cl)
~IU ~~ GI
~p-,... GI.
~ -
GO
"' .. .,: a: ,... ,. s GI -~ "' v.· ~ I ~· ~ ,... a~ ,... . l&J GI <ii c,; ~ - ..
.::> ;:> ....
~ IQ CD ~ ~ ~filO .. ; 44
~ ~
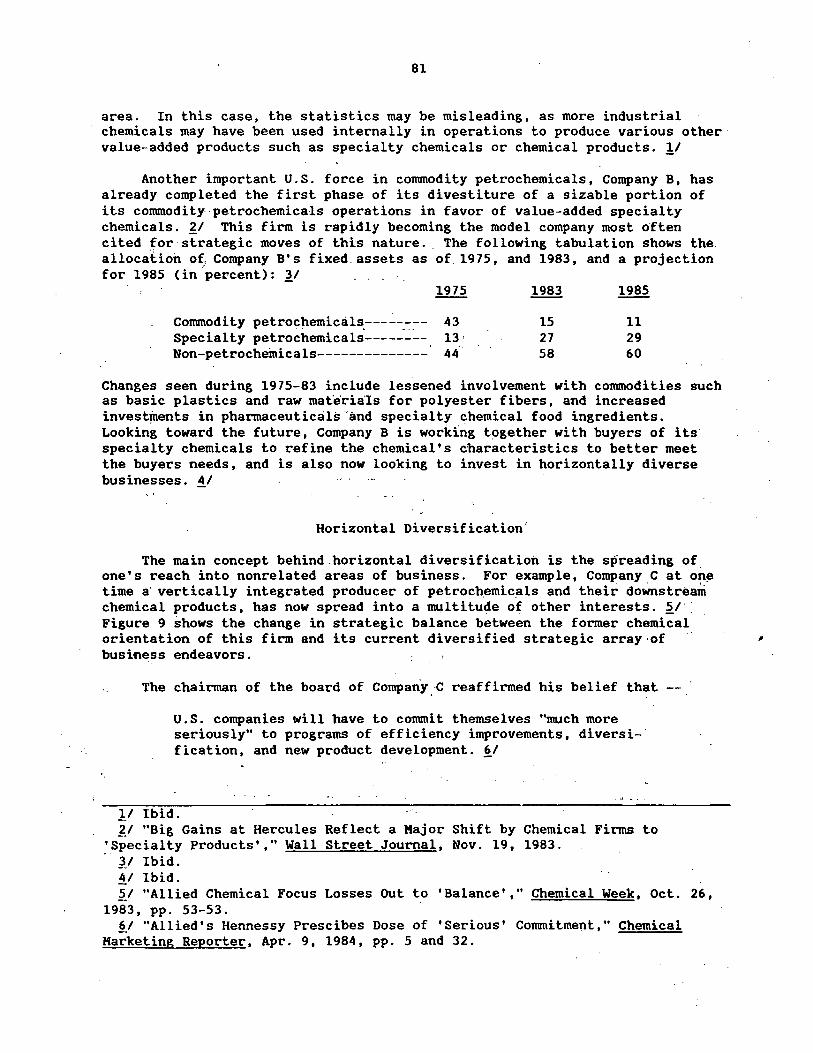
81
area. In this case, the statistics may be misleading, as more industrial chemicals may have been used internally in operations to produce various other value-added products such as specialty chemicals or chemical products. !I
Another important U.S. force in corranodity petrochemicals, Company B, has already completed the first phase of its divestiture of a sizable portion of its corranodity·petrochemicals operations in favor of value-added specialty chemicals. l:_I This firm is rapidly becoming the model company most often cited .for· strategic moves of this nature .. The following tabulation shows the. allocation o( Company B's fixed_ assets as of 1975, and 1983, and a projection for 1985 (in ·percent) : 'JI
1975 1983 1985
Commodity petrochemicals-------- 43 15 11 Specialty petrochemicals----:~~- . 13' 27 29 .. Non-petrochemicals-------------- 44 58 60
Changes seen during 1975-83 include lessened involvement with commodities such as basic plastics and raw mat·e·rials for polyester fibers, and increased investments in pharmaceuticals'and specialty chemical food ingredients. Looking toward the future, Company B is working together with buyers of its· specialty chemicals to refine the chemical's characteristics to better meet the buyers needs, and is also now looking to invest in horizontally diverse businesses. ~/
Horizontal Diversification'
The main concept behind horizontal diversification is the spreading of one's reach into nonrelated areas of business. For example, Company C at on~ time a· vertically integrated producer of petroch.emic_als and their dowstream chemical products, has now spread into a multitude of other interests. ~I' Figure 9 shows the change in strategic balance between the former chemical orientation of this firm and its current diversified strategic array·of " business endeavors.
•.
The chairman of the board of Company.·C reaffirmed his belief that -- ·
U.S. companies will have to commit themselves "much more seriously" to programs of efficiency improvements, diversi-· fication, and new product development. ~I
.!.I Ibid. ~I "Big Gains at Hercules Reflect a Major Shift by Chemical Firms to
'Specialty Products'," Wall Street Journal, Nov. 19, 1983 . . . 'JI Ibid. ~/ Ibid. ~I "Allied Chemical Focus Losses Out to 'Balance'," Chemical Week, Oct. 26,
1983, pp. 53-53. !!_I "Allied's Hennessy Prescibes Dose of 'Serious' Corranitment," Chemical
Marketing Reporter, Apr. 9, 1984, pp. 5 and 32.
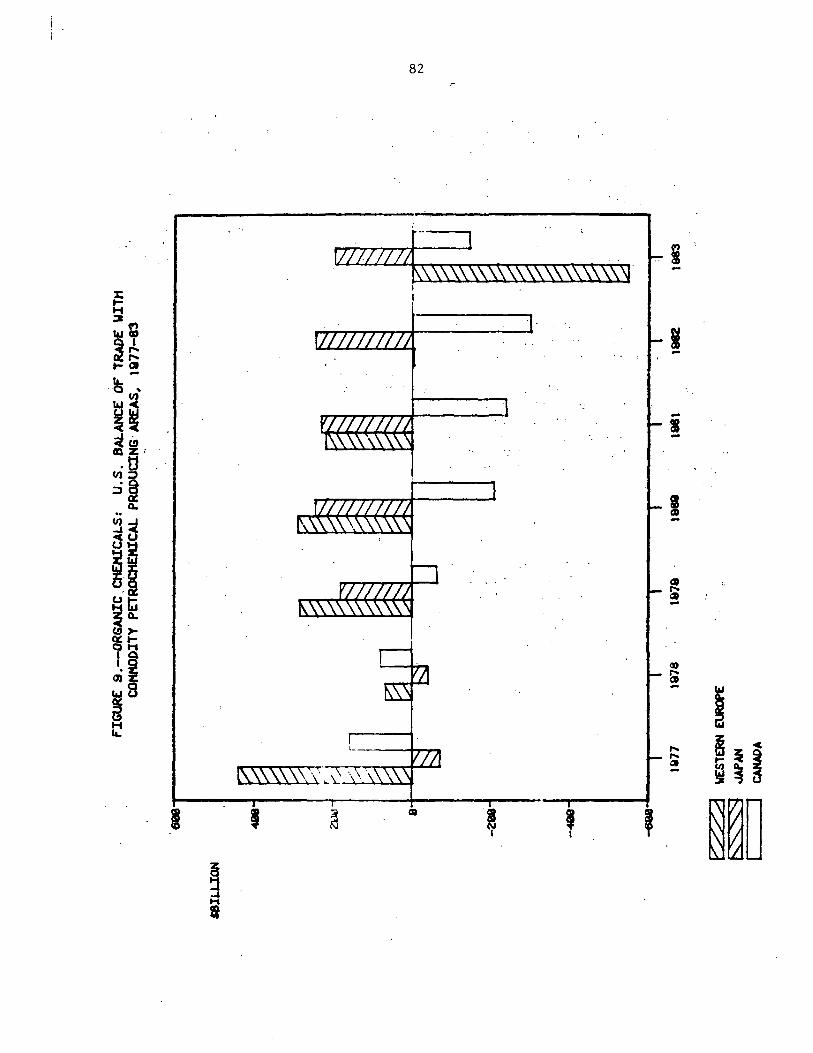
82
' I '
I ---1 -
I CD -
~ -
,... ,... QI -
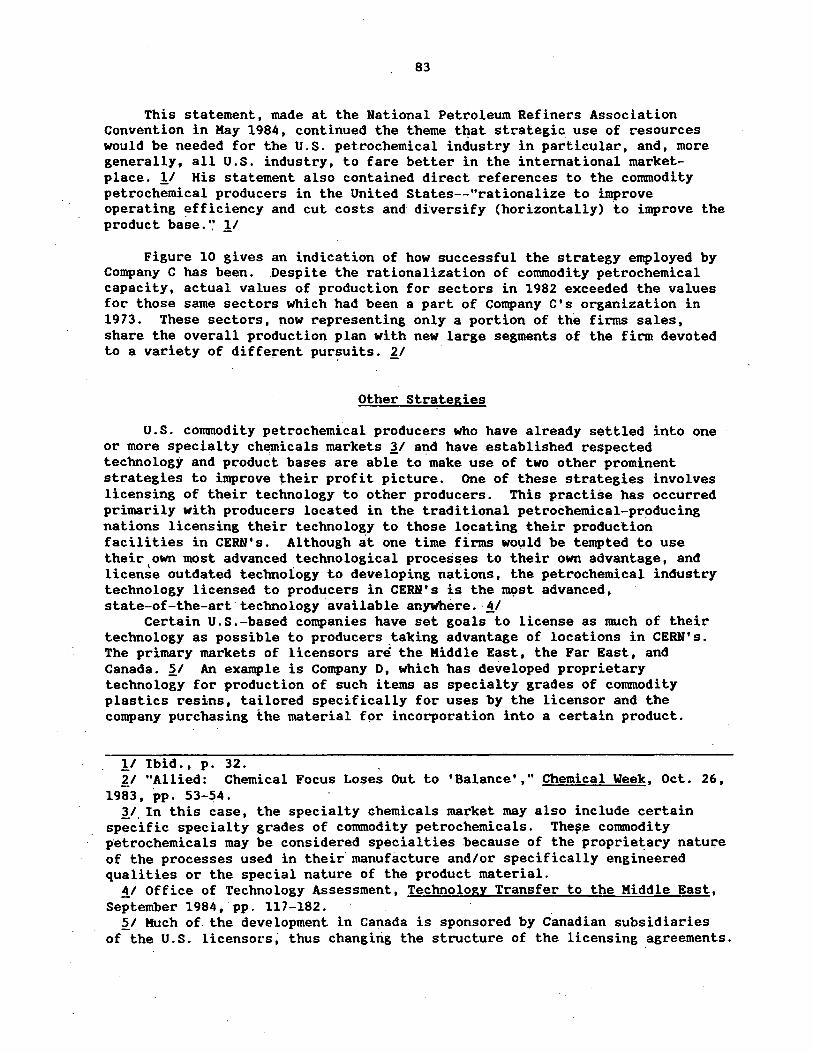
83
This statement, made at the National Petroleum Refiners Association Convention in Kay 1984, continued the theme t~at strategic use of resources would be needed for the U.S. petrochemical industry in particular, and, more generally, all U.S. industry, to fare better in the international marketplace. !I His statement also contained direct references to the commodity petrochemical producers in the United States--"rationalize to improve operating efficiency and cut costs and diversify (horizontally) to improve the product base.·~ !I
Figure 10 gives an indication of how successful the strategy employed by Company C has been. .Despite the rationalization of commodity petrochemical capacity, actual values of production for sectors in 1982 exceeded the values for those same sectors which had been a part of Company C's organization in 1973. These sectors, now representing only a portion of the firms sales, share the overall production plan with new large segments of the firm devoted to a variety of different pur~uits. ~/ ·
Other Strategies
U.S. commodity petrochemical producers who have already settled into one or more specialty ch~micals markets i1 and have established respected technology and product bases are able to make use of two other prominent strategies to improve their profit picture. One of these strategies involves licensing of their technology to other producers. This practise has occurred primarily with producers located in the traditional petrochemical-producing nations licensing their technology to those locating their production facilities in CERN's. Although at one time firms woµld be tempted to use their,own most advanced technological processes to their own advantage, and license outdated technoiogy to developing nations, the petrochemical industry technology licensed to producers in CERN's is the m9st advanced, state-of-the-art technology 'available anywhere. !/
Certain U.S.-based companies have set goals to license as much of their technology as possible to producers taking advantage of locations in CERN's. The primary markets of licensors ar~ the Kiddle East, the Far East, and Canada. ~/ An example is Company D, which has developed proprietary technology for production of such items as specialty grades of commodity plastics resins, tailored specifically for uses by the licensor and the company purchasing the material fpr incorporation into a certain product.
!I Ibid., p. 32. ~I "Allied: Chemical Focus Loses Out to 'Balance'," Chemical Week, Oct. 26,
1983, pp. 53-54. 3/ In this case, the specialty chemicals market may also include certain
spec.ific specialty grades of commodity petrochemicals. The~.e commodity petrochemicals may be considered specialties because of the propriet;ary nature of the processes used in their manufacture and/or specifically engineered qualities or the special nature of the product material.
!I Office of Technology Assessment, Technology Transfer to the Kiddle East, September 1984, pp. 117-182. ~I Much of the development in Canada is sponsored by Canadian subsidiaries
of the U.S. licensors, thus changing the structure of the licensing agreements. . .
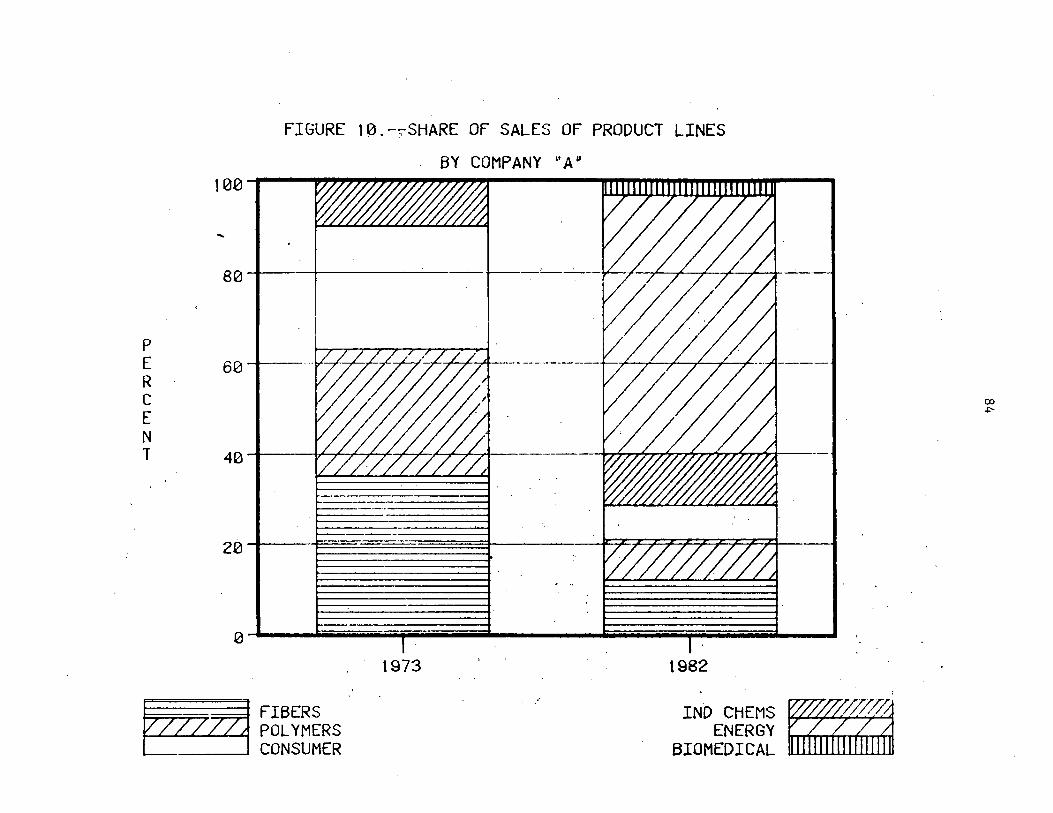
p E R c E N T
100
80
60
FIGURE 10.-~SHARE OF SALES OF PRODUCT LINES
BY COMP ANY 11 A II
1'->'--- •' •' "'' - ----------+---+-----__,,. _ __,,. _ _,__--+-·
40 I I/>',,>'''~/,•,, >l ---- .,,,,,~ >>7-7">7->>">->>~>>~J
2n I t= I -f=;;z=>~ '~~~ > > 1 1 --1 ~ rrrrrrrr7
0~----liiiiiiiiiiiiiiiiiiiiiiiiiiiiiiliiiiiipiiiiiiiiiiiiiiiiiiiiiiiiiiiiiiiiii~--------~iiiiiiiiiiiiiiiiiiiiiiiiiiiipiiiiiiiiiiiiiiiiiiiiiiiiiiiiiiiiiiif....---'
1973 1982
~ FIBERS POLYMERS CONSUMER
IND CHEMS ~~ ENERGY BIOMEDICAL
00 .i:-.
85
This company .had ,begun a -program to .rationaHze capacity in commodity petrochemicals early on,: so that by. 1979, ·commodity petrochemicals and plastics accounted for only 37 percent of the:company's -$7.9 ·billion of·. · sales.· ll Irr· 19 7-9; ·this company targeted six particular areas which, if strategic goals 'Would be met; would account ·for :15: percent of ·au Company D's· assets in 1983. ~I Also in 1979, Company D launched .the licensing program 'Jf. which allowed a producer of low-density polyethylene to reduce his capital costs for a new plant by two-thirds and also reduce energy costs by 85 percent. ~/ One petrochemical industry analyst projects Company D's 1984 income from licensing this technology will be about $81 million.
The specialty nature of the industry may be a service which can accompany the licensing of technology, such as the use of the licensors' marketing service. A Canadian licensee's new ethylene facility which began production in 1984 based on natural gas feedstocks and Company D's technology will be using Company D's marketing service. As of 1984, no other firm had commercialized this type of service. ~/
The major risks taken by the licensor either involve the breaking of the licensing agreement or the penetration of the licensor's domestic market by the licensee. ~/ In the case of petrochemical engineering technology, however, since the technology provided is·state of the art and the resulting pro~uction is priced competitively on the world market (some say too competitively), there is no incentive for the licensee to violate the terms or to take unfair advantage of the licensing agreement.
The desire to maintain good international trade relations is the main motivating f orcJ behind the prevention of nonorderly marketing of the licensee's product. Although Company D freely licenses its technology to all who are willing to pay for it, fears of license agreement violations cause other firms to be more selective about their partners in these agreements. ll
The other prominent strategy employed as often as possible by companies which produce specialty chemicals is the specialty equivalent of a commodity "cash cow." This would entail the development of a product which, through its unique set of properties, could be depended upon to generate revenue for the development of new products. This strategy, which is the ultimate goal of most any specialty chemical company, especially if it is independent and has no uninterruptible source of funding for R. & D., ~/is attained through the development of a proprietary position. A proprietary position in specialty
_!/ "Union Carbide: Its Six-Business Strategy Is Light on Chemicals," Business Week, Sept. 24, 1979, pp. 97-100, and "Union Carbide: Battling Growth by Licensing Technology," Business Week, Sept. 19, 1983, p. 88.
~I "Union Carbide: Its Six-Business Strategy Is Light on Chemicals," Business Week, Sept. 24, 1979, pp. 97-100.
11 Unipol.
Slow
!!_/ "Union Carbide: ~eek, Sept. 19, 1983,
?_/ Ibid.
Battling Slow Growth by Licensing Technology," Business p. 88'..
6/ Office of Technology Assessment, op.cit., p. 147. 71 Office of Technology Assessment·, op.cit. 8/ As mentioned previously, the backbone of any specialty chemical operation.
86
chemicals is significantly different from a proprietary position in commodities. In the specialty chemicals area, it may be inferred that no other producer has a similar product. In the commodity petrochemicals area, it is far more likely to be only the "process" !I that is proprietary. ~/ The majority of successful specialty chemical manufacturers have attained this strategic goal with at least one area or product.
l/ Company D licensed technology related to production of a specialty grade of a commodity petrochemical, not a. real commodity.
21 "Chemical Specialties," Presentation by Richard A. Andrews at Conference on-Strategic Planning for Petrochemicals, Sept. 11, 1984.
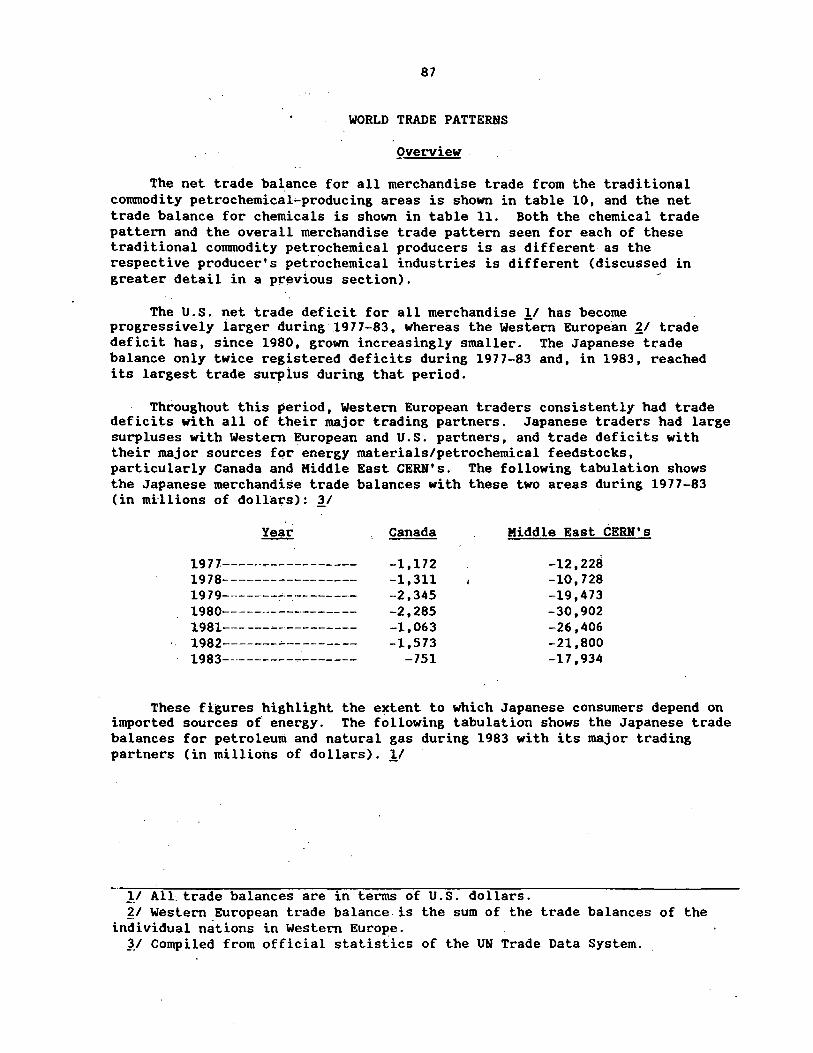
87
WORLD TRADE PATTERNS
Overview
The net trade balance for all merchandise trade from the traditional commodity petrochemical-producing areas is shown in table 10, and the net trade balance for chemicals is shown in table 11. Both the chemical trade pattern and the overall merchandise trade pattern seen for each of these traditional commodity petrochemical producers is as different as the respective producer's petrochemical industries is different (discussed in greater detail in a previous section).
The U.S. net trade deficit for all merchandise 1/ has become progressively larger during 1977-83, whereas the Western European ~/ trade deficit has, since 1980, grown increasingly smaller. The Japanese trade balance only twice registered deficits during 1977-83 and, in 1983, reached its largest trade surplus during that period.
Throughout this period, Western European traders consistently had trade deficits with all of their major trading partners. Japanese traders had large surpluses with Western European and U.S. partners, and trade deficits with their major sources ~Qr.energy materials/petrochemical feedstocks, particularly Canada and Middle East CERN's. The following tabulation shows the Japanese merchandise trade balances with these two areas during 1977-83 (in mH lions of dollars) : 'J_/
19 7 7------------------1978-----------------1979-------~~--------
1980-----------------1981------------------1982------~~---------
1983-----------------
Canada
-l, 172 -1,311 -2,345 -2,285 -1,063 -1,573
-751
Middle East CERN's
-12,228 -10, 728 -19,473 -30,902 -26,406 -21,800 -17,934
These figures highlight the extent to which Japanese consumers depend on imported sources of energy. The following tabulation shows the Japanese trade balances for petroleum and natural gas during 1983 with its major trading partners (in millions of dollars). 1/
!/ All. trade balances are in terms of U.S. dollars. ~I Western European trade balance.is the sum of the trade balances of the
individual nations in Western Europe. 11 Compiled from official statistics of the UN Trade Data System.

88
Table 11.--Chemicals: Net trade balance as reported by traditional commodity petrochemical proJucers, 1972-1983
Partner
United States: 1972----------------: 1977-----~----------: 1978----------------: 1979----------------: 1980----------------: 1981----------------: 1982----------------: 1983----------------:
Western Europe: . 1972----------------: 1977----~---------~-:
1978----------------: 1979----------------: 1980----------------: 1981----------------:. 19.82.---------------.: . 1983---------·-------:
Japan: 1972----------------: 1977---------------: 1978----------~-~~--: 1979----------------: 1980----------------: 1981----------------: 1982---------------- :· .. 1983---------------:
Canada: 1972----------------: 1977-----------~----:
1978---~------------: 1979-----------:----: 1980----------------: 1981----------------: 1982--------------: 1983----------------:
Non-market economies: : 1972----------------: 1977---------------: 1978----------------: 1979-------------: 1980----------------: 1981----------------: 1982-----~----------:
1983----------------: Total:
1972----------------: 1977----------------: 1978----------------: 1979----------------: 1980----------------: 1981----------------: 1982----------------: 1983----------------:
(In millions of dollars)
United States Western Europe
- . -897. - . -1,632
-1, 892 - . -3,305 :: - : -3,648
-3,048 - . -2,331 - . -539
509 - :: 1,165 - : . 886 1,978 - : 2,381 - : 2,217 - .
. .. 1. 732 -727 - :
63 151 .480 429
.•. 501 696 ·!
978 880 : 1,240 782 1,386 830 1,6l4' ·: 949 1,450 1,116
253 53 213 235 -45 180
-445 179 -422 : 16 -480 70 -568 70
-6 171
15 670 36 1,861 -2 2,347
139 2.~88 115 3,. 799 402 3,117 546 2,205 293 2, 125
2, 118 2,753 5,357 8,568 5,483 11,934 8,949 12,096
ll, 199 14,611 10, 788 14,646 9,423.: 14, 135 7,822 : 18,657
Japan
-167 -681 -834·
-1,432 ~1,799
.. -1,832 -2,171 -2, 157
-251. -628 -939.
-1,194. -l, 192 -1,201 -1,362 -1,457
-15 -38 -53 -57
-116 -133 -132 -136
228 521 629 613 752 589 552 581
636 1,296 1,304
891 528 317
-492 -254
Source: Based on official statistics of the U.N. Trade Data System.

89
Table 10. --Merchandise: Net trade balance as reported by traditional commodity petrochemical producers, 1972-1983
Partner
United States: 1972----------------: 1977----------------: 1978----------------: 1979----------------: 1980----------------: 1981----------------: "1982-------------~--:
1983----------------: Western Europe:
1972--------------: 1977----------------: 1978-------~--------: 1979----------------: 1980----------~-----: 1981----------------: 19.82----------------: 1983----------------:
Japan: 1972--------~-------:
1977----------------: 1978----------------: 1979--------------: 1980----------------: 1981------------: 1982----------------: 1983-------------:
Canada: 1972---------------: 1977----------------: 1978----------------: 1979---------------: 1980--------------: 1981----------------: 1982----------------: 1983----------------:
Non-market economies: : 1972----------------: 1977--------------: 1978----------------: 1979--------------: 1980---------------: 1981----------------: 1982------_:_--------: 1983-------------:
Total: 1972--------------: 1977----------------: 1978-------------: 1979-------------: 1980----------------: 1981--------------: 1982--------------: 1983---------------:
(In millions of dollars)
United States Western Europe
- :
-298 5,232 1,205 5,382
15,523 6;578 2,220
.-2, 952
-4,140 -8,480
-13,811 -10,812 -12, 399. -18,527 -19,534
' -22, 333
-2,826 -4,748 -6,866 -7,161 -8,217 -8,337
-13, 921 -15,906
526 1,581 2,797 5,286 4,942 4,127 2,874 1,116
-6,584 -29,936 -42, 192 -43, 728 -37,393 -45,436 -46, 988 -73,350
-917 -9,290 -8,468
-16,486 -30,905 -20,273 -16, 119 -2,~66
- :
-2, 187 -9,276 -9,292 -9,934
-15, 708 -16, 290 -16, 068 -15, 112
-624 -1,540
-951 -2,361 -4, 376 -2,801 -2,297
-706
498 719
1,883 -2,925 -7,034 -6,845
-10, 559 -8,451
-10, 235 -39,749 -24,060 -61,479
-108, 909 -66,850 -55,472 -17,923
. Japan
3, 113 7,507
10,307 . 6, 132
7,201 13,553 12,380 18,546
2,324 7,898 7 ,456 7,096
11, 915 14,376 12, 191 13,522
-44 -1,172 -1,311 -2, 345 -2,285 -1,063 -1,573
-751
121 1,895 2,927 2,050 2,586 2,438 1,349
-2,045
5, 120 9,909
18, 770 -7,143
-10,349 11,079 8,265
21,786
Source: Based on official statistics of the U.N. Trade Data System.
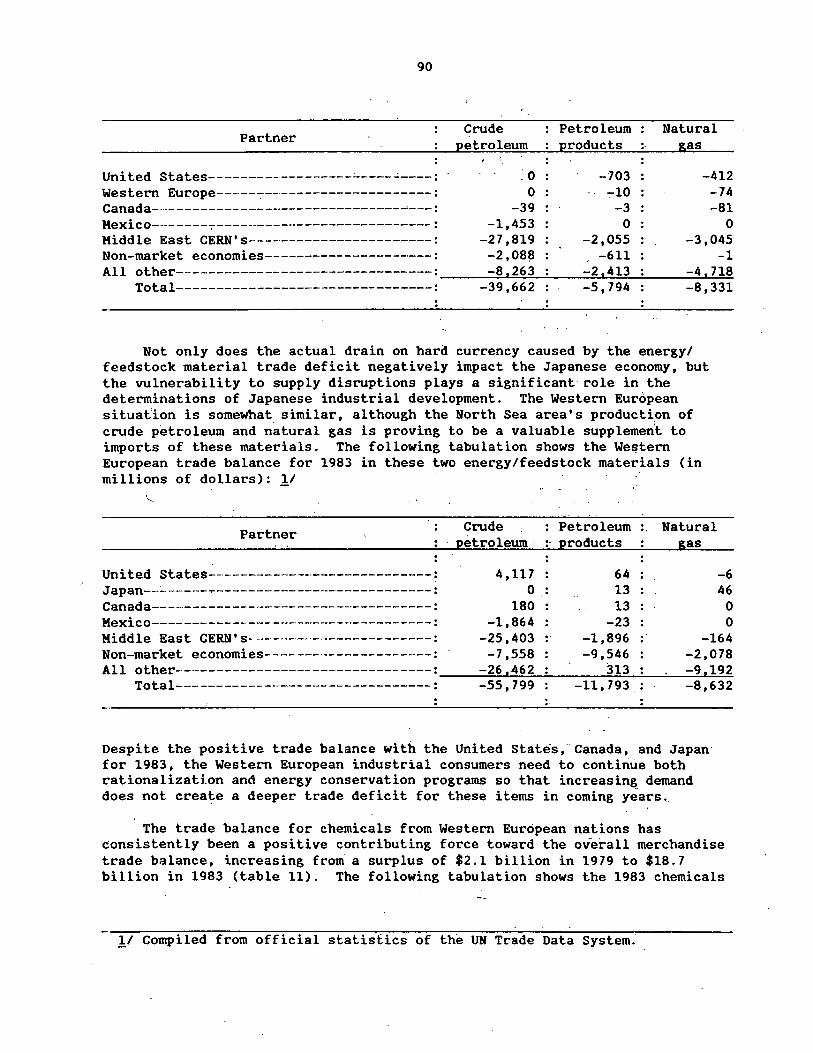
90
Partner Crude Petroleum Natural
petroleum products .. gas
United States------------------'------'-----: :o -703 -412 Western Europe-----7---------------------: 0 -10 -74 Canada-·---------------·---------------~---: -39 -3 -81 Mexico---- --- --;------------------------------: -1,453 0 0 Middle East CERN's-----------------------: -27,819 -2,055 -3,045 Non-market economies---------------------: -2,08~ -611 -1
-8,263 -2,413 -4 t 718 All other-----------~--------------------:~~~~---~~~~----------~~~~..-.....---.Total--------------------------------: -39,662 -5,794 -8,331
Not only does the actual drain on hard currency caused by the energy/ feedstock material trade deficit negatively impact the Japanese economy, but the vulnerability to supply disruptions plays a significant· role in the determinations of Japanese industrial development. The Western European situation is somewhat similar, although the North Sea area's production of crude petroleum and natural gas is proving to be a valuable supplemen't to imports of these materials. The following tabulation shows the We~tern European trade balance for 1983 in these two energy/feedstock materials (in millions of dollars): !I
.;
Partner Crude Petroleum .. Natural petroleum· .. products gas
United States--·---------·-----------------: 4, 117 64 -6 Japan--~---------------------------------: 0 13 46 Canada---------- --- ----- ---.--------------: 180 13 0 Mexico-----------------------------------: -1,864 -23 0 Middle East CERN's----·----·-·--------------: -25,403 . -1,896 -164 Non-market economies- --- --- -- -------- -----: -7,558 -9,546 -2,078
-26,462 313 -9,192 All other--------------------------------:~~~---------------~~~...-....--'---'---'-~--"-'--=-= Total--------------------------------: -55. 799 -11, 793 : -8,632
..
Despite the positive trade balance with the United states,·canada, and Japan for 1983, the Western European industrial consumers need to continue both rationalization and energy conservation programs so that increasing demand does not create a deeper trade deficit for these items in coming years ..
The trade balance for chemicals from Western European nations has consistently been a positive contributing force toward the overall merchandise trade balance, increasing from a surplus of $2.l billion in 1979 to $18.7 billion in 1983 (table 11). The following tabulation shows the 1983 chemicals
1/ Compiled from official statistics of the UN Trade Data System.
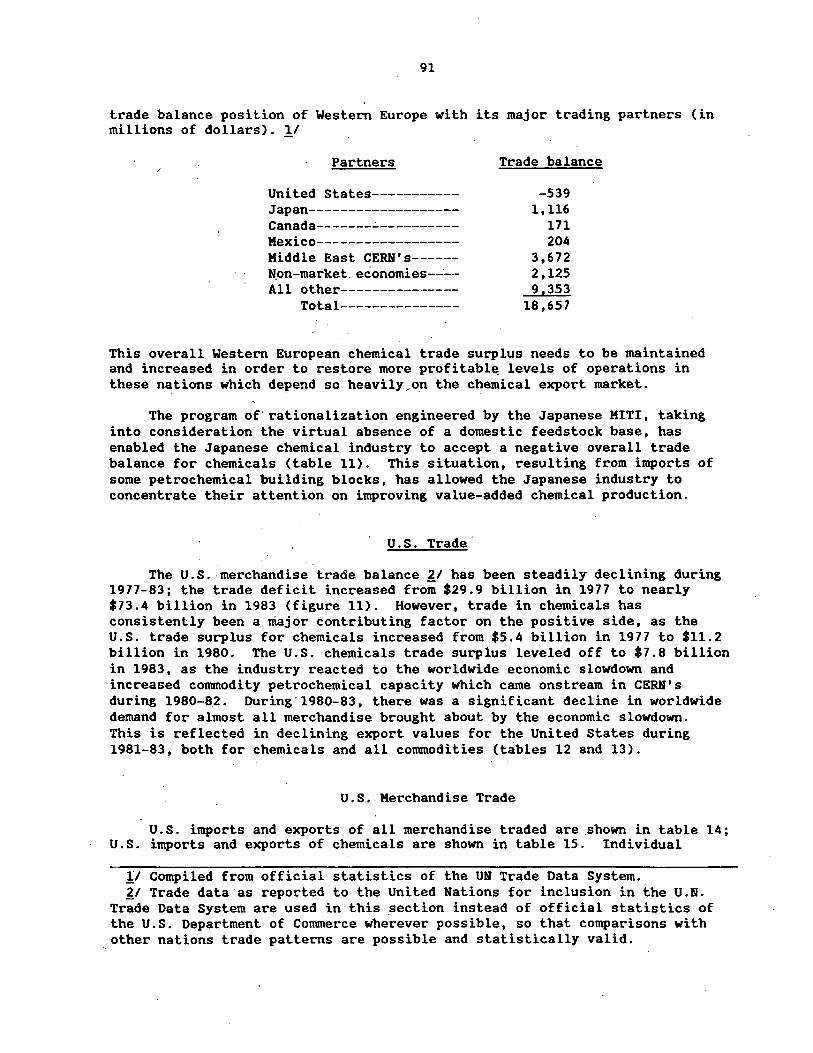
91
trade balance position of Western Europe with its major trading partners (in millions of dollars). 11
Partners
United States-----------Japan--·-----------------Canada-------~----------
Mexico--- ---------------Middle East CERN's-----N.on-market. economies--:....All other---------------
Total---------------
Trade balance
-539 1, 116
171 204
3,672 2,125 9,353
18,657
This overall Western European chemical trade surplus needs to be maintained and increased in order to restore more profitabl~ levels of operations in these nations which depend so heavily/on the chemical export market.
The program of· rationalization engineered by the Japanese MIT!, taking into consideration the virtual absence of a domestic feedstock base, has enabled the Japanese chemical industry to accept a negative overall trade balance for chemicals (table 11). This situation, resulting from imports of some petrochemical building blocks, has allowed the Japanese industry to concentrate their attention on improving value-added chemical production.
U.S. Trade·
The U.S. merchandise trade balance 21 has been steadily declining during 1977-83; the trade deficit increased from $29.9 billion in 1977 to nearly $73.4 billion in 1983 (figure 11). However, trade in chemicals has consistently been a major contributing factor on the positive side, as the U.S. trade surplus for chemicals increased from $5.4 billion in 1977 to $11.2 billion in 1980. The U.S. chemicals trade surplus leveled off to $7.8 billion in 1983, as the industry reacted to the worldwide economic slowdown and increased conunodity petrochemical capacity which came onstream in CERN's during 1980-82. During.1980-83, there was a significant decline in worldwide demand for almost all merchandise brought about by the economic slowdown. This is reflected in declining export values for the United States during 1981-83, both for chemicals and all conunodities (tables 12 and 13).
U.S. Merchandise Trade
U.S. imports and exports of all merchandise traded are .shown in table 14; U.S. imports and exports of chemicals are shown in table 15. Individual
11 Compiled from official statistics of the UN Trade Data System. ~I Trade data as reported to the United Nations for inclusion in the U.N.
Trade Data System are used in this _section instead of official statistics of the U.S. Department of Conunerce wherever possible, so that comparisons with other nations trade patterns are possible and statistically valid.
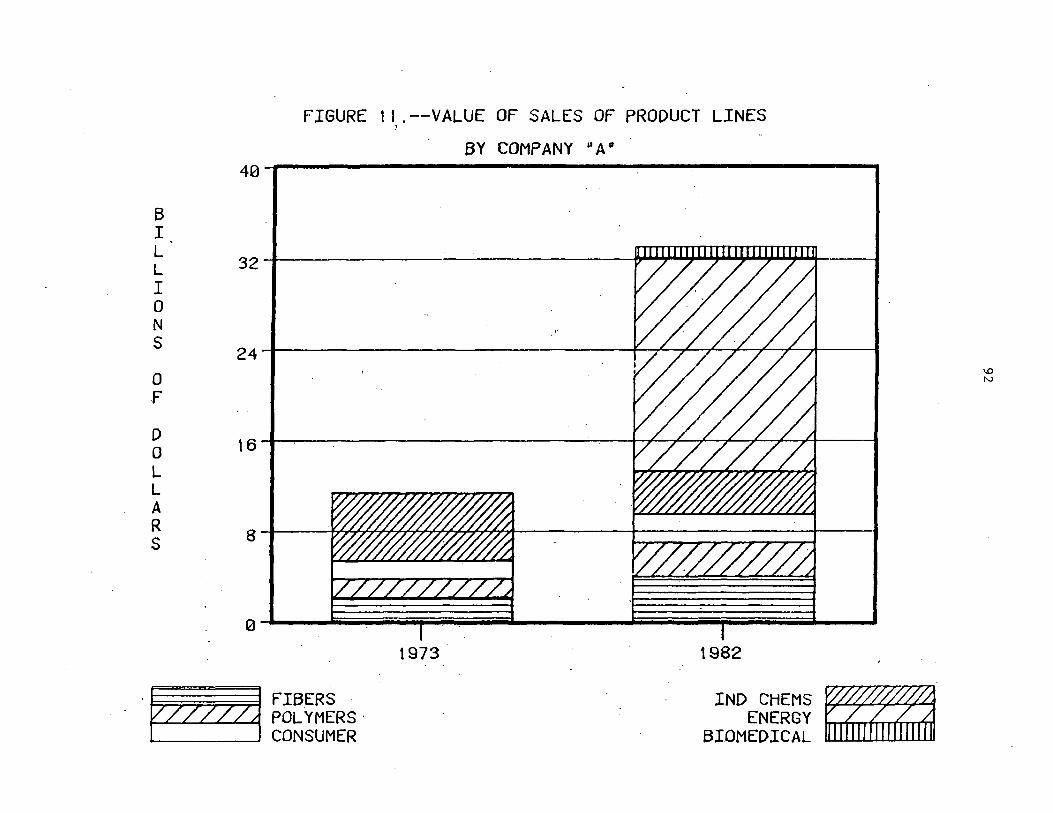
FIGURE t I .--VALUE OF SALES OF PRODUCT LINES '
BY COMP ANY ''A" 40
B I L
32 L I 0 N I ,.
s 24
0 I V//////j I F
D \6 0
L L A R
8 s
0-l---.....liiiiiiiiiiiiiiiiiiiiiiiiiiiiiiiiiiiiiiiiiiiiiiiiiiiiiiiiiiiiiiiiiiiiiiiiiiiil....------------iiiiiiiiiiiiiiiiiiiijjiiiiiiiiiiiiiiiiiiiiiiiiiiiiii~----'
1973 1982
·~FIBERS · POLYMERS· CONSUMER
IND CHEMS = ENERGY
BIOMEDICAL
'° N
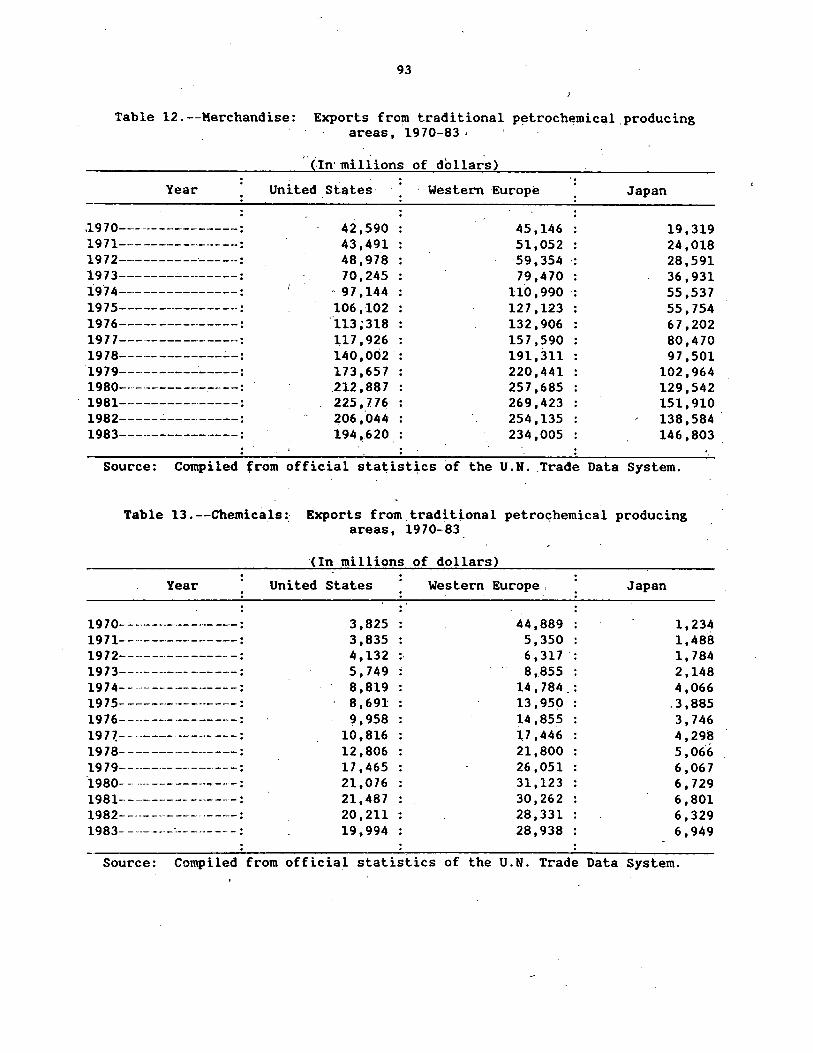
93
Table 12.--Merchandise: Exports from traditional petrochemical.producing areas, 1970-83 ,
Year
i970---------------: 1971---------------: 1972----------~----:
1973---------------: i9 7 4 ____ ..:_ ___________ :
19 75-------------- -·-: 1976---------------: 1977---------------: 1978---------------: 1979----------------: 1980-----------~---:
1981---------------: 1982---------------: 1983---------------:
(In· millions of dollars)
United States
42,590 43,491 48,978 70,245
··97,144 106,102 113;318 117. 926 140,002 173,657 212,887 225. 776 206,044 194,620_
Western Europe
45, 146 51,052 59. 354 .. 79,470
li0,990 . 127,123 132,906 157,590 191,311 220,441 257,685 269,423 254,135 234,005
Japan
19,319 24,018 28,591 36,931 55,537 55,754 67,202 80,470 97 ,501
102,964 129,542 151,910 138 ,584 . 146,803
Source: Compiled from official stat;.ist,ics of the U.N .. Trade Data System.
Table 13. --Chemicals:; Exports from. traditional petro~hemical producing areas, 1970-83
(In millions of dollars)
Year United States Western Europe, Japan
1970-~-------------: 3,825 44,889 1,234 1971---------------: 3,835 5,350 i,488 1972---------------: 4,132 .. 6,317 1,784 19 7 3-- ··- ------ --- --- : 5,749 8,855 2, 148 1974---------------: 8,819 14. 784.: 4,066 1975---------------: 8,691 13,950 .3,885 1976---------------: 9,958 14 ,855 3,746 197~-------·-------: 10,816 l7 ,446 4,298 1978---------------: 12,806 21,800 5,066 19 79---------- ------: 17,465 26,051 6,067 t980- - ···-----------··-: 21,076 31,123 6,729 1981-·--·------ -------: 21,487 30,262 6,801 1982-----------· ·----: 20. 211 : 28,331 6,329 1983-------~-------: 19,994 28,938 6,949
Source: Compiled from official statistics of the U.N. Trade Data System.
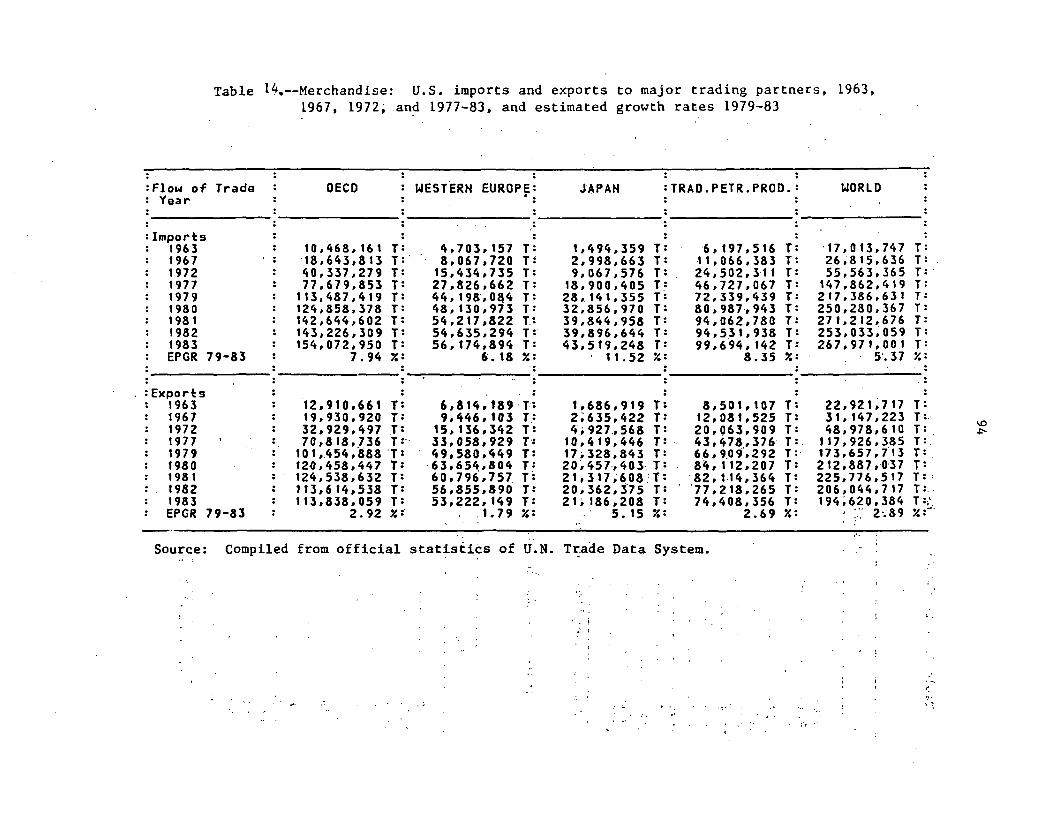
Table 14.--Merchandise: U.S. imports and exports to major trading partners, 1963, 1967, 1972; and 1977-83, and estimated growth rates 1979-83
:Flow of Trade : OECO : WESTERN EUROP~: JAPAN :TRAD.PETR.PROO.: WORLD : Year : :
: : : : : :
:Import:s : : : 1963 : 10,468,161 y: 4,103,151 T= 1,494,359 T: 6,197,516 T: ·11,on.747 T= 1967 : ·1s,643,813 r=· a,061,120 r: 2,998,663 r: 11,066,383 T: 26~815,636 T= 1972 : 40,337,279 r: 15,434,735 r: 9,067,576 r: 24,502,311 T: 55,563,365 r:· 1977 : 77,679,853 r: 21,826,662 r: 18,900,405 T_: 46,727.067 T: 147,862,419 T= 1979 : 113,437,419 T= 44, 198,0&4 T= 28, 141,355 T: 72.339,439 f: 217,386,631 r: 1980 : 124,858,378 y: 48, no,973 r: 32,856,970 T= ao,937.,943 T= 250,2ao,367 T= 198 1 : 142,644,602 r: 54,211.a22 r: 39,844,958 y: 94,062,780 T: 271,212,676 T: 1982 : 143,226,309 r: 54,635.294 r: 39,896,644 r: 94,531,933 r: 253,033,059 r: 1983 : 154,072,950 r: 56, 174,.394 r: 43,519,248 r: 99,694, 142 T: 261,911,001 r: EPGR 79-83 : 7.94 x: 6'.18?.: 11. 52 ": 8.35 x: 5·,37 r.:
: : : : : : : ..
:Export:s : : : : : : 1963 : 12,910,661 r: 6,814,189·T: t.686,919 r: 8,501,107 T: 22,921~111 r: 1967 : 19,930,920 y: 9, 4 4 6 , 1 0 3 T _: 2~635,422 r= 12, 08 1, 525 T: 31,141,223 T= 1972 : 32,929,497 r= 15,136,342 r: 4;927,568 r: 20.063,909 r: 48,978,610 r: 1977 : 7 0 , 8 18 , _7 3 6 T :· 33,058,929.T: 10,419,446 T=. 43,478,376 r: 111,926,385 r:. 1979 : 101,.454,888 ·r: 49,580,449 T: 17;.328,843 r: 66,9.oci,292 T:· 173,657,7'13 f: 1980 : 120,458,447 T: ·63,654,804 T! 20~457.,403._ T= a<.,112,201 r: 212,aa1,·0·37 T= 198 1 : 124,538,632 r: 60,196,151 r: 2 1 , 3 17 ~ 6 08 .' T: ·a2,1.14,364 r: 225,776,517 f:. 1982 : 1 u,614,538 r: 56,855,890 r: 20,362,3'75 T= ·11,218,265 r: 206,044,717 r: .. 1983 : I 13,838, 059 Y: 53,222,149 r: 2111a6,2oa r: 74,408,356 T: 194~620,384 r=:. EPGR 79-83 : 2.92 r.: .1.79Y.: s.15x: 2.69 r.: ::: z·.89 r.=-·
.. Source: Compiled from official stat~stics of U.N. T~ade Data System.
. i c '
. -. (
.. ..:· . ' ......... .. ;":
\0 .I:'-
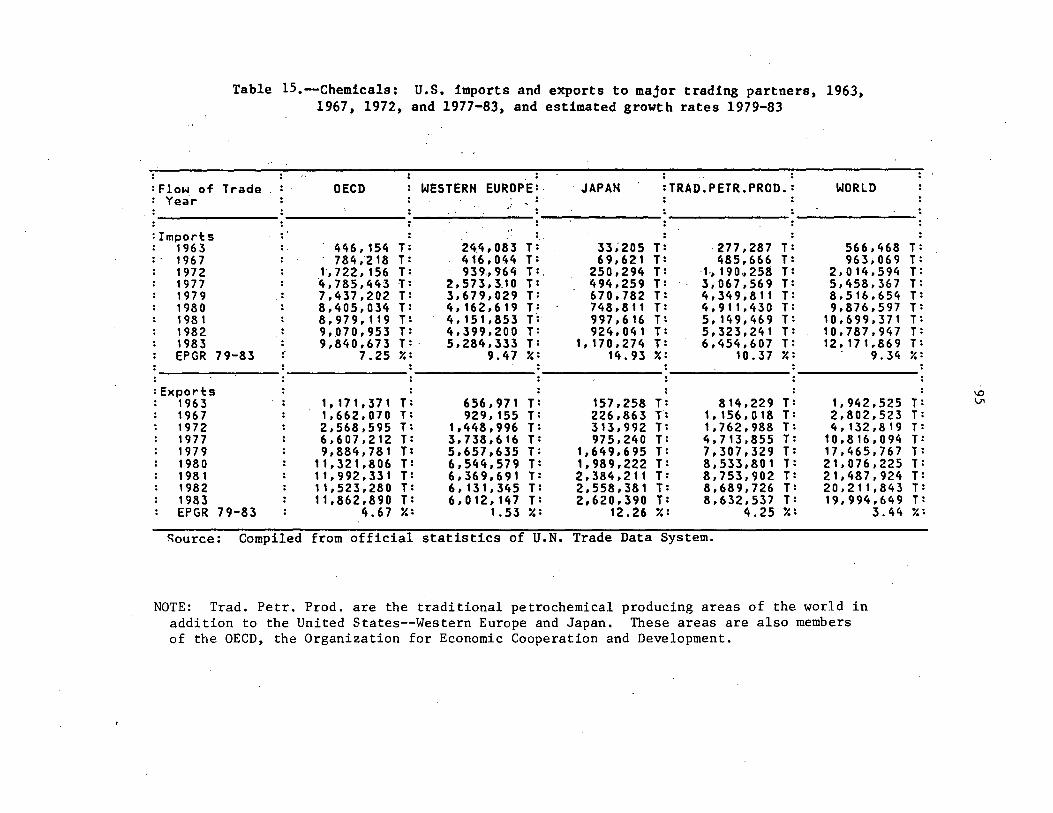
Table 15.~Chemicals: U.S. imports and exports to major trading partners' 1963, 1967, 1972, and 1977-83, and estimated growth rates 1979-83
:Flow of Trade : OECD : WESTERN EUROPE: JAPAN :TRAD.PETR.PROD.: WORLD : Yea·r --
:Imports 1963 .. . 446, 154 T: 24.4,083 T= 33~205 T: 277,287 T: 566,468 T: 1967 : · 784,218 T: 416,044 r: 69,621 T: 485,666 T: 963;069 T: 1972 : 1,722,156 T: 939,, 964 r:. .250,294 T: 1-, 1 9 0 ., 2 5 8 T : 2,014,594 T= 1977 : 4,785,443 T: 2 , 5 7 3 , 3. 1 0 T : 494,259 T: 3,067,569 r: .5,458,367 T= 1979 : 7,437,202 T: 3,679,029 r: 670,782 r: 4,349,811 T: 8,516,654 r: 1980 : 8,405,034 r: 4,162,619 r: 748,811 r: 4,911,430 T: 9,876,597 r= 198 1 : 8,979,119 r: 4,151,853 r= 997,616 T: 5, 149,469 T: 10,699,371 r: 1982 : 9 .. o 7 O , 9 5 3 T : 4,399,200 r: 924,041 T: 5,323,241 T: 10,787,947 T: 1983 : 9,840,673 T: · 5,284,333 r: 1,110,214 r: 6,454,607 T: 12,171.869 r: EPGR 79-83 f 7.25 r.: 9.47 r.: 14.93 r.: 10.37 r.: 9.34 r.:
:Exports ; ; ; ; ; ;
1963 : 1,111,311 r: 656,971 r: 151,258 r: 814,229 r: 1,942,525 r: 1967 : 1,662,070 T: 929, 155 r: 226,863 r: 1,156,018 T: 2,802,s23 T: 1972 : 2,568,595 T: 1,448,996 r: 313,992 r: 1,762,988 T: 4,132,319 T= 1977 : 6,607,212 T: 3,738,616 r: 975,240 T: 4,713,855 T: 10,816,094 r: 1979 : 9,884,781 r: 5,657,635 r: 1,649,695 T: 7,307,329 T: 17,465,767 T: 1980 : 11,321,806 T: 6,544,579 r: 1,939,222 r: 8,533,801 T: 21,076,225 l: 198 1 : 11,992,331 r: 6,369,691 r: 2,334,211 r: 3,753,902 r: 21,487,924 l: 1982 : 11,523,230 r: 6, 131,345 r: 2,558,381 T: 8,689,726 r: 20,211,843 r: 1983 : 11,862,890 T: 6,012,141 r: 2,620,390 T: 8,632,537 T: 19,994,649 l= EPGR 79-83 : 4.67 r.: 1.53 ": 12.26 ": 4.25 ": 3.44 r.:
~ource: Compiled from official statistics of U.N. Trade Data System.
NOTE: Trad. Petr. Prod. are the traditional petrochemical producing areas of the world in addition to the United States--Western Europe and Japan. These areas are also members of the OECD, the Organization for Economic Cooperation and Development.
\D V1
96
trading partners examined in these tables are the OECD, Western Europe, and Japan. 11
Imports of merchandise
Chemicals have repres~nted an.increasing sh~re qf t;.he imports of all conunodities during 1963-83,· increasing from 3.3 percent of the total value of all conunodity imports in 1963 to 4.5 percent of the total in 1.983. Imports of all conunodities climbed from a value of $17.0 billion in 1963 to $267.9 billion in 1983. The overall increase·in the value of me~chandise imports from 1963 to 1983 was about 1,476 percent, or an average annual increase of about 15 percent. 2/
Unlike merchandise imports from all sources, U.S. imports of.merchandise from the OECD increased from.about $10.5 billion in 1963 to about $154 billion in 1983, or by more than 1,367 percent, an average annual increase· of about 14 percent. The OECD's share of .U.S. merchandise imports increased· from about· 61.5 percent in 1963 to about 72.6 percent in 1972; however, from 1977 to 1983, the o·ECD' s share of these imports only ranged from about· 50 percent of. the total, in 1980, to about 58 percent of the totai, in 1983.
Western ~urope's share of U.S. merchandise imports also increased during 1963-83, from about $4.7 billion in 1963 to about $56.2 billion in 1983, or by·· approximately 1,200 percent, an average annual growth rate of 13 percent. The· Western European share of U.S. merchandise tt·ade ranged from 25 to. 30 percent during 1963-1972. However, during 1977-83, the Western European share of .· these merchandise imports declined~ ranging' from is to 21.percent. ..
Imports of merchandise from Japan· have also increased, from a value of $1.5 billion in 1962 to $43.5 billion in 1983. During 1979-83,. the· average annual growth rate was approximately 11.5 percent.· '·These merchandise imports· from Japan have accounted for between 12 and 16 percent of all merchandise · imports throughout the major part of this period.
Exports of merchandise
During 1963-83, the share of U.S. merchandise exports represented by chemicals ranged from 8.'4 percent (1972) to 10.3 'percent (1983)· of the value of all merchandise exports (tables 14 and 15). U.S. merchandise exports increased from $22.9 billion in 1963 to $194.6 billion in 1983. The value of U.S. exports of all commodities increased by about 750 percent from 1963 to 1983, or at an average annual rate of approximately 11 percent.· ·
ll The sum of trade for Western Europe and Japan is also included under the heading "Traditional Petroleum Products."
"l:_I Any shift in the sectoral production of chemicals would be expected to have effects throughout the industrial economy. Such items as plastics amd other chemical industry products are used in the manufacture of products from almost all other sectors of the U.S. industrial economy.
97
The value of U.S. merchandise exports to the OECD increased from $12.9 billion in 1963 to $113.8 billion in 1983, while the value of U.S. merchandise exports to Western European nat,ions increased from $6. 8 billion in 1963 to $53.2 billion in 1983. During 1979-83, the growth in exports to OECD nations slowed considerably, increasing at an average annual rate of only 2.9 percent. The rate of increase in the value of merchandise exports to Western Europe also declined during 1979-83, increasing only from $49.6 billion to $53.2 billion, or at an average annual rate of 1.8 percent.
The value of U.S. merchandise exports to Japan increased at a faster rate than OECD or Western European exports during 1979-83·, increasing by an average annual rate of 5.2 percent. This rate o.f increase ·is more related to increasing J·apanese ri;ltionalization than to increased demand. Japanese--bound exports increased overall from·a value of $1.7. billion in 1963 to $21.2 billion in 1983. · · ,
U.S. Chemical Trade ......
U.S. chemical exports increased from $17.5 birlion in 1979 to $21.5 billion in 1981, then declined to $20.0 billion in 1983 (table 15) .. The average annual growth rate through this entire period was more than1 3.4 percent (figure 12).
Industry sources report that several factors have contributed to ·the recent trend of decreasing U.S. exports of chemicals. 11 First, the strength of the U.S. dollar relative to other major currencies has generally made U.S. chemicals more costly than ~he foreign-made counterparts: On a trade-weighted basis, the dollar appreciated SO percent during 1980-83. Therefo·r~ ~ foreign markets generally opted for foreign-;made chemicals in many instances,· especially where price was the major consideration. Second, mos't of the industrialized world did not enjoy the same degree of economic recovery in 1983 as did the United States. This restrained the foreign markets from regaining demand to the same extent as the U.S. market; also, as foreign chemical producers were trying to operate near· capacity, their prices to domestic consumers seemed even more attractive. Z/ Additionally, U.S. chemical exports, especially ethylene-derived commodity petrochemicals, faced competition for foreign markets from such energy-rich sources as Canada,
!I "A Big Trade Setback for U.S. Producers," Chemical Week, Feb. 29, 1984, pp. 24-27; and, "U.S. Surplus in Chemical Trade Narrows Again As Exp°orts Drop," Chemical & Engineering News, Dec. 19, 1983, pp. 27 and 29.
l-._I "Chemical Trade Squabbles: The Industt·y is Divided Over Protectionism," Chemical Week, Mar. 28, 1984, pp. 34-39; "Chemicals and Materials 1983 Review/ 1984 Forecast," Elastomerics, February 1984, pp. 13-19; "U.S. Chemical Industry's 1984 outlook," Hydrocarbon Processing, January 1984, p. 21; "CMA.'s Foveaux Sees Reason to Smile as Chemical Results Keep Looking Strong," Chemical Marketing Reporter, Dec. 19, 19.83, pp: 3 and 24; and, "The Chemical Trade Balance Still Narrow," Chemical Week, Nov. 30, 1983, pp. 14 and 15.
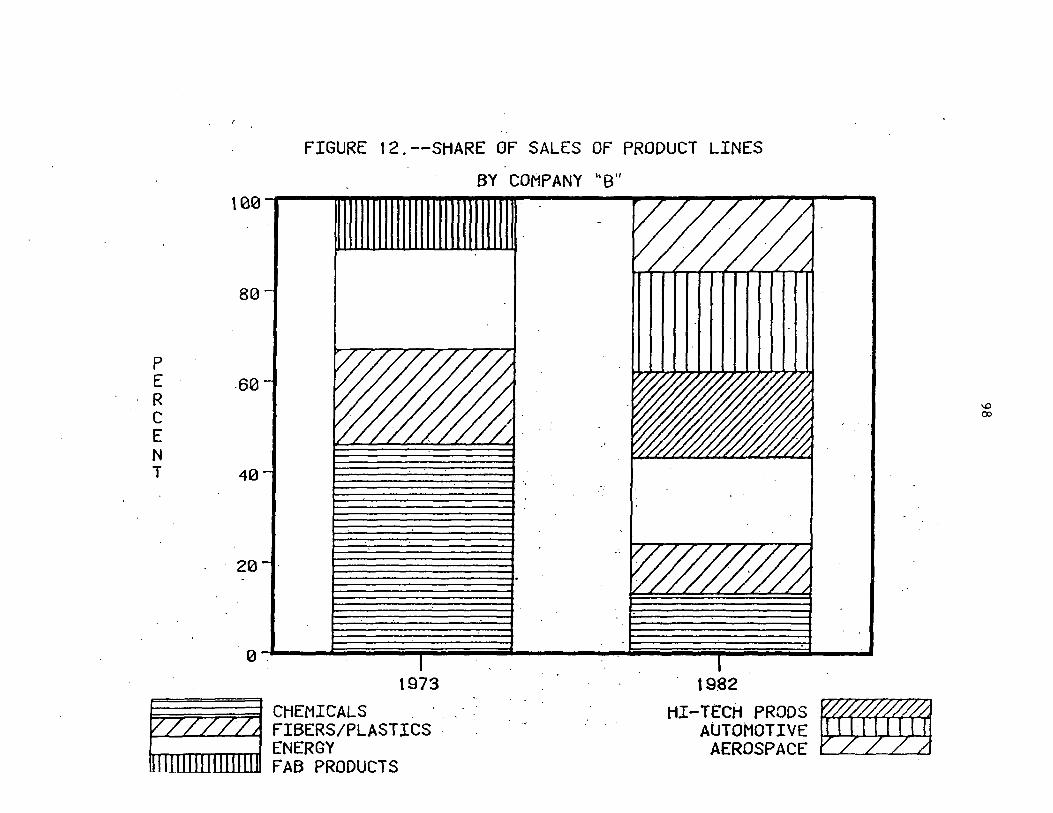
FIGURE 12.--SHARE OF SALES OF PRODUCT LINES
BY COMP ANY "B ''
p E R c E N T
100
80
-60
40
20
0~ ....... --~------ipiiiiiiiiiiiiiiiiiiiiiiiiiiiiii-=.--------~iiiiiiiiiiiiiiiiiiiiiimiiiiiiiimpiiiiiiiiiiiiiiiiiiiiiiiiiiimiiiiiiiiiii&....--.,;,.1
1973
~::;;=;;;::::;;:::;;:::::;;;::f CHEMICALS ,__.._.....__ __ __.__"'""1 FIBERS/PLASTICS · lrTTTTTTTTTT'TTTT"1'"nt ENERGY
l.LJ...L.l~ FAB PRODUCTS
t9.82
HI-TECH PRODS -AUTOMOTIVE
AEROSPACE
"° 00
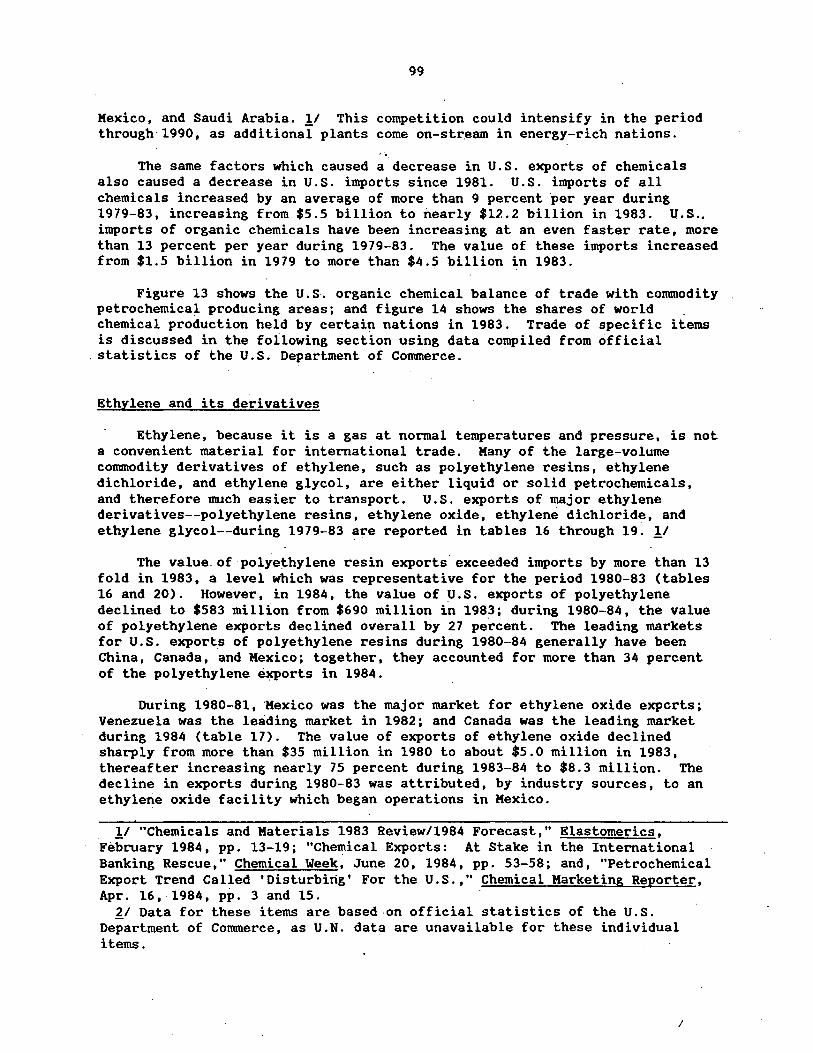
99
Mexico, and Saudi Arabia. 11 This competition could intensify in the period through 1990, as additional plants come on-str.eam in energy-rich nations.
The same factors which caused a decrease in U.S. exports of chemicals also caused a decrease in U.S. imports since 1981. U.S. imports of all chemicals increased by an average of more than 9 percent per year during 1979-83, increasing from $5.5 billion to nearly $12.2 billion in 1983. u.s .. imports of organic chemicals have been increasing at an even faster rate, more than 13 percent per year during 1979-83. The value of these imports increased from $1.5 billion in 1979 to more than $4.5 billion in 1983.
Figure 13 shows the U.S. organic chemical balance of trade with commodity petrochemical producing areas; and figure 14 shows the shares of world chemical production held by certain nations in 1983. Trade of specific items is discussed in the following section using data compiled from official
. statistics of the U.S. Department of Commerce.
Ethylene and its derivatives
Ethylene, because it is a gas at normal temperatures and pressure, is not a convenient material for international trade. Many of the large-volume commodity derivatives of ethylene, such as polyethylene resins, ethylene dichloride, and ethylene glycol, are either liquid or solid petrochemicals, and therefore much easier to transport. U.S. exports of major ethylene derivatives--polyethylene resins, ethylene oxide, ethylene dichloride, and ethylene glycol--during 1979-83 are reported in tables 16 through 19. 11
The value.of polye~hylene resin exports· exceeded imports by more than 13 fold in 1983, a level which was representative for the period 1980-83 (tables 16 and 20). However, in 1984, the value of U.S. exports of polyethylene declined to $583 million from $690 million in 198~; during 1980-84, the value of polyethylene exports declined overall by 27 percent. The leading markets for U.S. exports of polyethylene resins during 1980-84 generally have been China, Canada, and Mexico; together, they accounted for more than 34 percent of the polyethylene exports in 1984.
During 1980-81, ·Mexico was the major market for ethylene oxide exports; Venezuela was the leading market in 1982; and Canada was the leading market during 1984 (table 17). The value of exports of ethylene oxide declined sharply from more than $35 million in 1980 to about $5.0 million in 1983, thereafter increasing nearly 75 percent during 1983-84 to $8.3 million. The decline in exports during 1980-83 was attributed, by industry sources, to an ethylene oxide. facility which began operations in Mexico.
ll "Chemicals and Materials 1983 Review/1984 Forecast," Elastomerics, February 1984, pp. 13-19; "Chemical Exports: At Stake in the International Banking Rescue," Chemical Week, June 20, 1984, pp. 53-58; and, "Petrochemical Export Trend Called 'Disturbing' For the U.S.," Chemical Marketing Reporter, Apr. 16, 1984, pp. 3 and 15.
~I Data for these items are based on official statistics of the U.S. Department of Commerce, as U.N. data are unavailable for these individual items.
I
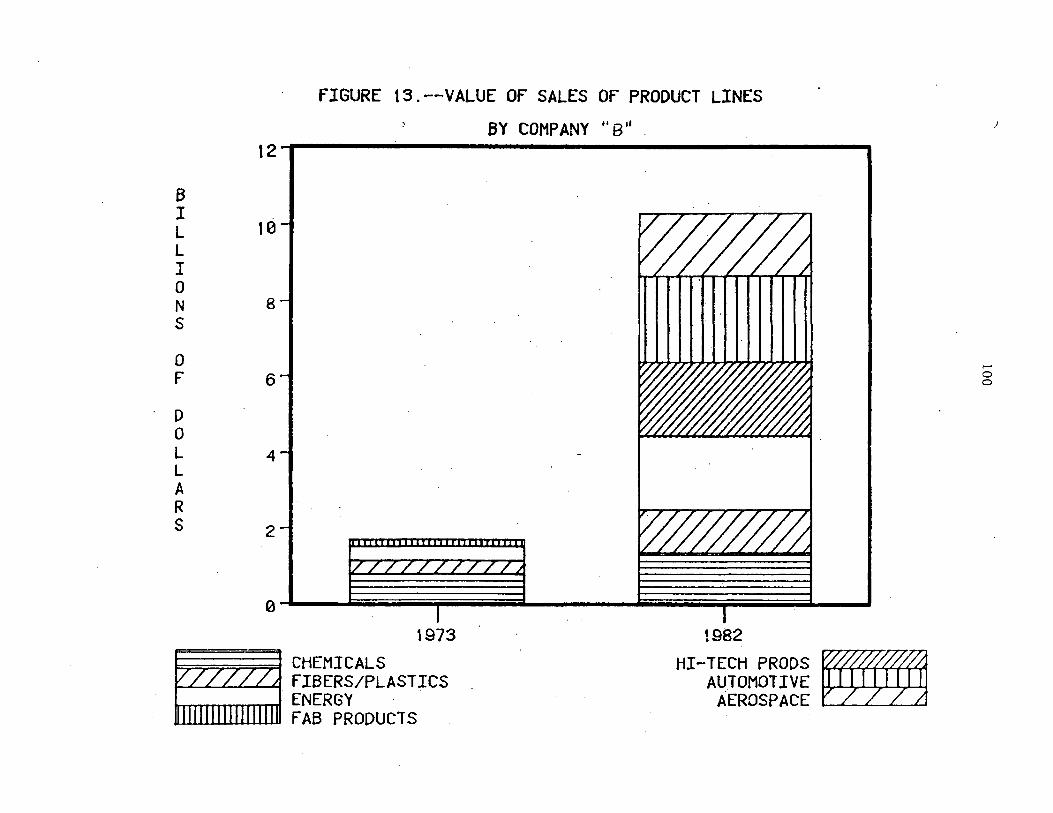
B I L L I 0 N s
0 F
D 0 L L A R s
12
10
8
6-I
4
2
FIGURE 13.--VALUE Of SALES Of PRODUCT LINES
BY COMP ANY " 8 11
~ I
I I ~ i""i""'I I 0 zzzzzrzzzj t t973
t=;:=:;:=;::::::;::=;;;::::;;::t CHEMIC AL S f--L--'---'L.....£-~ FIBERS/PLASTICS .......................... ....,.........,_........i ENERGY &Ll-l-UL..L.1-&..L~............., F AB PRODUCTS
1982
HI-TECH PRODS -AUTOMOTIVE
AEROSPACE
,I
,_. 0 0
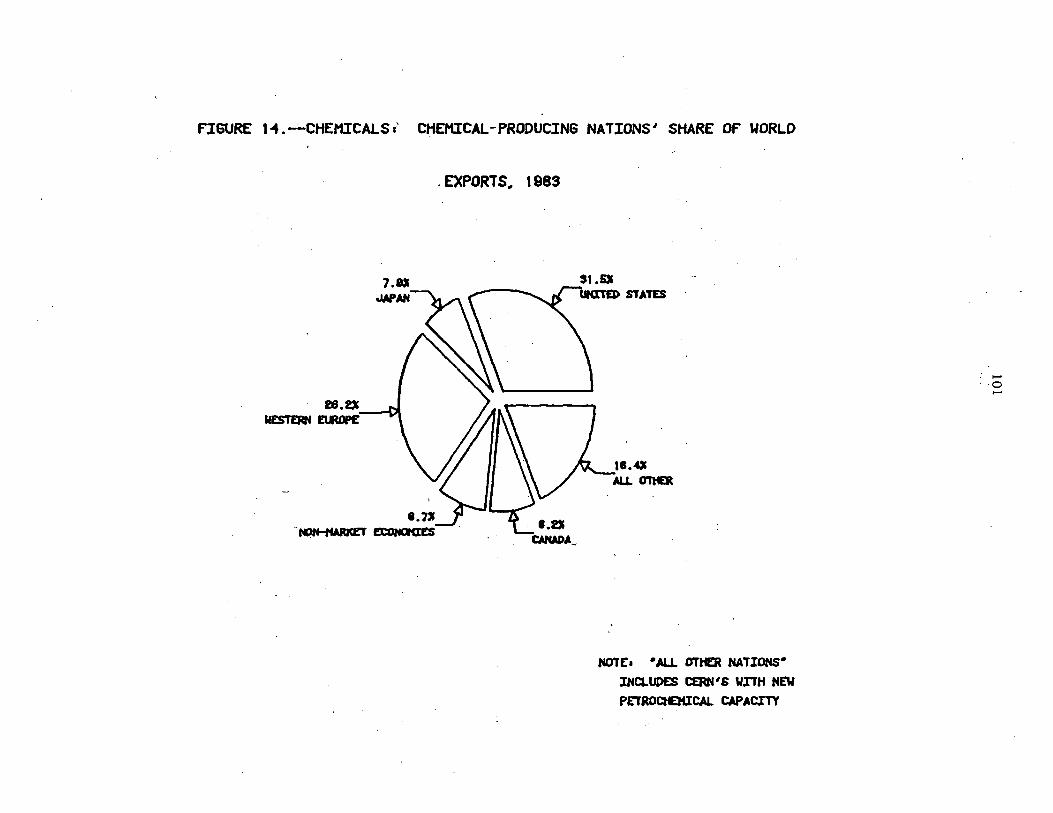
FIGURE 1 '4. -;...CHEMICALS,~ CHEMICAL -PRODUCING NATIONS' SHARE Of WORLD
28.0 ~ El.RDPE----ul
•.7J -~ £COiQtIES.
.EXPORTS .. 1983
CWW>A_
NOTE• •ALJ.. OTHER NATIONS•
~C:Ult>E'S CERN'S \IITH NEW PETROatEHICAL CAPACITY
..... ·O .....
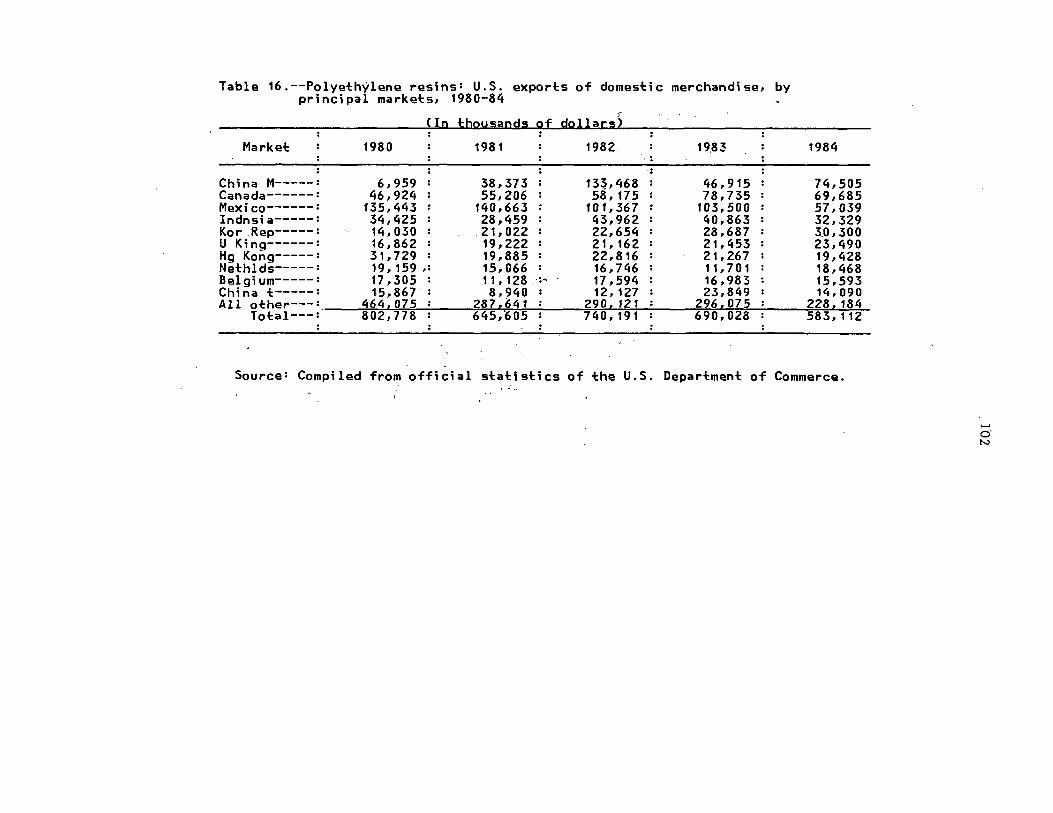
Table 16.--Polyethylene res;ns: U.S. exports of domest;c merchand;se, by pr; nc; pal markets, 1980-84
~
Cln thousands of dollars)
Market 1980 1981 1982 19,83 . : ·:
1984
Ch;na M-----: 6,959 : 38,373 : 133,468 : 46,915 : 74,505 Canada------: 46,924 : 55,206 : 58,175 : 78,735 : 69,685 Mex;co------: 135,443 : 140,663 : 101,367 : 103,500 : 57,039 Indns;a-----: 34,425 : 28,459 : 43,962 : 40,863 : 32,329 Kor.Rep-----: 14,030 : 21,022: 22,654: 28,687 : 3.0,300 U K;ng------: 16,862 : 19,222 : 21, 162 : 21,453 : 23,490 Hg Kong-----: 31,729 : 19,885 : 22,816 : 21,267 : 19,428 Nethlds-----: 19, 159 ,: 15,066 : 16,746 : 11,701 : 18,468 Belg;um-----: 17,305: 11,128.·:~ 17,594: 16,983: 15,593 Ch;na t-----: 15,867 ·: 8,940 : 12, 127 : 23,849 : 14,090 All other---:. 464,075: 287,641: 290,121: 296,075: 228,184
Total---: 802,778 : 645,a05 : 740,191 : 690,028 : 583,112
Source: Comp;led from off;c;al stat;st;cs of the U.S. Department of Commerce.
..... o· N
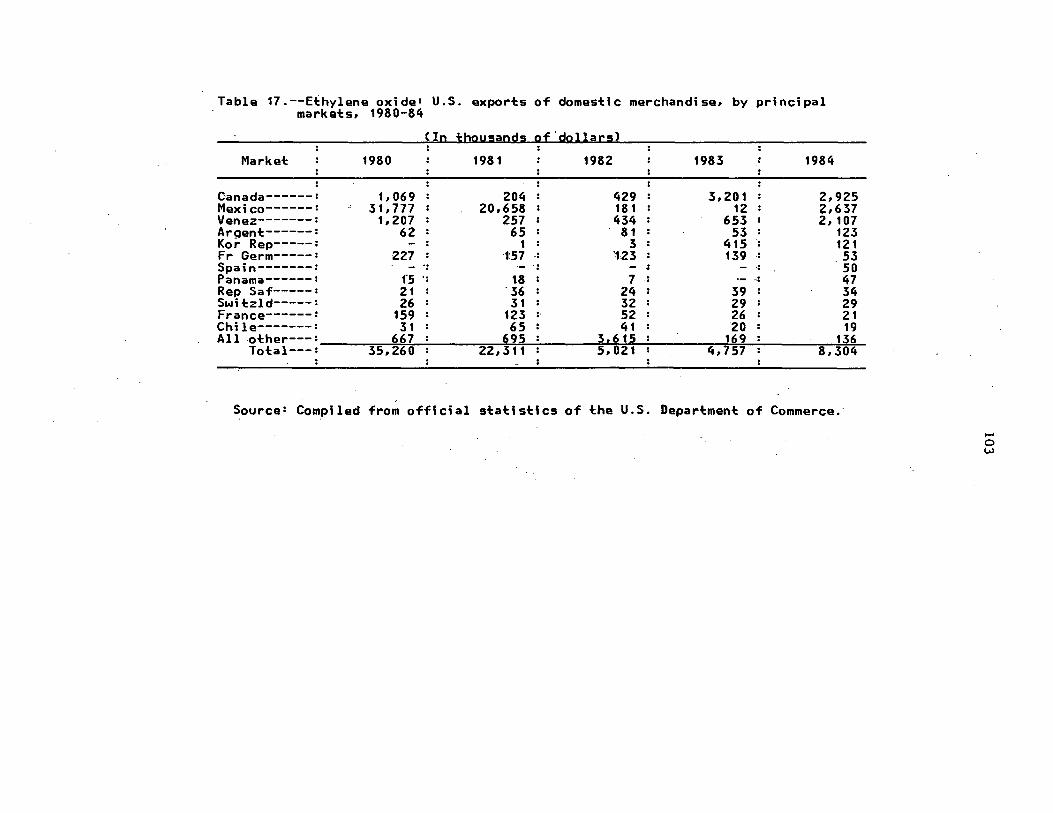
Table 17.--Ethylene oxide= U.S. exports of domestic merchandise, by principal markets, 1980-84
~Ic tbau5acd5 gf 'dallac5l . . : . . Market : 1980 : 1981 : 1982 : 1983 1984
: : : : : : : : :
Canada------: 1, 069 : 204 : 429 : 3,201 : 2,925 Mexico------: 31, 777 : 20,658 : 18 1 : 12 : ~.637 Venez-------: 1, 207 : 257 : 434 : 653 : 2, 107 Argent------: 62 : 65 : 81 : 53 : 123 Kor Rep-----: - : 1 : 3 : 415 : 121 Fr Germ-----: 227 : 1:57 : '123 : 139 : 53 Spain-------: - ~: ·- ··: - : - ·: 50 Panama------: rs ·: t8 : 7 : .,_ .. : 47 Rep Saf-----: 21 : '36 : 24 : 39 : 34 Switzld-----: 26 : 31 : 32 : 29 : 29 France------: 159 : 123 :· 52 : 26 : 21 Chile-------: 31 : 65 : 41 : 20 : 19 All other---: 667 : ~95 : 3i615 : 169 : 136
Total---: 35,260 : 22,311 : s,021 : 4, 757 : 8,304
Source: Compiled from official statistics of the U.S. Department of Commerce.
...... 0 w

Table 18.--Ethylene dichloride: U.S. exports of domestic merchandise, by principal markets, 1980-84
C In thousands_0f dallars) :-
Market : 1980 : 1981 : 1982 : 1983 : : : : : : : : : :
Japan-------: 23, 677 : 23,207 : 41,579 : 66,682 : China t-----: 36,246 : 29,615 : 25,447 : 37, 583 : Mexico------: 2,849 : 562 : 4 : 5,190 : Colomb------: - : - : - : - : India---:-----: - : 757 : - : - : Peru--------: 797 : 2, 709 : 782 : 330 : Venez-------: - : 1 : - : - : Singapr-----: 68 : 126 : 6e : 140 : Canada------: 189 : 91 : ,. : 4 : ::J
Belgium-----: - : - : 1 : - : All other---: 11 559 : 409 : 2 222 : 687 :
Total---: 7 5, 384 : 57,476 : 7 0, 1 06 : 110,616 :
1984
52,258 13,280 11,012
1,997 926 753 535
65 18 5
11 80,859
Source: Compiled from official statistics of the U.S. Department of Commerce.
I-'
0 ~

. Table 19.--Et:hylena glycol= U.S. exports of domestic merchandise. by principal market:s, 1980-84
Ctn thousands of clollacs) :
Marke~ 1980 1981 1982 1983 1984
Japan-----.--: 19,486 : 4,323 30,059 : Z8,71Z : 28,572 Belgium-----: 329 : 2, 623 3, 333 : 6;84'5 : 24; 496 Kor Rep-----: 8, 115 : 10,064 10,651 : 12,614 : 14,962 Rep Saf-----: 3,331 : 4,652 : 5,824 : 9,611 : tZ,371 Turkey------: -"" : 3,440 : 6,371 : 10,309 : 10,255 Haly-------: - : 2 : 3 : 4,670 : 9,051 <;bina t-----: 979: 4,647: 6,965: 15,448: 7~'649 Venez-------: 2,501: 3,350: 2,374: 2,549: 5,689 S'pO .. \'I'\-------: - : - : - ·: - : 5•598 Colomb------: 4, 051 : 3, 684 : 2, 099 : Z, 470 : 3, 434 All other---: 21,074 : 15, 121 : 22, 177 : 23,685 : 16,643
Tot:al---: 59,865 : 51,906 : 39,856 : 116,912 : t38,7ZI
: "' Source: Compiled from official st:aH5Hcsof the U.S •. Department: qf Commerce.
...... 0 V'I
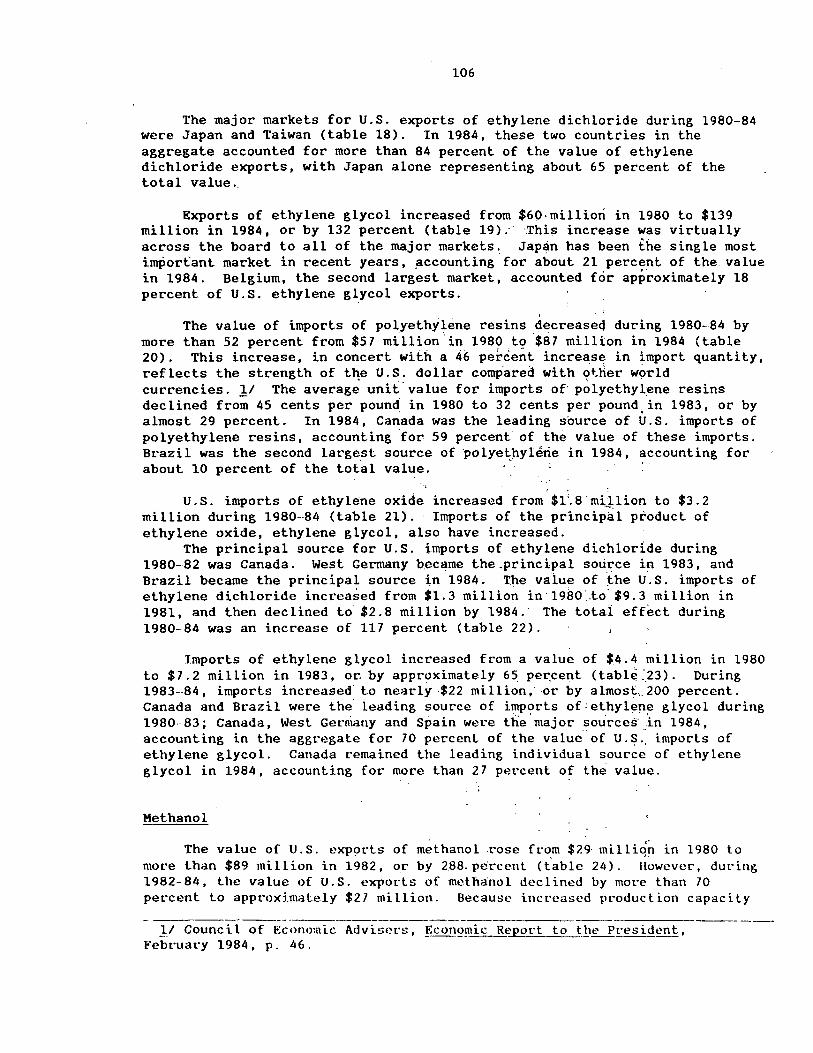
106
The major markets for U.S. exports of ethylene dichloride during 1980-84 were Japan and Taiwan (table 18). In 1984, these two countries in the aggregate accounted for more than 84 percent of the value of ethylene dichloride exports, with Japan alone representing about 65 percent of the total value.
Exports of ethylene glycol increased from $60·milliori in 1980 to $139 million in 1984, or by 132 percent (table 19) .-· ·This increase was virtually across the board to all of the major markets'. Japan has been the single most import::ant market in recent years, .accounting for about 21 percent of the value in 1984. Belgium, the second largest market, accounted fcir app.roximately 18 percent of U.S. ethylene glycol exports.
The value of imports of polyethylene resins decreaseq during 1980-84 by more than 52 percent from $57 million in 1980 to $B7 million in 1984 (table 20). This increase, in concert with a 46 percent increase in import quantity, reflects the strength of U~e U.S. dollar comp.ared with ot.lier world currencies. 1/ The average unit' value for imports of· polyethylene resins declined fro; 45 cents per pound in 1980 to 32 cents per pound .in 1983, or by almost 29 percent. In 1984, Canada was the leading source of U.S. imports of polyethylene resins, accounting ·for 59 percent of the value of these imports. Brazil was the second large_st source of polyetJ1ylerie in 1984, accounting for about 10 percent of the total value.
U.S. imports of ethylene oxide increased from $1'.8 miJlion to $3.2 million during 1980--84 (table 21). Imports of the principal product of ethylene oxide, ethylene glycol, also have increased.
The principal source for U.S. i..mports of ethylene dichloride during 1980-82 was Canada. West Germany b.ecame the .principal soli_rce i~ 1983, and Brazil became the principal source ~n 1984. The value of the U.S. imports of ethylene dichloride inct·eased from $1. 3 million in· 1980 .. to· $9. 3 million in 1981, and then declined to $2.8 million by 1984. The total eff~ct during 1980-84 was an increase of 117 percent (table 22). ,
Imports of ethylene glycol increased fr:om a value of $4.4 million in 1980 to $7.2 million in 1983, or, by approximately 6~ per.cent (table'..23). During 1983--84, imports increased· to ne:irly $22 million; or by almost .. 200 percent. Canada and Brazil wer:e the· leading source of imports of: ethylep.e glycol during 1980- 83; Canada, West Gern\any and Spain were the.major .sou.rces· )n 1984, accounting in the aggrt-~gate for: 70 percent of the value of u. ~ .. imports of ethylene glycol. Canada remained the leading individual source of ethylene glycol in 1984, accounting for more than 27 percent of th~ value.
Methanol
The value of U.S. exports of methanol rose ft·om $29 millio~ in 1980 to more than $89 million in 1982, or by 288. percent (t.able 24). H~wcvcr, dudng 1982-84, the value of U.S. exports of mctha·nol declined by more than 70 percent to approximately $27 million. Because increased peoduclion capacity
----------1/ Council of fi:conomic Advisers, f.con2!nic Repot:!.__!..2_t!_1e PL"esi~cnt,
February 1984, p. 46.
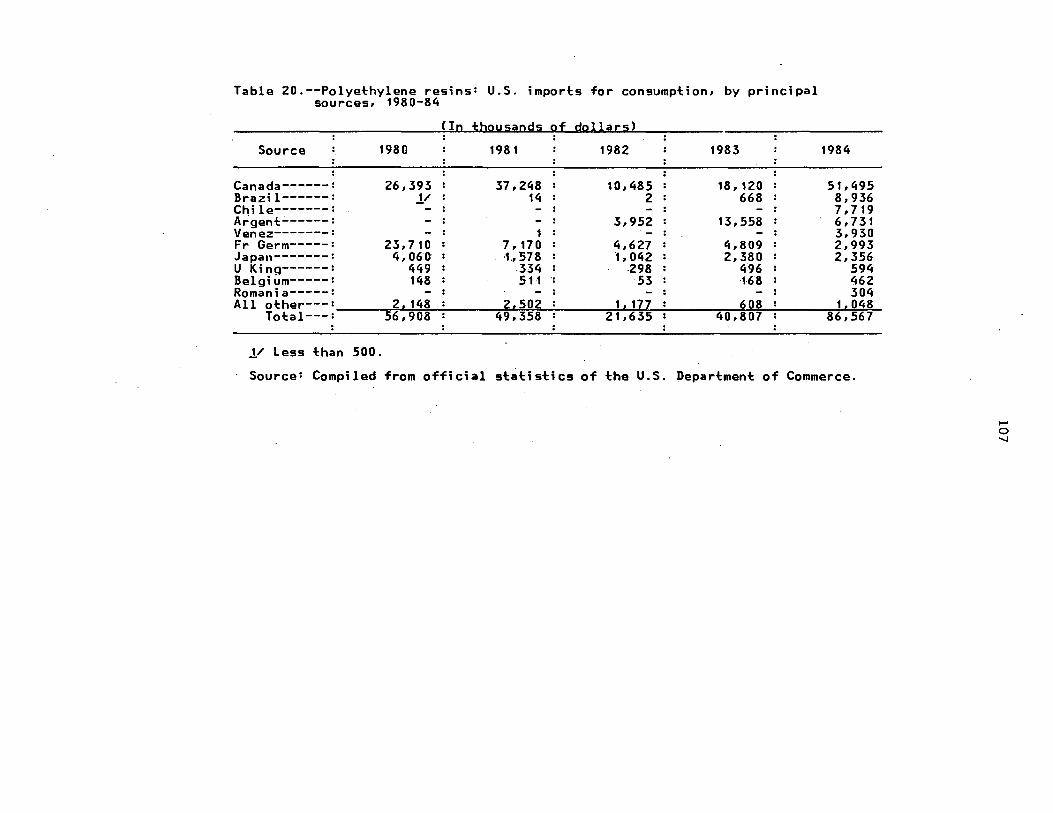
Table 20.--Polyethylene resins= U.S. imports for consumption, by principal sources, 1980-84
Cln thousands of dollars)
Source 1980 1981 1982 1983 1984
Canada------: 26,393 : 37,248 : 10,485 : 18,120 : 51,495 Brazil------: 1/ : 14 : 2 : 668 : 8,936 Chile-------: -- : - : - : - : 7,719 Argent~-----: - : - : 3,952 : 13,558 : 6,731 Venez-------: - : 1 : · - : - : 3, 930 Fr Germ-----: 23,710 : 7,170 : 4,627 : 4,809 : 2,993 Japan-------: 4,060 : ·1.,:S78 : 1,042 2,380 : 2,356 U Ki nq------: 449 : .334 : -298 496 : 594 Belgium-----: 148 : 511 ·: 53 ·168 : 462 Romania-----: - : - : - - : 304 All other---: 2,148 : 2,502: 1,177 608: 1,048
Total---: 56,908 : 49,358 : 21,635 40,807 : 86,567
j/ Less than 500.
Source= Compiled from official statistics of the U.S. Department of Commerce.
-0 .......
Table 21.--Ethylene ox;de: U.S. ;mports for consumpt;on, by pr;nc;pal sources, 1980-84
C In thousands o_f dollars)
Source 1980 198 t 1982 : 1983 : 1984 : :
Canada------: 1, 764 3 1
13,050 6
3, 182 : 2,622 : 3, 17 1 Fr Germ-----: U Kinq------: Sweden------: Japan-------: France------:
Total---:
1/ Less than 500.
1 1
1, 769
1 376
y -
13,056 3,559
: 17 : 22 : 15 : 12
40 : 2 : - : -: 2,695 : 3,205
Source: Comp;led from official statistics of the U.S. Department of Commerce.
...... 0 00
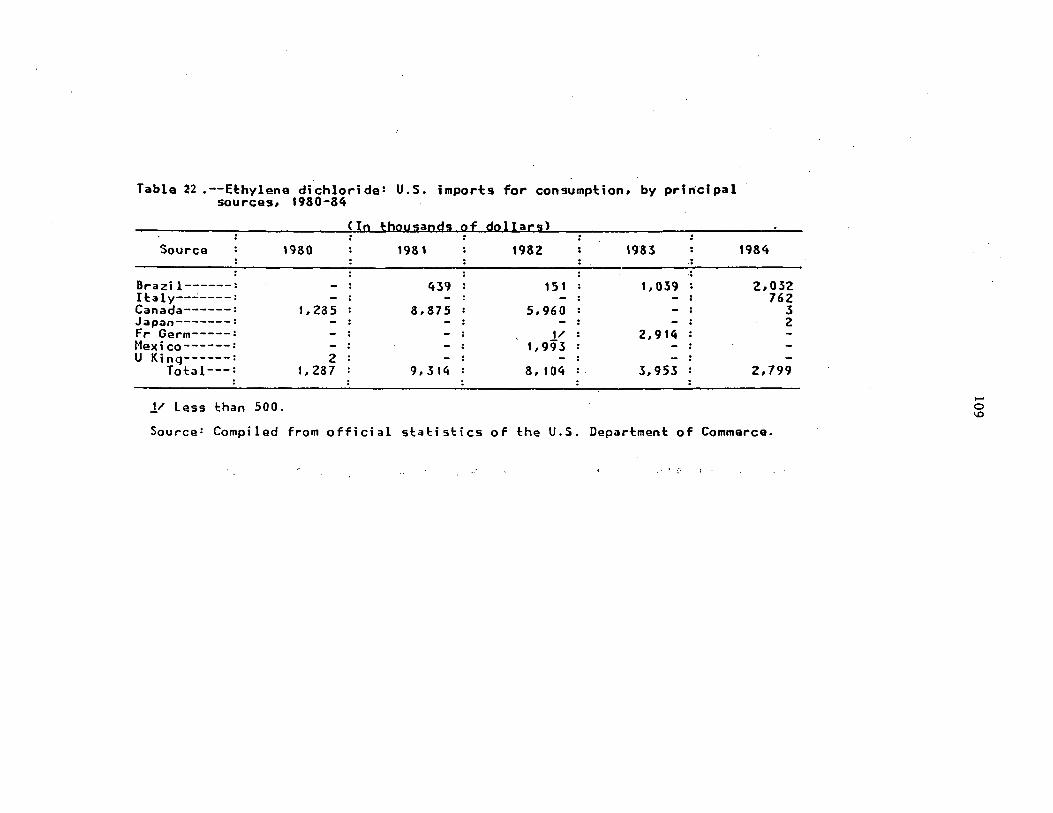
Table ~2 .--Et:hylene dichloride= U.S. impod:s for consumpt:ion. by principal sources, 1980-84
Source
Br-azil------: H:aly--..:----: Canada------: Japan-------: Fr- Germ-----: Mexico------: U Kinq------:
Tot:al---:
l/ less t:han 500.
1930
I, 235
2 1, 237
Cin ~housands of dollars)
1981 198Z
439 15 1
8,875 5,960
I/ I, 993
-9,314 8, I 04
: 19&3 : : : : " : 1, 039 :
: - :
: 2,914
: - : : 3,953 :
:
1984
Z,032 762
3 2
2,799
Source: Compiled from official st:at:ist:ics of t:he U.S. Depart:ment: of Commerce.
,_. 0
'°
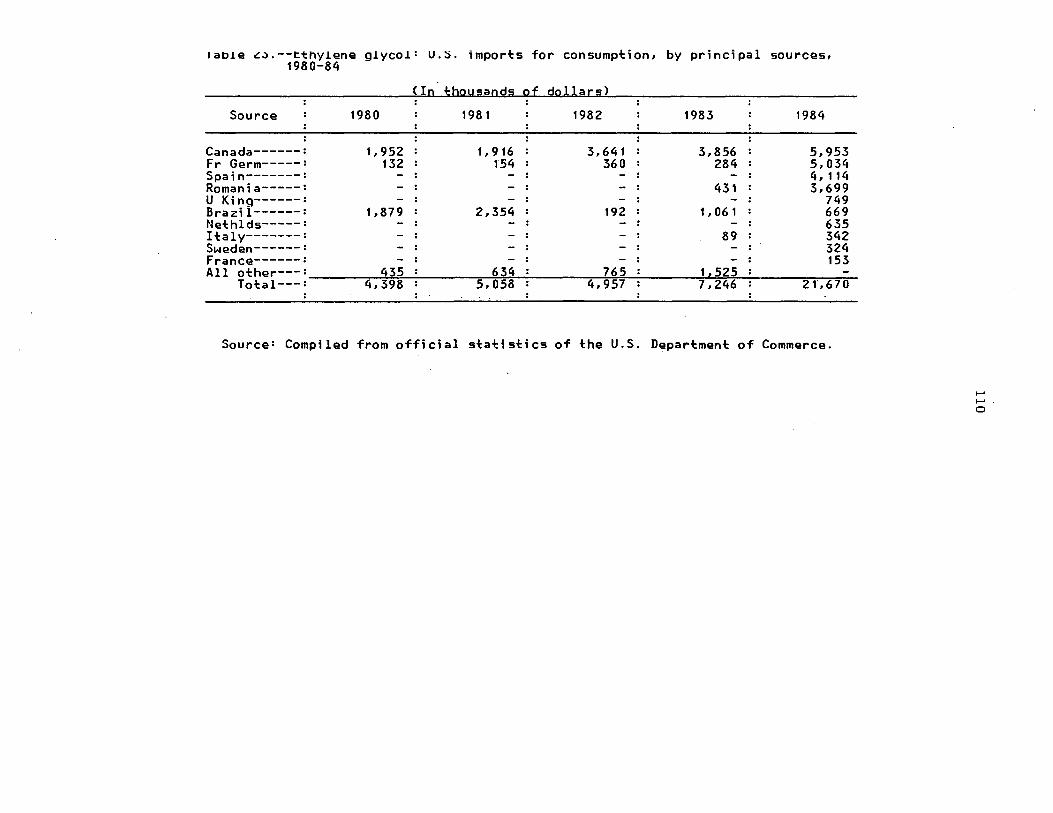
1ao1e £~.--~thylene glycol: 1980-84
u. :>. imports for consumpt;on, by pr; nd pal sources,
Cle ~bgy5acg5 af dallar5) : . . : . .
Source : 1980 : 198 1 : 1982 : 1983 : 1984 : : : :
Canada------: 1, 952 : 1, 916 : 3, 641 : 3,856 : 5,953 Fr Germ-----: 132 : 154 : 360 : 284 : 5,034 Spa;n-------: - : - : - : - : 4, 114 Roman; a-----: - : - : - : 431 : 3,699 U K;ng------: - : - : - : - : 749 Braz;!------: 1,879 : 2,354 : 192 : 1, 06 1 : 669 Nethlds-----: - : - : - : - : 635 Italy-------: - : - : - : 89 : 342 Sweden------: - : - : - : - : 324 France------: - : - : - : - : 153 All other---: 435 : 634 : 765 : 1£525
Total---: 4,398 : 5,058 : 4,957 : 7,246 : 21,670
Source: Comp;led from off;c;al stat;st;cs of the U.S. Department of Commerce.
......
...... 0
111
coming on stream in Canada and Saudi Arabia is adding more low-priced material to the continuing oversupply in world methanol markets. U.S. exports are expected to continue to decline.
Meanwhile, U.S. i.mports of methanol, primarily from Canada, have been increasing from $16 million in 1980 to, $57. mi_llion in 1984, or by 244 percent (table 25). Canada has remained the major source of these imports during 1980-84, accounting for about 90 percent of all methanol imports in 1983. Imports of methanol from Canada increased by by 476 percent during this period. Imports of methanol from~ a new plant in Trinidad entered t.he United States for the first time in 1984.
The value of U.S. exports of anhydrous ammonia remained fairly constant during 1980-82, decreasing from $107 million to $101 million (table 26). However, in 1983, as additional ammonia capacity came onstream i.n CERN's, U.S. ammonia exports fell to $48 million, or by 52 percent. / A possible reason for this decline is that several export markets-·--Turkey, Spain, and Mexico 2/-no longer purchased as much u. s. -produced ammonia·~ and instead began relying on either their own new production of ammonia, or imports from other nations (e.g., Mexico and Trinidad) where new ammonia facilities haye come onstream. During 1984, the value of U.S. exports increased to $89 million, with the major markets being Korea, the Philippines, and Taiwan.
As several of these new ammonia fa.cilities based on lower-cost natural gas feedstock came onstream in Canada, Mexico, and Trinidad, ammonia imports became more price-competitive with domestic production. Asa result, imports ft"om these nations increased during 1980-84 (table 27). Also, imports from the Soviet Union increased during 1980--84. 3/ The value of U.S. ·ammonia imports steadily increased ft"om $248 million in 1980 to nearly $474 million in 1984, or by approximately 91 percent.
11 Other nations which purchased significantly less U.S.-produced ammonia in 1983 than during· 1979-82 were the United Kingdom, West Germany, Trinidad, and France.
~I Imports of ammonia from the Soviet Union were part of an agt"eement with one domestic company.
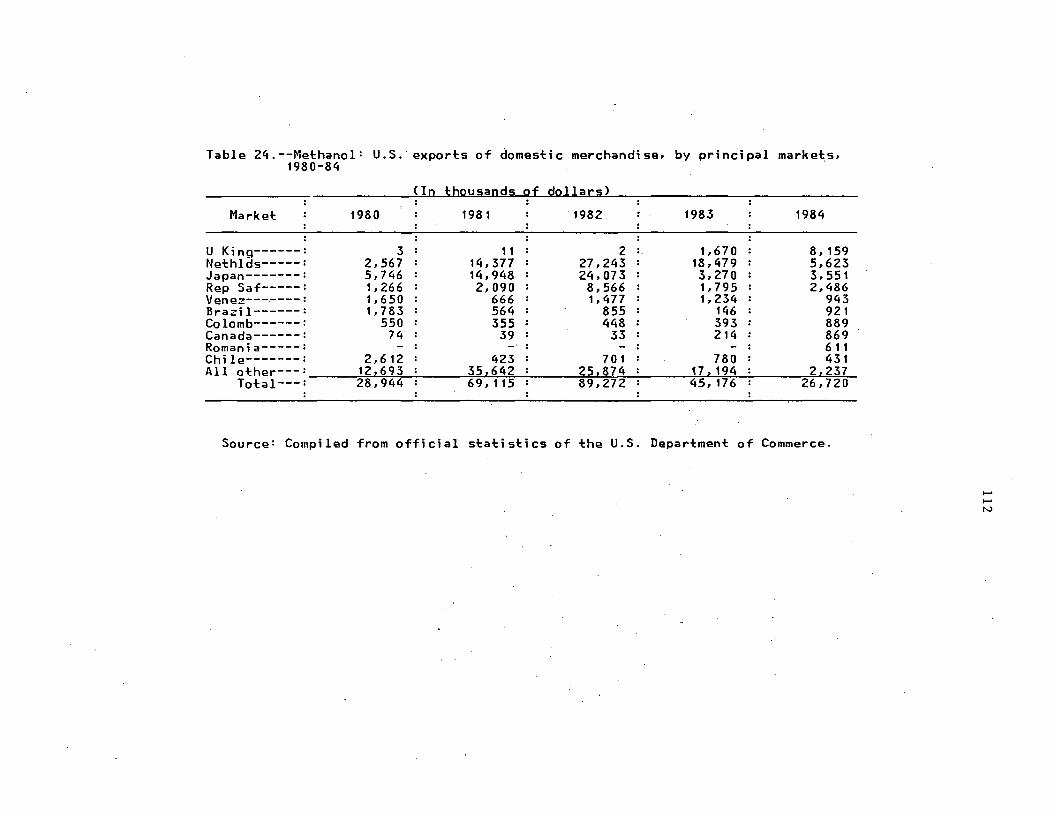
Table 24.--Methanol= U.S. exports of domestic merchandise, by principal markets, 1980-84
C I n__±bo u sa n ds___o±__doll_a_r s )
Market 1980 198 1 1982 1983 1984
U King------: 3: 11 : 2 :. 1,670 : 8,159 Nethlds-----: 2,567 : 14,377 : 27,243 : 18,479 : 5,623 Japan-------: 5,746 : 14,948 : 24,073 : 3,270 : 3,551 Rep Saf-----: 1,266 : 2,090 : 8,566 : 1,795 : 2,486 Venez---~---: 1,650 : 666 : 1,477 : 1,234 : 943 Brazi I------: 1, 783 : 564 : 855 : 146 : 921 Colomb------: 550 : 355 : 448 : 393 : 889 Canada------: 74 : 39 : 33 : 214 : 869 Romania-----: - : -·: - : - : 611 Chile-------: 2,612 : 423 : 701 : 780 : 431 All other---: 12,693 : 35,642 : 25,874 : 17.194 : 2,237
Total---: 28,944 : 69,115 : 89,272 : 45, 176 : 26,720
Source: Compiled from official statistics of the U.S. Department of Commerce.
......
...... N
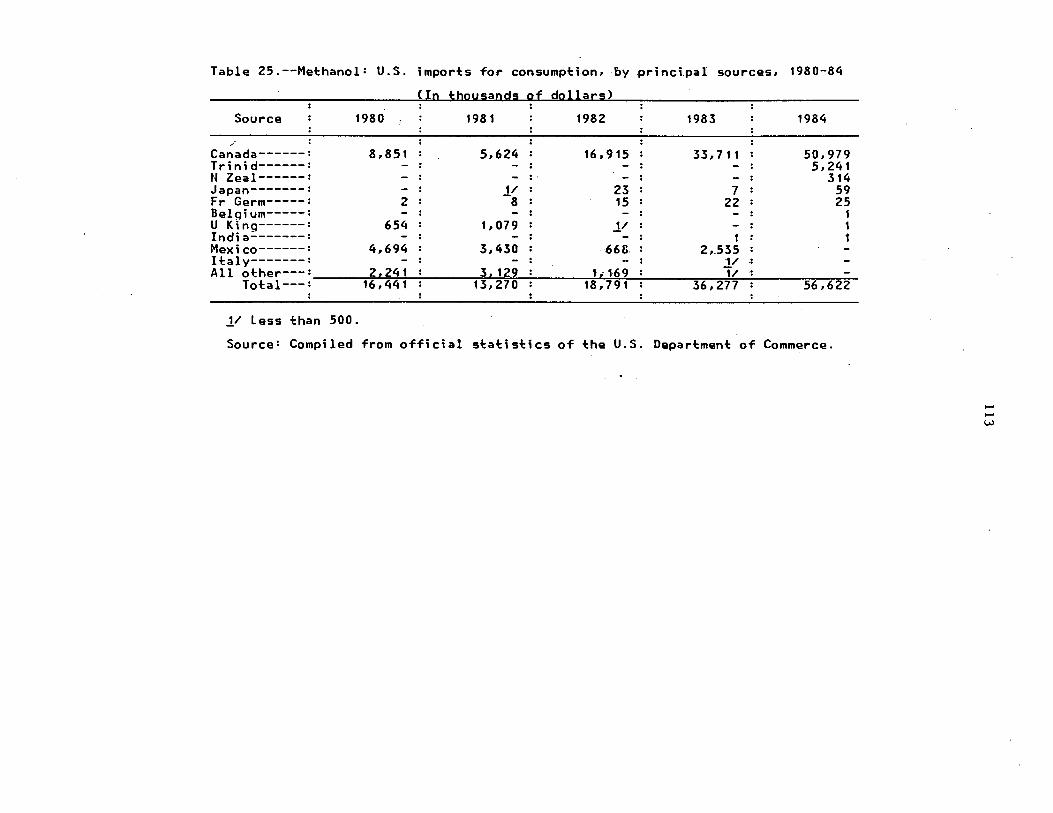
Table 25. --Methanol: U.S. ; mports for consumption, by .pri ncl.pal sources, 1980-84
Cln thousands of dollars)
Source : 1980 : 1981 : 1982 : 1983 : 1984 : : : :
/ : : : : Canada------: 8,851 : 5,624 : 16,915 : 33, 7 11 : 50,979 Tr;n;d------: - : - : - : - : 5,241 N Zeal------: - : - : . - : - : 314 Japan-------: - : l/ : 23 : 7 : 59 Fr Germ-----: 2 : 8 : 15 : 22 : 25 Belqium-----: - : - : - : - : 1 U King------: 654 : 1, 079 : l/ : - : 1 Ind; a-------: - : - : - : 1 : 1 Mex; co------: 4,694 : 3,430 : 668 : 2,,535 Italy-------: - : - : - : 1/ .• All other---: 2i241 : 3i 129 : 1i169 : 1/
Total---: 16 I 441 : 13,270 : 18 I 7 9 1 : 36 I 277 : 56,622
l/ Less than 500.
Source: Compiled from off;c;al stat;stics of the U.S. Department of Commerce.
..VJ
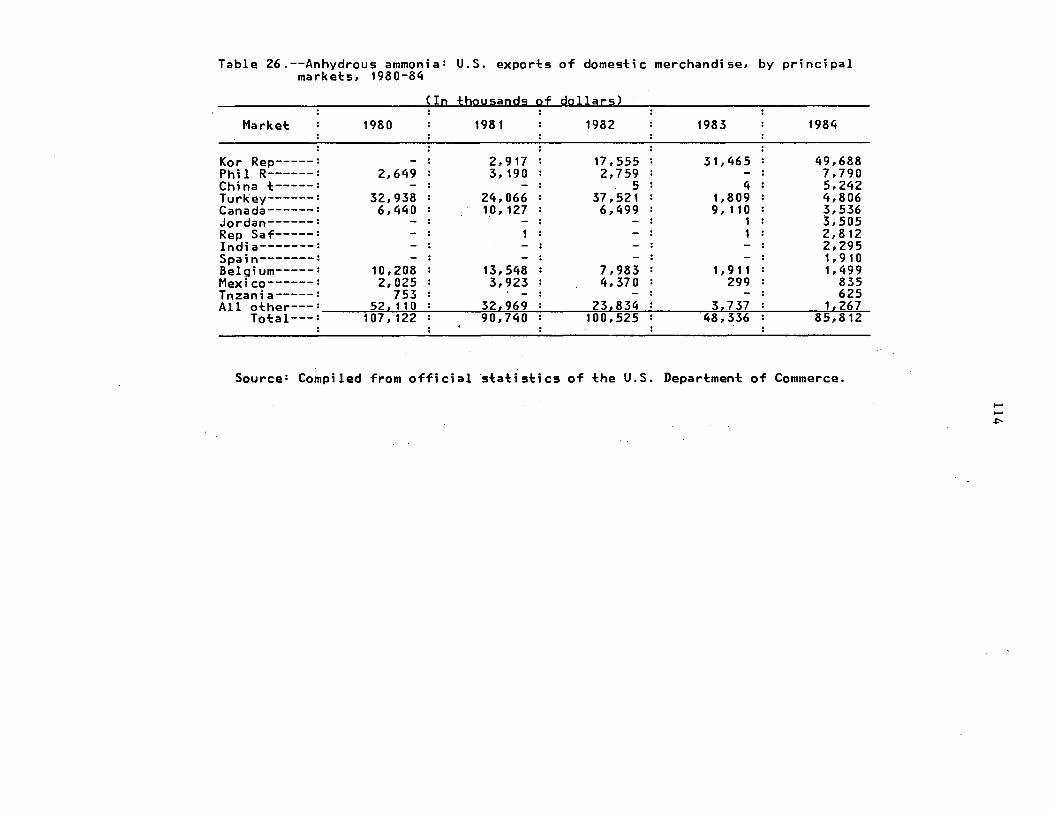
Table 26.--Anhydrous ammonia= U.S. exports of domestic merchandise, by principal markets, 1980-84
C In thouJ;ands of dollars)
Market 1980 1981 1982 1983 1984
Kor Rep-----: - : 2,917 : 17,555 : 31,465 : 49,688 Phil R------: 2,649: 3,190: 2,759: - : 7,790 China i:-----: - : - : 5 : 4 : 5,242 Turkey------: 32,938 : 24,066 : 37,521 : 1,809 : 4,806 Canada------: 6,440 : 10,127 : 6,499: 9,110 : 3,536 Jordan------: - : · - : - : 1 : 3, 505 Rep Saf-----: - : 1 : - : 1 : 2,812 India-------: - : - : - : - : 2,295 Spain-------: - : - : - : - : 1,910 Belgium-----: 10,208 : 13,548 : 7,983: 1,911 : 1,499 Mexico------: 2,025 : 3,923 : 4,370 : 299 : 835 Tnzania-----: 753 : - : - : - : 625 All other---: 52,110 : 32,969 : 23,834: 3,737 : 1,267
Total---: 107,122: 90,740 : 100,525: 48,336 : 85,812
Source: Compiled from offlcial statistics of the U.S. Department of Commerce.
.... ....
.c-.
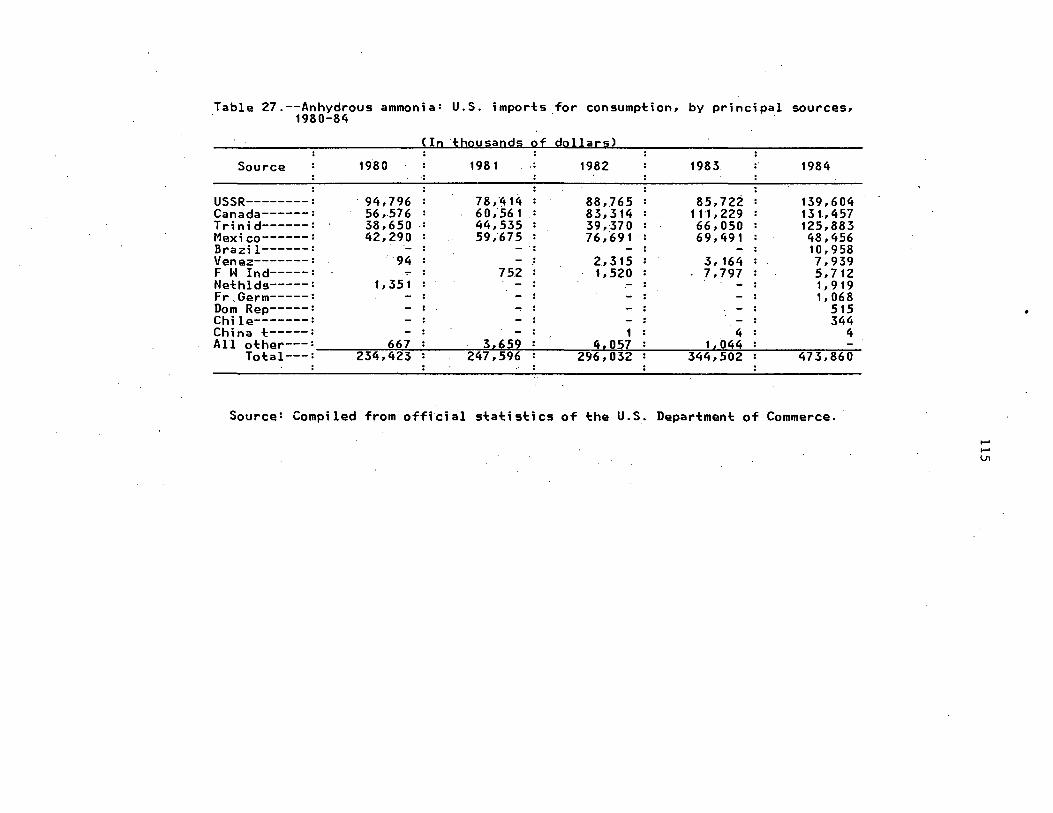
Table 27.--Anhydrous ammonia: U.S. imports for consumption, by principal sources, 1980-84 ' '
Cln ·thousands of dollars)
Source : 1980 : 198 1 .. 1982 : 1983 .. 1984 .. :
USSR--------: '94,796 : 78,·414 : 81$,.765 : 85,722 : 139,604 Canada------: 56 ,.576 : 60, 56 1 : 83,314 : 11 ·1, 229 : 131.,457 Tri n id------: 38,650 : 44,535 : 39,·370 : 66,050 : 125,883 Mexico------: 42,290 : 59,675 : 76,.691 : 69,491 : 48,456 Brazil------: - : - ·: - : - : 10,958 Venez-------: 94 : - 2., 315 : 3, 164 : 7,939 F W Ind-----: .,.. : 75.2 : 1, 520 : 7,797 : 5,712 Nethlds-----: 1, 351 : - : .- : - : 1, 9 19 Fr,Germ-----: - : - : - : - : 1, 068 Dom Rep-----: - : .., : ~ : - : 515 • Chile-------: - : - : - : - : 344 China t-----: - : - : 1 : 4 : 4 All other---: 667 : 3i659 : 4i057 : 1i044
Total---: 234,423 : 247,596 : 296,032 : 344,502 : 47 3, 860 ..
Source: Compiled from offi~ial statistics of the U.S. Department of Commerce.
--V1
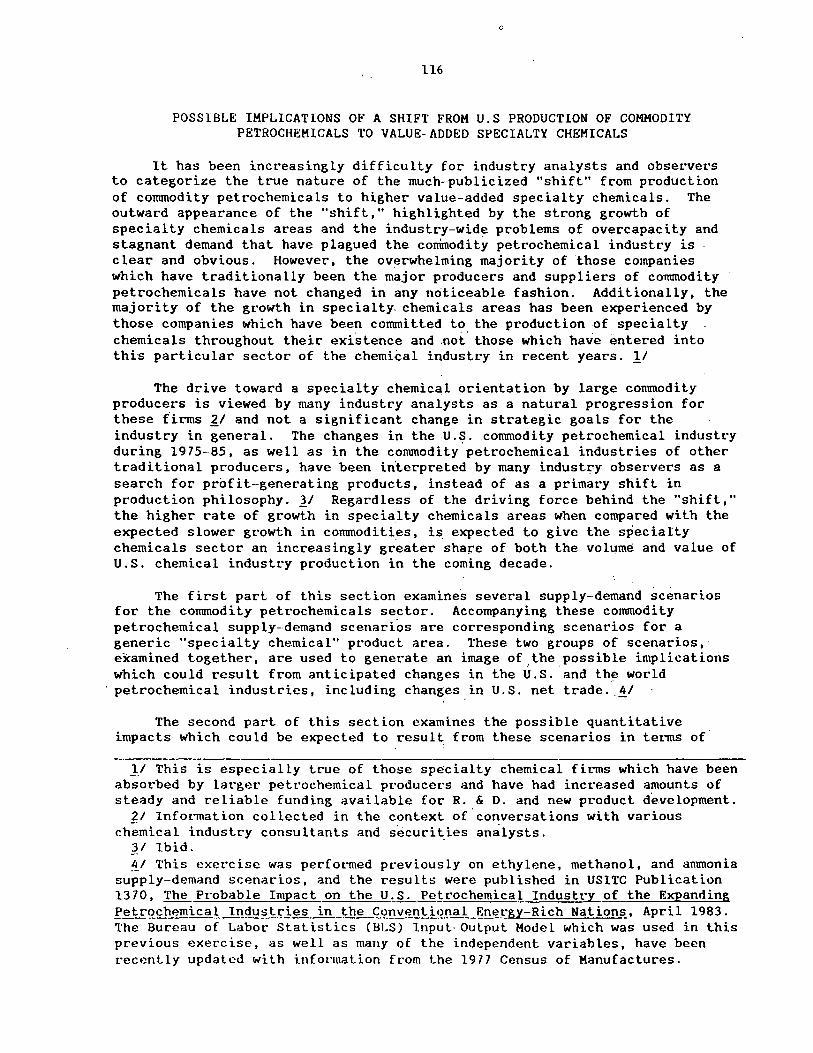
0
116
POSSIBLE IMPLICATlONS OF A SHIFT FROM U.S PRODUCTION OF COMMODITY PETROCHEMICALS TO VALUE-ADDED SPECIALTY CHEMICALS
It has been increasingly difficulty for industry analysts and observers to categorize the true nature of the much-publicized "shift" from production of commodity petrochemicals to higher value-added specialty chemicals. The outward appearance of the "shift," highlighted by the strong growth of specialty chemicals areas and the industry-wide problems of overcapacity and stagnant demand that have plagued the commodity petrochemical industry is clear and obvious. However, the overwhelming majority of 'those companies which have traditionally been the major producers and suppliers of commodity petrochemicals have not changed in any noticeable fashion. Additionally, the majority of the growth in specialty. chemicals areas has been experienced by those companies which have been committed to the production of specialty chemicals throughout their exi'stence and .not. those which have entered into this particular sector of the chemical industry in recent years. 11
The drive toward a specialty chemical orientation by large commodity producers is viewed by many industry analysts as a natural progression for these firms ~/ and not a significant change in strategic goals for the industry in general. The changes in the U.S. commodity petrochemical industt·y during 1975-85, as well as in the conunodity petrochemical industries of other traditional producers' have been in'terpreted by many industry observers as a search for profit--generating products, instead of as a primary shift in production philosophy. 'J_/ Regardless of the driving force behind the "shift," the higher rate of growth in specialty chemicals areas when compared with the expected slower gt·owth in commoditi.es, is. expected to give the specialty chemicals sector an increasingly greater share of both the volume and value of U.S. chemical industry production in the coming decade.
The first part of this section examine·s several supply-demand scenarios for the commodity pett·ochemicals sector. Accompanying these commodity petrochemical supply-demand scenarios are corresponding scenarios for a generic "specialty chemical" product area. These two groups of scenarios, examined together, are used to generate an image of ,the possible implications which could result from anticipated changes in the U.S. and the world
· petrochemical industries, including changes in U.S. net trade. !)_/
The second part of this section examines the possible quantitative impacts which could be expected to result from these scenarios in terms of
JI This is especially true of those specialty chemical firms which have been absorbed by larger peteochemical producers and have had increased amounts of steady and reliable funding available for R. & D. and new product development. ll Information collected in the context of.conversations with various
chemical industt·y consultants and securities analysts. 31 Ibid. Al This exercise was performed peeviously on ethylene, methanol, and ammonia
supply--demand scenarios, and the results were published in USITC Publication 1370, The Probable Impact on the U.S .. Petrochemical Industry of the Expanding Petrochemical Industries in the Conventional Energy-Rich Nation~, April 1983. The Bureau of Labor Statistics (BLS) lnput-Oulput Model which was used in this previous exercise, as well as many of the independent variables, have been recenlly updated with infonnation from the 1977 Census of Manufactures.
117
domestic output and domestic .. ~mployment. The u. S. Department of Labor's input/output (IIO) model of the U .,s. economy ·was used for this assessment. .11
Fut~re Supply-Demand Scenarios
In. this s~ction we are .charged with. setting up a realistic set of scenarios. which can be later employed to generate possible economic changes ·in the U.S. industrial. economy._ In .orde.r to best examin.e all .of. the · possibilities, the two s.ides of the chemical industry: we have addressed throughout this report, commodity petrochemicals and specialty chemicals, will be. treated in separate scenarios .. . .
The. information which has been µsed to generate these-scenarios has been obtained from field visits, company submissions, consultant's reports; .industry journals, other pµblications, and telephone conversations." The scenario bases which are dis.~µssed are logical and .consistent with historical facts;. however,. th~ reader may construct· any number of alternate scenarios by altering any of the assumptions or changing any of the. independent variables. The. scenarios as presented in this section are not, in .any manner,· to be construed as forecasts. 2/
Conunodity Petrochemicals·
Table 28 shows the,principal assumptions used in each of the three scenarios for U.S. producers of commodity petrochemicals. For this analysis, we are looking ~t three.sectors of the 1/0 model-·Sector 46, which contains the production of most commodity petrochemicals; 11 Sector 47, the agricultural chemical sector which includes ammonia and many of its derivative commodity petrochemicals; and Sector 49, containing commodity plastics resins
!I U.S. Department of Conunerce, Bureau of Economic Analysis, Definitions and Conventions of the 1972 Input-output Study, July 1980.
~I Certain assumptions as to the general economic outlook need to be made in order to provide a context for the application of the I/O model to the scenarios. We are .assuming a "business-as--usual" outlook for .scenario I
. (baseline scenario)' a continuation of the same. conditions we see "today ... The "hi-" and "lo-" growth scenarios tend to take into account any single event which would either positively or negatively influence the "business· as-usual" world situation. For a more detailed explanation of the use of scenarios, see USITC Publication 1370, The Probable Impact on the. U.S. ,Pett~ochemical Indy_stry of the Expanding __ Petrochel!lical Industries in the ~onv_~ntional Energy-Riel! Nations, April 1983, pp. 142- 148.
}_/ This sector does nol contain anhydrous ammonia, but does include industrial inorganic chemicals.
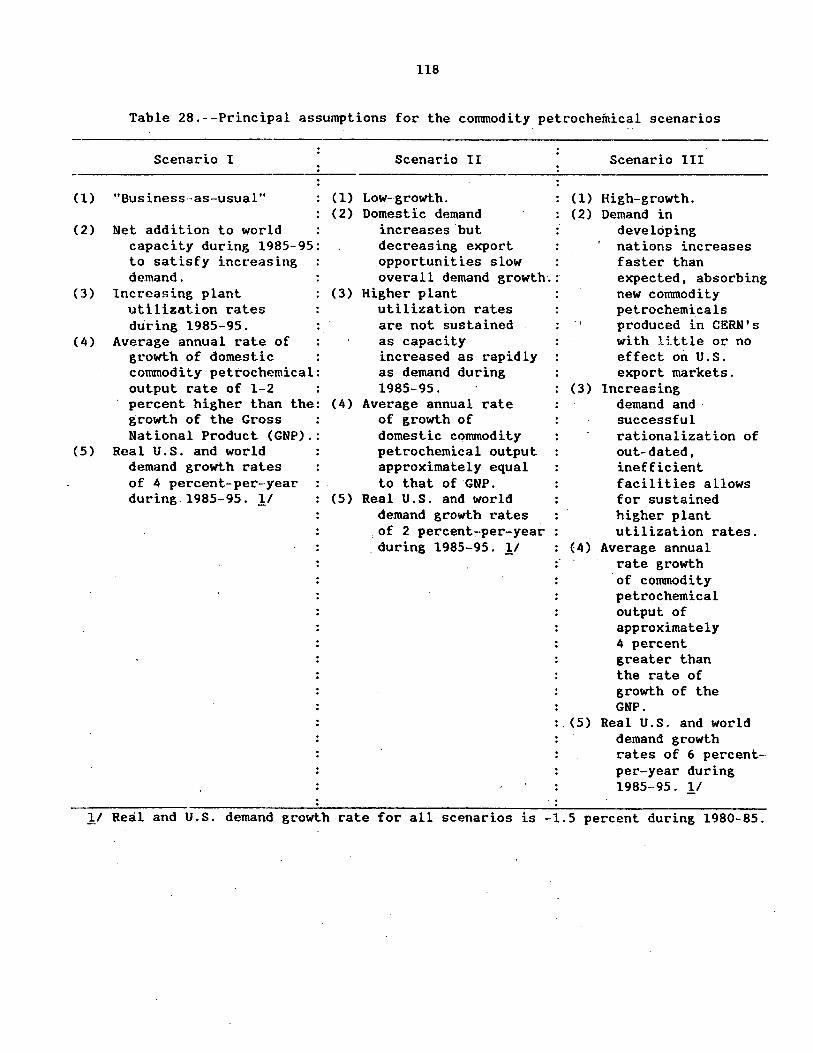
(1)
(2)
(3)
(4)
(5)
118
Table 28.--Principal assumptions for the commodity petrochemical scenarios
Scenario I
"Bus iness--as-usual"
Net addition to world capacity during 1985-95: to satisfy increasing demand.
Increasing plant utilization rates during 1985-95.
Average annual rate of growth of domestic commodity petrochemical: output rate of 1-2 percent higher than the: growth of the Gross National Product (GNP).:
Real U.S. and world demand growth rates of 4 percent-per-year during 1985-95. 11
Scenario II
(1) Low-growth. (2) Domestic demand
increases.but decreasing export opportunities slow overall demand growth·. :
(3) Higher plant utilization rates are not sustained as capacity increased as rapidly as demand during 1985-95.
(4) Average annual rate of growth of domestic conunodity petrochemical output approximately equal to that of GNP.
(5) Real U.S. and world demand growth rates
.of 2 percent~per-year . during 1985-95. 11
(1)
(2)
.,
Scenario III
High-growth. Demand in
developing nations increases faster than expected, absorbing new commodity petrochemi_cals produced in CERN's with 1i t tle or no effect on U.S. export markets.
(3) Increasing demand and· successful rationalization of out-dated, inefficient facilities allows for sustained higher plant utilization rates .
(4) Average annual rate growth of commodity petrochemical output of approximately 4 percent greater than the rate of growth of the GNP .
. (5) Real U.S. and world demand growth rates of 6 percent-per-year during 1985-95. 11
1/ Real and U.S. demand growth rate for all scenarios is -1.5 percent during 1980-85.
119
.and syntlietic rubber. 11· The·se" thre~ ·sectors· ·are defined by the. standard tndusttial (SIC) Systehi categories· shown: in the following tabulati'on:
'· · ·Sectors :' . •.
Sector 46 .---Industrial inorga~ic. and organic- chemicals-
Sect'or 4 7. ---Agricul.tural chemicals
Sector 49.--Plastic(s) materi.als and synthetic rubb~r .
SIC codes.
Group No'. 281.-- Industrial inorganic chemic,als .11
Group No.286.--Industrial organic chemicals ~/
Group. No. 287.--Agricultural chemicals.
In~ustry No. 2821.--Plastics materials, sythetic resins, non-vulcanizable elastomers.
Industt·y No. 2822 .-·-Synthetic rubber (vulcanizable el&stomers).
11 Not including SIC No: 28195, aluminum -oxide. ~/ Not including SIC No. 2861, gum and wood chemicals.
' - ' Historical data for.these three se~tors are shown in tables 29 through
31. As can be seen from examining-'the growth patterns.of these three sectors of the U.S. economy, a· similar pattern emerges for all of them. During 1958-73, all of these sectors experienced better than average growth in their output,·as output increased at average annual rates betwee~ 2.9 percent and 8.3 percent greater than· the GNP. During 1973--79, the average annual grc;>wth rate slowed; However, r·ates of inflation in these sectors ranging from 12.6 percent to 13.8 percent created large increases in revenue from commodity petrochemical sales,·and"fueled a fals~ sense of limitless growth possibilities and unbounded demand: · _As. the effects of the two crude petroleum price shocks began being·felt, the"growth in output in constant dollars reversed.· During 1979_:_83', -the output in the ag-&icultural chemical sector declined at an aye~age annµal rate.of.~pproximately 4.3 percent. During the same period,. the industrial chemical sector's. output fell at an average annual rate of'4.4 percent. The growth in the plastics sector managed to ~emain in·a positive direction, although slowing to an average annual rate of 1.1 percent. A partial summation of.demand in these sectors for 1980, as indicated by the outpul data 'in tables 29-31 appears in table 32, along with an estimate of demand for 1985, i990, 'and 1995 under the base scenario.
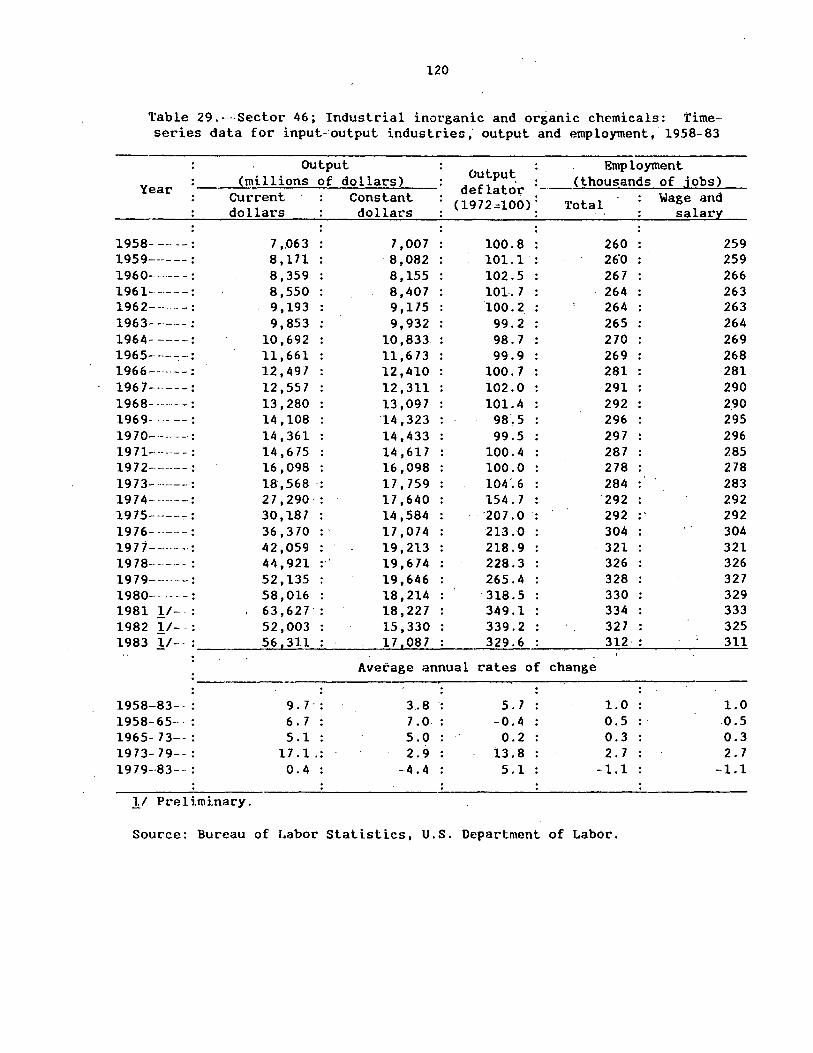
120
Table 29. -·--Sector 46; Industrial inorganic and organic chemicals: Time-· series data for input-'output industrie::;; output and employment, 1958-83
Year
1958- --- -- : 1959-----: 1960------- - : 1961------: 1962----- - : 1963- --·--: 1964-----: 1965-------: 1966-- ----: 196 7--·---: 1968- ------: 1969---- -- : 1970---------: 19 71-- ----- - : 1972----·--: 1973- ·-----: 1974-------: 1975-----,-: 19 7 6- --- .. - : 1971---·---·-: 1978------: 1979--------: 1980- - - -- : 1981 .!.!- . : 1982 !/--:
Output (millions of dollars)
Current Constant dollars dollars
7 ,.063 7,007 8, 171 8,082 8,359 8,155 8,550 8,407 9,193 9,175 9,853 9,932
10,692 10,833 11,661 11,673 12,497 12,410 12,557 12. 311 13,280 13,097 14,108 ·14. 323 14,361 14,433 14,675 14,617 16,098 16,098 18,568 .• 17,759 2 7. 290 17,640 30,187 14,584 36,370 . ' 17,074 42,059 19,213 44,921 . 19,674 52,135 19,646 58,016 18,214 63,627 18,227 52,003 15,330
output Employment
deflator (thousands of jobs)
(1972.:100): Total Wage and salary
100.8 260 101.l 26"0 102.5 267 lOL 7 264 100.2 264
99.2 265 98.7 270 99.9 269
100.7 281 102.0 291 101.4 292
98,5 296 99.5 297
100.4 287 100.0 278 104'.6 284 154.7 292 '207 .0 292 •'
213.0 304 218.9 321 228.3 326 265.4 328 318.5 330 349.l· 334 339.2 327
259 259 266 263 263 264 269 268 281 290 2.90 295 296 285 278 283 292 292 304 321 326 327 329 333 325
56. 311 17,087 329.6 312 311 1983 !/-- =~~~~--'-~~~~~--"--~~~~~~~--~-,-~~~~~~~~~~ Average annual rates of change
9. 7.: 3 .. 8 .. 5. 7 1.0 1.0 1958-83--: 1958-65- - : 1965- 73--: 1973- 79--: 1979--83--:
6. 7 : 7 .0 -0.4 0.5 .o.s 5.1 : 5.0 0.2 0.3 0.3
17.1.: 2.9 13.8 2. 7 2.7 0.4 -4. Ii 5.1 -1.1 -1. l
.!/ Preliminary.
Source: Bureau of Labor Statistics, U.S. Department of Labor.
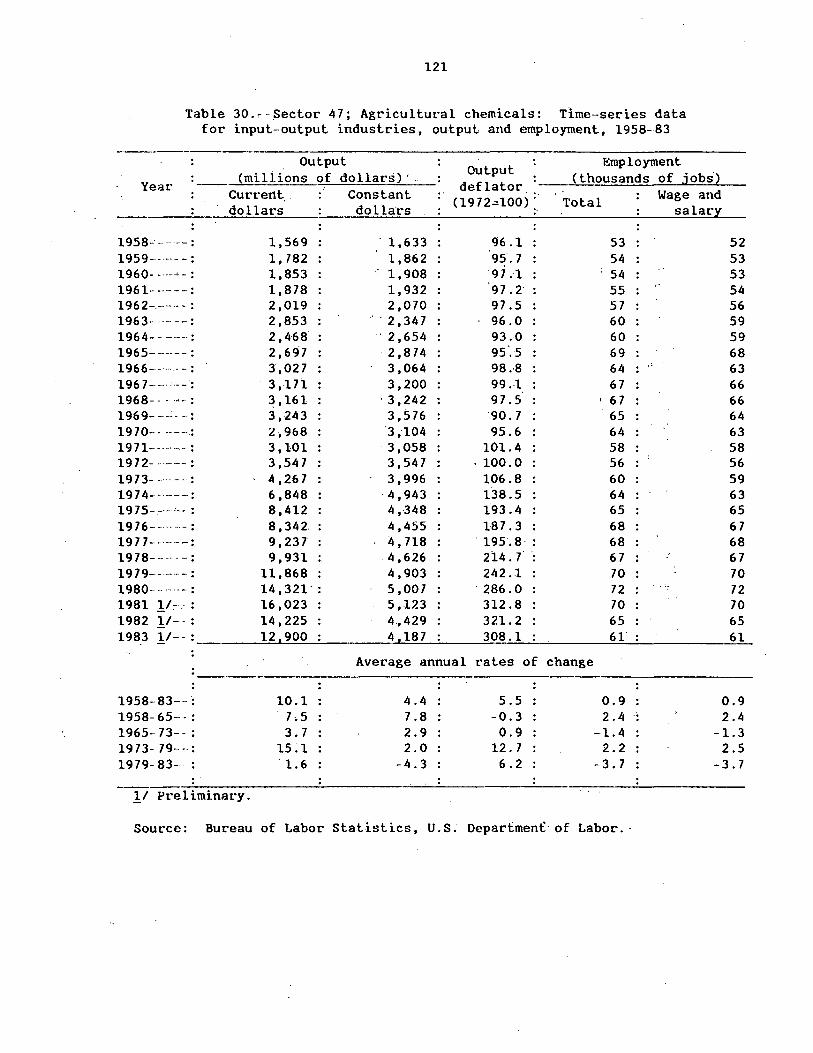
121
Table 30.~-Sector 47; Agricultural chemicals: Tl.me-series data for input~output industries, output and employment, 1958-83
Year
1958-'---- --- : 1959------: 1960- - ___ , - : 1961------: 1962-------: 1963------: 196 4 - - - -- -- : 1965----·--: 1966-- -- -- : 196 7---·'·--: 1968- - .. .,_: 1969---~--:
19 7 0- - -- - --.: 1971-------: 1972- -------: 1973--------: 1974-'·-----: 1975----'--: 1976------: 1977-------: 1978-------: 1979------: 1980-- -- -- -- : 1981 !'~ .· : 1982 !I-· : 1983 1/-- :
1958-83--: 1958-65--:
Output ___ (millions of do].lars)' .
Currertt,. dollars
1,569 1, 782 1,853 1,878 2,019 2,853 2,468 2,697 3',027
. 3,·171 ~.161 3,243 2,968 3,101 3 ,54 7 4,267 6,848 8,412 8,342 9,237 9,931
11,868 14. 321' : 16,023 14,225 12 900
Constant dollars
- 1,633 1,862 1,908 1,932 2,070
.. 2 ,347 .. 2. 654 . 2 ,874 3,064 3,200
'3 ,242 3,576 ·3,104 3,058 3,547 3 ,996
·4,943 4,348 4,455 4 t 718
.4,626 4,903 5,007 5,123 4., 429 4 187
Output deflator
(1972.:::100) ;.
96.l 95. 7 97:1 97.2 97 .5 96.0 93.0 95'.5 98.'8 99.-1 97 .5 '90. 7 95.6
101.4 . 100.0
106.8 138.5 193.4 187. 3
. 195 .8 214.7 242.l
. 286 .0 312.8 321.2 308.l
Employment (thousands of jobi)
Total
53 54
: 54 55 57 60 60 69 64 67
' 6 7 65 64 58 56 60 64 65 68 68 67 70 72 70 65 61'
"
Wage and salary
Average annual rates of change
10.l 4.4 5.5 0.9 7.5 7 .8 -0.3 2.4 ..
52 53 53 54 56 59 59 68 63 66 66 64 63 58 56 59 63 65 67 68 67 70 72 70 65 61
0.9 2.4
1965-73--: 3.7 2.9 0.9 -1.4 -1.3 1973- 79- -- : 15;1 2.0 12.7 2.2 2.5 1979- 83-. : '1.6 -4.3 6.2 - 3. 7 -3.7
!I Preliminary.
Source: But•eau of Labor Statistics, U.S. Department:: of Labor. -

122
Table 31.--Sector 49; Plastic· materials and synthethic ·rubber: Time-series data for input-output ·industries, output and employment, 19.58-83
Output .,
Employment (millions of dollars) Outpu.t (thousands of jobs)
Year Current Constant deflator Wage and dollars dollars '
(1972=10.0): Total salar,l
1958---·- - : 2,361 1,890 124.9 77 77 1959- -·-·.- - : 2,994 2,470 119.2 81 81 1960- -·-··--: 2,908 2,456 118:,4 84 84 1961-· -·--: 2,797 ·2,475 H3.0 83 83 1962- ____ :.__: 3, 111 2,780 111. 9. 89 89 1963- ·-----: 3,306 2;968 111.4 93 93 1964-. -·--: 3,555 3,294 107-".9 94 94 1965-----: 3,938 ·3 ,636 108 .. 3.: 97 97 1966-. ---·: 4,479 4., 182 107.1 102 102 1967-----: 4,368 4,105 106.4 103 : 103 1968--- -----: 4,690 4,644 101.0 106 . 106 1969- ··-- -- : 5,239 5,218 100.4 108 108 1970-------: 5,096 5,046 101.0 106 106 1971-----.: 5,389 5,389 . 100-.0 103 103 1972------: 5,529' 5,529 100.0 105 105 1973- -----: 6,189 5,973 103.6 109 109 1974- ··---: 9,383 6,041 155 .3': 111 111 19 7 5- _____ ;_.: 8,448 4,487 188.3 98 . " 97 19 7 6 - - - ·- - : 10,874 5,479 198.5 99 98 19 77- - --- - : 12,588 6,128 205.4 98 98 1978- ... -·-: 13,801 6,528 211'-.4 99 99 1979--·----: 16. 798 6,759 248'·.5 100 100 1980- - - --- : 17 ,417 5,905 295',0 95 95 1981 !/--: 19,635 6,322 310.6.: 93 93 1982 1/--·: 17,966 ·5.,906 30'4 .2 : . 89 89 1983 !/--: 22.226 71133 3H.6 : . 87 87
Average annual rates of change
1958-83--: 9.4 4. 7 . 4 ;5 0.5 ': 0.5 1958-65--: 6.2 8.3 -2.0 3. 3. : 3.3 1965- 73--: 5.0 5.9 -0.8 0.9 0.9 1973-·79--: 16.0 3.0 12.6 -1. 7 -1. 7 1979-83--: 6.1 1.1 6.0 - 3. 4 :: -3.4
]J Prelimi.nary.
Source: Bureau of Labor Statistics, U.S. Department of Labor.
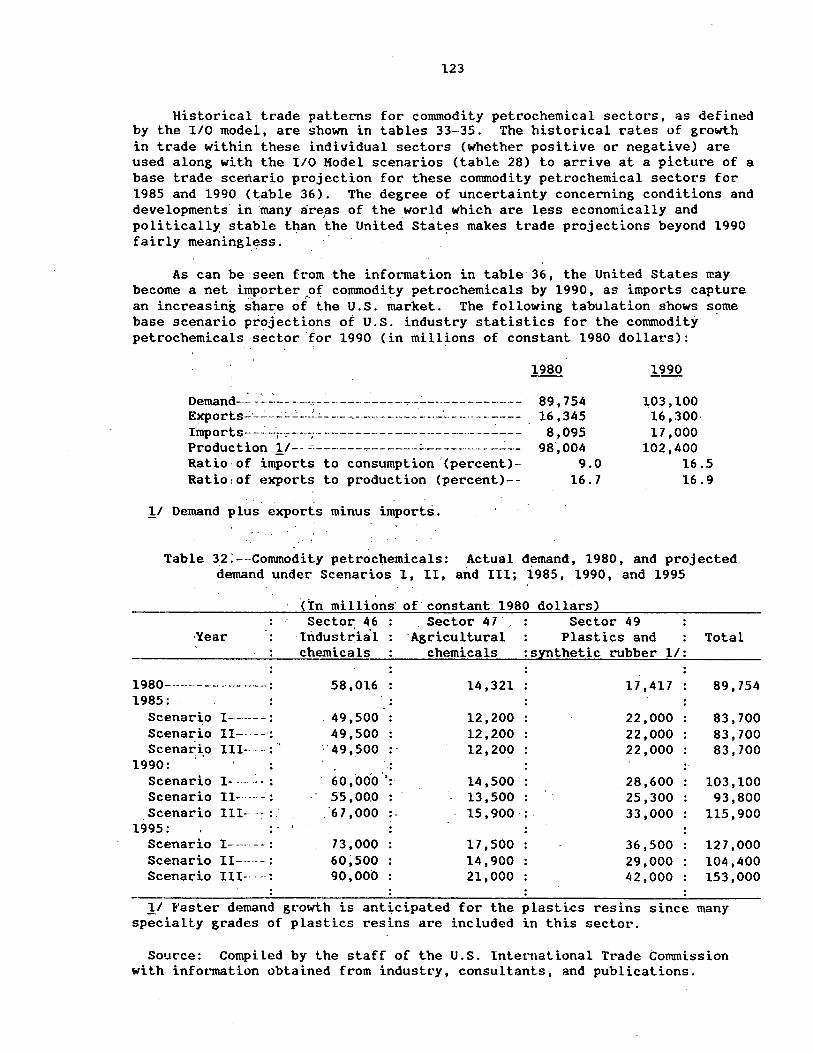
123
Historical trade patterns for commodity petrochemical sectors, as defined by the I/O model, are shown in tables 33-35. The historical rates of growth in trade within these individual sectors (whether positive or negative) are used along with the I/O Model scenarios (table 28) to arrive at a picture of a base trade scenario projection for these corranodity petrochemical sectors for 1985 and 1990 Ct.able 36). The degree of uncertainty concerning conditions and developments in ·many areas of the world which are less economically and politically stable than the United Stat~s makes trade projections beyond 1990 fairly meaningless.
As can be seen from the information in table·36, the United States may become a net i~porter ,.of corranodity petrochemicals by 1990, as imports capture an increasing share of the U.S. market. The following tabulation shows some base scenario proj.ections of U.S. industry statistics for the corranodity petrochemicals sector 'for 1990 (in millions of constant 1980 dollars):
Demand-_:_ -:_~: __ - -·-.c- -- -----------·..,.--:... ______________ ·
Exports...:.· __ _:_ __ :...:._ .. '...:._---------,---.:_ ___ . __ - --·· ·- --:----Imports- _ _: __ ·,:-----:·------·---------------·-------·---·-· Production 1/--~------~------:..-----------Ratio of imports to consumption (percent)-Ratio 1 of exports to production (percent)--
11 Demand plus exports minus imports.
89,754 l6,34S 8,09S
98',004 9.0
16.7
1990
103,100 16 ,300· 17 ,000
102,400 16.S 16.9
Table 32:---Conune>dity petrochemicals: Actual demand, 1980, and projected demand under Scenarios I, II, and III; i98S, 1990, and 199S
·Year
1980-------------------: 1985:
Scenario I------: Scenario II-·. -- : Scenari.o III----:
.,
1990: Scenario I----.:_- : Scenario II-------: Scenario III-· -- : .
1995: Scenario I---··--: Scenario II-·-. - : Scenario III--·-·:
(In millions· of' constant 1980 dollars) Sector 46 . Sector 41 . Sector 49
Industrial ·Agricultural Plastics and Total chemicals chemicals :synthetic rubber 1/:
58,016 : 14,321 17 ,417 89,754
. 49,500 12,200 22,000 83. 700 49,500 12,200 22,000 83. 700
.· 49 ,500 . 12,200 22,000 83, 700 '.· . . ... ').
60,000 : 14,500 28,600 103,100 SS ,00.0 13,SOO 25 ,,300 93,800
'67 ,000 .- 15 ,900.:. 33,000 115,900
73,000 17 ,soo 36,SOO 127 ,000 60~500 14,900 29,000 104,400 90,000 21,000 42,000 153 ,000
l/ '(t'aster demand gt·owth is anticipated for the plastics resins since many specialty grades of plastics resins are included in this sector.
Source: Compiled by the staff of the U.S. International Trade Commission with information obtained from industry, consultants, and publications.
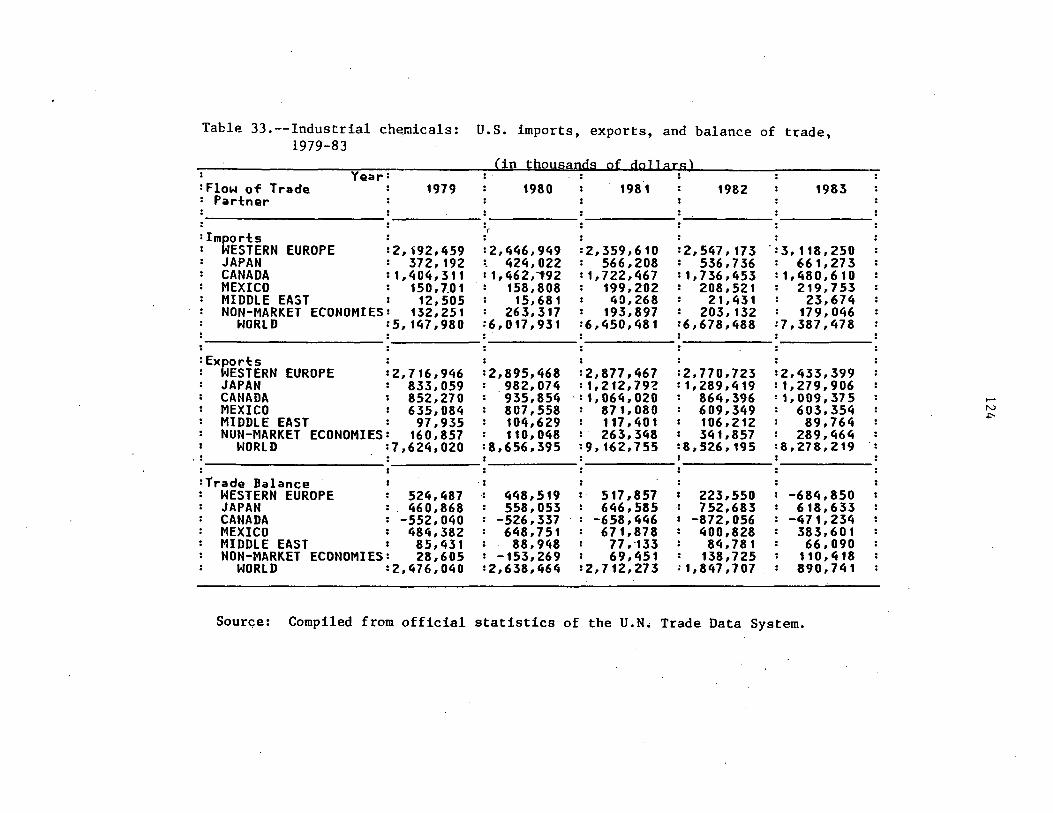
Table 33.--Industrial ch~rnicals: u. s. imports, exports, and balance of trade, 1979-83
(in thousand~ cf dclla~s) Year: : : :
: Flow of Trade : 1979 : 1980 : 1981 : 1982 : 1983 : Partner
: : : :
: Im~ort:s r
: : : ESTERN EUROPE :2,~92,459 :2,446,949 :2,359,610 :2,547,173 ':3,118,250
JAPAN : 372, 192 •. 424,022 : 566,208 : 536,736 : 661, 27 3 CANADA =1,404,311 : 1,462,""1;92 =1,722,467 :1,736,453 :1,480,610 MEXICO : 150, 7.01 : 158,808 : 199,202 : 208,521 : 219,753 MIDDLE EAST : 12,505 : 15,681 : 40,268 : 21, 431 : 23,674 NON-MARKET ECONOMIES: 132,251 : 263,317 : 193,897 : 203,132 : 179,046
WORLD :5,147,980 :6,017,931 :6,450,481 :6,678,488 :7,387,478 : : : :
: Ex~ort:s : ESTERN EUROPE :2,716,946 =2,895,468 :2,877,467 :2, 770, 723 :2,433,399
JAPAN : 833,059 : 982,074 :1,212,79~ :1,289,419 :1,279,906 CANADA : 852,270 : 935,854 ·:1,064,020 : 864,396 ' 1, 009, 37 5 . ....... MEXICO : 635,084 : 807,558 : 871,080 : 609,349 : 603,354 : N
.i:-MIDDLE EAST : 97,935 : 104,629 : 117,401 : 106,212 : 89,764 NUN-MARKET ECONOMIES: 160,857 : 110,048 .. 263,348 : 341,857 : 289,464
WORLD :7,624,020 :8,656,395 :9,162,755 :8,526, 195 :8,278,219 .. : =Trade Balance : -:
WESTERN EUROPE : 524,487 : 448,519 : 517,857 : 223,550 : -684,850 JAPAN : 460,868 : 558,053 : 646,585 : 7 52,683 : 618,633 CANADA : -552,040 : -526,337 : -658,446 : -872,056 : -471,234 MEXICO : 484,382 : 648,751 : 671,878 : 400,828 : 383,601 MIDDLE EAST : 85,431 : 88,948 : 77 ,·133 : 84,781 : 66,090 NON-MARKET ECONOMIES: 28,605 : -153,269 : 69,451 : 138,725 : 110,418
WORLD =2,476,040 :2,638,464 :2,712,273 ;1,847,707 : 890,741
SourGe: Compiled from official statistics of the U.N. Trade Data System.
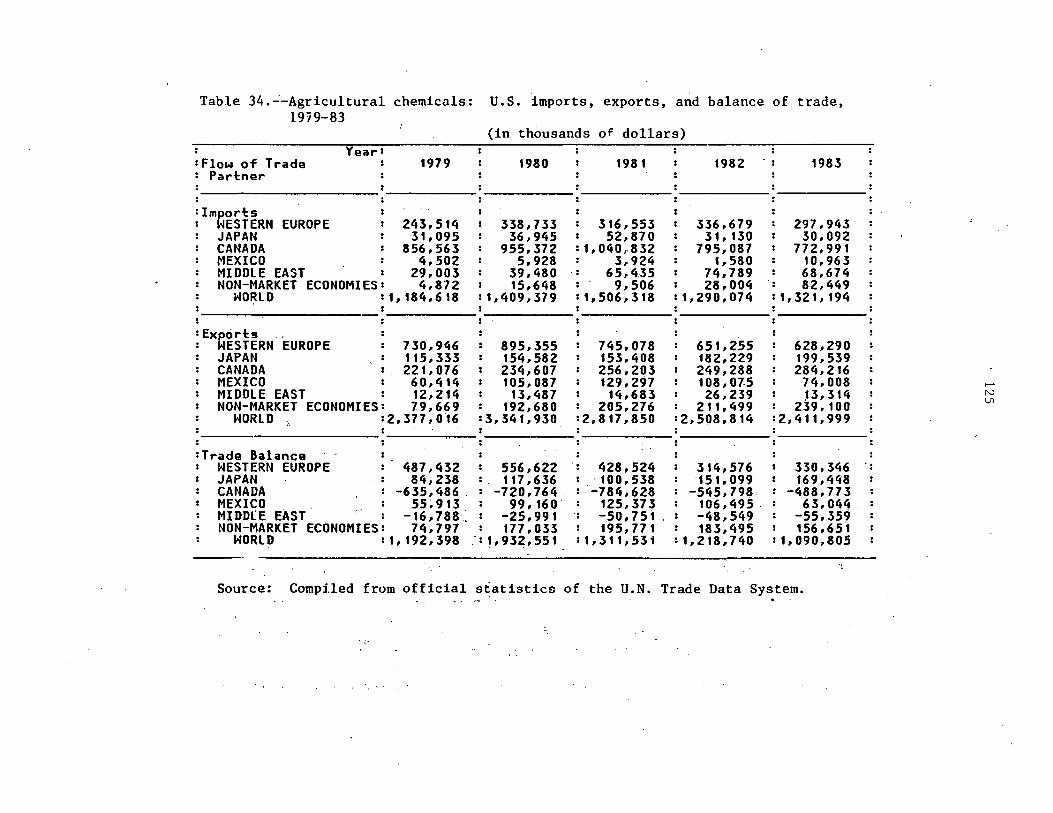
Table 34._.-Agricultural chemicals: 1979-83
Year: : Flow of Trade : 1979 : Pad:ner
:Im~orts : ~ESTERN EUROPE : 243,514
JAPAN : 31,095 CANADA I 856 I 563 MEXICO : 4,502 MIDDLE EAST I 29,003 NON-MARKET ECONOMIES: 4,872
WORLD :1,184,618 I -:
: Ex~orts : ESTERN EUROPE : 730,946
JAPAN : 115,333 CANADA : . 221,076 MEXICO : 60,414 MIDDLE EAST : 12,214 NON-MARKET ECONOMIES: 79,669
WORLD :2,377,016
:Trade Balance WESTERN EUROPE : 487,432 JAPAN : 84,238 CANADA : -635,486 MEXICO . : 55~913 MIDDLE EAST : -16,788~ NON-MARKET ECONOMIES: 74,797
WORLD :1,192,398
U.S. imports, exports, and balance of trade,
(in thousands of dollars) : : 1980
: 338, 733 : 36,945 : 955, 372 : 5,928 : 39,480 : 15,648 : 1,409,379
: 895,355 : 154,582 : 234,607 : 105,087 : 13,487 : 192,680 :3,341,930
556,622 117,636
-720,764 99 I 160.
-25,991 177,033.
:: 1,932,551
: : 198 1
: 316,553 : 52,870 : 1,040,.832 : 3.924
. : 65, 4.35 : 9,506 :1,506,318
: 745,078 : 153,408 : 256,203 : 129,297 : 14,683 : 205,276 :2,817,850
: 428,524 . 100, 538 -784,628
125,373 .• -50,751
195, 771 l 1 I 31 1 I 531
: : 1982
: 336,679 : 31, 130 : 795,087 : 1I580 : 74,789 : 28,004 :1,290,074
: 651,255 : 182,229 : 249,288 : 103, 01.5 : 26,239 : 211,499 :2,508,814
314,576 151,099
-545,798 106,495. -48,549 183, 495
:1,218,740
: 1983
: 297,943 : 30,092 : 772,991 : 10, 963 : 68,674 : 82,449 :1,321,194
: 628,290 : 199,539 : 284,216 : 74,008 : ,3,314 : 239,100 :2,411,999
330,346 169,448
-488,773 63, 044 .
-55,359 156,651
:1,090,805
~
Source: Compiled from official statistics of the U.N. Trade Data System •
. ;~
...... : N
\.J1
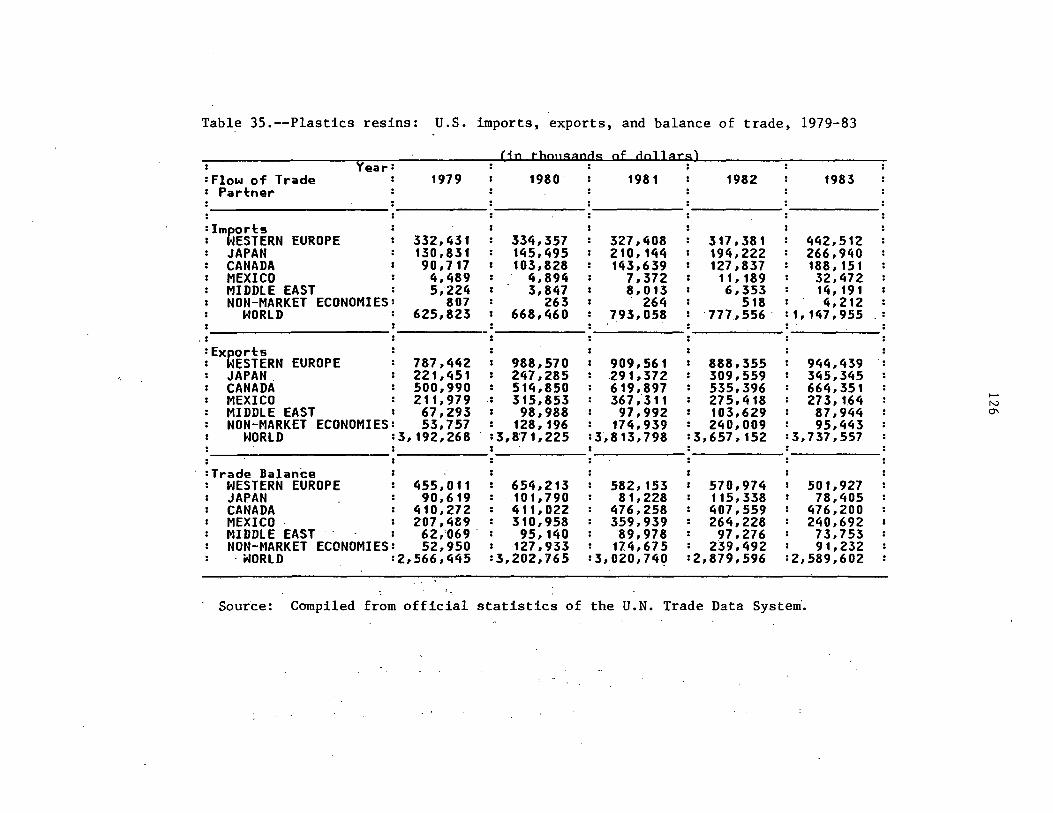
Table 35.--Plastics resins: U.S. imports, exports, and balance of trade, 1979-83
Year: : Flow of Trade : Pari:ner
1979
: Impori:s : WESTERN EUROPE 332,431
130,831 90, 717
4,489 5,·224
807
. :
JAPAN CANADA MEXICO MIDDLE EAST NON-MARKET ECONOMIES:
WORLD 625,823
=Expori:s : WESTERN EUROPE : 787,442
JAPAN. : 221,451 CANADA : 500,990 MEXICO : 211,979 MIDDLE EAST : 67,293 NON-MARKET ECONOMIES: 53,757
WORLD :3,192,268
I
=Trade Balan~e WESTERN EUROPE : 455,011 JAPAN : 90,619 CANADA : 410,272 MEXICO : 207,489 MIDDLE EAST : 62;069 . NON-MARKET ECONOMIES: 52,950
·WORLD :2,566,445
(in_t.hnnsands nf dollars)
1980.
334,357 145,495 103,828
4,894 3,847
263 668,460
988,570 247,285 514,850 315,853 98,988
128,196 :3,8'71,225
·:
654,213 101,790 411,022 310,958 95,140
127,933 :3,202,765
1981
327,408 210,144 143,639
7,372 8,013
264 793,058
909,561 .. 291,372
619,897 367,.311 97,992
174, 939 :3,813,798
582, 153 81,228
476,258 359,939 ·39, 978
114,675 :3,020,74Q
1982
317, 381 194,222 127,837 ,, , 189 6,353
518 . 777, 556 .
888,355 309,559 535,396 275,418 103,629 240,009
:3,657,152
570,974 115,338 407,559 264,228 97,276
239,492 :2,879,596
1983
442,512 266,940 188, 151 32,472 14,191 4,212
:1,147,955
944,439 : 345,345 664,351 27 3, 1.64 87,944 95,443
:3, 737 ,557
501,927 78,405
476,200 240,692 73,753 91, 232
=2,589,602
Source: Compiled from official statistics of the U.N. Trade Data System.
..... N 0\
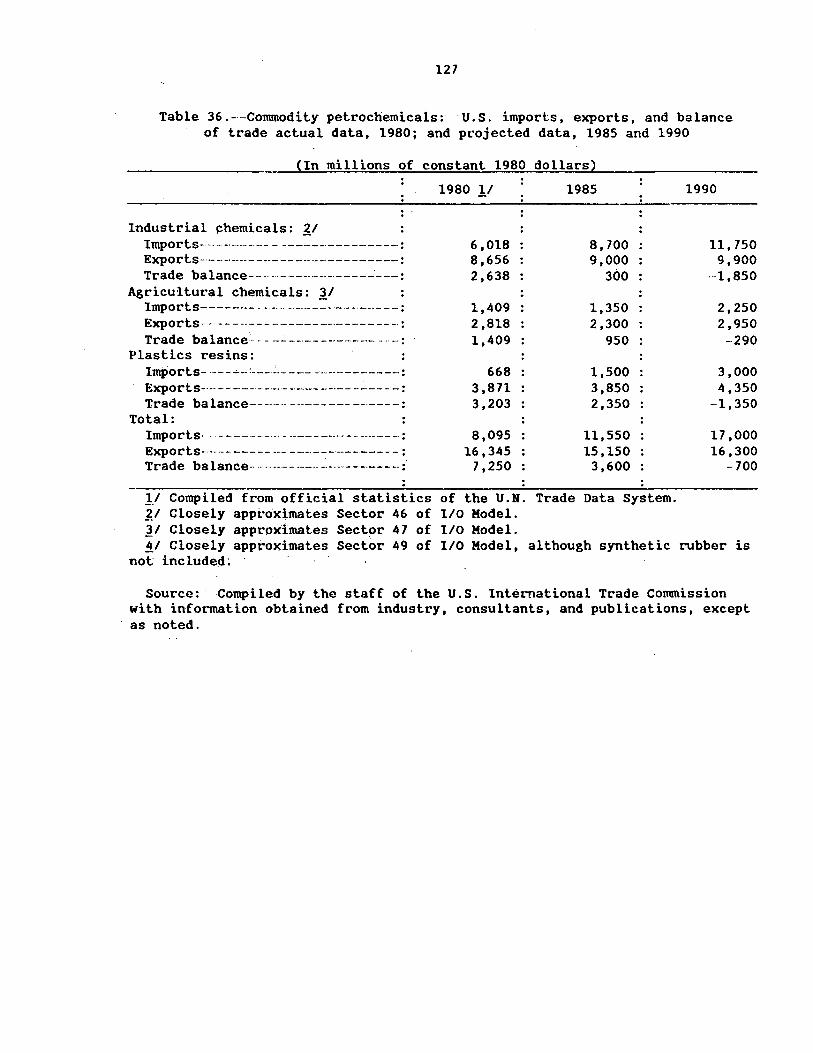
127
Table 36.---Commodity petrochemicals: ·u.s. imports, exports, and balance of trade actual data, 1980; and projected data, 1985 and 1990
(In millions of constant 1980 dollars)
Industrial chemicals: ~/ Imports-----·-···----- - -----------------: Exports-·----------------------·---------: Trade balance-- - ---·------------------:
Agricultural chemicals: '}_/ Imports----------·-- - ------ -- ----- -- : Exports- ---- ----- - -------·-·----- -- -- : Trade balance- - - -·- ----- --------- -· - -- :
Plastics resins: Imports-·----.._ __ : ____ ~-- --- ------------: Exports---·------·--··--·-------------- - - : Trade balance--------------------:
Total: Imports--------- - ---- - ----- --··- ---------: Exports--------- --- --------------: Trade balance- - ------ -----~------------ :·
}._/ Compiled from official statistics 21 Closely appi:o'>c:imates Sector 46 of ~I Closely apprpximates Sector 47 of 4/ Closely app~oX.imates Sector 49 of
not included~ ·
1980 11
6,018 8,656 2,638
1,409 2,818 1,409
668 3,871 3,203
8,095 16,345
7,250
of the U.N. 1/0 Model. 1/0 Model. 1/0 Model,
1985 1990
8, 700 11, 750 9,000 9,900
300 ·-1,850
1,350 2,250 2,300 2,950
950 -290
1,500 3,000 3,850 4,350 2,350 -1,350
11,550 17,000 15,150 16,300
3,600 -700
Trade Data System.
although synthetic rubber is
Source: Compiled by the staff of the U.S. International Trade commission with information obtained from industry, consultants, and publications, except as noted.
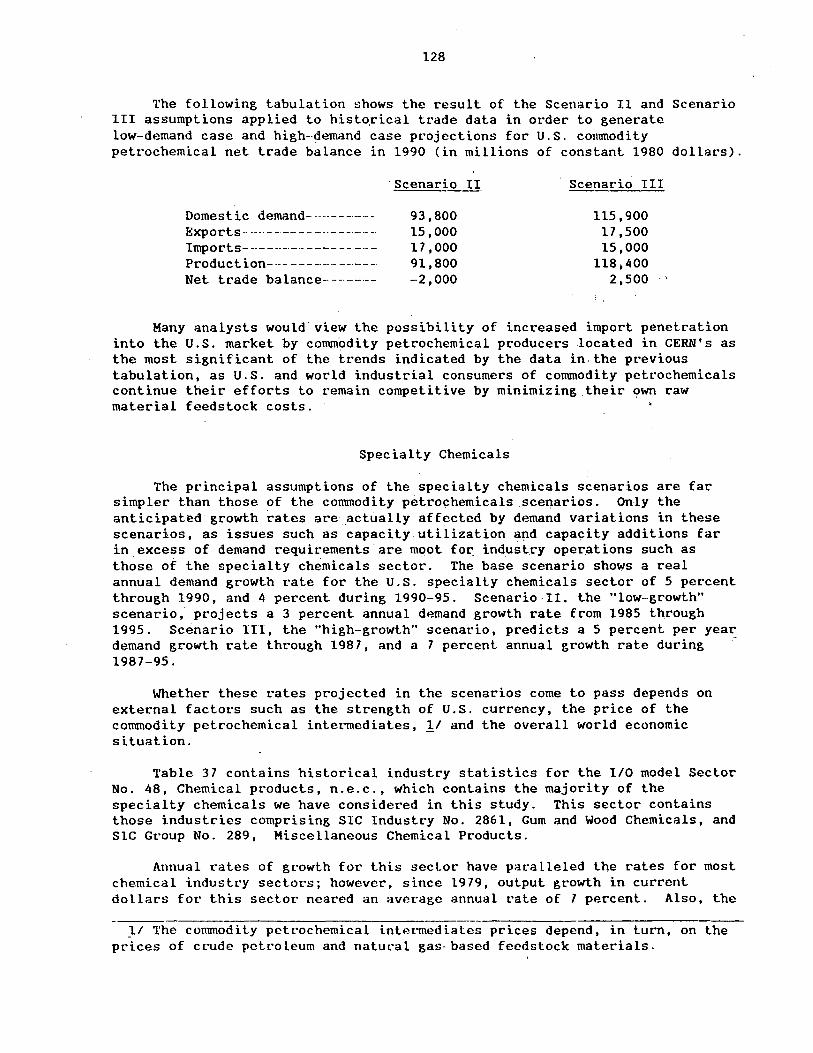
128
The following tabulation shows the result of the Scenario 11 and Scenario III assumptions applied to histo.rical trade data in order to generate low-demand case and high--demand case projections for U.S. conunodity petrochemical net trade balance in 1990 (in millions of constant 1980 dollars).
Domestic demand----------·-Exports-·---· - - -- - - --·- - -·--·- -Imports------·-·-·--·------·· -Production---·-·---·----·---Net trade balance-------
Scenario II
93,800 15,000 17 ,000 91,800 -2,000
Scenario III
115,900 17. 500 15,000
118;400 2 ,500 . '
Many analysts would. view the possibility of increased import penetration into the U.S. market by commodity petrochemical producers located in CERN's as the most significant of the trends indicated by the data in, the previous tabulation, as U.S. and world industrial consumers of commodity petrochemicals continue their efforts to remain competitive by minimizing their: own raw material feedstock costs.·
Specialty Chemicals
The principal assumptions of the specialty chemicals scenarios are far simpler than those of the commodity petro~hemicals scenarios. Only the anticipated growth rates are actually affected by demand variations in these scenarios, as issues such as capacity utilization and capacity additions far in excess of demand requirements· are moot fo~ industry oper:.ations such as those of the specialty chemicals sector:. The base scenario shows a real annual demand growth rate for: the U.S. specially chemicals sector of 5 percent through 1990, and 4 percent during 1990-95. Scenario. II. the "low-growth" scenario, projects a 3 percent annual demand growth rate from 1985 through 1995. Scenario III, the "high-growth" scenario, predicts a 5 percent per year demand growth rate through 1987, and a 7 percent annual growth rate during -1987-95.
Whether these rates projected in the scenarios come to pass depends on external factors such as the strength of U.S. currency, the price of the commodity petrochemical intermediates, !I and the overall world economic situation.
for the 1/0 model Sector majority of the
Table 37 contains historical industry statistics No. 48, Chemical products, n.e.c., which contains the specialty chemicals we have considered in this study. those industries comprising SlC Industt·y No. 2861, Gum SIC Group No. 289, Miscellaneous Chemical Products.
This sector contains and Wood Chemicals, and
Annual rates of growth for this seclor have paralleled lhe rates for most chemical industt·y sectors; however, since 1979, output gt·owth in current dollars for this sector neared an average annual rate of 7 percent. Also, the ~~~~~~--~~~~~~~~~~~~~-~~~- ~~~~~~--~~~~~~~~~~
].! The conunodily petrochemical intennediales prices depend, in turn, on the pr: ices of ct·ude pctro leum and natueal gas- based feedstock materials.
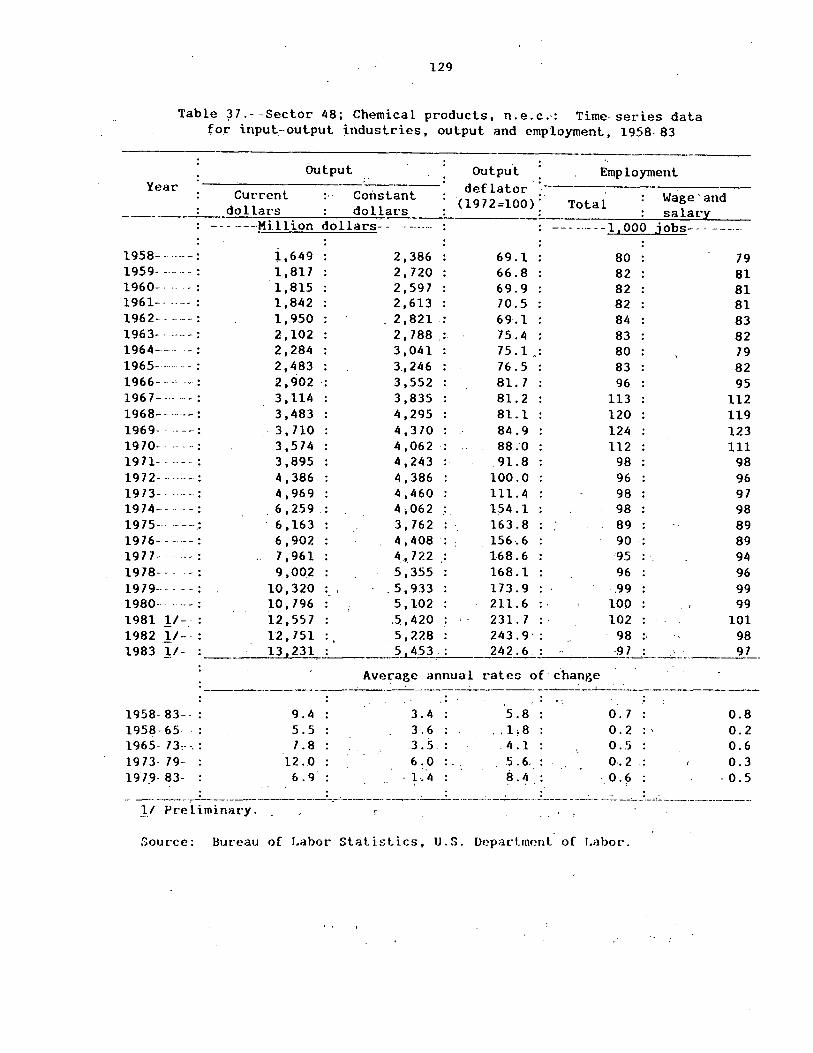
Year
129
Table 37.--Sector 48; Chemical products, n.e.c.·: Time-series data for i.nput--output ~ndustries, output and employment, 1958- 83
Output
Current Corislant dollars dollars
Outpu-t - .
def lator ·(1972~100):
Employment
Total Wage'and salary
------Killion dollars~- ---- --- -----1 1 000 jobs-- - -----
1958-- - l.,649 2,386 69.l 80 79 1959- ---- -- : 1,817 2,720 66.8 82 81 1960-- -- -- : 1,815 2,597 69.9 82 81 1961-- -----: 1,842 2,613 70.5 82 81 1962- - ----: 1,950 2,821 .. 69.l 84 83 1963- - ----: 2,102 2. 788 ,: 75.4 83 82 1964----- -- : 2,284 3,041 75. 1 _,: 80 79 1965- - -- -- : 2,483 3_,246 76.5 83 82 1966- - -- ---- : 2,902 3,552 81. 7 96 95 1967------: 3, 114 3,835 81.2 113 112 1968- - -----: 3,483 4,295 81. l 120 119 1969-- ----: 3, 710 4,370 84.9 124 123 1970- - -- -- : 3,574 4,062 .. 88_.o 112 111 1971------: 3,895 4,243 : 91.8 98 98 1972-- ----: 4,386 4,386 100.0 96 96 1973-- ----: 4 ,969 4,460 111.4 98 97 19 7 4- - -- -- : - 6 ,259 - . 4,062 154.l 98 98 1975- ---.: 6,163 3' 762 163.8 89 89 19 7 6 - - - -- - : 6 ,_902 4,408 156.6 90 89 19 77 -- -- - ~ - : 7 ,961 4 ,_7 2.2 168.6 95 . - 94 1978--- - - : 9,002 5,355 168.l 96 96 1979------: 10,320 .5,933 173 .9 .99 99 1980- - 10, 796 5,102 211. 6 100 99 1981 1/- 12,557 .5,420 231. 7 102 101 1982 1/-- 12,751 5,228 243 .9-; 98 •' 98 1983 _!./- 13 ,231 5.453. 242 .6.: -.9 L_L ___ ·. _-____ __!!7__
Average annual rates of change ------------· ----· ------------~--·--------------
-· : 1958- 83--- : 9.4 3.4 5.8 0. 7 0.8 1958- 65- : 5.5 3.6 "1.8 0.2 : -, 0.2 1965- 73:--.: 1. 8 3.5. 4.1 0 .. 5 0.6 1973- 79- : 12.0 6.0 .. 5 .6. 0-.·2 -· 0.3 19'7_9- 83- : 6.9 - 1-.4 8.4 . o.~ - 0.5
. . . . . -. -- - ---~--------- -----~-~-------------- ---.. -·-----· - ______ : ___ '--....: _____ ~----- -_ __.:_ ___ --=- --:...... _..___._:_ ______________ _ _!./ Pn~ l iminat·y. . '
Source: Hut·eau of Labor Statistics, U.S. Department of I.nbot·.
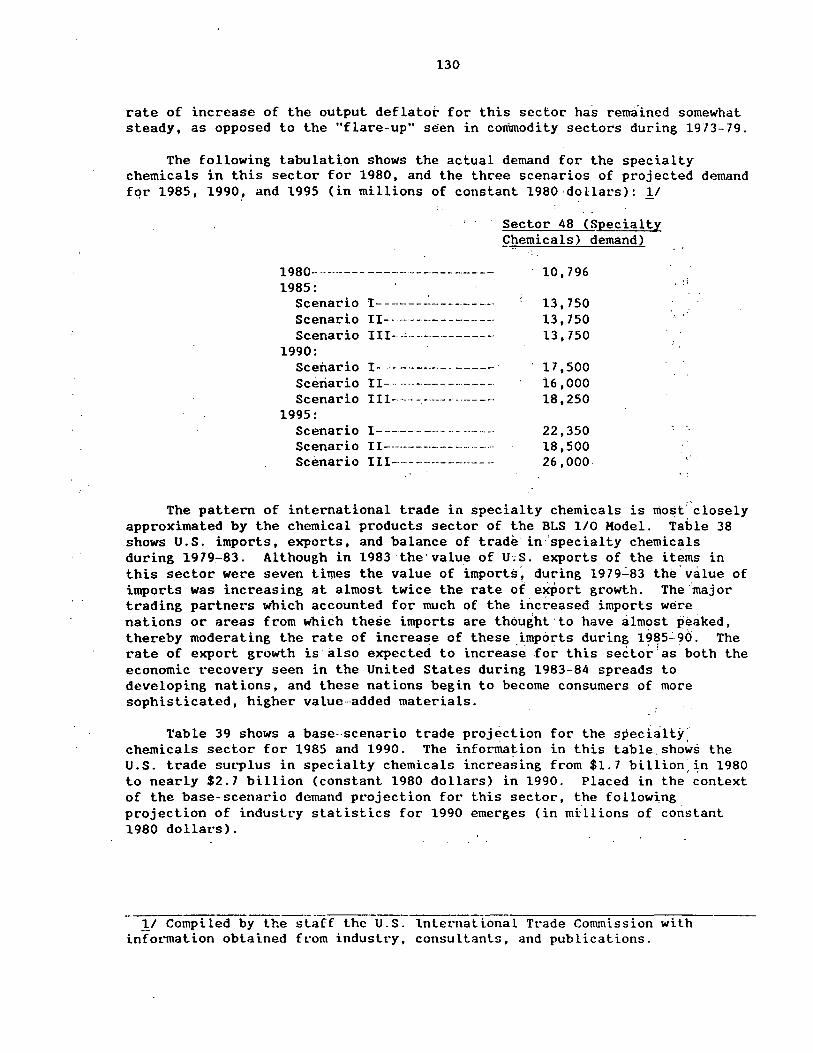
130
rate of increase of the output deflator for this sector has rema'ined somewhat steady, as opposed to the "flare-up" seen in commodity sectors during 1913-79.
The following tabulation shows the actual demand for the specialty chemicals in this sector for 1980, and the three scenarios of projected demand fqr 1985, 1990! and 1995 (in millions of constant 1980·dollars): !I
1980- --------- --------- ----- ------1985:
Scenario I- - ---- --~- -- ---- ----Scenario II-·----------- - ---- ---Scenario I II---'----·--------- -
1990: Scenario I----------------sceriario II--------------Scenario Ill----:----- - - -- --
1995: Scenario I----------------Scenario II---------------------Scenario I 11:.. __ - ------ ------ - --
Sector 48 (Specialty f~e~icals) demand)
10. 796
13,750 13,750 13,750
17,500 16,000 18,250
22,350 18,500 26,000.
'
The pattern of international trade in specialty chemicals is triost' .. closely approximated by the chemical products sector of the BLS 1/0 Model. Table 38 shows U.S. imports, exports, and balance of trade in specialty chemicals during 1979-83. Although in 1983 the'value of U;S. exports of the items in this sector were seven times the value of imports·. during 1979...:.93 the' value of imports was increasing at almost twice the rate of eXi)ort growth. The.major trading partners which accounted for much of the increased imports were nations or areas from which these imports are thought·to have almost peaked, thereby moderating the rate of increase of these imports during 19a5..:9(>, The rate of export growth is· also expected to increase for this sector;as both the economic recovery seen in the Vnited States during 1983-84 spreads to developing nations, and these nations begin to become consumers of more sophisticated, higher value-added materials.
Table 39 shows a base-scenario trade proj~ction for the s~eci~ltt' chemicals sector for 1985 and 1990. The information in this table.sho~s the U.S. trade surplus in specialty chemicals increasing from $1.7 billion:~n 1980 to nearly $2.7 billion (constant 1980 dollars) in 1990. Placed in the context of the base--scenario demand projection for this sector, the following pt"ojection of induslt·y statistics for 1990 emerges (in millions of constant 1980 dollars).
1/ Compiled by the slaff the U.S. lnlernalional Trade Commission with information obtained ft·om induslt·y, consultants, and publications.
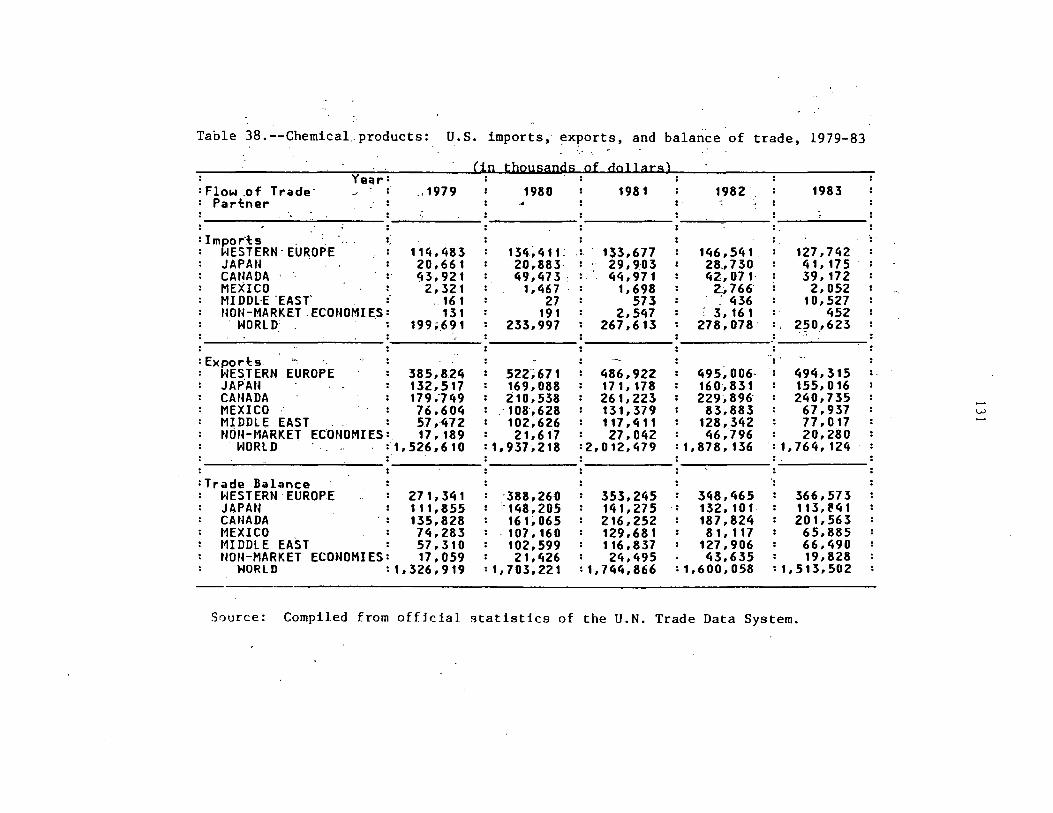
Table 38.--Chernical.products: U.S. imports, exports, and balance of trade, 1979-83 ',· ·.
(in thousands cf dclla~s) Year: : :
: Flow .of Trade· -- f ·' 1979 : 1980 : 1981 : 198Z : 1983 : Pad:ner : : .4 . ..
: : I . •.
: Impod:s ... : : : : : WESTERN- EUROP·E : 114,483 : 134, 4 11: . : 133,677 : 146,541. : 1Z7,742 JAPAN : Z0,661 : 20,883· : 29, 9:03 : 28., 7 30 : 41, 17 5 CANADA · 43,921 : 49,473: :. 44, 971 : 42, 07 1 : 39, 172 MEXICO : 2,321 : 1,467 : 1, 698 : 2.1 766" : 2,052 MIDDL·E "EAST" : . 16 1 : 27 : 573 : : 436 : 10,527 NON-MARKET .ECONOMIES: 131 : 191 : 2,547 : 3, 161 452
WORLD: : 199 ,;_691 : 233,997 : 267,613 : 278,078· .. 2~0,623 : : :
: Expod:s. ·- : : : ~ : : . WESTERN EUROPE : 385, 8.24 : 522;671 : 486,922 : 495~ 006- : 494,315 .. JAPAN : 132,517 : 169,088 : 171,178 : 160,831 : 155,016 CANADA : 179.749 : 210,538 : 261,22~ : 229, 896" : 240,735 MEXICO : 76,604 : .· 108·,628 : 131,379 : 83,883 : 67,937 ; w MIDDLE EAST . : 57 ,·472 : 102,626 : 117,411 : 128,342 : 77,017 tH)N-MARKET ECONOMIES:. 17, 189 : 21, 6 17 : 27,042 : 46,796 : 20,280
WORLD :·1,526,610 :1,937,218 :2,012,479 : 1, 878, 136 : 1, 764, 124 : : : : -I : : : :
:Trade Balance : : : : : WESTERN-EUROPE : 27 1, 341 : ·388,260 : 353,245 : 348,465 : 366,573 JAPAN : 111,855 : ""148,205 : 141, 27 5 ·: 132, 101 : 113,{141 CANADA . : 135,828 : 161~065 : 216,252 : 187,824 : 201,563 MEXICO : 74,283 : ·107,160 : 129,681 : 81,117 : 65,885 MIDDLE EAST : 57,310 : 102,599 : 116,837 l 127,906 : 66,490 NOH-MARKET ECONOMIES: 17, 059 : 21, 426 l 24,495 ; 43,635 : 19,828
WORLD : 1,326,919 :1,703,221 :1,744,866 : 1, 600, 058 : 1,513,502
Source: Compiled from offjcial Btatistics of the U.N. Trade Data System.
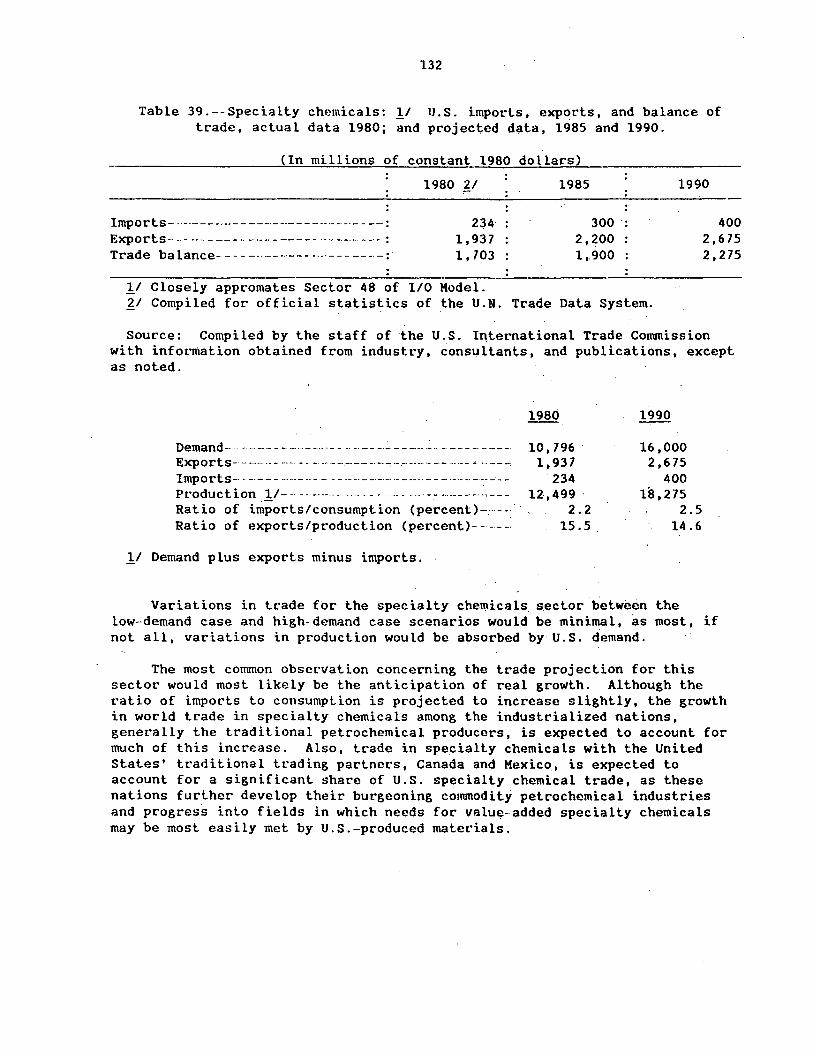
132
Table 39.--Specialty chemicals: .!J U.S. imports, exports, and balance of trade, actual data 1980; and projected data, 1985 and 1990.
(In millions of constant 1980 dollars)
Imports--·-·--------------- - ------- -·-- -- : Exports--· - -- - --- - --- - ----- ·-----·-· -·-·- : Trade balance- -- - --··----- - ---·-- - ----:
1980 21
234· 1,937 1, 703
1/ Closely appromates Sector 48 of I/O Hodel.
1985
300 ·: 2,200 1,.900
1990
400 2,675 2,275
21 Compiled for official statistics of the U.N. Trade Data System.
Source: Compiled by the staff of the U.S. International Trade Commission with information obtained from industt·y, consultants, and publications, except as noted.
Demand--··-·-··-·- - - - ... _ -... -- - -· -· ·-- -·~- - - ---- .~ ·· -· -- - - - - - -· Exports- - -·- ·- - ··--· - _ .. _. ------.---- ----,- .---·--·- -·- -···--" ·· -- -, Imports--·-----·--·-- -- - - -- ---·--·-···· ·- -·---· - - - ·-·- -· -·---· --Production J/- - -- ---·- - - -- -- - - ·-- - ·-- - - -·---.. ·o- - -
Ratio of imports/consumption (percent)----: Ratio of exports/pt·oduction (percent)----·--·
1/ Demand plus exports minus imports.
1980
10, 796 1,937
234 12,499
2.2 15.5
1990
16,000 2,675
400 18,275
2.5 14.6
Variations in trade for the specialty che~icals sect.or between the low-demand case and high-demand case scenarios would be minimal, as most, if not all, variations in production would be absorbed by U.S. demand.
The most common observation concerning the trade projection for this sector would most likely be the anticipation of real growth. Although the ratio of imports to consumption is projected to increase slightly, the growth in world trade in specialty chemicals among the industrialized nations, generally the traditional petrochemical producers, is expected to account for much of this increase. Also, trade in specially chemicals with the United Stales' traditional trading partners, Canada and Mexico, is expected to account for a significant share of U.S. specialty chemical trade, as these nations further develop their burgeoning commodity petrochemical industries and progress into fields in which needs for valu~-added specialty chemicals may be most easily met by U.S.-produced materials.
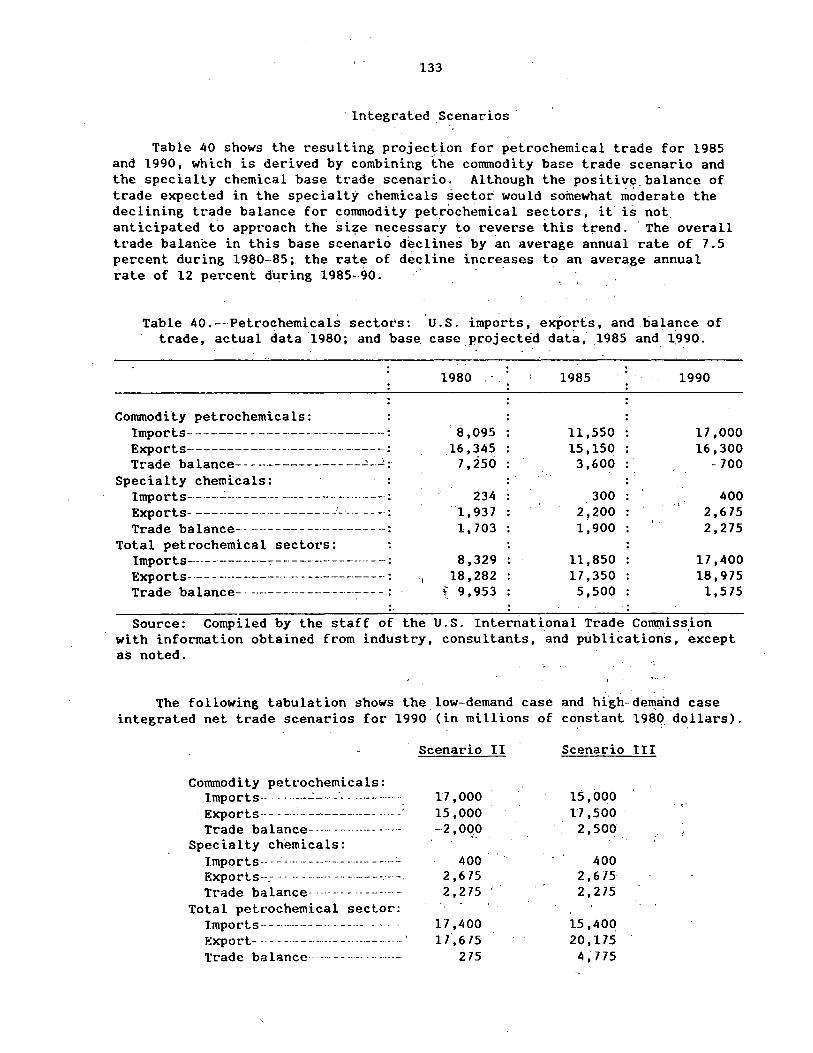
133
· Integrated _Scenarios ·
Table 40 shows the resulting projection for petrochemical trade for 1985 and 1990, which is derived by combining the commodity base trade scenario and the specialty chemical base trade scenario. Although the positiv~.balance of trade expected in the specialty chemicals sector would somewhat moderate the declining trade balance for commodity petroch~mical sectors, it is not. anticipated to approach the si~e necessary to reverse this trend. ·The overall trade balance in this base scenario d~clines by an average annual rate of 7.5 percent during 1980-85; the rate of decline increases to an average annual rate of 12 percent d~ring 1985--90.
Table 40.--·Petrochemicals sectors: U.S. imports, ezj)orts, and balance of trade, actual data 1980; and base case projected data, 1985 and 1~9-90.
1980 1985 1990
Commodity petrochemicals: Imports-------- - -·-- -·---·-·-------- ·-: 8,095 11,550 17 ,000 Exports------·-------·----·--- - ·· -·--- -·: Trade balance- -- ----------'- ___ _.:: _ __::
16,345 · 1, 25ci
15,150 16,300 3,600 - 700
Specialty chemicals: : Imports---··----·---- - -· --·--· --·-- - ---- -· -·-·-- -- -·: 234 300 400 Exports------------·--·-------~·-·-·-----: . 1, 93 7 2,2()0 2,675 Trade balance------------------------·-: 1, 703 1,900 2,275
Total petrochemical sectors: Imports-·-·- - ------·-.,---·----·-·-- ---·· - -: 8,329 11,850 17 ,400 Exports----- - --·------·····----------------: ·1 18,282 17 ,350 18,975 Trade balance------------··--------,----: \ 9,953 5,500 1,575
Source: Compiled by the staff of the U.S. Internati_onal Trade CollllJliss.ion with information obtained from industt·y, consultants, and publications, except as noted.
The following tabulation shows the low-demand case and hfgh-de~al'\d case integrated net trade scenarios for 1990 (in mi 11 ions of cons.lant 19~0. dollars) .
Commodity pett·ochemicals: Imports-- -- - ___ _: ____ -·- ___ .. _ - .... · --_ Exports---- - - c: .. --------·--- - ---- -· Trade balance--------------·----
Specialty chemicals: Imports-- -- --·- - - ----- - - ---- - ___ :_ Exports--_-·· - -- - - ---- -- --- - - -.--· -. Trade balance------ - - -- - ------ -
Total petrochemical sector: Imports-------·-------- - -- -- - · · -Export- -- - - ------·------ -·-·-------··- · Trade balance-----·--·-----····--·
Scenario II
17 ,000 15,000 -2,0C).O
400 2 '6 75 2,275
ll ,400 l (, 6 /5
275
Scenario III
15,ooo . 17 ,500
2,500
400 2 ,6 75 2,275
15,400 20,175
4 ~ 775
',.
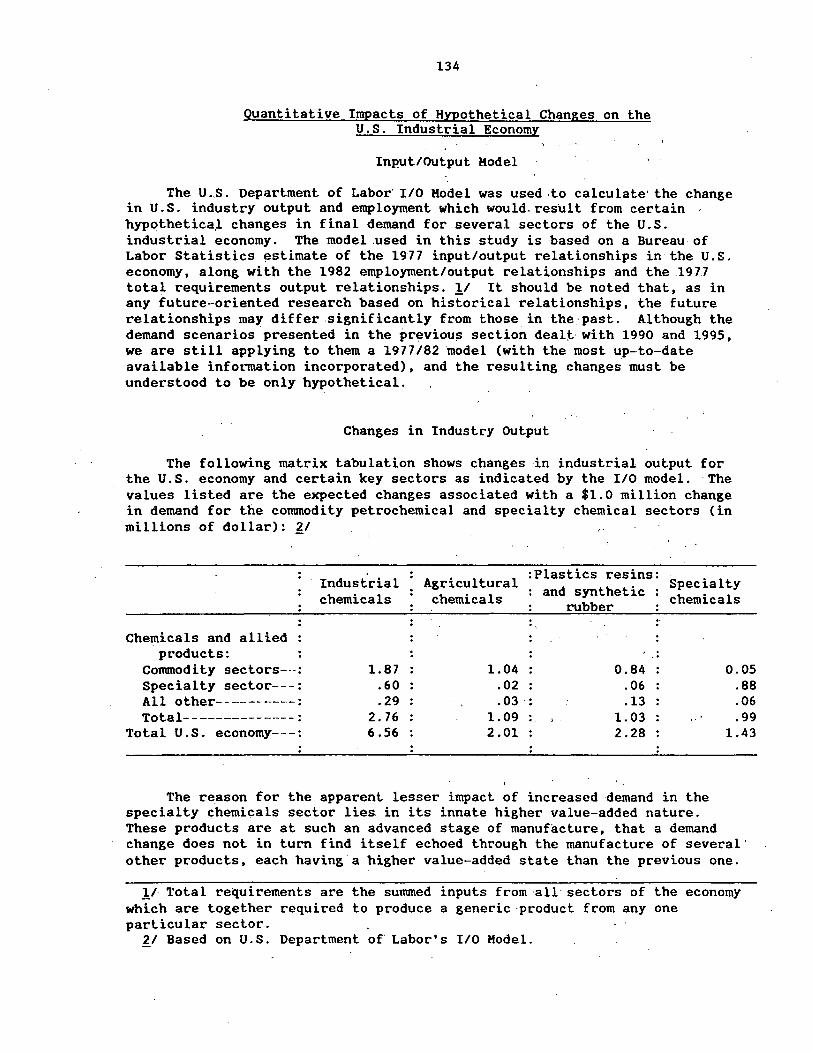
134
Quantitative Impacts of Hypothetical Changes on the U.S. Industrial Economy
Input/Output Model
The U .. S. Department of Labor· I/O Hodel was used .to calculate· the change in U.S. industry output and employment which would.result from. certain hyp()thetica.l changes in final demand for several sectors of the U.S. industrial economy. The model used in this study is based on a Bureau of Labor Statistics estimate of the 1977 input/output relationships in the U.S. economy, along with the 1982 employment/output relationships and the .197.7 total requirements output relationships. !I It should be noted that, as in any future-oriented research based on historical relationships, the future relationships may differ .significantly from those in.the past. Although the demand scenarios presented in the previou~ section dealt· with 1990 and 1995, we are still applying to them a 1977/82 model (with the most up-to-date available information incorporated), and the resulting changes must be understood to be only hypothetical.
Changes in Industry Output
The following matrix tabulation shows changes in industrial output for the U.S. economy and certain key sectors as indicated. by the I/O model. -The values listed are the expected changes associated with a $1.0 million change in demand for the commodity petrochemical and specialty chemical sectors (in millions of dollar): ~/
Industrial Agricultural :Plastics resins:
Specialty and synthetic chemicals chemicals rubber chemicals
•.
Chemicals and allied products: ..
Commodity sectors---: 1.87 1.04 0.84 0.05 Specialty sector---: .60 .02 .06 .88 All other-----------: .29 .03 . .13 .06 Total--------------: 2. 76 1.09 1.03 .99
Total U.S. economy---: 6.56 2.01 2.28 1.43
The reason for the apparent lesser impact of increased demand in the specialty chemicals sector lies in its innate higher value-added nature. These products are at such an advanced stage of manufacture, that a demand change does not in turn find itself echoed through the manufacture of several' other products, each having a higher value-added state than the previous one.
ll Total requirements are the sununed inputs from·all· sectors of the economy which are together required to produce a generic product from any one particular sector.
21 Based on U.S. Department of· Labor's I/O Model.
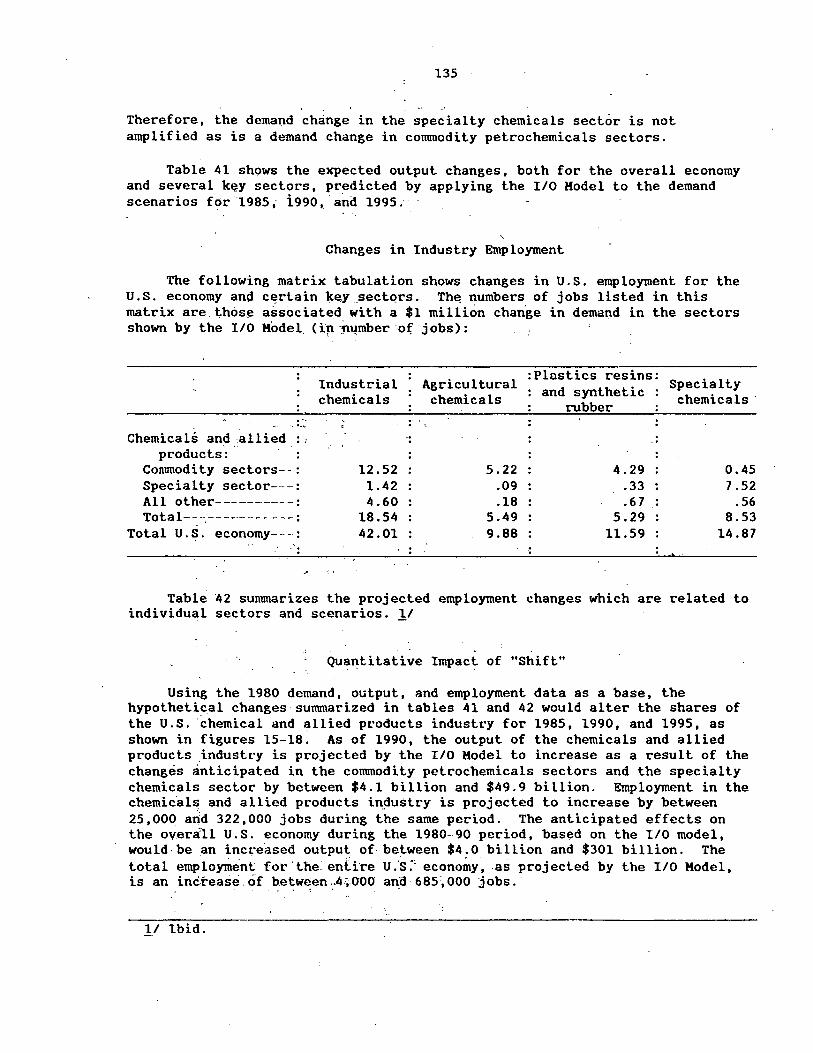
135
Therefore, the dema~d change in the specialty chemicals sector is not amplified as is a demand change in commodity petrochemicals sectors.
Table 41 shqws the expected output changes, both for the overall economy and several k~y sectors, predicted by applying the 1/0 Model to the demand scenarios for 1985.. i 990 '· and 1995. .
Changes in Industry En'lployment
The following matrix tabulation shows changes in U.S. employment for the U.S. economy an!l c~rtain 1cey .secto.rs. The, numbers of jobs listed in this matrix are.thos~ associated with a $1 million change in demand in the sectors shown by the I/O Model. ( ip -~u~mber o{ jobs):
•'· ...... Chemicals and .allied : ;
products: Commodity sectors--: Specialty sector---: All other------------- - : Total--~------------:
Total U.S. economy--· - :
Industrial chemicals
12.52 1.42 4.60
18.54 42.01
:Plostics resins: Agricultural Specialty
chemicals and synthetic chemicals · rubber
5.22 4.29 0.45 .09 .33 7.52 .18 .67 .56
5.49 5.29 8.53 9.88 11.59 14.87
..
Table 42 summarizes the projected employment changes which are related to· individual sectors and scenarios. 11
Qu~f!.titative Impac~ of "Shift"
Using the 1980 demand, output, and employment data as a base, the hypothetical changes summarized in tables 41 and 42 would alter the shares of the U.S. ·chemical and allied products industry for 1985, 1990, and 1995, as shown in figures 15-18. As of 1990, the output of the chemicals and allied products industry is projected by the 1/0 Model to increase as a result of the changes anticipated in the commodity petrochemicals sectors and the specialty chemicals sector by between $4.1 billion and $49.9 billion. Employment in the chemic.a ls and allied products i~~ustry is projected to increase by between 25,000 arid 322,000 jobs during the same period. The anticipated effects on the overa'll U.S. economy during the 1980-90 period, based on the I/O model, would.be .an inct·eased output of between $4.0 billion and $301 billion. The total emploJtitenl for'theentire u:s:' ecorio~y •. as projected by the I/O Model, is an ·increase' of betwe,en /1;000 ana 685. 000 jobs ..
1/ Ibid.
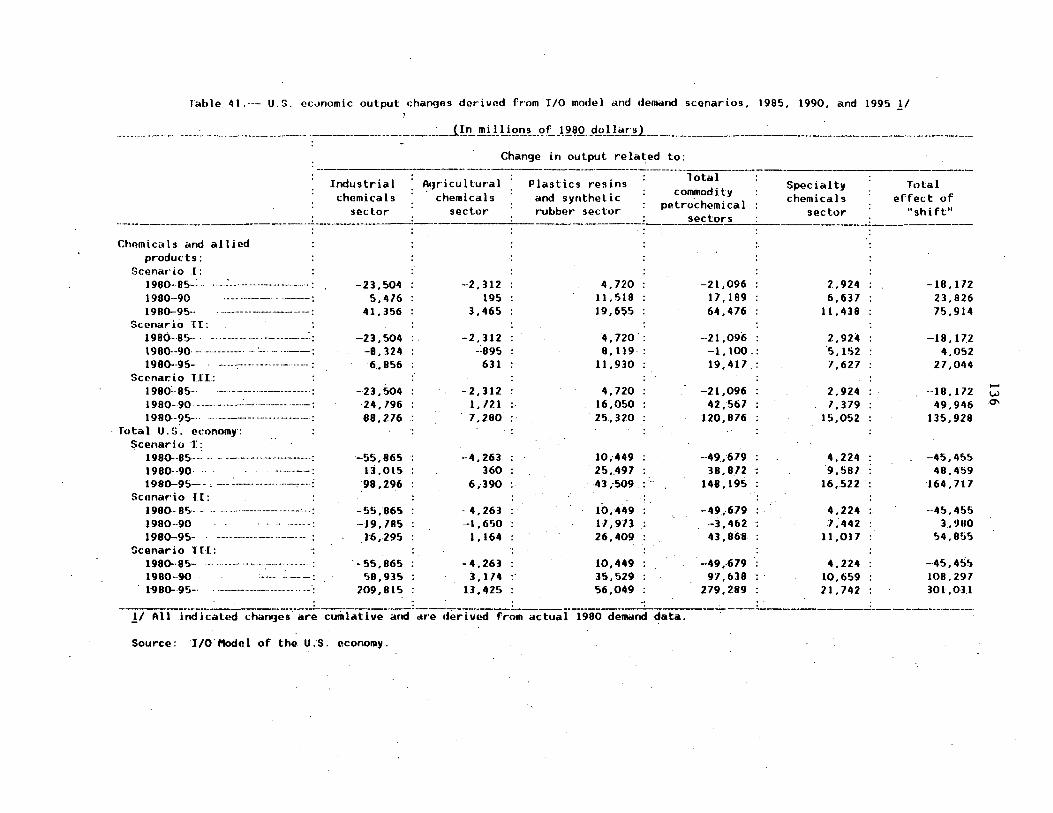
T'able 41.--- U.S. ec0nomic output changes dedved from I/0 model and dellliind scenados, 1985, 1990. and 1995 .!/
___ ............. ___ --·--·-·--··· . ·----·-----.. ·-·---....... - .... --~-·--· _J.!!!.....!1!.!l!J..C?n~ ... C?LJ~~Q-~2..U~r.~l .... _________ .. --·-----------····--.. -----·-···----------
Change in output related to: ·-------------------··--·-·-·-·-·-·----·----···---·--·------·--·--·---·--·------·----------·---·--------··-·----. .
Industrial · A1,Jdcultur·al · .. chemicals
lotal Plastics resins and synthetic : commodity chemkals
Specialty chemicals
sector
Total effect of
"shift" ·--- . sector . sector rubber se<"lor : petrochemical -- -·-·-----·-----------------~--·--- -----~----------:------.. --.. __:·-------:----~EJors ------·---------·---.. ---·-
ChP.micc:ils and allied products:
Scenar· io I: 1980- 85-· 1980·-90 1990-95--
Scenario lI: 1980····85-·· l 980--90 .... -·-·--·"· 1980-·95-
Sc~nar.io Ill: 1980· 85-· 1980-·90· 1980--95-.
folal U.!i. economy·: Scenario I:
1980.--85--· ..... ··----- ---· .. ·------· 1980--90· 1980-95~- - ' ---·- : ___ ...
Sc1maf'io U: 1980-·85-1980·-90 1980-95-
Scenario lTC: 1980-·85--1980-90
. 1980-·95-·
-23,504 : --2. 312 : 4,720 : 5,416 : 195 : 11,518 :
41,356 : 3,465 : 19,655 : : : :
-23,504 : . -2.312 : 4. 720.: -8, 324 : _:995 : 8. 119 :
6_,856 : 631 : 11,930 : : : :
-23,504 : -2.312 : 4. 720 : 24,196 : l, 121 :- 16,050 : 88,276 : . 7,280 : 25,320 :
~ : :
-55,865 : --4,263 : 10,449 : ll,015 : . 360 : 25,497 : 98,296 : 6,390 : 43;509.:.
: : .,
-55,865 : ··4,263 : 10.449 : ·-19, 185 : --1,650 : 17,973 : '1·6,.295 : 1,164 : . 26,409 :
: : : . -55,865 : -·4,263 : 10,449 :
~;8,935 : 3. 114 :· 35,!'>29 : 209,815 : 13,425 : 56.049 :
. . . . . . J./ All indi~:ated chanq~...,.. ar-;··cumlative--~~--~-;.e-;teriv~d fn;;.--;-ctua1i98o d~ma.:ict data.
Source: I/O'l"'lodel of the U.S. economy.
-21,096 : 2,924 : -18,172 17,109 : 6,637 : 23,826 64,476 : 11,438 : 75,914
: : -21,096 : 2,924 : -18, 17.2 -1.100.: 5, 152 : 4,052 19,417 : 7,627 : 27,044
: -21,096 : 2,924 : . --18.172 .42,567 : 1,379 : 49,946
120,876 : 15,052 : 135, 928 : :
-·49 .• 679 : 4,224 : -45,455 38,812 : 9,587 : 48,459
148,195 : 16,.522 ': '164. 717 :
-49 .-fi79 : . 4,224 : -.. 45. 455 ·-3. 462 : 7;442 : 3,980 43,868 : 11,017 : 54,855
: : -49,-679 : 4.224 : -45,455
97,638 : 10,659 : 108. 297 279,289 : 21,742 : 301,03.l
. . . . ··---·------------------------------
...... ·w 0\
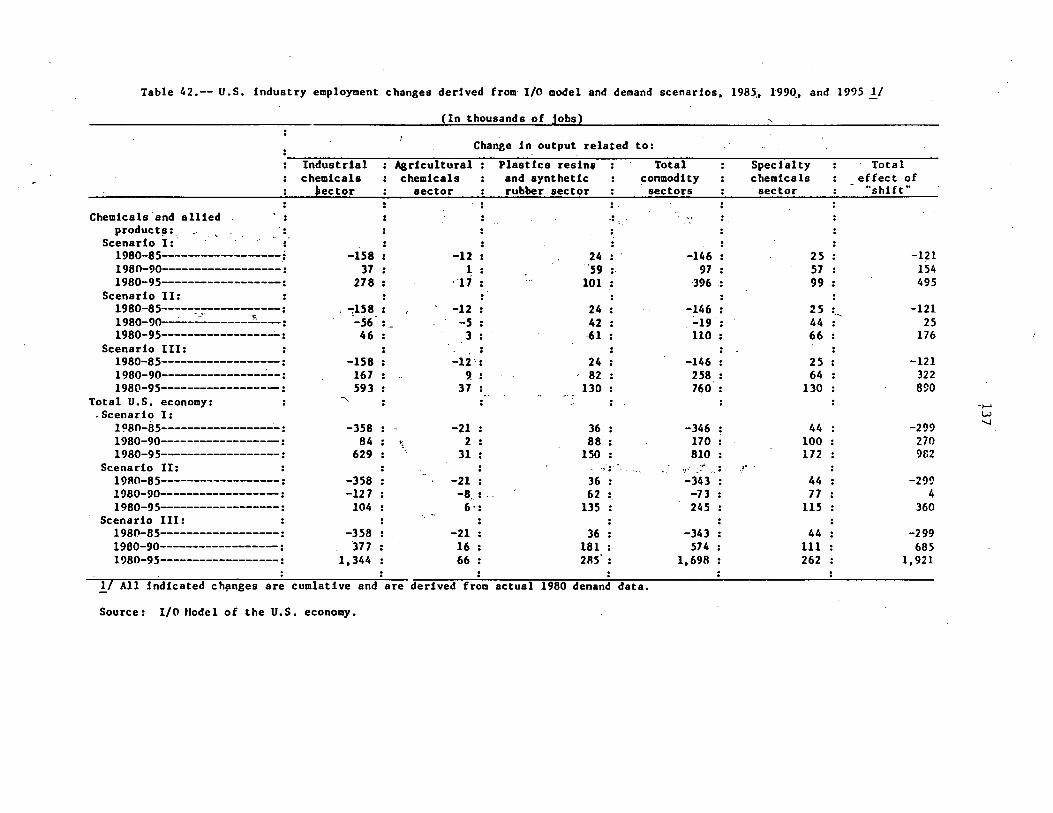
Table 42.-- U.S. industry employment changes derived from I/O model and demand scenarios, 1985;, 1990_, and 1995 ]J
(In thousands of jobs)
Change in output related to:
Industrial : Agricultural : Plast lea resins : Total : Specialty : Total chemicals : chemicals : and synthetic : conmodity : chemicals : effect of -
ector : sector : rubber sector : sectors : sector : "shift" :
Chemicals and allied : : : .: : .. '" • . .. . product!':, :
Scenario I: : 1980-8 5------------------.: -158 : -12 : 24 : -146 : 25 : -121 1980-90------------------: 37 : 1 : ·59 : 97 : 51 : 154 1980-95-----~---------~: 278 : · 17 : 101 : 396 : 99 : 495
Scenario II: 1980-85------~----~----: . -:158 : ' -12 : 24 : -146 : 25 : -121 1980-90--~-:.:: ______ _.:_ ___ : --56 : -5 : 42 : -19 : 44 ;~ 25 1980-95-----~---------..;..: 46 : 3 : -61 : 110 : 66 : 176
Scenario III: : . : : : : . 1980-85----------------~: -158 : -12.: 24 : -146 : 2 5 : -121 1980-90---------------~--: 167 : 9 . . 82 : 258 : 64 : 322 1980-95----------------~: 593 : 37 : 130 : 760.: 130 : 890
Total U.S. economy: : ...... : : : : : _,_. .Scenario I: w
1~80-85------------------: -358 : -21 : 36 : -346 : 44 : -299 -...J
1980-90----------------~: 84 : \. 2 : 88 : 170 : 100 : 270 1980-95------------------: 629 : 31 : 150 : 810 : 172 : 982
Scenario II: : : . : ~ ·:. . , .. . ., ·• . , .. . " ~ ~ ... ;., . ..
19R0-85----~------~----: -358 : -21 : 36 : -343 : 44 : -299 1980-90----------------~: -127 : -8 .. : 62 : -73 : 71 : 4 1980-95------------------: 104 : 6 .• 135 : 245 : 115 : 360
Scenario III: 1980-85------------------: -358 : -21 : 36 : -343 : 44 : -299 1980-90----------------~: 377 : 16 : 181 : 574 : 111 : 685 1980-95------------------: 1,344 : 66 : 2s5· : 1,698 : 262 : 1,921 . . . .
!7 All indicated ch~nges ar~ cumlative and0
are derived fr~m actual 1980 demand data.
Source: I/O llodel of the U.S. economy.
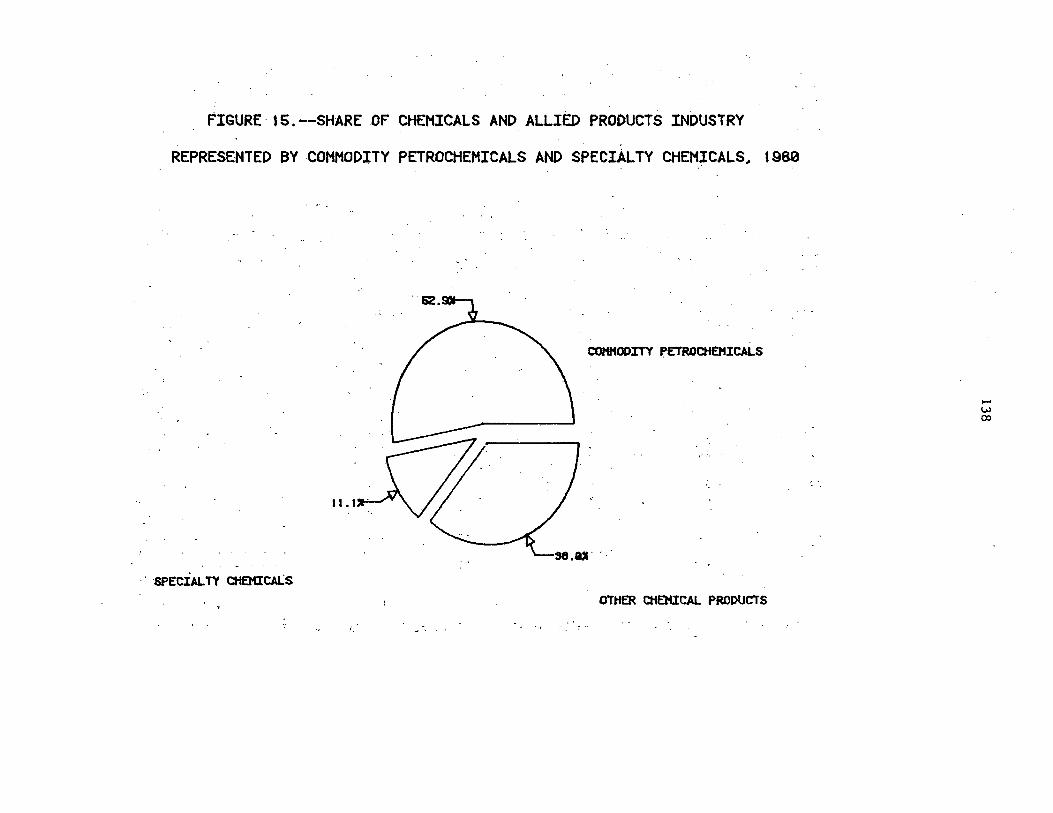
FIGURE 16.--SHARE OF CHEMICALS AND ALLIED PRODUCTS INDUSTRY
REPRESENTED BY COMMODITY PETROCHEMICALS AND SPECIAL TY CHEM.ICALS.. 1980
COHHOPITY PETROCH£11ICALS
, ..
l 1. I
. . SPECIAL TY CHEMICALS
OTHER CHEMICAL PRODUCTS
i.
..... w 00
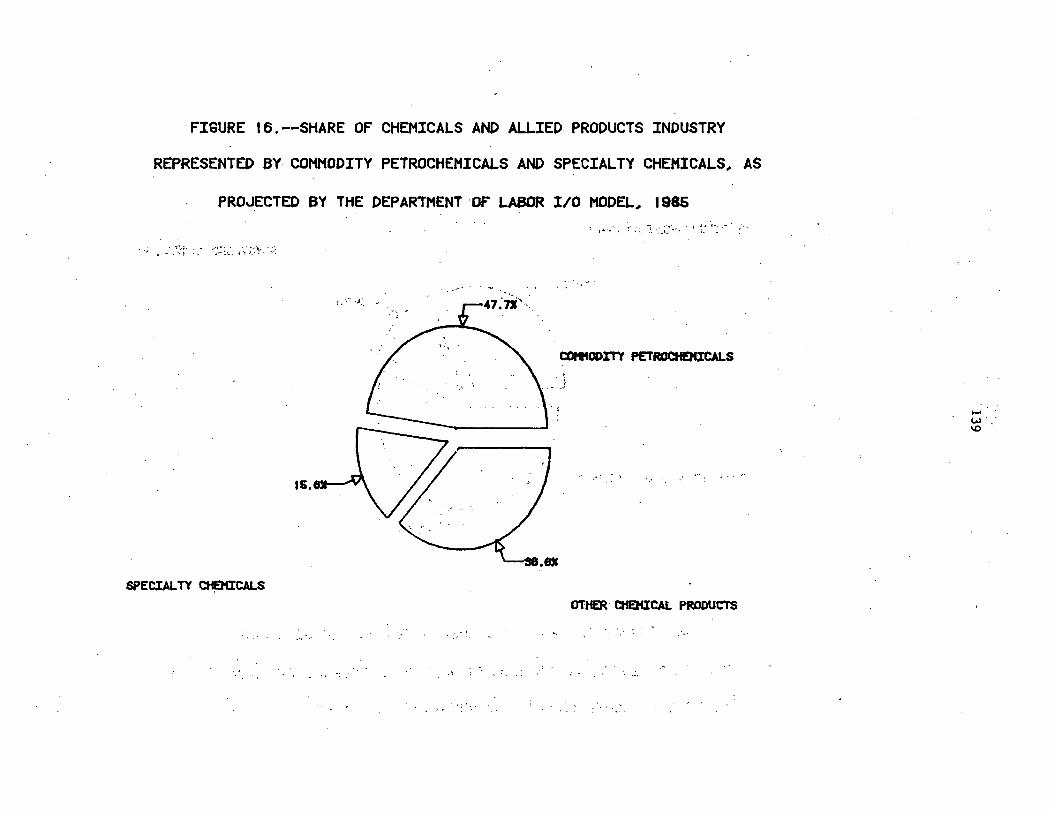
FIGURE 16.--SHARE OF CHEMICALS AND ALLIED PRODUCTS INDUSTRY
REPRESENTED BY COMMODITY PETROCHEMICALS AND SPECIALTY CHEMICALS, AS
PRO~ECTED BY THE DEPARTMENT OF LABOR I/O HODEL, 1986 •"''~ ~· i ... _~.~···~ ~:·'f"'·
. ·~ ~· .~:·~· ··~·..: ~ .. :_ ( ·~·.:.:~~ .. ~~:
. __ ,,.. . ...
:. ·..1:: '
~Ol>ITY PETROCtlEJUCALS
. '
... ·, 16,..-....V\
SPECIALTY CHEMICALS OTHER· CHEMICAL PRODUCTS
..... ....,. '°
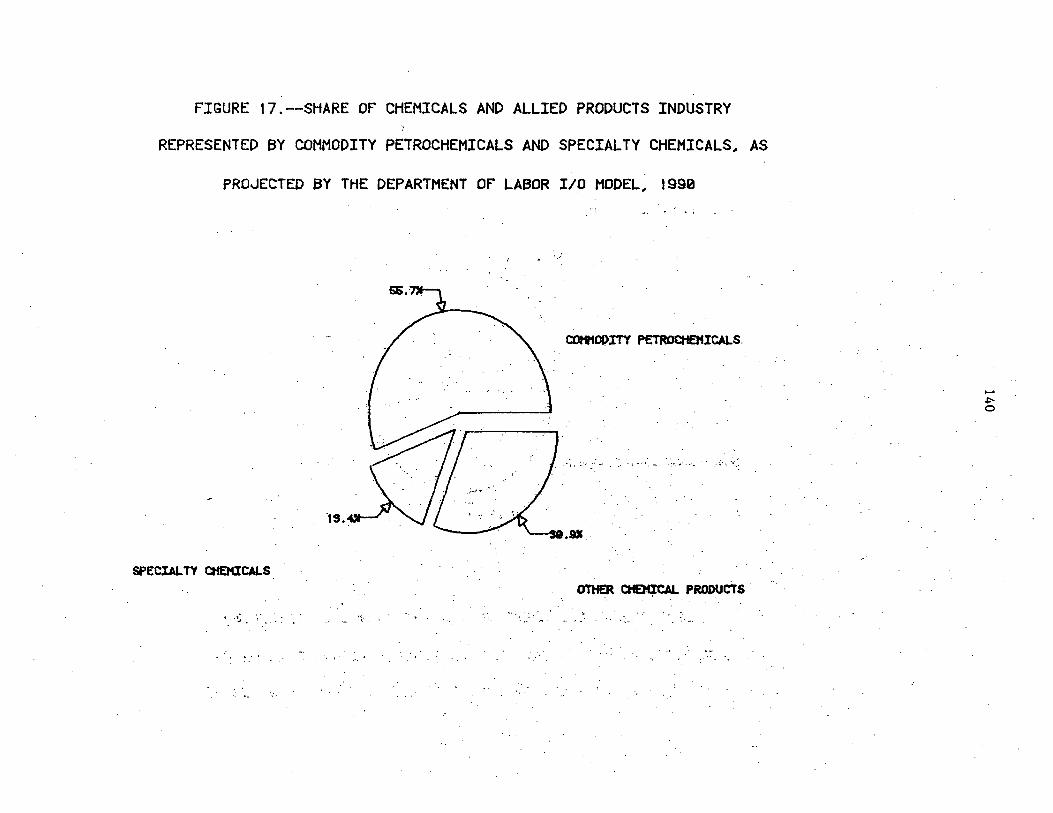
FIGURE 17.--SHARE OF CHEMICALS AND ALLIED PRODUCTS INDUSTRY
REPRESENTED BY COMMODITY PETROCHEMICALS AND SPECIALTY CHEMICALS# AS
PROJECTED BY THE DEPARTMENT OF LABOR I/O MODEL# 1990
cottfOl>ITY PETRDatEHICALS.
. : ~. ~. ... ' '."- ,.. .. ··~ ·' :,; . -... ,•
;....- ..
·1s.
Sf'ECIALTY CHEtaCALS
OTHER ~ PRODUCTS .
~ • ,_; '1. I~. - .. · .. '.
.....
.i:--0
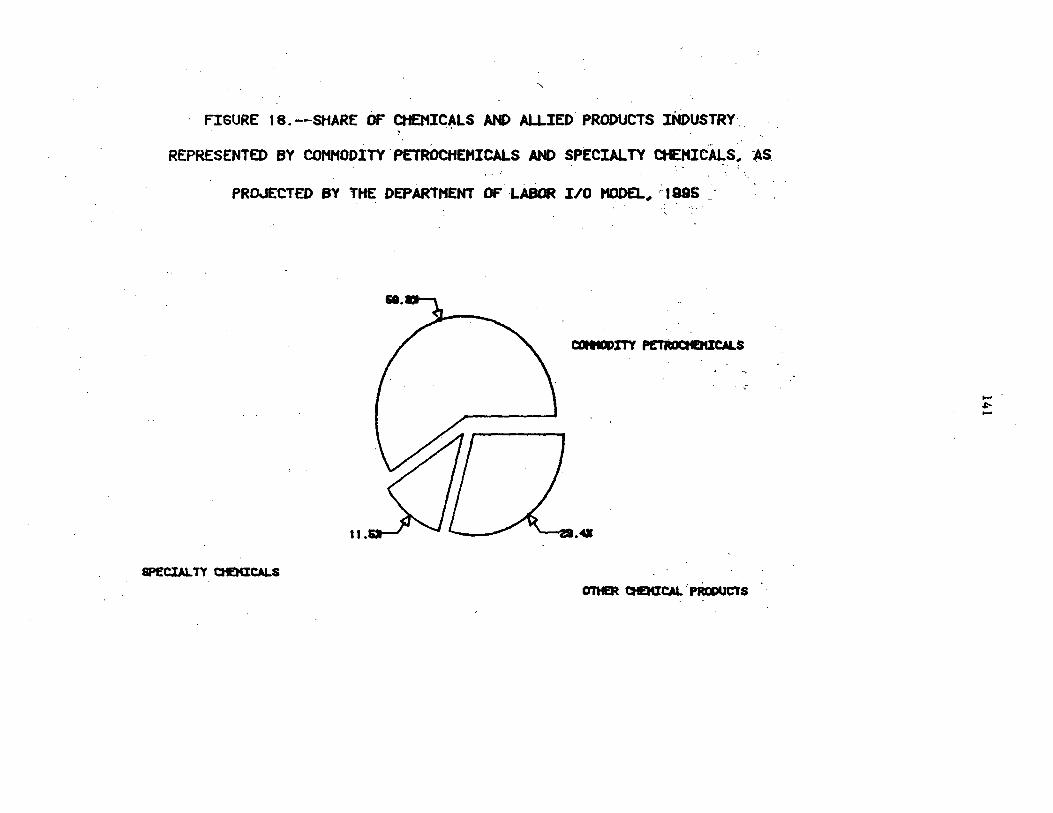
" FIGURE 18. --SHARE OF CHEttIC~LS AND ALLIED. PRODUCTS INDUSTRY· ..
REPRESENTED BY COHtfODITY PETROCHEMICALS AND SPECIALTY aiEHICALS~ ~$ . .. .
PROJECTED BY THE DEPARTttENT OF LABOR I/O t100£l.., ; 1996 _ ·
cotttOl>m ~s
11. .G
SPECIALTY CHE>aCALS OTHER atEMICAL'PRaouets
-.i:-. -
142'
In 1995, output from the chemicals and allied products industry is projected to increase by between $27.0 billion and $).35.9 billion, from the 1980 values. Employment for this industry is proje~ted to increase by between 176,000 and 890,000 jobs during 1980-95. Overall U.S. eco~~mic o~tput f9r 1995 is projected to increase by between $54. 9 billion and $30LO billion. during 1980-95, and total employment is projected t;.o increase.by.between 360,000 and 1.9 million jobs.
Figure 15 shows the relationships among the primary indµstry sectors which comprise the chemicals and allied product~ industry, as of 1980. Figures 16-18 show the anticipated retationJ?hips according tQ the base scenario projections of .the I/O. model,for.198~. 19~0, and i995, W}\ile the share of the chemicals and allied prod~ts. in4ustry held by the COTUJllOdily petrochemicals sector is-anticipated to decline from 5~ p~rcent in 1980 to 48 percent in· 1985, ·the overall size of. this secto.r a.llows it to regain an· .. ~ increased share· of the chemicals an~.allied; p~o~ucts industry, despite the slower growth rate expected for thi~ sector during 198~_:95. The share of tl\e industry held by specialty·. chemicals .is anticipated tq increase in~tial,ly from 11 percent in 198.0 to an expect~d i6 perce~t in .1985, and then l!ecline t~ ;.:. approximately 12: •percent by_ 1995. )