THE ROLE OF INTESTINAL GLUCURONIDATION ON THE …
250
AN INVESTIGATION INTO THE ROLE OF GLUCURONIDATION ON THE DISPOSITION AND TOXICITY OF MYCOPHENOLIC ACID USING TARGETED QUANTITATIVE PROTEOMICS David Edward Harbourt A dissertation submitted to the faculty of the University of North Carolina at Chapel Hill in partial fulfillment of the requirements for the degree of Doctor of Philosophy in the Curriculum of Toxicology. Chapel Hill 2009 Approved by: Advisor and Committee Chair: Philip C. Smith, Ph.D. Reader: Michael J. DeVito, Ph.D. Reader: Gary L. Glish, Ph.D. Reader: Mary F. Paine, Ph.D. Reader: Joseph K. Ritter, Ph.D.
Transcript of THE ROLE OF INTESTINAL GLUCURONIDATION ON THE …
i
AN INVESTIGATION INTO THE ROLE OF GLUCURONIDATION ON THE DISPOSITION AND TOXICITY OF MYCOPHENOLIC ACID USING TARGETED
QUANTITATIVE PROTEOMICS
David Edward Harbourt
A dissertation submitted to the faculty of the University of North Carolina at
Chapel Hill in partial fulfillment of the requirements for the degree of Doctor of Philosophy in the Curriculum of Toxicology.
Chapel Hill
2009
Approved by:
Advisor and Committee Chair: Philip C. Smith, Ph.D. Reader: Michael J. DeVito, Ph.D.
Reader: Gary L. Glish, Ph.D. Reader: Mary F. Paine, Ph.D.
Reader: Joseph K. Ritter, Ph.D.
ii
ABSTRACT
DAVID HARBOURT: “An Investigation into the Role of Glucuronidation on the
Disposition and Toxicity of Mycophenolic Acid using Targeted Quantitative Proteomics”
(Under the direction of Dr. Philip C. Smith)
The prodrug mycophenolate mofetil (MMF) is used clinically for
prophylaxis of organ rejection in transplant patients. MMF is metabolized to the
active metabolite mycophenolic acid (MPA). While proven useful in this setting, a
significant fraction of patients receiving MMF chronically experience delayed-
onset diarrhea, which limits the long term effectiveness of their treatment. MPA
is eliminated primarily through glucuronidation by the action of UDP-
glucuronosyltransferase (UGT) 1A enzymes within the liver and intestine.
Glucuronides in the liver are excreted into the bile by the canalicular transporter
multidrug resistance-associated protein 2 (MRP2) where they are subject to
enterohepatic cycling and excretion through the urine as glucuronides.
Glucuronidation results in the formation of the inactive phenolic glucuronide
(MPAG) and the labile acyl glucuronide (acMPAG). While the formation of
MPAG is the primary method of detoxification of MPA in vivo, studies have
attempted to link formation of acyl glucuronides with adverse drug reactions
(ADRs). While evidence has been inconclusive in directly linking acyl
glucuronides with toxicity, some drugs forming acyl glucuronides have been
removed from the marketplace due to ADRs. The overall hypothesis of this

iii
dissertation project is that variable glucuronidation formation and efflux within the
liver and gastrointestinal tract results in differential MPAG formation rates and
thus modulates MPA toxicity.
The study of the relationships between metabolism and transport was
aided by quantitative measurement of relevant enzymes in humans and animals.
This methodology was used to establish assays to quantify precise differences in
UGT1A enzymes between the tissues in rats and humans to understand the
differences in metabolism and toxicity of MPA between species. This
dissertation research examined the disposition of acMPAG and MPAG in relation
to expression levels of Ugt1a enzymes and efflux transporters using targeted
quantitative proteomics. By correlating glucuronide catalysis and efflux with
absolute quantification of Ugts and transporters, we increased our understanding
of relationships between glucuronide formation and disposition and UGT
enzymes. This research helps explain some differences in metabolism and
elimination observed between rats and humans administered MPA and these
relationships may be applied to other xenobiotics with Phase II substrates.
iv
ACKNOWLEDGEMENTS
I am forever indebted to my committee chair and advisor, Dr. Philip Smith for his guidance and mentorship over the course of my graduate work. His advice and thoughtful comments during my numerous inquiries throughout my experiments have taught me how to think critically during problem solving. My graduate work in Dr. Smith’s lab has shaped me into the scientist I am today and it is my hope that he can be proud of the work presented as it is a testament to his guidance and thoughtfulness as my mentor. I also have the deepest gratitude for my committee members, Drs. Mike DeVito, Gary Glish, Mary Paine and Joe Ritter for their thoughtful comments and advice over the course of my project. I would especially like to thank the members of the Glish and Ritter labs along with Dr. Peter Bullock and Saber Malecki of Panacos Pharmaceuticals for their assistance and camaraderie as this work would not have been possible without their help. I would like to thank my parents, Cyrus and Bonnie, and my sister Diana for providing me with a solid foundation and for always believing in me. The many lessons they have taught me beginning in my early childhood help shape the kind of person I hope to be through the duration of my adult life. I would also like to thank the members of the Cho lab as my daily interactions with them helped me through all of the ups and downs of graduate school. I would like to thank all of my friends and members of my extended family for their support during the course of my graduate education. My friends have always been supportive of me during the course of my studies and have helped me in many ways that are too numerous to list. I will always be grateful for all of my interactions with them because they formed many of my fondest memories from graduate school. Finally, I would like to express my sincerest gratitude to my wonderful girlfriend Kelly Ennis. The past two years that we have spent together have been the happiest of my life as she has always given me someone to talk to and has been the person that I can always lean on during difficult times. I will always cherish her love and company and meeting her during the course of my graduate studies has been one of the best things that has ever happened to me.
v
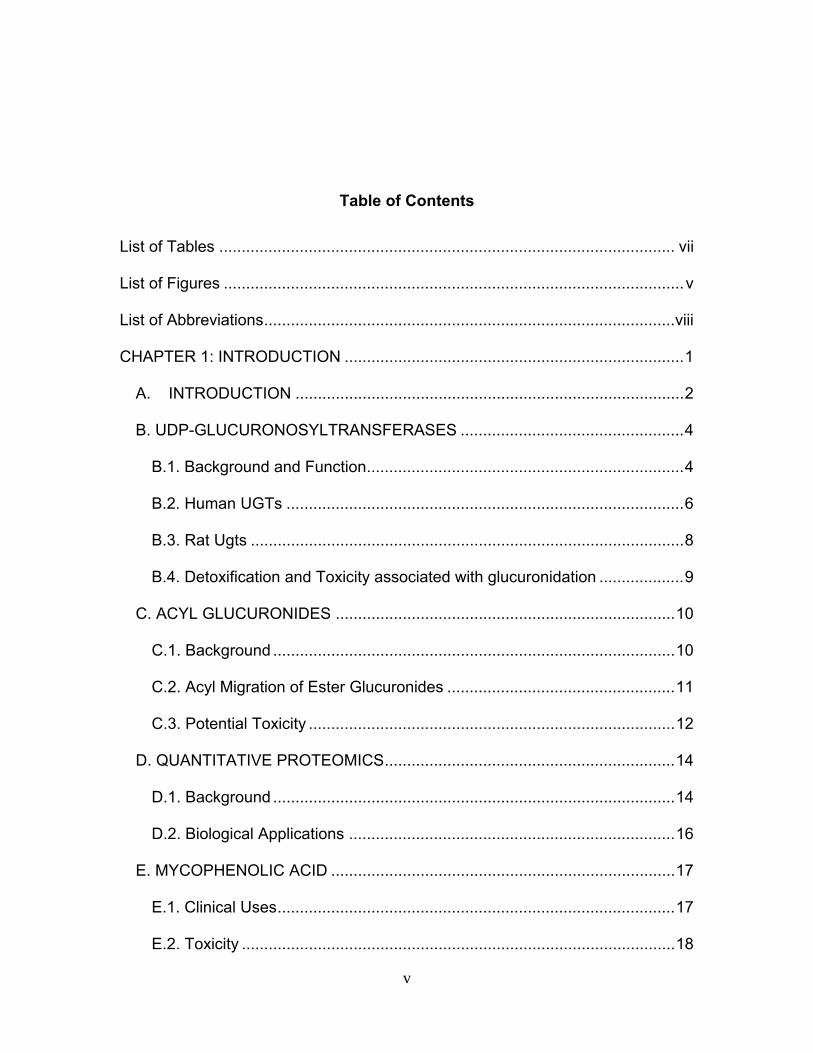
Table of Contents List of Tables ...................................................................................................... vii List of Figures .......................................................................................................v List of Abbreviations............................................................................................viii CHAPTER 1: INTRODUCTION ............................................................................1
A. INTRODUCTION .......................................................................................2 B. UDP-GLUCURONOSYLTRANSFERASES ..................................................4
B.1. Background and Function.......................................................................4 B.2. Human UGTs .........................................................................................6 B.3. Rat Ugts .................................................................................................8 B.4. Detoxification and Toxicity associated with glucuronidation ...................9
C. ACYL GLUCURONIDES ............................................................................10
C.1. Background ..........................................................................................10 C.2. Acyl Migration of Ester Glucuronides ...................................................11 C.3. Potential Toxicity ..................................................................................12
D. QUANTITATIVE PROTEOMICS.................................................................14
D.1. Background ..........................................................................................14 D.2. Biological Applications .........................................................................16
E. MYCOPHENOLIC ACID .............................................................................17
E.1. Clinical Uses.........................................................................................17 E.2. Toxicity .................................................................................................18
vi
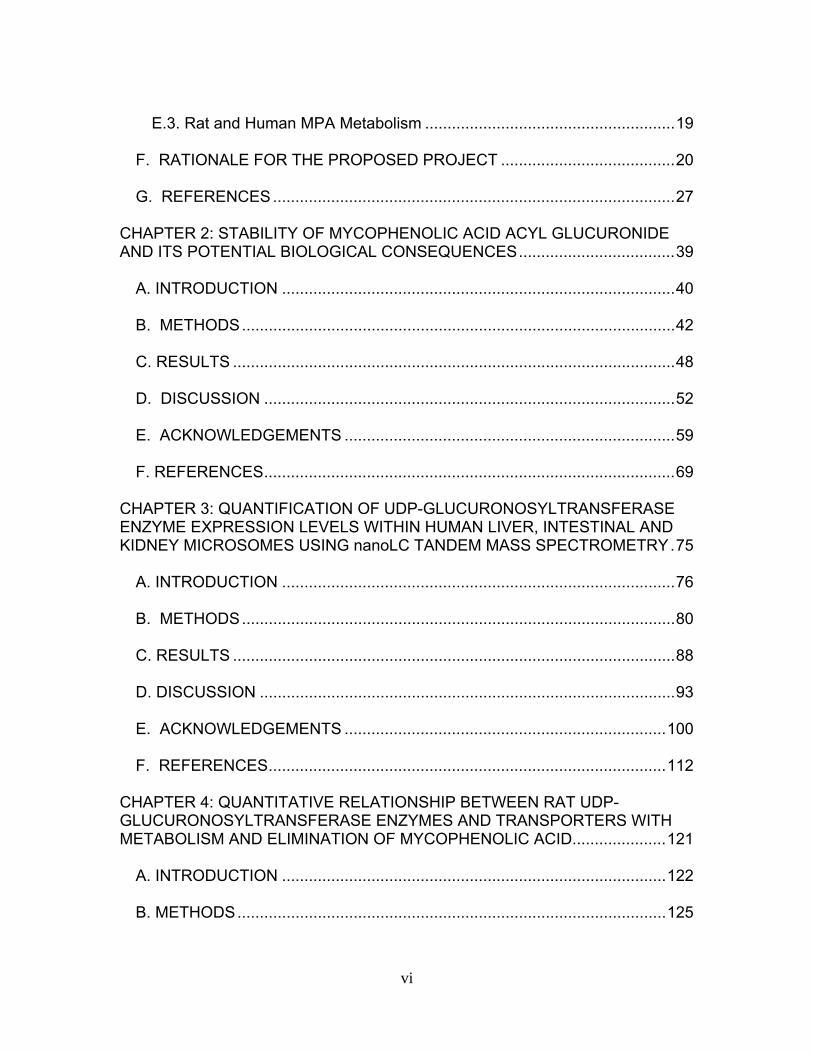
E.3. Rat and Human MPA Metabolism ........................................................19
F. RATIONALE FOR THE PROPOSED PROJECT .......................................20 G. REFERENCES..........................................................................................27
CHAPTER 2: STABILITY OF MYCOPHENOLIC ACID ACYL GLUCURONIDE AND ITS POTENTIAL BIOLOGICAL CONSEQUENCES...................................39
A. INTRODUCTION ........................................................................................40 B. METHODS.................................................................................................42 C. RESULTS ...................................................................................................48 D. DISCUSSION ............................................................................................52 E. ACKNOWLEDGEMENTS ..........................................................................59 F. REFERENCES............................................................................................69
CHAPTER 3: QUANTIFICATION OF UDP-GLUCURONOSYLTRANSFERASE ENZYME EXPRESSION LEVELS WITHIN HUMAN LIVER, INTESTINAL AND KIDNEY MICROSOMES USING nanoLC TANDEM MASS SPECTROMETRY.75
A. INTRODUCTION ........................................................................................76 B. METHODS.................................................................................................80 C. RESULTS ...................................................................................................88 D. DISCUSSION .............................................................................................93 E. ACKNOWLEDGEMENTS ........................................................................100 F. REFERENCES.........................................................................................112
CHAPTER 4: QUANTITATIVE RELATIONSHIP BETWEEN RAT UDP-GLUCURONOSYLTRANSFERASE ENZYMES AND TRANSPORTERS WITH METABOLISM AND ELIMINATION OF MYCOPHENOLIC ACID.....................121
A. INTRODUCTION ......................................................................................122 B. METHODS................................................................................................125

vii
C. RESULTS .................................................................................................133 D. DISCUSSION ...........................................................................................141 E. ACKNOWLEDGEMENTS ........................................................................156 F. REFERENCES.........................................................................................178
CHAPTER 5: CONCLUSIONS..........................................................................184
REFERENCES..............................................................................................192
APPENDIX: ABSOLUTE QUANTIFICATION OF HUMAN URIDINE-DIPHOSPHATE GLUCURONOSYL TRANSFERASE (UGT) ENZYME ISOFORMS 1A1 AND 1A6 BY TANDEM LC-MS..............................................194
A. INTRODUCTION .....................................................................................195 B. METHODS...............................................................................................199 C. RESULTS ................................................................................................208 D. DISCUSSION ..........................................................................................212 E. REFERENCES .........................................................................................232

viii
List of TablesTable 1.1 Localization of UGT1A mRNA in human and rat tissues ....................25 Table 1.2 Pharmacokinetic estimates of MPA/MPAG following a single oral dose of 1.5 g of MMF in healthy human volunteers ...........................26 Table 2.1 Pharmacokinetic estimates following rat dosing .................................67 Table 2.2 Half life values of acMPAG in various matrices. .................................68 Table 3.1 Peptide representatives of all UGT isoforms used for LIT-TOF analysis ..............................................................................................106 Table 3.2 Ion suppression and matrix effects following recombinant enzyme tryptic digestion...............................................................107 Table 3.3 Intraday variability measurements were averaged following five replicate digestions of human liver, intestinal and kidney microsomes.......108 Table 3.4 Interday variability measurements were averaged following five between day replicate digestions of human liver from two separate pools and pooled intestinal microsomes. .........................................109 Table 3.5 Peptide hUGT measurements using the LIT-TOF ............................110 Table 3.6 UGT concentrations obtained from various human intestinal (HIM) and liver microsomal (HLM) donors .......................................111 Table 3.7 Recombinant hUGT enzyme isoform concentrations using the LIT-TOF.............................................................................................112 Table 4.1 Rat Ugt/Transporter stable isotope labeled peptide standards .........171 Table 4.2 MPA pharmacokinetic estimates ...............................................172-173 Table 4.3 Intraday variability of rUgt enzymes and membrane transporters.....................................................................................174 Table 4.4 Interday variability of rUgt enzymes and membrane transporters.....................................................................................175 Table 4.5 Individual peptide measurements of rUgt enzyme expression levels ..............................................................................................176 Table 4.6 Individual peptide measurements of rat transporter expression levels ..............................................................................................177
ix
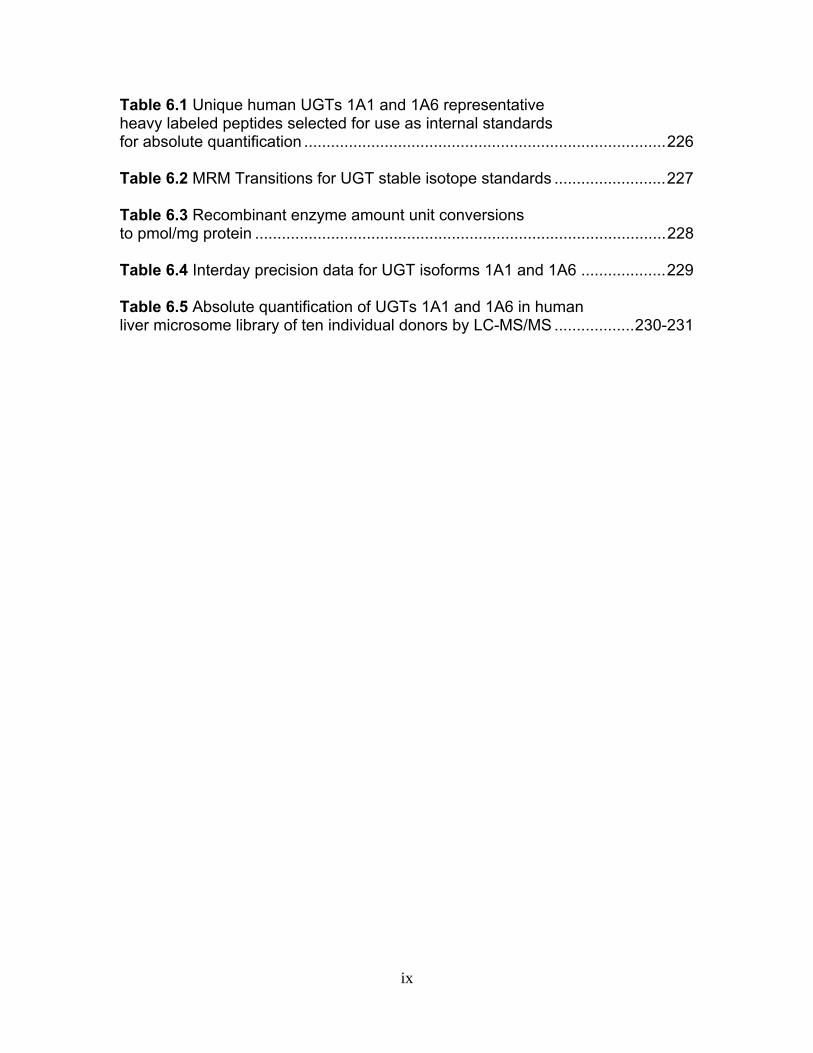
Table 6.1 Unique human UGTs 1A1 and 1A6 representative heavy labeled peptides selected for use as internal standards for absolute quantification .................................................................................226 Table 6.2 MRM Transitions for UGT stable isotope standards .........................227 Table 6.3 Recombinant enzyme amount unit conversions to pmol/mg protein ............................................................................................228 Table 6.4 Interday precision data for UGT isoforms 1A1 and 1A6 ...................229 Table 6.5 Absolute quantification of UGTs 1A1 and 1A6 in human liver microsome library of ten individual donors by LC-MS/MS ..................230-231
v
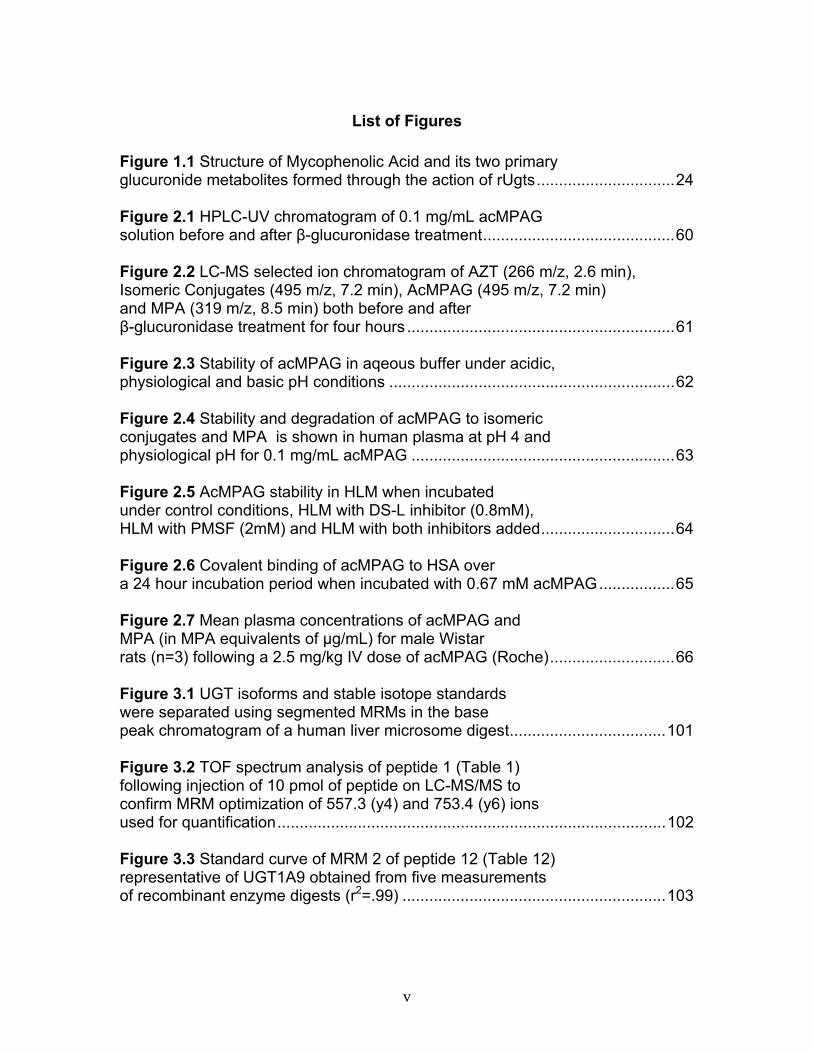
List of Figures
Figure 1.1 Structure of Mycophenolic Acid and its two primary glucuronide metabolites formed through the action of rUgts...............................24 Figure 2.1 HPLC-UV chromatogram of 0.1 mg/mL acMPAG solution before and after β-glucuronidase treatment...........................................60 Figure 2.2 LC-MS selected ion chromatogram of AZT (266 m/z, 2.6 min), Isomeric Conjugates (495 m/z, 7.2 min), AcMPAG (495 m/z, 7.2 min) and MPA (319 m/z, 8.5 min) both before and after β-glucuronidase treatment for four hours ............................................................61 Figure 2.3 Stability of acMPAG in aqeous buffer under acidic, physiological and basic pH conditions ................................................................62 Figure 2.4 Stability and degradation of acMPAG to isomeric conjugates and MPA is shown in human plasma at pH 4 and physiological pH for 0.1 mg/mL acMPAG ...........................................................63 Figure 2.5 AcMPAG stability in HLM when incubated under control conditions, HLM with DS-L inhibitor (0.8mM), HLM with PMSF (2mM) and HLM with both inhibitors added..............................64 Figure 2.6 Covalent binding of acMPAG to HSA over a 24 hour incubation period when incubated with 0.67 mM acMPAG.................65 Figure 2.7 Mean plasma concentrations of acMPAG and MPA (in MPA equivalents of μg/mL) for male Wistar rats (n=3) following a 2.5 mg/kg IV dose of acMPAG (Roche)............................66 Figure 3.1 UGT isoforms and stable isotope standards were separated using segmented MRMs in the base peak chromatogram of a human liver microsome digest...................................101 Figure 3.2 TOF spectrum analysis of peptide 1 (Table 1) following injection of 10 pmol of peptide on LC-MS/MS to confirm MRM optimization of 557.3 (y4) and 753.4 (y6) ions used for quantification.......................................................................................102 Figure 3.3 Standard curve of MRM 2 of peptide 12 (Table 12) representative of UGT1A9 obtained from five measurements of recombinant enzyme digests (r2=.99) ...........................................................103

vi
Figure 3.4 Correlation analysis between UGT1A1 (4A) and UGT1A6 (4B) enzyme expression levels obtained by the current assay using the LIT-TOF and previous analysis using ABI 3000..........104 Figure 3.5 Comparison of UGT enzyme concentrations from five replicate measurements of digests of human liver, intestinal and kidney microsomes .....................................................................105 Figure 4.1 Bile cannulated TR- rat and Wistar rat MPA and MPAG plasma levels following a single IV or oral 50mg/kg dose of MMF. ..................................................................................................157 Figure 4.2 Intact TR- rat and Wistar rat MPA/MPAG plasma levels following a single IV or oral 50mg/kg dose of MMF…........................................158 Figure 4.3 Total biliary excretion of acMPAG and MPAG in Wistar and TR- rats after a single 50 mg/kg dose.............................................159 Figure 4.4 MPAG bile and plasma levels following 2.5 mg/kg IV MPAG administration to male Wistar rats.....................................................................160 Figure 4.5 In vitro MPA glucuronidation rates (in nmol/min/mg protein) for tissues extracted following pharmacokinetic studies. ………………………..161 Figure 4.6 Product ion scan of peptide 3 (ENQF*DALFR, parent ion 575.4) yielding product ions y4 and y5 used for MRM quantification of rUgt1a6……………………………………………………………………………..162 Figure 4.7 MRM chromatogram of 1.5 µg recombinant rUgt microsomal protein digest analyzed on QTRAP 5500 system..............................................163 Figure 4.8 Calibration curves constructed from 5 replicate digests for two MRMs (y1 570.4/621.4, y2 570.4/506.4) of peptide 3 representative of rUgt1a6..................................................................164 Figure 4.9 Time dependant tryptic digestion of β-casein protein using specific MRMs from two peptides monitoring missed cleavages sites performed in triplicate ...............................................................................165 Figure 4.10 rUgt expression levels in tested rat tissues obtained following pharmacokinetic studies.....................................................................166 Figure 4.11 Rat transporter expression levels in rat tissues following pharmacokinetic studies. ..................................................................................167
vii
Figure 4.12 Correlation analysis relating rUgt protein expression data obtained using QTRAP 5500 to glucuronidation activity levels .................168 Figure 4.13 Correlation analysis relating rat trasnsporter protein expression data obtained using QTRAP 5500 to glucuronidation activity levels.................................................................................................................169 Figure 4.14 Correlation analysis relating rUgt expression to rMrp2 levels using protein expression data obtained using QTRAP 5500 ..................170 Figure 6.1 MRM optimization scans for peptides 1 and 4, highlighting prominent product ions of mass > 500 Da ........................................................221 Figure 6.2 MRM chromatograms following isolation of tryptic peptides from a human liver microsomal donor sample ..................................................222 Figure 6.3 Representative calibration curves (n = 5 replicate samples for each concentration), constructed using a weighted (1/x2) linear regression fit, for MRMs 1 and 2 of peptides 1 and 4........................................223 Figure 6.4 Western immunoblot analysis of human liver microsome library of ten individual donors ..........................................................................224 Figure 6.5 Human liver microsome library analysis of ten individual donors ....225
viii
List of Abbreviations
ABC= Adenosine Triphosphate Binding Cassette
ACN= Acetonitrile
AcMPAG= Mycophenolic Acid Acyl Glucuronide
ADRs= Adverse Drug Reactions
AhR= Aryl Hydrocarbon Receptor
BCA = Bicinchoninic Acid
BD= Bile duct
BEH= Bridged ethylene hybrid
BSA= Bovine Serum Albumin
CAR= Constitutive Androstane Receptor
Cdx2= Caudal Homeodomain Protein 2
CHAPS = 3-((3-cholamidopropyl)dimethylammonio)-1-propanesulfonic acid
CID= Collision induced dissociation
CRP= C-Reactive Protein
% C.V. = Percentage coefficient of variation
DIGE= Differential Gel Electrophoresis
DPP-IV= Dipeptidyl Peptidase IV
DS-L= D-Sacchric Acid 1, 4 Lactone
ELISA= Enzyme Linked ImmunoSorbant Assay
ESI= Electrospray Ionization
FA= Formic Acid
GI= Gastronintestinal
ix
HOAc= Acetic Acid
HSA= Human Serum Albumin
HIM = Human intestinal microsomes
HLM = Human liver microsomes
HNF1-α= Human Nuclear Factor 1-Alpha
ICAT= Isotope Coded Affinity Tag
IMPDH= Ionosine Monophosphate Dehydrogenase
IV= Intravenous
iTRAQ= Isobaric Tagging for Relative and Absolute Quantification
LC = Liquid Chromatography
LC-MS = Liquid Chromatography - Mass Spectrometry
LC-MS/MS = Liquid Chromatography – Tandem Mass Spectrometry
LIT-TOF= Linear Ion Trap-Time of Flight
MgCl2= Magnesium Chloride
MMF= Mycophenolate Mofetil
MPA = Mycophenolic Acid
MPAG= Mycophenolic Acid Glucuronide
MPA Na+= Mycophenolic Acid Sodium Salt
MRM= Multiple Reaction Monitoring
Mrp2= Rat Mutidrug Resistance-Associated Protein 2
Mrp3= Rat Mutidrug Resistance-Associated Protein 3
Nano-UPLC= Nano-Ultra Performance Liquid Chromatography
x
NCBI Blast = National Center for Biotechnology Information Basic Local
Alignment Search tool
NSAIDs= Non-Steroidal Anti-Inflammatory Drugs
PAR = Peak Area Ratio
PMSF= Phenylmethylsulfonyl Fluoride
PSA= Prostate Specific Antigen
PO= Oral Dosing
PXR= Pregnane X Receptor
QconCAT/QCAT= Quantitative Concatomer
Q-TOF= Quadrupole-Time of Flight
RLM = Rat liver microsomes
RT-PCR= Real Time Polymerase Chain Reaction
SDS-PAGE = Sodium dodecyl sulfate polyacrylamide gel electrophoresis
SILAC = Stable isotope labeling with amino acids in cell culture
SNP = Single nucleotide polymorphism
SPE = Solid Phase Extraction
TFE = 2,2,2-Trifluoroethanol
TPCK = L-1-tosylamido-2-phenylethyl chloromethyl ketone
T1/2= Half-Life
UGT = Uridine-Diphosphate Glucuronosyl Transferase
VPA= Valproic Acid
1
CHAPTER 1
INTRODUCTION

2
A. INTRODUCTION
Drug metabolizing enzymes affect the disposition and toxicity of many
endogenous and exogenous chemicals. These enzymes can alter compounds in
a number of ways, either through the addition or subtraction of functional groups
or by the alteration of oxidation state or arrangement of the molecule (Bock and
Lilienblum, 1994; Ionescu C and Caira MR, 2005). Through the actions of drug
metabolizing enzymes, the body is able to eliminate many potential harmful
compounds, primarily as inactive biproducts, by the usual methods of excretion
and elimination.
While the impact of drug metabolizing enzymes on the disposition and
elimination of xenobiotics is well known, additional factors include protein
binding, metabolite disposition and toxicity, and transporters (Bock and
Lilienblum, 1994; Coleman M, 2005; Ionescu C and Caira MR, 2005). A single
compound may be metabolized by different enzymes, resulting in many different
metabolites, and are subsequently excreted into either the blood or bile by
separate transporters, further complicating absorption, disposition, metabolism
and excretion (ADME) studies necessary for pharmaceutical compounds.
The rapid development of new methods and instruments designed for
quantitative proteomics has the potential to advance our understanding of
relationships between drug metabolizing enzymes and transporters when
conducting ADME studies of particular compounds of interest. The example of
linking the expression of particular enzymes and transporters of interest with the
metabolism and disposition of a compound can be highlighted with the
3
immunosuppressive agent mycophenolic acid (MPA; 1,3-dihydro-4-hydroxy-6-
methoxy-7-methyl-3-oxo-5-isobenzylfuranyl-4-methyl-4-hexenoate, Figure 1.1).
MPA is a substrate for uridine diphosphate glucuronosyltransferase (UGT)
enzymes in the liver, kidney and intestinal tract. Following UGT conjugation,
MPA is excreted first into either the bile or blood by canalicular or basolateral
transporters located in hepatocytes. Subsequent metabolism following efflux into
the bile or blood, hydrolysis by β-glucuronidase enzymes found in the gut flora of
the intestinal lumen by enterocytes of the intestine, or the tubules of the kidney
leads to elimination of glucuronide conjugates in the urine or feces (Bullingham et
al., 1996; Bullingham et al., 1998). While MPA is generally well tolerated, a large
fraction of patients experience delayed-onset diarrhea, impacting lifestyle and
potentially resulting in allograft rejection and life threatening complications
(Davies et al., 2007). It is possible that variability in UGT enzymes and
transporters within the gastrointestinal tract affect MPA exposure levels, leading
to gastrointestinal toxicity (Stern et al., 2007; Tallman et al., 2007; Tukey and
Strassburg, 2000).
The structure and function of UGT enzymes within the body, along with
differences between metabolism and expression levels between rats and
humans are examined. Furthermore, a background on the clinical uses of MPA
is given, along with its fate within the body following administration. The potential
impact of labile acyl glucuronides are examined along with a short background
on the recent developments within the field of quantitative proteomics. This
introduction should provide the reader with an understanding of the benefits that
4
quantitative proteomics can provide biological scientists, illustrated by the effect
of altered UGT enzyme and transporter levels have on MPA disposition and
toxicity.
B. UDP-Glucuronosyltransferases
B.1. Background and Function UDP-glucuronosyltransferases (UGTs) are a family of phase II metabolism
enzymes that primarily convert lipophilic exogenous and endogenous
compounds to conjugated products through the nucleophilic addition of
glucuronic acid onto the compound. The glucuronic acid side chain addition is
accomplished through a nucleophilic attack onto the C1 pryanose acid side chain
in a SN2 reaction mediated by the cofactor UDPGA and UGT enzymes (Clarke
and Burchell, 1994; Ionescu C and Caira MR, 2005). The UGT family of
enzymes consists of four gene families, UGT1, UGT2, UGT3 and UGT8, with 52
UGT enzymes described between vertebrate and invertebrate species (Tukey
and Strassburg, 2000; Tukey and Strassburg, 2001). In humans, 19 UGT
enzymes have been described and separated into two gene families, UGT1 and
UGT2, with two subfamilies each. The UGT1A locus is found within
chromosome 2q37 encoding nine separate functional isoforms and the inactive
pseudogenes UGT1A2, UGT1A11, UGT1A12 and UGT1A13 (Tukey and
Strassburg, 2001). The UGT locus consists of a 528-534 amino acid sequence
divided between a conserved domain toward the carboxyl tail, spanning 250
5
amino acids and a divergent domain unique to each isoform spanning
approximately 280 amino acids starting at the amino terminus.
The primary function of UGT enzymes within the body is the detoxification
of endogenous and exogenous lipophilic compounds. Conjugation results in the
formation of a product that is more hydrophilic and excreted into the blood or into
the bile after a change in charge state and molecular weight addition. In
addition, conjugation results in the loss of pharmacological activity, with the some
exceptions including morphine 6-glucuronide (Bailey and Dickinson, 2003; Ritter
2000; Ionescu C and Caira MR, 2005). Compounds that undergo conjugation
are also less likely to form electrophilic adducts with proteins or other
macromolecules including DNA (Bock and Lilienbaum, 1994). A source of
bioactivation involves the formation of electrophilic N-O-glucuronides of
hydroxamic acids potentially resulting in hypersensitivity or chemical
carcinogenesis (Ritter, 2000). While electrophilic adducts of DNA have been
linked to carcinogenesis, there is inconsistent evidence linking drug protein
adduct formation via acyl glucuronides with toxicological outcomes (Bailey and
Dickinson, 2003).
Following conjugation within the liver, it is common for glucuronide
conjugates to be excreted into the biliary tract by the ATP-binding cassette (ABC)
family of canalicular membrane transporters, including the multidrug resistance-
associated protein 2 (MRP2) (ABCC2/Abcc2) and the breast cancer resistance
protein (BCRP) (ABCG2/Abcg2). Conjugated metabolites may be cleaved back
to the parent aglycone molecule by β-glucuronidase enzymes within the gut flora
6
of the intestinal lumen. The parent aglycone that is liberated within the intestinal
lumen may then be taken back up into the liver through the portal vein in a
process known as enterohepatic cycling (EHC). Generally, glucuronides are not
passively absorbed due to their polarity and charge. EHC can be manifested in
plasma concentration versus time curves as secondary peaks after initial dose
administration. EHC values vary between compounds but may be responsible
for as much as 60% of MPA systemic exposure in humans and can serve to both
increase efficacy of the parent compound along with potential side effects
(Bullingham et al., 1998; Naderer et al., 2005).
B.2. Human UGTs UGTs are expressed widely in humans and have been found in some
capacity in virtually every major organ within the body. In humans, genes are
expressed within two separate families and four subfamilies. Nomenclature for
the UGT gene family is denoted with an Arabic numeral, the gene subfamily with
a letter and specific gene with an Arabic numeral (Mackenzie et al., 1997). In
humans, UGT genes are transcribed from chromosomes 2q37 (1A) and 4q2
(2B). The UGT1A enzymes are transcribed from 12 unique promoter sequences
with the four common 3’ exons and one unique 5’ exon to form nine functional
enzymes and four pseudogenes (Ritter et al., 1992; Owens and Ritter, 1995;
Tukey and Strassburg, 2000; Tukey and Strassburg, 2001;
<http://som.flinders.edu.au/FUSA/ClinPharm/UGT/>).
7
UGT1A1 is the most widely expressed of the human UGT enzymes
(hUGTs) and is known to conjugate numerous endogenous steroid and thyroid
hormones, in addition to many exogenous compounds, but is best known for
bilirubin detoxification (Ritter et al., 1991; Tukey and Strassburg, 2000). Its role
in bilirubin conjugation is responsible for this being the most intensly studied UGT
isoform. Expression of UGT1A1 has been detected primarily in the liver and
throughout the gastrointestinal tract. Unlike other drug metabolizing enzymes,
UGTs undergo oligermerization, either within or between isoforms, drastically
impacting activity levels (Bock and Kohle, 2009; Meech and Mackenzie, 1997;
Levesque et al., 2007). UGT1A6 has a similar distribution of tissue expression
compared to 1A1 but has been found to catalyze and detoxify primarily
exogenous compounds. The advent of RT-PCR technology allowed for tissue
expression studies of individual UGT isoforms but quantification has still proven
difficult. Because human UGT1A3, UGT1A4, UGT1A5 and UGT1A7, UGT1A8,
UGT1A9 and UGT1A10 display up to 93% sequence homology, antibody
generation for Western blotting has proven to be an arduous task and perhaps
unresolvable. Of the 17 active human UGT isoforms identified, only UGT1A1,
UGT1A6 and UGT2B7 display proper structural diversity to allow for specific or
selective antibody generation (Tukey and Strassburg, 2001). A fourth antibody
for quantification of UGT1A9 has been generated from the laboratory of J. Ritter
at Virginia Commenwealth University (VCU), but cross-reactivity with UGT1A7-10
due to structural homology has hindered reliability of quantification. A similar
attempt has been made with UGT1A4 and UGT1A8, but again, cross-reactivity

8
with analogous isoforms has deterred development. Because of their high
genome sequence homology, coupled with extensive tissue expression and
diverse substrate conjugation, a need exists for an accurate, reproducible
method for UGT quantification.
B.3. Rat Ugts In rats, the UGT gene family is separated between two families and four
subfamilies but displays a different set of conjugating isoforms. Unlike humans,
rat Ugt1a enzymes are encoded from the gene locus of chromosome 9q35, with
the gene subfamilies denoted with lower case letters (Nagai et al., 1995). Within
the rat Ugt1a locus, Ugt1a1 is seen as a functional homolog to the human
counterpart, but the additional Ugt1a isoforms diverge from their human
counterparts with respect to location, sequence and substrate specificity. In
conjunction with the active isoforms within the rat UGT1A locus, two
pseudogenes encoding Ugt1a4 and Ugt1a9 have been discovered within the
genome (Shelby et al., 2003). Despite these differences, rat models have long
since been used for glucuronidation studies due to comparable metabolite
generation capabilities compared to humans and the ability to perform
cannulation studies for pharmacokinetic analyses. Furthermore, the rat also
serves as a powerful tool for mimicking the human hyperbilirubinemic disease
state through the Gunn rat model. The Gunn rat is devoid of functional Ugt1a
enzymes due to a frameshift mutation on exon 2 and subsequently develops
hyperbilirubinemia in addition to an increased sensitivity to xenobiotics
9
undergoing detoxification through glucuronidation (Chowdury et al., 1993).
Unlike humans with Criglar-Najjar Syndrome, however, the rat has some bilirubin
conjugation ability, making the Gunn rat mutation nonlethal. Recent work
involving Gunn rats revolves around adenovirus mediated gene therapy to
restore expression of UGT1A isoforms within the liver and gastrointestinal tract.
Specifically, adenovirus gene therapy Gunn rat models have been more sensitive
to gastrointestinal toxicity of irinotecan and mycophenolic acid due to increased
biliary efflux and subsequent hydrolysis of glucuronide conjugates resulting in
elevated exposure of of the GI tract to toxic aglycones (Miles et al., 2006;
Tallman et al., 2007).
B.4. Detoxification and Toxicity associated with glucuronidation Despite the role of UGTs in the detoxification and excretion of numerous
endogenous and exogenous compounds, there has been evidence indicating
glucuronide conjugates have toxicological implications. The link between UGTs
and cancer has not yet been directly made, but mutations in UGT genomes have
been observed in colorectal carcinoma (Guillemette, 2003; Tukey and
Strassburg, 2000; Tukey and Strassburg, 2001). In addition, UGT activity has
been shown to be highly polymorphic within the gastrointestinal tract, yet
interindividual differences are small within the liver (Strassburg et al., 1999). One
of the most prominent detoxification mechanisms prevalent in the UGT genome
is the formation of bilirubin diacylglucuronide through UGT1A1 catalysis. In
Gunn rats and humans stricken with Crigler-Najjar or Gilbert’s Syndrome,

10
hyperbilirubinemia results from the buildup of lipophilic bilirubin that then can
penetrate the blood brain barrier to result in encephalopathy, neural necrosis and
death if untreated (Tukey and Strassburg, 2000). Though a vast majority
glucuronide conjugates are pharmacologically inactive, certain compounds such
as morphine-6-glucuronide display increased pharmacological activity (Bailey
and Dickinson, 2003; Ritter, 2000). In addition to active glucuronides, an area of
active research and continued debate revolves around acyl glucuronide catalysis
and toxicity (Shipkova et al., 2003). Acyl glucuronide conjugates occur through
conjugation of carboxylic acid moiety within the affected compound, resulting in a
product whose link to adverse drug reactions and adduct formation has been
implicated but yet to be established (Bailey and Dickinson, 2003; Faed, 1984;
Shipkova et al., 2003).
C. Acyl Glucuronides
C.1. Background Acyl glucuronides are controversial in drug toxicology due to their ability to
form protein adducts with liver and plasma proteins and may have a role in
adverse drug reactions (ADRs) (Bailey and Dickinson, 2003). After arising from
a carboxylate moiety within a substrate, acyl glucuronides have a series of
potential fates within the body that may either predispose the affected organism
to toxicity or result in harmless excretion outside the body. One of these fates
includes the acyl glucuronide being produced through a UGT catalyzed reaction
followed by excretion from the liver into the bloodstream or via biliary tract into
the intestine. Acyl glucuronides make excellent substrates for transporters within

11
the hepatocyte, with the most active transporters in acyl glucuronide excretion
including the basolateral organic anion transporters (OAT) transporters or the
canalicular MRP2 transporter (Bailey and Dickinson, 2003).
Besides excretion, acyl glucuronides can be subject to hydrolysis through
the actions of esterases within the liver, blood or gastrointestinal tract. This
aspect is unique to acyl glucuronides compared other glucuronide conjugates
because of the carboxylate moiety binding to the glucuronide conjugate resulting
in ester linkage (Faed, 1984). Unlike other glucuronides which are resistant to
hydrolysis by esterase enzymes, acyl glucuronides may be cleaved back to the
parent compound through the actions of esterases which are found throughout
the body. The cleavage of acyl glucuronides can increase a patient’s exposure
to the parent drug, and subsequently its efficacy, through enterohepatic cycling
or even engage the compound in systemic “futile cycling” through continuous
cleavage and conjugation within the body (Bailey and Dickinson, 2003). This is
important for toxicological consequences if glucuronidation of a carboxylate
moiety is the primary means of elimination and detoxification for a compound.
The parent compound may exhibit cellular toxicity due to increased exposure
throughout the body because of esterase cleavage of the acyl glucuronide.
C.2. Acyl Migration of Ester Glucuronides Another possible fate of acyl glucuronide metabolites in vivo concerns acyl
migration. Acyl migration of glucuronide conjugates involves the initial
conversion of O-β-1 acyl glucuronide into either an O-β-2 or an O-α-2 isomeric
conjugate via intramolecular trans-esterification (Faed, 1984). This reaction is
12
the result of a nucleophilic attack on an adjacent carbon by the hydroxyl group of
the glucuronide conjugate. Additional isomeric conjugates O-β-3, O-β-4, O-α-3,
O-α-4 can be created during this process and each reaction beyond the initial O-
β-1 conjugate is reversible (Bailey and Dickinson, 2003; Faed, 1984). Some
studies have shown that back conversion into the initial biologically synthesized
β-1 acyl glucuronide metabolite is possible at low levels within in vitro systems
but this reaction is rare and not significant in in vivo biological systems (Bailey
and Dickinson, 2003). While the isomeric conjugates are similar to the O-β-1
acyl glucuronide, they are unique because biological systems are unable to
create them as primary products and they are resistant to β-glucuronidase
enzymes present within the gastrointestinal tract and liver. Even though many
isomeric conjugates exhibit no apparent biological consequences, the ability of
these isomers to form covalent bonds with cellular proteins and macromolecules
may have toxicological implications resulting in ADRs seen in some compounds
containing carboxylate moeities.
C.3. Potential Toxicity Once the parent acyl glucuronide conjugate or any of its isomeric
conjugates form protein adducts in vivo, a number of consequences are possible.
One of the most contentious debates is the fate of the acyl glucuronide-protein
adducts within the biological system (Bailey and Dickinson, 2003; Shipkova et al.,
2003). Protein adducts have been demonstrated frequently with albumin, plasma
and liver in vitro systems, yet within each system, few direct links to toxicity have
been made (Bailey and Dickinson, 2003; Shipkova et al., 2003). Many
13
compounds including NSAIDS rapidly form acyl glucuronides and subsequent
protein adducts with plasma proteins and albumin, yet these drugs are generally
regarded as safe and some such as ibuprofen are available without a
prescription (Bailey and Dickinson, 2003).
Drug-protein adducts formed from acyl glucuronides have been shown to
affect cellular function of certain proteins within rats, including disruption of
tubulin and dipeptidyl-peptidase IV function by diclofenac and zomepirac acyl
glucuronides (Bailey et al., 1998; Bailey and Dickinson, 2003). In addition to
drug-protein adducts, acyl glucuronides have also been implicated in
hypersensitivity and idiosyncratic adverse drug reactions with mixed results
(Shipkova et al., 2003). Numerous acyl glucuronide forming compounds
including suprofen, zomepirac and ibufenac have been withdrawn from the
market because of hepatoxicity, yet compared to the large number of patients
administered these compounds, the number of adverse reactions remains small
and unpredictable. Moreover, no direct link between toxicity and acyl
glucuronide exposure has been reported in animals and humans (Bailey and
Dickinson, 2003).
Mycophenolic acid is an immunosuppressant for prophylaxis in organ and
solid graft transplant patients that forms both a phenolic and acyl glucuronide in
humans (Young and Sollinger, 1994). While the phenolic glucuronide is inactive,
in vitro testing of the acyl glucuronide conjugate exhibited a greater efficacy for
inhibition of leukocyte proliferation than the unconjugated parent drug (Shipkova
et al., 2001). Along with this evidence, cellular protein adducts have been found
14
to form as a result of the acyl glucuronide, which has led some scientists to
believe that this metabolite is the source of delayed-onset diarrhea observed
within patients on extended therapy along with additional side effects including
leucopenia (Shipkova et al., 2004). However, the evidence basing MPA toxicity
on acyl glucuronide formation (acMPAG) remains inconsistent, not only due to
the lack of conclusive data from in vitro testing, but also due to the fact that
negative clinical outcomes of MPA have not been directly linked to exposure of
acMPAG (Kypers et al., 2003).
D. Quantitative Proteomics
D.1. Background While traditional methods of quantitative proteomics involved 2D-gel
electrophoresis or immunoassays for relative quantification, the field began to
take off with the advent of refined electrospray ionization (ESI) and tandem mass
spectrometry (MS/MS) techniques in the late 1980s (Whitehouse et al., 1985;
Cañas et al., 2006). Even though immunoassays including ELISA and Western
Blots have been used for clinical biomarker detection for years, they have a
number of shortcomings. Many antibody-based assays can vary significantly
between laboratories and are subject to cross-reactivity along with the hook
effect (antibody saturation resulting in declining signal) that compromises the
linear range of the assays (Hoofnagle and Wener, 2009). The refinements in both
ionization and mass spectrometry have enabled the development of methods
involving isotope dilution mass spectrometry applied for the quantification of
intact proteins and peptides. Coupled with the newer stable isotope internal
15
standards available today with an increasing assortment of mass spectrometer
platforms and LC configurations, the field of quantitative proteomics through
tandem mass spectrometry continues its evolvement as a primary research
initiative for investigators interested in biomarker discovery, enzyme
quantification, cancer research and global proteomics (Gstaiger and Aebersold,
2009).
While numerous methods of stable isotope labeling are offered today, one
of the more reliable and cost effective methods involves N15 and C13 isotopes of
peptide side chains such as the AQUA™ method (Gerber et al., 2003). In
addition to the AQUA™ method, other methods that have been developed within
this decade include stable isotope labeling with amino acids in cell culture
(SILAC), isotope coated affinity tags (ICAT), isobaric tagging for relative and
absolute quantification (iTRAQ) reagents. The most recent development by SJ
Gaskell’s lab involves stable isotopes expressed and grown in E. Coli cell culture
to form quality concatamer internal standards (QConCAT) (Beynon et al., 2005).
As opposed to the SILAC and QConCAT methodology involving stable isotopes
grown in cell culture, the ICAT and iTRAQ methods involve targeting the entire
protein through either cysteine labeling (ICAT) or N-terminal labeling (iTRAQ)
(Cañas B 2006). One problem with the ICAT and SILAC strategy is that each of
these methods are not suitable for wide-scale quantification due to the limited
number of peptides containing cysteine residues and the difficulty in purifying
proteins of interest from SILAC cultures, respectively. While iTRAQ and
QConCAT have been applied in absolute quantification, iTRAQ peptides have
16
been beset by problems due to lack of specificity compared to true MS/MS and
QConCAT peptides are no longer commercially produced for proteomic
applications (Wu et al., 2006).
D.2. Biological Applications Recently, a number of new methodologies have been used for quantifying
biological enzymes in complex matrices. Biological enzymes such as the
cytochrome P450 family (CYP450s), hUGTs, cancer biomarkers and membrane
transporters have been quantified across a number of different matrices
(Barnidge et al., 2004; Jenkins et al., 2006; Kamiie et al., 2008; Li et al., 2008;
Wang et al., 2008). The AQUA™ method was selected for this research project
because the synthetic peptides are readily available for purchase through
numerous vendors and their accuracy in quantification of specific enzymes and
proteins has been demonstrated through previous experiments (Fallon et al,
2008; Gerber et al., 2003). Two AQUA™ peptides are usually selected per
protein through a specific series of selection criteria, including the elimination of
cysteine, methionine and tryptophan due to ionization difficulties, size limited to
8-15 residues and no aspartic acid/glycine N-terminus to prevent cyclization.
These selection rules, coupled with the understanding that each peptide must be
unique to the targeted protein, two AQUA™ peptides are chosen for
quantification of both human and rat UGT enzymes, whereas three peptides are
used for each rat membrane transporter.
17
E. Mycophenolic Acid
E.1. Clinical Uses Mycophenolic acid (MPA) is an immunosuppressant designed for
prophylaxis in renal and hepatic transplant patients or as treatment for
autoimmune disorders such as systemic lupus erythmatosus (Bullingham et al.,
1996; Young and Sollinger, 1994; Stern et al., 2007). Currently MPA is available
in either the prodrug form mycophenolate mofetil (CellCept©, Novartis) or as an
enteric coated sodium salt (Myfortic©, Roche). The immunosuppressive action
of MPA is obtained through the inhibition of the ionsine monophosphate
dehydrogenase type II (IMPDH) enzyme which converts xanthine
monophosphate (XMP) into guanine monophosphate (GMP) in the de novo
purine biosynthesis pathway (Young and Sollinger, 1994). This particular
pathway is important for lymphocyte proliferation because lymphocytes are
unable to undergo the secondary salvage pathway for purine biosynthesis and
IMPDH type II is unique to both B and T lymphocytes (Carr et al., 1993; Young
and Sollinger, 1994). MPA is coadministered as part of immunosuppressive
therapy for transplant patients with cyclosporin A, tacrolimus or sirolimus
combined with corticosteroids for maximum efficacy. MPA is extensively protein
bound (97%) and metabolized almost exclusively by UGTs into either MPA-7-O-
glucuronide (MPAG) or MPA-acyl-glucuronide (acMPAG) and eliminated through
biliary or urinary excretion (Table 1.2, Bullinghman et al., 1996; Bullingham et al.,
1998; Hofmann La Roche; Parker et al., 1996). While it is generally regarded as
a safe drug and is well tolerated by patients, side effects of MPA include
18
leucopenia and an elevated infection rate. The most severe effect exhibited in
patients is delayed-onset diarrhea seen in 20-30% of patients (Davies et al.,
2007; Hebert et al., 1999; McDiarmid, 1996; Wang et al., 2004).
E.2. Toxicity In humans, the toxicological source of MPA is a conflicted argument
revolving around the fate of the acyl glucuronide within the bloodstream and
intestinal tract. MPA metabolized to its phenolic glucuronide by UGT1A1,
UGT1A8 and UGT1A9 within the liver followed by excretion into the bloodstream
or into the biliary tract by MRP2 and BCRP (Mackenzie, 2000; Miura et al.,
2008). Peak plasma concentrations of MPA, MPAG and acMPAG are observed
within forty five to ninety minutes of oral dosing of MMF (Bullingham et al., 1996;
Bullingham et al., 1998; Hofmann La Roche). While UGT1A1, UGT1A8,
UGT1A9 and UGT1A10 are the source of the phenolic glucuronide in humans,
acyl glucuronidation of MPA exclusively involves UGT2B7 (Mackenzie, 2000;
Saitoh et al., 2006). After excretion into the biliary tract or bloodstream, acMPAG
has the ability to form covalent bonds with plasma proteins and cellular
macromolecules, creating protein adducts (Shipkova et al., 2003). More
troubling is that in vitro cell systems have shown that acMPAG incubation results
in significantly elevated cytokine levels, possibly resulting in immunogenic
reactions (Wieland et al., 2000). However, this evidence has yet to be shown in
in vivo experiments which may indicate that acMPAG is excreted out of the
system before cytokine elevation occurs.
19
A further complication of MPA metabolism and excretion involves
polymorphisms in UGT enzymes, MRP2 and BCRP transcripts that result in
decreased MPA clearance that is possibly be associated with intestinal toxicity in
transplant patients (Djedi et al., 2007; Miura et al., 2008; Shipkova et al., 2005).
Unlike its glucuronide metabolites, MPA has also shown the ability to penetrate
the enterocyte membranes within the intestinal tract and be a source of direct
cellular toxicity (Shipkova et al., 2005). While attempts have been made to link
acMPAG exposure levels with toxicity, recent studies have not been able to
correlate elevated acMPAG exposure with GI toxicity (Kuypers et al., 2003; Shaw
et al., 1996; Staatz et al., 2007). This indicates that within humans,
glucuronidation serves as a protective mechanism although the potential
immunogenic properties of acMPAG should be monitored.
E.3. Rat and Human MPA Metabolism The fate of MPA is similar between rats and humans despite the different
UGT isoforms involved between the two species. In rats, MPA is glucuronidated
at the phenol ring by Ugt1a1, Ugt1a6 and Ugt1a7 and at the carboxylate
functional group by rUgt2b7 to form acMPAG followed by excretion into the
biliary tract by Mrp2 (Koboyashi et al., 2004; Miles et al., 2006; Takekuma et al.,
2007). Compared to humans, a significantly elevated amount or fraction of the
dose of MPAG is excreted into the biliary tract as opposed to the bloodstream
(Takekuma et al., 2007). Thus, the ratio between MPAG and MPA exposure
levels is different between species.

20
Glucuronidation rates of MPA in in vitro systems have been shown to vary
up to ten fold between species, and also genders of rats but differences in
toxicity have not been observed across rat strains (Miles et al., 2005; Miles et al.,
2006; Stern et al., 2007). MPAG formation rates have been shown to be higher
in male Sprague Dawley rats and male rats have also been more resistant to
MPA induced GI toxicity than females (Stern et al., 2007). Ugt1a deficient Gunn
rats and AVUgt treated Gunn rats whose rUgt expression is restored within the
liver, exhibit lacrimation, malaise and diarrhea after MPA administration (Miles et
al., 2006). While Gunn rats and AVUgt treated Gunn rats exhibit no intestinal
Ugt1a activity, Wistar and male Sprague Dawley rats expressing high levels of
rUgt1a activity are resistant to MPA induced GI toxicity (Miles et al., 2006; Stern
et al., 2007). Furthermore, MPA administration to AVUgt treated Gunn rats that
lacked intestinal Ugt activity resulted in an elevated level of intestinal toxicity
when compared to control Wistar rats which were resistant to MPA induced GI
toxicity (Miles et al., 2006). This indicates that intestinal glucuronidation activity
may help prevent GI toxicity due to decreased enterocyte MPA exposure which
could be due to either increased metabolism or enhanced efflux. As in humans,
glucuronidation activity in rats is likely to be the primary source of detoxification
of MPA and a key factor in the prevention of MPA related toxicological effects.
F. Rationale for the Proposed Project
Glucuronidation has repeatedly been demonstrated as a determining
factor of toxicity and disposition of numerous endogenous and exogenous
21
compounds (Bock and Lilebaum, 1994; Tukey and Strassburg, 2000). However,
the fate of some acyl glucuronide metabolites within body systems remains a
contested debate. MPA represents an excellent model compound for study due
to its ability to form the nontoxic and inactive MPAG, in addition to the labile and
potentially reactive acMPAG metabolite, while remaining a well-tolerated
treatment for transplant patients. While many papers have been published
establishing assays to quantify proteins of interest within in vivo systems there
have been no attempts to link enzyme expression levels assayed using
quantitative proteomics via LC-MS/MS with their biological significance. The
methods developed through this proposed project, coupled with pharmacokinetic
and acMPAG stability studies examine the relationship between MPA disposition
and altered Ugt and transporter levels within the rat. The overall hypothesis of
this dissertation project is that variable glucuronidation formation and efflux within
the liver and gastrointestinal tract results in differential MPAG formation rates and
thus modulates MPA toxicity. To evaluate the potential effect of glucuronidation
on MPA toxicity, the stability, reactivity and disposition of the MPA glucuronide
metabolites will be examined in the following aims:
AIM 1: Differences in toxicity of mycophenolic acid will be examined
through evaluation of glucuronide disposition. There are conflicting reports
on acMPAG stability and reactivity. These experiments on acMPAG stability and
reactivity will help determine if acMPAG is a reactive metabolite that could be a
factor in MPA GI toxicity. In addition, a series of pharmacokinetic studies
22
evaluating MPA, acMPAG and MPAG disposition will be conducted for future
studies comparing enzyme expression with metabolite disposition:
a. A method to assay the acyl glucuronide metabolite of mycophenolic acid
will be established and used to evaluate the stability of acMPAG in vitro
and measure it within biological matrices.
b. Acyl glucuronide reactivity will be examined through covalent binding
studies
c. MPAG and acMPAG will be administered intravenously to rats to examine
the fate of the glucuronides and to determine hepatic uptake from the
systemic circulation.
AIM 2: The differences in UGT enzyme expression levels will be quantified
in vivo across human tissues involved with drug disposition. To properly
evaluate metabolite disposition with enzyme and transporter expression,
methods to quantify UGT enzymes will be established. It is important to first
evaluate and validate our quantitative proteomic methods against established
assays for hUGT quantification in the following experiments:
a. A quantitative proteomic LC-MS/MS method to measure hUGT1A1 and
hUGT1A6 levels within human liver and intestine will be established to
validate the proposed methodology.
b. The quantitative proteomic method will then be optimized to quantify
enzyme levels of the hUGT1A gene family using nano-LC MS/MS
instrumentation.
23
c. The expanded and optimized hUGT1A assay will be used to compare
UGT enzyme expression levels in human liver, kidney and intestinal
microsomes.
AIM 3: The association between varying rUGT and transporter expression
levels and the disposition of MPA will be determined. Once the utility and
accuracy of hUGT quantitative assays have been evaluated, the effect of altered
enzyme and transporter expression on MPA metabolism and disposition will be
examined. Experiments examining the relationship between rUgt and membrane
transporter expression with the metabolism, disposition and toxicity of MPA are
outlined below:
a. An LC-MS/MS quantitative proteomic method for quantifying rUGT1A1,
rUGT1A6 and rUGT1A7 within the liver and gastrointestinal tract will be
established.
b. Biliary excretion of MPA and its glucuronides administered to bile
cannulated Wistar rats will be examined with respect to rUGT expression
levels and in vitro glucuronidation rates.
c. Ugt 1a1, 1a6, 1a7, Mrp2, Mrp3 and Bcrp expression levels will be
compared between Wistar, AVUgt and TR- rats to examine the effect of the
altered Ugt or Mrp2 protein on Bcrp, Mrp3 and UGT enzyme levels and
MPA disposition.

24
Figure 1.1 Structure of Mycophenolic Acid and its two primary glucuronide metabolites formed through the action of rUgts (Miles et al., 2005; Picard et al., 2005; Young and Sollinger, 1994)
Mycophenolate Mofetil(MMF)
Mycophenolic Acid(MPA)
Mycophenolic Acid Glucuronide(MPAG)
Mycophenolic Acid Acyl Glucuronide(acMPAG)
Ugt 1a1, 1a6, 1a7 Ugt2b7
Esterase
Mycophenolate Mofetil(MMF)
Mycophenolic Acid(MPA)
Mycophenolic Acid Glucuronide(MPAG)
Mycophenolic Acid Acyl Glucuronide(acMPAG)
Ugt 1a1, 1a6, 1a7 Ugt2b7
Esterase

25
Table 1.1 Localization of UGT1A mRNA in human and rat tissues with isoforms in bold responsible for MPA glucuronidation
Enzyme Species Localization Ugt1a1 Rat Liver, kidney, intestinal tract, brain, lung,
testis Ugt1a2 Rat Small intestine, large intestine, colon,
stomach Ugt1a3 Rat Small intestine, large intestine Ugt1a5 Rat Liver Ugt1a6 Rat Large and small intestine, kidney,
stomach, liver, lung, brain, esophagus Ugt1a7 Rat Small and large intestine, kidney, lung,
ovary, spleen, stomach Ugt1a8 Rat Liver and kidney
UGT1A1 Human Liver, biliary tract, colon, duodenum, jejunum, ileum
UGT1A3 Human Liver, biliary tract, colon, gastric lining, small intestine
UGT1A4 Human Liver, biliary tract, colon and small intestine
UGT1A6 Human Liver, biliary tract, stomach, colon, small intestine
UGT1A7 Human Stomach, esophagus UGT1A8 Human Colon, esophagus UGT1A9 Human Liver, colon, esophagus
UGT1A10 Human Biliary, gastric lining, colon, esophagus, small intestine
*Isoforms in bold indicate capability for MPA glucuronidation, table above includes only functional encoded proteins within UGT1A locus. List does not include the isoforms rUgt1a4, rUgt1a9, UGT1A2, UGT1A11, UGT1A12 and UGT1A13 which encode nonfunctional pseudogenes (Mackenzie, 2000; Miles et al., 2006; Miles et al., 2006; Shelby et al., 2003; Strassburg et al., 1997; Strassburg et al., 1998; Strassburg et al., 1999; Strassburg et al., 2000).

26
Table 1.2 Estimates of MPA and MPAG pharmacokinetic parameters following a single oral dose of 1.5 g of MMF in healthy human volunteers (n=6) (Bullingham et al., 1996; Bullingham et al., 1998; Hofmann-La Roche; Parker et al., 1996). Data are presented as mean values +/- SD.
Pharmacokinetic Parameter MPA MPAG
Cmax (mg/L) 34.0±7.1 43.1±6.8
Tmax (h) 1.0±0.1 1.8±0.5
Terminal t1/2 17.9±6.5 16.1±5.2
AUC0-∞ (mg/L*h) 101.1±23.4 480.1±105.2
CLRenal (mL/min) 1.2 (0-4.6) 33.7 (7.4)
Exposure due to EHC 40% N/A
Therapeutic Range 1-60 mg/L N/A
%Dose recovered in urine 0.6% 96.3%
%Dose recovered in feces 0.5% 5.5%
%Dose excreted into bile 0.1% 18.0%
* Cmax (Maxicum concentration), Tmax (Time to reach maximum concentration), AUC (Area under the curve)
27
G. References
Allison AC and Eugui EM. Preferential Suppression of Lymphocyte Proliferation by Mycophenolic Acid and Predicted Long Term Effects of Mycophenoliate Mofetil in Transplantation. Transpl Proc. 1994, 26(6), 3205-3210.
Auyeung DJ, Kessler FK and Ritter JK. Differential regulation of alternate UDP-glucuronosyltransferase 1A6 gene promoters by hepatic nuclear factor 1. Toxicol Appl Pharm. 2003, 191, 156-166.
Barbier O and Bellanger A. The cynomolgus monkey (Macaca fascicularis) is the best animal model for the study of steroid glucuronidation. J Steroid Biochem Mol Biol. 2003, 85(2-5), 235-45. Barnidge DR, Goodmanson MK, Klee GG, Muddiman DC. Absolute quantification of the model biomarker prostate-specific antigen in serum by LC-Ms/MS using protein cleavage and isotope dilution mass spectrometry. J Prot Res. 2004, 3(3), 644-52.
Barr JR, Maggio VL, Patterson DG Jr, Cooper GR, Henderson LO, Turner WE, Smith SJ, Hannon WH, Needham LL, Sampson EJ. Isotope dilution--mass spectrometric quantification of specific proteins: model application with apolipoprotein A-I. Clin Chem. 1996, 42(10):1676-82.
Bailey MJ, Worrall S, Jersey J and Dickinson RG. Zomepirac acyl glucuronide covalently modifies tubulin in vitro and in vivo and inhibits its assembly in an in vitro system. Chem Biol Interact. 1998, 115, 153-166.
Beynon RJ, Doherty MK, Pratt JM, Gaskell SJ. Multiplexed absolute quantification in proteomics using artificial QCAT proteins of concatenated signature peptides. Nat Meth. 2005, 2(8), 587-9.
Beynon RJ, Pratt JM. Metabolic labeling of proteins for proteomics. Mol Cell Prot. 2005, 4(7), 857-72.
Bier DM. The use of stable isotopes in metabolic investigation. Baillieres Clinical Endocrinology and Metabolism. 1987, 1(4), 817-36. Bock KW and Lilienblum W. Roles of Uridine Diphosphate Glucuronosyltransferases in Chemical Carcinogenesis, in Conjugation-Deconjugation Reactions in Drug Metabolism and Toxicity (Kauffamn F ed) , Springer-Verlag, Berlin. 1994, 391-428. Bock KW and Kohle C. Topological aspects of oligomeric UDP-glucuronosyltransferases in endoplasmic reticulum membranes: Advances and open questions. Biochem Pharm 2009, 77, 1458-1465.

28
Boelsterli UA. Diclofenac-induced liver injury: a paradigm of idiosyncratic drug toxicity. Toxicol Appl Pharmacol. 1998, 192, 307-322. Bullingham RE, Nicholls AJ, Kamm BR. Clinical pharmacokinetics of mycophenolate mofetil. Clin Pharmacokinet. 1998, 34(6), 429-55.
Bullingham R, Monroe S, Nicholls A, Hale M. Pharmacokinetics and bioavailability of mycophenolate mofetil in healthy subjects after single-dose oral and intravenous administration. J Clin Pharmacol. 1996, (4), 315-24.
Burchell B, Ebner T, Baird S, Bin Senafi S, Clarke D, Brierley C, Sutherland L. Use of cloned and expressed human liver UDP-glucuronosyltransferases for analysis of drug glucuronide formation and assessment of drug toxicity. Environ Health Perspect. 1994, 102 Suppl 9, 19-23. Cañas B, López-Ferrer D, Ramos-Fernández A, Camafeita E, Calvo E. Mass spectrometry technologies for proteomics. Brief Funct Genomic Proteomic. 2006, 4(4), 295-320. Carr SF, Papp E, Wu JC and Natsumeda Y. Characterization of Human Type I and Type II IMP Dehydrogenases. J. Biol Chem. 1998, 268(36), 27286-272890. Cattaneo D, Perico N and Remuzzi G. From Pharmacokinetics to Pharmacogenomics: A New Approach to Tailor Immunosuppressive Therapy. Am J Transpl. 2004, 4, 299-310. Chowdhury JR, Kondapalli R and Chowdhury NR. Gunn Rat: a model for inherited deficiency of bilirubin glucuronidation. Adv vet sci comp med. 1993, 37, 149-73. Clutterbuck PW and Raistrick H. The Molecular Constitution of the Metabolic Products of Penicillium Brevi-Compactum Dierckx and Related Species. Studies in the Biochemistry of Microorganisms. 1933. Cohen MB, Maybaum J and Sadee W. Guanine Nucleotide Depletion and Toxicity in Mouse T Lymphoma (S-49) Cells. J Biol Chem. 1981, 256(16), 8713-8717. Coleman M. Drug Biotransformation Systems: Orgins and Aims in Human Drug Metabolism: An Introduction. Wiley, London. 2005, 13-19, 23-56, 101-157. Cooper GS, Makris SL, Nietert PJ, Jinot J. Evidence of autoimmune-related effects of trichloroethylene exposure from studies in mice and humans. Environ Health Perspect. 2009, 117(5), 696-702.
29
Court MH. Isoform-Selective Probe Substrates for in Vitro Studies of Human UDP-Glucuronosyltranferases. Meth Enzymology. 2005, 400,104-116. Cussoneau X, Bolon-Lager M, Prunet-Spano C, Bastien O and Boulieu R. Relationship between MPA free fraction and free MPAG concentrations in heart transplant recipients based on simultaneous HPLC quantification of the target compounds in human plasma. J Chrom B. 2007. Dass C, Fridland GH, Tinsley PW, Killmar JT, Desiderio DM. Characterization of beta-endorphin in human pituitary by fast atom bombardment mass spectrometry of trypsin-generated fragments. Intl J Pep Prot Res. 1989, 34(2), 81-7. Dickinson RG and Bailey MJ. Acyl Glucuronide reactivity in perspective: biological consequences. Chem Biol Interact. 2003,145, 117-137. Dickinson RG and King AR. Studies on the reactivity of acyl glucuronides----v. glucuronide-derived covalent binding of diflunisal to bladder tissue of rats and its modulation by urinary pH and β-glucuronidase. Biochem Pharm. 1993, 46(7), 1175-1182. Djebi N, Picard N, Rerolle JP, Meur YL and Marquet P. Influence of the UGT2B7 promoter region and exon 2 polymorphisms and comedications on Acyl-MPAG production in vitro and in adult renal transplant patients. Pharmacogen Gen. 2007, 17, 321-330. Domon B, Aebersold R. Mass spectrometry and protein analysis. Science. 2006, 312(5771), 212-7.
Faed EM. Properties of acyl glucuronides: implications for studies of the pharmacokinetics and metabolism of acidic drugs. Drug Metab Rev. 1984, 15, 1213-1249.
Fisher MB, VandenBranden M, Findlay K, Burchell B, Thummel KE, Hall SD and Wrighton SA. Tissue distribution and interindividual variation in human UDP-Glucuronosyltransferase activity: relationship between UGT1A1 promoter genotype and variability in a liver bank. Pharmacogenetics. 2000, 10, 727-739. Gerber SA, Rush J, Stemman O, Kirschner MW, Gygi SP. Absolute quantification of proteins and phosphoproteins from cell lysates by tandem MS. Proc Natl Acad Sci USA. 2003, 100(12), 6940-5. Gonazalez-Roncero FM, Govantes MAG, Chaves VC, Palomo PP and Serra MB. Influence of Renal Insufficiency on Pharmacokinetics of ACYL-Glucuronide Metabolite of Mycophenolic Acid in Renal Transplant Patients. Transpl Proc. 2007, 39, 2176-2178.

30
Görg A, Weiss W, Dunn MJ. Current two-dimensional electrophoresis technology for proteomics. Proteomics. 2004, 4(12), 3665-85. Gregory PA, Lewinsky RH, Gardner-Stephen DA and Mackenzie PI. Regulation of UDP glucuronosyltransferases in the gastrointestinal tract. Toxicol Appl Pharmacol. 2004, 199, 354-363. Gstaiger M, Aebersold R. Applying mass spectrometry-based proteomics to genetics, genomics and network biology. Nat Rev Genet. 2009, 10(9), 617-27. Guillemette C. Pharmacogenomics of human UDP-glucuronosyltransferase enzymes. Pharmacogenomics J. 2003, 3(3), 136-58. Hancock WS, Wu SL, Shieh P. The challenges of developing a sound proteomics strategy. Proteomics. 2002, 2(4), 352-9. Hebert MF, Ascher NL, Lake JR, Emond J, Nikolai B, Linna TJ and Roberts JP. Four-year follow-up of mycophenolate mofetil for graft rescue in liver allograft recipients. Transplantation. 1999, 67, 707–712. Hesselink DA, van Hest R, Mathot RAA, Bonthuis F, Weimer W, Bruin RWF and Gelder T. Cyclosporine Interacts with Mycophenolic Acid by Inhibiting the Multidrug Resistance-Associated Protein 2. Am J of Transpl. 2005, 5, 987-994. Hofmann-La Roche, Basle, Switzerland, data on file Hoofnagle AN, Wener MH. The fundamental flaws of immunoassays and potential solutions using tandem mass spectrometry. J Immunol Meth. 2009, 347(1-2), 3-11. Ionescu C and Caira MR. Drug Metabolism in Context and Pathways of Biotransformation: Phase II Reactions, in Drug Metabolism Current Concepts, Springer, Dordrecht, The Netherlands. 2005, 1-37, 129-139. Jaggi R, Addison RS, King AR, Suthers BD and Dickinson RG. Conjugation of Desmethylnaproxen in the rat-A novel acyl glucuronide-sulfate diconjugate as a major biliary metabolite. Drug Metab Dispos. 2002, 30:161-166. Javitt NB. Ethereal and acyl glucuronide formation in the homozygous Gunn rat. Am J of Physiol. 1966, 211(2), 424-8. Jenkins RE, Kitteringham NR, Hunter CL, Webb S, Hunt TJ, Elsby R, Watson RB, Williams D, Pennington SR, Park BK. Relative and absolute quantitative expression profiling of cytochromes P450 using isotope-coded affinity tags. Proteomics. 2006, 6(6),1934-47.
31
Kamiie J, Ohtsuki S, Iwase R, Ohmine K, Katsukura Y, Yanai K, Sekine Y, Uchida Y, Ito S, Terasaki T. Quantitative atlas of membrane transporter proteins: development and application of a highly sensitive simultaneous LC/MS/MS method combined with novel in-silico peptide selection criteria. Pharm Res. 2008, 25(6),1469-83. King AR and Dickinson RG. The Utility of the Bile-Exteriorized Rat as a Source of Reactive Acyl Glucuronides: Studies with Zomepirac. J Pharm Toxicol Meth. 1996, 36, 131-136. King CD, Green MD, Rios GR, Coffman BL, Owens IS, Bishop WP and Tephly TR. The Glucuronidation of Exogenous and Endogenous Compounds by Stably Expressed Rat and Human UDP-Glucuronosyltransferase 1.1. Arc Biochem Biophys. 1996, 332(1), 92-100. Kobayashi M, Saitoh H, Koboyashi M, Tadano K, Takahashi Y and Hirano T. Cyclosporin A, but not Tacrolimus, Inhibits the Biliary Excretion of Mycophenolic Acid Glucuronide Possibly Mediated by Multidrug Resistance-Associated Protein 2 in Rats. J Pharm Exp Therap. 2004, 309 (3), 1029-1035. Kuhn E, Wu J, Karl J, Liao H, Zolg W, Guild B. Quantification of C-reactive protein in the serum of patients with rheumatoid arthritis using multiple reaction monitoring mass spectrometry and 13C-labeled peptide standards. Proteomics. 2004, 4(4),1175-86. Kypers DRJ, Vanrenterghem Y, Squifflet JP, Mourad M, Abramowicz D, Oellerich M, Armstrong V, Shipkova M and Daems J. Twelve Month Evaluation of the Clinical Pharmacokinetics of Total and Free Mycophenolic Acid and Its Glucuronide Metabolites in Renal Allograft Recipients on Low Dose Tacrolimus in Combination with Mycophenolate Mofetil. Ther Drug Monit. 2003, 25, 609-622. Li N, Nemirovskiy OV, Zhang Y, Yuan H, Mo J, Ji C, Zhang B, Brayman TG, Lepsy C, Heath TG, Lai Y. Absolute quantification of multidrug resistance-associated protein 2 (MRP2/ABCC2) using liquid chromatography tandem mass spectrometry. Anal Biochem. 2008, 380(2), 211-22. Levesque E, Girard H, Journault K, Lepine J and Guillemette C. “Regulation of the UGT1A1 Bilirubin-Conjugating Pathway: Role of a new Splicing Event at the UGT1A Locus. Hepatology. 2007, 128-138. Luukkanen L, Mikkola J, Forsman T, Taavitsainen P, Taskinen J and Elovaara E. Glucuronidation of 1-Hydroxypyrene by Human Liver Microsomes and Human UDP-Glucuronosyltransferases UGT1A6, UGT1A7 and UGT1A9: Development of a High-Sensitivity Glucuronidation Assay for Human Tissue. Drug Metab Dispos. 2001, 29, 1096-1101.
32
Mackenzie PI. Identification of uridine diphosphate glucuronosyltransferases involved in the metabolism and clearance of mycophenolic acid. Ther Drug Monit. 2000, 22(1), 10-3. Mackenzie PI, Owens IS, Burchell B, Bock KW, Bairoch A, Bélanger A, Fournel-Gigleux S, Green M, Hum DW, Iyanagi T, Lancet D, Louisot P, Magdalou J, Chowdhury JR, Ritter JK, Schachter H, Tephly TR, Tipton KF, Nebert DW. The UDP glycosyltransferase gene superfamily: recommended nomenclature update based on evolutionary divergence. Pharmacogenetics. 1997, 7(4), 255-69. Meech R and Mackenzie PI. UDP-Glucuronosyltransferase, the Role of the Amino Terminus in Dimerization. J Biol Chem. 1997, 272(43), 26913-26917. Meech R and Mackenzie PI. Structure and Function of Uridine Diphosphate Glucuronosyltransferases. Clin Exp Pharm Phys. 1997, 24 (12), 907-915. Melethil S and Conway WD. Urinary excretion of probenecid and its metabolites in humans as a function of dose. J Pharm Sci. 1976, 65 (6), 861-865. McDiarmid SV. Mycophenolate mofetil in liver transplantation. Clin. Transplant. 1996, 10(1), 140-145 Miles KK, Kessler FK, Webb LJ, Smith PC and Ritter JK. Adenovirus-Mediated Gene Therapy to Restore Expression and Functionality of Multiple UDP-Glucuronosyltransferase 1A Enzymes in the Gunn Rat Liver. J Pharmaco Exp Therap. 2006, 318, 1240-1247. Miles KK, Stern ST, Smith PC, Kessler FK, Ali S and Ritter JK. An Investigation of Human and Rat Liver Microsomal Mycophenolic Acid Glucuronidation: Evidence for a Principle Role of UGT1A Enzymes and Species Differences in UGT1A Specificity. Drug Metab Dispos. 2005, 33, 1513-1520. Miners JO. The glucuronidation of mycophenolic acid by human liver, kidney and jejunum microsomes. J Clin Pharm. 2001, 52, 605-609. Miura M, Kagaya H, Satoh S, Inoue K, Saito M, Habuchi T, Suzuki T. Influence of Drug Transporters and UGT Polymorphisms on Pharmacokinetics of Phenolic glucuronide Metabolite of Mycophenolic Acid in Japanese Renal Transplant Recipients. Ther Drug Monit. 2008. Mizuma T, Benet LZ and Lin ET. Interaction of Human Serum Albumin with Furosemide Glucuronide: a Role of Albumin in Isomerization, Hydrolysis, Reversible Binding and Irreversible Binding of a 1-O-Acyl Glucuronide Metabolite. Biopharm Drug Dispos. 1999, 20, 131-136.
33
Monaghan G, Clarke DJ, Povey S, See CG, Boxer M, Burchell B. Isolation of a human YAC contig encompassing a cluster of UGT2 genes and its regional localization to chromosome 4q13. Genomics. 1994, 23(2), 496-9.
Naderer OJ, Dupuis RE, Heinzen EL, Wiwattanawongsa K, Johnson MW, Smith PC. The influence of norfloxacin and metronidazole on the disposition of mycophenolate mofetil. J Clin Pharmacol. 2005, 45(2), 219-26.
Naesens M, Kuypers DRJ, Verbeke K and Vanrenterghen Y. Multidrug Resistance Protein 2 Genetic Polymorphisms Influence Mycophenolic Acid Exposure in Renal Allograft Recipients. Transplantation. 2006, 82(8).
Nagai F, Satoh H, Mori S, Sato H, Koiwai O, Homma H, Matsui M. Mapping of rat bilirubin UDP-glucuronosyl-transferase gene (Ugt1a1) to chromosome region 9q35-->q36. Cytogenet Cell Genet. 1995, 69(3-4),185-6.
Nagar S and Remmel RP. Uridine diphophoglucuronosyltransferase pharmacogenetics and cancer. Oncogene. 2006, 25, 1659-1672. Neerman MF, Boothe DM. A possible mechanism of gastrointestinal toxicity posed by mycophenolic acid. Pharmacol Res. 2003, 47(6), 523-6. O'Farrell PH. High resolution two-dimensional electrophoresis of proteins. J Bioll Chem. 1975, 250(10), 4007-21. Owens IS, Ritter JK. Gene structure at the human UGT1 locus creates diversity in isozyme structure, substrate specificity, and regulation. Prog Nucleic Acid Res Mol Biol. 1995, 51, 305-38. Paoluzzi L, Singh AS, Price DK, Danesi R, Mathijssen RHJ, Verweij J, Figg WD and Sparreboom A. Influence of Genetic Variants in UGT1A1 and UGT1A9 on the In Vivo Glucuronidation of SN-38. J Clin Pharm. 2004, 44, 854-860.
Parker G, Bullingham R, Kamm B, Hale M. Pharmacokinetics of oral mycophenolate mofetil in volunteer subjects with varying degrees of hepatic oxidative impairment. J Clin Pharmacol. 1996, 36(4), 332-44.
Picard N, Ratanasavanh D, Premaud A, Le Meur Y, and Marquet P. Identification of the UDP-glucuronosyltransferase isoforms involved in mycophenolic acid phase 2 metabolism. Drug Metab Dispos. 2005, 33, 139-146 Ritter JK. Roles of glucuronidation and UDP-glucuronosyltransferases in xenobiotic bioactivation reactions. Chem Biol Interact. 2000, 129(1-2), 171-93. Ritter JK, Chen F, Sheen YY, Tran HM, Kimura S, Yeatman MT, Owens IS. A novel complex locus UGT1 encodes human bilirubin, phenol, and other UDP-
34
glucuronosyltransferase isozymes with identical carboxyl termini. J Biol Chem. 1992, 267(5), 3257-61. Ritter JK, Crawford JM, Owens IS. Cloning of two human liver bilirubin UDP-glucuronosyltransferase cDNAs with expression in COS-1 cells. J Biol Chem. 1991, 266(2), 1043-7. Ritter JK, Yeatman MT, Ferreira P, Owens IS. Identification of a genetic alteration in the code for bilirubin UDP-glucuronosyltransferase in the UGT1 gene complex of a Crigler-Najjar type I patient. J Clin Invest. 1992, 90(1), 150-5. Saitoh H, Kobayashi M, Oda M, Nakasato K, Kobayashi M and Tadano K. Characterization of Intestinal Absorption and Enterohepatic Circulation of Mycophenolic Acid and Its 7-O-Glucuronide in Rats. Drug Metab Pharmacokinet. 2006, 21(5), 406-413. Sallustio BC, Sabordo L, Evans AM and Nation RL. Hepatic Disposition of Electrophilic Acyl Glucuronide Conjugates. Curr Drug Metab. 2000, 1, 163-180. Sechi S, Oda Y. Quantitative proteomics using mass spectrometry. Curr Op Chem Biol. 2003, 7(1), 70-7. Senafi SB, Clarke DJ, Burchell B. Investigation of the substrate specificity of a cloned expressed human bilirubin UDP-glucuronosyltransferase: UDP-sugar specificity and involvement in steroid and xenobiotic glucuronidation. Biochem J. 1994, 303( Pt 1), 233-40. Shaw LM, Nowak I. Mycophenolic acid: measurement and relationship to pharmacologic effects. Ther Drug Monit. 1995, 17(6), 685-9. Shipkova M, Armstron VW, Scheneider T, Neidmann PD, Schutz E, Wieland E and Oellerich M. Stability of Mycophenolic Acid and Mycophenolic Acid Glucuronide in Human Plasma. Clin Chem. 1999, 45(1). Shipkova M, Armstrong VW, Oellerich M and Wieland E. Mycophenolate mofetil in organ transplantation: focus on metabolism, safety and tolerability. Exp Op Drug Metab Tox. 2005, 1(3), 505-526. Shipkova M, Armstrong VW, Weber L, Niedmann PD, Wieland E, Haley J, Tonshoff B and Oellerich M. Pharmacokinetics and Protein Adduct Formation of the Pharmacologically Active Acyl Glucuronide Metabolite of Mycophenolic Acid in Pediatric Renal Transplant Patients. Ther Drug Monit. 2004. Shipkova M, Armstrong VW, Oellerich M and Wieland E. Acyl Glucuronide Drug Metabolites: Toxicological and Analytical Implications. Ther Drug Monit. 2003, 25, 1-16.

35
Shipkova M, Beck H, Voland A, Armstrong VW, Grone HJ, Oellerich M and Wieland E. Identification of protein targets for mycophenolic acid acyl glucuronide in rat liver and colon tissue. Proteomics. 2004, 4, 2728-2738. Shipkova M, Strassburg CP, Braun F, Streit F, Grone HJ, Armstrong VW, Tukey RH, Oellerich M and Wieland E. Glucuronide and glucoside conjugation of mycophenolic acid by human liver, kidney and intestinal microsomes. Brit J Pharm. 2001, 132, 1027-1034. Shipkova M, Wieland E, Schutz E, Wiese C, Niedmann PD, Oellerich M and Armstrong VW. The Acyl Glucuronide Metabolite of Mycophenolic Acid Inhibits the Proliferation of Human Mononuclear Leukocytes. Transplantation Proceedings. 2001, 33, 1080-1081. Sollinger H. “Enteric-Coated Mycophenolate Sodium: Therapeutic Equivalence to Mycophenolate Mofetil in De Novo Renal Transplant Patients.” Transplantation Proceedings. 36 (suppl 2S), 517S-520S 2004. Sollinger HW. From mice to man: the preclinical history of mycophenolate mofetil. Clin Transpl. 1996, 10, 85-92. Staatz CE, Tett SE. Clinical pharmacokinetics and pharmacodynamics of mycophenolate in solid organ transplant recipients. Clin Pharmacokin. 2007, 46(1), 13-58. Stern ST, Tallman MN, Miles KK, Ritter JK, Dupuis RE, Smith PC. Gender-related differences in mycophenolate mofetil-induced gastrointestinal toxicity in rats. Drug Metab Dispos. 2007, 35(3), 449-54. Strassburg CP, Manns MP, and Tukey RH. Expression of UDP-Glucuronosyltransferase 1A locus in the human colon. Identification and characterization of the novel extrahepatic UGT1A8. J Biol Chem 1998, 273, 8719-8726. Strassburg CP, Nguyen N, Manns MP, Tukey RH. UDP-glucuronosyltransferases in the human liver and colon. Gastroenterology. 1999, 116(1), 149-160. Strassburg CP, Oldhafer K, Manns MP and Tukey RH. Differential expression of the UGT1A locus in human liver, biliary and gastric tissue: identification of UGT1A7 and UGT1A10 transcripts in extrahepatic tissue. Mol Pharmacol 1997, 52, 212-220. Strassburg CP, Strassburg A, Nguyen N, Li Q, Manns MP and Tukey RH. Regulation and function of family 1 and family 2 UDP-glucuronosyltransferase
36
genes (UGT1A, UGT2B) in human oesophagus. Biochem J 1999, 338(Pt 2), 489-498. Strassburg CP, Vogel A, Kneip S, Tukey RH and Manns MP. Polymorphisms of the human UDP-glucuronosyltransferase (UGT) 1A7 gene in colorectal cancer. Gut. 2002, 50, 581-856. Sweeney MJ, Hoffman DH and Esterman MA. Metabolism and Biochemistry of Mycophenolic Acid. Cancer Research. 1972, 32, 1803-1809. Sweeney MJ, Gerzon K, Harris PN, Holmes RE, Poore GA and Williams RH. Experimental Antitumor Activity and Preclinical Toxicology of Mycophenolic Acid. Cancer Research 1972, 32, 1795-1802. Tallman MN, Miles KK, Kessler FK, Nielsen JN, Tian X, Ritter JK, Smith PC. The contribution of intestinal UDP-glucuronosyltransferases in modulating 7-ethyl-10-hydroxy-camptothecin (SN-38)-induced gastrointestinal toxicity in rats. J Pharmacol Exp Ther. 2007, 320(1), 29-37. Tang W. The Metabolism of Diclofenac- Enzymology and Toxicology Perspectives. Curr Drug Metab. 2003, 4(1), 319-329. Takekuma Y, Kakiuchi H, Yamazaki K, Miyauchi S, Kikukawa T, Kamo N Ganapathy V and Sugawara M. Difference between Pharmacokinetics of Mycophenolic acid (MPA) in Rats and that in Humans is caused by Different affinities of MRP2 in glucuronized form. J Pharm Pharmaceut Sci. 2007, 10(1), 71-85. Tukey RH and Strassburg CP. Genetic Mobility of the Human UDP-Glucuronosyltransferases and Regulation in the Gastrointestinal Tract. Mol Pharmacol. 2001, 59, 405-414. Tukey RH and Strassburg CP. Human UDP-Glucuronosyltransferases: Metabolism, Expression and Disease. Ann Rev of Pharmacol and Tox. 2000, 40, 581-616. UDP Glucuronosyltransferase Homepage. Department of Clinical Pharmacology, Flinders University. <http://som.flinders.edu.au/FUSA/ClinPharm/UGT/> Wang M and Dickinson RG. Bile duct ligation promotes covalent drug-protein adduct formation in the plasma but not in liver of rats given zomepirac. Life Sci. 2000, 68, 525-537.
Wang MZ, Wu JQ, Dennison JB, Bridges AS, Hall SD, Kornbluth S, Tidwell RR, Smith PC, Voyksner RD, Paine MF, Hall JE. A gel-free MS-based quantitative
37
proteomic approach accurately measures cytochrome P450 protein concentrations in human liver microsomes. Proteomics. 2008, 8(20), 4186-96.
Wang K, Zhang H, Li Y, Wei Q, Li H, Yang Y and Lu Y. Safety of mycophenolate mofetil versus azathioprine in renal transplantation: a systemic review. Transplant Proc. 2004, 36, 2608-2070. Westley IS, Brogan LR, Morris RG, Evans AM, Sallustio BC. Role of Mrp2 in the hepatic disposition of mycophenolic acid and its glucuronide metabolites: effect of cyclosporine. Drug Metab Dispos. 2006, 34(2), 261-6. Westley IS, Morris RG, Evans AM and Sallustio BC. Glucuronidation of mycophenolica acid by Wistar and Mrp2 deficient TR- rat liver microsomes. Drug Metab Dispos. 2007. Whitehouse CM, Dreyer RN, Yamashita M and Fenn JB, Electrospray interface for liquid chromatographs and mass spectrometers. Anal. Chem. 1985, 57, 675-679. Wieland E, Shipkova M, Schellhaas U, Schutz E, Neidmann PD, Armstrong VW, Oellerich M. Induction of Cytokine Release by the Acyl Glucuronide of Mycophenolic Acid: A Link to Side Effects? Clin Biochem. 2000, 33, 2, 107-113. Wiwattanawongsa K, Heinzen E, Kemp DC, Dupuis RE and Smith PC. Determination of mycophenolic acid and its phenol glucuronide metabolite in human plasma and urine by high performance liquid chromatography. J Chrom B. 2001, 763, 35-45. Wolff NA, Burckhardt BC, Burckhardt G, Oellerich M and Armstrong VW. Mycophenolic acid (MPA) and its glucuronide metabolites interact with transport systems responsible for excretion of organic anions in the basolateral membrane of the human kidney. Neph Dialysis Transpl. 2007. Wu SL, Amato H, Biringer R, Choudhary G, Shieh P, Hancock WS. Targeted proteomics of low-level proteins in human plasma by LC/MSn: using human growth hormone as a model system. J Prot Res. 2002, 1(5), 459-65. Wu WW, Wang G, Baek SJ and Shen RF. Comparative Study of Three Proteomic Quantitative Methods, DIGE, cICAT, and iTRAQ, using 2D Gel- or LC-MALDI TOF/TOF. J Prot Res. 2006, 5, 651-658. Young CJ and Sollinger HW. RS-61443: A new Immunosuppressive Agent. Transpl Proc. 1994, 26(8), 3144-3146.
38
Zhou J, Zhang J and Xie W. Xenobiotic Nuclear Receptor-Mediated Regulations of UDP-Glucuronosyltransferases. Curr Drug Metab. 2005, 6, 289-298.
39
CHAPTER 2
STABILITY OF MYCOPHENOLIC ACID ACYL GLUCURONIDE AND ITS POTENTIAL BIOLOGICAL CONSEQUENCES
40
A. INTRODUCTION
Mycophenolic acid (MPA) is used as an adjuvant immunosuppressive
agent for prevention of renal and liver allograft rejection. It is also used to treat
several autoimmune disorders. MPA is a selective and reversible inhibitor of the
inosine monophosphate dehydrogenase type II enzyme, which is primarily
responsible for the conversion of xanthine monophosphate to guanine
monophosphate in the de novo purine biosynthesis pathway (Young and
Sollinger, 1994). This enzyme is particularly important for B and T lymphocytes
that are unable to undergo the salvage pathway for purine biosynthesis and
proliferation (Young and Sollinger, 1994). Because the type II enzyme is found
primarily in lymphocytes, MPA makes an ideal agent for immunosuppressive
therapy.
MPA is administered as either an ester prodrug, mycofenolate mofetil,
(MMF) or an enteric coated sodium salt (MPA-Na+) in IV or oral formulations.
Following administration, MMF is rapidly converted to MPA and subsequently
conjugated to form the inactive phenolic glucuronide (MPAG) or the putative
reactive acyl glucuronide (acMPAG). These glucuronide metabolites can then be
excreted into the biliary tract by the canalicular multidrug resistance-associated
protein 2 (MRP2) transporter (Kobayashi et al., 2004). Enterohepatic cycling is
responsible for approximately forty percent of MPA exposure in humans, which is
visible through the presence of a secondary peak of MPA between 8-12 hours
following dosing (Bullingham et al., 1996; Staatz et al., 2007).
41
While MMF and MPA-Na+ are generally well tolerated, side effects such
as leucopenia, increased infection rate and diarrhea are observed in 20-30% of
patients (Davies et al., 2007). Diarrhea usually develops between one and three
months into MPA therapy and in severe cases can require dosage reduction or
cessation of therapy, increasing the chance of allograft rejection (Davies et al.,
2007). Numerous potential causes of delayed onset diarrhea due to MMF
therapy have been examined and investigated, but the precise origin remains
unknown. Due to the reactivity of acyl glucuronides, attempts have been made
to link the acMPAG metabolite to the gastrointestinal side effects of MPA in
humans. (Oellerich et al., 2000; Bailey and Dickinson, 2003; Heller et al., 2007).
Indeed, in vitro studies conducted with acMPAG indicate that it has the potential
to elevate cytokine levels, inhibit lymphocyte proliferation and form drug-protein
adducts with plasma and liver proteins (Wieland et al., 2000; Shipkova et al.,
2001; Shipkova et al., 2002). All of these findings could conceivably contribute to
toxicities or affect efficacy.
The purpose of this investigation was to evaluate acMPAG stability under
various conditions and to assess its covalent binding potential. The in vitro t1/2 of
the acMPAG metabolite and its relative stability as compared to other common
acyl glucuronide metabolites was investigated. Furthermore, the effects of
plasma proteins and liver microsomes on acMPAG stability were evaluated.
Using in vivo studies in male rats, we estimated the systemic clearance and the
fraction of acMPAG metabolite that is converted to MPA following direct acMPAG
administration. The ability of acMPAG to covalently bind with albumin in vitro
42
was examined to evaluate its stability and reactivity. This investigation of
acMPAG stability coupled with in vivo and covalent binding studies, provides
insight into whether the presence of drug-protein adducts could be a factor in
adverse reactions to MPA.
B. METHODS
Materials
AcMPAG (reported >95% pure) was generously donated in separate
batches by Roche Pharmaceuticals (Metby, NJ) and Novartis Pharmaceuticals.
MMF (CellCept©) was purchased from Roche Pharmaceuticals (Nutley, NJ).
Analytical grade acetonitrile (ACN), methyl alcohol (anhydrous) and glacial acetic
acid (HOAc) were purchased from Fisher Scientific Co. (Pittsburgh, PA). β-
Glucuronidase (Type β-1 from Bovine Liver), formic acid (FA), suprofen, diethyl
ether, human serum albumin fraction V (HSA), alamethicin, magnesium chloride
(MgCl2), phenylmethylsulfonyl fluoride (PMSF), D-saccharic acid 1, 4-lactone (D-
SL), dextrose, carboxyl methyl cellulose (CM-cellulose) and TRIZMA®
hydrochloride were purchased from Sigma-Aldrich Co. (St. Louis, MO).
Potassium phosphate monobasic, dibasic and sodium acetate (anhydrous) were
obtained from Mallinckrodt Baker, Inc. (Paris, Kentucky). Tris base was
purchased from Bio-Rad Laboratories (Hercules, CA). Protein concentrations
were determined using the Pierce BCA Protein Assay Kit with bovine serum
albumin (BSA) as the reference standard. Bond Elut solid phase extraction
cartridges (SPE, RP-C18) were obtained from Varian Inc (Palo Alto, CA).
Human liver microsomes (HLMs) (20 mg/mL) were purchased from BD
43
Biosciences (Franklin Lakes, NJ) (pools of 33), and human plasma (K2-EDTA
treated) was obtained from Valley Biomedical, Inc (Winchester, Virginia).
HPLC-UV Analysis
Analysis by reversed phase HPLC utilized a HP 1050 LC equipped with a
autosampler and an Axxiom (Moorpark, CA) C18 (15cm length, 4.6 mm
diameter, 5 μ particle size, 100 Ǻ pore size) column, with an HP 1100 series UV
detector set at 250 nm. Data analysis was performed with a Chemstation
(A.05.01, Agilent Technologies, Santa Clara, CA). The HPLC method was
adopted from an earlier protocol with some modifications (Wiwattanawongsa et
al., 2001). The mobile phase was 52% methanol/48% (0.1% formic acid (FA))
under isocratic conditions at a 1.0 mL/min flow rate over 24 minutes. Stability
experiments and pharmacokinetic analyses were conducted several different
times over a period of weeks with small variations (<20%) in both standard error
and stability calculations.
LC-MS Conditions
Analysis by reversed phase LC-MS was adopted from a previous method
using an HP 1100 series LC system and autosampler coupled to a single
quadrapole mass spectrometer (Sciex API 100, MDS Sciex, Concord, CA)
(Stern et al., 2007). A Zorbax RX-C8 column (Agilent Technologies, Palo Alto,
CA) (15 cm, 2.1 mm, 5 μ particle size) was run under gradient conditions utilizing
acetonitrile (sovent B) and 0.1% HOAc (solvent A) mobile phase. Linear gradient
44
conditions used were, 0 minutes, 20%B; 7 minutes, 90% B; 10 minutes, 90% B;
11 minutes, 20% B; 15 minutes, 20% B. Data analysis was performed by Analyst
1.4.2 (build 1236) (Applied Biosystems, Foster City, CA).
Stability Experiments in Phosphate Buffer
Concentrations of sodium phosphate monobasic and dibasic solutions (0.1
M) were used for pH 4, pH 7.4 and pH 9 buffers. AcMPAG (Roche) was added
to 50:50 ACN/0.1% HOAc (pH 3) to provide a 1 mg/mL stock and stored at -20ºC
prior to analysis. AcMPAG solution (75 μL, 0.1 mg/mL) was first diluted from the
1 mg/mL stock using HPLC water then added to microcentrifuge tubes and
brought to 0.2 mL with 150 mM phosphate buffer and incubated at 37ºC in
duplicate. At 0, 30, 60, 120, 240, 480, 720 and 1440 minutes, a 10μL aliquot was
extracted and, either quenched with 800 μL of acidified acetonitrile (0.5% FA, pH
3.2), or hydrolyzed with 10 μL of β-glucuronidase solution (final dilution of 100
U/μL in pH 5 acetate buffer) for four hours. Following quenching of either the
incubated or hydrolyzed acMPAG, samples were centrifuged at 15,000g for 10
minutes at 4ºC and dried under nitrogen. Samples were then reconstituted with
0.15mL of MeOH/0.1% FA (25:75) and suprofen internal standard (2 μg/mL final
concentration) and injected for HPLC analysis.
AcMPAG Stability in Plasma
Stability studies in plasma were processed using the same sample
preparation protocol described in the previous section. AcMPAG diluted stock
45
(0.1 mg/mL) was added to either human plasma (K2-EDTA treated) at
physiological pH or plasma acidified with HOAc (pH 4), providing a final
concentration of 40 μg/mL. During incubation, samples (in duplicate) were
obtained and prepared as indicated in the buffer experiments. Samples were
centrifuged again at 15,000g for 15 minutes at 4ºC, and the supernatant was
extracted and dried under nitrogen gas. After evaporation to dryness, samples
were reconstituted with MeOH/0.1% FA (25:75) and injected onto the HPLC-UV.
Stability in Human Liver Microsomes
HLMs (1 mg/mL) were prepared in 100 mM Tris buffer (pH 7.7) and
incubated on ice for 10 minutes with 100 mM MgCl2 and alamethicin (20 μg/mL)
and either tris buffer (control), PMSF (2 μM), D-SL (0.8 mM) or both PMSF and
DS-L in duplicate in buffer. The reaction was initiated with an aliquot of acMPAG
(40 μg/mL final concentration, Roche) and incubated at 37°C in duplicate. At 0,
15, 30, 60 and 120 minutes, a 10µL aliquot was extracted and either hydrolyzed
with β-glucuronidase (100 U/μL) or quenched with acidified ACN. Following
quenching, samples were then centrifuged, dried and reconstituted prior to
HPLC-UV analysis.
Covalent Binding of acMPAG in HSA
Covalent binding experiments were carried out under protocols that have
been previously reported (Smith et al., 1993; Liu et al., 1996). HSA fraction V
was dissolved in phosphate buffer (pH 7.4, 150 mM) to 30 mg/mL and then
46
combined with acMPAG to obtain 50 μg/mL for incubation. The mixture was
incubated at 37ºC for 24 hours, and 0.1 mL aliquots were obtained in triplicate at
0, 30, 60, 120, 240, 480, 720 and 1440 minutes and immediately quenched with
1 mL isopropanol/43% phosphoric acid (50:1). MPA was similarly incubated in
duplicate in HSA fraction V to serve as a control. Samples were centrifuged and
the precipitated protein pellet was washed 10X with methanol/diethyl ether (3:1).
After washing, the pellets were spiked with suprofen internal standard (0.4
mg/mL in solution) and dissolved in 1 mL 0.2 M NaOH, followed by three hour
incubation at 37ºC to hydrolyze and release covalently-bound acMPAG to form
MPA. To confirm MPA stability against extreme acidic or basic treatment, MPA
was incubated with aqueous 0.1 M NaOH or 0.1 M HCl over 8 hours and its
content monitored by HPLC. Following hydrolysis, concentrated phosphoric acid
was added to adjust the pH to approximately 2. Samples were then purified by
SPE. Following conditioning, samples were added to SPE tubes, followed by a
wash with MeOH/0.1% FA (20:80), and then eluted with of ACN/0.1% FA (80:20).
The eluents were dried under nitrogen, reconstituted in MeOH/0.1% FA (25:75),
and injected for HPLC analysis. Chromatographic conditions were the same as
previously described with the exception of the mobile phase (60% MeOH/40%
0.1% FA). Run time was ten minutes with retention times of 5.5 and 7.5 minutes
for suprofen and MPA, respectively.
47
Animals
Male Wistar rats (250-300 g) were purchased from Charles River
laboratories (Wilmington, MA) and housed under a 12 hour-light dark cycle.
Experimental methods were approved by the Institutional Animal Care and Use
Committee (IACUC) and the Division of Lab Animal Medicine (UNC-Chapel Hill).
Animals were acclimated for one week prior to experimentation. Male rats (n=3)
were administered a single bolus 2.5 mg/kg AcMPAG (in MPA equivalents) dose
intravenously in 5% isotonic dextrose solution or IV with 50 mg/kg MMF in a 5%
isotonic dextrose solution (6 mg/mL). Blood was collected from the tail vein in
0.1-0.2 mL aliquots into microcentrifuge tubes at 2, 5, 10, 15, 20, 30, 60, 120,
180, 240, 360 and 480 minutes post IV dosing and 0, 15, 30, 60, 120, 180, 240,
360 and 480 minutes post MMF dosing, placed on ice, and centrifuged at
15,000g for 10 minutes. Following centrifugation, plasma was transferred into
microcentrifuge tubes containing acetic acid (HOAc) (pH 3, 5μL/mL) to stabilize
acMPAG at pH~4 and stored at -20ºC until analysis. For quantitative analysis,
50 μL of plasma was precipitated with 300 μL of acetonitrile containing 5 μL of
0.1mg/mL suprofen internal standard and centrifuged, dried under nitrogen and
reconstituted in methanol/0.1% formic acid (25:75) for HPLC injection.
Noncompartmental pharmacokinetic estimates were obtained using WinNonlin
5.0.1 (Pharsight, Cary, NC). Individual pharmacokinetic estimates for each rat
were calculated based on plasma concentration data using noncompartmental
pharmacokinetics on WinNonline and averaged (n=3) to generate parameter
estimates.

48
C. RESULTS
AcMPAG Purity
Initial HPLC analysis of both the Novartis and Roche acMPAG products
revealed an additional peak eluting as a shoulder just prior to the acMPAG peak
(Figure 2.1). After β-glucuronidase treatment, the first peak remained and was
later confirmed through mass spectrometry (Figure 2.2) to be a putative isomeric
conjugate impurity of the initial acMPAG sample. This peak was consistently
seen throughout all stability testing and indicated that the initial samples provided
by both the Roche and Novartis pharmaceutical companies consisted of 82% β-1
acMPAG and 18% isomeric conjugates that are resistant to β-glucuronidase.
Isomeric Conjugate Content
Prior to stability testing, the time dependant β-glucuronidase (1000 U/mL)
treatment was evaluated at 2, 4 and 6 hours to determine the optimal duration of
hydrolysis. At two hours, there was still a significant fraction of β-1 conjugate
that was not cleaved by β-glucuronidase, but at four and six hours, there was no
detectable β-1 conjugate present at Rt=10.2 minutes. Furthermore, there was no
difference in isomeric conjugate impurity seen at Rt=9.4 minutes between the
four and six hour treatments (18.2% at four hours, 18.5% at six hours, p=0.88,
data not shown). Based on these results, four hours of β-glucuronidase
treatment was used for the subsequent stability testing in phosphate buffer and
biological matrices.

49
Stability Experiments
The buffer stability experiments with acMPAG consistently showed a pH
dependant acyl migration and hydrolysis. While acMPAG was very stable
through 24 hours at pH 4, all three pH conditions demonstrated a noticeable
product loss following the first hour of incubation (Figure 2.3). This pattern was
seen most dramatically at pH 7.4 which demonstrated a much steeper rate of
decline in the first 120 minutes of incubation compared to the remaining
incubation time period up to 24 hours. The t1/2 of 18.1 hours (Table 2.1) indicates
that acMPAG is a moderately stable acyl glucuronide in protein free buffer under
physiological conditions. Comparatively, acyl glucuronides from drugs removed
from the market such as zomepirac (t1/2 0.5 hours) and benoxaprofen acyl
glucuronide (t1/2 1.4 hours) are much less stable under similar conditions
(Hasegawa et al., 1982; Dong et al., 2005).
Relative to buffer, acMPAG demonstrated a similar yet more rapid pattern
of decline in human plasma under both physiological (pH 7.4) and acidic (pH 4)
conditions (Figure 2.4). The mildly acidic condition stabilized acMPAG compared
to physiological pH through 24 hours, but continued to display the biphasic
decline seen in the phosphate buffer experiments (Figure 2.3). In human
plasma, the t1/2 was 6.7 hours, but there were no significant differences in
isomeric rearrangement. It is likely that the presence of esterases within the
human plasma caused acMPAG hydrolysis to increase dramatically as compared
with protein free phosphate buffer.
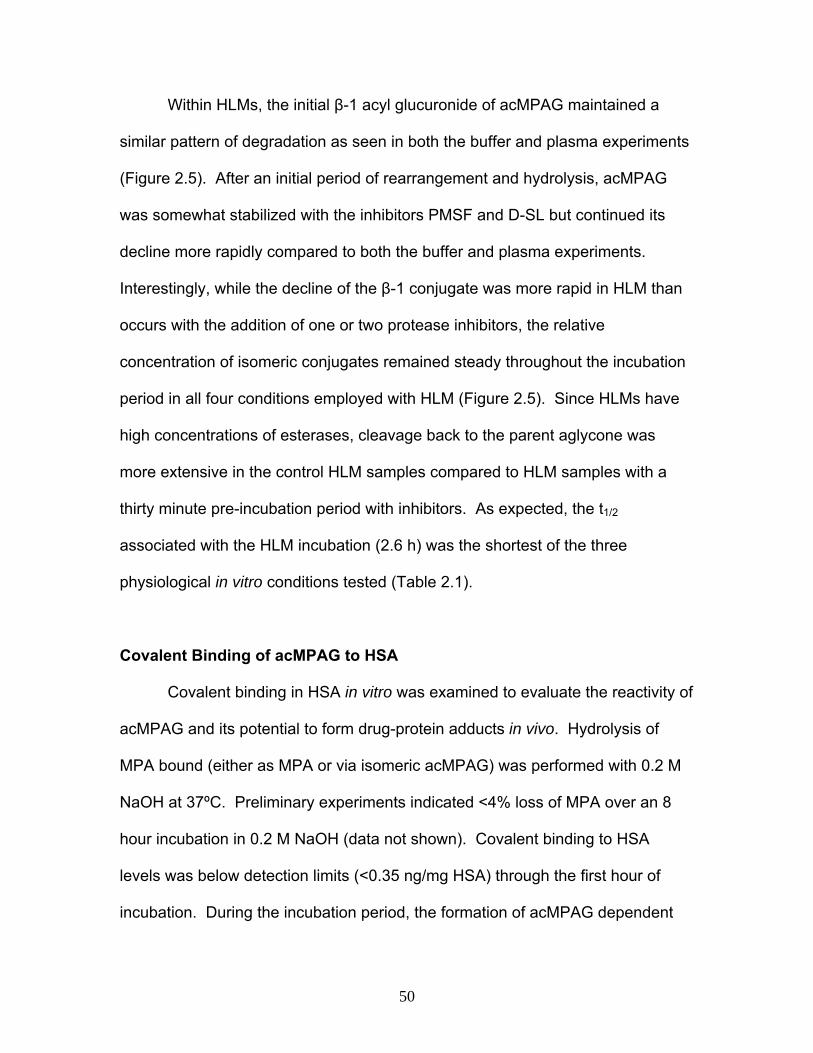
50
Within HLMs, the initial β-1 acyl glucuronide of acMPAG maintained a
similar pattern of degradation as seen in both the buffer and plasma experiments
(Figure 2.5). After an initial period of rearrangement and hydrolysis, acMPAG
was somewhat stabilized with the inhibitors PMSF and D-SL but continued its
decline more rapidly compared to both the buffer and plasma experiments.
Interestingly, while the decline of the β-1 conjugate was more rapid in HLM than
occurs with the addition of one or two protease inhibitors, the relative
concentration of isomeric conjugates remained steady throughout the incubation
period in all four conditions employed with HLM (Figure 2.5). Since HLMs have
high concentrations of esterases, cleavage back to the parent aglycone was
more extensive in the control HLM samples compared to HLM samples with a
thirty minute pre-incubation period with inhibitors. As expected, the t1/2
associated with the HLM incubation (2.6 h) was the shortest of the three
physiological in vitro conditions tested (Table 2.1).
Covalent Binding of acMPAG to HSA
Covalent binding in HSA in vitro was examined to evaluate the reactivity of
acMPAG and its potential to form drug-protein adducts in vivo. Hydrolysis of
MPA bound (either as MPA or via isomeric acMPAG) was performed with 0.2 M
NaOH at 37ºC. Preliminary experiments indicated <4% loss of MPA over an 8
hour incubation in 0.2 M NaOH (data not shown). Covalent binding to HSA
levels was below detection limits (<0.35 ng/mg HSA) through the first hour of
incubation. During the incubation period, the formation of acMPAG dependent
51
HSA adducts was minimal and lower than that reported for ibuprofen acyl
glucuronide and almost ten fold lower than that reported for reactive ibufenac
acyl glucuronide under the same experimental conditions (Figure 2.6, Castillo et
al. 1995). These data indicates that acMPAG is a fairly nonreactive acyl
glucuronide with a low propensity for rapid accumulation of drug-protein adducts
within the systemic circulation and tissues in vivo.
AcMPAG Disposition in a Rat
Three male Wistar rats were dosed intravenously with 2.5 mg/kg acMPAG
to obtain AUC and Cl estimates. The plasma concentration profile demonstrated
that the metabolite is rapidly cleared after IV administration, with hydrolysis being
the primary route of loss for acMPAG. After a 2.5 mg/kg dose (based on MPA
equivalents), the average AUC(acMPAG)0-∞ was 1.4 mg*min/mL with the average
parent aglycone AUC (MPA)0-∞ is 0.2 mg*min/mL (Table 2.2). IV dosing of MMF 50
mg/kg (based on MPA equivalents) resulted in an AUC (MPA)0-∞ of 2.9 mg/mL*min.
Data from the IV MMF and IV acMPAG dosing to rats were used to estimate the
MPA fraction converted from acMPAG (FacMPAG MPA) as 0.88. This extent of
hydrolytic conversion indicates extensive cleavage of acMPAG back to the MPA
aglycone, with the remaining metabolite excreted likely through the urine or bile.
None of the rats administered a single dose of acMPAG demonstrated any signs
of overt toxicity during the course of the experiments.
52
D. DISCUSSION
A few attempts have been made previously to study the stability of the
acMPAG metabolite of MPA. The results of these reports were ambiguous
(Wieland et al., 2000; Shipkova et al., 1999; Shipkova et al., 2000; de Loor et al.,
2008). We therefore sought to provide a comprehensive investigation into
acMPAG stability using various physiological conditions that may be responsible
for the previously reported results that were inconsistent. Our first observation
was that the chromatographs from both the HPLC-UV and LC-MS experiments
indicate a significant amount of impurity is present within the samples of
acMPAG obtained from both pharmaceutical companies prior to stability testing,
indicating the presence of the isomeric conjugates. It is likely that, during the
overnight incubation process of liver microsomes with MPA used to generate the
acMPAG metabolites, the samples underwent significant acyl migration
(Kittelmann et al., 2003). In each of our stability experiments, there was an
immediate loss of initial β-1 acyl glucuronide (prior to the terminal phase
degradation period) that existed under all conditions tested. It has been
previously reported that while acMPAG metabolites are stable when stored in
acidic conditions at -20ºC, this metabolite undergoes hydrolysis and
rearrangement under some experimental settings (Shipkova et al., 1999;
Shipkova et al., 2000, de Loor et al., 2008). These setting include incubations in
both plasma and phosphate buffer at both room temperature and under
refridgeration (Shipkova et al., 2000, de Loor et al., 2008). Our studies here
confirm these findings and show that the primary differences in acMPAG stability

53
is that it decreases when progressing from protein-free conditions to an intact in
vivo system.
The decreases in stability of acMPAG demonstrated from the
physiological phosphate buffer incubations compared to human plasma indicate
that the plasma protein matrix itself destabilizes the acyl glucuronide. While the
rates of isomeric rearrangement remain consistent between the two matrices, the
rate of hydrolysis increases dramatically in human plasma and is responsible for
the reduced t1/2s calculated using the concentration time plots (Figures 2.3 and
2.4). Esterase cleavage of acMPAG responsible for increased MPA
concentration could also be a source for the efficacy of the acMPAG metabolite
reported by Shipkova et al. for an in vitro assay (Shipkova et al., 2001).
Esterases are readily present within mononuclear leukocytes and an incubation
period of 96 hours at 37ºC could cause a significant contamination of the parent
MPA aglycone, resulting in inhibited leukocyte proliferation (Shipkova et al.,
2001).
Of the three in vitro matrices chosen for this study (buffer, plasma, HLM),
the acMPAG metabolite was found to be the least stable within the HLM matrix.
This is likely due to not only the presence of a significant amount of esterase
activity within the HLM but also because of β-glucuronidase enzymes within the
liver microsomes. The actions of these enzymes was confirmed following the
addition of the two different inhibitors to the HLM cocktail, which decreased the
degradation rate with the HLMs individually, but were most effective when
combined. PMSF is a nonspecific protease inhibitor that can be used for liver or
54
intestinal microsome preparations to prevent loss of enzyme activity (Dutton,
1980).
The putative toxicity of acyl glucuronides has continued to be a source of
investigation primarily due to the large number of nonsteroidal anti-inflammatory
drugs (NSAIDs) forming acyl glucuronide metabolites that have been removed
from the market because of adverse drug reactions (ADRs) (Dickinson, 1993;
Bailey and Dickinson, 2003). Acyl glucuronide metabolites are unique when
compared to other glucuronides because they undergo esterase cleavage back
to the parent aglycone and they also form isomeric conjugates through acyl
migration (Faed, 1984). Acyl migration results from the intraconversion of the 1-
O-β acyl glucuronide into 2-O-β, 3-O-β, 4-O-β or α isomeric conjugates and
unlike the parent 1-O-β conjugate, they are resistant to β-glucuronidase
hydrolysis (Sinclair, 1982; Faed, 1984). Isomeric conjugates observed for
numerous NSAIDs have shown the ability to bind to both plasma and liver
proteins such as tubulin and albumin; primarily through the nucleophilic
displacement or Schiff base mechanisms, leading to the formation of drug-protein
adducts (Smith et al., 1990; Smith et al., 1992). It has been hypothesized that
these drug-protein adducts could disrupt cellular function such as seen in
dipeptidyl peptidase IV (DPP-IV) adducts with diflunisal (King and Dickinson,
1993; Bailey and Dickinson, 2003). In addition, the binding of tubulin with the
acyl glucuronides of zomepirac, tolmetin and valproic acid (VPA) may lead to the
inhibition of hepatocyte function and subsequent liver toxicity (Bailey et al., 1998;
Bailey and Dickinson, 2003; Cannell et al., 2003). Many NSAIDs that form
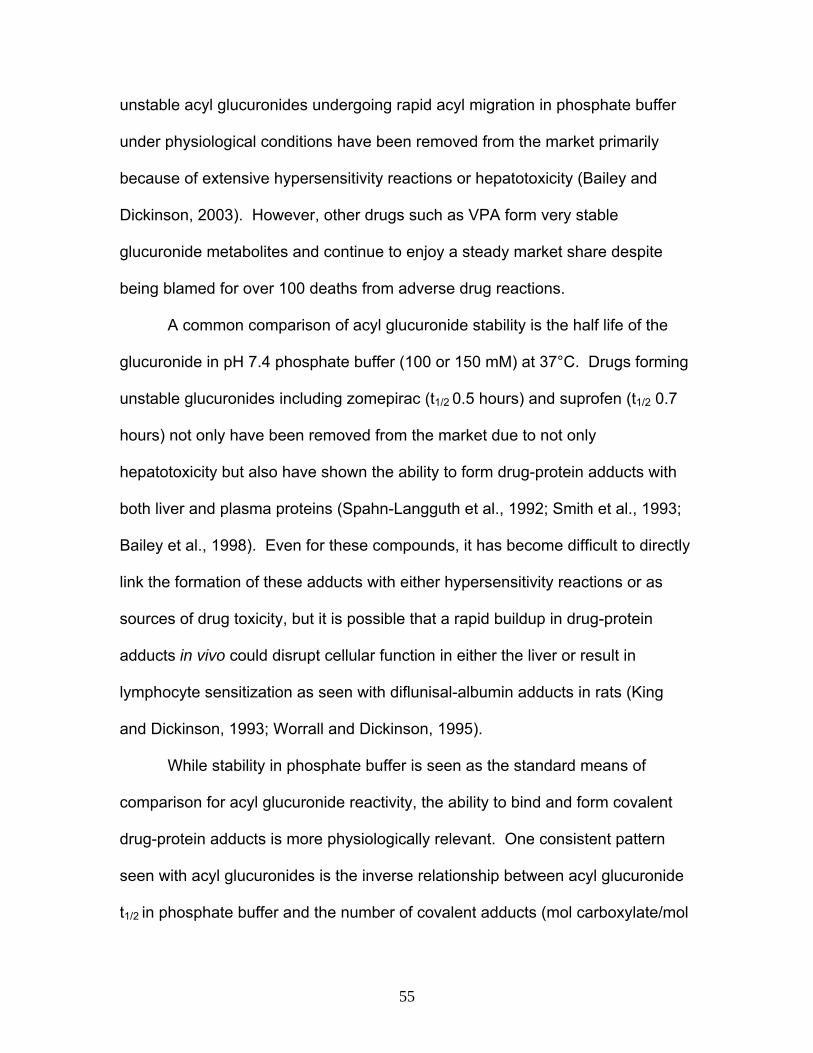
55
unstable acyl glucuronides undergoing rapid acyl migration in phosphate buffer
under physiological conditions have been removed from the market primarily
because of extensive hypersensitivity reactions or hepatotoxicity (Bailey and
Dickinson, 2003). However, other drugs such as VPA form very stable
glucuronide metabolites and continue to enjoy a steady market share despite
being blamed for over 100 deaths from adverse drug reactions.
A common comparison of acyl glucuronide stability is the half life of the
glucuronide in pH 7.4 phosphate buffer (100 or 150 mM) at 37°C. Drugs forming
unstable glucuronides including zomepirac (t1/2 0.5 hours) and suprofen (t1/2 0.7
hours) not only have been removed from the market due to not only
hepatotoxicity but also have shown the ability to form drug-protein adducts with
both liver and plasma proteins (Spahn-Langguth et al., 1992; Smith et al., 1993;
Bailey et al., 1998). Even for these compounds, it has become difficult to directly
link the formation of these adducts with either hypersensitivity reactions or as
sources of drug toxicity, but it is possible that a rapid buildup in drug-protein
adducts in vivo could disrupt cellular function in either the liver or result in
lymphocyte sensitization as seen with diflunisal-albumin adducts in rats (King
and Dickinson, 1993; Worrall and Dickinson, 1995).
While stability in phosphate buffer is seen as the standard means of
comparison for acyl glucuronide reactivity, the ability to bind and form covalent
drug-protein adducts is more physiologically relevant. One consistent pattern
seen with acyl glucuronides is the inverse relationship between acyl glucuronide
t1/2 in phosphate buffer and the number of covalent adducts (mol carboxylate/mol
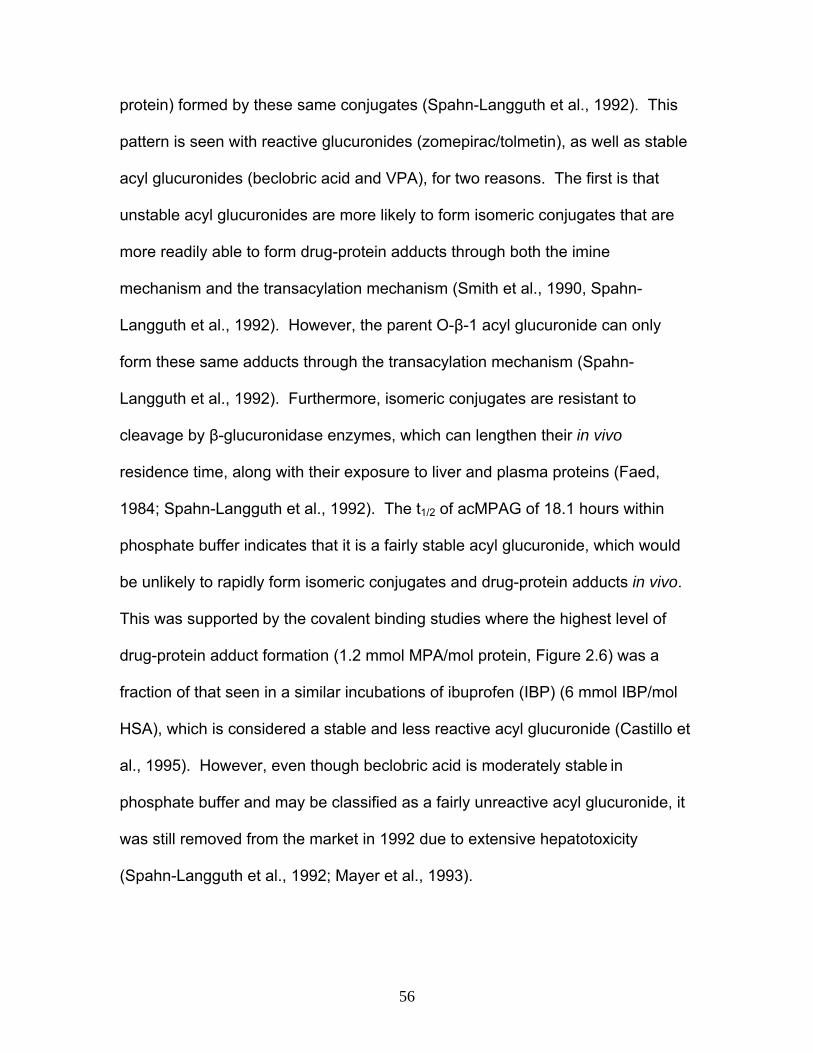
56
protein) formed by these same conjugates (Spahn-Langguth et al., 1992). This
pattern is seen with reactive glucuronides (zomepirac/tolmetin), as well as stable
acyl glucuronides (beclobric acid and VPA), for two reasons. The first is that
unstable acyl glucuronides are more likely to form isomeric conjugates that are
more readily able to form drug-protein adducts through both the imine
mechanism and the transacylation mechanism (Smith et al., 1990, Spahn-
Langguth et al., 1992). However, the parent O-β-1 acyl glucuronide can only
form these same adducts through the transacylation mechanism (Spahn-
Langguth et al., 1992). Furthermore, isomeric conjugates are resistant to
cleavage by β-glucuronidase enzymes, which can lengthen their in vivo
residence time, along with their exposure to liver and plasma proteins (Faed,
1984; Spahn-Langguth et al., 1992). The t1/2 of acMPAG of 18.1 hours within
phosphate buffer indicates that it is a fairly stable acyl glucuronide, which would
be unlikely to rapidly form isomeric conjugates and drug-protein adducts in vivo.
This was supported by the covalent binding studies where the highest level of
drug-protein adduct formation (1.2 mmol MPA/mol protein, Figure 2.6) was a
fraction of that seen in a similar incubations of ibuprofen (IBP) (6 mmol IBP/mol
HSA), which is considered a stable and less reactive acyl glucuronide (Castillo et
al., 1995). However, even though beclobric acid is moderately stable in
phosphate buffer and may be classified as a fairly unreactive acyl glucuronide, it
was still removed from the market in 1992 due to extensive hepatotoxicity
(Spahn-Langguth et al., 1992; Mayer et al., 1993).
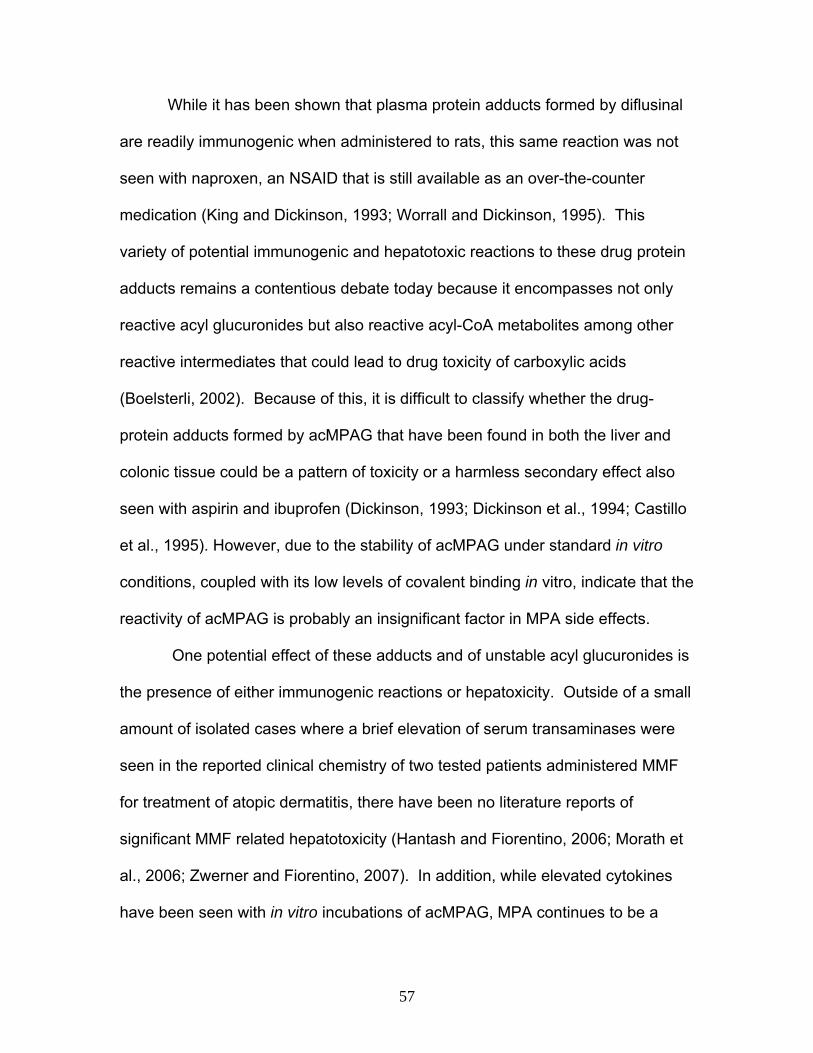
57
While it has been shown that plasma protein adducts formed by diflusinal
are readily immunogenic when administered to rats, this same reaction was not
seen with naproxen, an NSAID that is still available as an over-the-counter
medication (King and Dickinson, 1993; Worrall and Dickinson, 1995). This
variety of potential immunogenic and hepatotoxic reactions to these drug protein
adducts remains a contentious debate today because it encompasses not only
reactive acyl glucuronides but also reactive acyl-CoA metabolites among other
reactive intermediates that could lead to drug toxicity of carboxylic acids
(Boelsterli, 2002). Because of this, it is difficult to classify whether the drug-
protein adducts formed by acMPAG that have been found in both the liver and
colonic tissue could be a pattern of toxicity or a harmless secondary effect also
seen with aspirin and ibuprofen (Dickinson, 1993; Dickinson et al., 1994; Castillo
et al., 1995). However, due to the stability of acMPAG under standard in vitro
conditions, coupled with its low levels of covalent binding in vitro, indicate that the
reactivity of acMPAG is probably an insignificant factor in MPA side effects.
One potential effect of these adducts and of unstable acyl glucuronides is
the presence of either immunogenic reactions or hepatoxicity. Outside of a small
amount of isolated cases where a brief elevation of serum transaminases were
seen in the reported clinical chemistry of two tested patients administered MMF
for treatment of atopic dermatitis, there have been no literature reports of
significant MMF related hepatotoxicity (Hantash and Fiorentino, 2006; Morath et
al., 2006; Zwerner and Fiorentino, 2007). In addition, while elevated cytokines
have been seen with in vitro incubations of acMPAG, MPA continues to be a
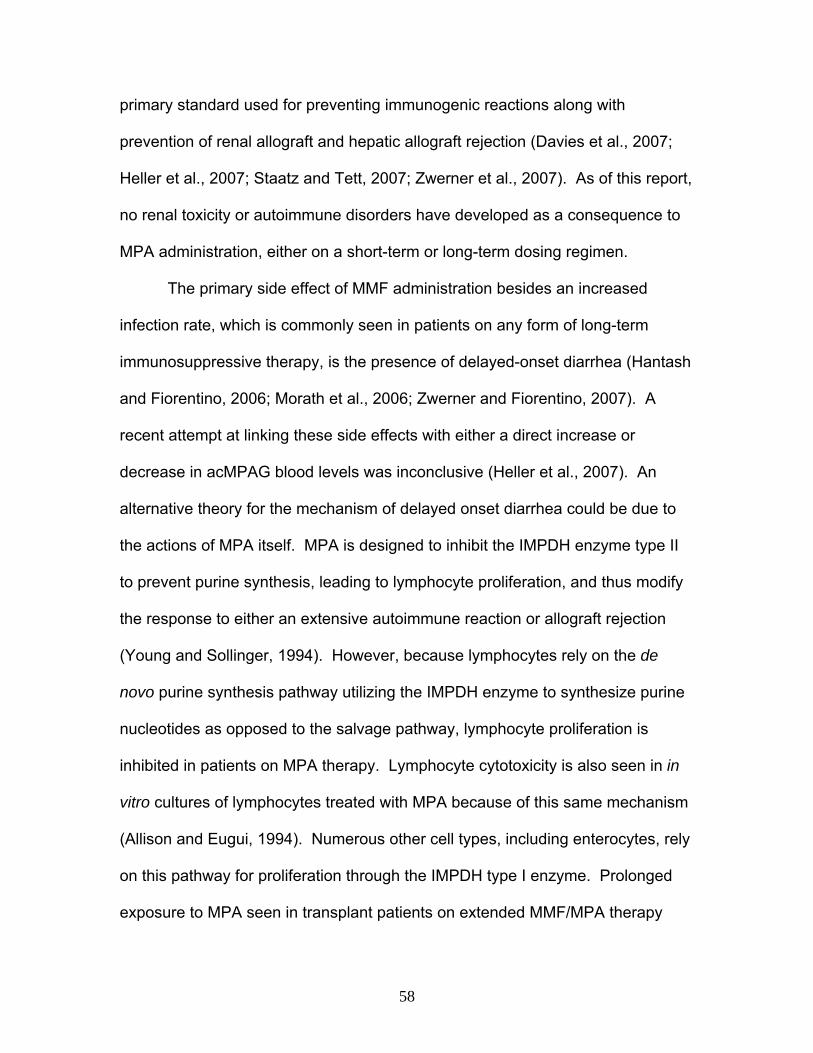
58
primary standard used for preventing immunogenic reactions along with
prevention of renal allograft and hepatic allograft rejection (Davies et al., 2007;
Heller et al., 2007; Staatz and Tett, 2007; Zwerner et al., 2007). As of this report,
no renal toxicity or autoimmune disorders have developed as a consequence to
MPA administration, either on a short-term or long-term dosing regimen.
The primary side effect of MMF administration besides an increased
infection rate, which is commonly seen in patients on any form of long-term
immunosuppressive therapy, is the presence of delayed-onset diarrhea (Hantash
and Fiorentino, 2006; Morath et al., 2006; Zwerner and Fiorentino, 2007). A
recent attempt at linking these side effects with either a direct increase or
decrease in acMPAG blood levels was inconclusive (Heller et al., 2007). An
alternative theory for the mechanism of delayed onset diarrhea could be due to
the actions of MPA itself. MPA is designed to inhibit the IMPDH enzyme type II
to prevent purine synthesis, leading to lymphocyte proliferation, and thus modify
the response to either an extensive autoimmune reaction or allograft rejection
(Young and Sollinger, 1994). However, because lymphocytes rely on the de
novo purine synthesis pathway utilizing the IMPDH enzyme to synthesize purine
nucleotides as opposed to the salvage pathway, lymphocyte proliferation is
inhibited in patients on MPA therapy. Lymphocyte cytotoxicity is also seen in in
vitro cultures of lymphocytes treated with MPA because of this same mechanism
(Allison and Eugui, 1994). Numerous other cell types, including enterocytes, rely
on this pathway for proliferation through the IMPDH type I enzyme. Prolonged
exposure to MPA seen in transplant patients on extended MMF/MPA therapy

59
could result in a consistent exposure to high local concentrations of MPA within
the intestinal lumen through the actions of the gut flora producing β-
glucuronidase enzymes. The fraction of acMPAG cleaved to MPA in the
systemic circulation of rats, to 0.88, indicates that a large portion of acMPAG
formed and effluxed into the blood is hydrolyzed back into the parent aglycone.
Efficient hydrolysis in vivo is supported by the large amount of β-glucuronidase
and esterase hydrolysis displayed in the HLM incubations along with the
significant hydrolysis within the plasma (Figure 2.4 and 2.5). AcMPAG could
serve as a secondary source of MPA within the systemic circulation and intestinal
lumen, which over time could be a factor in MPA intestinal toxicity, even if the
metabolite itself is not proven to be the source of drug toxicity.
In conclusion, the data presented here indicate that acMPAG is a fairly
stable acyl glucuronide with low relative reactivity compared to other metabolites
of this type. It is a labile metabolite in the systemic circulation and minor
metabolite in plasma and bile, thus there is little evidence to support this
metabolite as a likely reactive metabolite to be associated with the adverse drug
reactions of MPA.
E. ACKNOWLEDGEMENTS
I would like to thank Dr. Melanie Joy along with Novartis and Roche
Pharmaceuticals for providing the acMPAG. I would also like to thank the NIH
Training Grant T32-ES007126 for providing funding.
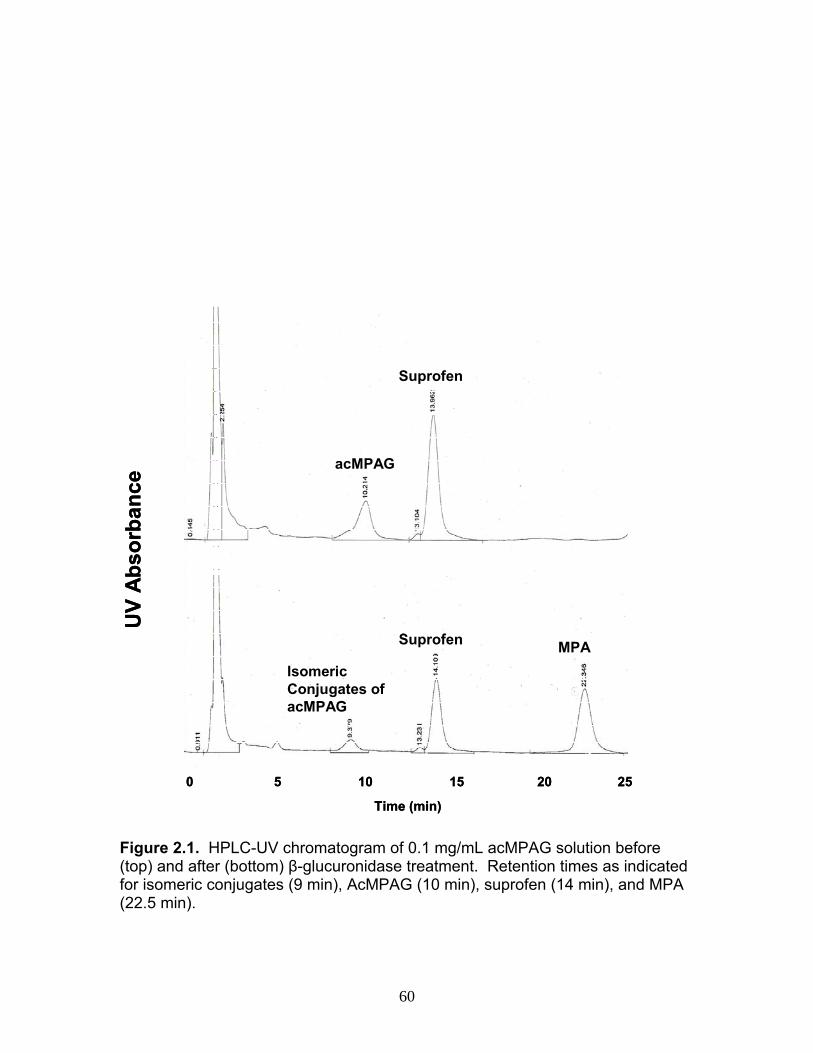
60
UV
Abs
orba
nce
Suprofen MPA
Suprofen
acMPAG
Isomeric Conjugates of acMPAG
0 5 10 15 20 25
Time (min)
UV
Abs
orba
nce
Suprofen MPA
Suprofen
acMPAG
Isomeric Conjugates of acMPAG
0 5 10 15 20 25
Time (min) Figure 2.1. HPLC-UV chromatogram of 0.1 mg/mL acMPAG solution before (top) and after (bottom) β-glucuronidase treatment. Retention times as indicated for isomeric conjugates (9 min), AcMPAG (10 min), suprofen (14 min), and MPA (22.5 min).
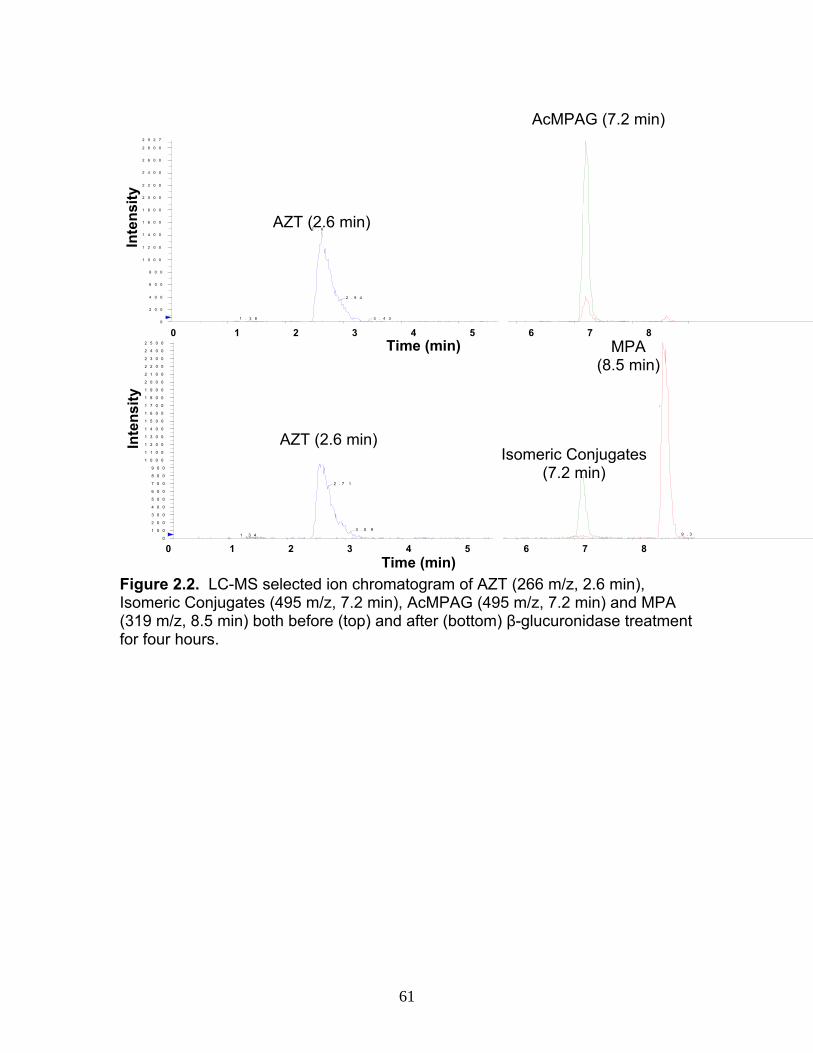
61
0
2 0 0
4 0 0
6 0 0
8 0 0
1 0 0 0
1 2 0 0
1 4 0 0
1 6 0 0
1 8 0 0
2 0 0 0
2 2 0 0
2 4 0 0
2 6 0 0
2 8 0 0
2 9 2 7
2 . 6 3
2 . 9 4
3 . 4 31 . 3 8
0
1 0 0
2 0 0
3 0 0
4 0 0
5 0 0
6 0 0
7 0 0
8 0 0
9 0 0
1 0 0 0
1 1 0 0
1 2 0 0
1 3 0 0
1 4 0 0
1 5 0 0
1 6 0 0
1 7 0 0
1 8 0 0
1 9 0 0
2 0 0 0
2 1 0 0
2 2 0 0
2 3 0 0
2 4 0 0
2 5 0 0
2 . 5 8
2 . 7 1
3 . 0 99 . 31 . 3 4
AZT (2.6 min)
AcMPAG (7.2 min)
MPA (8.5 min)
Isomeric Conjugates (7.2 min)
AZT (2.6 min)
Time (min)0 1 2 3 4 5 6 7 8
0 1 2 3 4 5 6 7 8Time (min)
Inte
nsity
Inte
nsity
Figure 2.2. LC-MS selected ion chromatogram of AZT (266 m/z, 2.6 min), Isomeric Conjugates (495 m/z, 7.2 min), AcMPAG (495 m/z, 7.2 min) and MPA (319 m/z, 8.5 min) both before (top) and after (bottom) β-glucuronidase treatment for four hours.
AZT (2.6 min)
AcMPAG (7.2 min)
Isomeric Conjugates (7.2 min)
AZT (2.6 min)
MPA
(8.5 min)

62
Figure 2.3. Stability of acMPAG (■) in aqueous buffer performed at pH 4 (top), pH 7.4 (middle) and pH 9 (bottom). Fractions were averaged from experiments run in duplicate (variation between samples <25%). Degradation to isomeric conjugates of acMPAG ( ) and MPA (▲) are shown.
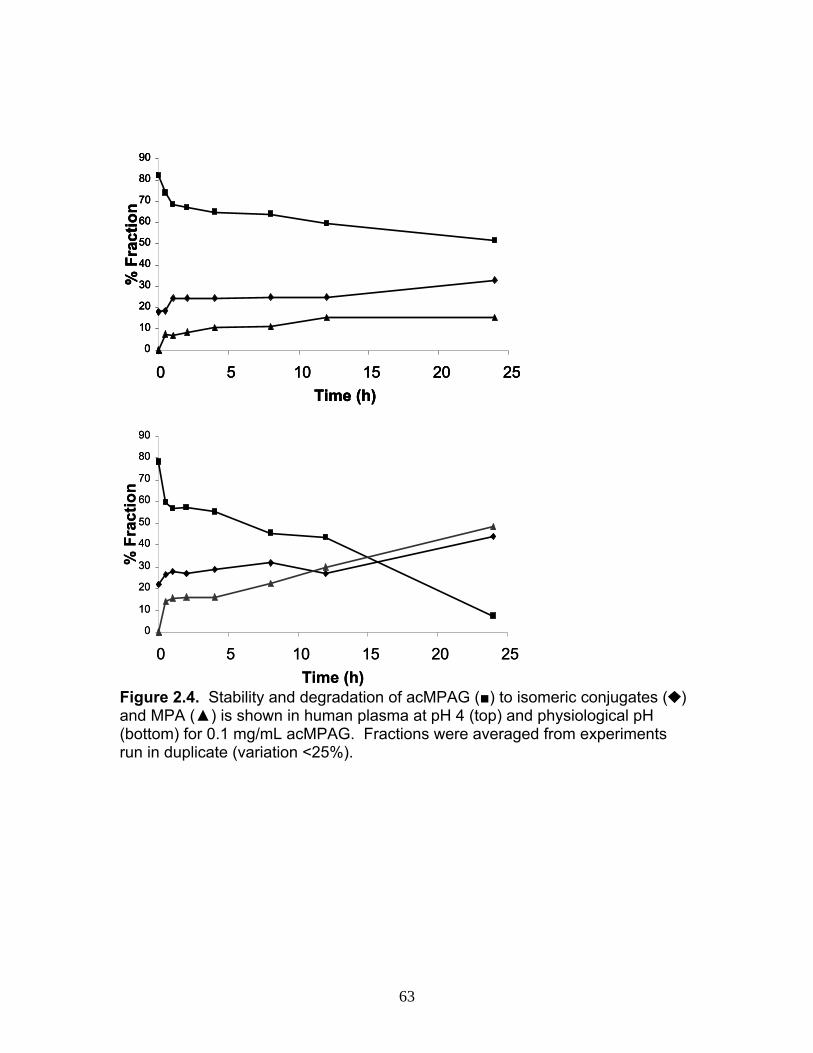
63
0
10
20
30
40
50
60
70
80
90
0 5 10 15 20 25Time (h)
% F
ract
ion
0
10
20
30
40
50
60
70
80
90
0 5 10 15 20 25Time (h)
% F
ract
ion
0
10
20
30
40
50
60
70
80
90
0 5 10 15 20 25Time (h)
% F
ract
ion
0
10
20
30
40
50
60
70
80
90
0 5 10 15 20 25Time (h)
% F
ract
ion
0
10
20
30
40
50
60
70
80
90
0 5 10 15 20 25Time (h)
% F
ract
ion
Figure 2.4. Stability and degradation of acMPAG (■) to isomeric conjugates ( ) and MPA (▲) is shown in human plasma at pH 4 (top) and physiological pH (bottom) for 0.1 mg/mL acMPAG. Fractions were averaged from experiments run in duplicate (variation <25%).
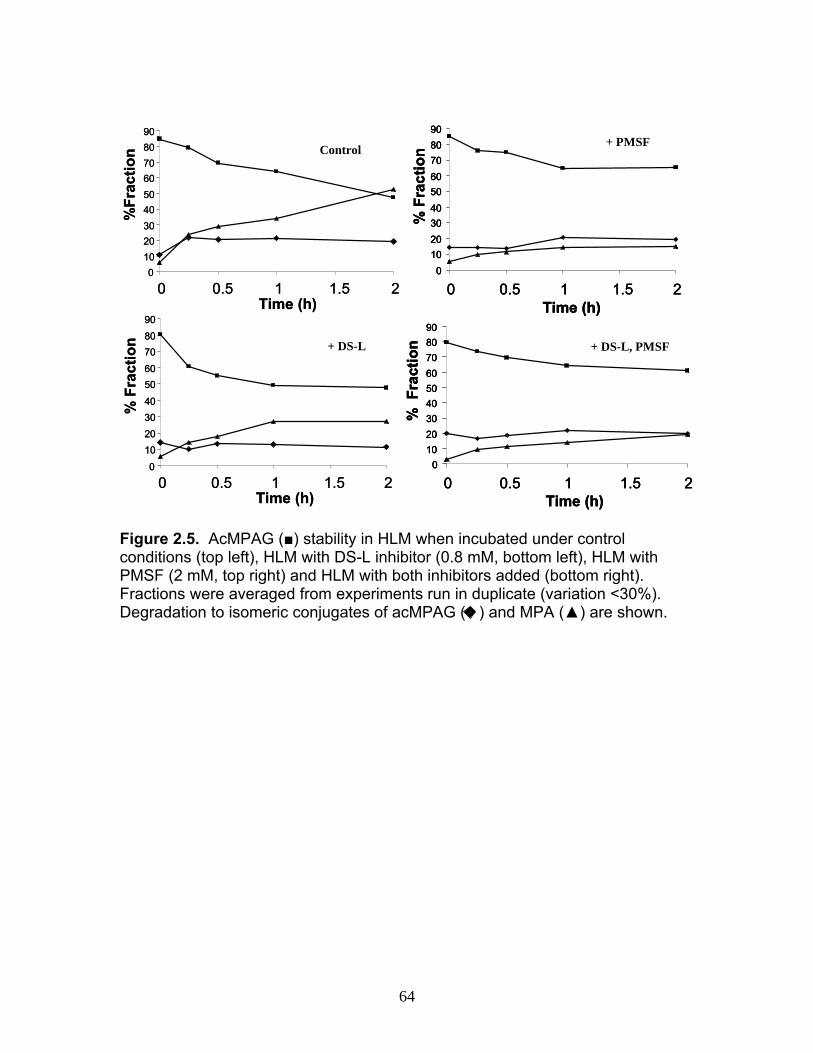
64
0102030405060708090
0 0.5 1 1.5 2Time (h)
%Fr
actio
n
0
10203040
5060708090
0 0.5 1 1.5 2Time (h)
% F
ract
ion
Control
0102030405060708090
0 0.5 1 1.5 2Time (h)
% F
ract
ion
+ PMSF
+ DS-L
0102030405060708090
0 0.5 1 1.5 2Time (h)
% F
ract
ion + DS-L, PMSF
0102030405060708090
0 0.5 1 1.5 2Time (h)
%Fr
actio
n
0
10203040
5060708090
0 0.5 1 1.5 2Time (h)
% F
ract
ion
Control
0102030405060708090
0 0.5 1 1.5 2Time (h)
% F
ract
ion
+ PMSF
0102030405060708090
0 0.5 1 1.5 2Time (h)
% F
ract
ion
+ PMSF
+ DS-L
0102030405060708090
0 0.5 1 1.5 2Time (h)
% F
ract
ion + DS-L, PMSF
0102030405060708090
0 0.5 1 1.5 2Time (h)
% F
ract
ion + DS-L, PMSF
Figure 2.5. AcMPAG (■) stability in HLM when incubated under control conditions (top left), HLM with DS-L inhibitor (0.8 mM, bottom left), HLM with PMSF (2 mM, top right) and HLM with both inhibitors added (bottom right). Fractions were averaged from experiments run in duplicate (variation <30%). Degradation to isomeric conjugates of acMPAG ( ) and MPA (▲) are shown.
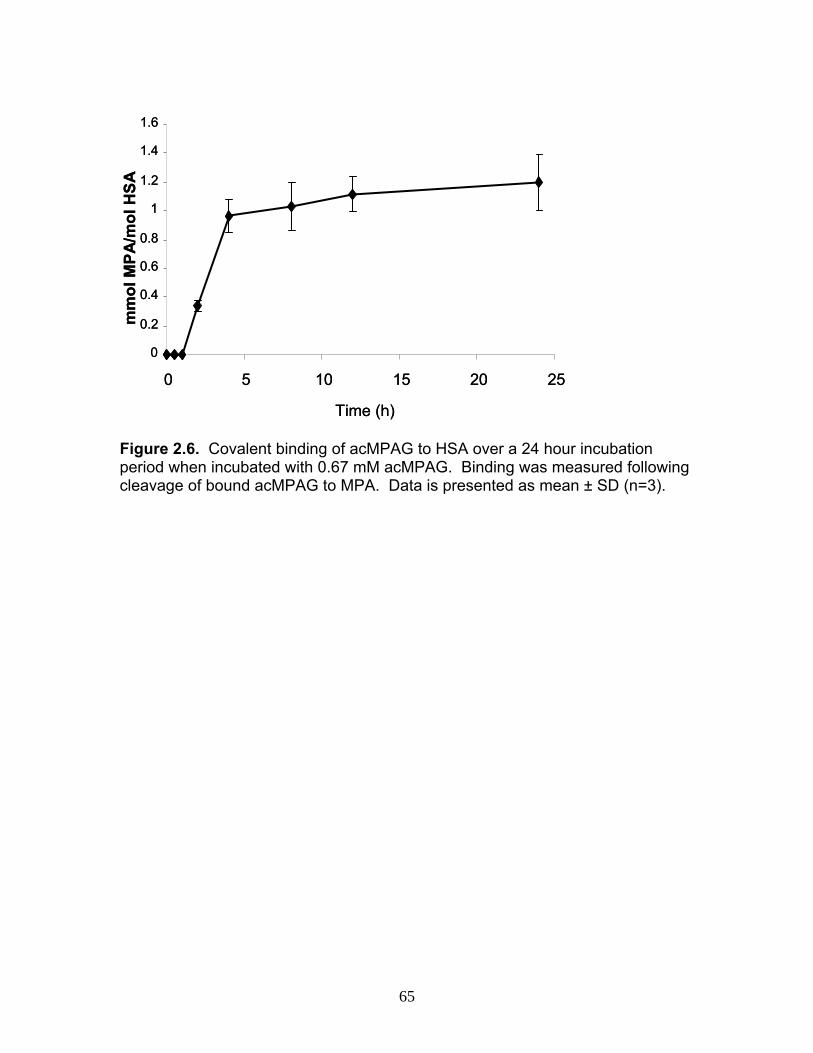
65
0
0.2
0.4
0.6
0.8
1
1.2
1.4
1.6
0 5 10 15 20 25
Time (h)
mm
olM
PA/m
ol H
SA
0
0.2
0.4
0.6
0.8
1
1.2
1.4
1.6
0 5 10 15 20 25
Time (h)
mm
olM
PA/m
ol H
SA
Figure 2.6. Covalent binding of acMPAG to HSA over a 24 hour incubation period when incubated with 0.67 mM acMPAG. Binding was measured following cleavage of bound acMPAG to MPA. Data is presented as mean ± SD (n=3).

66
Figure 2.7. Mean plasma concentrations of acMPAG (■) and MPA (▲) (in MPA equivalents of μg/mL) for male Wistar rats (n=3) following a 2.5 mg/kg IV dose of acMPAG (Roche). Data is presented as mean ± SD.
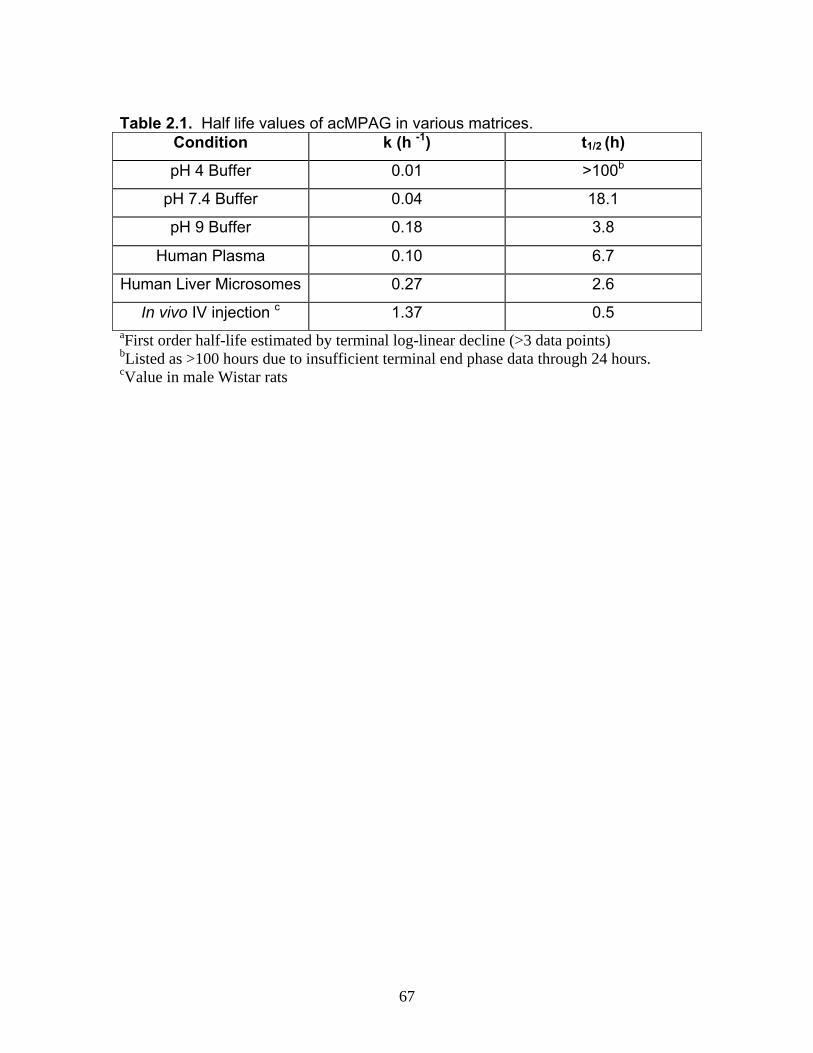
67
Table 2.1. Half life values of acMPAG in various matrices.
Condition k (h -1) t1/2 (h)
pH 4 Buffer 0.01 >100b
pH 7.4 Buffer 0.04 18.1
pH 9 Buffer 0.18 3.8
Human Plasma 0.10 6.7
Human Liver Microsomes 0.27 2.6
In vivo IV injection c 1.37 0.5 aFirst order half-life estimated by terminal log-linear decline (>3 data points) bListed as >100 hours due to insufficient terminal end phase data through 24 hours. cValue in male Wistar rats
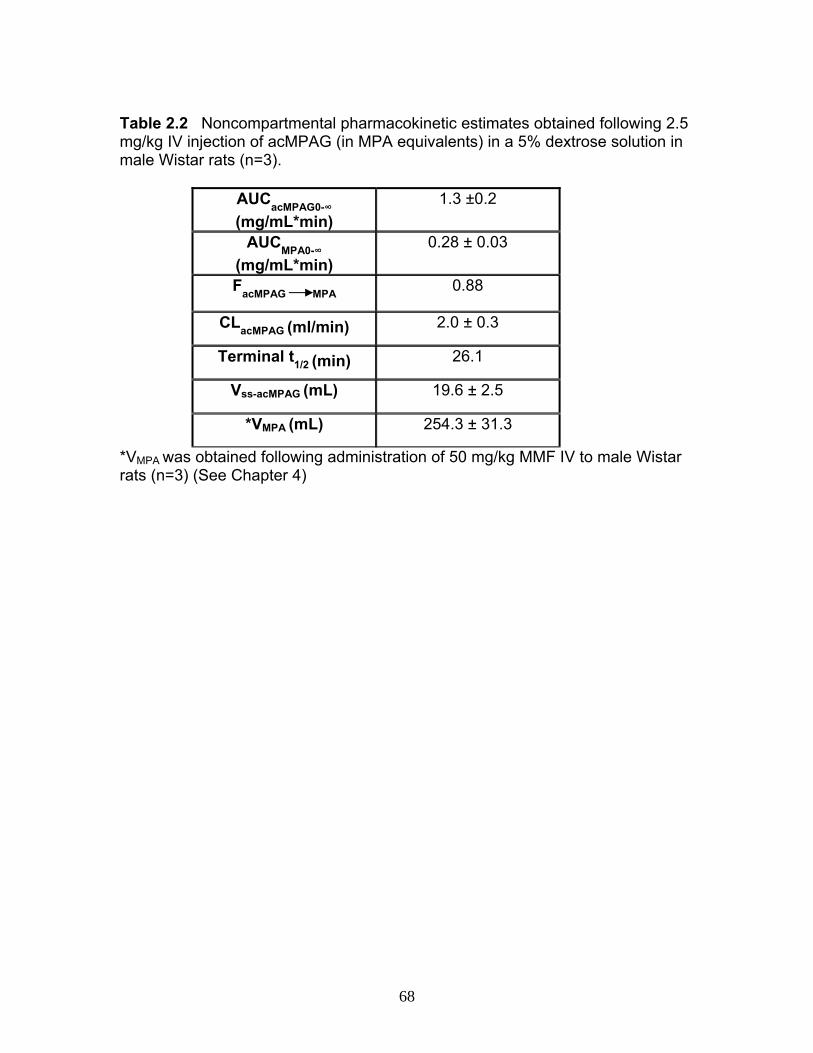
68
Table 2.2 Noncompartmental pharmacokinetic estimates obtained following 2.5 mg/kg IV injection of acMPAG (in MPA equivalents) in a 5% dextrose solution in male Wistar rats (n=3).
AUCacMPAG0-∞ (mg/mL*min)
1.3 ±0.2
AUCMPA0-∞ (mg/mL*min)
0.28 ± 0.03
FacMPAG MPA 0.88
CLacMPAG (ml/min) 2.0 ± 0.3
Terminal t1/2 (min) 26.1
Vss-acMPAG (mL) 19.6 ± 2.5
*VMPA (mL) 254.3 ± 31.3
*VMPA was obtained following administration of 50 mg/kg MMF IV to male Wistar rats (n=3) (See Chapter 4)
69
F. References
Allison AC and Eugui EM. “Preferential Suppression of Lymphocyte Proliferation by Mycophenolic Acid and Predicted Long Term Effects of Mycophenoliate Mofetil in Transplantation.” Transplant Proc. 1994, 26(6), 3205-3210. Bailey MJ, Dickinson RG. Acyl glucuronide reactivity in perspective: biological consequences. Chem Biol Interact. 2003, 145, 117-137.
Bailey MJ, Worrall S, de Jersey J, Dickinson RG Zomepirac acyl glucuronide covalently modifies tubulin in vitro and in vivo and inhibits its assembly in an in vitro system. Chem Biol Interact. 1998, 115, 153-166.
Boelsterli UA. Diclofenac-induced liver injury: a paradigm of idiosyncratic drug toxicity. Toxicol Appl Pharmacol. 2003, 192, 307-322.
Boelsterli UA. Xenobiotic acyl glucuronides and acyl CoA thioesters as protein-reactive metabolites with the potential to cause idiosyncratic drug reactions. Curr Drug Metab. 2002, 3, 439-450.
Cannell GR, Bailey MJ, Dickinson RG. Inhibition of tubulin assembly and covalent binding to microtubular protein by valproic acid glucuronide in vitro. Life Sci. 2002, 71, 2633-2643.
Cannell GR, Vesey DA, Dickinson RG. Inhibition of proliferation of HT-29 colon adenocarcinoma cells by carboxylate NSAIDs and their acyl glucuronides. Life Sci. 2001, 70, 37-48.
Castillo M, Smith PC. Disposition and reactivity of ibuprofen and ibufenac acyl glucuronides in vivo in the rhesus monkey and in vitro with human serum albumin. Drug Metab Dispos. 1995, 23, 566-572.
Chiou YJ, Tomer KB, Smith PC. Effect of nonenzymatic glycation of albumin and superoxide dismutase by glucuronic acid and suprofen acyl glucuronide on their functions in vitro. Chem Biol Interact. 1999, 121, 141-159.
Davies NM, Grinyó J, Heading R, Maes B, Meier-Kriesche HU, Oellerich M. Gastrointestinal side effects of mycophenolic acid in renal transplant patients: a reappraisal. Nephrol Dial Transplant. 2007, 22, 2440-2448.
de Loor H, Naesens M, Verbeke K, Vanrenterghem Y, Kuypers DR. Stability of mycophenolic acid and glucuronide metabolites in human plasma and the impact of deproteinization methodology. Clin Chim Acta. 2008, 389, 87-92.
Dickinson RG. Acyl glucuronide conjugates: reactive metabolites of non-steroidal anti-inflammatory drugs. Proc West Pharmacol Soc. 1993, 36, 157-162.
70
Dickinson RG, Baker PV, King AR. Studies on the reactivity of acyl glucuronides--VII. Salicyl acyl glucuronide reactivity in vitro and covalent binding of salicylic acid to plasma protein of humans taking aspirin. Biochem Pharmacol. 1994, 47, 469-476.
Dickinson RG, King AR. Studies on the reactivity of acyl glucuronides--V. Glucuronide-derived covalent binding of diflunisal to bladder tissue of rats and its modulation by urinary pH and beta-glucuronidase. Biochem Pharmacol. 1993, 46, 1175-1182.
Djebli N, Picard N, Rérolle JP, Le Meur Y, Marquet P. Influence of the UGT2B7 promoter region and exon 2 polymorphisms and comedications on Acyl-MPAG production in vitro and in adult renal transplant patients. Pharmacogenet Genomics. 2007,17, 321-330.
Dong JQ, Liu J, Smith PC. Role of benoxaprofen and flunoxaprofen acyl glucuronides in covalent binding to rat plasma and liver proteins in vivo. Biochem Pharmacol. 2005, 70, 937-48. Dutton GJ. Glucuronidation of Drugs and Other Compounds. CRC Press, Baco Raton, FL. 1980.
Faed EM. Properties of acyl glucuronides: implications for studies of the pharmacokinetics and metabolism of acidic drugs. Drug Metab Rev. 1984, 15, 1213-1249.
González-Roncero FM, Govantes MA, Chaves VC, Palomo PP, Serra MB. Influence of renal insufficiency on pharmacokinetics of ACYL-glucuronide metabolite of mycophenolic acid in renal transplant patients. Transplant Proc. 2007, 39, 2176-2178.
Hantash B, Fiorentino D. Liver enzyme abnormalities in patients with atopic dermatitis treated with mycophenolate mofetil. Arch Dermatol. 2006, 142, 109-110.
Hasegawa J, Smith PC, Benet LZ. Apparent intramolecular acyl migration of zomepirac glucuronide. Drug Metab Dispos. 1982, 10, 469-473.
Heller T, van Gelder T, Budde K, de Fijter JW, Kuypers D, Arns W, Schmidt J, Rostaing L, Powis SH, Claesson K, Macphee IA, Pohanka E, Engelmayer J, Brandhorst G, Oellerich M, Armstrong VW. Plasma concentrations of mycophenolic acid acyl glucuronide are not associated with diarrhea in renal transplant recipients. Am J Transplant. 2007, 7, 1822-1831.
71
Jaggi R, Addison RS, King AR, Suthers BD, Dickinson RG. Conjugation of desmethylnaproxen in the rat--a novel acyl glucuronide-sulfate diconjugate as a major biliary metabolite. Drug Metab Dispos. 2002, 30, 161-166.
King AR, Dickinson RG. Studies on the reactivity of acyl glucuronides--IV. Covalent binding of diflunisal to tissues of the rat. Biochem Pharmacol. 1993, 45, 1043-1047.
King AR, Dickinson RG. The utility of the bile-exteriorized rat as a source of reactive acyl glucuronides: studies with zomepirac. J Pharmacol Toxicol Methods. 1996, 36, 131-136.
Kittlemann M., Rheinegger U., Espigat A., Oberer L., Aichholz R., Francotte E., Ghisalba O. Preparative enzymatic synthesis of the acyl glucuronide of mycophenolic acid. AdV Synth Catal. 2003, 345, 825-829. Kobayashi M, Saitoh H, Kobayashi M, Tadano K, Takahashi Y, Hirano T. Cyclosporin A, but not tacrolimus, inhibits the biliary excretion of mycophenolic acid glucuronide possibly mediated by multidrug resistance-associated protein 2 in rats. J Pharmacol Exp Ther. 2004, 309, 1029-1035.
Kuypers DR, Vanrenterghem Y, Squifflet JP, Mourad M, Abramowicz D, Oellerich M, Armstrong V, Shipkova M, Daems J. Twelve-month evaluation of the clinical pharmacokinetics of total and free mycophenolic acid and its glucuronide metabolites in renal allograft recipients on low dose tacrolimus in combination with mycophenolate mofetil. Ther Drug Monit. 2003, 25, 609-622.
Liu JH, Malone RS, Stallings H and Smith PC. Influence of Renal Failure in Rats on the Disposition of Salicyl Acyl Glucuronide and Covalent Binding of Salicylate to Plasma Proteins. J Pharmacol Exp Ther. 1996, 278, 277-283.
Mayer S, Mutschler E, Benet LZ, Sphahn-Langguth H. In vitro and in vivo irreversible plasma protein binding of beclobric acid enantiomers. Chirality. 1993, 5, 120-125.
Miles KK, Kessler FK, Smith PC, Ritter JK. Characterization of rat intestinal microsomal UDP-glucuronosyltransferase activity toward mycophenolic acid. Drug Metab Dispos. 2006, 34, 1632-1639.
Mizuma T, Benet LZ, Lin ET. Interaction of human serum albumin with furosemide glucuronide: a role of albumin in isomerization, hydrolysis, reversible binding and irreversible binding of a 1-O-acyl glucuronide metabolite. Biopharm Drug Dispos. 1999, 20, 131-136.

72
Morath C, Schwenger V, Beimler J, Mehrabi A, Schmidt J, Zeier M, Muranyi W. Antifibrotic actions of mycophenolic acid. Clin Transplant. 2006, 20 Suppl 17, 25-29.
Oellerich M, Shipkova M, Schütz E, Wieland E, Weber L, Tönshoff B, Armstrong VW. Pharmacokinetic and metabolic investigations of mycophenolic acid in pediatric patients after renal transplantation: implications for therapeutic drug monitoring. Ther Drug Monit. 2000, 22, 20-26. Erratum in: Ther Drug Monit. 2000, 22, 500.
Ritter JK. Intestinal UGTs as potential modifiers of pharmacokinetics and biological responses to drugs and xenobiotics. Expert Opin Drug Metab Toxicol. 2007, 3, 93-107.
Shipkova M, Armstrong VW, Oellerich M, Wieland E. Acyl glucuronide drug metabolites: toxicological and analytical implications. Ther Drug Monit. 2003, 25, 1-16.
Shipkova M, Armstrong VW, Schneider T, Niedmann PD, Schütz E, Wieland E, Oellerich M. Stability of mycophenolic acid and mycophenolic acid glucuronide in human plasma. Clin Chem. 1999, 45, 127-129.
Shipkova M, Armstrong VW, Weber L, Niedmann PD, Wieland E, Haley J, Tönshoff B, Oellerich M. Pharmacokinetics and protein adduct formation of the pharmacologically active acyl glucuronide metabolite of mycophenolic acid in pediatric renal transplant recipients. Ther Drug Monit. 2002, 24, 390-399.
Shipkova M, Beck H, Voland A, Armstrong VW, Gröne HJ, Oellerich M, Wieland E. Identification of protein targets for mycophenolic acid acyl glucuronide in rat liver and colon tissue. Proteomics. 2004, 4, 2728-2738.
Shipkova M, Schütz E, Armstrong VW, Niedmann PD, Oellerich M, Wieland E. Determination of the acyl glucuronide metabolite of mycophenolic acid in human plasma by HPLC and Emit. Clin Chem. 2000, 46, 365-372.
Shipkova M, Wieland E, Schütz E, Wiese C, Niedmann PD, Oellerich M, Armstrong VW. The acyl glucuronide metabolite of mycophenolic acid inhibits the proliferation of human mononuclear leukocytes. Transplant Proc. 2001, 33, 1080-1081.
Schütz E, Shipkova M, Armstrong VW, Wieland E, Oellerich M. Identification of a pharmacologically active metabolite of mycophenolic acid in plasma of transplant recipients treated with mycophenolate mofetil. Clin Chem. 1999, 45, 419-422.
73
Sinclair KA, Caldwell J. The formation of beta-glucuronidase resistant glucuronides by the intramolecular rearrangement of glucuronic acid conjugates at mild alkaline pH. Biochem Pharmacol. 1982, 31, 953-957.
Smith PC, Benet LZ, McDonagh AF. Covalent binding of zomepirac glucuronide to proteins: evidence for a Schiff base mechanism. Drug Metab Dispos. 1990, 18, 639-644. Smith PC and Liu JH. Covalent binding of suprofen acyl glucuronide to albumin in vitro. Xenobiotica. 1993, 23, 337-348.
Smith PC, McDonagh AF, Benet LZ. Irreversible binding of zomepirac to plasma protein in vitro and in vivo. J Clin Invest. 1986, 77, 934-9
Smith PC, Wang C. Nonenzymic glycation of albumin by acyl glucuronides in vitro. Comparison of reactions with reducing sugars. Biochem Pharmacol. 1992, 44, 1661-8.
Spahn-Langguth H, Dahms M, Hermening A. Acyl glucuronides: covalent binding and its potential relevance. Adv Exp Med Biol. 1992, 387, 313-328.
Staatz CE, Tett SE. Clinical pharmacokinetics and pharmacodynamics of mycophenolate in solid organ transplant recipients. Clin Pharmacokinet. 2007, 46, 13-58.
Stern ST, Tallman MN, Miles KK, Ritter JK, Dupuis RE, Smith PC. Gender-related differences in mycophenolate mofetil-induced gastrointestinal toxicity in rats. Drug Metab Dispos. 2007, 35, 449-454.
Treinen-Moslen M, Kanz MF. Intestinal tract injury by drugs: Importance of metabolite delivery by yellow bile road. Pharmacol Ther. 2006, 112, 649-667.
Wade LT, Kenna JG, Caldwell J. Immunochemical identification of mouse hepatic protein adducts derived from the nonsteroidal anti-inflammatory drugs diclofenac, sulindac, and ibuprofen. Chem Res Toxicol. 1997, 10, 546-555.
Wang M, Dickinson RG. Bile duct ligation promotes covalent drug-protein adduct formation in plasma but not in liver of rats given zomepirac. Life Sci. 2000, 68, 525-537.
Wieland E, Shipkova M, Schellhaas U, Schütz E, Niedmann PD, Armstrong VW, Oellerich M (2000) Induction of cytokine release by the acyl glucuronide of mycophenolic acid: a link to side effects? Clin Biochem. 33: 107-113.
Williams AM, Dickinson RG. Studies on the reactivity of acyl glucuronides--VI. Modulation of reversible and covalent interaction of diflunisal acyl glucuronide
74
and its isomers with human plasma protein in vitro. Biochem Pharmacol. 1994, 47, 457-467.
Williams AM, Worrall S, De Jersey J, Dickinson RG. Studies on the reactivity of acyl glucuronides--VIII. Generation of an antiserum for the detection of diflunisal-modified proteins in diflunisal-dosed rats. Biochem Pharmacol. 1995, 49, 209-217.
Wiwattanawongsa K, Heinzen EL, Kemp DC, Dupuis RE, Smith PC. Determination of mycophenolic acid and its phenol glucuronide metabolite in human plasma and urine by high-performance liquid chromatography. J Chromatogr B Biomed Sci Appl. 2001, 763, 35-45.
Worrall S, Dickinson RG. Rat serum albumin modified by diflunisal acyl glucuronide is immunogenic in rats. Life Sci. 1995, 56, 1921-1930.
Young CJ and Sollinger HW. RS-61443: A New Immunosuppressive Agent. Transplant Proc. 1994, 26, 3144-3146.
Zwerner J, Fiorentino D, Mycophenolate mofetil. Dermatol Ther. 2007, 20, 229-238.
75
CHAPTER 3
QUANTIFICATION OF UDP-GLUCURONOSYLTRANSFERASE ENZYME EXPRESSION LEVELS WITHIN HUMAN LIVER, INTESTINAL AND KIDNEY
MICROSOMES USING nanoLC TANDEM MASS SPECTROMETRY
76
A. INTRODUCTION
UGT enzymes catalyze the formation of glucuronide conjugates of Phase
II metabolism. Through the actions of the cofactor uridine disphosphate
glucuronide acid (UDPGa) and UGT enzymes, glucuronidation encompasses the
most common and clinically important of the Phase II metabolic pathways. In
humans, the UGT genome consists of two families and three subfamilies. The
UGT1A locus found on chromosome 2q37 encodes for nine functional enzymes
located throughout the body and is responsible for converting a large number of
endogenous and exogenous compounds to more hydrophilic conjugates,
ultimately for excretion outside the body (Owens and Ritter, 1995). Traditional
quantification methods have been used to evaluate relative hUGT levels
including Western blots, ELISA and RT-PCR studies, but these methods lack the
sensitivity, reproducibility and dynamic range to properly examine expression.
Furthermore, the correlation between mRNA levels measured using RT-PCR and
protein expression is often poor, making these methods unreliable for evaluation
of protein expression in biological systems (Izukawa et al., 2009). In addition, the
high degree of sequence homology between hUGT enzymes (as high as 94% in
some isoforms) prevents the raising of antibodies against specific UGT isoforms,
with few exceptions (Tukey et al., 2000).
Traditional approaches to protein quantification include differential gel
electrophoresis (DIGE) which involves separation through 2D-gel electrophoresis
followed by fluorescent tagging of lysine side chains (Bantscheff et al., 2007).
While multiple proteins may be monitored through the DIGE technique through
77
the use of alternate fluorescent tags, it is often difficult to distinguish high and low
molecular weight proteins, and DIGE often lacks the sensitivity to detect low
abundant proteins (Wu et al., 2006). In recent years, advances in electrospray
ionization (ESI), coupled with sensitive tandem mass spectrometry (MS/MS), has
allowed for the development of several different approaches at relative
quantification of proteins. Methods for relative protein quantification within cells
include in vivo metabolic labeling within enriched media (C13, N15, O18), followed
by digestion and quantification of labeled peptides to evaluate changing
expression of proteins of interest (Beynon et al., 2005; Gu et al., 2004; Hsu et al.,
2005; Huttlin et al., 2009). These methods have been used to determine
expression changes in myoglobins, immune response, HIV levels, glycoproteins
and mitochondrial proteins. Recently, label-free techniques have also been used
that can evaluate global expression changes, but these methods are not
commonly employed due to variability across instrumentation platforms and ion
suppression from complex matrices (Bantscheff et al., 2007).
Along with the use of capillary LC-MS/MS for relative quantification for
global proteomics, stable isotope internal standards also have been developed
for targeted absolute quantitative proteomics. Labeling techniques such as ICAT
and iTRAQ can be utilized for relative quantification or for absolute quantification
if a known amount of targeted peptide is added during sample preparation (Gygi
et al., 1999; Hardt et al., 2005; Jenkins et al., 2006; Zieske et al., 2006).
However, because ICAT reagents only target peptide with cysteine groups, the
number of potential targeted peptides is limited (Wu et al., 2006). Furthermore,
78
iTRAQ methods can encounter difficulties in precursor ion selection in complex
matrices (Wu et al., 2006). Although both ICAT and iTRAQ methods have
greatly increased sensitivity and selectivity of peptide/protein analysis when
compared with gel based methods further improvement and more general
approaches are being developed (Wu et al., 2006).
Other approaches using stable isotope labels have had more recent
success with quantifying proteins and peptides. Barr et al. were able to
accurately quantify apolipoprotein A-1 using unique heavy-labeled peptides (Barr
et al., 1996). Following these initial experiments, both C-reactive protein (CRP)
and PSA were quantified within human plasma by preselecting heavy
isotope-labeled internal standards added prior to a tryptic protein digestion
(Barnidge et al., 2004; Kuhn et al., 2004). Using sensitive capillary LC coupled
with MS/MS, it was found that using isotope dilution mass spectrometry, the
concentration levels of PSA and CRP were comparable to immunoassay with
lower detection limits (Barnidge et al., 2004; Kuhn et al., 2004). These methods
fostered the development of stable isotope labeling with amino acids in cell
culture (SILAC), absolute quantification (AQUA) and Quantitative Concatamer
(QCAT) stable isotope standards and have been applied more recently for
determining gonadotropin releasing hormone (GnRH) across different MS
platforms (Thomas et al., 2008). While QCAT standards require development of
recombinant protein expression in cell lines to produce heavy labeled internal
standard proteins for quantification, heavy isotope-labeled peptides can be
79
readily prepared following preselection using standard peptide synthesis
methods.
The continued development of quantitative proteomics is significant for
biological scientists interested in understanding precise levels of protein
expression. By being able to precisely quantify enzymes involved in drug
metabolism, scientists will be better able to describe differences between species
to evaluate the effects of induction and inhibition, and to provide more accurate in
vitro and in vivo predictions of drug elimination. Furthermore, the use of targeted
absolute quantitative proteomics also may be used for quantification of enzymes
for which specific antibodies are unavailable and for proteins yet to be
discovered. These techniques will continue to open new avenues for drug
metabolism studies that will now be able to directly establish relationships
between enzymes and metabolite levels.
While capillary LC connected to triple quadrupole tandem MS is common
instrumentation for MRM quantification, other platforms have been successfully
implemented for these purposes. LC-MS/MS has been applied using quadrupole
time of flight mass spectrometry (Q-TOF) for both metabolite detection and
peptide quantification (Jeanville et al., 2000; Spaulding et al., 2006). In addition,
a new MS platform that couples capillary LC to a linear ion trap time of flight
mass spectrometer (LIT-TOF) from Hitachi Hi-Technologies has been utilized for
both qualitative and quantitative mass spectrometry (Deguchi et al., 2007; Ito H
et al., 2006; Ito S et al., 2008). Most recently, Ito et al. were able to successfully
quantify a novel glycosylated phospholipid and demonstrate that the LIT-TOF
80
platform was not only very sensitive, but also has a dynamic range approaching
three orders of magnitude (Ito S et al., 2008).
We have previously demonstrated the utility of quantifying hUGTs using
stable isotope standards and tandem MS (Fallon et al., 2008). While this method
was successfully applied for quantification of two of the nine active human UGT
isoforms, it is necessary to extend this method for the remaining hUGT1A
isoforms to not only better examine the relationship within and across species,
but to also be able to quantify other UGT1A isoforms that lack a specific
antibodies. By taking advantage of the increased sensitivity offered by capillary
LC compared to standard bore HPLC and extending the LC gradient for better
separation of labeled and unlabeled peptides, we will be able to selectively
quantify all hUGT1As in a single chromatographic run. Here we present a
method to quantify the entire hUGT1A proteome of nine active UGTs using
capillary LC coupled to a LIT-TOF mass spectrometer using the extracted MRM
mode.
B. METHODS
Materials
Analytical grade acetonitrile and methyl alcohol (anhydrous) were
purchased from Fisher Scientific Co. (Pittsburg, PA). Ammonium bicarbonate,
dithiothreitol, iodoacetamide, ammonium hydroxide, formic acid, 2,2,2-
trifluoroethanol (TFE) and TPCK (L-1-tosylamido-2-phenylethyl chloromethyl
ketone) treated trypsin from bovine pancreas (≥ 10,000 BAEE units/mg protein)
were purchased from Sigma-Aldrich Co. (St. Louis, MO). Bond Elut solid phase
81
extraction cartridges (C18 100mg, 1mL) were purchased from Varian,
Inc. Recombinant UGTs 1A1, 1A3, 1A4, 1A6, 1A7, 1A8, 1A9, 1A10 and control
supersomes were purchased from BD Biosciences (San Jose, CA). Human liver
microsomes (HLMs) (20 mg/mL) were purchased from BD Biosciences (pool of
33) and Xenotech LLC (Lenexa, KA) (pool of 50). A human liver microsome
library of individual donors (n=10, 20 mg/mL) was purchased from Human
Biologics International (Scottsdale, AZ). Human kidney microsomes were
purchased from BD Biosciences (pool of 33, 20 mg/mL) and a human intestinal
microsome library of individual donors (n=3, mixed gender) were graciously
donated by Dr. Mary Paine (UNC-Chapel Hill, Chapel Hill, NC) (Paine et al.,
2006). Pooled human intestinal microsomes (HIMs) were obtained from
Xenotech LLC (Lenexa, KA) (8 donors, mixed gender). Protein concentrations
were determined using the Pierce BCA Protein assay Kit, in which bovine serum
albumin is used as the standard.
Instrumentation
Samples were analyzed using capillary LC attached to a linear ion trap
time of flight (LIT-TOF) mass spectrometer (Hitachi High-Technologies, Tokyo,
Japan). The LC column was a monolithic C-18 column (GL Sciences, Tokyo,
Japan, 150 mm, 0.075 mm ID). The instrument was operated in positive ion
mode for multiple reaction monitoring (MRM) analysis. Data analysis was
performed using NanoFrontier LD-ECD Data Processing software (Hitachi High
Technologies, Tokyo, Japan)
82
Stable Isotope Labeled Internal Standards
Synthetic peptide standards (8-15 mer), each containing one amino acid
heavy labeled with 13C [98%] and 15N [95%], were purchased from Thermo
Electron (Thermo Scientific, Waltham, MA) using methods and selection criteria
as previously reported (Fallon et al., 2008). For each UGT isoform, two unique
peptides were purchased for analysis and validation. The peptides were selected
according to manufacturer recommendations and previously published guidelines
(Beynon et al., 2005; Gerber et al., 2003). Amino acid sequences for the nine
UGT1A isoforms were obtained using the Universal Protein Resource Knowledge
Base (UniProtKB). Peptide uniqueness of tryptic fragments was verified by NCBI
Blast (National Center for Biotechnology Information Basic Local Alignment
Search Tool). Amino acid analysis on each peptide to determine sample purity
which was conducted at the Center for Structural Biology, Wake Forest
University School of Medicine, Winston-Salem, NC. Some amino acids were
excluded from the analysis because of known acid hydrolysis effects (e.g., bonds
between isoleucine and valine [peptide 3] are not easily broken) and the possible
cyclization and isomerization of aspartic acid adjacent to glycine or isoleucine
(peptides 2 and 3).
Known variable single nucleotide polymorphisms (SNPs) were also
considered during peptide selection. While at the time of purchase there were no
known interferences with SNPs along the targeted protein sequence, reports
83
indicate that there are potential conflicts due to polymorphisms for UGT1A1
(Peptide 2, frequency <1%), UGT1A6 (Peptide 4, frequency ~4% in Caucasians)
and UGT1A7 (Peptide 11, frequency ~2% in African Americans) (Kadakol et al.,
2000; Krishnaswamy et al., 2006; Villeneuve et al., 2007). Furthermore, while it
is initially intended to obtain two unique peptides per isoform, the dearth of
unique peptides for UGT1A8 and UGT1A9 that are amendable to the LC-MS
approach only provided one unique peptide for these isoforms along with one
peptide that is shared between the two enzymes.
Sample Preparation
Aliquots of 50 µg of microsomal protein, recombinant enzyme or UGT
control supersomes were denatured and digested as previously reported with
some modifications (Fallon et al., 2008). Samples of digested protein matrix with
heavy labeled peptides added as internal standards, 10 pmol for each peptide,
excluding peptide 16 and 17, (Table 3.1) and the residual acetonitrile was
removed by evaporation under nitrogen for ~5 min were then denatured and
reduced by heating at 95 ºC for 10 min in 5 mM dithiothreitol (sample volume 90
µL; buffer 50 mM ammonium bicarbonate). This was followed by alkylation with
100 mM iodoacetamide stock for 20 min in the dark. Samples were dissolved in
150 µL 50 mM ammonium bicarbonate (volume brought to 150 μL with HPLC
water); with trypsin enzyme/protein ratio = 1:50; for 4 h at 37 ºC. The reaction
was then quenched by addition of 50 µL acetonitrile. Following centrifugation at
1000g for 10 min, the organic content was removed by evaporation under
nitrogen for ~10 min. An aliquot of 0.9 mL of 50 mM ammonium bicarbonate was

84
then added in preparation for solid phase extraction. SPE cartridges were
conditioned with methanol and distilled water. Samples were then added and the
cartridges were washed with 1 mL 10 mM ammonium acetate (pH 3) then eluted
with acetonitrile/25 mM formic acid (40:60). The eluate was evaporated to
dryness under nitrogen at 42ºC in a water bath, and samples were reconstituted
with 250 μL (80:20) acetonitrile/25 mM formic acid at pH 3 (pH was adjusted to 3
by drop wise addition of ammonium hydroxide) to minimize sample loss from
glass tubes. Following initial reconstitution, samples were transferred and dried
under nitrogen at 42 ºC, then reconstituted in 50 μL (15:85) acetonitrile/25 mM
formic acid at pH 3. Samples were stored at -20 ºC until analyzed by LC-MS/MS.
MRM Selection
All peptide heavy labeled standards were directly infused into the LIT-TOF
mass spectrometer at a rate of 2 μL/min for MRM and MS optimization. Upon
infusion, a vast majority of the peptide standards were doubly charged. Peptide
5, 16 and 17, were found to be triply charged or greater and were ultimately
excluded because of inadequate MRM selection. For each peptide, two MRMs
above 500 m/z were selected to be used for quantification. MRM selections were
then confirmed following an optimized LC gradient elution of a solution of
10 pmole aliquots of each selected peptide. These peptides were then subject to
MRM spectrum analysis using the LIT-TOF in scanning mode.
85
LC/MS Conditions
The mobile phase used for analysis consisted of 25 mM formic acid in
water (solvent A) and acetonitrile (solvent B). A NanoFrontier L series (Hitachi-
High Technologies, Tokyo, Japan) using a nano-flow HPLC was coupled to an
AT10PV nano-flow gradient generator and connected to a LIT-TOF instrument
with an electrospray ion source (Deguchi et al., 2004). An Upchurch M-435
microinjection valve (Upchurch Scientific, Oak Harbor, WA) was used as the
sample injector (Ito et al. 2008). A 1 μL injection (approximately 0.5 μg of
digested protein) was loaded onto a 5 cm trap column (C18, 2.1 mm ID, 5 μ
particle size) at a rate of 10 μL /min for 4 minutes. The sample was then
transferred onto the analytical column and analyzed under the following linear
gradient conditions, 0 min, 5% B; 30 min, 55% B; 30.1 min, 100% B; 40 min,
100% B; 40.1 min, 5% B and then equilibrated until 65 min. The gradient pump
maintained a 100 μL/min flow rate while the nanoflow pump was run at 200
nL/min during analysis. MS conditions were similar to a previous report by Ito et
al. (Ito et al., 2008) except the AP1 temperature was set a 120ºC, with an
isolation time of 50 ms.
Calibration Curves
Recombinant enzymes of all UGT1A isoforms excluding 1A5 (not
commercially available) were used to establish recombinant enzyme calibration
curve points representative of 0.19 μg, 0.75 μg, 1.5 μg, 3.0 μg and 6.0 μg of
recombinant microsomal protein. To keep volumes consistent for the tryptic
86
digests, each recombinant enzyme was taken through a series of serial dilutions
using tris buffer, pH 7.4. Prior to the tryptic digestion, 10 pmol of each heavy
labeled peptide standard was added and the response ratio between the labeled
and unlabeled peptides was used to establish a calibration curve and to verify
linearity. Equality of response between the labeled and unlabeled peptides along
with complete tryptic digestion was assumed in the creation of the calibration
curves. Calibration curves were constructed by comparing response of unlabeled
peak area to labeled peak area for each MRM selected. These MRMs standard
curves were calculated in units of pmol/mg protein (microsomal protein) and used
the response ratio between unlabeled and labeled peptides in the unknown
microsomal protein fitted to the calibration curves to calculate enzyme
concentrations.
Ion Suppression/Matrix Effects
Aliquots containing 25 μg of each recombinant enzyme microsomes were
digested as described earlier in two separate groups in triplicate. The internal
standard of heavy labeled peptides was added at either before the tryptic digest
or following reconstitution. The internal standard solution was also added to a
0.1 mL aliquot of the reconstitution buffer, in triplicate, with peak areas of the
heavy peptides serving as a baseline.

87
Interday and Intraday Variability
To examine intraday variability, five replicate calibration curves along with
human liver, intestinal and kidney microsomes (n=5) were digested within the
same day and analyzed on the nanoLC LIT-TOF instrumentation. Individual
peptide measurements for four of the UGT1A isoforms using two peptides for
quantification were averaged to obtain final enzyme expression levels (Table
3.5). Interday variability experiments were carried out in a similar manner with
five replicate standard curves along with digests of human liver microsomes
analyzed over five separate analyses and days.
Human Liver and Intestinal Microsomal Library
To compare the newly established method to the initial method
established by Fallon et al., a library of ten individual liver microsomal donors
were digested and analyzed in duplicate (Fallon et al., 2008). Individual donors
of intestinal microsomes (n=3) were also digested and analyzed in duplicate
using the response ratios generated to compare against calibration curves
analyzed in duplicate and prepared within the same day. For the human liver
microsomal library, the enzyme expression levels of hUGT1A1 and hUGT1A6
were compared against those results obtained by the previous assay (Fallon et
al., 2008).
88
C. RESULTS
MRM Scheduling
Following initial scouting gradient runs and MRM optimization on the LIT-
TOF, it was found that peptides of interest eluted between 17 and 32 minutes.
Further increases in the %B at the beginning of the LC gradient or increases in
slope of the gradient to decrease run times resulted in band broadening or loss of
signal. Peptides eluted consistently with six separate time windows (T1 0-17 min,
T2 17-19.5 min, T3 19.5-22.0 min, T4 22.1-26.4 min and T5 26.5-28 min, T6 28.1-
32 min) and were optimized using MRM scheduling with NanoFrontier LD-ECD
software. Extraction of selected MRMs from a single chromatographic run is
shown in Figure 3.1. Peptide 5 and 14 were not consistently detectable using the
LC gradient due to insufficient singly charged MRMs and were excluded from
sample analysis. MRM time segments assigned are listed in Table 3.2 and were
used for the remaining analyses.
Calibration Curves
Calibrants for each of the hUGT isoforms were quantified using
procedures described in METHODS. Initial curves were converted to pmol/mg
protein units for enzyme concentration calculations. Each peptide produced two
MRM calibration curves resulting in as many as four curves per UGT isoform.
For each interday enzyme measurement, curves performed in duplicate
produced replicate expression data which was then averaged between the two
MRMs per peptide to obtain final enzyme concentration levels. Calibration
89
curves produced a linear range between 0.19 μg and 6.0 μg of recombinant
microsomal matrix with a LOD approximately one third of the lowest
concentration on the calibration curve (approximately 1 pmol enzyme/mg
protein). Calibration curves were generally similar between MRMs for each
peptide, and MRM ratios between labeled standards and unlabeled peptide were
averaged to generate expression ratios (Table 3.5). Any peptides that did not
generate quality product ion scans, stable and reproducible LC retention times or
sufficient sensitivity or precise quantification (%C.V. <25% with repeat sampling)
were excluded from all hUGT enzymatic analyses. All R2 values for calibration
curves were between 0.96 and 0.99 including the hUGT1A9 intraday calibration
curve indicated in Fig (3.3).
Ion Suppression
Ion suppression varied between time segments, but was most evident for
segment 4 and 6. While peptide 1 demonstrated significant ion suppression
(92% for both MRMs), most ions eluting during segment 4 and 6 demonstrated
>75% ion suppression and ion some cases ion suppression was >90% (Table
3.2). Peptides eluting early benefited from minimal ion suppression and
recovery of these peptides was generally >75%, which is similar to our previous
assay validation studies (Fallon et al., 2008). While ion suppression levels were
slightly lower in the 25 μg recombinant microsomal protein samples, compared to
the human liver microsomal protein samples, the recombinant microsomal
protein ion suppression studies are presented due to the limitations in linearity
90
discovered in the calibration curves. Because the linear range of the method
was established using the calibrations curves constructed with digests of
recombinant microsomal protein, the recombinant microsomal protein matrix was
used to determine loss of signal due to ion suppression.
Intraday and Interday Variability
Intraday variability measurements (n=5) for the hUGTs provided
reproducible results with minimal variation (<25%) between samples. hUGT1A1
enzyme levels were 22.7 pmol/mg protein in human liver microsomes (Table 3.3)
which is similar to what we reported earlier (Fallon et al., 2008). hUGT1A6 levels
were 8.5 pmol/mg protein (Table 3.3). However, hUGT1A6 demonstrated less
variability (16.7% C.V. compared to 19.9% of hUGT1A1, (Table 3.3)) but was not
as reproducible as the other isoforms found in the liver. Peptides for isoforms
hUGT1A7, hUGT1A8 and hUGT1A10 were below detection limits in the liver,
which agree with previous reports of their lack of UGT liver expression based on
mRNA (Ohno et al., 2009; Strassburg et al., 1997; Tukey et al., 2000). In
addition, UGT1A3, UGT1A4 and UGT1A5 were below detection limits in the
intestine (Ohno et al., 2009; Tukey et al., 2000). In contrast, UGT1A3 and
UGT1A5 were the only isoforms below detection limits in the kidney. With few
exceptions, all C.V. values were below 20% for each of the UGT enzymes (Table
3.4). Intraday variability studies produced similar results both with regards to
variability and expression (Table 3.3).
91
Human Liver, Intestine and Kidney UGT Expression
The data from liver microsomes indicated that hUGT1A1, hUGT1A9 and
UGT1A5 consistently had the highest enzyme levels among the UGTs. While
UGT1A3, UGT1A4 and UGT1A6 were readily detectable, their expression levels
(3.2 pmol/mg protein for 1A3 to 8.5 pmol/mg protein for 1A6, (Table 3.3) were
generally 50-75% lower when compared to the other three enzymes. UGT1A1
expression was the highest within the liver along with UGT1A3, UGT1A5 and
UGT1A6. UGT1A8 was found at its highest levels within the intestine while
UGT1A7, UGT1A9 and UGT1A10 were most extensively expressed in the
kidney.
Human Liver and Intestinal Libraries
Expression studies from the human liver and intestinal libraries are shown
in Table (3.4). UGT1A1 expression varied five fold (7.0 pmol/mg protein to 32.6
pmol/mg protein) which was the general trend for liver expression of the other
measurable isoforms. An exception was UGT1A9, where variation was more
than ten fold in the liver (9.0 pmol/mg protein to 96.4 pmol/mg protein in liver).
Unlike in the liver library, the intestinal library enzyme expression data indicated
less variability between patients. Most isoforms demonstrated between 1.5 to 3
fold variability between the lowest and highest concentration (Table 3.4). One
exception was UGT1A8 which demonstrated five fold variability (1.9 pmol/mg
92
protein to 9.4 pmol/mg protein) in the intestine. Isoforms that were determined
to be below detection limits within the pooled microsomal studies were also not
detected within any of the individual library specimens.
To further validate the LIT-TOF based assay for UGT expression,
UGT1A1 and UGT1A6 enzyme rank orders and enzymatic levels were compared
between the current assay and the UGT1A1/1A6 assay previously developed on
the ABI 3000 (Fallon et al., 2008). Both correlation plots indicated a strong
correlation (r=.92 for UGT1A1, r=.75 for UGT1A6, Fig. (3.4). Furthermore, the
rank orders for each isoform within the library specimens were very similar and
most of the enzyme levels validated in the previous method varied <20% from
the values of the current assay (Fallon et al., 2008).
Recombinant UGT Enzyme Concentrations
Using the calibration curves generated following digestion of recombinant
microsomal protein, calibration curves were extrapolated to obtain UGT isoform
expression levels in the recombinants. Based on the calibration curves, isoform
concentration levels ranged from 0.83 nmol/mg protein to 2.74 nmol/mg protein
indicating that recombinant microsomal protein stocks contained approximately
5-20% recombinant UGT protein (Table 3.7). Generally, isoforms expressed at
high levels within the tested microsomal samples were found in high
concentrations in the recombinants with the exception of UGT1A4 whose
concentration in the recombinant microsomal protein stocks (2.23 nmol/mg
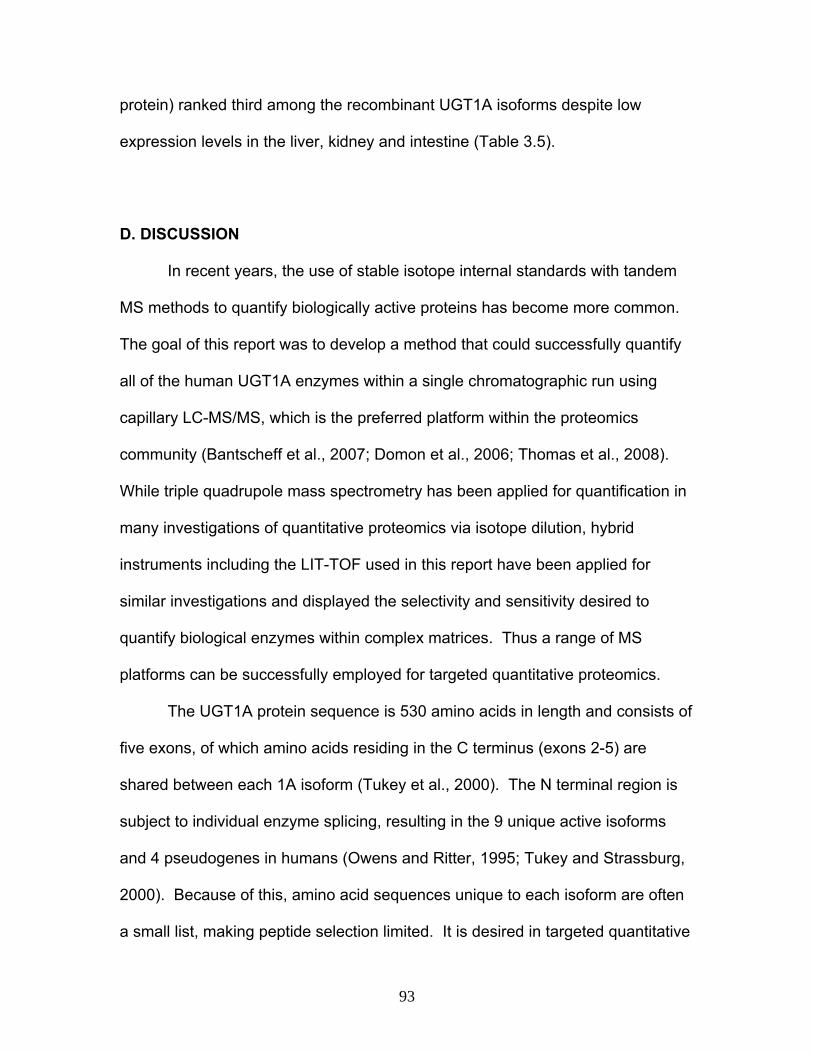
93
protein) ranked third among the recombinant UGT1A isoforms despite low
expression levels in the liver, kidney and intestine (Table 3.5).
D. DISCUSSION
In recent years, the use of stable isotope internal standards with tandem
MS methods to quantify biologically active proteins has become more common.
The goal of this report was to develop a method that could successfully quantify
all of the human UGT1A enzymes within a single chromatographic run using
capillary LC-MS/MS, which is the preferred platform within the proteomics
community (Bantscheff et al., 2007; Domon et al., 2006; Thomas et al., 2008).
While triple quadrupole mass spectrometry has been applied for quantification in
many investigations of quantitative proteomics via isotope dilution, hybrid
instruments including the LIT-TOF used in this report have been applied for
similar investigations and displayed the selectivity and sensitivity desired to
quantify biological enzymes within complex matrices. Thus a range of MS
platforms can be successfully employed for targeted quantitative proteomics.
The UGT1A protein sequence is 530 amino acids in length and consists of
five exons, of which amino acids residing in the C terminus (exons 2-5) are
shared between each 1A isoform (Tukey et al., 2000). The N terminal region is
subject to individual enzyme splicing, resulting in the 9 unique active isoforms
and 4 pseudogenes in humans (Owens and Ritter, 1995; Tukey and Strassburg,
2000). Because of this, amino acid sequences unique to each isoform are often
a small list, making peptide selection limited. It is desired in targeted quantitative
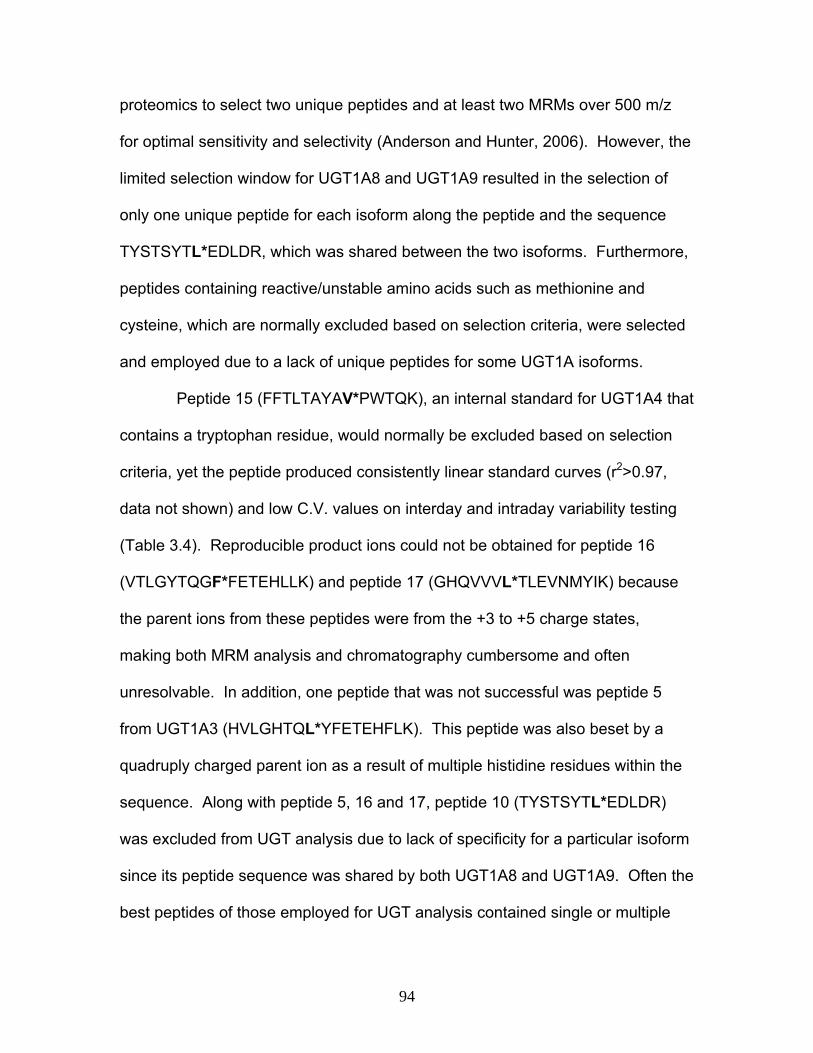
94
proteomics to select two unique peptides and at least two MRMs over 500 m/z
for optimal sensitivity and selectivity (Anderson and Hunter, 2006). However, the
limited selection window for UGT1A8 and UGT1A9 resulted in the selection of
only one unique peptide for each isoform along the peptide and the sequence
TYSTSYTL*EDLDR, which was shared between the two isoforms. Furthermore,
peptides containing reactive/unstable amino acids such as methionine and
cysteine, which are normally excluded based on selection criteria, were selected
and employed due to a lack of unique peptides for some UGT1A isoforms.
Peptide 15 (FFTLTAYAV*PWTQK), an internal standard for UGT1A4 that
contains a tryptophan residue, would normally be excluded based on selection
criteria, yet the peptide produced consistently linear standard curves (r2>0.97,
data not shown) and low C.V. values on interday and intraday variability testing
(Table 3.4). Reproducible product ions could not be obtained for peptide 16
(VTLGYTQGF*FETEHLLK) and peptide 17 (GHQVVVL*TLEVNMYIK) because
the parent ions from these peptides were from the +3 to +5 charge states,
making both MRM analysis and chromatography cumbersome and often
unresolvable. In addition, one peptide that was not successful was peptide 5
from UGT1A3 (HVLGHTQL*YFETEHFLK). This peptide was also beset by a
quadruply charged parent ion as a result of multiple histidine residues within the
sequence. Along with peptide 5, 16 and 17, peptide 10 (TYSTSYTL*EDLDR)
was excluded from UGT analysis due to lack of specificity for a particular isoform
since its peptide sequence was shared by both UGT1A8 and UGT1A9. Often the
best peptides of those employed for UGT analysis contained single or multiple
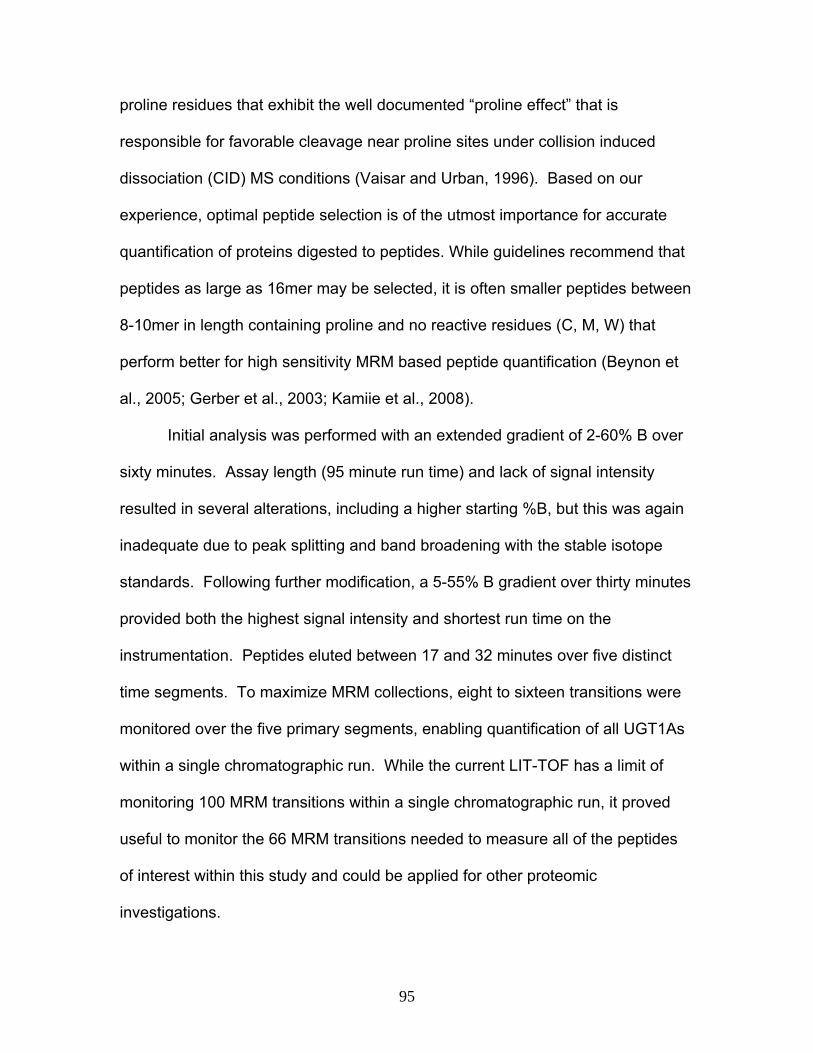
95
proline residues that exhibit the well documented “proline effect” that is
responsible for favorable cleavage near proline sites under collision induced
dissociation (CID) MS conditions (Vaisar and Urban, 1996). Based on our
experience, optimal peptide selection is of the utmost importance for accurate
quantification of proteins digested to peptides. While guidelines recommend that
peptides as large as 16mer may be selected, it is often smaller peptides between
8-10mer in length containing proline and no reactive residues (C, M, W) that
perform better for high sensitivity MRM based peptide quantification (Beynon et
al., 2005; Gerber et al., 2003; Kamiie et al., 2008).
Initial analysis was performed with an extended gradient of 2-60% B over
sixty minutes. Assay length (95 minute run time) and lack of signal intensity
resulted in several alterations, including a higher starting %B, but this was again
inadequate due to peak splitting and band broadening with the stable isotope
standards. Following further modification, a 5-55% B gradient over thirty minutes
provided both the highest signal intensity and shortest run time on the
instrumentation. Peptides eluted between 17 and 32 minutes over five distinct
time segments. To maximize MRM collections, eight to sixteen transitions were
monitored over the five primary segments, enabling quantification of all UGT1As
within a single chromatographic run. While the current LIT-TOF has a limit of
monitoring 100 MRM transitions within a single chromatographic run, it proved
useful to monitor the 66 MRM transitions needed to measure all of the peptides
of interest within this study and could be applied for other proteomic
investigations.
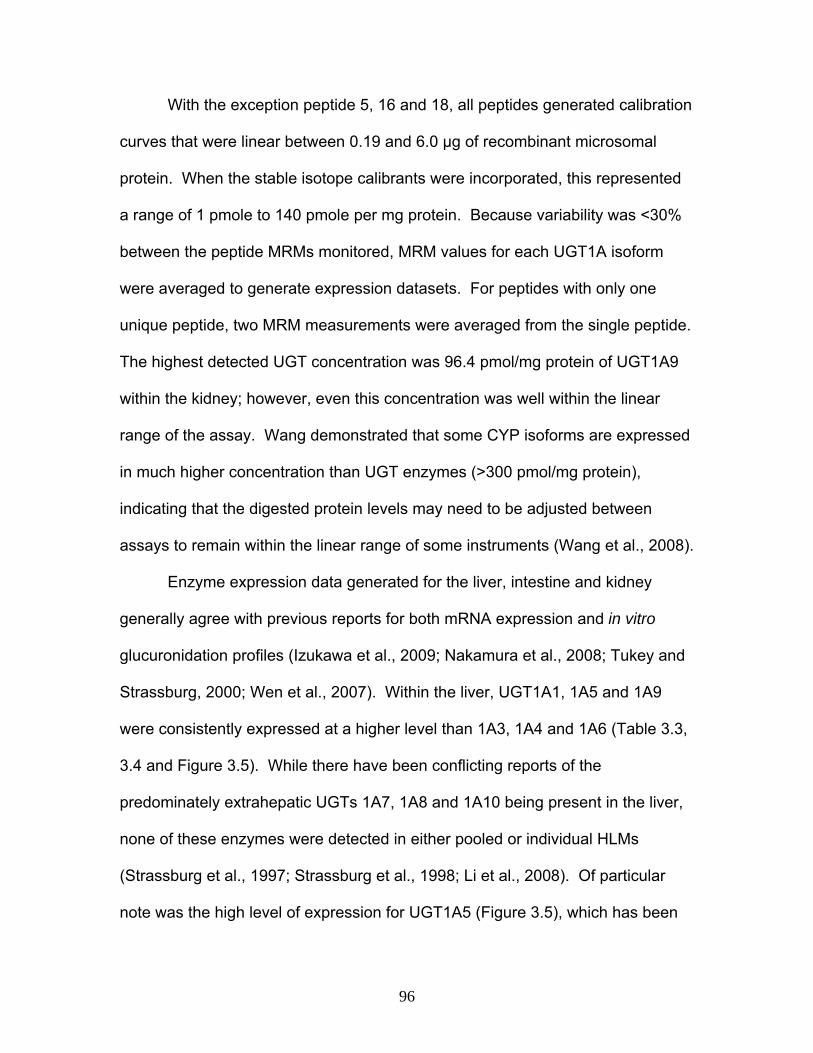
96
With the exception peptide 5, 16 and 18, all peptides generated calibration
curves that were linear between 0.19 and 6.0 μg of recombinant microsomal
protein. When the stable isotope calibrants were incorporated, this represented
a range of 1 pmole to 140 pmole per mg protein. Because variability was <30%
between the peptide MRMs monitored, MRM values for each UGT1A isoform
were averaged to generate expression datasets. For peptides with only one
unique peptide, two MRM measurements were averaged from the single peptide.
The highest detected UGT concentration was 96.4 pmol/mg protein of UGT1A9
within the kidney; however, even this concentration was well within the linear
range of the assay. Wang demonstrated that some CYP isoforms are expressed
in much higher concentration than UGT enzymes (>300 pmol/mg protein),
indicating that the digested protein levels may need to be adjusted between
assays to remain within the linear range of some instruments (Wang et al., 2008).
Enzyme expression data generated for the liver, intestine and kidney
generally agree with previous reports for both mRNA expression and in vitro
glucuronidation profiles (Izukawa et al., 2009; Nakamura et al., 2008; Tukey and
Strassburg, 2000; Wen et al., 2007). Within the liver, UGT1A1, 1A5 and 1A9
were consistently expressed at a higher level than 1A3, 1A4 and 1A6 (Table 3.3,
3.4 and Figure 3.5). While there have been conflicting reports of the
predominately extrahepatic UGTs 1A7, 1A8 and 1A10 being present in the liver,
none of these enzymes were detected in either pooled or individual HLMs
(Strassburg et al., 1997; Strassburg et al., 1998; Li et al., 2008). Of particular
note was the high level of expression for UGT1A5 (Figure 3.5), which has been
97
difficult to characterize and not successfully detected until recently (Finel et al.,
2005). Within the liver, the highest variability in individual donor specimens was
found with UGT1A1 and UGT1A9 isoforms, both which are polymorphic (Kadakol
et al., 2000; Strassburg et al., 1997; Tukey et al., 2000; Villeneuve et al., 2007).
Within the intestinal tract, expression of UGT1A1 and 1A6 was
approximately 35% of expression seen in livers, which concurs with our previous
investigation into these isoforms (Fallon et al., 2008). Furthermore, previous
studies by Wen et al. with etoposide, a UGT1A1 and 1A8 probe substrate
indicated that the Vmax of etoposide glucuronidation in the intestine was
approximately 30% of liver levels (Wen et al., 2007). However, the low levels of
UGT1A enzymes found within the recombinant microsomal protein stocks
coupled with the difficulties in in vitro/in vivo activity extrapolations indicate that
protein concentration may not always correlate well with protein activity when
using recombinant microsomal protein in probe substrate and in vitro
glucuronidation studies (Table 3.7) (Miners et al., 2006). While UGT1A1, 1A6,
1A7, 1A8, 1A9 and 1A10 were all detected within the intestine, levels were
appreciably lower than liver hepatic enzyme levels, and only UGT1A8 was
expressed at a higher level within the intestine than the other two tissues using
microsomes. Individual patient levels of UGT1A8 were highly variable within the
intestine, yet there have been few UGT1A8 polymorphisms reported with
appreciable effects on glucuronidation (Lévesque et al., 2007). An additional
mechanism or unreported polymorphism could be responsible for this large
variation.
98
Expression levels within the kidney microsomes were much higher than
the intestine and sometimes higher than seen in the liver. Particularly, UGT1A9
was expressed (81.4 pmol/mg protein, Figure 3.5) at a level nearly four fold that
of the liver. While mRNA and protein correlation is often poor, recent reports
characterizing UGT mRNA expression indicated UGT1A9 was highly expressed
within the human kidney (Nakamura et al., 2008; Ohno and Nakajin, 2009).
However, it is important to note that when making comparisons between mRNA
assays and with the hUGT assay, one must take into account the numerous
polymorphisms within the hUGT gene family that result in high expression
variability in the tissue populations. Altered protein expression affected by SNPs
or other polymorphisms in human tissues could account for the low level
discrepancies in 1A3 expression within the intestine and kidney in both the UGT
assay and mRNA values. In addition, some isoforms including 1A1 and 1A4
expressed at low levels within the kidney may benefit from the increased
sensitivity using targeted proteomics (Nakamura et al., 2008; Ohno et al., 2009).
Despite some differences in mRNA expression, UGT expression within the
kidney coincides with MPA glucuronidation levels that are also three fold higher
in the kidney compared to the liver and fifteen fold higher than those seen in the
intestinal tract (Picard et al., 2005). Not only were enzyme levels highest in the
kidney for UGT1A4, 1A7, 1A9 and 1A10, but only UGT1A3 and UGT1A5 were
not detected, making the kidney a potentially important organ for clearance via
glucuronidation in the body.
99
By combining the advantages of capillary LC coupled with the new LIT-
TOF instrumentation, we developed and applied a method to detect all of the
active human UGT1A isoforms within a single chromatographic assay. Our
assay demonstrates acceptable variability (<25%) with comparable sensitivity
relative to our earlier method performed using older triple quadrupole (ABI 3000)
instrumentation. The use of capillary LC allowed for a dramatic reduction of
protein needed for the assay without a loss of sensitivity. Furthermore, we are
now able to compare absolute expression levels of UGTs within different tissues
in humans that are comparable with previous reports of relative mRNA
expression and RT-PCR studies. The significant levels of UGT expression within
the kidney demonstrate that this organ could have a potentially important role in
glucuronide disposition within the body. Liver expression was generally higher
than levels seen within the intestine, but more UGT1A isoforms were detected in
kidney compared with the liver. The data obtained here confirms previous
reports of UGT1A5 expression in the liver (Nakamura et al., 2008; Ohno et al.,
2009).
While the liver is seen as the primary organ involved in metabolite
disposition, the importance of other organ systems within the body should not be
underestimated. The emergence of novel targeted quantitative proteomic
methods based upon LC-MS/MS will allow the explosion of protein expression
studies, especially for the many proteins not amenable to developing specific
antibodies. The ability to quantify specific proteins within and between species
without a reliance on specific antibodies not only opens many new avenues of
100
research into xenobioltic metabolism but also within the areas of protein-protein
interactions, enzyme regulation and induction/inhibition studies with proteins that
were not previously amenable to antibody based assays.
E. ACKNOWLEDGEMENTS
This work was made possible through the NIH Training Grant T32-ES007126
and with the technical assistance of Takashi Baba, Shinya Ito and Dr. Gary Glish.
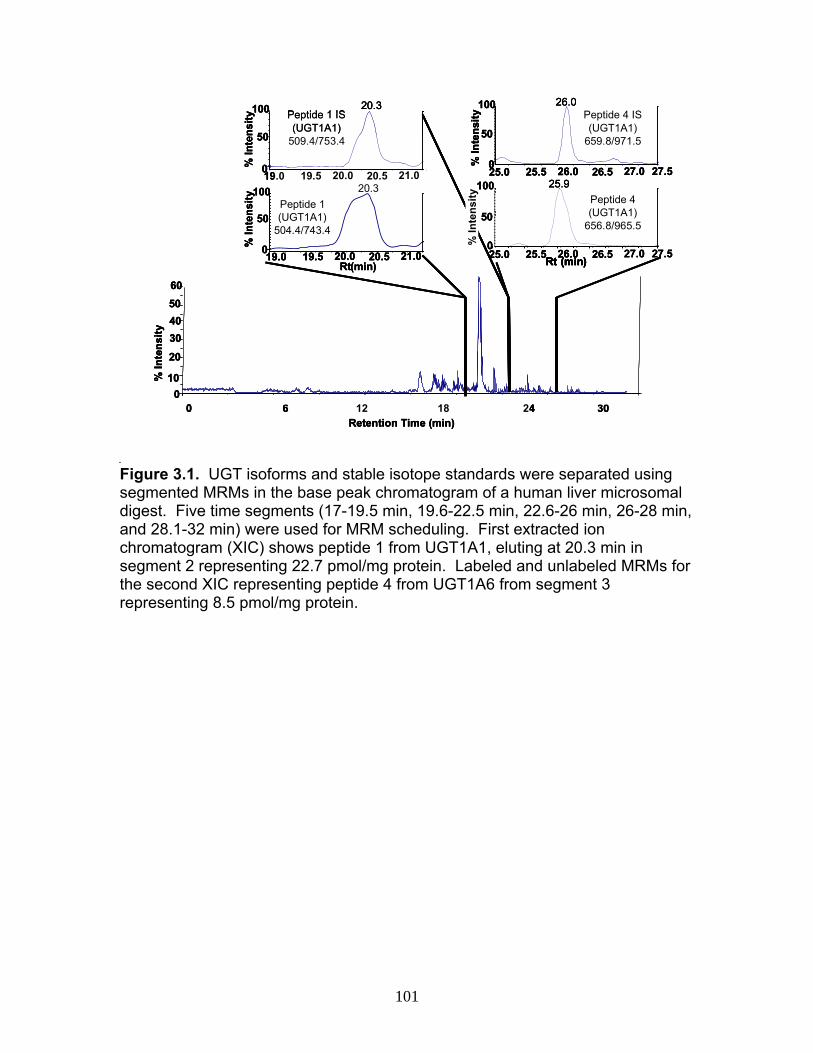
101
00
20.3
6.6 13.2 19.8 26.4Retention Time (min)
010
20
30405060
0 6 12 18 30
Rt(min) Rt (min)
Peptide 1 IS (UGT1A1)
509.4/753.4
Peptide 1 (UGT1A1)
504.4/743.4
Peptide 4 IS (UGT1A1)
659.8/971.5
Peptide 4 (UGT1A1)
656.8/965.5
100
0
50
100
20.3
20.3
% In
tens
ity%
Inte
nsity
6.6 13.2 19.8 26.4Retention Time (min)
% In
tens
ity
Retention Time (min)12 18 24
25.9
26.0
% In
tens
ity
Rt (min)
Peptide 1 IS (UGT1A1)
509.4/753.4
Peptide 1 (UGT1A1)
504.4/743.4
Peptide 4 IS (UGT1A1)
659.8/971.5
Peptide 4 (UGT1A1)
656.8/965.5
19.0 19.5 20.0 20.5 21.0
50
019.0 19.5 20.0 20.5 21.0
100
50
025.0 25.5 26.0 26.5 27.0 27.5
25.0 25.5 26.0 26.5 27.0 27.5
100
50
0% In
tens
ity
Figure 3.1. UGT isoforms and stable isotope standards were separated using segmented MRMs in the base peak chromatogram of a human liver microsomal digest. Five time segments (17-19.5 min, 19.6-22.5 min, 22.6-26 min, 26-28 min, and 28.1-32 min) were used for MRM scheduling. First extracted ion chromatogram (XIC) shows peptide 1 from UGT1A1, eluting at 20.3 min in segment 2 representing 22.7 pmol/mg protein. Labeled and unlabeled MRMs for the second XIC representing peptide 4 from UGT1A6 from segment 3 representing 8.5 pmol/mg protein.
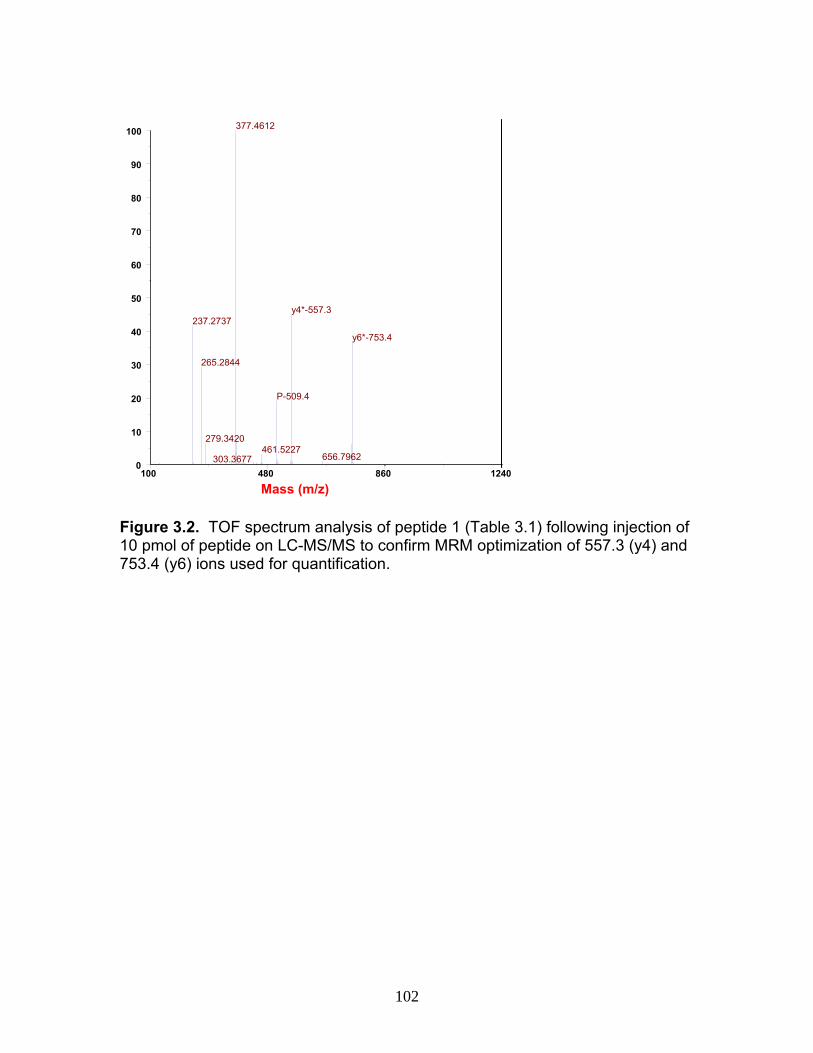
102
Figure 3.2. TOF spectrum analysis of peptide 1 (Table 3.1) following injection of 10 pmol of peptide on LC-MS/MS to confirm MRM optimization of 557.3 (y4) and 753.4 (y6) ions used for quantification.
100 480 860 1240
0
10
20
30
40
50
60
70
80
90
100
377.4612
y4*-557.3237.2737
y6*-753.4
265.2844
P-509.4
279.3420461.5227
656.7962303.3677
Mass (m/z)
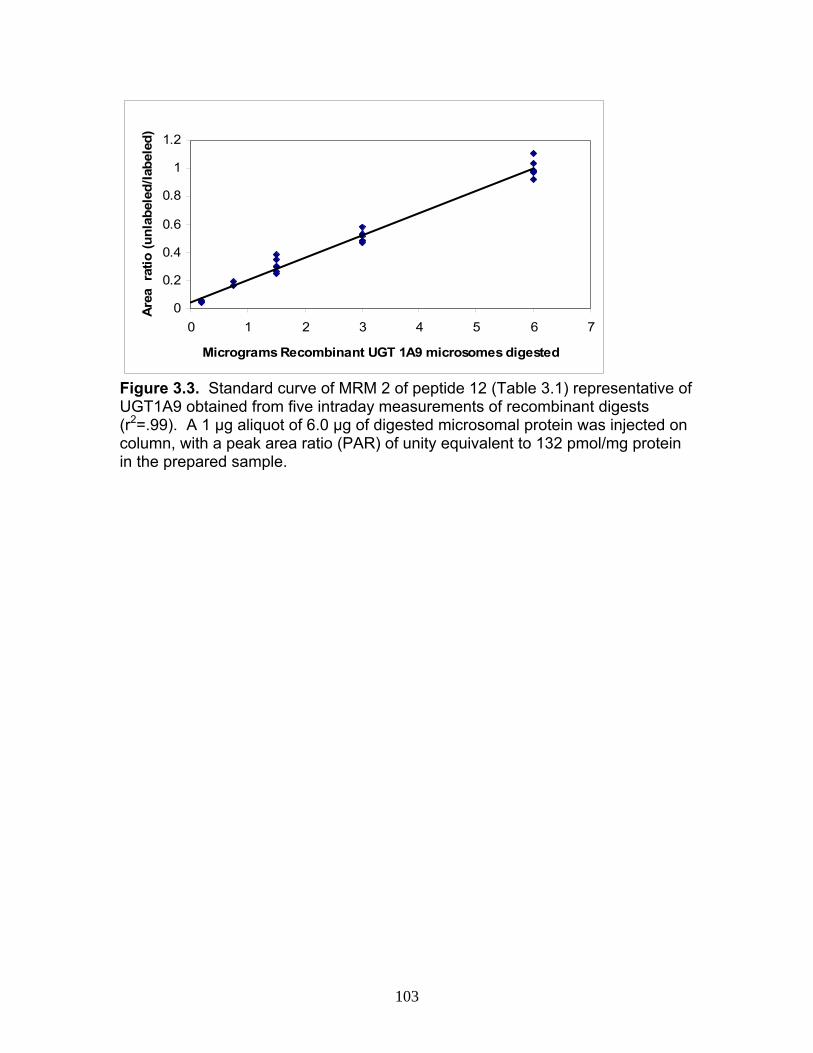
103
0
0.2
0.4
0.6
0.8
1
1.2
0 1 2 3 4 5 6 7
Micrograms Recombinant UGT 1A9 microsomes digested
Area
rat
io (u
nlab
eled
/labe
led)
Figure 3.3. Standard curve of MRM 2 of peptide 12 (Table 3.1) representative of UGT1A9 obtained from five intraday measurements of recombinant digests (r2=.99). A 1 µg aliquot of 6.0 µg of digested microsomal protein was injected on column, with a peak area ratio (PAR) of unity equivalent to 132 pmol/mg protein in the prepared sample.
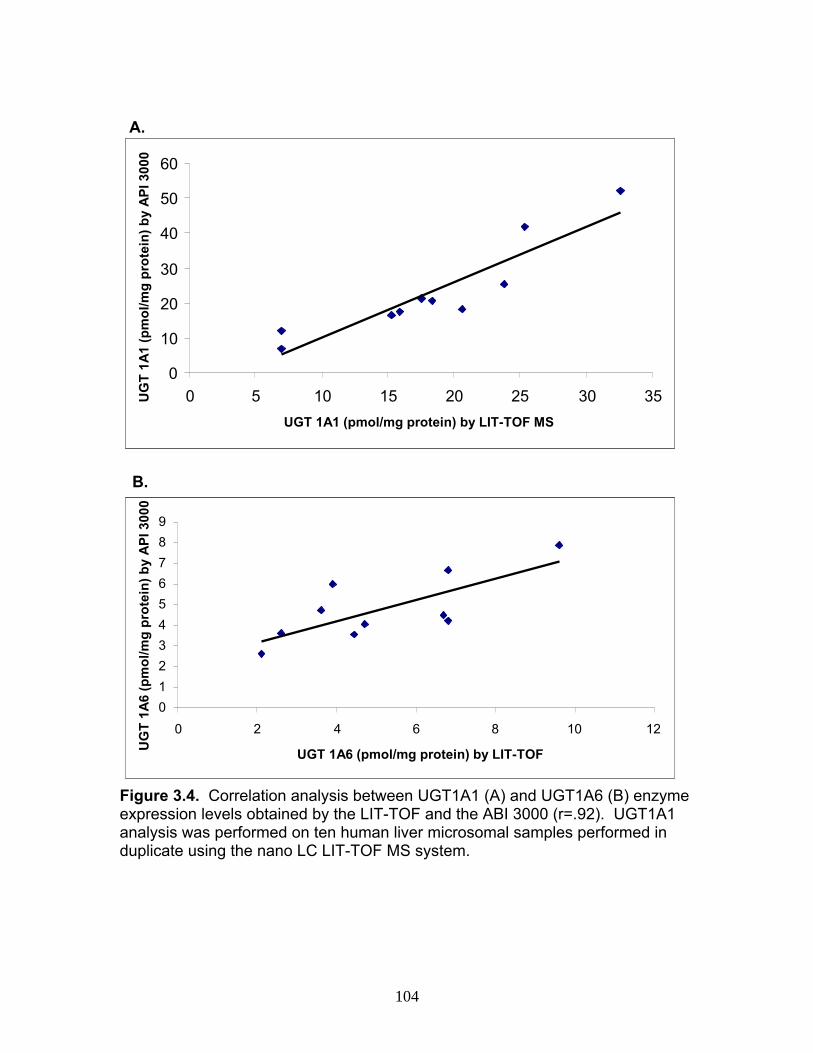
104
0
10
20
30
40
50
60
0 5 10 15 20 25 30 35UGT 1A1 (pmol/mg protein) by LIT-TOF MS
UG
T 1A
1 (p
mol
/mg
prot
ein)
by
API
300
0
0
10
20
30
40
50
60
0 5 10 15 20 25 30 35UGT 1A1 (pmol/mg protein) by LIT-TOF MS
UG
T 1A
1 (p
mol
/mg
prot
ein)
by
API
300
0
0123456789
0 2 4 6 8 10 12
UGT 1A6 (pmol/mg protein) by LIT-TOFUG
T 1A
6 (p
mol
/mg
prot
ein)
by
API
300
0
0123456789
0 2 4 6 8 10 12
UGT 1A6 (pmol/mg protein) by LIT-TOFUG
T 1A
6 (p
mol
/mg
prot
ein)
by
API
300
0
Figure 3.4. Correlation analysis between UGT1A1 (A) and UGT1A6 (B) enzyme expression levels obtained by the LIT-TOF and the ABI 3000 (r=.92). UGT1A1 analysis was performed on ten human liver microsomal samples performed in duplicate using the nano LC LIT-TOF MS system.
A.
B.

105
0102030405060708090
100
1A1 1A3 1A4 1A5 1A6 1A7 1A8 1A9 1A1UGT isoform
UG
T 1A
con
cent
ratio
n (p
mol
/mg
prot
ein)
HLM HIM HKM
00
102030405060708090
100
1A1 1A3 1A4 1A5 1A6 1A7 1A8 1A9 1A1UGT isoform
UG
T 1A
con
cent
ratio
n (p
mol
/mg
prot
ein)
HLM HIM HKM
0
Figure 3.5. Comparison of human UGT enzyme expression from five replicate measurements of digests of pooled human liver, intestinal and kidney microsomes. Data are presented as mean values with standard deviation error bars of each enzyme obtained from averages of two MRMs from one or two peptides as detailed in Methods.

106
Table 3.1. Peptide standards for the UGT isoforms measured using LIT-TOF with their sequence and optimized MRMs used for UGT analysis.
UGT Isoform Sequence IS MRMs (labeled)
Unknown MRMs
(Unlabeled)
Rt (min)
509.4/557.3 504.4/547.3 20 1A1 (peptide1) TYPVPF*QR
509.4/753.4 504.4/743.4 462.7/526.3 457.7/526.3 18.50 1A1 (peptide 2) DGAF*YTLK
462.7/681.4 457.7/671.4 526.5/724.6 523.5/718.6 21 1A1 (peptide 3) DIVEV*LSDR
526.5/823.6 523.5/817.6
1A3 (peptide 5) HVLGHTQL*YFETEHFLK ** ** **
681.3/885.5 678.3/879.5 30.1 1A3 (peptide 6) YLSIP*TVFFLR
681.3/1085.6 678.3/1079.6
839.9/764.4 836.9/758.4 27.5 1A4 (peptide 15) FFTLTAYAV*PWTQK
839.6/1020.5 836.9/1014.5
1A4 (peptide 16) VTLGYTQGF*FETEHLLK ** ** **
1A5 (peptide 17) GHQVVVL*TLEVNMYIK ** ** **
666.3/855.4 663.3/849.4 29.8 1A5 (peptide 18) YLSIPAV*FFLR
666.3/1055.6 663.3/1049.6
659.8/799.3 656.8/793.3 26.0 1A6 (peptide 4) SFLTAP*QTEYR
659.8/971.4 656.8/965.4
750.5/1027.5 747.5/1021.5 30.5 1A6 (peptide 7) IYPVP*YDQEELK
750.5/1223.8 747.5/1217.8
793.8/1046.4 790.3/1039.4 18.5 1A7 (peptide 8) TYSTSYTL*EDQDR
793.8/883.4 790.3/876.4
835.9/649.3 830.9/649.3 24.5 1A7 (peptide 9) ESCFDAVF*LDPFDR
835.9/919.4 830.9/909.4
786.3/518.3 786.3/518.3 18.8 1A8/1A9 (peptide 10) TYSTSYTL*EDLDR
786.3/647.3 786.3/647.3
699.3/990.4 694.3/980.4 24.1 1A8 (peptide 11) EFMDF*ADAQWK
699.3/875.4 694.3/865.4
481.7/536.2 479.7/532.2 18.1 1A9 (peptide 12) AFAHA*QWK
481.7/744.3 479.7/740.3
792.8/661.2 789.3/661.2 20.2 1A10 (peptide 13) TYSTSYTL*EDQNR
792.8/882.4 789.3/875.4
702.8/740.3 699.3/740.3 24.3 1A10 (peptide 14) EFMVF*AHAQWK
702.8/897.4 699.3/897.4
** Indicates that MRM analysis aborted due to insufficient product ion sensitivity following infusion of pure peptide. a: MRM values were obtained following infusion and LC analysis of stable isotope internal standards. b: Bold* amino acid indicates presence of C13, N15 heavy label to generate a mass difference between four and ten daltons.

107
Table 3.2. Ion suppression and matrix effect determination following tryptic digestion of recombinant enzyme represented with % intensity of signals from selected stable isotope internal standards.
MRM Segment I II III III/IV V
MRM 481.7/536.2 509.4/557.5 699.3/990.4 659.8/971.5 666.3/855.4
*%Signal 64.8 7.7 90.5 91.9 6.9
MRM 481.7/744.3 509.4/753.4 699.3/875.4 659.8/799.3 666.3/1055.6
*%Signal 96.9 7.9 28.4 74.3 34.9
MRM 793.8/883.4 792.8/661.2 835.9/919.4 839.9/1020.5 681.3/855.5
*%Signal 89.5 100.9 73.1 25.1 10
MRM 793.8/1046.4 792.8/882.4 835.9/649.3 839.9/764.4 681.3/1085.6
*%Signal 83.3 61.7 73.1 22 11.8
*Compares % signal relative to stable isotope standard signal intensities in solution of reconstitution buffer (ACN/0.1% FA pH 3.0 (15:85)) relative to the addition of internal standard after reconstitution following SPE at the end of sample preparation. %C.V. varied between 2.8% and 27.6% but was generally <15% for all standards
107

108
Table 3.3. Comparison of UGT Expression through intraday variability measurements that were averaged following five replicate digestions of human liver, intestinal and kidney microsomes. Data are presented as averages of two MRMs from one or two peptide representatives for each UGT.
hUGT Isoform
Tissue 1A1 1A3 1A4 1A5a 1A6 1A7 1A8 1A9 1A10
HLMd (pmol/mg protein) 22.7 3.2 7.4 19.5 8.5 * * 22.4 *
% C.V. 19.9 12.6 8.4 11.8 16.7 * * 15.5 *
HIMe (pmol/mg protein) 9.7 * * * 3.5 7.3 18.2 8.8 5.5
%C.V. 5.7 * * * 35.0 17.0 28.0 9.8 32.4 HKM (pmol/mg
protein) 7.0 * 9.1 * 2.5 13.4 5.6 81.9 16.7
%C.V. 14.4 * 32.5 * 17.3 6.9 9.1 18.1 16.0
* Denotes enzyme levels were below detection limits (0.5 pmol/mg protein) a Denotes quantification based on one point calibration curve due to lack of recombinant enzyme b Experiments were run in duplicate with 100 μg liver microsomal protein, 100 μg of kidney microsomal protein and 50 μg intestinal microsomal protein c Data are average of 2 MRMs per peptide. d Indicates sample pooled human microsomal protein purchased from Xenotech LLC **Samples were analyzed on the Hitachi NanoFrontier L/LIT-TOF instrument with a monolithic column (75 μm X 150 mm) at 250 nL/min using a linear gradient conducted as follows: 0 min, 5% B; 5 min, 5% B; 30 min, 55% B; 30.1 min, 100%B; 40 min, 100% B; 40.1 min, 5% B; reequilibration until 65 minutes. LIT-TOF was operated in positive mode using Scheduled MRMs optimized as indicated in Methods.
108
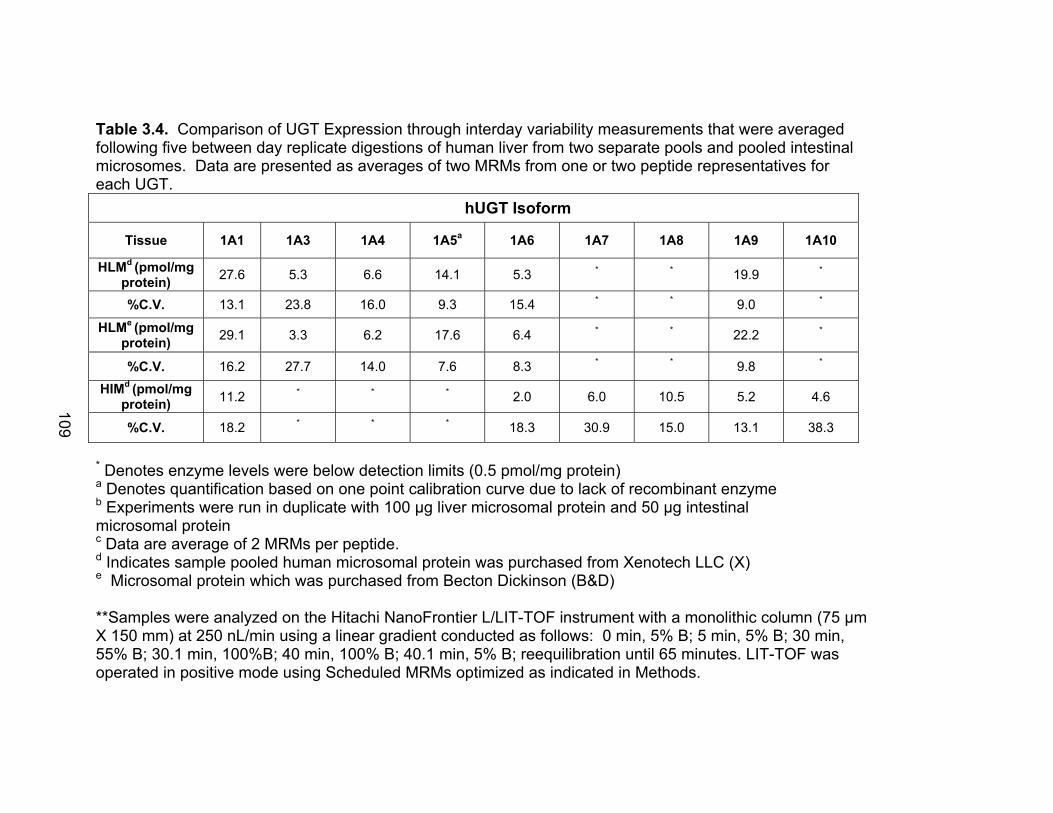
109
Table 3.4. Comparison of UGT Expression through interday variability measurements that were averaged following five between day replicate digestions of human liver from two separate pools and pooled intestinal microsomes. Data are presented as averages of two MRMs from one or two peptide representatives for each UGT.
hUGT Isoform
Tissue 1A1 1A3 1A4 1A5a 1A6 1A7 1A8 1A9 1A10
HLMd (pmol/mg protein) 27.6 5.3 6.6 14.1 5.3 * * 19.9 *
%C.V. 13.1 23.8 16.0 9.3 15.4 * * 9.0 *
HLMe (pmol/mg protein) 29.1 3.3 6.2 17.6 6.4 * * 22.2 *
%C.V. 16.2 27.7 14.0 7.6 8.3 * * 9.8 *
HIMd (pmol/mg protein) 11.2 * * * 2.0 6.0 10.5 5.2 4.6
%C.V. 18.2 * * * 18.3 30.9 15.0 13.1 38.3
* Denotes enzyme levels were below detection limits (0.5 pmol/mg protein) a Denotes quantification based on one point calibration curve due to lack of recombinant enzyme b Experiments were run in duplicate with 100 μg liver microsomal protein and 50 μg intestinal microsomal protein c Data are average of 2 MRMs per peptide. d Indicates sample pooled human microsomal protein was purchased from Xenotech LLC (X) e Microsomal protein which was purchased from Becton Dickinson (B&D) **Samples were analyzed on the Hitachi NanoFrontier L/LIT-TOF instrument with a monolithic column (75 μm X 150 mm) at 250 nL/min using a linear gradient conducted as follows: 0 min, 5% B; 5 min, 5% B; 30 min, 55% B; 30.1 min, 100%B; 40 min, 100% B; 40.1 min, 5% B; reequilibration until 65 minutes. LIT-TOF was operated in positive mode using Scheduled MRMs optimized as indicated in Methods.
109
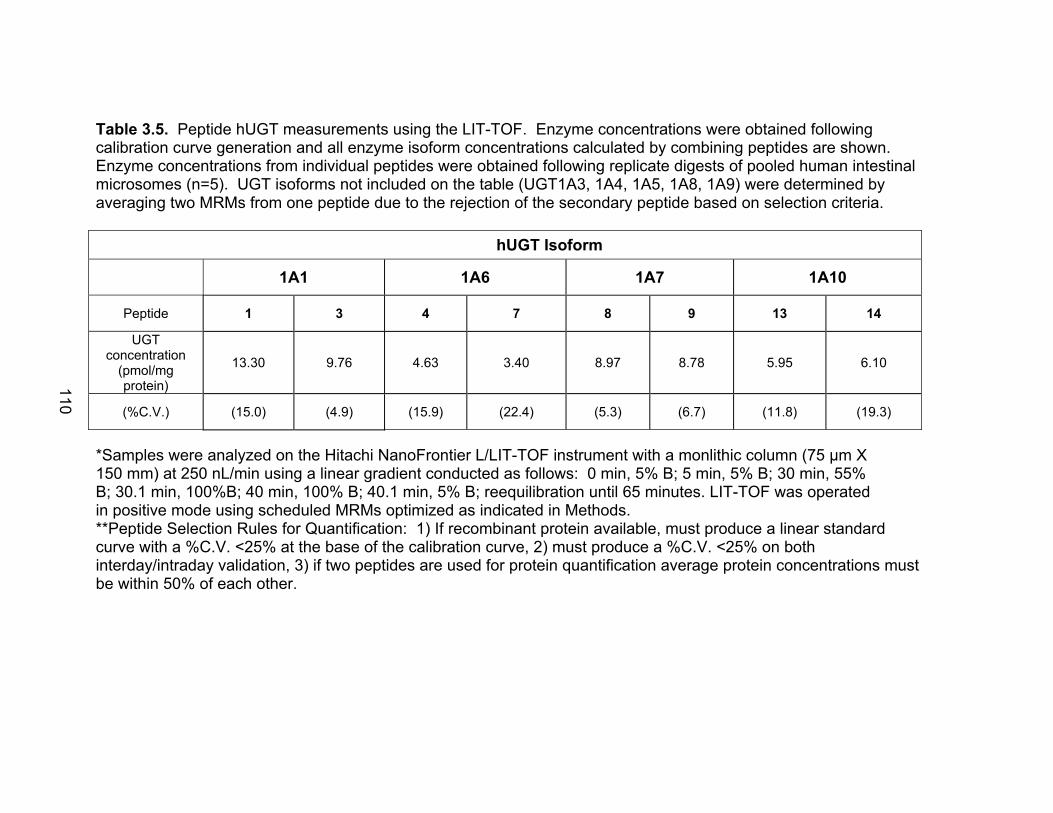
110
Table 3.5. Peptide hUGT measurements using the LIT-TOF. Enzyme concentrations were obtained following calibration curve generation and all enzyme isoform concentrations calculated by combining peptides are shown. Enzyme concentrations from individual peptides were obtained following replicate digests of pooled human intestinal microsomes (n=5). UGT isoforms not included on the table (UGT1A3, 1A4, 1A5, 1A8, 1A9) were determined by averaging two MRMs from one peptide due to the rejection of the secondary peptide based on selection criteria.
hUGT Isoform
1A1 1A6 1A7 1A10
Peptide 1 3 4 7 8 9 13 14
UGT concentration
(pmol/mg protein)
13.30 9.76 4.63 3.40 8.97 8.78 5.95 6.10
(%C.V.) (15.0) (4.9) (15.9) (22.4) (5.3) (6.7) (11.8) (19.3)
*Samples were analyzed on the Hitachi NanoFrontier L/LIT-TOF instrument with a monlithic column (75 μm X 150 mm) at 250 nL/min using a linear gradient conducted as follows: 0 min, 5% B; 5 min, 5% B; 30 min, 55% B; 30.1 min, 100%B; 40 min, 100% B; 40.1 min, 5% B; reequilibration until 65 minutes. LIT-TOF was operated in positive mode using scheduled MRMs optimized as indicated in Methods. **Peptide Selection Rules for Quantification: 1) If recombinant protein available, must produce a linear standard curve with a %C.V. <25% at the base of the calibration curve, 2) must produce a %C.V. <25% on both interday/intraday validation, 3) if two peptides are used for protein quantification average protein concentrations must be within 50% of each other.
110

111
Table 3.6. UGT concentrations obtained from three individual intestinal microsomal donors (HIM) and ten individual donors of liver microsomal protein (HLM) performed on the LIT-TOF in duplicate.
hUGT Isoform Specimen 1A1 1A3 1A4 1A5 1A6 1A7 1A8 1A9 1A10
HIM-1 9.9 * * * 3.2 10.8 9.4 8.2 7.8
HIM-21 3.0 * 5.8 * 1.5 6.1 1.9 5.6 3.9
HIM-27 8.7 * 4.8 * * 8.4 7.0 5.9 2.4
AVG±SD 7.2±3.7 * 5.3±0.7 * 2.3±1.2 8.4±2.4 6.1±3.8 6.6±1.4 4.7±2.8
%C.V. 51.3 * 13.4 * 49.8 28.0 62.8 21.7 59.3
HLM-216 23.8 8.9 4.7 15.6 4.7 * * 16.9 *
HLM-218 15.3 8.1 7.7 17.7 2.1 * * 9.0 *
HLM-219 20.6 2.9 1.8 14.2 6.8 * * 23.5 *
HLM-222 32.6 10.5 4.4 11.6 6.8 * * 17.3 *
HLM-224 17.5 3.4 4.9 22.4 4.5 * * 11.6 *
HLM-225 25.3 6.1 1.5 18.0 6.7 * * 17.9 *
HLM-228 7.0 27.5 4.4 10.9 3.6 * * 96.4 *
HLM-230 15.9 7.4 4.7 16.2 3.9 * * 16.1 *
HLM-233 18.4 * 7.8 12.1 9.6 * * 36.4 *
AVG±SD 18.3±7.8 9.9±7.4 4.6±2.0 15.3±3.5 5.2±2.3 * * 26.7±25.6 *
%C.V. 43.0 75.2 44.9 22.9 43.4 * * 95.7 *
Variability between enzyme measurements was generally <25%. Sections marked with an * indicate enzyme concentrations that were below detection limits (0.5 pmol/mg protein). **Samples were analyzed on the Hitachi NanoFrontier L/LIT-TOF instrument with a monolithic column (75 μm X 150 mm) at 250 nL/min using a linear gradient conducted as follows: 0 min, 5% B; 5 min, 5% B; 30 min, 55% B; 30.1 min, 100%B; 40 min, 100% B; 40.1 min, 5% B; reequilibration until 65 minutes. LIT-TOF was operated in positive mode using Scheduled MRMs optimized as indicated in Methods.
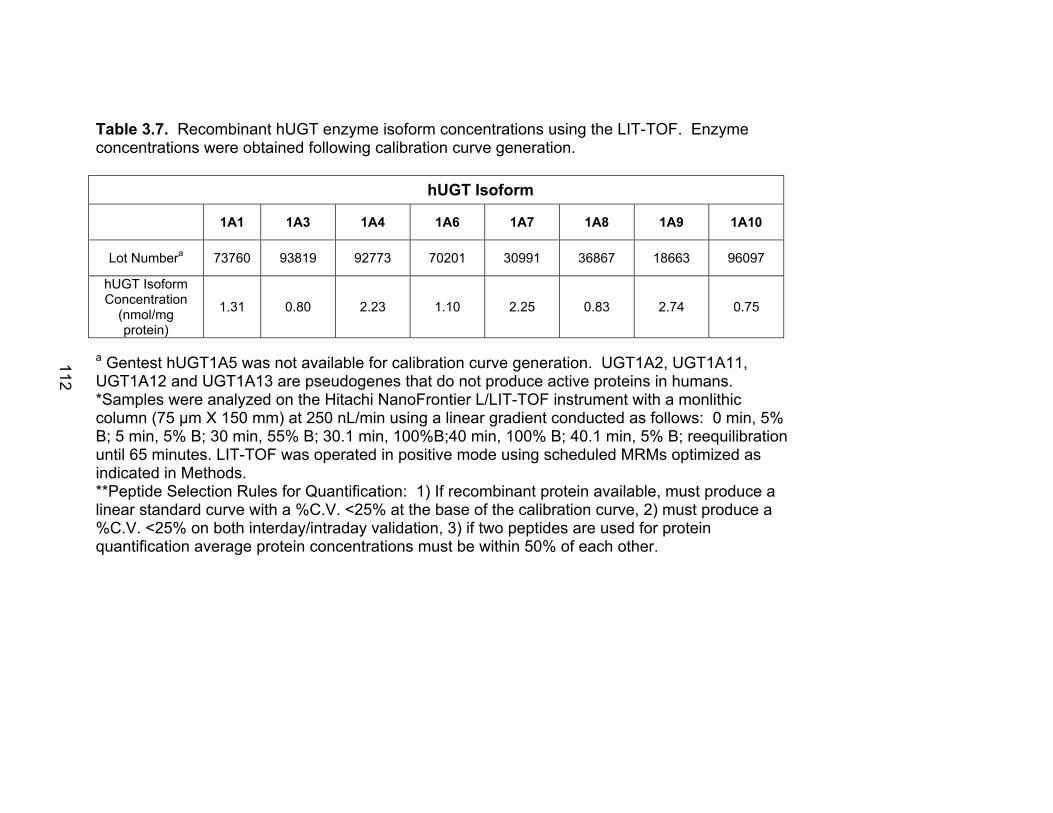
112
Table 3.7. Recombinant hUGT enzyme isoform concentrations using the LIT-TOF. Enzyme concentrations were obtained following calibration curve generation.
hUGT Isoform
1A1 1A3 1A4 1A6 1A7 1A8 1A9 1A10
Lot Numbera 73760 93819 92773 70201 30991 36867 18663 96097
hUGT Isoform Concentration
(nmol/mg protein)
1.31 0.80 2.23 1.10 2.25 0.83 2.74 0.75
a Gentest hUGT1A5 was not available for calibration curve generation. UGT1A2, UGT1A11, UGT1A12 and UGT1A13 are pseudogenes that do not produce active proteins in humans. *Samples were analyzed on the Hitachi NanoFrontier L/LIT-TOF instrument with a monlithic column (75 μm X 150 mm) at 250 nL/min using a linear gradient conducted as follows: 0 min, 5% B; 5 min, 5% B; 30 min, 55% B; 30.1 min, 100%B;40 min, 100% B; 40.1 min, 5% B; reequilibration until 65 minutes. LIT-TOF was operated in positive mode using scheduled MRMs optimized as indicated in Methods. **Peptide Selection Rules for Quantification: 1) If recombinant protein available, must produce a linear standard curve with a %C.V. <25% at the base of the calibration curve, 2) must produce a %C.V. <25% on both interday/intraday validation, 3) if two peptides are used for protein quantification average protein concentrations must be within 50% of each other.
112

113
F. References
Alterman MA, Kornilayev B, Duzhak T, Yakovlev D. Quantitative analysis of cytochrome p450 isozymes by means of unique isozyme-specific tryptic peptides: a proteomic approach. Drug Metab Dispos. 2005, 33(9), 1399-1407. Anderson NL, Anderson NG, Haines LR, Hardie DB, Olafson RW, Pearson TW. Mass spectrometric quantitation of peptides and proteins using Stable Isotope Standards and Capture by Anti-Peptide Antibodies (SISCAPA). J Proteome Res. 2004, 3(2), 235-244.
Anderson L, Hunter CL. Quantitative mass spectrometric multiple reaction monitoring assays for major plasma proteins. Mol Cell Proteomics. 2006, 5(4), 573-88.
Bantscheff M, Schirle M, Sweetman G, Rick J, Kuster B. Quantitative mass spectrometry in proteomics: a critical review. Anal Bioanal Chem. 2007, 389(4), 1017-31. Barnidge DR, Goodmanson MK, Klee GG, Muddiman DC. Absolute quantification of the model biomarker prostate-specific antigen in serum by LC-Ms/MS using protein cleavage and isotope dilution mass spectrometry. J Proteome Res. 2004, 3(3), 644-52.
Barr JR, Maggio VL, Patterson DG Jr, Cooper GR, Henderson LO, Turner WE, Smith SJ, Hannon WH, Needham LL, Sampson EJ. Isotope dilution--mass spectrometric quantification of specific proteins: model application with apolipoprotein A-I. Clin Chem. 1996, 42(10), 1676-82.
Beynon RJ, Doherty MK, Pratt JM, Gaskell SJ. Multiplexed absolute quantification in proteomics using artificial QCAT proteins of concatenated signature peptides. Nat Methods. 2005, 2(8), 587-9. Beynon RJ, Pratt JM. Metabolic Labeling of Proteins for Proteomics. Mol. Cell. Proteomics. 2005, 4, 857-872. Bock KW and Kohle C. Topological aspects of oligomeric UDP-glucuronosyltransferases in endoplasmic reticulum membranes: Advances and open questions. Biochem Pharm. 2009, 77, 1458-1465. Cañas B, López-Ferrer D, Ramos-Fernández A, Camafeita E, Calvo E. Mass spectrometry technologies for proteomics. Brief Funct Genomic Proteomic. 2006, 4(4), 295-320. Deguchi K, Ito H, Baba T, Hirabayashi A, Nakagawa H, Fumoto M, Hinou H, and Nishimura S. Structural analysis of O-glycopeptides employing negative- and
114
positive-ion multi-stage mass spectra obtained by collision-induced and electron-capture dissociations in linear ion trap time-of-flight mass spectrometry. Rapid Commun Mass Spectrom. 2007, 21(5), 691-8. Deguchi K, Ito S, Yoshioka S, Ogata I, and Takeda A. Nanoflow gradient generator for capillary high-performance liquid chromatography-nanoelectrospray mass spectrometry. J Chromatogr A. 2004, 1051(1-2), 19-23. Doherty MK, McLean L, Hayter JR, Pratt JM, Robertson DH, El-Shafei A, Gaskell SJ, Beynon RJ. The proteome of chicken skeletal muscle: changes in soluble protein expression during growth in a layer strain. Proteomics. 2004, 4(7), 2082-93. Domon B, Aebersold R. Mass spectrometry and protein analysis, Science. 2006, 312(5771), 212-7. Fallon JK, Harbourt DE, Maleki SH, Kessler FK, Ritter JK and Smith PC. Absolute Quantification of Human Uridine-Diphosphate Glucuronosyl Transferase (UGT) Enzyme Isoforms 1A1 and 1A6 By Tandem LC MS, Drug Metabolism Letters. 2008, 2, 210-222. Finel M, Li X, Gardner-Stephen D, Bratton S, Mackenzie PI. Radominska-Pandya A. Human UDP-glucuronosyltransferase 1A5: identification, expression, and activity. J Pharmacol Exp Ther. 2005, 315, 1143-9. Gerber SA, Rush J, Stemman O, Kirschner MW, Gygi SP. Absolute quantification of proteins and phosphoproteins from cell lysates by tandem MS. Proc Natl Acad Sci U S A. 2003, 100(12), 6940-5. Gregory PA, Lewinsky RH, Gardener-Stephen DA, and Mackenzie PI. Regulation of UDP glucuronosyltransferases in the gastrointestinal tract, Tox. and App. Pharmacol. 2004, 199, 354-363. Goshe MB, Smith RD. Stable isotope-coded proteomic mass spectrometry. Curr Opin Biotechnol. 2003, 14(1), 101-9. Gu S, Liu Z, Pan S, Jiang Z, Lu H, Amit O, Bradbury EM, Hu CA, Chen X. Global investigation of p53-induced apoptosis through quantitative proteomic profiling using comparative amino acid-coded tagging. Mol Cell Proteomics. 2004, 3(10), 998-1008. Gygi SP, Rist B, Gerber SA, Turecek F, Gelb MH, Aebersold R. Quantitative analysis of complex protein mixtures using isotope-coded affinity tags. Nat Biotechnol. 1999, 17(10), 994-9.
115
Hardt M, Witkowska HE, Webb S, Thomas LR, Dixon SE, Hall SC, Fisher SJ. Assessing the effects of diurnal variation on the composition of human parotid saliva: quantitative analysis of native peptides using iTRAQ reagents. Anal Chem. 2005, 77(15), 4947-54. Hoofnagle AN, Becker JO, Wener MH, Heinecke JW. Quantification of thyroglobulin, a low-abundance serum protein, by immunoaffinity peptide enrichment and tandem mass spectrometry. Clin Chem. 2008, 54(11), 1796-804. Hsu JL, Huang SY, Shiea JT, Huang WY, Chen SH. Beyond quantitative proteomics: signal enhancement of the a1 ion as a mass tag for peptide sequencing using dimethyl labeling. J Proteome Res. 2005, 4(1), 101-8. Huttlin EL, Chen X, Barrett-Wilt GA, Hegeman AD, Halberg RB, Harms AC, Newton MA, Dove WF, Sussman MR. Discovery and validation of colonic tumor-associated proteins via metabolic labeling and stable isotopic dilution. Proc Natl Acad Sci U S A. 2009, 106, 17235-17240. Ito H, Takegawa Y, Deguchi K, Nagal S, Nakagawa H, Shinohara Y, and Nishimura S, Direct structural assignment of neutral and sialylated N-glycans of glycopeptides using collision-induced dissociation MSn spectral matching. Rapid Commun Mass Spectrom. 2006, 20(23), 3557-65. Ito H, Yamada K, Deguchi K, Nakagawa H, and Nishimura S, Structural assignment of disialylated biantennary N-glycan isomers derivatized with 2-aminopyridine using negative-ion multistage tandem mass spectral matching. Rapid Commun Mass Spectrom. 2007, 21(2), 212-8. Ito S, Nabetani T, Shinoda Y, Nagatsuka Y, Hirabayashi Y, Quantitative analysis of a noval glucosylated phospholipid by liquid chromatography-mass spectrometry, Anal. Biochem. 2008, 376, 252–257. Ito S, Yoshioka S, Ogata I, Yamashita E, Nagai S, Okumoto T, Ishii K, Ito M, Kaji H, Takao K, Deguchi K, Capillary high-performance liquid chromatography/electrospray ion trap time-of-flight mass spectrometry using a novel nanoflow gradient generator. J Chromatogr A. 2005, 1090(1-2), 178-83. Izukawa T, Nakajima M, Fujiwara R, Yamanaka H, Fukami T, Takamiya M, Aoki Y, Ikushiro S, Sakaki T, Yokoi T. Quantitative analysis of UDP-glucuronosyltransferase (UGT) 1A and UGT2B expression levels in human livers. Drug Metab. Dispos. 2009, 37, 1759-68. Jeanville PM, Woods JH, Baird TJ 3rd, Estapé ES. Direct determination of ecgonine methyl ester and cocaine in rat plasma, utilizing on-line sample

116
extraction coupled with rapid chromatography/quadrupole orthogonal acceleration time-of-flight detection. J Pharm Biomed Anal. 2000, 23(5), 897-907
Jenkins RE, Kitteringham NR, Hunter CL, Webb S, Hunt TJ, Elsby R, Watson RB, Williams D, Pennington SR, Park BK. Relative and absolute quantitative expression profiling of cytochromes P450 using isotope-coded affinity tags. Proteomics. 2006, 6(6), 1934-47.
Kadakol A, Ghosh SS, Sappal BS, Sharma G, Chowdhury JR, Chowdhury NR. Genetic lesions of bilirubin uridine-diphosphoglucuronate glucuronosyltransferase (UGT1A1) causing Crigler-Najjar and Gilbert syndromes: correlation of genotype to phenotype. Hum Mutat. 2000, 16(4), 297-306.
Kamiie J, Ohtsuki S, Iwase R, Ohmine K, Katsukura Y, Yanai K, Sekine Y, Uchida Y, Ito S, Terasaki T. Quantitative atlas of membrane transporter proteins: development and application of a highly sensitive simultaneous LC/MS/MS method combined with novel in-silico peptide selection criteria. Pharm Res. 2008, 25(6), 1469-83. Kirkpatrick DS, Gerber SA, Gygi SP. The absolute quantification strategy: a general procedure for the quantification of proteins and post-translational modifications. Nat. Methods. 2005, 35(3), 265-73. Kirkpatrick DS, Weldon SF, Tsaprailis G, Liebler DC, Gandolfi AJ. Proteomic identification of ubiquitinated proteins from human cells expressing His-tagged ubiquitin. Proteomics. 2005, 5(8), 2104-11.
Krishnaswamy S, Hao Q, Al-Rohaimi A, Hesse LM, von Moltke LL, Greenblatt DJ, Court MH. UDP glucuronosyltransferase (UGT) 1A6 pharmacogenetics: I. Identification of polymorphisms in the 5'-regulatory and exon 1 regions, and association with human liver UGT1A6 gene expression and glucuronidation. J Pharmacol Exp Ther. 2005, 313(3), 1331-9.
Kuhn E, Wu J, Karl J, Liao H, Zolg W, Guild B. Quantification of C-reactive protein in the serum of patients with rheumatoid arthritis using multiple reaction monitoring mass spectrometry and 13C-labeled peptide standards. Proteomics. 2004, 4(4), 1175-86. Lévesque E, Delage R, Benoit-Biancamano MO, Caron P, Bernard O, Couture F, Guillemette C. The impact of UGT1A8, UGT1A9, and UGT2B7 genetic polymorphisms on the pharmacokinetic profile of mycophenolic acid after a single oral dose in healthy volunteers. Clin Pharmacol Ther. 2007, 81(3), 392-400. Li M, Yuan H, Li N, Song G, Zheng Y, Baratta M, Hua F, Thurston A, Wang J, Lai Y. Identification of interspecies difference in efflux transporters of hepatocytes from dog, rat, monkey and human., Eur J Pharm Sci. 2008, 35, 114-26.
117
Li N, Nemirovskiy OV, Zhang Y, Yuan H, Mo J, Ji C, Zhang B, Brayman TG, Lepsy C, Heath TG, Lai Y. Absolute quantification of multidrug resistance-associated protein 2 (MRP2/ABCC2) using liquid chromatography tandem mass spectrometry. Anal Biochem. 2008, 380, 211-22. Li N, Zhang Y, Hua F, Lai Y. Absolute difference of hepatobiliary transporter multidrug resistance-associated protein (MRP2/Mrp2) in liver tissues and isolated hepatocytes from rat, dog, monkey, and human. Drug Metab Dispos. 2009, 37, 66-73. Little JL, Wempe MF, Buchanan CM. Liquid chromatography-mass spectrometry/mass spectrometry method development for drug metabolism studies: Examining lipid matrix ionization effects in plasma. J Chromatogr B Analyt Technol Biomed Life Sci. 2006, 833(2), 219-30. Li X, Bratton S, and Radominska-Pandya A, Human UGT1A8 and UGT1A10 mRNA are expressed in primary human hepatocytes. Drug Metab Pharmacokinet. 2007, 22(3), 152-61. Marley K, Mooney DT, Clark-Scannell G, Tong TT, Watson J, Hagen TM, Stevens JF, Maier CS. Mass tagging approach for mitochondrial thiol proteins. J Proteome Res. 2005, 4(4), 1403-12. Mayya V, Rezual K, Wu L, Fong MB, Han DK. Absolute quantification of multisite phosphorylation by selective reaction monitoring mass spectrometry: determination of inhibitory phosphorylation status of cyclin-dependent kinases. Mol Cell Proteomics. 2006, 5(6), 1146-57.
Miners JO, Knights KM, Houston JB, Mackenzie PI. In vitro-in vivo correlation for drugs and other compounds eliminated by glucuronidation in humans: pitfalls and promises. Biochem Pharmacol. 2006, 71(11), 1531-9. Nakamura A, Nakamura M, Yamanaka H, Fujiwara R, Yokoi T, Expression of UGT1A and UGT2B mRNA in Human Normal Tissues and Various Cell Lines, Drug Metab Dispos. 2008, 36, 1461-1464.
Ohno S, Nakajin S. Determination of mRNA expression of human UDP-glucuronosyltransferases and application for localization in various human tissues by real-time reverse transcriptase-polymerase chain reaction. Drug Metab Dispos. 2009, 37(1), 32-40.
Owens IS, Ritter JK. Gene structure at the human UGT1 locus creates diversity in isozyme structure, substrate specificity, and regulation. Prog Nucleic Acid Res Mol Biol. 1995, 51, 305-38.
118
Paine MF, Hart HL, Ludington SS, Haining RL, Rettie AE, Zeldin DC. The human intestinal cytochrome P450 "pie". Drug Metab Dispos. 2006, 34(5), 880-6.
Picard N, Ratanasavanh D, Premaud A, Le Meur Y, and Marquet P, Identification of the UDP-Glucuronosyltransferase Isoforms Involved in Mycophenolic Acid Phase II Metabolism, Drug Metab. Dispos. 2005, 33, 139-146.
Ross PL, Huang YN, Marchese JN, Williamson B, Parker K, Hattan S, Khainovski N, Pillai S, Dey S, Daniels S, Purkayastha S, Juhasz P, Martin S, Bartlet-Jones M, He F, Jacobson A, Pappin DJ. Multiplexed protein quantitation in Saccharomyces cerevisiae using amine-reactive isobaric tagging reagents. Mol Cell Proteomics. 2004, 3(12), 1154-69.
Saeki M, Saito Y, Jinno H, Sai K, Kaniwa N, Ozawa S, Komamura K, Kotake T, Morishita H, Kamakura S, Kitakaze M, Tomoike H, Shirao K, Minami H, Ohtsu A, Yoshida T, Saijo N, Kamatani N, Sawada J. Genetic polymorphisms of UGT1A6 in a Japanese population. Drug Metab Pharmacokinet. 2005, 20(1), 85-90.
Souchelnytskyi S, Proteomics in studies of signal transduction in epithelial cells. J Mammary Gland Biol Neoplasia. 2002, 7(4), 359-71. Spaulding RS, George KM, Thompson CM. Analysis and sequencing of the active-site peptide from native and organophosphate-inactivated acetylcholinesterase by electrospray ionization, quadrupole/time-of-flight (QTOF) mass spectrometry. J Chromatogr B Analyt Technol Biomed Life Sci. 2006, 830(1), 105-13. Strassburg CP, Manns MP, Tukey RH, Expression of the UDP-glucuronosyltransferase 1A locus in human colon. Identification and characterization of the novel extrahepatic UGT1A8. J Biol Chem. 1998, 273(15), 8719-26. Strassburg CP, Nguyen N, Manns M and Tukey RH, Polymorphic expression of the UDP-glucuronosyltransferase UGT1A gene locus in human gastric epithelium. Mol Pharmacol. 1998, 54(4), 647-54. Strassburg CP, Nguyen N, Manns MP, and Tukey RH, UDP-glucuronosyltransferase activity in human liver and colon. Gastroenterology. 1999, 116(1), 149-60. Strassburg CP, Oldhafer K, Manns MN, and Tukey RH, Differential expression of the UGT1A locus in human liver, biliary, and gastric tissue: identification of UGT1A7 and UGT1A10 transcripts in extrahepatic tissue. Mol Pharmacol. 1997, 52, 212-20.
119
Thomas A, Geyer H, Kamber M, Schänzer W, Thevis M. Mass spectrometric determination of gonadotrophin-releasing hormone (GnRH) in human urine for doping control purposes by means of LC-ESI-MS/MS. J Mass Spectrom. 2008, 43(7), 908-15. Tukey RH, and Strassburg CP. Genetic multiplicity of the human UDP-glucuronosyltransferases and regulation in the gastrointestinal tract. Mol Pharmacol. 2001, 59(3), 405-14. Tukey RH, Strassburg CP. Human UDP-Glucuronosyltransferases: Metabolism, Expression and Disease, Annu. Rev. Pharmacol. Toxicol. 2000, 40, 581-616. Vaisar T and Urban J. Probing the Proline Effect in CID of Protonated Peptides, J. Mass Spectrom. 1996, 31, 1185-1187.
Villeneuve L, Girard H, Fortier LC, Gagné JF, Guillemette C. Novel functional polymorphisms in the UGT1A7 and UGT1A9 glucuronidating enzymes in Caucasian and African-American subjects and their impact on the metabolism of 7-ethyl-10-hydroxycamptothecin and flavopiridol anticancer drugs. J Pharmacol Exp Ther. 2003, 307(1), 117-28.
Wang H, Qian WJ, Mottaz HM, Clauss TR, Anderson DJ, Moore RJ, Camp DG 2nd, Khan AH, Sforza DM, Pallavicini M, Smith DJ, Smith RD. Development and evaluation of a micro- and nanoscale proteomic sample preparation method. J Proteome Res. 2005, 4(6), 2397-403.
Wang MZ, Wu JQ, Dennison JB, Bridges AS, Hall SD, Kornbluth S, Tidwell RR, Smith PC, Voyksner RD, Paine MF, Hall JE. A gel-free MS-based quantitative proteomic approach accurately measures cytochrome P450 protein concentrations in human liver microsomes. Proteomics. 2008, 8(20), 4186-4196. Wang T, Gu S, Ronni T, Du YC, Chen X. In vivo dual-tagging proteomic approach in studying signaling pathways in immune response. J Proteome Res. 2005, 4(3), 941-9. Wen Z, Tallman MN, Ali SY, Smith PC. UDP-glucuronosyltransferase 1A1 is the principal enzyme responsible for etoposide glucuronidation in human liver and intestinal microsomes: structural characterization of phenolic and alcoholic glucuronides of etoposide and estimation of enzyme kinetics. Drug Metab Dispos. 2007, 35(3), 371-80. Williams JG, Tomer KB, Hioe CE, Zolla-Pazner S, Norris PJ. The antigenic determinants on HIV p24 for CD4+ T cell inhibiting antibodies as determined by limited proteolysis, chemical modification, and mass spectrometry. J Am Soc Mass Spectrom. 2006, 17(11), 1560-9.
120
Wu SL, Amato H, Biringer R, Choudhary G, Shieh P, Hancock WS. Targeted proteomics of low-level proteins in human plasma by LC/MSn: using human growth hormone as a model system. J Proteome Res. 2002, 1(5), 459-65.
Wu WW, Wang G, Baek SJ, Shen RF. Comparative study of three proteomic quantitative methods, DIGE, cICAT, and iTRAQ, using 2D gel- or LC-MALDI TOF/TOF. J Proteome Res. 2006, 5(3), 651-8.
Zieske LR, A perspective on the use of iTRAQ reagent technology for protein complex and profiling studies, J Exp Bot. 2006, 57(7), 1501-8.

121
CHAPTER 4
QUANTITATIVE RELATIONSHIP BETWEEN RAT UDP-GLUCURONOSYLTRANSFERASE ENZYMES AND TRANSPORTERS WITH
METABOLISM AND ELIMINATION OF MYCOPHENOLIC ACID
122
A. INTRODUCTION
Glucuronidation is a phase II metabolism process that involves the
conjugation of glucuronic acid by uridine disphosphate glucuronosyl transferase
(UGT) enzymes to many exogenous and endogenous lipophilic compounds to
yield a polar, anionic product for urinary or biliary excretion. Glucuronidation
enzymes in mammals are composed of two families and three subfamilies and
are present throughout the body (Shelby et al., 2003). One of the primary sites
for glucuronidation activity is the liver, where compounds are subsequently
excreted into either the bile or the sinusoid following conjugation. The process of
biliary or sinusoidal excretion of glucuronide conjugates is aided by a number of
transporters from the ATP binding cassette (ABC) family, including the multidrug
resistance-associated protein 2 and 3 (Abcc2/Abcc3, Mrp2/Mrp3) and the breast
cancer resistance protein (Abcg2/Bcrp) (Westley et al., 2006). The actions of
these glucuronidation enzymes and transporters facilitate the elimination of many
compounds.
Mycophenolic acid (MPA) is used primarily as part of first line adjuvant
immunosuppressive therapy following renal or hepatic transplantation. MPA
selectively inhibits the ionosine monophosphate dehydrogenase enzyme type II
(IMPDH II) enzyme that inhibits the de novo purine biosynthesis pathway in
lymphocytes (Platz et al., 1991). Following administration, MPA is conjugated by
UGT enzymes within the liver to either the pharmacologically inactive phenolic
glucuronide (MPAG) or its potentially labile acyl glucuronide (acMPAG). MPAG
and acMPAG are subsequently excreted into the bile and intestinal tract via
123
MRP2/Mrp2 or BCRP/Bcrp, either for elimination through the feces or cleavage
by β-glucuronidase enzymes back to MPA and subsequent reuptake through the
portal vein back into the liver (Bullingham et al., 1998; Staatz et al., 2007).
Enterohepatic cycling is common in MPA dosing both in rats and humans, and in
humans, it is responsible for 10-61% of MPA exposure (Bullingham et al., 1998;
Naderer et al., 2005; Staatz et al., 2007). While MPA is generally well tolerated,
side effects including leucopenia, an increased infection rate and delayed onset
diarrhea in 20-30% of patients can sometimes result in dosage reduction or
cessation of therapy with potential life threatening complications (Davies et al.,
2007).
The field of quantitative proteomics rapidly advanced following the
development of electrospray ionization (ESI) in 1985 that allowed for analysis of
intact proteins and peptides (Cañas B et al., 2006; Whitehouse et al., 1985). In
addition to the development of ESI, several types of stable isotope standards
have allowed for precise quantification of several proteins, including apo A-I (Barr
et al., 1996), thyroglobulin (Hoofnagle et al., 2006), C-reactive protein (Kuhn et
al., 2004), prostate specific antigen (Barnidge et al., 2003), yeast regulatory
proteins and phosphoproteins (Gerber et al., 2003) and gonadotropin releasing
hormone (Thomas et al., 2008). More recently, the development of absolute
quantification strategies to evaluate expression levels of CYP enzymes,
membrane transporters and UGT enzymes has become particularly important to
biologists and the pharmaceutical industry due to their ability to relate expression
levels and metabolite profiles, i.e. in vitro/in vivo predictions, or to evaluate the
124
induction/inhibition ability of particular compounds of interest (Alterman et al.,
2005; Fallon et al., 2008; Jenkins et al., 2006; Kamiie et al., 2008.; Li et al., 2009;
Wang et al., 2008).
Previously, our lab has explored quantification of hUGT enzymes within
liver, kidney and intestinal segments using both standard bore LC coupled with
triple quardrupole instrumentation and nanoLC linked to an LIT-TOF mass
spectrometer (Fallon et al., 2008). While these experiments were successful in
quantifying all of the enzymes of interest, they lacked sufficient sensitivity or
throughput capability to quantify extremely low abundant proteins on a larger
scale. Moreover, to apply quantitative proteomics when an experiment is
sample limited, such as with cell culture or biopsy samples, more sensitive
methods are needed. Li et al. and Kamiie et al. indicated that some particular
membrane proteins of interest are expressed at levels below the 1 pmol/mg
protein limit of quantification of our previous assays (Li et al., 2008; Kamiie et al.,
2008). By combining the advantages of nano-UPLC chromatography with the
new ABI 5500 QTRAP mass spectrometer, we are now able to use the
advantages in sensitivity and spray efficiency provided by capillary LC and
increase throughput with UPLC particle technology.
We present a method for quantification of rUgt 1a1, 1a6 and 1a7 and the
membrane efflux transporters Mrp2, Mrp3 and Bcrp in rat tissues. In addition,
through in vitro incubations and pharmacokinetic experiments the enzyme
expression in separate strains of male rats were related to the disposition of MPA
and its glucuronide conjugates. This experimental approach also allowed

125
determination if particular strains of rats may be sensitive to MPA induced
delayed onset diarrhea due to MPA exposure within the intestinal tract.
B. METHODS
Materials
Analytical grade acetonitrile, methyl alcohol (anhydrous), potassium
hydroxide, ammonium acetate, ethyl acetate and glacial acetic acid (HOAc) were
purchased from Fisher Scientific Co. (Pittsburgh, PA). Ammonium bicarbonate,
dithiothreitol, iodoacetamide, ammonium hydroxide, formic acid, TPCK treated
trypsin from bovine pancreas (= 10,000 BAEE units/mg protein) alamethicin,
magnesium chloride (MgCl2), phenylmethylsulfonyl fluoride (PMSF), D-saccharic
acid 1, 4-lactone (D-SL), dextrose, carboxyl methyl cellulose (CM-cellulose),
chymostatin (catalog no. C-7268), leupeptin (L-2023), aprotinin (A-1153), antipain
(A-6191), pepstatin A (P-5318), methyl (tri-O-acetyl-α- -glucopyranosyl
bromide)-uronate, β-casein and TRIZMA® hydrochloride were purchased from
Sigma-Aldrich Co. (St. Louis, MO). Tris base was purchased from Bio-Rad
Laboratories (Hercules, CA). Bond Elut solid phase extraction cartridges (C18
100mg, 1mL) were purchased from Varian, Inc. Rat Ugt 1a1, 1a6 and 1a7
recombinant enzyme and control supersomes were obtained from transfected
HepG2 cells out of the lab of Joe Ritter (VCU Medical Center, Richmond, Va).
Human liver microsomes (20 mg/mL) were purchased from Xenotech LLC
(Lenexa, KA) (Lot 1037, pool of 50). Rat liver microsomes (RLMs) and
membrane protein fractions from Wistar, TR- and Gunn (j+/-) rats were prepared
126
rats were prepared using standard methods (Miles et al. 2006; Stern et al. 2007).
Protein concentrations were determined using the Pierce BCA Protein assay Kit,
in which bovine serum albumin is used as the standard.
Animals
Male Wistar rats (250-300 g) and Mrp2 deficient TR- rats (250-300 g) were
purchased from Charles River laboratories (Wilmington, MA) and housed under a
12 hour-light dark cycle. Male adenovirus treated Gunn rat livers were obtained
from the lab of J. Ritter at Virginia Commonwealth University (Richmond, VA)
following AVUgt restoration using previously established methods (Miles et al.,
2006). Experimental methods were approved by the Institutional Animal Care
and Use Committee (IACUC) and the Division of Lab Animal Medicine (UNC-
Chapel Hill). Animals were acclimated for one week prior to experimentation.
Male rats (n=5) were administered either a single oral 50 mg/kg MMF suspension
in 1% CMC (10 mg/mL) or a 50 mg/kg MMF IV infusion dissolved in 5% dextrose
at pH 4 over a thirty minute time period. Following anesthesia using
ketamine/xylezine, the bile ducts were cannulated, and blood was collected from
the tail vein in 0.1-0.2 mL aliquots into microcentrifuge tubes. Time points for
blood and bile collection were 15, 20, 30, 60, 120, 180, 240, 360 and 480 post
dosing. Blood samples were placed on ice and centrifuged at 10,000g for 12
minutes, and plasma was transferred into vials acidified with HOAc (pH~4,
5μL/mL) and kept at -20°C until analysis. Bile samples were collected in
microcentrifuge tubes containing acetic acid (HOAc) (final pH 4, 5μL/mL) and
stored at -20ºC until analysis. For quantitative analysis, 0.050 mL of plasma was
127
precipitated with 0.3 mL acetonitrile containing suprofen internal standard and
centrifuged, dried under nitrogen and reconstituted in methanol/0.1% formic acid
(25:75) for HPLC injection. Pharmacokinetic measures were obtained by
noncompartmental methods using WinNonlin 5.0.1 (Pharsight, Cary, NC).
Statistical analysis was performed using a one way ANOVA to separate
parameters across different rat strains (p=0.05). MPA exposure from
enterohepatic cycling was determined from the equation:
MPA Exposure=)(inf)0(
)(inf)0()(inf)0(
)()()(
Cannulated
CannulatedIntact
MPAAUCMPAAUCMPAAUC
→
→→ −
HPLC-UV Analysis
Analysis by reversed phase HPLC utilized a HP 1050 LC equipped with a
autosampler and an Axxiom (Moorpark, CA) C18 (15cm length, 4.6 mm
diameter, 5 μ particle size, 100 Ǻ pore size) column, with an HP 1100 series UV
detector set at 250 nm. Data analysis was performed with a Chemstation
(A.09.01, Agilent Technologies, Palo Alto, CA). The HPLC method was adopted
from an earlier protocol with the some modifications (Wiwattanawongsa et al.,
2001). The mobile phase was 52% methanol/48% (0.1% formic acid (FA)) under
isocratic conditions at a 1.0 mL/min flow rate over 15 minutes.
MPAG Biliary Elimination
MPAG was synthesized as previously indicated following isolation of MMF
from Cellcept© tablets (Roche Pharmaceuticals, Nutly, NJ) at pH 10 and
extracted using ethyl acetate (Wiwattanawongsa et al., 2001). After extraction,

128
the solution was evaporated and the residue was dried overnight prior to NMR
analysis. Once MMF purity was confirmed, one gram of purified MMF was added
to a solution of pyridine, 0.6 g of silver carbonate and one gram of methyl (tri-O-
acetyl-α- -glucopyranosyl bromide)-uronate under gentle stirring overnight.
Briefly, the reaction was then diluted with toluene and filtered then washed with
HCl, 0.3 M KOH and water, dried with MgSO4 and rotary evaporated. The crude
product was then subject to saponification in acetone with 0.1 M NaOH followed
by the addition of Amberlite IR-120 (H+ form) and filtering with toluene washing.
The product was dried and obtained through the addition of heated ethanol
(~80ºC) in minimal amounts and petroleum ether dropwise. The yellowish
solution was placed in -20ºC overnight and product identity was confirmed
through HPLC, LC-MS and NMR.
Purified MPAG was solubilized in 5% dextrose solution (5 mg/mL) and
administered IV to male Wistar rats following bile cannulation. Blood (0.25 mL)
and bile (0.5 mL) was collected at 5, 15, 30, 60, 120, 180, 240, 360 and 480
minutes. Blood samples were centrifuged for plasma collection and bile was
placed in -20ºC prior to analysis.
Tissue Collection and Microsome Preparation
At the conclusion of the pharmacokinetic studies, rats were euthanized via
thoracotomy and the livers, kidneys and the entire intestinal tract from the pylorus
to the distal colon was removed and placed on a bed of ice. Livers and kidneys
were collected and snap frozen in liquid nitrogen and placed at -80ºC prior to
129
microsome and membrane protein fraction collection. Intestine segments were
taken in 10 cm fractions according to protocols previously indicated by Miles et.
al (Miles et al., 2006).
In vitro MPA Glucuronidation Studies
In vitro glucuronidation rates were based upon previous studies using 1
mM MPA and 1 mg/mL microsomal protein with minor modifications (Stern et al.,
2007). Reactions were terminated at 15 and 30 minutes with 1 mL of acetonitrile
with suprofen as internal standard. Following centrifugation, drying and
reconstitution, 50 µL was injected onto an HP1050 system with the UV detector
set at 250nm.
Stable Isotope Labeled Internal Standards
Peptide standards (7mer-15mer), each containing one amino acid heavy
labeled with 13C [98%] and 15N [95%], selected according to previous methods
(Fallon et al., 2008) were purchased from Thermo Electron (Thermo Scientific,
Waltham, MA). For each rUGT isoform, two synthetic peptide standards were
purchased but three synthetic standards were purchased as representatives for
each transporter of interest. The peptides were purchased for rUgt1a1, 1a6 and
1a7, along with the canalicular transporters rMrp2 and rBcrp and the basolateral
transporter rMrp3 due to their principle effect on MPA metabolism and
distribution within rats. The peptides were selected according to manufacturer
recommendations and previously published guidelines (Beynon et al., 2005;

130
Fallon et al., 2008; Kamiie et al., 2008). The selection criteria along with previous
guidelines established within our lab were used in all peptide selections.
Amino acid analysis and LC-MS was conducted on each peptide to determine
exact amount present as previously described (Fallon et al., 2008). Amino acid
analysis was conducted at the Center for Structural Biology, Wake Forest
University School of Medicine, Winston-Salem, NC. While some peptides
exhibited purity levels of 90%, many peptide purity levels were between 75-85%.
The peptides purchased are listed in Table 4.1 together with optimal MRM
transitions for quantitation.
Sample Preparation and Tryptic Digestion
Calibration curves were generated containing 0.075, 0.19, 0.75, 1.5, 3.0 and
6.0 µg of microsomes for recombinant rat Ugts 1a1, 1a6 and 1a7 with protein
normalized to 25 µg by the addition of HLMs. A blank containing 25 µg of rUGT
control supersomes, with protein normalized in the same way was prepared for
each calibration curve. Rat liver, intestinal or kidney microsomal protein or
membrane protein fractions prepared from the same rat tissues using the
Novagen Native Membrane Protein Extraction Kit (EMD Chemicals, Gibbstown,
NJ) were prepared prior to digestion. Samples were denatured and digested as
previously described with slight modifications (Fallon et al., 2008). Samples were
denatured by heating at 95 ºC for 11 min after the addition of 5 mM dithiothreitol
(sample volume 90 µL), followed by alkylation by iodoacetimide (IAA, 10 µL of
100 mM solution added) for 20 under darkness. Heavy labeled peptides were

131
then added as internal standards (1 pmol of peptides 1-15, Table 4.1) and the
residual acetonitrile (< 5 µL) was removed by evaporation under nitrogen.
Samples were then digested with trypsin in 50 mM ammonium bicarbonate;
enzyme/protein ratio = 1:50; overnight at 37ºC. The reaction was then quenched
by acetonitrile, centrifuged at 1000g for 10 min and the organic content was then
removed by evaporation under nitrogen for ~10 min. Ammonium bicarbonate (0.9
mL, 50 mM solution) was then added in preparation for solid phase extraction.
SPE cartridges were conditioned with methanol and HPLC water. Samples were
then added and the cartridges were washed with ammonium acetate (10 mM,
pH3), then with acetonitrile/0.1% FA in water solution (10:90). Peptides were
eluted from SPE with a 1 mL 65:35 solution of acetonitrile/0.1%FA. The eluate
was evaporated to dryness under nitrogen at 42ºC in a water bath and samples
were reconstituted with 200 μL of 15% acetonitrile/0.1% formic acid at pH 3 (pH
was adjusted to 3 by drop wise addition of ammonium hydroxide). Samples were
stored at -20 ºC until analyzed by LC-MS/MS.
LC Conditions
Following tryptic digestion and sample preparation, peptides from tissue
samples were injected onto a Waters nanoACQUITY UPLC system (Waters
Corporation, Milford, MA) with a Waters Symmetry® loading column (length,
2cm; internal diameter, 180 µm; particle size, 5µ). Samples were loaded onto
the loading column for 3 minutes using 95% Solvent A at 5 μL/min followed by
gradient elution through a bridged ethylene hybrid (BEH) column (length, 10cm;

132
internal diameter, 150 µm; particle size, 1.7µ; pore size, 100Å). The mobile
phase consisted of 98% HPLC water and 2% acetonitrile with 0.1% formic acid
(Solvent A) coupled with 98% acetonitrile and 2% HPLC water with 0.1% formic
acid (Solvent B). Injection volume was 2 μL and the flow rate was held constant
at 2.0 μL/min. Gradient; 15% B from 0 to 5 min, 15% to 65% B at 25 min, to 99%
at 25.1 min, hold at 99% until 30 min, then to 15%B at 30.1 min with equilibration
until 40 minutes.
MS/MS Analysis
MS instrumentation consisted of an ABI QTRAP 5500 system with a
Nanospray III ion source operated in positive ion mode (Applied Biosystems,
Foster City, CA). All data acquisition and method development was carried out
using Analyst Software (version 1.5, build 3655, Applied Biosystems, Foster City,
CA). A majority of the heavy labeled peptides were found to be doubly charged
when infused into the mass spectrometer in 1 µg/mL concentrations in mobile
phase (50:50). Two MRM transitions, with product ions that were generally
>500amu (and precursor ion as doubly charged ion, except for peptide 9 which
was triply charged), were chosen for each heavy labeled peptide following
optimization as shown in Table 4.1, i.e. 30 MRMs for monitoring the heavy
labeled standards. Two additional MRM transitions were chosen for the
corresponding unlabeled peptides from digested recombinant enzyme and
microsomal samples with adjustment based on the masses of the unlabeled
peptides. Thus, there were four MRM transitions monitored per peptide, giving a
133
total of 60 MRMs, which were acquired between the rat UGT enzymes of interest
and the three transporters potentially involved in MPA glucuronide efflux. Due to
the similar nature of many of the peptides, there were several distinct time
windows of peptide elution, allowing for the development of a scheduled MRM
method. Following optimization, total scan time per MRM was set to 100 msec
using an 80 sec scan window for each MRM. MS ion voltage was set at 4000V,
curtain gas 30 L/min, entrance potential 10V, source temperature set at 160ºC,
nebulizer gas set at were maintained 14 L/min while the declustering potential
(DP), collision energy (CE) and collision cell exit potential (CXP) were optimized
for each MRM. A majority of MRM product ions were y ions with some b ions
used for quantification. The MRM transitions acquired are listed in Table 4.1.
C. RESULTS
Rat MPA Pharmacokinetics
After administration of MMF to bile cannulated Wistar rats via either the
oral or intravenous routes, the exposure to MPA was essentially the same (11.6
vs 10.3 mg/ml*min, respectively) which indicates that oral bioavailability of MPA
via the prodrug was essentially complete (Table 4.2, Figures 4.1, A, B). Thus,
CL/F and CL were similar and not statistically different (Table 4.2). The terminal
half-lives were also not statistically different following these two routes of input
into bile cannulated Wistar rats (Table 4.2). The peak concentrations of both
MPA and MPAG were within 60 min following oral dosing. Systemic exposure to
the primary metabolite, MPAG, was also not measurably different between the
134
oral and intravenous dose of MMF, which resulted in ratios of MPAG/MPA to be
similar as well with values below 1.0, reflecting less relative systemic exposure in
rats to MPAG relative to humans where the ratio is often above five in healthy
volunteers.
Biliary excretion in cannulated Wistar rats provided estimates of apparent
biliary clearance. The apparent biliary clearance is defined as “apparent” due to
it measuring amounts of glucuronides in bile relative to parent, MPA, in plasma.
The apparent biliary clearance thus reflects metabolism and then excretion of the
glucuronide(s) into bile. Mean values for apparent biliary clearance were 1.1 and
0.8 mL/min the bile cannulated Wistar rats after the intravenous and oral doses
of MPA, respectively. These were not statistically different and represent biliary
clearance following metabolism as major route of elimination with approximately
60% of the dose excreted in bile when the rats were cannulated and
enteroheptatic recycling was not permitted.
MPA and MPAG disposition in Wistar rats, without bile duct cannulation,
after an intravenous dose allowed an estimate of enterohepatic recycling. The
mean AUC for MPA was 14.3 mg/ml*min following IV dosing of MMF to Wistar
rats and 12.3 mg/ml*min following oral dosing which was much higher than
obtained with cannulation (Table 4.2, Figure 4.2B) and a secondary peak was
noted. From the AUC differences, an estimate for the fraction of dose that is
subject to enterohepatic recycling in the Wistar rat is between 20-39% using both
IV and oral formulations (Table 4.2).

135
When TR- rats were administered MMF orally with bile duct cannulation,
the systemic exposure to MPA was reduced to a mean AUC of 6.1 mg/ml*min
from 11.6 in Wistar rats (Table 4.2). The TR- rats did have substantially elevated
systemic exposure to MPAG (Figure 4.1C) relative to normal Wistar rats,
resulting in an MPAG/MPA level of 6.7 compared with MPAG/MPA values of 0.63
and 0.53 in the Wistar oral and IV dosing groups (Table 4.2)
MPAG in Bile
Within five minutes following a 2.5 mg/kg dose of MPAG (in MPA
equivalents), between 40-50% of the original dose is excreted within the bile. A
significant secondary fraction (~30%) is present within the blood and remained
detectable up to three hours post dosing (Figure 4.4). While there was initially a
large fraction of the MPAG dose excreted into the bile, MPAG elimination through
the bile dropped off dramatically after five minutes to levels below detection limits
for four hours, when a small fraction was detected until the end of the study. At
the end of the collection period (0-8 hr), 53% of the original MPAG dose was
eliminated in bile with the remaining fraction eliminated in the urine and a small
amount undergoing hydrolysis and subsequent hydrolysis in vivo followed by
conjugation and elimination.
In Vitro Glucuronidation Studies
Following incubation periods of 15 and 30 minutes with 1 mM MPA,
hepatic and intestinal microsomes obtained from TR- rats generally exhibited
136
higher glucuronidation formation rates (nmol/min/mg protein) than the Wistar rat
tissue specimens, although the difference was not significant (ANOVA one way,
p=0.45). Furthermore, glucuronidation rates were generally lower in the middle
segments of the gastrointestinal tract in both the TR- and Wistar rats (Figure 4.5)
which is consistent with previous reports (Miles et al., 2006). MPA conjugation
rates were the highest within the liver microsomes of both animal strains, and our
findings on TR- and Wistar rats generally agreed with previously reported
glucuronidation rates (Westley et al., 2006; Miles et al., 2006).
Stable Isotope Standards
Upon infusion into the MS with electrospray ionization, all heavy labeled
peptides produced doubly charged parent ions with the exception of Peptide 6
and Peptide 9 (Table 4.1). However, following inconsistent retention times and
inadequate sensitivity of Peptide 6 during method development, it was infused
again for optimization of the doubly charged parent ion that ultimately yielded
better sensitivity and reproducible retention times on the LC-MS/MS. While our
previous experiments relied on peptides with product ions >500 m/z, inadequate
sensitivity of the product ions of peptide 2 and peptide 13 made it necessary to
expand product ion selections beyond this window (Fallon et al., 2008). Due to
the increased size of the protein sequences for the transporters of interest
relative to the rUgts, coupled with the need for accurate quantification at the base
of the calibration curves, three stable isotope standards were utilized for MRM
quantification. However, due to %C.V. values >25% for peptide 12 (Mrp3) at
137
levels below 1 pmol/mg protein, this peptide was not used for quantification
(Table 4.3).
Calibration Curves
Recombinant microsomal protein was serially diluted to generate a six
point calibration curve for each rUgt enzyme and to establish lower limit of
detection (LLOD) values of the LC-MS/MS instrument. Calibration curves were
constructed following five replicate digests and averaged for each calibrant to
obtain %C.V. values used to evaluate accuracy and precision. All peptide MRMs
generated calibration curves with R2 values >0.98; however, both MRMs of
peptide 1, peptide 3 and peptide 4 also demonstrated %C.V. values of <10% at
the base of their respective calibration curves (Figure 8). While peptides 2, 5 and
6 had slightly higher %C.V. values for rUgt quantification, all %C.V. were <20%
for the analytical procedures.
Validation
Efficiency of tryptic digestion was evaluated by monitoring the ratios of
missed cleavages following a timed digest of 50 µg of β-casein. Missed
cleavages were monitored through two MRMs from the peptides DERFFSDK
(522.4/496.2, 522.4/481.1) and FFSDK (643.4/625.2, 643.4/349.2) along with
IAKYIPIQYVLSR (782.3/764.3, 782.3/782.4) and YIPIQYVLSR (626.4/975.6,
626.4/488.2) representing incomplete and complete digestion. Complete
digestion efficiency was observed when only MRMs from FFSDK and
YIPIQYVLSR were observed following overnight digestion (Figure 4.9). Interday
138
and intraday precision was obtained following five replicate digestions of pooled
RLMs or membrane fractions prepared from frozen Wistar rat livers. All %C.V.
values for each of the casein digests were <20% while the difference in enzyme
expression between the tissue and casein sample sets was minimal (Table 4.3).
Calibration curves were generated for each of the peptide MRMs
representative of the three rUgts (peptides 1-6). All calibration curves were linear
between 0.075-6.0 µg of microsomal protein (R2>0.98) (Figure 4.8). The lower
limit of detection (LLOD) was established at 15 fmol/mg protein by monitoring the
signal: noise ratio at the lowest end of the calibration curves. Enzyme
expression measured in microsomes were obtained by averaging converted peak
area ratios (unlabeled/labeled) of each peptide MRM with %C.V. <20% at the
lowest end of the calibration curves. The low end of the calibration curve was
used to indicate optimal linear range for the tested peptides. Values for %C.V.
for transporters were determined through interday and intraday testing of Wistar
liver membrane fractions. Peptide 12 was eliminated for quantitative purposes
because %C.V. values were >25% in both interday and intraday samples (Table
4.3).
Rat Microsomes
Microsomal digests of Wistar, TR- and adenovirus treated (AVUgt) rat
tissues (Miles et al. 2006) were examined for rUgt expression following validation
of the quantitative proteomic method. It has been previously reported that TR-
rUgt levels are upregulated using a general rUgt1a antibody in a Western Blot
139
when compared with Wistar rat expression levels; however, this was not seen
across all tissues (Johnson et al., 2006). Using our specific quantitative
proteomic method, while rUgt 1a1 was significantly upregulated in the TR- rat
livers no other significant differences according to one way ANOVA analysis in
rUgt expression of rUgt 1a1, 1a6 and 1a7 for any of the other tested tissues
(Figure 4.10). There was a general increase in rUgt1a1 and rUgt1a7 expression
both between the Wistar and TR- rat tissues and proceeding down the segments
of the GI tract within both sets of rat intestines (Figure 4.10). Of the three
isoforms, rUgt1a7 expression was often lower than rUgt1a1 and rUgt1a6 across
all tissues with the exception of the S3 and S4 segments within the TR- rat GI
tract. Often expression levels of this isoform were below 1 pmol/mg protein,
which would have been <LOD in our previous hUGT targeted proteomic assays
established (Fallon et al., 2008).
Rat Membrane Fractions
Rat membrane fractions were isolated using the Novagen Membrane
Extraction Kit from tissues following pharmacokinetic analysis and euthanasia. In
the Wistar rat tissue samples, rBcrp was the most abundant of the three
transporters expressed, between 0.9 and 2.0 pmol/mg protein. In the liver and
kidney, there were no significant differences in transporter expression, and rBcrp
expression was relatively unchanged between intestinal segments. Expression
of rMrp3 was generally higher in the liver and kidney as opposed to the GI tract
and also was present in higher levels descending into the colonic segment (S4).

140
Expression levels of rMrp3 and rMrp2 were highest within the colonic segments
of the intestine while rBcrp expression was minimal (Figure 4.11).
In the TR- rats, as expected, rMrp2 was below detection limits in all
samples, while both rMrp3 and rBcrp were dramatically upregulated in the liver
and kidney. In the liver, rMrp3 was the most abundant of the two transporters,
which has been previously reported; however, rBcrp was expressed in a higher
amount than rMrp3 in the kidney (Johnson et al., 2006). In the intestine, there
was a reversal of transporter expression, where rMrp3 was highest in S1 and S4
of the GI tract while rBcrp expression was more abundant in segments S3 and
S4 (Figure 4.11). AVUgt rat liver expression of rMrp2 was not statiscally different
compared with Wistar rat livers but both rMrp3 and rBcrp expression was
significantly lower compared to Wistar rats (Figure 4.11).
Correlation Analysis
Correlation results were obtained following evaluation of both in vitro
glucuronidation levels and enzyme and transporter expression across liver,
kidney and intestinal segments from Wistar, TR- and AVUgt treated Gunn rats. A
strong correlation was seen between rUgt1a1 and rMrp2 (R2=0.75, Figure 4.14)
but no correlations were observed between any other rUgt enzymes or
transporters (R2<0.20, data not shown). However, in vitro glucuronidation rates
were found to correlate strongly with rMrp2 expression values across all species
and tissues (Figure 4.12, 4.13). In addition, a strong correlation (R2=0.76) was
found between in vitro glucuronidation rates and rUgt1a1 across all tissue types;
141
however, there was no correlation between rUgt1a6 and glucuronidation rates
(R2=0.18, Figure 4.12). While it has been previously reported that in vitro MPA
metabolism correlates with rUgt1a7 expression, initially correlation tests between
the two conditions did not correlate across all tested liver, kidney and intestinal
samples (Miles et al. 2006) (R2=0.21, data not shown). When liver and kidney
samples were removed from the dataset, the correlation improved (Figure 4.12)
and supports previous reports that indicate in vitro glucuronidation rates depend
on rUgt1a7 expression within the gastrointestinal tract (Miles et al., 2006).
D. DISCUSSION
The field of targeted quantitative proteomics has rapidly advanced over
the last decade; however, many studies have not been able to link protein
quantification with physiological effects. In particular, drug metabolizing enzymes
and protein biomarkers are of interest to many scientists due to the need to
understand metabolism endpoints in preclinical testing and to increase to the
likelihood of early detection of disease biomarkers for patients in the clinic. Here
we have attempted to examine the differential expression levels of both rUgt
enzymes and transporters using in vitro and in vivo glucuronidation of MPA as a
probe substrate.
While MPA total clearance values varied slightly between Wistar and TR-
rats (1.7 mL/min vs. 2.5 mL/min, Table 4.2), there was great variability in biliary
clearances (1.1 mL/min vs. 0.09 mL/min, Table 4.2). Initial pharmacokinetic

142
studies centered on determining any differences in AUC or clearance levels
between oral and IV dosing in Wistar rats. Even though initial plasma
MPA/MPAG plasma concentrations differed slightly due to first pass metabolism
observed upon oral dosing of MMF compared with IV dosing, none of the
pharmacokinetic parameters were significantly different between the Wistar rats
(Table 4.2). Furthermore, MPA/MPAG plasma concentration time curves were
virtually identical after sixty minutes in both cannulated and Wistar rats after oral
and IV dosing with intact bile ducts. Both the oral and IV dosed Wistar rats
demonstrated an increase in MPA plasma concentration between four and six
hours post dosing, an indicator of enterohepatic cycling, which is typically seen
between six and eight hours post dosing in humans and responsible for a
significant fraction of overall MPA exposure in humans. Using the IV and oral
dose studies both the bile cannulated rats and control animals with intact bile
flow, it was found that approximately between 20-39% of overall MPA exposure
results from enterohepatic cycling. Enterohepatic cycling is important for both
rats and humans because it represents not only an increase in mean residence
time and overall exposure to the parent compound, but can also increase efficacy
and potential side effects, especially if intestinal metabolism or exposure to the
parent drug is associated with toxicity.
Previous experiments (Chapter 2) demonstrated that rats rapidly excrete
acMPAG that is not cleaved by esterases within the body following IV
administration of the pre-formed acyl glucuronide metabolite. While previous
experiments have indicated that acyl glucuronides can be taken back into the
143
liver following IV administration, it is also important to consider the possibility of
rapid cleavage of the acyl glucuronide back to the parent aglycone, which may
then be available for hepatic uptake and metabolism within the liver. MPAG,
which is resistant to esterase cleavage, was also administered intravenously to
Wistar rats to evaluate the potential for reuptake and excretion of the intact
glucuronide. Following IV administration, MPAG is excreted rapidly into the bile
within five minutes, but plasma levels of MPAG decrease rapidly to below
detection limits within three hours. Of the original IV dose of MPAG, 53% is
ultimately excreted within the bile, indicating that glucuronide metabolites may be
taken back up into the liver intact (Figure 4.4). This could possibly serve as a
tertiary source of parent aglycone exposure following potential β-glucuronidase
cleavage within the liver, in addition to the initial dose and parent aglycone that is
reabsorbed during enterohepatic cycling.
The side effects of MPA are well documented, but of particular concern is
the 20-30% fraction of the patient population that suffers from debilitating delayed
onset diarrhea (Davies et al., 2007). This particular side effect is troubling not
only because of lifestyle factors, but also because many patients that exhibit this
symptom must either alter MPA dosing levels or resort to second line therapy.
Second line therapy can result in allograft rejection, leading to not only life
threatening complications for the patients but also substantial increases in patient
care costs for the individuals. Within the body, MPA is detoxified through the
actions of UGT enzymes in the liver and gastrointestinal tract, leading to the
formation of two glucuronides, MPAG and acMPAG, which are then excreted in
144
bile and urine. Even though many attempts have been made to link acMPAG
exposure levels with the GI toxicity of MPA, no distinct correlations have been
found and in vitro studies of the acMPAG metabolite indicate that compared with
many acyl glucuronide metabolites, it is a fairly stable and unreactive metabolite
(Chapter 2; Shipkova et al., 2003). Therefore, our lab in collaboration with Miles
and Ritter (VCU Medical Center, Richmond, VA) investigated different rat strains
that exhibit variable rUgt and transporter expression, then modulated rUgt
expression through the use of AVUgt Gunn rats (Miles et. al 2006). MPA
exposure in plasma varied, thus MPA toxicity also varied.
While TR- rats demonstrated much lower MPA biliary clearance values
during the pharmacokinetic experiments, CLtotal was generally higher than Wistar
rats tested under the same conditions with bile collection. Biliary clearance of 0.1
mL/min and Febile below 10% in TR- rats were consistent with what has been
previously reported (Westley et al., 2006). The retention of some biliary efflux of
MPAG in TR- rats indicates that glucuronide efflux into the bile involves
additional canicular transporters besides Mrp2. While BCRP single nucleotide
polymorphisms have been linked to altered MPA exposure levels in humans,
Bcrp is likely a minor factor in rat MPAG elimination due to the low biliary
clearance levels observed in TR- rats (Miura et al., 2008).
Analysis of in vitro glucuronidation demonstrated no statistically significant
differences between Wistar and TR- rat tissue samples. Generally, there was a
modest increase in MPA glucuronidation rates between Wistar and TR- rat liver
and kidney samples (Figure 4.5). Westey et al. reported a modest increase in
145
TR- rat liver glucuronidation rates and attributed this as being due to increases in
rUgt1a enzymes (Johnson et al., 2006; Westley et al., 2008). However, because
a general antibody for all rUgt1a isoforms was used in determining changes in
rUgt expression levels, it has been difficult to determine if the increase in rUgt
expression can be related to increased MPA glucuronidation capacity. In order
to more precisely examine this relationship, it was beneficial to develop an assay
to quantify rUgt1a1, 1a6 and 1a7, which are primarily responsible for MPA
glucuronidation within rats (Miles et al., 2005).
Targeted quantitative proteomic assays were performed on the
nanoACQUITY UPLC system connected to the QTRAP 5500 using 15 stable
isotope (C13, N15) internal standards. Standards were selected and purchased
following in silico digest of each respective protein of interest following selection
rules (avoid extensive hydrophilicity/hydrophobicity, 8mer-16mer in length, no
D-G N terminus, no C or W residues) that we have previously outlined (Fallon et
al., 2008). In addition, peptide selections were based on previous experience
with peptides used in hUGT quantification, where it was found that multiply
charged peptides are much more common with multiple histidine residues and
proline residues generate preferential MRM product ions (Fallon et al., 2008;
Vaisar and Urban, 1996). Only two peptides were selected for quantification of
each of the three rUgts studied due to their shorter protein sequences, which
resulted in a lack of ideal stable isotope peptide standards. Upon infusion, all
peptides were doubly charged with the exception of peptide 6
(TVSV*SHTSQEDQEDLNR) and peptide 9 (LIHDLLVLF*LNPQLLK), which were
146
triply charged. While peptide 9 demonstrated excellent reproducibility on the LC-
MS/MS system, peptide 6 lacked consistent reproducible LC retention times.
Peptide 6 was then optimized again on the MS/MS system following infusion.
Even though the triply charged state was approximately ten fold more abundant
than the doubly charged state, peptide 6 was optimized using the doubly charged
ion and subsequently produced consistent and reliable LC retention times and
adequate MS/MS sensitivity. Despite careful evaluation during the peptide
selection process, peptide 12 (YP*GLELVLK, rMrp3) was ultimately excluded
from the analysis due to excessive variability when applied to assays for the
analysis of membrane fractions. Unlike previous experiments (Chapter 3), all
peptides produced strong MRM product ion spectra and were easily resolvable
on the nano-UPLC MS/MS system.
The LC properties of the stable isotope standards and their corresponding
unlabeled peptides from the digested proteins produced several distinct windows
of peptide retention times (Figure 4.7). This was addressed by the development
of a scheduled MRM method to optimize instrument dwell times and ensure that
enough data points are collected across a peak. While previous experiments
with scheduled MRMs were based on peak widths between 60-90 seconds
allowing for generous dwell times (Fallon et al., 2008), the advantages of UPLC
often resulted in peak widths as small as 10 seconds for particular peptides
(Figure 4.7). Because of this, it became necessary to shorten dwell times from
60ms employed on the API 3000 to approximately 3-5ms using scheduled MRMs
147
on the QTRAP 5500 to acquire sufficient points across a particular MRM peak for
all 60 MRMs analyzed within a single LC run.
Calibration curves for each peptide representing a rUgt enzyme were
established to validate the lower limit of quantification (LLOQ) and linear range of
the assay with injection of approximately 0.2 µg of digested protein on column.
At the low end of the calibration curve (75 fmol/mg protein) the signal to noise
ratio (S:N) was approximately 25:1 for each peptide, resulting in a 30 fmol/mg
protein LLOQ value. To validate the effectiveness of peptides used for
quantification of membrane transporters, the %C.V. values from the interday and
intraday analysis were evaluated since recombinant transporters were not
available to determine linear ranges of the assays. Any targeted peptides with
%C.V. values >25% were excluded from the analysis. Peptide 12 was excluded
from all transporter analyses because %C.V. values were >25% for both MRMs
in both the interday and intraday validations. All other peptide %C.V. values
were below 20% during validation and the MRM measurements for each peptide
were averaged to generate the transporter expression data. Transporter
expression levels not only agreed between peptide MRMs on the QTRAP 5500
but also between the three peptides employed for quantification of rMrp2 and
rBcrp and the two peptides used for quantification of rMrp3 (Table 4.5; Table
4.6). Compared to our previous targeted proteomic assays for human UGTs
using the LIT-TOF with capillary LC (Chpater 3), the %C.V. values obtained on
the ABI 5500 were generally lower but no significant differences in assay
precision have been observed across any of the three instrument platforms
148
evaluated to date (Fallon et al., 2008). However, the limit of detection of the ABI
5500 (rUgt 1a1, 1a6, 1a7 and transporters) was fifty fold lower (0.01 pmol/mg
protein vs. 0.5 pmol/mg protein) compared to both the ABI 3000 (for hUGT1A1
and 1A6) and the LIT-TOF (for all active hUGT1A isoforms).
After assay development and validation, Ugt enzymes between Wistar,
TR- and AVUgt rats were analyzed on the LC-MS/MS system. Previous
experiments using Western Blots have indicated that rUgt1a enzymes increase in
concentration from the duodenum section of the GI tract descending into the
colon (Miles et al., 2006; Shelby et al., 2003). In addition, mRNA analysis
indicates that rUgt1a1 is the most prevalent isoform of the rUgt enzymes followed
by rUgt1a6 and rUgt1a7 (Miles et al., 2006; Shelby et al., 2003). Current RT-
PCR assays lack consistent sensitivity to detect rUgt1a7 within the liver, and
these same studies detected this isoform within each section of the intestinal
tract. Using the LC-MS/MS analytical procedure, we were able to detect rUgt1a7
in the liver, kidney and intestinal tracts in both Wistar and TR- rats.
Consistent with previous reports, rUgt1a1 was the most prominent
enzyme within the liver in across all rat strains (Figure 4.10). Ugt1a7 was
expressed at the highest levels within the colon in both Wistar and TR- rats with
a general trend of increasing expression from the duodenum to the colon of the
GI tract. Despite altered expression levels of rUgt1a1 and rUgt1a7 across tissue
segments of the GI tract, expression of rUgt1a6 remained relatively unchanged.
MPA glucuronidation within the kidney was approximately 40% of the levels
within the liver, which was supported by both in vitro glucuronidation studies, but
149
also by previous experiments using selective antibodies with Western Blots
showing that rUgt1a1 and rUgt1a7 levels were approximately half of those seen
in the liver (Stern et al., 2007). Miles et al. reported that rUgt1a7 preferentially
glucuronidates MPA compared to rUgt1a6 and rUgt1a1 in rats, which suggests
that MPA glucuronidation rates should be higher within liver and colon compared
to other tissues (Miles et al., 2005; Miles et al., 2006). While MPA toxicity is
minimal within the liver, MPA toxicity within the colon is one of the primary
sources of delayed onset diarrhea. The higher levels of rUgt1a7 and MPA
glucuronidation capacity likely help protect Wistar rats, which are resistant to
MPA toxicity, while Gunn rats, which lack all rUgt1a activity within all organs, are
susceptible to MPA induced side effects (Miles et al., 2006).
While there were no statistically significant differences in rUgt1a6 and
rUgt1a7 expression between Wistar and TR- rats, rUgt1a1 was significantly
upregulated in TR- rat livers (Figure 4.10). Previous reports of glucuronidation in
TR- rat livers indicate a slight increase in glucuronidation catalysis, but significant
upregulation of rUgt expression when measured using Western Blots and RT-
PCR (Johnson et. al 2006; Westley et al. 2006). The expression studies
presented here using targeted quantitative proteomics indicate that while rUgt1a1
expression significantly increases in TR- rats, it is likely that alterations in
transporter expression also factor in overall differences in MPA exposure
between TR- rats and Wistar rats. This is because previous studies have
indicated that rUgt1a1 is not the primary rUgt isoform involved in MPA
150
glucuronidation in the rat due to its higher Km and Vmax compared with rUgt1a7
(Miles et al., 2006).
Many previous experiments with membrane transporters have indicated
that rMrp2 is highly expressed within the liver, kidney and brush border of the
intestinal tract (Johnson et al., 2006). In addition, rBcrp and rMrp3 are also both
highly expressed within the liver with variable expression within the intestinal
tract. The experiments presented here have indicated that rMrp2 is highly
expressed within the liver, kidney, duodenum and colon and found at lower levels
within the jejunum and ileum. In Wistar rats, rMrp3 is present at lower levels than
both rMrp2 and rBcrp except within the colon, and rMrp3 lacks any discernible
pattern of expression within the intestinal tract. Compared to previous reports in
the literature, levels of rMrp2 in Wistar rats found here by quantitative proteomics
were approximately three fold lower than those reported in Sprague Dawley rats
(Li et al., 2008). Because of the lack of genetic homogeneity within the outbred
Sprague Dawley rat strains, along with differences in methodology, it is difficult to
directly compare transporter expression levels between labs and species. Miles
et al. noted that Sprague Dawley rats have approximately three fold higher in
vitro MPA glucuronidation rates compared with Wistar rats (20.7 nmol/min/mg vs
6.0 nmol/min/mg) (Miles et al., 2006). The data presented in Figure 4.13 show
that rMrp2 expression and in vitro glucuronidation rates correlate strongly, and
enhanced rMrp2 expression could be a compensatory effect of increased
glucuronidation capacity that varies with rat strain.
151
Unlike rMrp2, rBcrp was highly expressed within the liver and kidney but
expression drops off within the intestinal tract. rBcrp levels within the liver and
kidney (1.8 pmol/mg protein, Figure 4.11) were slightly higher than those
reported by Li et al. within Sprague Dawley rats (Li et al., 2009). Using absolute
quantitative proteomics, it is possible to compare values between labs, which
were not feasible when using relative measurements with Western Blots to
evaluate protein expression. Expression of rBcrp within the intestinal tract of rats
was largely unchanged descending from the duodenum to the colon and was the
least prominent of the three tested transporters in the colon. While the three
efflux transporters within the Wistar and AVUgt strains were moderately
expressed, tissue levels of the transporters changed substantially when
compared with TR- rats (Figure 4.11).
There was a significant difference in rMrp3 levels within the tissues of the
TR- rats with rMrp3 expression increasing five fold in both the liver and kidney
relative to Wistar rats (Figure 4.11). Alterations in transporter expression were
more modest between Wistar and TR- rats within the intestinal tract with minor
decreases in rBcrp expression and increases in expression of rMrp3 primarily
within the duodenum and colon. Previous reports with Western Blots of Wistar
and TR- rats indicated a 500% increase in rMrp3 expression in TR- rat livers with
minor decreases between TR- rats and Wistar rats across the intestinal tract in
both rMrp3 and rBcrp expression (Johnson et al., 2006). The data presented
here supports those earlier studies with some exceptions for rBcrp within the liver
and rMrp3 within the intestinal tract. While Figure 4.11 shows slight increases in
152
rMrp3 levels in both the duodenum and colon, previous studies using Western
Blot studies reported decreases in expression of both transporters of interest in
rats (Johnson et al., 2006). It is likely that differences in sample preparation
(cellular homogenate vs. membrane fractions) and tissue handling
(homogenizing buffers, tissue extract conditions) contribute to this variability in
discernible expression levels. In addition, the differences in assay methodology
and lack of linearity of relative quantification with a Western Blot compared with
targeted quantitative proteomics also contribute to variability in membrane
transporter expression levels seen between the quantitative proteomics and the
Western Blot method (Hoofnagle and Werner, 2009). The combination of
increased levels of rMrp3 and rUgt1a1 enzymes, together with the decrease in
efflux to bile by loss of rMrp2 contributes to the increased MPAG levels seen
within the TR- rat plasma, while the maintenance of 10% of MPAG bilary
excretion in TR- rats compared with Wistar rats within the bile indicate that rBcrp
is likely a minor factor in the biliary excretion of MPAG in control Wistar rats.
Levels of both rMrp3 and rBcrp in AVUgt rats were largely unchanged with
slight but not statistically significant increases in rMrp2 expression (Figure 4.11).
Liver transporter levels in AVUgt rats were lower than the control Wistar strains
and significantly lower than TR- rat livers (p<0.05). Gunn rats, the rUgt1a
deficient background strain of the AVUgt rats, have been reported to possess
upregulated rMrp3 transporter expression compared to Sprague Dawley rats
(Higuchi et al., 2004). Interestingly, this was not seen within our experiments,
although it should be noted that mRNA expression of rMrp3 is actually decreased
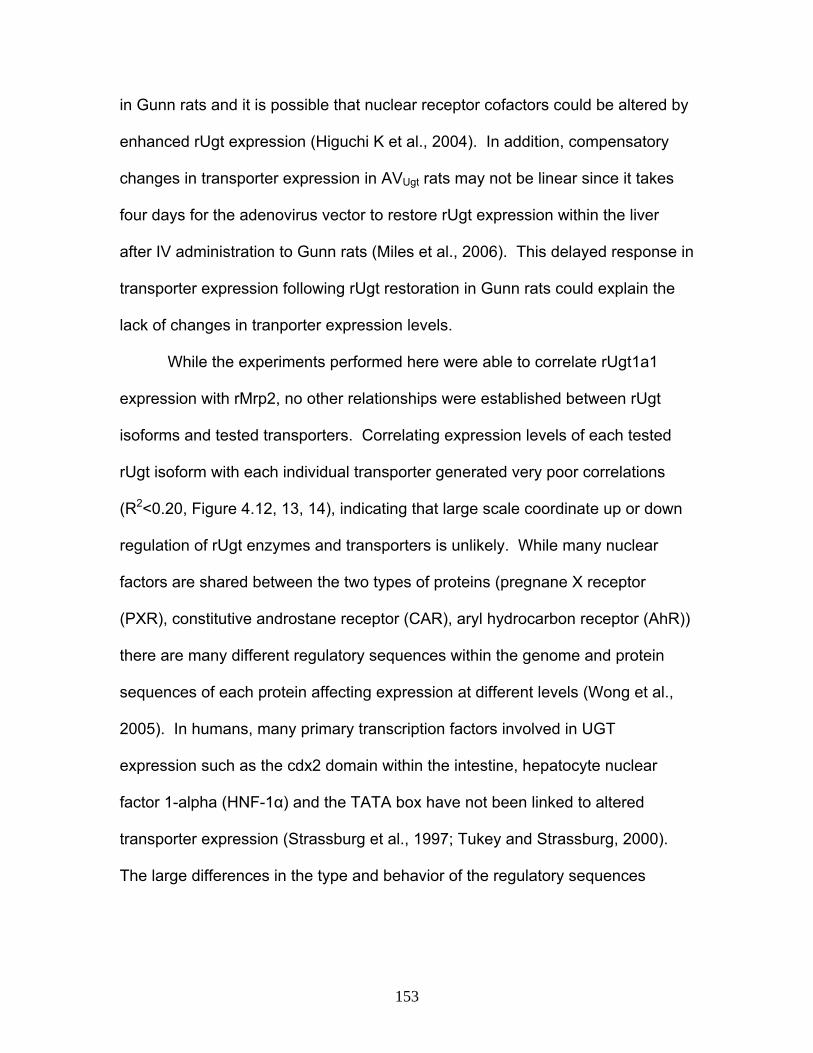
153
in Gunn rats and it is possible that nuclear receptor cofactors could be altered by
enhanced rUgt expression (Higuchi K et al., 2004). In addition, compensatory
changes in transporter expression in AVUgt rats may not be linear since it takes
four days for the adenovirus vector to restore rUgt expression within the liver
after IV administration to Gunn rats (Miles et al., 2006). This delayed response in
transporter expression following rUgt restoration in Gunn rats could explain the
lack of changes in tranporter expression levels.
While the experiments performed here were able to correlate rUgt1a1
expression with rMrp2, no other relationships were established between rUgt
isoforms and tested transporters. Correlating expression levels of each tested
rUgt isoform with each individual transporter generated very poor correlations
(R2<0.20, Figure 4.12, 13, 14), indicating that large scale coordinate up or down
regulation of rUgt enzymes and transporters is unlikely. While many nuclear
factors are shared between the two types of proteins (pregnane X receptor
(PXR), constitutive androstane receptor (CAR), aryl hydrocarbon receptor (AhR))
there are many different regulatory sequences within the genome and protein
sequences of each protein affecting expression at different levels (Wong et al.,
2005). In humans, many primary transcription factors involved in UGT
expression such as the cdx2 domain within the intestine, hepatocyte nuclear
factor 1-alpha (HNF-1α) and the TATA box have not been linked to altered
transporter expression (Strassburg et al., 1997; Tukey and Strassburg, 2000).
The large differences in the type and behavior of the regulatory sequences

154
between the two types of proteins may explain their lack of coordinate and
compensatory expression between subtypes and isoforms.
While there was no observed coordinate expression between the three
efflux membrane transporters and the three rUgt enzymes of interest, there were
strong correlations observed between MPAG formation levels with some of the
membrane transporters and rUgts. A very strong correlation was observed
between rMrp2 and MPA glucuronidation activity across all tissues, potentially
indicating that while individual compensatory regulation is unlikely between rUgts
and transporters, overall glucuronidation capacity could factor in efflux
transporter expression (Figure 4.12-14). This is also seen in TR- rat livers,
where rMrp2 expression is absent yet rUgt1a enzymes and rMrp3 are both
upregulated, resulting in increased glucuronide conjugate concentrations within
the blood due to increased efflux into the sinusoid of hepatocytes (Figure 4.1)
(Johnson et al., 2006). Miles et al. have previously established a strong
correlation between rUgt1a7 expression and MPA glucuronidation activity levels
in rats (Miles et al., 2006). Initially, this relationship was not seen in our
experiments; however, once the data from the intestinal tract was isolated from
the liver and kidney rUgt studies, a strong correlation was observed between
rUgt1a7 levels and MPA glucuronidation (Figure 4.12). The higher levels of
rUgt1a1 within the liver and kidney likely contributed to the nonlinear relationship
between rUgt1a7 levels and MPA glucuronidation activity.
This research successfully developed a targeted quantitative proteomic
method to analyze the primary rUgt1a isoforms and membrane transporters
155
involved in MPA metabolism and hepatic efflux in rats. While coordinate
regulation between individual rUgt isoforms and membrane transporters is
unlikely due to the high degree of sequence homology between UGT enzymes,
resulting in a number of similarities in substrate specificity between isoforms,
glucuronidation activity could potentially result in higher expression levels of
membrane transporters involved in glucuronide efflux (Meech and Mackenzie,
1997; Tukey and Strassburg, 2000). Previous experiments have suggested that
acMPAG is not reactive enough to be a primary factor in MPA induced toxicity,
so the increased expression of rUgt enzymes within the intestinal tract of both the
Wistar and TR- rat livers could potentially limit MPA exposure to intestinal
epithelial cells and toxicity within the gastrointestinal tract (Arns, 2007; Saitoh et
al., 2005; Stern et al., 2007). The likely combination of rMrp3 and rUgt1a1
upregulation within the liver of TR- rats contributes with the loss of rMrp2 to
elevated levels of MPAG and decreased levels of MPA within the blood while
markedly decreased biliary clearance indicates that rBcrp is not a primary
transporter involved in MPAG efflux in the rat. The continued development of
targeted quantitative proteomics will continue to advance our understanding of
the relationship between protein expression and metabolite disposition, providing
investigators with an improved ability to properly evaluate the inter relationships
of transporter protein and enzyme activity levels in tissues.
156
E. ACKNOWLEDGEMENTS
This work was made possible by funding through Cambridge Theranostics (U.K.)
and the NIH along with Dr. Yurong Lai and Dr. Brigitte Simons who provided
technical assistance.
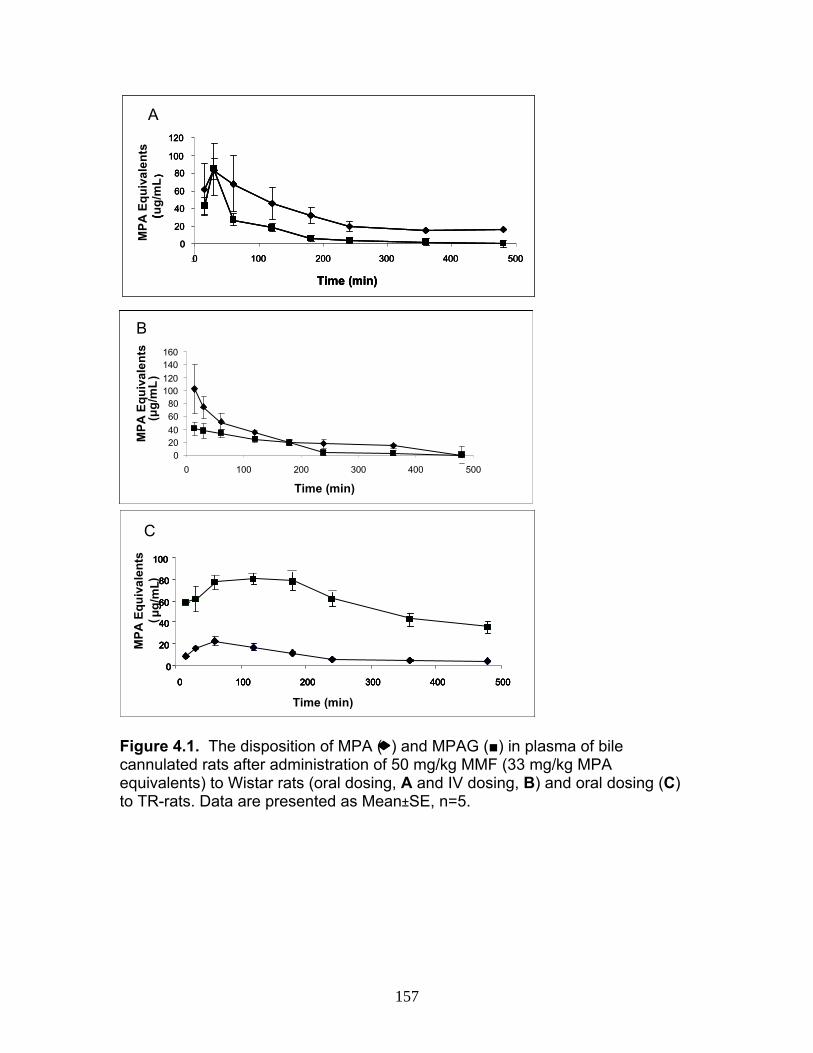
157
Wistar Rat Plasma MPA/MPAG
MPA■ MPAG
A
0
20
40
60
80
100
0 100 200 300 400 5000
20
40
60
80
100
0 100 200 300 400 5000
20
40
60
80
100
0 100 200 300 400 500
Time (min)
0
20
40
60
80
100
0 100 200 300 400 500
MPA
Equ
ival
ents
( ?g/
mL )
0
20
40
60
80
100
0 100 200 300 400 5000
20
40
60
80
100
0 100 200 300 400 5000
20
40
60
80
100
0 100 200 300 400 500
Time (min)
0
20
40
60
80
100
0 100 200 300 400 500
MPA
Equ
ival
ents
( ?g/
mL )
0
20
40
60
80
100
0 100 200 300 400 5000
20
40
60
80
100
0 100 200 300 400 5000
20
40
60
80
100
0 100 200 300 400 500
Time (min)
0
20
40
60
80
100
0 100 200 300 400 500
MPA
Equ
ival
ents
( μg/
mL)
C
Wistar Rat Plasma MPA/MPAG
MPA■ MPAG0
20406080
100120140160
0 100 200 300 400 500
Time (min)
MPA
Equ
ival
ents
(u
g/m
L)
B
020406080
100120140160
0 100 200 300 400 500
Time (min)
MPA
Equ
ival
ents
(u
g/m
L)
020406080
100120140160
0 100 200 300 400 500
Time (min)
MPA
Equ
ival
ents
(u
g/m
L)
020406080
100120140160
0 100 200 300 400 500
Time (min)
MPA
Equ
ival
ents
(μ
g/m
L)
B
0
20
40
60
80
100
120
0 100 200 300 400 500
Time (min)
MPA
Equ
ival
ents
(u
g/m
L)
C
0
20
40
60
80
100
120
0 100 200 300 400 500
Time (min)
MPA
Equ
ival
ents
(u
g/m
L)
0
20
40
60
80
100
120
0 100 200 300 400 500
Time (min)
()
0
20
40
60
80
100
120
0 100 200 300 400 500
Time (min)
()
A
Wistar Rat Plasma MPA/MPAG
MPA■ MPAG
A
0
20
40
60
80
100
0 100 200 300 400 5000
20
40
60
80
100
0 100 200 300 400 5000
20
40
60
80
100
0 100 200 300 400 500
Time (min)
0
20
40
60
80
100
0 100 200 300 400 500
MPA
Equ
ival
ents
( ?g/
mL )
0
20
40
60
80
100
0 100 200 300 400 5000
20
40
60
80
100
0 100 200 300 400 5000
20
40
60
80
100
0 100 200 300 400 500
Time (min)
0
20
40
60
80
100
0 100 200 300 400 500
MPA
Equ
ival
ents
( ?g/
mL )
0
20
40
60
80
100
0 100 200 300 400 5000
20
40
60
80
100
0 100 200 300 400 5000
20
40
60
80
100
0 100 200 300 400 500
Time (min)
0
20
40
60
80
100
0 100 200 300 400 500
MPA
Equ
ival
ents
( μg/
mL)
C
Wistar Rat Plasma MPA/MPAG
MPA■ MPAG
MPA■ MPAG
A
0
20
40
60
80
100
0 100 200 300 400 5000
20
40
60
80
100
0 100 200 300 400 5000
20
40
60
80
100
0 100 200 300 400 500
Time (min)
0
20
40
60
80
100
0 100 200 300 400 500
MPA
Equ
ival
ents
( ?g/
mL )
0
20
40
60
80
100
0 100 200 300 400 5000
20
40
60
80
100
0 100 200 300 400 5000
20
40
60
80
100
0 100 200 300 400 500
Time (min)
0
20
40
60
80
100
0 100 200 300 400 500
MPA
Equ
ival
ents
( ?g/
mL )
0
20
40
60
80
100
0 100 200 300 400 5000
20
40
60
80
100
0 100 200 300 400 5000
20
40
60
80
100
0 100 200 300 400 500
Time (min)
0
20
40
60
80
100
0 100 200 300 400 500
MPA
Equ
ival
ents
( ?g/
mL )
0
20
40
60
80
100
0 100 200 300 400 5000
20
40
60
80
100
0 100 200 300 400 5000
20
40
60
80
100
0 100 200 300 400 500
Time (min)
0
20
40
60
80
100
0 100 200 300 400 500
MPA
Equ
ival
ents
( μg/
mL)
C
Wistar Rat Plasma MPA/MPAG
MPA■ MPAG0
20406080
100120140160
0 100 200 300 400 500
Time (min)
MPA
Equ
ival
ents
(u
g/m
L)
B
020406080
100120140160
0 100 200 300 400 500
Time (min)
MPA
Equ
ival
ents
(u
g/m
L)
020406080
100120140160
0 100 200 300 400 500
Time (min)
MPA
Equ
ival
ents
(u
g/m
L)
020406080
100120140160
0 100 200 300 400 500
Time (min)
MPA
Equ
ival
ents
(μ
g/m
L)
B
Wistar Rat Plasma MPA/MPAG
MPA■ MPAG
MPA■ MPAG0
20406080
100120140160
0 100 200 300 400 500
Time (min)
MPA
Equ
ival
ents
(u
g/m
L)
020406080
100120140160
0 100 200 300 400 500
Time (min)
MPA
Equ
ival
ents
(u
g/m
L)
B
020406080
100120140160
0 100 200 300 400 500
Time (min)
MPA
Equ
ival
ents
(u
g/m
L)
020406080
100120140160
0 100 200 300 400 500
Time (min)
MPA
Equ
ival
ents
(u
g/m
L)
020406080
100120140160
0 100 200 300 400 500
Time (min)
MPA
Equ
ival
ents
(u
g/m
L)
020406080
100120140160
0 100 200 300 400 500
Time (min)
MPA
Equ
ival
ents
(μ
g/m
L)
B
0
20
40
60
80
100
120
0 100 200 300 400 500
Time (min)
MPA
Equ
ival
ents
(u
g/m
L)
C
0
20
40
60
80
100
120
0 100 200 300 400 500
Time (min)
MPA
Equ
ival
ents
(u
g/m
L)
0
20
40
60
80
100
120
0 100 200 300 400 500
Time (min)
()
0
20
40
60
80
100
120
0 100 200 300 400 500
Time (min)
()
A
0
20
40
60
80
100
120
0 100 200 300 400 500
Time (min)
MPA
Equ
ival
ents
(u
g/m
L)
0
20
40
60
80
100
120
0 100 200 300 400 500
Time (min)
MPA
Equ
ival
ents
(u
g/m
L)
C
0
20
40
60
80
100
120
0 100 200 300 400 500
Time (min)
MPA
Equ
ival
ents
(u
g/m
L)
0
20
40
60
80
100
120
0 100 200 300 400 500
Time (min)
MPA
Equ
ival
ents
(u
g/m
L)
0
20
40
60
80
100
120
0 100 200 300 400 500
Time (min)
()
0
20
40
60
80
100
120
0 100 200 300 400 500
Time (min)
()
A
Figure 4.1. The disposition of MPA ( ) and MPAG (■) in plasma of bile cannulated rats after administration of 50 mg/kg MMF (33 mg/kg MPA equivalents) to Wistar rats (oral dosing, A and IV dosing, B) and oral dosing (C) to TR-rats. Data are presented as Mean±SE, n=5.
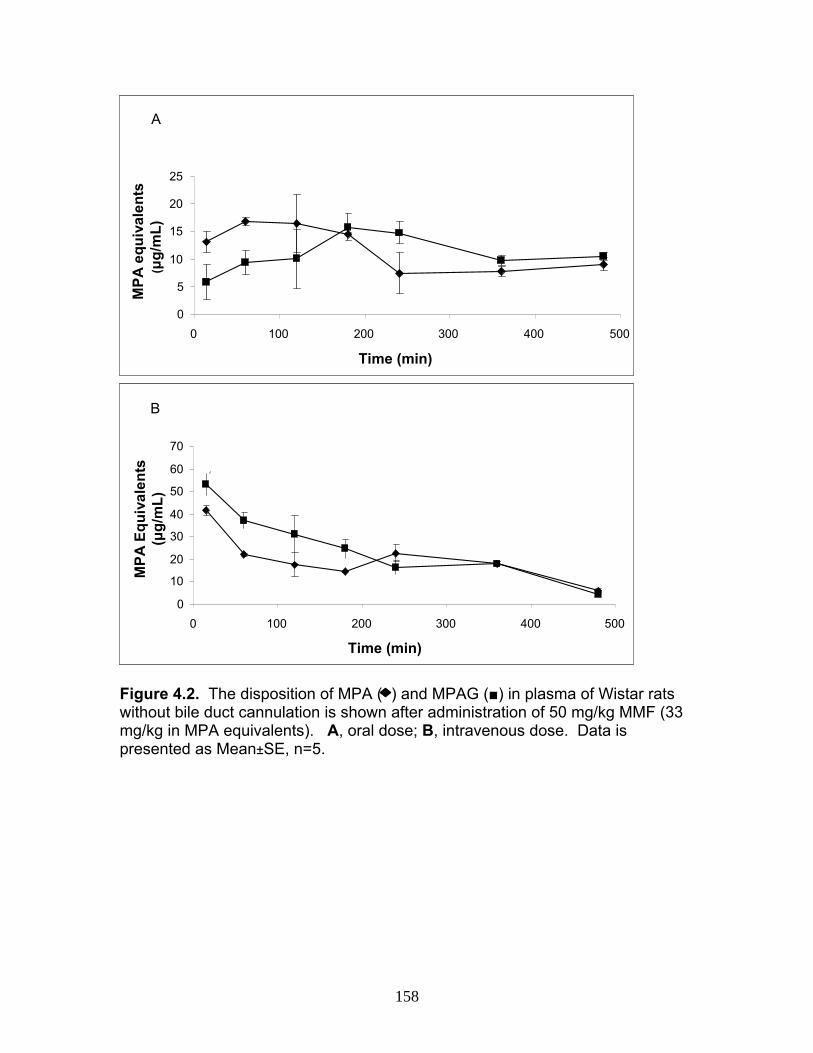
158
0
5
10
15
20
25
0 100 200 300 400 500
Time (min)
MPA
equ
ival
ents
(μ
g/m
L)
0
10
20
30
40
50
60
70
0 100 200 300 400 500
Time (min)
MPA
Equ
ival
ents
(μ
g/m
L)
A
B
0
5
10
15
20
25
0 100 200 300 400 500
Time (min)
MPA
equ
ival
ents
(μ
g/m
L)
0
10
20
30
40
50
60
70
0 100 200 300 400 500
Time (min)
MPA
Equ
ival
ents
(μ
g/m
L)
A
B
Figure 4.2. The disposition of MPA ( ) and MPAG (■) in plasma of Wistar rats without bile duct cannulation is shown after administration of 50 mg/kg MMF (33 mg/kg in MPA equivalents). A, oral dose; B, intravenous dose. Data is presented as Mean±SE, n=5.

159
0
2000
4000
6000
8000
10000
12000
0 100 200 300 400 500Time (min)
Tota
l Bili
ary
Excr
etio
n (μ
g in
MPA
Eq
uiva
lent
s)
0
2000
4000
6000
8000
10000
12000
0 100 200 300 400 500Time (min)
Tota
l Bili
ary
Excr
etio
n (μ
g in
MPA
Eq
uiva
lent
s)
Figure 4.3. Total biliary excretion of combined acMPAG and MPAG in Wistar and TR- rats after a single 50 mg/kg dose of MMF (33 mg/kg in MPA equivalents). Biliary excretion values are shown for oral (■, top) and IV ( ) dosing to Wistar rats and oral dosing to TR- (■, bottom) rats. Data represents mean ±SE of biliary excretion values (n=5). In all cases acMPAG was a minor component of bile representing ~5% of MPA equivalents in bile. MPA was not measureable in bile.
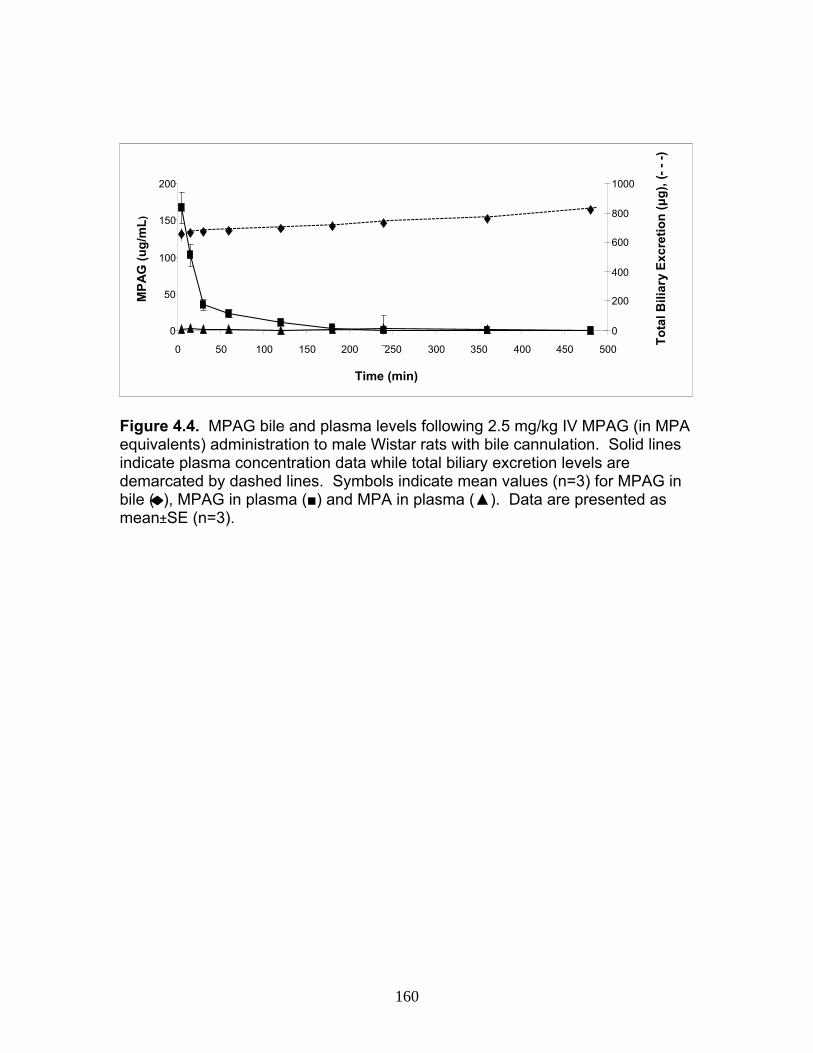
160
0
50
100
150
200
0 50 100 150 200 250 300 350 400 450 500
Time (min)
MPA
G (u
g/m
L)
0
200
400
600
800
1000
Tota
l Bili
ary
Excr
etio
n (μ
g), (
---)
0
50
100
150
200
0 50 100 150 200 250 300 350 400 450 500
Time (min)
MPA
G (u
g/m
L)
0
200
400
600
800
1000
Tota
l Bili
ary
Excr
etio
n (μ
g), (
---)
Figure 4.4. MPAG bile and plasma levels following 2.5 mg/kg IV MPAG (in MPA equivalents) administration to male Wistar rats with bile cannulation. Solid lines indicate plasma concentration data while total biliary excretion levels are demarcated by dashed lines. Symbols indicate mean values (n=3) for MPAG in bile ( ), MPAG in plasma (■) and MPA in plasma (▲). Data are presented as mean±SE (n=3).
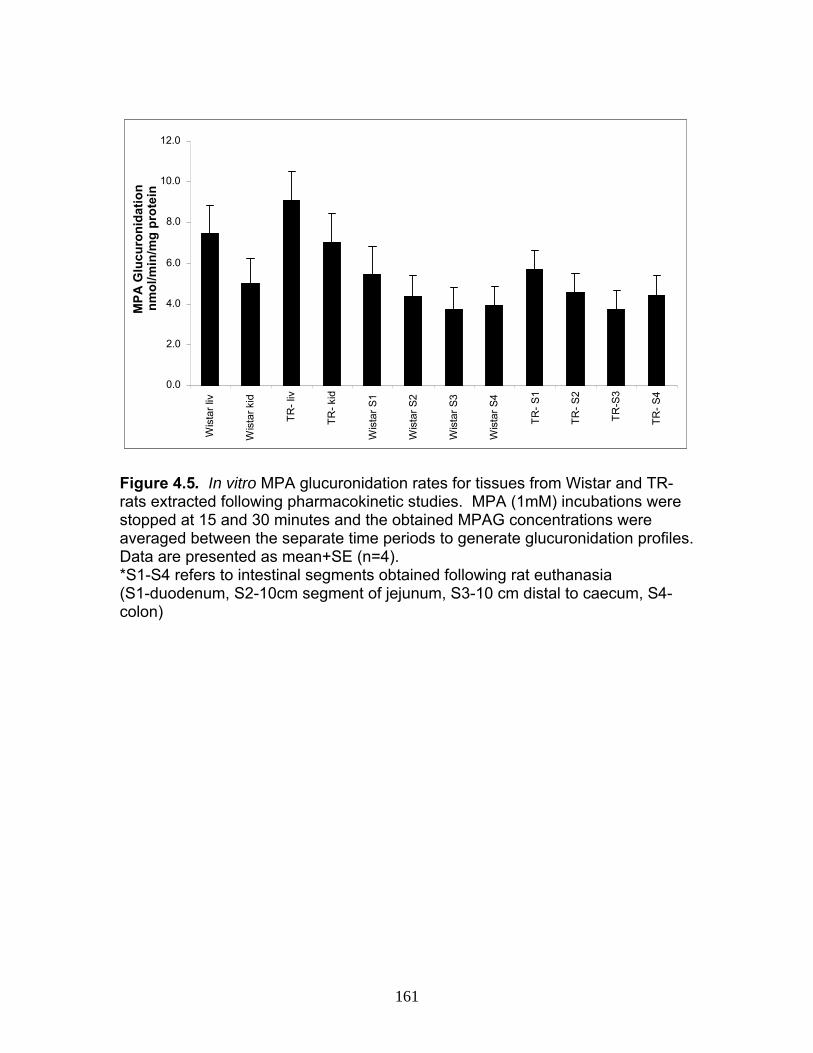
161
0.0
2.0
4.0
6.0
8.0
10.0
12.0
Wis
tarl
iv
Wis
tark
id
TR-l
iv
TR-k
id
Wis
tarS
1
Wis
tarS
2
Wis
tarS
3
Wis
tarS
4
TR-S
1
TR-S
2
TR-S
3
TR-S
4
nmol
/min
/mg
prot
ein
MPA
Glu
curo
nida
tion
0.0
2.0
4.0
6.0
8.0
10.0
12.0
Wis
tarl
iv
Wis
tark
id
TR-l
iv
TR-k
id
Wis
tarS
1
Wis
tarS
2
Wis
tarS
3
Wis
tarS
4
TR-S
1
TR-S
2
TR-S
3
TR-S
4
nmol
/min
/mg
prot
ein
MPA
Glu
curo
nida
tion
Figure 4.5. In vitro MPA glucuronidation rates for tissues from Wistar and TR- rats extracted following pharmacokinetic studies. MPA (1mM) incubations were stopped at 15 and 30 minutes and the obtained MPAG concentrations were averaged between the separate time periods to generate glucuronidation profiles. Data are presented as mean+SE (n=4). *S1-S4 refers to intestinal segments obtained following rat euthanasia (S1-duodenum, S2-10cm segment of jejunum, S3-10 cm distal to caecum, S4- colon)

162
+MS2 (575.40) CE (50): 21 MCA scans from Sample 2 (Peptide3) of Peptide3q3.wiff (Turbo Spray) Max. 9.6e5 cps.
350 400 450 500 550 600 650 700 750 800 850 900 950 1000m/z, Da
0.0
5.0e4
1.0e5
1.5e5
2.0e5
2.5e5
3.0e5
3.5e5
4.0e5
4.5e5
5.0e5
5.5e5
6.0e5
6.5e5
7.0e5
7.5e5
8.0e5
8.5e5
9.0e5
9.5e5506.4
448.1
435.4
621.4
383.3
418.3365.2 454.3 489.3
400.1 411.1 778.1603.3516.2445.3385.1 889.4471.3 586.2 632.4534.2439.2 788.5 906.4
y5
y4
y6 y-NH3-7y7
y5
y4
y6 y-NH3-7y7
Figure 4.6. Representative product ion scan of 1 μg/mL infusion of peptide 3 heavy labeled standard (ENQF*DALFR, parent ion 575.4) on the QTRAP 5500 system yielding product ions for MRM quantification of peptide 3 representing rUgt1a6. Product ions y4 and y5 were selected for quantification based on signal intensities.
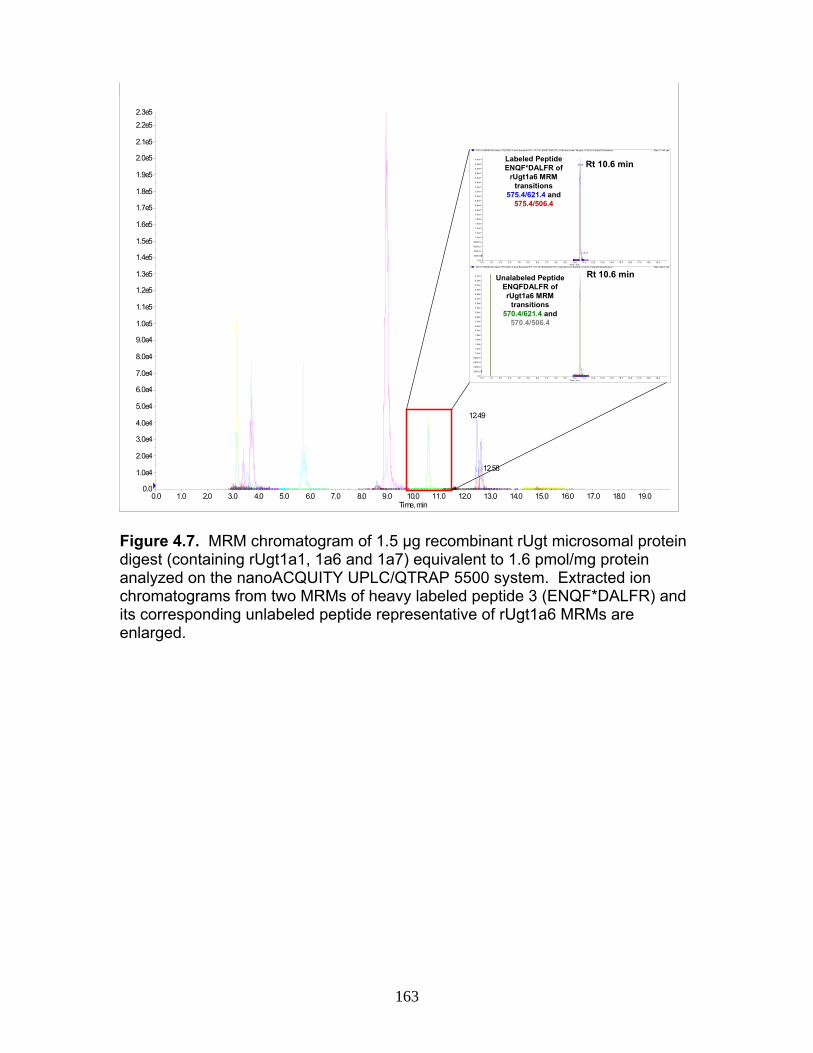
163
0.0 1.0 2.0 3.0 4.0 5.0 6.0 7.0 8.0 9.0 10.0 11.0 12.0 13.0 14.0 15.0 16.0 17.0 18.0 19.0Time, min
0.0
1.0e4
2.0e4
3.0e4
4.0e4
5.0e4
6.0e4
7.0e4
8.0e4
9.0e4
1.0e5
1.1e5
1.2e5
1.3e5
1.4e5
1.5e5
1.6e5
1.7e5
1.8e5
1.9e5
2.0e5
2.1e5
2.2e5
2.3e5
12.49
12.58
XIC of +MRM (60 pairs): 570.4/621.4 amu Expected RT: 10.7 ID: ENQFDALFR1_1A6.light from Sample 19 (6.0) of Data0722calibration... Max. 449.0 cps .
0.0 1.0 2.0 3.0 4.0 5.0 6.0 7.0 8.0 9.0 10.0 11.0 12.0 13.0 14.0 15.0 16.0 17.0 18.0 19.0Time, min
0.0
2000.0
4000.0
6000.0
8000.0
1.0e4
1.2e4
1.4e4
1.6e4
1.8e4
2.0e4
2.2e4
2.4e4
2.6e4
2.8e4
3.0e4
3.2e4
3.4e4
3.6e4
3.8e4
4.0e4
4.2e4
4.4e4
XIC of +MRM (60 pai rs): 575.4/621.4 amu Expected R T: 10.7 ID: ENQF*DALFR1_1A6.heavy from Sample 19 (6.0) of Data0722calibrati... Max. 4.1e4 cps .
0.0 1.0 2.0 3.0 4.0 5.0 6.0 7.0 8.0 9.0 10.0 11.0 12.0 13.0 14.0 15.0 16.0 17.0 18.0 19.0Time, min
0.0
2000.0
4000.0
6000.0
8000.0
1.0e4
1.2e4
1.4e4
1.6e4
1.8e4
2.0e4
2.2e4
2.4e4
2.6e4
2.8e4
3.0e4
3.2e4
3.4e4
3.6e4
3.8e4
4.0e4
4.2e4
4.4e4
10.60
10.71
Labeled Peptide ENQF*DALFR of
rUgt1a6 MRM transitions
575.4/621.4 and 575.4/506.4
Unalabeled Peptide ENQFDALFR of rUgt1a6 MRM
transitions 570.4/621.4 and
570.4/506.4
Rt 10.6 min
Rt 10.6 min
0.0 1.0 2.0 3.0 4.0 5.0 6.0 7.0 8.0 9.0 10.0 11.0 12.0 13.0 14.0 15.0 16.0 17.0 18.0 19.0Time, min
0.0
1.0e4
2.0e4
3.0e4
4.0e4
5.0e4
6.0e4
7.0e4
8.0e4
9.0e4
1.0e5
1.1e5
1.2e5
1.3e5
1.4e5
1.5e5
1.6e5
1.7e5
1.8e5
1.9e5
2.0e5
2.1e5
2.2e5
2.3e5
12.49
12.58
XIC of +MRM (60 pairs): 570.4/621.4 amu Expected RT: 10.7 ID: ENQFDALFR1_1A6.light from Sample 19 (6.0) of Data0722calibration... Max. 449.0 cps .
0.0 1.0 2.0 3.0 4.0 5.0 6.0 7.0 8.0 9.0 10.0 11.0 12.0 13.0 14.0 15.0 16.0 17.0 18.0 19.0Time, min
0.0
2000.0
4000.0
6000.0
8000.0
1.0e4
1.2e4
1.4e4
1.6e4
1.8e4
2.0e4
2.2e4
2.4e4
2.6e4
2.8e4
3.0e4
3.2e4
3.4e4
3.6e4
3.8e4
4.0e4
4.2e4
4.4e4
XIC of +MRM (60 pai rs): 575.4/621.4 amu Expected R T: 10.7 ID: ENQF*DALFR1_1A6.heavy from Sample 19 (6.0) of Data0722calibrati... Max. 4.1e4 cps .
0.0 1.0 2.0 3.0 4.0 5.0 6.0 7.0 8.0 9.0 10.0 11.0 12.0 13.0 14.0 15.0 16.0 17.0 18.0 19.0Time, min
0.0
2000.0
4000.0
6000.0
8000.0
1.0e4
1.2e4
1.4e4
1.6e4
1.8e4
2.0e4
2.2e4
2.4e4
2.6e4
2.8e4
3.0e4
3.2e4
3.4e4
3.6e4
3.8e4
4.0e4
4.2e4
4.4e4
10.60
10.71
Labeled Peptide ENQF*DALFR of
rUgt1a6 MRM transitions
575.4/621.4 and 575.4/506.4
Unalabeled Peptide ENQFDALFR of rUgt1a6 MRM
transitions 570.4/621.4 and
570.4/506.4
Rt 10.6 min
Rt 10.6 min
Figure 4.7. MRM chromatogram of 1.5 µg recombinant rUgt microsomal protein digest (containing rUgt1a1, 1a6 and 1a7) equivalent to 1.6 pmol/mg protein analyzed on the nanoACQUITY UPLC/QTRAP 5500 system. Extracted ion chromatograms from two MRMs of heavy labeled peptide 3 (ENQF*DALFR) and its corresponding unlabeled peptide representative of rUgt1a6 MRMs are enlarged.

164
y2 = 0.4942x + 0.0246R2 = 0.995
y1 = 0.5211x + 0.0293R2 = 0.9975
0.00.51.01.52.02.53.03.5
0 2 4 6
Micrograms of recombinant 1a6 microsomal protein
Peak
Are
a R
atio
(u
nlab
eled
/labe
led)
570.4/621.4570.4/506.4
y2 = 0.4942x + 0.0246R2 = 0.995
y1 = 0.5211x + 0.0293R2 = 0.9975
0.00.51.01.52.02.53.03.5
0 2 4 6
Micrograms of recombinant 1a6 microsomal protein
Peak
Are
a R
atio
(u
nlab
eled
/labe
led)
570.4/621.4570.4/506.4
Figure 4.8. Calibration curves constructed from 5 replicate digests for two MRMs (y1 570.4/621.4, y2 570.4/506.4) of peptide 3 representative of rUgt1a6. Data is presented as mean ± SE.

165
0102030405060708090
100
0 5 10 15 20
Time (hours)
% T
otal
Fra
ctio
n
0102030405060708090
100
0 5 10 15 20
Time (hours)
% T
otal
Fra
ctio
n
Figure 4.9. Time dependant tryptic digestion of β-casein protein using specific MRMs from two peptides monitoring missed cleavages sites performed in triplicate. Peptide MRMs representing complete (solid line) digestion obtained from peptides FFSDK ( ) and YIPIQYVLSR ( ) and incomplete digestion (dotted line) from DERFFSDK ( ) and IAKYIPIQYVLSR ( ). Peak areas ratios were obtained from the peptide MRMs using peptide 4 (ENQF*DALFR) as the internal standard. Measured area ratios were then compared between missed cleavage peptides to generate time dependant digestion curve.

166
Figure 4.10. Graph indicates mean+SE (n=3 animals in duplicate) rUgt expression levels in tested rat tissues obtained following pharmacokinetic studies. One way ANOVA statistical analyses were used to evaluate potential significant differences in expression between each enzyme isoform across all tested tissues along with evaluating strain differences in rUgt expression. *W refers to Wistar rat samples while TR- refers to TR- rats samples AV tissues indicates livers that were obtained from Dr. Ritter representing adenovirus (AVUgt) treatment of native Gunn rats to restore glucuronidation capacity **S1-S4 refer to different segments of the GI tract extracted following euthanasia of rats with S1 containing the duodenum and S4 the distal colon as detailed in METHODS a Significantly different between other tissue samples (rUgt1a1) (p<0.05)
a
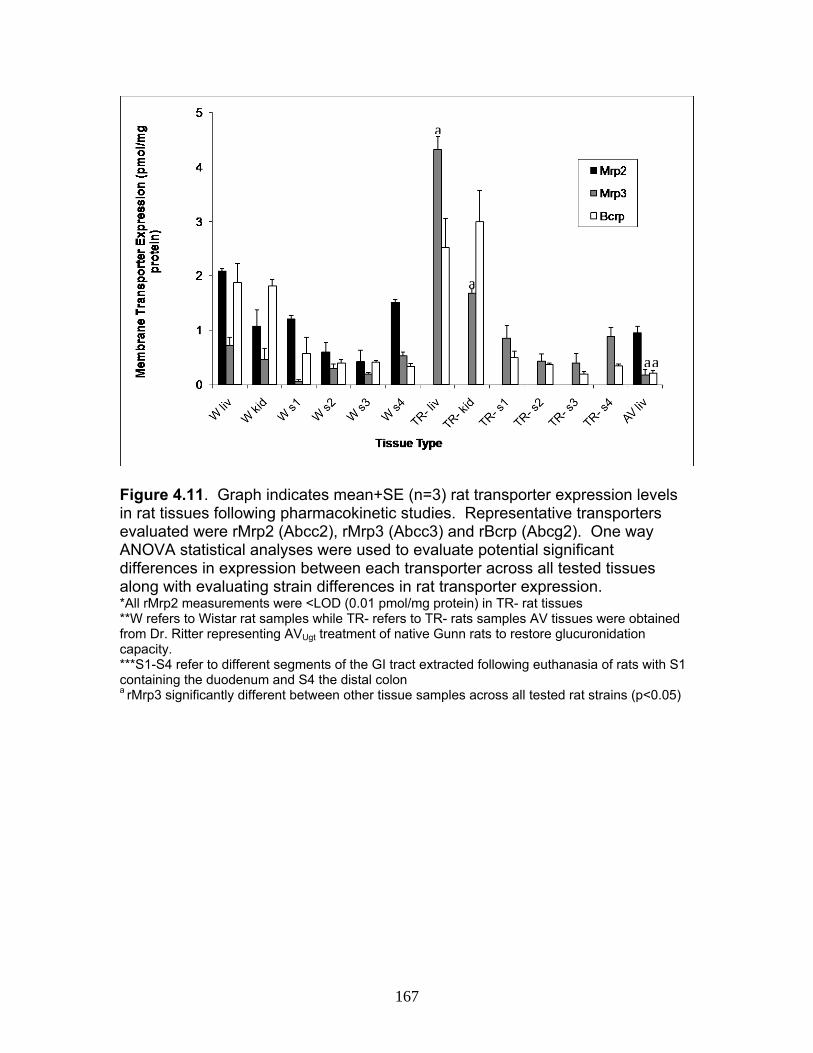
167
Figure 4.11. Graph indicates mean+SE (n=3) rat transporter expression levels in rat tissues following pharmacokinetic studies. Representative transporters evaluated were rMrp2 (Abcc2), rMrp3 (Abcc3) and rBcrp (Abcg2). One way ANOVA statistical analyses were used to evaluate potential significant differences in expression between each transporter across all tested tissues along with evaluating strain differences in rat transporter expression. *All rMrp2 measurements were <LOD (0.01 pmol/mg protein) in TR- rat tissues **W refers to Wistar rat samples while TR- refers to TR- rats samples AV tissues were obtained from Dr. Ritter representing AVUgt treatment of native Gunn rats to restore glucuronidation capacity. ***S1-S4 refer to different segments of the GI tract extracted following euthanasia of rats with S1 containing the duodenum and S4 the distal colon a rMrp3 significantly different between other tissue samples across all tested rat strains (p<0.05)
a
a
aa

168
0
1
2
3
4
5
6
0 0.5 1 1.5 2 2.5 3Intestinal rUgt 1a7 (pmol/mg protein)
in v
itro
MPA
glu
curo
nida
tion C
0123456789
10
0 1 2 3 4 5 6 7 8 9 10rUgt1a1 (pmol/mg protein)
In V
itro M
PA g
lucr
uoni
datio
n
A R2= 0.7578
▲
0123456789
10
0 1 2 3 4 5 6
rUgt1a6 (pmol/mg protein)
in v
itro
MPA
glu
curo
nida
tion
R2= 0.5983
B R2=0.0357
0
1
2
3
4
5
6
0 0.5 1 1.5 2 2.5 3Intestinal rUgt 1a7 (pmol/mg protein)
in v
itro
MPA
glu
curo
nida
tion C
0
1
2
3
4
5
6
0 0.5 1 1.5 2 2.5 3Intestinal rUgt 1a7 (pmol/mg protein)
in v
itro
MPA
glu
curo
nida
tion C
0123456789
10
0 1 2 3 4 5 6 7 8 9 10rUgt1a1 (pmol/mg protein)
In V
itro M
PA g
lucr
uoni
datio
n
A R2= 0.7578
▲
0123456789
10
0 1 2 3 4 5 6 7 8 9 10rUgt1a1 (pmol/mg protein)
In V
itro M
PA g
lucr
uoni
datio
n
A R2= 0.7578
▲
0123456789
10
0 1 2 3 4 5 6
rUgt1a6 (pmol/mg protein)
in v
itro
MPA
glu
curo
nida
tion
R2= 0.5983
B R2=0.0357
Figure 4.12. Correlation analysis relating glucuronidation activity (MPA catalysis) levels in rat liver (■), intestine ( ) and kidney (▲) (averaged, n=3 animals) to protein expression data obtained using quantitative proteomics. Correlation analysis was performed for glucuronidation rate vs. rUgt1a1 (A), glucuronidation rate vs. rUgt1a6 (B), glucuronidation rate vs. intestinal rUgt1a7 (C). Data points are averaged (n=3) from tissue measurements from microsomal protein or membrane fractions in Wistar, TR- and AVUgt rats (liver only). In vitro rates were matched with enzyme expression for each strain and tissue type to obtain R2 values.

169
0
12
3
4
56
7
0 0.5 1 1.5 2 2.5
rMrp2 (pmol/mg protein
In V
itro
MPA
glu
curo
nida
tion
R2 = 0.8469
A
0123456789
10
0 1 2 3 4 5
rMrp3 (pmol/mg protein)
in v
itro
MPA
glu
curo
nida
tion
R2= 0.5621
B
0123456789
10
0.0 0.5 1.0 1.5 2.0 2.5 3.0 3.5
rBcrp (pmol/mg protein)in v
itro
MPA
Glu
curo
nida
tion R2= 0.2964C
0
12
3
4
56
7
0 0.5 1 1.5 2 2.5
rMrp2 (pmol/mg protein
In V
itro
MPA
glu
curo
nida
tion
R2 = 0.8469
A
0
12
3
4
56
7
0 0.5 1 1.5 2 2.5
rMrp2 (pmol/mg protein
In V
itro
MPA
glu
curo
nida
tion
R2 = 0.8469
A
0123456789
10
0 1 2 3 4 5
rMrp3 (pmol/mg protein)
in v
itro
MPA
glu
curo
nida
tion
R2= 0.5621
B
0123456789
10
0 1 2 3 4 5
rMrp3 (pmol/mg protein)
in v
itro
MPA
glu
curo
nida
tion
R2= 0.5621
B
0123456789
10
0.0 0.5 1.0 1.5 2.0 2.5 3.0 3.5
rBcrp (pmol/mg protein)in v
itro
MPA
Glu
curo
nida
tion
0123456789
10
0.0 0.5 1.0 1.5 2.0 2.5 3.0 3.5
rBcrp (pmol/mg protein)in v
itro
MPA
Glu
curo
nida
tion R2= 0.2964C
Figure 4.13. Correlation analysis relating glucuronidation activity (MPA catalysis) levels in rat liver (■), intestine ( ) and kidney (▲) (averaged, n=3 animals) to protein expression data obtained using quantitative proteomics. Correlation analysis was performed for glucuronidation rate vs. rMrp2 (A), glucuronidation rate vs. rMrp3 (B), glucuronidation rate vs. intestinal rBcrp (C). Data points are averaged (n=3) from tissue measurements from microsomal protein or membrane fractions in Wistar, TR- and AVUgt rats (liver only). In vitro rates were matched with enzyme expression for each strain and tissue type to obtain R2 values.
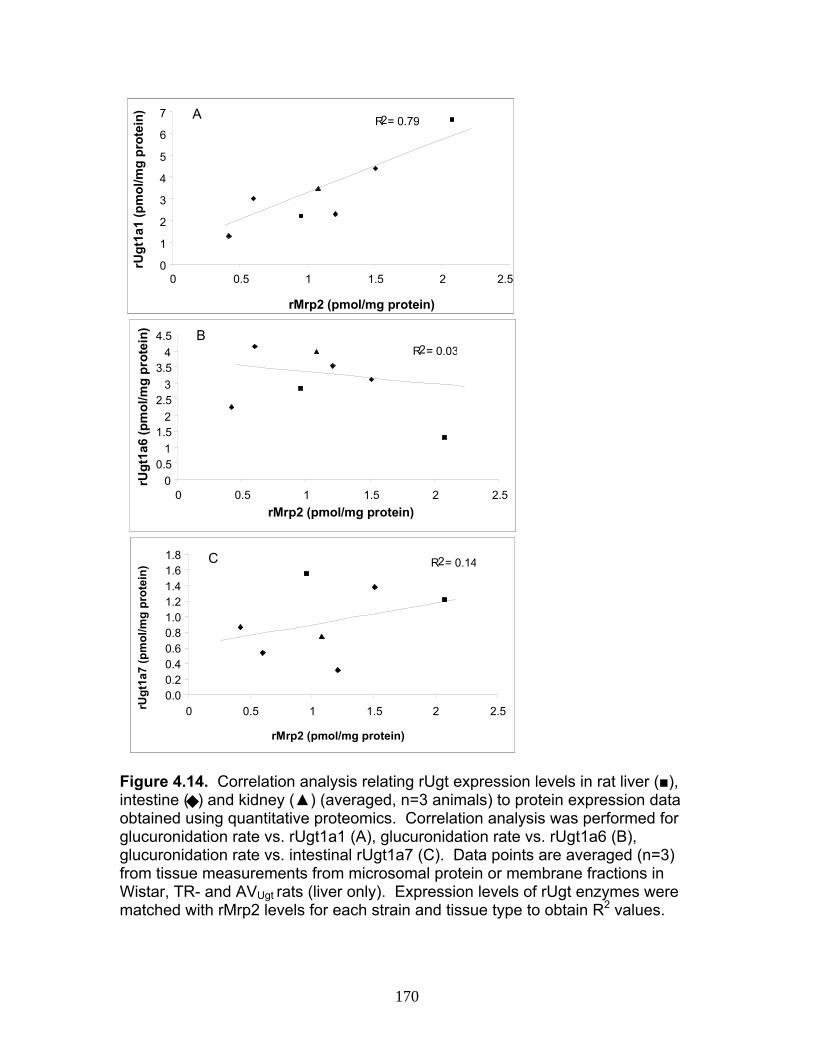
170
0
1
2
3
4
5
6
7
0 0.5 1 1.5 2 2.5
rMrp2 (pmol/mg protein)
rUgt
1a1
(pm
ol/m
g pr
otei
n) R2= 0.7943A
00.5
11.5
22.5
33.5
44.5
0 0.5 1 1.5 2 2.5rMrp2 (pmol/mg protein)
rUgt
1a6
(pm
ol/m
g pr
otei
n)
R2= 0.0374B
0.00.20.40.60.81.01.21.41.61.8
0 0.5 1 1.5 2 2.5
rMrp2 (pmol/mg protein)
rUgt
1a7
(pm
ol/m
g pr
otei
n)
R2= 0.1467C
0
1
2
3
4
5
6
7
0 0.5 1 1.5 2 2.5
rMrp2 (pmol/mg protein)
rUgt
1a1
(pm
ol/m
g pr
otei
n) R2= 0.7943A
0
1
2
3
4
5
6
7
0 0.5 1 1.5 2 2.5
rMrp2 (pmol/mg protein)
rUgt
1a1
(pm
ol/m
g pr
otei
n) R2= 0.7943A
00.5
11.5
22.5
33.5
44.5
0 0.5 1 1.5 2 2.5rMrp2 (pmol/mg protein)
rUgt
1a6
(pm
ol/m
g pr
otei
n)
R2= 0.0374B
00.5
11.5
22.5
33.5
44.5
0 0.5 1 1.5 2 2.5rMrp2 (pmol/mg protein)
rUgt
1a6
(pm
ol/m
g pr
otei
n)
R2= 0.0374B
0.00.20.40.60.81.01.21.41.61.8
0 0.5 1 1.5 2 2.5
rMrp2 (pmol/mg protein)
rUgt
1a7
(pm
ol/m
g pr
otei
n)
R2= 0.1467C
0.00.20.40.60.81.01.21.41.61.8
0 0.5 1 1.5 2 2.5
rMrp2 (pmol/mg protein)
rUgt
1a7
(pm
ol/m
g pr
otei
n)
0.00.20.40.60.81.01.21.41.61.8
0 0.5 1 1.5 2 2.5
rMrp2 (pmol/mg protein)
rUgt
1a7
(pm
ol/m
g pr
otei
n)
R2= 0.1467C
Figure 4.14. Correlation analysis relating rUgt expression levels in rat liver (■), intestine ( ) and kidney (▲) (averaged, n=3 animals) to protein expression data obtained using quantitative proteomics. Correlation analysis was performed for glucuronidation rate vs. rUgt1a1 (A), glucuronidation rate vs. rUgt1a6 (B), glucuronidation rate vs. intestinal rUgt1a7 (C). Data points are averaged (n=3) from tissue measurements from microsomal protein or membrane fractions in Wistar, TR- and AVUgt rats (liver only). Expression levels of rUgt enzymes were matched with rMrp2 levels for each strain and tissue type to obtain R2 values.
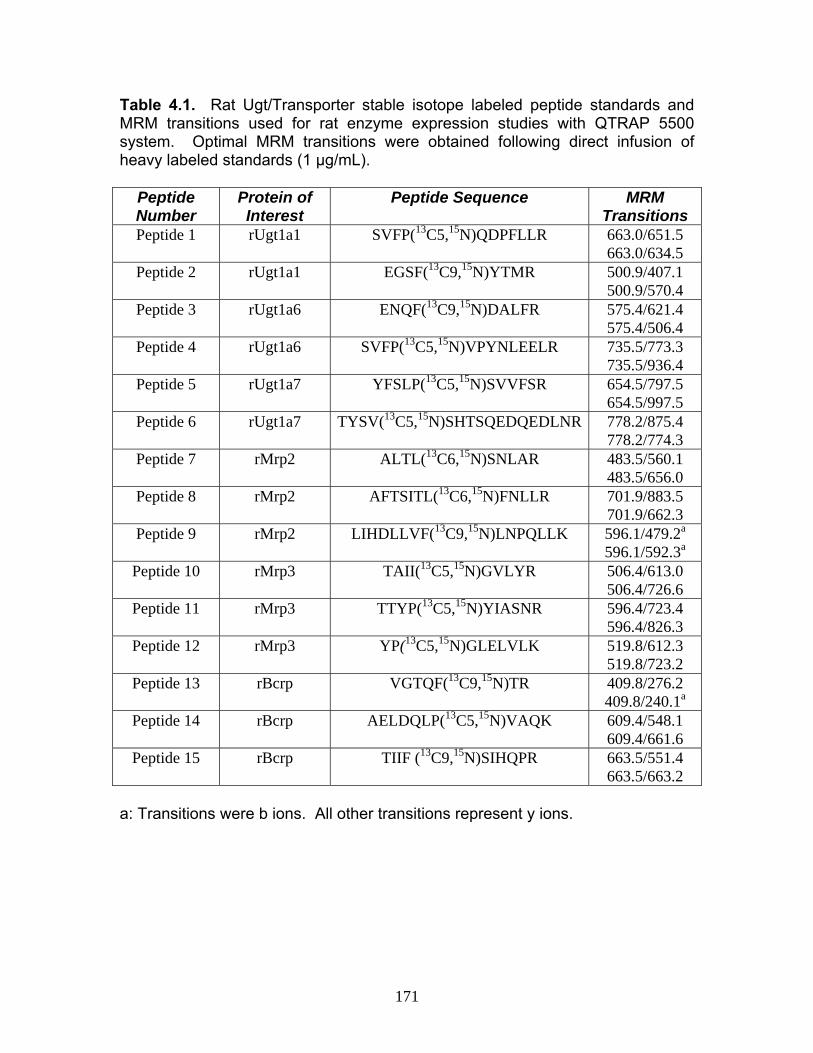
171
Table 4.1. Rat Ugt/Transporter stable isotope labeled peptide standards and MRM transitions used for rat enzyme expression studies with QTRAP 5500 system. Optimal MRM transitions were obtained following direct infusion of heavy labeled standards (1 μg/mL).
Peptide Number
Protein of Interest
Peptide Sequence MRM Transitions
Peptide 1 rUgt1a1 SVFP(13C5,15N)QDPFLLR 663.0/651.5 663.0/634.5
Peptide 2 rUgt1a1 EGSF(13C9,15N)YTMR 500.9/407.1 500.9/570.4
Peptide 3 rUgt1a6 ENQF(13C9,15N)DALFR 575.4/621.4 575.4/506.4
Peptide 4 rUgt1a6 SVFP(13C5,15N)VPYNLEELR 735.5/773.3 735.5/936.4
Peptide 5 rUgt1a7 YFSLP(13C5,15N)SVVFSR 654.5/797.5 654.5/997.5
Peptide 6 rUgt1a7 TYSV(13C5,15N)SHTSQEDQEDLNR 778.2/875.4 778.2/774.3
Peptide 7 rMrp2 ALTL(13C6,15N)SNLAR 483.5/560.1 483.5/656.0
Peptide 8 rMrp2 AFTSITL(13C6,15N)FNLLR
701.9/883.5 701.9/662.3
Peptide 9 rMrp2 LIHDLLVF(13C9,15N)LNPQLLK 596.1/479.2a 596.1/592.3a
Peptide 10 rMrp3 TAII(13C5,15N)GVLYR 506.4/613.0 506.4/726.6
Peptide 11 rMrp3 TTYP(13C5,15N)YIASNR 596.4/723.4 596.4/826.3
Peptide 12 rMrp3 YP(13C5,15N)GLELVLK 519.8/612.3 519.8/723.2
Peptide 13 rBcrp VGTQF(13C9,15N)TR 409.8/276.2 409.8/240.1a
Peptide 14 rBcrp AELDQLP(13C5,15N)VAQK 609.4/548.1 609.4/661.6
Peptide 15 rBcrp TIIF (13C9,15N)SIHQPR 663.5/551.4 663.5/663.2
a: Transitions were b ions. All other transitions represent y ions.
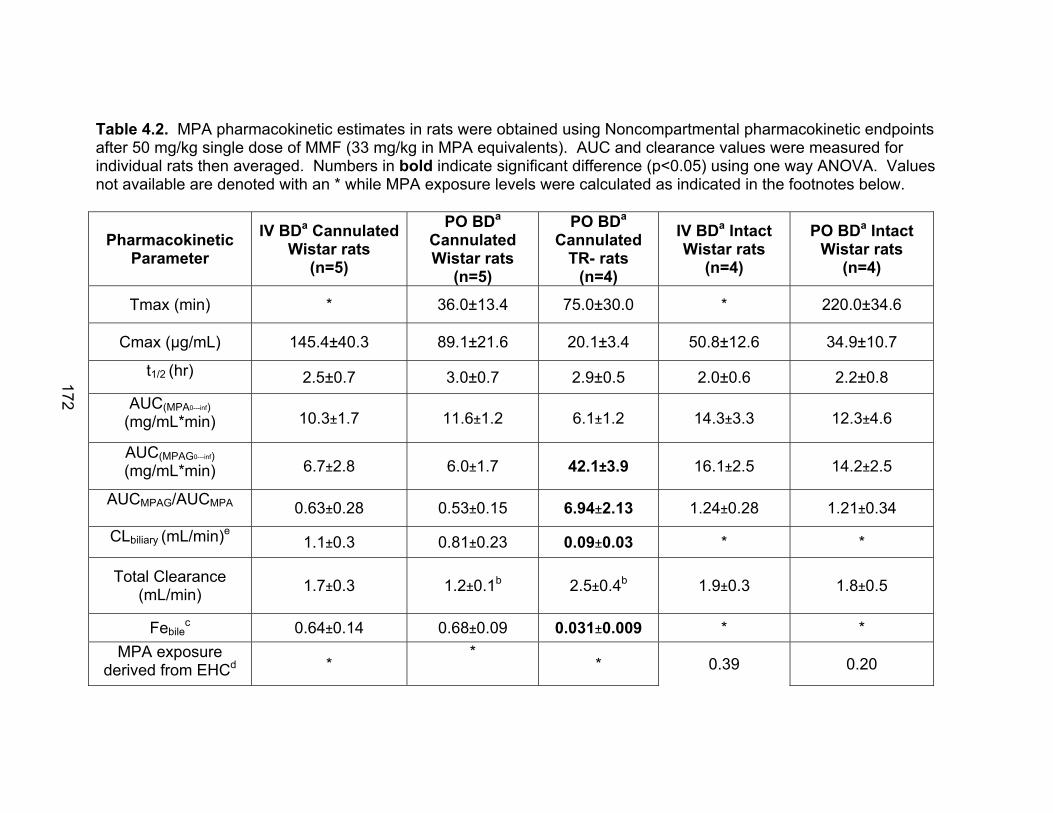
172
Table 4.2. MPA pharmacokinetic estimates in rats were obtained using Noncompartmental pharmacokinetic endpoints after 50 mg/kg single dose of MMF (33 mg/kg in MPA equivalents). AUC and clearance values were measured for individual rats then averaged. Numbers in bold indicate significant difference (p<0.05) using one way ANOVA. Values not available are denoted with an * while MPA exposure levels were calculated as indicated in the footnotes below.
Pharmacokinetic Parameter
IV BDa Cannulated Wistar rats
(n=5)
PO BDa
Cannulated Wistar rats
(n=5)
PO BDa Cannulated
TR- rats (n=4)
IV BDa Intact Wistar rats
(n=4)
PO BDa Intact Wistar rats
(n=4)
Tmax (min) * 36.0±13.4 75.0±30.0 * 220.0±34.6
Cmax (µg/mL) 145.4±40.3 89.1±21.6 20.1±3.4 50.8±12.6 34.9±10.7
t1/2 (hr) 2.5±0.7 3.0±0.7 2.9±0.5 2.0±0.6 2.2±0.8 AUC(MPA0---inf)
(mg/mL*min) 10.3±1.7 11.6±1.2 6.1±1.2 14.3±3.3 12.3±4.6
AUC(MPAG0---inf) (mg/mL*min) 6.7±2.8 6.0±1.7 42.1±3.9 16.1±2.5 14.2±2.5
AUCMPAG/AUCMPA 0.63±0.28 0.53±0.15 6.94±2.13 1.24±0.28 1.21±0.34
CLbiliary (mL/min)e 1.1±0.3 0.81±0.23 0.09±0.03 * *
Total Clearance (mL/min) 1.7±0.3 1.2±0.1b
2.5±0.4b
1.9±0.3 1.8±0.5
Febilec 0.64±0.14 0.68±0.09 0.031±0.009 * *
MPA exposure derived from EHCd *
* * 0.39 0.20
172
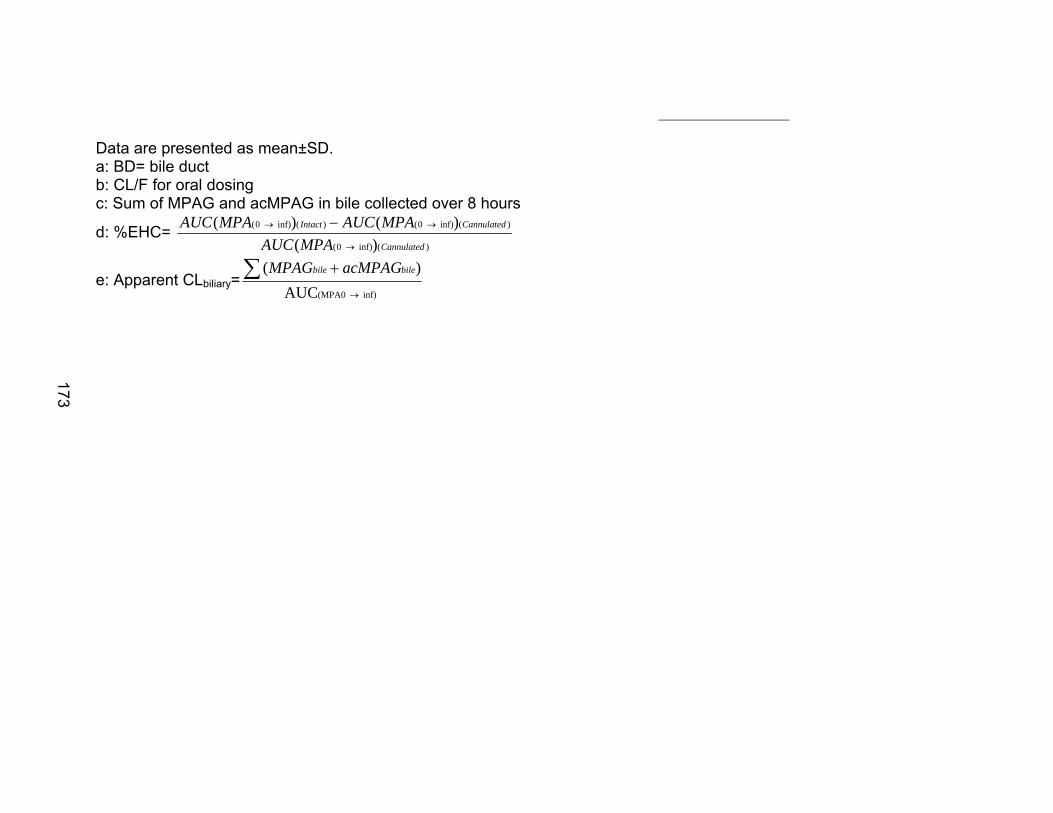
173
Data are presented as mean±SD. a: BD= bile duct b: CL/F for oral dosing c: Sum of MPAG and acMPAG in bile collected over 8 hours
d: %EHC= )(inf)0(
)(inf)0()(inf)0(
)()()(
Cannulated
CannulatedIntact
MPAAUCMPAAUCMPAAUC
→
→→ −
e: Apparent CLbiliary= AUC
)(inf)(MPA0 →
∑ + bilebile acMPAGMPAG
173
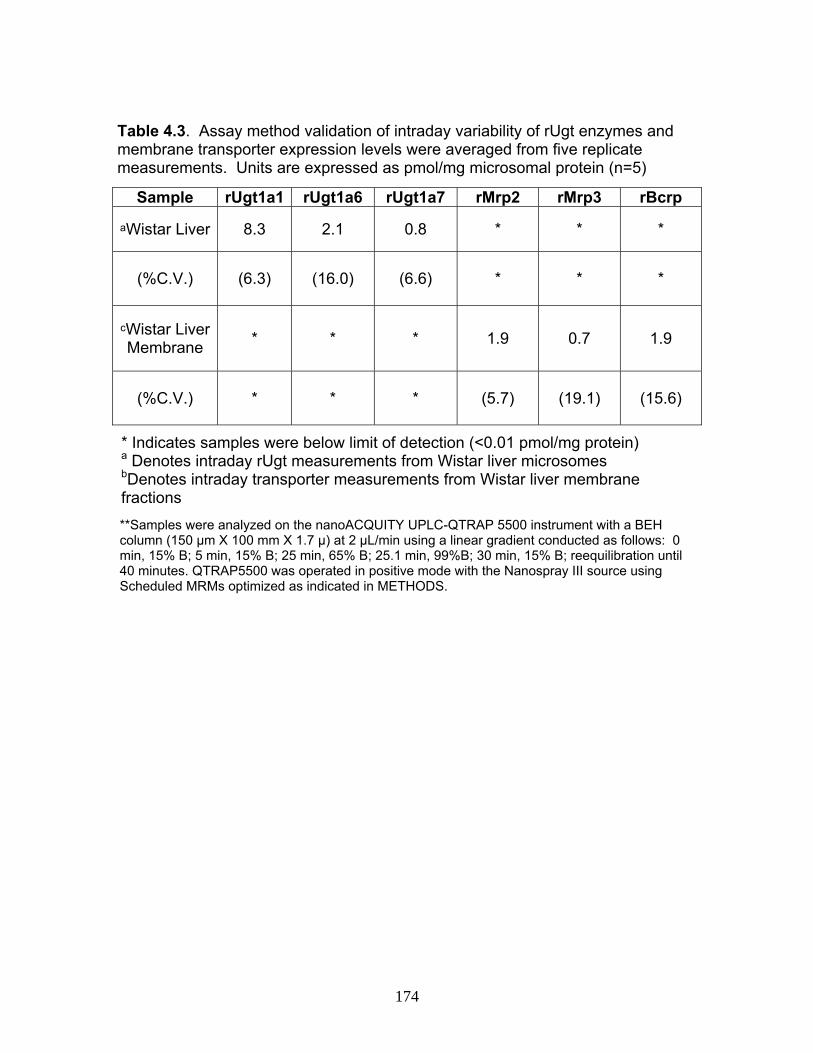
174
Sample rUgt1a1 rUgt1a6 rUgt1a7 rMrp2 rMrp3 rBcrp
aWistar Liver 8.3 2.1 0.8 * * *
(%C.V.) (6.3) (16.0) (6.6) * * *
cWistar Liver Membrane * * * 1.9 0.7 1.9
(%C.V.) * * * (5.7) (19.1) (15.6)
**Samples were analyzed on the nanoACQUITY UPLC-QTRAP 5500 instrument with a BEH column (150 μm X 100 mm X 1.7 μ) at 2 μL/min using a linear gradient conducted as follows: 0 min, 15% B; 5 min, 15% B; 25 min, 65% B; 25.1 min, 99%B; 30 min, 15% B; reequilibration until 40 minutes. QTRAP5500 was operated in positive mode with the Nanospray III source using Scheduled MRMs optimized as indicated in METHODS.
Table 4.3. Assay method validation of intraday variability of rUgt enzymes and membrane transporter expression levels were averaged from five replicate measurements. Units are expressed as pmol/mg microsomal protein (n=5)
* Indicates samples were below limit of detection (<0.01 pmol/mg protein) a Denotes intraday rUgt measurements from Wistar liver microsomes bDenotes intraday transporter measurements from Wistar liver membrane fractions

175
Table 4.4. Interday Variability of rUgt enzymes and membrane transporter expression levels were averaged from five replicate measurements in pmol/mg protein
Sample rUgt1a1 rUgt1a6 rUgt1a7 rMrp2 rMrp3 rBcrp aWistar Liver 8.1 1.9 1.0 * * *
(%C.V.) (7.9) (11.0) (15.6) * * * bWistar Liver
Membrane * * * 1.7 0.7 1.4
(%C.V.) * * * (18.6) (12.6) (8.8)
* Indicates samples were below limit of detection (<0.01 pmol/mg protein) a Denotes interday rUgt measurements from Wistar liver microsomes b Denotes interday transporter measurements from Wistar liver membrane **Samples were analyzed on the nanoACQUITY UPLC-QTRAP 5500 instrument with a BEH column (150 μm X 100 mm X 1.7 μ) at 2 μL/min using a linear gradient conducted as follows: 0 min, 15% B; 5 min, 15% B; 25 min, 65% B; 25.1 min, 99%B; 30 min, 15% B; reequilibration until 40 minutes. QTRAP5500 was operated in positive mode with the Nanospray III source using Scheduled MRMs optimized as indicated in METHODS.

176
Table 4.5. Individual peptide measurements of rUgt enzyme expression levels were averaged from five replicate measurements. Two MRMs from each peptide were selected (Table 4.1) and averaged between each individual sample.
Sample rUgt1a1 rUgt1a1 rUgt1a6 rUgt1a6 rUgt1a7 rUgt1a7 Peptide 1 2 3 4 5 6
rUgt (pmol/mg protein)
5.53 7.25 1.47 1.08 1.31 1.10
(%C.V.) (8.7) (16.1) (8.6) (12.3) (20.8) (6.3) *Samples were analyzed on the nanoACQUITY UPLC-QTRAP 5500 instrument with a BEH column (150 μm X 100 mm X 1.7 μ) at 2 μL/min using a linear gradient conducted as follows: 0 min, 15% B; 5 min, 15% B; 25 min, 65% B; 25.1 min, 99%B; 30 min, 15% B; reequilibration until 40 minutes. QTRAP5500 was operated in positive mode with the Nanospray III source using Scheduled MRMs optimized as indicated in METHODS. **Peptide Selection Rules for Quantification: 1) If recombinant protein available, must produce a linear standard curve with a %C.V. <25% at the base of the calibration curve, 2) must produce a %C.V. <25% on both interday/intraday validation, 3) if two peptides are used for protein quantification average protein concentrations must be within 50% of each other.

177
Table 4.6. Individual peptide measurements of rat transporter expression levels were averaged from five replicate measurements. Two MRMs from each peptide were selected (Table 4.1) and averaged between each individual sample. For each transporter three peptides were selected for quantification with the exception of rMrp3 due to the elimination of peptide 12 based on selection rules.
Sample rMrp2 rMrp2 rMrp2 rMrp3 rMrp3 rBcrp rBcrp rBcrp Peptide 7 8 9 10 11 13 14 15
Rat Transporter (pmol/mg protein)
1.53 2.13 1.71 0.54 0.44 1.61 1.39 2.09
(%C.V.) (14.5) (23.9) (11.9)_ (20.2) (19.2) (17.1) (17.6) (7.8) *Samples were analyzed on the nanoACQUITY UPLC-QTRAP 5500 instrument with a BEH column (150 μm X 100 mm X 1.7 μ) at 2 μL/min using a linear gradient conducted as follows: 0 min, 15% B; 5 min, 15% B; 25 min, 65% B; 25.1 min, 99%B; 30 min, 15% B; reequilibration until 40 minutes. QTRAP5500 was operated in positive mode with the Nanospray III source using Scheduled MRMs optimized as indicated in METHODS. **Peptide Selection Rules for Quantification: 1) If recombinant protein available, must produce a linear standard curve with a %C.V. <25% at the base of the calibration curve, 2) must produce a %C.V. <25% on both interday/intraday validation, 3) if two peptides are used for protein quantification average protein concentrations must be within 50% of each other.
177
178
F. References
Alterman MA, Kornilayev B, Duzhak T, Yakovlev D. Quantitative analysis of cytochrome p450 isozymes by means of unique isozyme-specific tryptic peptides: a proteomic approach. Drug Metab Dispos. 2005, 33(9),1399-407.
Arns W. Noninfectious gastrointestinal (GI) complications of mycophenolic acid therapy: a consequence of local GI toxicity? Transplant Proc. 2007, 39(1), 88-93.
Barnidge DR, Goodmanson MK, Klee GG, Muddiman DC. Absolute quantification of the model biomarker prostate-specific antigen in serum by LC-Ms/MS using protein cleavage and isotope dilution mass spectrometry. J Proteome Res. 2004, 3(3), 644-52.
Barr JR, Maggio VL, Patterson DG Jr, Cooper GR, Henderson LO, Turner WE, Smith SJ, Hannon WH, Needham LL, Sampson EJ. Isotope dilution--mass spectrometric quantification of specific proteins: model application with apolipoprotein A-I. Clin Chem. 1996, 42(10), 1676-82.
Beynon RJ, Doherty MK, Pratt JM, Gaskell SJ. Multiplexed absolute quantification in proteomics using artificial QCAT proteins of concatenated signature peptides. Nat Methods. 2005, 2(8), 587-9.
Brun V, Dupuis A, Adrait A, Marcellin M, Thomas D, Court M, Vandenesch F, Garin J. Isotope-labeled protein standards: toward absolute quantitative proteomics. Mol Cell Proteomics. 2007, 6(12), 2139-49.
Cañas B, López-Ferrer D, Ramos-Fernández A, Camafeita E, Calvo E. “Mass spectrometry technologies for proteomics.” Brief Funct Genomic Proteomic. 2006, 4(4), 295-320.
Catania VA, Luquita MG, Sánchez Pozzi EJ, Ikushiro S, Emi Y, Iyanagi T, Mottino AD. Effect of spironolactone on the expression of rat hepatic UDP-glucuronosyltransferase. Biochem Pharmacol. 2003, 66(1), 171-7.
Davies NM, Grinyó J, Heading R, Maes B, Meier-Kriesche HU, Oellerich M. Gastrointestinal side effects of mycophenolic acid in renal transplant patients: a reappraisal. Nephrol Dial Transplant. 2007, 22, 2440-2448.
Emi Y, Ikushiro S, Kato Y. Thyroxine-metabolizing rat uridine diphosphate-glucuronosyltransferase 1A7 is regulated by thyroid hormone receptor. Endocrinology. 2007, 148(12), 6124-33.
179
Fallon JK, Harbourt DE, Maleki SH, Kessler FK, Ritter JK and Smith PC, Absolute Quantification of Human Uridine-Diphosphate Glucuronosyl Transferase (UGT) Enzyme Isoforms 1A1 and 1A6 By Tandem LC MS, Drug Metabolism Letters. 2008, 2, 210-222.
Gerber SA, Rush J, Stemman O, Kirschner MW, Gygi SP.Absolute quantification of proteins and phosphoproteins from cell lysates by tandem MS. Proc Natl Acad Sci U S A. 2003, 100(12), 6940-5.
Goshe MB, Smith RD. Stable isotope-coded proteomic mass spectrometry. Curr Opin Biotechnol. 2003, 14(1), 101-9.
Gregory PA, Lewinsky RH, Gardner-Stephen DA, Mackenzie PI. Regulation of UDP glucuronosyltransferases in the gastrointestinal tract. Toxicol Appl Pharmacol. 2004, 199(3), 354-63.
Higuchi K, Kobayashi Y, Kuroda M, Tanaka Y, Itani T, Araki J, Mifuji R, Kaito M, Adachi Y. Modulation of organic anion transporting polypeptide 1 and multidrug resistance protein 3 expression in the liver and kidney of Gunn rats. Hepatol Res. 2004, 29(1), 60-66.
Hoofnagle AN, Becker JO, Wener MH, Heinecke JW. Quantification of thyroglobulin, a low-abundance serum protein, by immunoaffinity peptide enrichment and tandem mass spectrometry. Clin Chem. 2008, 54(11), 1796-804.
Hoofnagle AN, Wener MH. The fundamental flaws of immunoassays and potential solutions using tandem mass spectrometry. J Immunol Met. 2009, 347(1-2), 3-11. Huttlin EL, Chen X, Barrett-Wilt GA, Hegeman AD, Halberg RB, Harms AC, Newton MA, Dove WF, Sussman MR. Discovery and validation of colonic tumor-associated proteins via metabolic labeling and stable isotopic dilution. Proc Natl Acad Sci U S A. 2009, 106(40), 17235-40.
Jenkins RE, Kitteringham NR, Hunter CL, Webb S, Hunt TJ, Elsby R, Watson RB, Williams D, Pennington SR, Park BK. Relative and absolute quantitative expression profiling of cytochromes P450 using isotope-coded affinity tags. Proteomics. 2006, 6(6), 1934-47.
Johnson BM, Zhang P, Schuetz JD, Brouwer KL. Characterization of transport protein expression in multidrug resistance-associated protein (Mrp) 2-deficient rats. Drug Metab Dispos. 2006, 34(4), 556-62.
Kamiie J, Ohtsuki S, Iwase R, Ohmine K, Katsukura Y, Yanai K, Sekine Y, Uchida Y, Ito S, Terasaki T. Quantitative atlas of membrane transporter proteins:
180
development and application of a highly sensitive simultaneous LC/MS/MS method combined with novel in-silico peptide selection criteria. Pharm Res. 2008, 25(6), 1469-83.
Kirkpatrick DS, Gerber SA, Gygi SP. The absolute quantification strategy: a general procedure for the quantification of proteins and post-translational modifications. Methods. 2005, 35(3), 265-73.
Kuhn E, Wu J, Karl J, Liao H, Zolg W, Guild B. Quantification of C-reactive protein in the serum of patients with rheumatoid arthritis using multiple reaction monitoring mass spectrometry and 13C-labeled peptide standards. Proteomics. 2004, 4(4), 1175-86.
Li N, Nemirovskiy OV, Zhang Y, Yuan H, Mo J, Ji C, Zhang B, Brayman TG, Lepsy C, Heath TG, Lai Y. Absolute quantification of multidrug resistance-associated protein 2 (MRP2/ABCC2) using liquid chromatography tandem mass spectrometry. Anal Biochem. 2008, 380(2), 211-22.
Li N, Palandra J, Nemirovskiy OV, Lai Y. LC-MS/MS Mediated Absolute Quantification and Comparison of Bile Salt Export Pump and Breast Cancer Resistance Protein in Livers and Hepatocytes across Species. Anal Chem. 2009.
Li N, Zhang Y, Hua F, Lai Y. Absolute difference of hepatobiliary transporter multidrug resistance-associated protein (MRP2/Mrp2) in liver tissues and isolated hepatocytes from rat, dog, monkey, and human. Drug Metab Dispos. 2009, 37(1), 66-73.
Meech R and Mackenzie PI. UDP-Glucuronosyltransferase, the Role of the Amino Terminus in Dimerization. J Biol Chem. 1997, 272(43), 26913-26917.
Miles KK, Kessler FK, Smith PC, Ritter JK. Characterization of rat intestinal microsomal UDP-glucuronosyltransferase activity toward mycophenolic acid. Drug Metab Dispos. 2006, 34(9), 1632-9.
Miles KK, Kessler FK, Webb LJ, Smith PC, Ritter JK. Adenovirus-mediated gene therapy to restore expression and functionality of multiple UDP-glucuronosyltransferase 1A enzymes in Gunn rat liver. J Pharmacol Exp Ther. 2006, 318(3), 1240-7.
Miles KK, Stern ST, Smith PC, Kessler FK, Ali S, Ritter JK. An investigation of human and rat liver microsomal mycophenolic acid glucuronidation: evidence for a principal role of UGT1A enzymes and species differences in UGT1A specificity. Drug Metab Dispos. 2005, 33(10), 1513-20.
181
Miura M, Satoh S, Inoue K, Kagaya H, Saito M, Inoue T, Suzuki T, Habuchi T. Influence of SLCO1B1, 1B3, 2B1 and ABCC2 genetic polymorphisms on mycophenolic acid pharmacokinetics in Japanese renal transplant recipients. Eur J Clin Pharmacol. 2007, 63(12), 1161-9.
Miura M, Kagaya H, Satoh S, Inoue K, Saito M, Habuchi T, Suzuki T. Influence of Drug Transporters and UGT Polymorphisms on Pharmacokinetics of Phenolic glucuronide Metabolite of Mycophenolic Acid in Japanese Renal Transplant Recipients. Ther Drug Monit. 2008.
Naderer OJ, Dupuis RE, Heinzen EL, Wiwattanawongsa K, Johnson MW, Smith PC. The influence of norfloxacin and metronidazole on the disposition of mycophenolate mofetil. J Clin Pharmacol. 2005, 45(2), 219-26.
Nagai F, Satoh H, Mori S, Sato H, Koiwai O, Homma H, Matsui M. Mapping of rat bilirubin UDP-glucuronosyl-transferase gene (Ugt1a1) to chromosome region 9q35-->q36. Cytogenet Cell Genet. 1995, 69(3-4), 185-6.
Nagaraj N, Lu A, Mann M, Wiśniewski JR. Detergent-based but gel-free method allows identification of several hundred membrane proteins in single LC-MS runs. J Proteome Res. 2008, 7(11), 5028-32.
Owens IS, Basu NK, Banerjee R. UDP-glucuronosyltransferases: gene structures of UGT1 and UGT2 families. Methods Enzymol. 2005, 400, 1-22.
Picard N, Ratanasavanh D, Prémaud A, Le Meur Y, Marquet P. Identification of the UDP-glucuronosyltransferase isoforms involved in mycophenolic acid phase II metabolism. Drug Metab Dispos. 2005, 33(1), 139-46.
Platz KP, Sollinger HW, Hullett DA, Eckhoff DE, Eugui EM, Allison AC. RS-61443--a new, potent immunosuppressive agent. Transplantation. 1991, 51(1), 27-31.
Ros JE, Roskams TA, Geuken M, Havinga R, Splinter PL, Petersen BE, LaRusso NF, van der Kolk DM, Kuipers F, Faber KN, Müller M, Jansen PL. ATP binding cassette transporter gene expression in rat liver progenitor cells. Gut. 2003, 52(7), 1060-7.
Saitoh H, Kobayashi M, Oda M, Nakasato K, Kobayashi M, Tadano K. Characterization of intestinal absorption and enterohepatic circulation of mycophenolic Acid and its 7-O-glucuronide in rats. Drug Metab Pharmacokinet. 2006, 21(5), 406-13.
Shelby MK, Cherrington NJ, Vansell NR, Klaassen CD. Tissue mRNA expression of the rat UDP-glucuronosyltransferase gene family. Drug Metab Dispos. 2003, 31(3), 326-33.
182
Shipkova M, Armstrong VW, Oellerich M, Wieland E. Acyl glucuronide drug metabolites: toxicological and analytical implications. Ther Drug Monit. 2003, 25, 1-16.
Stern ST, Tallman MN, Miles KK, Ritter JK, Dupuis RE, Smith PC. Gender-related differences in mycophenolate mofetil-induced gastrointestinal toxicity in rats. Drug Metab Dispos. 2007, 35(3), 449-54.
Strassburg CP, Nguyen N, Manns MP, Tukey RH. Polymorphic expression of the UDP-glucuronosyltransferase UGT1A gene locus in human gastric epithelium. Mol Pharmacol. 1998, 54(4), 647-54.
Strassburg CP, Oldhafer K, Manns MP, Tukey RH. Differential expression of the UGT1A locus in human liver, biliary, and gastric tissue: identification of UGT1A7 and UGT1A10 transcripts in extrahepatic tissue. Mol Pharmacol. 1997, 52(2), 212-20.
Staatz CE, Tett SE. Clinical pharmacokinetics and pharmacodynamics of mycophenolate in solid organ transplant recipients. Clin Pharmacokinet. 2007, 46, 13-58.
Takano M, Yumoto R, Murakami T. Expression and function of efflux drug transporters in the intestine. Pharmacol Ther. 2006, 109(1-2), 137-61.
Thomas A, Geyer H, Kamber M, Schänzer W, Thevis M. Mass spectrometric determination of gonadotrophin-releasing hormone (GnRH) in human urine for doping control purposes by means of LC-ESI-MS/MS. J Mass Spectrom. 2008, 43(7), 908-15.
Tukey RH, Strassburg CP. Human UDP-glucuronosyltransferases: metabolism, expression, and disease. Annu Rev Pharmacol Toxicol. 2000, 40, 581-616.
Vaisar T, Urban J. Probing the proline effect in CID of protonated peptides. J Mass Spectrom. 1996, 31(10), 1185-7.
Vansell NR, Klaassen CD. Increase in rat liver UDP-glucuronosyltransferase mRNA by microsomal enzyme inducers that enhance thyroid hormone glucuronidation. Drug Metab Dispos. 2002, 30(3), 240-6.
Wang MZ, Wu JQ, Dennison JB, Bridges AS, Hall SD, Kornbluth S, Tidwell RR, Smith PC, Voyksner RD, Paine MF, Hall JE. A gel-free MS-based quantitative proteomic approach accurately measures cytochrome P450 protein concentrations in human liver microsomes. Proteomics. 2008, 8(20), 4186-96.
183
Webb LJ, Miles KK, Auyeung DJ, Kessler FK, Ritter JK. Analysis of substrate specificities and tissue expression of rat UDP-glucuronosyltransferases UGT1A7 and UGT1A8. Drug Metab Dispos. 2005, 33(1), 77-82
Westley IS, Brogan LR, Morris RG, Evans AM, Sallustio BC. Role of Mrp2 in the hepatic disposition of mycophenolic acid and its glucuronide metabolites: effect of cyclosporine. Drug Metab Dispos. 2006, 34(2), 261-6.
Westley IS, Morris RG, Evans AM, Sallustio BC. Glucuronidation of mycophenolic acid by Wistar and Mrp2-deficient TR- rat liver microsomes. Drug Metab Dispos. 2008, 36(1), 46-50.
Whitehouse CM, Dreyer RN, Yamashita M and Fenn JB, Electrospray interface for liquid chromatographs and mass spectrometers. Anal. Chem. 1985, 57, 675-679.
Wong H, Lehman-McKeeman LD, Grubb MF, Grossman SJ, Bhaskaran VM, Solon EG, Shen HS, Gerson RJ, Car BD, Zhao B, Gemzik B. Increased hepatobiliary clearance of unconjugated thyroxine determines DMP 904-induced alterations in thyroid hormone homeostasis in rats. Toxicol Sci. 2005, 84(2), 232-42.
Wu SL, Amato H, Biringer R, Choudhary G, Shieh P, Hancock WS. Targeted proteomics of low-level proteins in human plasma by LC/MSn: using human growth hormone as a model system. J Proteome Res. 2002, 1(5), 459-65.
Wu WW, Wang G, Baek SJ, Shen RF. Comparative study of three proteomic quantitative methods, DIGE, cICAT, and iTRAQ, using 2D gel- or LC-MALDI TOF/TOF. J Proteome Res. 2006, 5(3), 651-8.
Zamek-Gliszczynski MJ, Hoffmaster KA, Humphreys JE, Tian X, Nezasa K, Brouwer KL. Differential involvement of Mrp2 (Abcc2) and Bcrp (Abcg2) in biliary excretion of 4-methylumbelliferyl glucuronide and sulfate in the rat. J Pharmacol Exp Ther. 2006, 319(1), 459-67.

184
CHAPTER 5
CONCLUSIONS
185
The experiments presented here utilizing novel methods for the
quantitative analysis of UGTs and transporters have increased our understanding
of MPA metabolism and disposition while beginning to establish relationships
between quantitative expression of drug metabolizing enzymes and metabolic
profiles. MPA is metabolized and detoxified through the actions of UGT enzymes
almost exclusively, making it an excellent compound for studying effects of
varying expression levels of UGTs and membrane transporters on MPA
exposure. Because MPA is metabolized into two forms of glucuronide
conjugates, an inactive phenolic and the labile acyl, it is also imperative to
examine any potential toxicity resulting from excessive acMPAG exposure.
Potential toxicity resulting from acyl glucuronide exposure has been reported
since the 1970s, and despite conflicting reports, acMPAG had been postulated
as a potential factor in MPA based GI toxicity (Bailey and Dickinson, 2003; Faed,
1984; Shipkova et al., 2003). It was important to evaluate acMPAG stability and
reactivity in order to validate that glucuronidation activity is beneficial within the
GI tract, and subjects with moderate or elevated UGT activity within the intestine
are likely less susceptible to MPA toxicity due to lower levels of MPA regional
tissue exposure compared with subjects deficient in UGT enzymes within the
intestinal tract.
Our experiments indicated that acMPAG is neither highly reactive nor
highly unstable. When these experiments are coupled with previous in vivo
evidence that found no correlations between acMPAG exposure and GI toxicity, it
supports the argument that acMPAG is not a primary factor to consider in MPA
186
toxicity. With acMPAG discounted as a primary factor in MPA toxicity,
glucuronidation within the GI tract can be viewed as a detoxification process that
is beneficial to enterocytes and also a secondary parameter when evaluating
MPA toxicity in patients.
Pharmacogenomics is a rapidly growing field with respect to
understanding the effect of altered enzyme expression and drug toxicity. The
recent modification of adding Gilbert’s Syndrome (UGT1A1*28 polymorphism),
which results in a reduction of UGT1A1 activity in humans by 70%, warnings to
labels on irinotecan products is a prime example of how genetic variations in
enzyme expression can affect drug safety in the clinical setting (Guillemette,
2003; Nagar et al., 2006). Yet one primary problem with developing drug
warnings based on polymorphisms is that it is difficult to accurately quantify the
precise changes in enzyme expression using traditional antibody assays
commonly employed. In humans, there are over thirty known polymorphisms
affecting UGT1A1 expression alone and numerous others affecting expression of
the remaining UGT1As (Guillemette, 2003; Tukey and Strassburg, 2000;
<http://som.flinders.edu.au/FUSA/ClinPharm/UGT/>). Without the development
of more sensitive or reliable testing, scientists have had to rely on mRNA
expression studies, which may correlate poorly with protein expression or
Western Blots, which are difficult to correlate between labs, lack specific
antibodies for numerous enzymes, and have limited sensitivity and dynamic
ranges.
187
Quantitative proteomics can be employed for both preclinical and clinical
samples of interest based on the results using reliable methods for evaluating
UGT expression in both humans and rats, along with membrane transporters in
the rat kidney, liver and intestine. A significant component of this dissertation
project involved the development of these methods due to the need to overcome
numerous hurdles during this process of methods development on several LC-
MS/MS platforms. One of the primary obstacles during the method development
process throughout this project was the selection of the proper internal
standards. The first 18 peptides selected for analysis of the hUGTs were beset
by some difficulties in MRM product ion selection and inconsistent retention times
on the LC-MS/MS. Primarily, peptides in these experiments longer than 13
amino acids containing a number of histidine residues were prone to excessive
charge states resulting in inadequate sensitivity for reliable quantification. A
secondary problem with peptide selection, both during these experiments and for
future studies, is that some proteins may only generate one or two acceptable
tryptic fragments. In this case, it may become necessary to examine alternative
enzymes for proteolytic digests such as chymotrypsin or Lys-C or to combine
proteases to expand the sequence coverage of each enzyme in hopes of
generating more suitable peptides for quantification.
Another issue to examine in future studies concerns flow rates and column
selection for future applications. While our lab performed the rat enzyme studies
using a 150 μm ID column, we have also evaluated the utility of 100 μm and 300
μm ID columns. Compared to the 150 μm columns, the other two formats were

188
between two and five fold less sensitive on the 5500 QTRAP, indicating that the
current column generates the best data for all current applications and is the best
current compromise between sensitivity and robustness (data not shown).
However, it should be noted that larger ID columns could be applied for future
studies where absolute sensitivity can be sacrificed for increased throughput and
column lifetime.
Even though targeted quantitative proteomics produces a number of
advantages for scientists, there are still drawbacks. One of the primary criticisms
of quantitative proteomics continues to be the upfront cost in both LC-MS/MS
instrumentation along with annual maintenance. An additional problem is that
even though several new software packages have been recently produced by a
number of companies attempting to make LC-MS/MS more user friendly, there is
a still a steep learning curve. While the development of multiple protease digests
has generated an increasing amount of potential stable isotope standards, there
will still be proteins that are not amenable to the current methods in quantitative
proteomics due to insufficient peptide candidates that lend themselves to high
sensitivity LC-MS/MS detection.
What the development of targeted quantitative proteomics allows for is to
precisely evaluate altered expression of proteins of interest with their biological
significance. In particular, these experiments can highlight sources of potential
differences in metabolite exposure using quantitative proteomics compared with
either mRNA expression or in vitro metabolism studies. One example that can
be highlighted in this project involves evaluating differences in MPAG levels seen
189
in TR- rat plasma compared with Wistar rats. Following MPA administration and
bile cannulation, there was a significant difference in MPAG exposure seen in
TR- rats, while there were no differences in in vitro glucuronidation rates between
TR- rats and Wistar rats. However, when transporter and rUgt levels are
compared between the two strains, there was a significant increase in rUgt1a1
and rMrp3 expression within the liver in TR- rats. Because rUgt1a1 and rMrp3
are two of the primary proteins responsible for MPAG formation and efflux,
respectively, into the blood, it is likely that the upregulation of these two proteins
coupled with the absence of Mrp2 for biliary excretion in TR- rats results in
increased MPAG plasma levels. This illustrates that quantitative proteomics can
be a powerful tool in explaining differences in metabolism, elimination and toxicity
that may be irresolvable using more traditional methods.
One of the more frustrating aspects within the field of quantitative
proteomics is the lack of applications directly linking protein expression with
clinical outcomes. Recently, there have been a number of published reports for
quantifying a number of biologically significant drug metabolizing enzymes and
biomarkers including CYPs, membrane transporters, C-reactive protein and
prostate specific antigen (Barnidge et al., 2004; Jenkins et al., 2006; Kuhn et al.,
2004; Li et al., 2008; Wang et al., 2008). Yet despite the wealth of knowledge
and resources, scientists have been unable to apply these methods to evaluate
potential differences in enzyme expression with any events of biological
significance. One of the primary goals of this project was to begin to bridge the
190
gap between proteomic experiments performed primarily by analytical chemists
and clinicians lacking the tools needed for applications in quantitative proteomics.
A secondary goal of this project was to begin to set up preliminary
methods to be able to analyze large numbers of samples for targeted quantitative
proteomic analysis. One primary advantage that the AQUATM peptide selection
rules provide is that the resulting peptides will retain similar chromatographic
profiles due to size and residue restrictions. Because of this, method alterations
to accommodate the analysis of different proteins will likely be minor, enabling
faster method development and minimal variations in LC gradients. The
advantages of rapid method development, faster LC runs and precise and
sensitive quantification provided will make targeted quantitative proteomics more
accessible to biologists and clinicians than ever before.
Within the areas of UGTs and transporters, there are several different
avenues where this research may be applied. One of the primary interests to
scientists is the effect of genetic polymorphisms on protein expression. As noted
earlier, there are over thirty polymorphisms within the UGT1A1 isoform alone
(Guillemette, 2003; Nagar et al., 2006; Tukey and Strassburg, 2000). One
potential benefit could be gained by evaluating different expression levels of UGT
enzymes across a number of microsomal donors and correlating these levels
with any SNPs discovered during genotyping. Using both of these methods will
help evaluate whether the polymorphisms of interest significantly affect isoform
expression, resulting in decreased UGT activity. An additional area of interest to
clinicians could be in evaluating patients undergoing either irinotecan or MPA
191
therapy for UGT levels to help determine patient susceptibility to GI toxicity.
Patients on either treatment regimen may undergo colonic biopsies that may be
analyzed for UGT expression with our current protein requirements (~10 μg per
assay). Susceptible patients displaying diminished UGT levels might be carefully
monitored over the course of treatment and may open other areas of adjuvant
therapy, including coadministration with potential UGT inducers to help improve
therapeutic outcomes.
In summary, the work presented within this project has advanced our
understanding of acMPAG stability and reactivity relating to MPA toxicity, along
with the development and application of targeted quantitative proteomics to
evaluate enzyme expression in both rats and humans. Most importantly, through
the use of proteomics and in vitro/in vivo models, we have begun to establish
relationships between tissue expression and xenobiotic metabolism and
elimination. Furthermore, these relationships open up a number of areas of
research into possible coregulation of enzymes and transporters and relating
metabolite profiles using both Phase II and Phase III metabolism. In addition,
because of the low protein requirements of our current methods, clinical
applications evaluating drug metabolism and toxicity are also possible. Finally,
we hope that this research eventually helps clinicians and scientists tailor
treatment regimens to susceptible populations resulting in improved therapeutic
outcomes with less adverse reactions and toxicity.

192
References
Allison AC and Eugui EM. “Preferential Suppression of Lymphocyte Proliferation by Mycophenolic Acid and Predicted Long Term Effects of Mycophenoliate Mofetil in Transplantation.” Transplant Proc. 1994, 26(6), 3205-3210. Barnidge DR, Goodmanson MK, Klee GG, Muddiman DC. “Absolute quantification of the model biomarker prostate-specific antigen in serum by LC-Ms/MS using protein cleavage and isotope dilution mass spectrometry.” J Proteome Res. 2004, 3(3), 644-52. Bock KW and Kohle C. Topological aspects of oligomeric UDP-glucuronosyltransferases in endoplasmic reticulum membranes: Advances and open questions. Biochem Pharm. 2009, 77, 1458-1465. Bullingham RE, Nicholls AJ, Kamm BR. Clinical pharmacokinetics of mycophenolate mofetil. Clin Pharmacokinet. 1998, 34(6), 429-55. Cañas B, López-Ferrer D, Ramos-Fernández A, Camafeita E, Calvo E. “Mass spectrometry technologies for proteomics.” Brief Funct Genomic Proteomic. 2006, 4(4), 295-320. Cattaneo D, Perico N and Remuzzi G. “From Pharmacokinetics to Pharmacogenomics: A New Approach to Tailor Immunosuppressive Therapy.” Am J Transplant. 2004, 4, 299-310. Dickinson RG and Bailey MJ. “Acyl Glucuronide reactivity in perspective: biological consequences.” Chem Biol Interact. 2003, 145, 117-137.
Faed EM. Properties of acyl glucuronides: implications for studies of the pharmacokinetics and metabolism of acidic drugs. Drug Metab Rev. 1984, 15, 1213-1249.
Guillemette C. Pharmacogenomics of human UDP-glucuronosyltransferase enzymes. Pharmacogenomics J. 2003, 3(3), 136-58. Jenkins RE, Kitteringham NR, Hunter CL, Webb S, Hunt TJ, Elsby R, Watson RB, Williams D, Pennington SR, Park BK. Relative and absolute quantitative expression profiling of cytochromes P450 using isotope-coded affinity tags. Proteomics. 2006, 6(6), 1934-47. Kamiie J, Ohtsuki S, Iwase R, Ohmine K, Katsukura Y, Yanai K, Sekine Y, Uchida Y, Ito S, Terasaki T. Quantitative atlas of membrane transporter proteins: development and application of a highly sensitive simultaneous LC/MS/MS method combined with novel in-silico peptide selection criteria. Pharm Res. 2008, 25(6), 1469-83.
193
Kuhn E, Wu J, Karl J, Liao H, Zolg W, Guild B. Quantification of C-reactive protein in the serum of patients with rheumatoid arthritis using multiple reaction monitoring mass spectrometry and 13C-labeled peptide standards. Proteomics. 2004, 4(4), 1175-86. Kypers DRJ, Vanrenterghem Y, Squifflet JP, Mourad M, Abramowicz D, Oellerich M, Armstrong V, Shipkova M and Daems J. Twelve Month Evaluation of the Clinical Pharmacokinetics of Total and Free Mycophenolic Acid and Its Glucuronide Metabolites in Renal Allograft Recipients on Low Dose Tacrolimus in Combination with Mycophenolate Mofetil. Ther Drug Monit. 2003, 25, 609-622. Li N, Nemirovskiy OV, Zhang Y, Yuan H, Mo J, Ji C, Zhang B, Brayman TG, Lepsy C, Heath TG, Lai Y. Absolute quantification of multidrug resistance-associated protein 2 (MRP2/ABCC2) using liquid chromatography tandem mass spectrometry. Anal Biochem. 2008, 380(2), 211-22. Nagar S and Remmel RP. “Uridine diphophoglucuronosyltransferase pharmacogenetics and cancer.” Oncogene. (2006) 25, 1659-1672.
Shipkova M, Armstrong VW, Oellerich M, Wieland E. Acyl glucuronide drug metabolites: toxicological and analytical implications. Ther Drug Monit. 2003, 25, 1-16.
Tukey RH and Strassburg CP. “Human UDP-Glucuronosyltransferases: Metabolism, Expression and Disease.” Ann Rev Pharmacol Toxicol. 2000, 40, 581-616. UDP Glucuronosyltransferase Homepage. Department of Clinical Pharmacology, Flinders University. <http://som.flinders.edu.au/FUSA/ClinPharm/UGT/>
Wang MZ, Wu JQ, Dennison JB, Bridges AS, Hall SD, Kornbluth S, Tidwell RR, Smith PC, Voyksner RD, Paine MF, Hall JE. A gel-free MS-based quantitative proteomic approach accurately measures cytochrome P450 protein concentrations in human liver microsomes. Proteomics. 2008, 8(20), 4186-96.
194
APPENDIX
ABSOLUTE QUANTIFICATION OF HUMAN URIDINE-DIPHOSPHATE GLUCURONOSYL TRANSFERASE (UGT) ENZYME ISOFORMS 1A1 AND
1A6 BY TANDEM LC-MS
This section was published in Drug Metablism Letters. 2, 210-222. 2008

195
A. INTRODUCTION
UGT enzymes catalyze the formation of glucuronic acid conjugates of Phase
II metabolism. Glucuronidation is the most important Phase II metabolic pathway
for drugs [Evans and Relling 1999] and is also a primary elimination route for
other xenobiotics and endogenous compounds [Meech and Mackenzie 1997,
Tukey and Strassburg 2000, Guillemette 2003, Wells et al. 2004]. Quantification
of UGTs in biological matrices has traditionally been done by immunometric
methods such as Western blots and ELISA. These methods can be time
consuming and cumbersome, and require the raising of antibodies, which are
often unsuccessful in achieving specificity. Indeed, there is a high degree of
sequence identity among the UGT1A subfamily of enzymes, and antibodies have
been found to be cross reactive between isoforms. Quantitative measurements
by Western blot can be highly variable, with very limited dynamic range, and
often provide imprecise quantification results, even if done relative to a control
experiment. The ELISA method is more sensitive, and linearity can be greater,
but considerable effort is needed to validate an ELISA assay, even when a
specific antibody is available.
Other techniques for quantitative analysis of proteins have been developed in
recent years. These include the Difference Gel Electrophoresis (DIGE) method
[Friedman et al. 2007, Tonge et al. 2001] which employs fluorescent tags and gel
electrophoresis for separation and relative quantification, and antibody arrays
[Wellmann et al. 2002]. Methods based on isotopic labeling have also been
developed. These include stable isotope labeling
196
with amino acids in cell culture (SILAC) [Ong et al. 2002], Isotope Coated Affinity
Tags (ICAT) [Gygi et al. 1999, Jenkins et al. 2006, Smolka et al. 2001, Turecek
2002], and iTRAQ reagents [Ross et al. 2004, Skalnikova et al. 2007]. ICAT
targets a specific amino acid, cysteine, on the protein sequence, while iTRAQ
enables coverage of an entire peptide sequence by N-terminal labeling of all
peptides. Many of these techniques can at best only be described as semi-
quantitative because they establish relative differences in protein expression
between samples. iTRAQ and ICAT can be used for absolute quantification when
employed with standards of known concentration as calibrants.
The approach of using heavy isotope labeling for absolute quantification has
previously been established [Barnidge et al. 2003, Barr et al. 1996, Gerber et al.
2003, Kuhn et al. 2004] and has become increasingly popular with the ongoing
development of higher sensitivity analytical instrumentation [Kamiie et al. 2008,
Kirsch et al. 2007, Lin et al. 2006]. The determination of absolute concentration
enables better interpretation of metabolic studies by, for example, allowing
transfer of data between laboratories without needing to normalize to different
controls. It also enables better comparison of data between biological tissue
types. Barr et al. [Barr et al. 1996] used heavy labeled peptides, unique to the
protein, to quantify apoliproprotein A-I. They found the concentration obtained to
be in good agreement with the known concentration of the Apo A-I standard.
Gerber et al. [Gerber et al. 2003] used the technique, with tandem MS (including
selected reaction monitoring), to quantify proteins and phosphoproteins from cell
lysates, and introduced the term AQUA (absolute quantification). Myoglobin was
197
measured in the presence of whole yeast and was found to equal the known
amount of myoglobin added. Kuhn et al. [Kuhn et al. 2004] quantified C-reactive
protein in serum using 13C-labeled peptide standards. They cautioned against
claims of absolute quantification due to possible peptide losses during sample
preparation or incomplete trypsin digestion. Their sample preparation procedure
was complex (size exclusion chromatography and SDS-PAGE analysis) and
heavy labeled peptides were added after trypsinization. Barnidge et al. [Barnidge
et al. 2003] quantified prostate specific antigen in serum using a synthetic
peptide containing two glycine atoms each labeled with two 13C atoms and one
15N atom. Although they found values determined to be lower than those
obtained by immunoassay, the method was deemed worth pursuing as a
possible means of standardizing commercially available immunoassays
performed in serum. The inclusion of the reactive amino acids cysteine and
tryptophan in their heavy labeled peptide may have contributed to the lower
values obtained. Lin et al. [Lin et al. 2006] used a single quadrupole ion trap for
isotope labeling determinations and found it sufficient for their purposes of
quantifying intermediate abundance proteins in human serum. Kirsch et al.
[Kirsch et al. 2007] quantified two human growth hormone serum biomarkers in
samples containing approximately 8 mg of serum protein (100 μL volume) by
tandem LC-MS. They considered their isotope dilution method to be easily
adaptable to other proteins and possibly to other species. More recently Kamiie
et al. [Kamiie et al. 2008] used stable isotope labeled peptides as internal
standards for quantification of 34 transporter proteins in liver, kidney and blood-
198
brain barrier of mouse. They used one representative peptide per protein and the
average of three MRM product ions per peptide for quantification. A long LC
(liquid chromatography) run time of 50 min was used to enable the assay of
many analytes.
An alternative, but related, method has recently been reported by Beynon et
al. (Beynon et al. 2005), where the formation of a concatenation of tryptic
peptides (a QCAT protein) encoded from an artificial gene was employed. The
peptides in the QCAT protein are present in strict 1:1 stoichiometry and each is
derived from a naturally occurring tryptic peptide in the parent protein of interest.
A single cysteine containing extension is added at the C terminus and used for
calibration of the QCAT protein. Although effort is required to construct the
artificial gene, repeated expression of the QCAT is facile, and there is no need
for individual peptides to be quantified before use. The QCAT can also be heavy
labeled by being expressed in medium containing 15NH4Cl to afford internal
standard for calibration.
The use of stable isotope labeled peptides as internal standards for the assay
of digested proteins is a logical development based on the earlier reported
methods. This has led to the commercial availability of custom labeled peptides.
Here we present a tandem mass spectrometry method, using such labeled
peptides, for the absolute quantification of human UGT enzyme isoforms 1A1
and 1A6 in microsomal tissue preparations. The method reported here provides a
basis for extension of the assay to the entire UGT family of proteins, many of
which do not have adequate antibodies available due to high sequence identity.
199
B. METHODS
Materials
Analytical grade acetonitrile and methyl alcohol (anhydrous) were purchased
from Fisher Scientific Co. (Pittsburg, PA). Ammonium bicarbonate, dithiothreitol,
iodoacetamide, ammonium hydroxide, formic acid, 2,2,2-trifluoroethanol (TFE)
and TPCK (L-1-tosylamide
-2-phenylethyl chloromethyl ketone) treated trypsin from bovine pancreas
(≥ 10,000 BAEE units/mg protein) were purchased from Sigma-Aldrich Co.
(St. Louis, MO). Bond Elut solid phase extraction cartridges (C18 100 mg, 1 mL)
were purchased from Varian, Inc. Recombinant UGTs 1A1, 1A6 and control
supersomes were purchased from BD Biosciences (San Jose, CA). Human liver
microsomes (HLMs)(20 mg/mL) were purchased from BD Biosciences (pool of
33; 15 female, 18 male) and Xenotech LLC (Lenexa, KA) (pool of 50; 26 female,
24 male). A human liver microsome library of individual donors (n=10, 3 female, 7
male, 20 mg/mL) was purchased from Human Biologics International (Scottsdale,
AZ). Rat liver microsomes (RLMs), for normalizing total protein content of
samples, were prepared from male and female Sprague-Dawley rats using
standard methods. Protein concentrations were determined using the Pierce BCA
Protein assay Kit, in which bovine serum albumin is used as the standard.
Human intestinal microsomes (HIMs) (duodenum and jejunum derived) were
obtained from Xenotech LLC (Lenexa, KA) (pool of 8 donors, 5 female, 3 male).
200
Instrumentation
Analysis was by reverse phase LC-MS/MS, using a Hewlett Packard 1100 LC
equipped with a Phenomenex Luna C18 (length, 5 cm; internal diameter, 2 mm;
particle size, 3 µm; pore size, 100 Å) column, coupled to an API3000 triple
quadrupole mass spectrometer (Applied Biosystems, Foster City, CA) with a
turbo ionspray source. The mass spectrometer was operated in positive ion
mode, with acquisition by multiple reaction monitoring (MRM). Peak areas were
determined using Analyst 1.4.2 (build 1236) software (Applied Biosystems).
Stable Isotope Labeled Synthetic Peptides
Synthetic peptide standards (8-12 mer), each containing one amino acid
heavy labeled with 13C [98 %] and 15N [95 %], were purchased from Thermo
Electron (Thermo Scientific, Waltham, MA). Two of the peptides were uniquely
representative of human UGT1A1 and three were uniquely representative of
human UGT1A6. The peptides were selected according to manufacturer
recommendations and previously published guidelines [Beynon et al. 2005,
Gerber et al. 2003]. The amino acid sequences (for UGT1A1 and UGT1A6) were
obtained using the Universal Protein Resource Knowledge Base
(UniProtKB)(funded mainly by the National Institutes of Health). Peptide
uniqueness of tryptic fragments was verified by NCBI Blast (National Center for
Biotechnology Information Basic Local Alignment Search Tool). Amino acid
analysis was conducted on each peptide to determine exact amount present. The
analysis involved acid hydrolysis, derivatization with phenylisothiocyanate and

201
separation of the phenylthiocarbamyl-amino acid derivatives by reverse phase
HPLC. The analysis was conducted at the Center for Structural Biology, Wake
Forest University School of Medicine, Winston-Salem, NC, USA. Some amino
acids were excluded from the analysis because of known acid hydrolysis effects
(e.g. bonds between isoleucine and valine [peptide 3] are not easily broken) and
the possible cyclization and isomerization of aspartic acid adjacent to glycine or
isoleucine (peptides 2 and 3) [Vinther et al. 1996, Fledelius et al. 1997]. The
peptides purchased are listed in Table 1. Selection criteria included peptides
which were not too hydrophilic or hydrophobic, did not contain reactive amino
acids (e.g. M, C), and did not contain chemically unstable sequences (e.g. N-
terminal Q, N-terminal N).
Known variable Single Nucleotide Polymorphisms (SNPs) were also
considered during selection (see discussion). It was intended to obtain two
peptides for each UGT isoform, but a third was obtained for UGT1A6 because
initial investigations suggested that there may be difficulties with peptide 3. This
proved not to be the case. One peptide, initially selected for UGT1A6 (peptide 5,
Table 1) was ignored for most of the investigations when a large co-eluting peak
was consistently observed for one of its two MRMs. All five peptide sequences
were found to lack the predicted posttranslational modifications using the
software indicated in parentheses: N-linked glycosylation (NetNGlyc), O-linked
glycosylation (NetOGlyc), sulfation (Sulfinator), methylation (MeMO), acetylation
(NetAcet), palmitoylation (NBA-Palm), myristoylation (NMT), and sumoylation
(SUMOsp). Results of analysis for predicted phosphorylation sites lacked
202
agreement and depend on the software used (Kinase Phos or NetPhos). No sites
were identified in the two UGT1A1 peptides. Kinase Phos identified tyrosine-77 in
peptide 5 as a potential site, whereas NetPhos suggested that serine-50 in
peptide 3, threonine-110 in peptide 4, and tyrosine-112 in peptide 4 are likely
phosphorylation sites. These predictions do not take into account the
endoplasmic reticulum localization of the UGTs where they likely have restricted
access to most cellular kinases. Stock solutions of each peptide were prepared in
50 % acetonitrile/50 % acetic acid 1.6 % and stored, in 300 and 400 µL aliquots,
at -20 ºC in polypropylene vials.
Sample Preparation and digestion
Calibrators, containing 1.5, 3, 6, 12 and 25 µg of commercially available
recombinant UGTs 1A1 and 1A6, with protein normalized to 200 µg by the
addition of RLMs, a blank containing 50 µg of UGT control supersomes, with
protein normalized in the same way, and HLM samples (pooled and individual
donor samples) containing 200 µg of protein, were prepared. Samples were
denatured and reduced by heating at 95 ºC for 11 min in 5 mM dithiothreitol
(sample volume 90 µL; buffer 50 mM ammonium bicarbonate). This was followed
by alkylation with iodoacetamide (10 µL of 100 mM solution added) for 20 min in
the dark. Heavy labeled peptides were then added as internal standards (10 μL
of solution containing 10 pmol of peptides 1, 3, 4, 5 and 20 pmol of peptide 2)
and the residual acetonitrile (< 5 µL) was removed by evaporation under nitrogen
for ~5 min. Samples were then digested with trypsin in 50 mM ammonium
203
bicarbonate; enzyme/protein ratio = 1:50; for 4 h at 37 ºC, which was found to
provide maximal response to peptides monitored from recombinant UGTs. The
reaction was then quenched by addition of three volumes of acetonitrile.
Following centrifuging at 800 x g for 10 min the organic content was removed by
evaporation under nitrogen for ~10 min. Ammonium bicarbonate (50 mM, 0.9 mL)
was then added in preparation for solid phase extraction. SPE cartridges were
conditioned with 1 mL methanol and 1 mL distilled water. Samples were then
added and the cartridges were washed with 1 mL 50 mM ammonium
bicarbonate. Cartridges were eluted with 1 mL acetonitrile/25 mM formic acid
(40:60). The eluate was evaporated to dryness under nitrogen at 42 ºC in a water
bath and samples were reconstituted with 100 μL acetonitrile/25 mM formic acid
at pH 3 (pH was adjusted to 3 by drop wise addition of ammonium hydroxide).
Samples were stored at -20 ºC until analyzed by LC-MS/MS.
LC conditions
Mobile phase was acetonitrile (solvent B) and 25 mM formic acid with pH
adjusted to 3 (solvent A) by addition of ammonium hydroxide. Injection volume
was 50 μL (50 % of sample), and flow rate was 0.4 mL/min. Gradient; 10 %
solvent B to 100 % at 4 min, to 10 % at 5 min, held at 10 % for equilibration until
10 min. Sample was split before introduction into the turbo ionspray source of the
mass spectrometer (half of effluent was allowed into the source).

204
MS/MS conditions
All heavy labeled peptides were found to be doubly charged when infused
into the mass spectrometer in ~2 μM concentrations in mobile phase (50:50).
Two MRM transitions, with product ion for each > 500 Da (and precursor ion as
doubly charged ion), were chosen for each heavy labeled peptide following
optimization. Using these, two further MRM transitions were elucidated for the
corresponding unlabeled peptides from digested recombinant enzyme and
microsomal samples. Thus there were four MRM transitions monitored per
peptide, giving a total of 20 MRMs which were acquired. As the peptides eluted
within a narrow time frame the MRMs were not grouped and were therefore all
acquired within each cycle. Following optimization, dwell time was set at 60 ms,
with a pause time of 5 ms. Cycle time was therefore 1.3 s. MRM product ions
were named according to peptide fragmentation nomenclature [Roepstorff and
Fohlman 1984] (Table 2).
Calibration Curves
The concentration of enzyme in recombinant material (pmol/mg recombinant
protein) was calculated, following preparation and analysis of five replicate
calibrant sets (total 25 samples; a calibrant set consisted of five samples, each a
different concentration within the calibration range), from the known amount of
heavy labeled peptide added to each sample as internal standard. The amount of
heavy labeled peptide added was designed to fall within the (unweighted) linear
range, and equality of response between labeled and unlabeled peptide was

205
assumed. Complete trypsin digestion was also assumed as increasing time of
digestion did not improve responses. The same batches of recombinant UGTs
1A1 and 1A6 were used throughout the study. Calibration curves were
constructed by plotting recombinant enzyme concentration against the peak area
of each MRM representing unlabeled (recombinant) tryptic peptide relative to the
peak area of each corresponding MRM representing labeled synthetic peptide
internal standard, using a weighted (1/x2) linear regression fit. The calibration and
assignment of enzyme concentration was based upon the known amount of
labeled synthetic peptide internal standard added to each sample, and assuming
equality of response, as commonly done for isotope dilution methods. Thus for
each peptide there were two calibration curves, and for each enzyme there were
at least four calibration curves, from which the optimal peptides and MRM
transitions could be determined.
Validation
Solid phase extraction efficiency
Solid phase extraction efficiency was determined for the labeled internal
standard peptides in calibrant samples which were put through the entire sample
preparation procedure. Two concentrations of calibrant were used. For each
concentration the labeled standards were added to three samples just before
solid phase extraction, and to three further samples just after solid phase
extraction.

206
Sample preparation – denaturation and trypsinization
The use of heating (95 ºC for 11 min), in our method, to denature the protein
samples was compared with use of an organic co-solvent, TFE [Roepstorff and
Fohlman 1984], to denature. For the co-solvent method TFE (35 μL of the final
90 μL volume) was added at the very beginning, and samples were incubated
with shaking at 37 ºC for 2 h. Two samples from the HLM library were analyzed
in triplicate by each method and average concentrations calculated. To examine
use of a lower temperature to denature, two samples of a high concentration
within the calibration range were denatured at 60 ºC for 30 min and compared to
five replicate calibrant samples of the same concentration denatured at 95 ºC for
11 min.
Intra- and inter-day assay variability
For intra-day variability, five replicate calibration curves were prepared on the
same day, and analyzed. Peak area ratios were examined as a measure of
variability. This was repeated with a further five replicate calibrant sets, without
adding rat liver microsomes to normalize protein content, to examine for matrix
effects. For inter-day variability two batches of pooled human liver microsome
samples, from different sources, were analyzed with each calibrant set.
207
Human liver microsome (HLM) library
To test the application of the developed method, samples from a library of ten
individual HLM donors were analyzed in triplicate, with a calibrant set and pooled
HLM inter-day control samples.
Human intestinal microsomes (HIMs)
Samples from one batch of HIMs were analyzed in triplicate, with a calibrant
set and pooled HLM inter-day control samples.
Western blot analysis of HLM library and digested and non-digested
samples
As demonstration of the reliability of the developed LC-MS/MS method, the
HLM library was analyzed for UGTs 1A1 and 1A6 by (relative quantification)
Western blot. Correlations between the results for each method were evaluated.
Two immunoblots were prepared, one for UGT1A1 and one for UGT1A6. The
primary antibodies, one for each isoform, were both developed in the Ritter lab
[Chen et al. 2005, Ritter et al. 1999]. For each blot a 7.5 % polyacrylamide
resolving gel and a 4 % polyacrylamide stacking gel were poured and 25 µg of
protein loaded for each HLM sample. Samples were electrophoresed at 150 V
through the stacking gel and 175 V through the resolving gel. After transfer of the
proteins to a nitrocellulose membrane, the blots were probed for expression of
the relevant UGT isoform, at a 1:1000 dilution of the primary antibody, by
incubation for an hour at room temperature. The blots were then probed for the
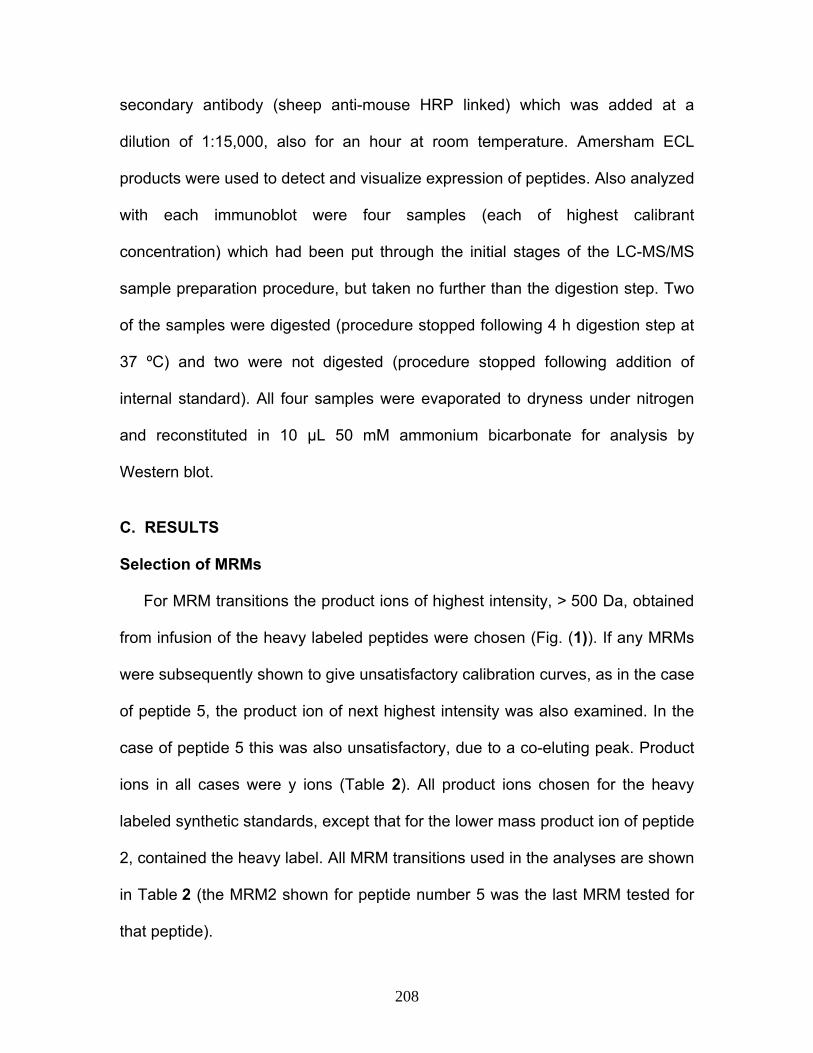
208
secondary antibody (sheep anti-mouse HRP linked) which was added at a
dilution of 1:15,000, also for an hour at room temperature. Amersham ECL
products were used to detect and visualize expression of peptides. Also analyzed
with each immunoblot were four samples (each of highest calibrant
concentration) which had been put through the initial stages of the LC-MS/MS
sample preparation procedure, but taken no further than the digestion step. Two
of the samples were digested (procedure stopped following 4 h digestion step at
37 ºC) and two were not digested (procedure stopped following addition of
internal standard). All four samples were evaporated to dryness under nitrogen
and reconstituted in 10 μL 50 mM ammonium bicarbonate for analysis by
Western blot.
C. RESULTS
Selection of MRMs
For MRM transitions the product ions of highest intensity, > 500 Da, obtained
from infusion of the heavy labeled peptides were chosen (Fig. (1)). If any MRMs
were subsequently shown to give unsatisfactory calibration curves, as in the case
of peptide 5, the product ion of next highest intensity was also examined. In the
case of peptide 5 this was also unsatisfactory, due to a co-eluting peak. Product
ions in all cases were y ions (Table 2). All product ions chosen for the heavy
labeled synthetic standards, except that for the lower mass product ion of peptide
2, contained the heavy label. All MRM transitions used in the analyses are shown
in Table 2 (the MRM2 shown for peptide number 5 was the last MRM tested for
that peptide).
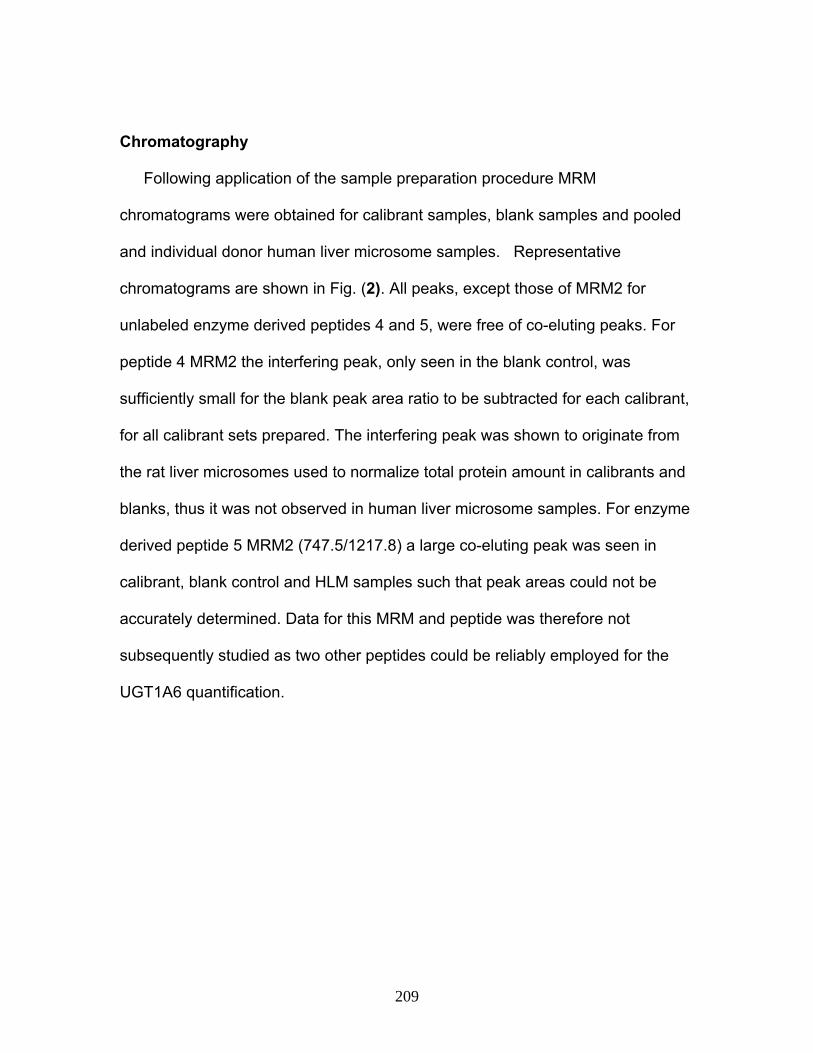
209
Chromatography
Following application of the sample preparation procedure MRM
chromatograms were obtained for calibrant samples, blank samples and pooled
and individual donor human liver microsome samples. Representative
chromatograms are shown in Fig. (2). All peaks, except those of MRM2 for
unlabeled enzyme derived peptides 4 and 5, were free of co-eluting peaks. For
peptide 4 MRM2 the interfering peak, only seen in the blank control, was
sufficiently small for the blank peak area ratio to be subtracted for each calibrant,
for all calibrant sets prepared. The interfering peak was shown to originate from
the rat liver microsomes used to normalize total protein amount in calibrants and
blanks, thus it was not observed in human liver microsome samples. For enzyme
derived peptide 5 MRM2 (747.5/1217.8) a large co-eluting peak was seen in
calibrant, blank control and HLM samples such that peak areas could not be
accurately determined. Data for this MRM and peptide was therefore not
subsequently studied as two other peptides could be reliably employed for the
UGT1A6 quantification.
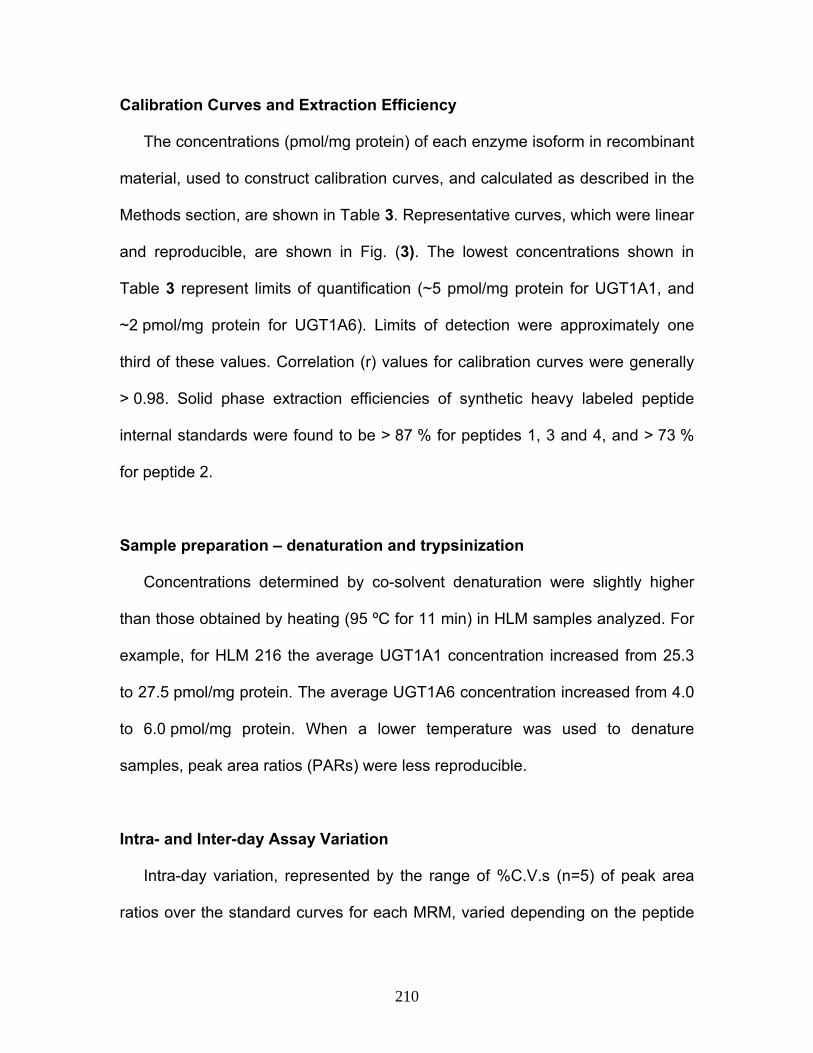
210
Calibration Curves and Extraction Efficiency
The concentrations (pmol/mg protein) of each enzyme isoform in recombinant
material, used to construct calibration curves, and calculated as described in the
Methods section, are shown in Table 3. Representative curves, which were linear
and reproducible, are shown in Fig. (3). The lowest concentrations shown in
Table 3 represent limits of quantification (~5 pmol/mg protein for UGT1A1, and
~2 pmol/mg protein for UGT1A6). Limits of detection were approximately one
third of these values. Correlation (r) values for calibration curves were generally
> 0.98. Solid phase extraction efficiencies of synthetic heavy labeled peptide
internal standards were found to be > 87 % for peptides 1, 3 and 4, and > 73 %
for peptide 2.
Sample preparation – denaturation and trypsinization
Concentrations determined by co-solvent denaturation were slightly higher
than those obtained by heating (95 ºC for 11 min) in HLM samples analyzed. For
example, for HLM 216 the average UGT1A1 concentration increased from 25.3
to 27.5 pmol/mg protein. The average UGT1A6 concentration increased from 4.0
to 6.0 pmol/mg protein. When a lower temperature was used to denature
samples, peak area ratios (PARs) were less reproducible.
Intra- and Inter-day Assay Variation
Intra-day variation, represented by the range of %C.V.s (n=5) of peak area
ratios over the standard curves for each MRM, varied depending on the peptide
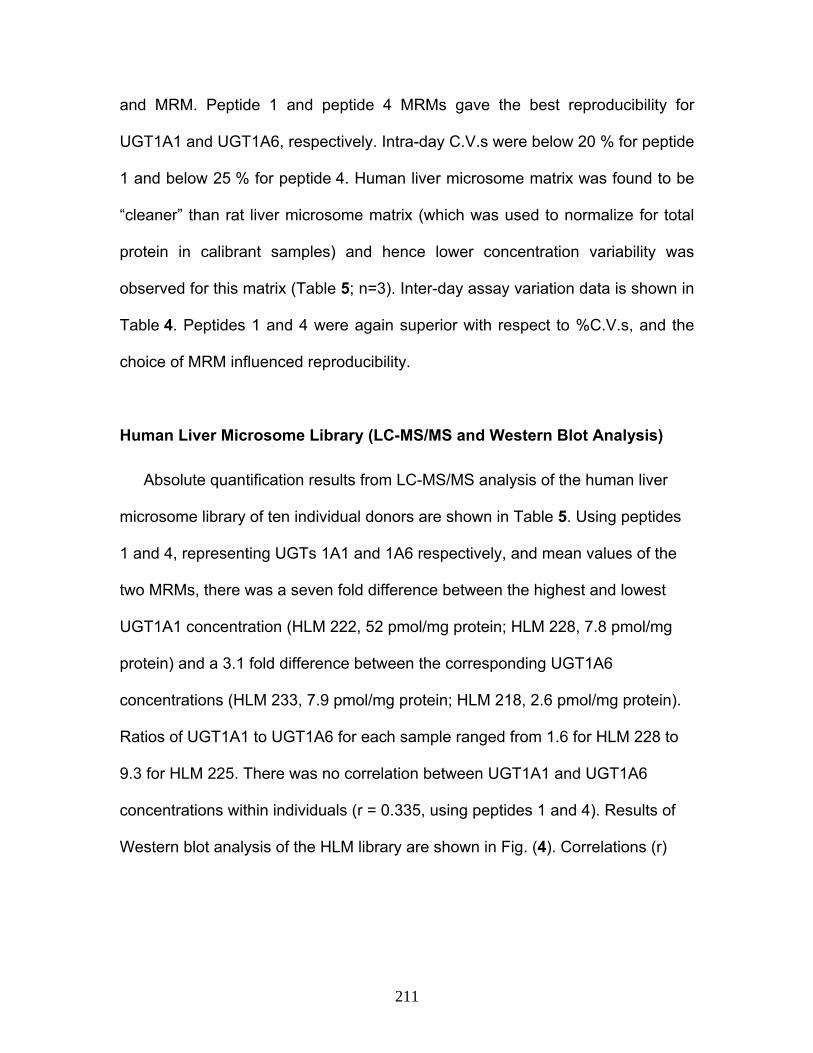
211
and MRM. Peptide 1 and peptide 4 MRMs gave the best reproducibility for
UGT1A1 and UGT1A6, respectively. Intra-day C.V.s were below 20 % for peptide
1 and below 25 % for peptide 4. Human liver microsome matrix was found to be
“cleaner” than rat liver microsome matrix (which was used to normalize for total
protein in calibrant samples) and hence lower concentration variability was
observed for this matrix (Table 5; n=3). Inter-day assay variation data is shown in
Table 4. Peptides 1 and 4 were again superior with respect to %C.V.s, and the
choice of MRM influenced reproducibility.
Human Liver Microsome Library (LC-MS/MS and Western Blot Analysis)
Absolute quantification results from LC-MS/MS analysis of the human liver
microsome library of ten individual donors are shown in Table 5. Using peptides
1 and 4, representing UGTs 1A1 and 1A6 respectively, and mean values of the
two MRMs, there was a seven fold difference between the highest and lowest
UGT1A1 concentration (HLM 222, 52 pmol/mg protein; HLM 228, 7.8 pmol/mg
protein) and a 3.1 fold difference between the corresponding UGT1A6
concentrations (HLM 233, 7.9 pmol/mg protein; HLM 218, 2.6 pmol/mg protein).
Ratios of UGT1A1 to UGT1A6 for each sample ranged from 1.6 for HLM 228 to
9.3 for HLM 225. There was no correlation between UGT1A1 and UGT1A6
concentrations within individuals (r = 0.335, using peptides 1 and 4). Results of
Western blot analysis of the HLM library are shown in Fig. (4). Correlations (r)

212
between the absolute concentrations obtained by LC-MS/MS and the relative
values obtained by Western blot (normalized to 100 % for the lowest density) for
each MRM of peptides 1 and 4, are shown in Fig. (5).
Human Intestinal Microsomes
The UGT1A1 concentration determined in one batch of pooled human
intestinal microsomes, analyzed in triplicate, was on average (n=3), peptide 1,
MRM1, 5.8 pmol/mg protein, MRM2, 7.4 pmol/mg protein. These data were in
good agreement for the MRMs monitored. Peptide 2 concentrations (data not
shown) were in a similar range, but showed higher variability. UGT1A6
concentrations in intestinal microsomes were below the limit of quantification.
D. DISCUSSION
This study demonstrates the use of stable isotope labeled synthetic peptides
for the absolute quantification of endogenous enzyme proteins by tandem mass
spectrometry operated in the MRM mode. The approach is applied here to Phase
II metabolic enzymes for the first time. Specifically it is applied to UGT1A1 and
UGT1A6, two enzymes with specific antibodies, to enable a comparison and
evaluation of the new approach.
Selection of stable isotope labeled synthetic peptide is clearly an important
step, both for enzyme identification purposes (the peptide must be unique to the
enzyme being quantified) and for analytical reasons (the peptide needs to have
good chromatographic properties, ionize well, and give sensitive and selective
213
MRM signals). Each of the nine functional known UGTs in the 1A subfamily of
enzymes is comprised of approximately 530 amino acids (Uniprot). There is
sequence identity at the C terminus region, which is encoded for each isoform by
the common exons 2 to 5 of the UGT1A gene. Therefore, the N terminus region,
which is less homologous, and encoded for by a unique exon 1 for each isoform
was the site for unique peptides. We found, when searching for suitable peptides
for labeling, that there were no apparent unique sequences beyond approximate
amino acid number 210. For the isoforms quantified here, UGTs 1A1 and 1A6,
there were few tryptic peptides that fit the criteria for use in the method. For
UGT1A1 the enzyme sequence D70GAF(13C5,15N)YTLK77 was selected as the
second peptide (peptide 2) because it was the only remaining peptide of
sufficient length (< 16 amino acids), even though it was known that the DG
linkage could possibly undergo cyclization or isomerization [Vinther et al. 1996,
Fledelius et al. 1997], particularly at neutral or basic pH. This peptide could also
be affected by a reported G71R polymorphism (UGT1A1*6) that is more common
in Asians and found to produce Gilbert Syndrome [Akaba et al. 1998, Maruo et
al. 2005]. For UGT1A6 one other peptide could possibly have been used. This
was S185PDPVSYIPR194. It was not chosen because of a reported R184S
polymorphism [Basu et al. 2005], which if present would alter the length of the
tryptic peptide. Some additional SNPs for UGT1A1 have been reported for the
peptides employed, though these were relatively rare with allele frequencies that
are very low. Certainly, one must consider nonsynonymous SNPs when
interpreting quantitative proteomic data, but it may also be possible to use this
214
method to measure expression of the variant isoforms in subjects that are
heterozygous. The other concern with the method is that it does not consider
possible posttranslational modifications. The peptides selected here (Table 1) did
not include asparagine (N), a possible site for glycosylation, but were replete with
serine (S) and tyrosine (Y), which are possible sites for phosphorylation. To date
there is limited information on phosphorylation of UGTs [Basu et al. 2004, Ciotti
et al. 1997]. Alternative methods based on antibody detection may also, in any
case, be affected by phosphorylation.
The use of dithiothreitol and iodoacetamide for reduction and alkylation of
protein samples is well established. The use of heating to denature is less
common. Our method was validated by showing little difference between heating
at 95 ºC and using TFE to denature samples. A lower temperature produced
peak area ratios that were less reproducible. The use of detergents sodium
dodecyl sulfate and CHAPS [3-((3-cholamidopropyl)dimethylammonio)-1-
propane-sulfonic acid] to denature the proteins was also examined. However,
these were found to produce interfering peaks by full scan mass spectrometry,
thereby possibly affecting ionization and mass spectrometry performance.
Detergents could also possibly affect chromatography performance. Our sample
work up, using SPE, was simple and provided samples that easily interfaced with
LC-MS/MS. A point worth noting is that trypsinization is assumed to be 100%.
Other than optimizing the conditions for trypsinization, for example with respect
to time and trypsin concentration, as was done in our method development, it is
difficult to examine the efficiency of the reaction. It is also assumed that there are
215
no protein losses during denaturation and reduction. Labeled peptides are added
prior to digestion and SPE to compensate for possible peptide losses during
these steps. Loss of peptide would mean under calculation of UGT
concentration.
For initial method development a 15 cm column was tested due to the
complexity of the digested peptides. Peak shape was not optimal with a longer
column, therefore the 5 cm column was evaluated and found to provide adequate
chromatography with much shorter run times and higher sensitivity. Product ions
of > 500 Da were chosen for MRMs because of increased selectivity at higher
mass values (Fig. (1)) [Anderson and Hunter 2006]. The peak intensities
between MRMs were in good agreement for each peptide (MRM1/MRM2 ratio
range for peptides 1 to 4 was ≥ 0.45 ≤ 1.51). The dwell time (60 ms) was chosen
as a compromise between sensitivity needed and cycle time. The cycle time
(1.3 s) was sufficient for approximately 15 data points per peak, most peaks
being approximately 20 s wide. Peak intensities for peptide 2 MRMs were lower
than for the other peptides, possibly a consequence of the potential DG
cyclization and isomerization described earlier [Chen et al. 2005, Ritter et al.
1999]. The peak intensity of MRM2 in particular was low. This was interesting
because the product ion of this MRM was the only product ion of all MRMs
selected that did not contain the synthetic peptide label (Table 2).
Calculated concentrations of enzyme in recombinant material were consistent
between MRMs and between peptides for each UGT isoform. However,
reproducibility and the sensitivity are improved if optimization for the best peptide
216
and MRM is performed. Intra- and inter-day assay variation results indicated that
peptides 1 and 4 were the best peptides to use for the UGTs 1A1 and 1A6
quantification respectively. Peptides 2 and 3 could be used as support
verification. Intra-day variation would have been expected to be less than inter-
day variation, but examination of the data suggested that this was not so. This
could possibly be explained by the use of rat liver microsomes in calibrants
(intra-day samples) to normalize total protein content. The rat liver microsomal
matrix appeared to be more complex, with greater background interference than
the human liver microsomal matrix. Analysis of the human liver microsome library
provided a form of intra-day measure (samples were prepared and analyzed in
triplicate) free from rat liver microsomal matrix, with %C.V.s being better than
those obtained when rat liver microsomal matrix was present (Table 5). Results
again showed that peptides 1 and 4 were best because of the lower %C.V.s
obtained for those peptides.
Concentrations of UGT1A1 were greater than UGT1A6 in all 10 HLM library
samples when measured by LC-MS/MS (Table 5). Comparisons of
concentrations are not possible with Western blots since different antibodies
would be employed for distinct enzymes. For UGT1A enzymes, because they
share a common C-terminus via exon sharing, one could use the 1A common
antibody to estimate relative concentrations between isoforms assuming the
response is similar. However, the LC-MS/MS method employed here is generally
applicable to diverse proteins and provides greater precision than is commonly
obtained with Western blot combined with densitometry. There was no
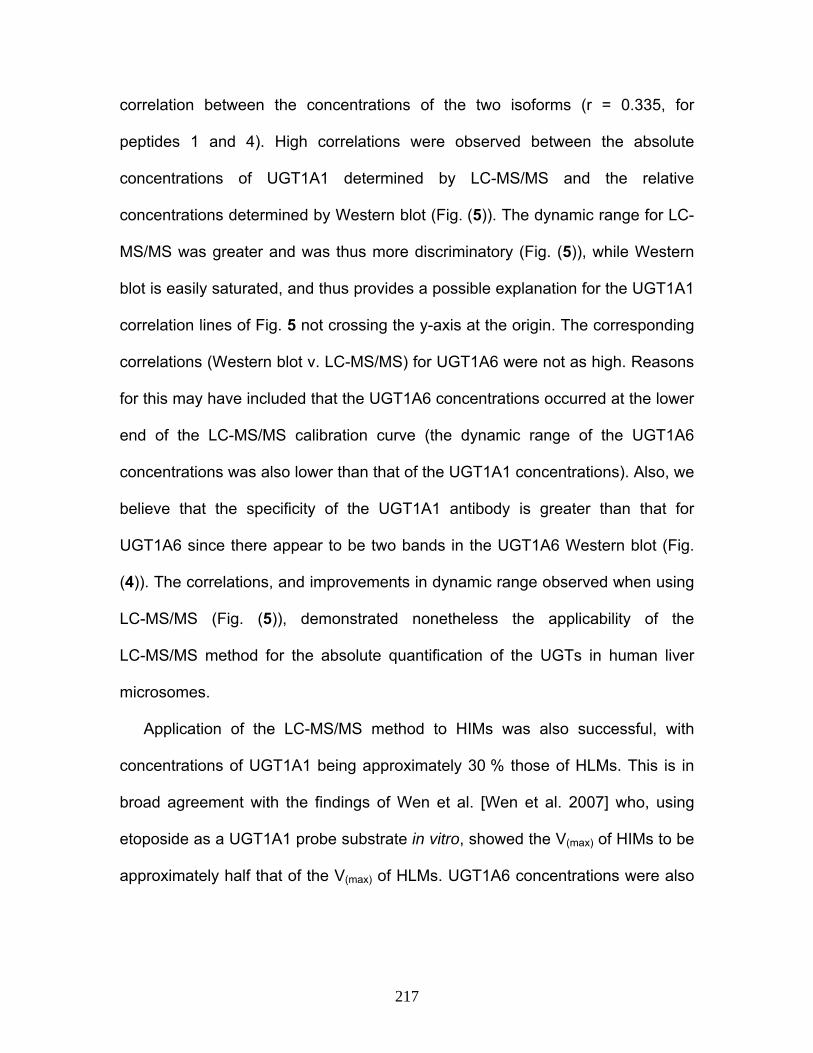
217
correlation between the concentrations of the two isoforms (r = 0.335, for
peptides 1 and 4). High correlations were observed between the absolute
concentrations of UGT1A1 determined by LC-MS/MS and the relative
concentrations determined by Western blot (Fig. (5)). The dynamic range for LC-
MS/MS was greater and was thus more discriminatory (Fig. (5)), while Western
blot is easily saturated, and thus provides a possible explanation for the UGT1A1
correlation lines of Fig. 5 not crossing the y-axis at the origin. The corresponding
correlations (Western blot v. LC-MS/MS) for UGT1A6 were not as high. Reasons
for this may have included that the UGT1A6 concentrations occurred at the lower
end of the LC-MS/MS calibration curve (the dynamic range of the UGT1A6
concentrations was also lower than that of the UGT1A1 concentrations). Also, we
believe that the specificity of the UGT1A1 antibody is greater than that for
UGT1A6 since there appear to be two bands in the UGT1A6 Western blot (Fig.
(4)). The correlations, and improvements in dynamic range observed when using
LC-MS/MS (Fig. (5)), demonstrated nonetheless the applicability of the
LC-MS/MS method for the absolute quantification of the UGTs in human liver
microsomes.
Application of the LC-MS/MS method to HIMs was also successful, with
concentrations of UGT1A1 being approximately 30 % those of HLMs. This is in
broad agreement with the findings of Wen et al. [Wen et al. 2007] who, using
etoposide as a UGT1A1 probe substrate in vitro, showed the V(max) of HIMs to be
approximately half that of the V(max) of HLMs. UGT1A6 concentrations were also
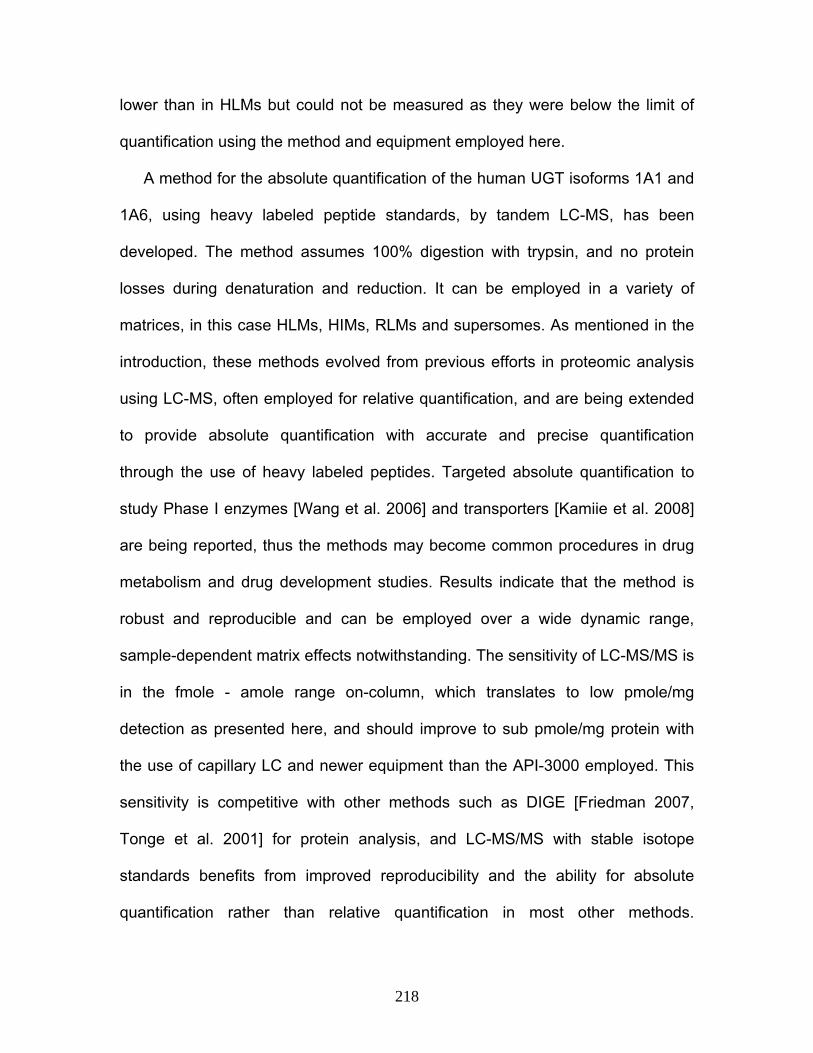
218
lower than in HLMs but could not be measured as they were below the limit of
quantification using the method and equipment employed here.
A method for the absolute quantification of the human UGT isoforms 1A1 and
1A6, using heavy labeled peptide standards, by tandem LC-MS, has been
developed. The method assumes 100% digestion with trypsin, and no protein
losses during denaturation and reduction. It can be employed in a variety of
matrices, in this case HLMs, HIMs, RLMs and supersomes. As mentioned in the
introduction, these methods evolved from previous efforts in proteomic analysis
using LC-MS, often employed for relative quantification, and are being extended
to provide absolute quantification with accurate and precise quantification
through the use of heavy labeled peptides. Targeted absolute quantification to
study Phase I enzymes [Wang et al. 2006] and transporters [Kamiie et al. 2008]
are being reported, thus the methods may become common procedures in drug
metabolism and drug development studies. Results indicate that the method is
robust and reproducible and can be employed over a wide dynamic range,
sample-dependent matrix effects notwithstanding. The sensitivity of LC-MS/MS is
in the fmole - amole range on-column, which translates to low pmole/mg
detection as presented here, and should improve to sub pmole/mg protein with
the use of capillary LC and newer equipment than the API-3000 employed. This
sensitivity is competitive with other methods such as DIGE [Friedman 2007,
Tonge et al. 2001] for protein analysis, and LC-MS/MS with stable isotope
standards benefits from improved reproducibility and the ability for absolute
quantification rather than relative quantification in most other methods.
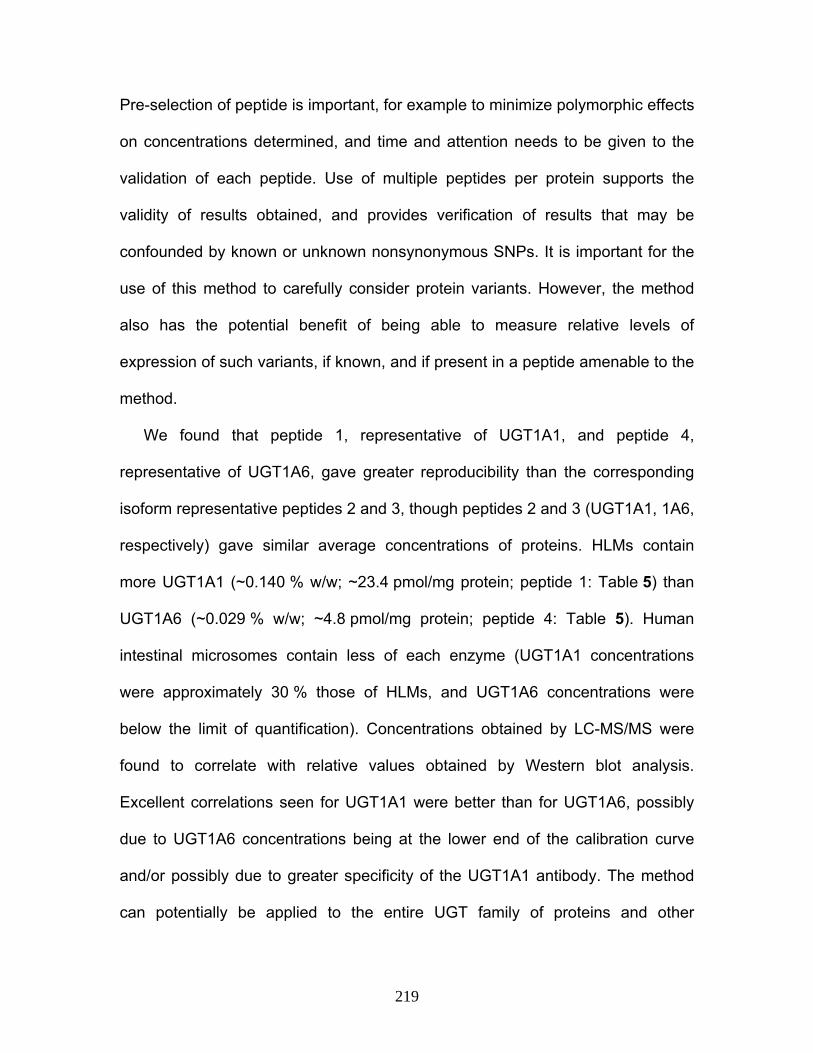
219
Pre-selection of peptide is important, for example to minimize polymorphic effects
on concentrations determined, and time and attention needs to be given to the
validation of each peptide. Use of multiple peptides per protein supports the
validity of results obtained, and provides verification of results that may be
confounded by known or unknown nonsynonymous SNPs. It is important for the
use of this method to carefully consider protein variants. However, the method
also has the potential benefit of being able to measure relative levels of
expression of such variants, if known, and if present in a peptide amenable to the
method.
We found that peptide 1, representative of UGT1A1, and peptide 4,
representative of UGT1A6, gave greater reproducibility than the corresponding
isoform representative peptides 2 and 3, though peptides 2 and 3 (UGT1A1, 1A6,
respectively) gave similar average concentrations of proteins. HLMs contain
more UGT1A1 (~0.140 % w/w; ~23.4 pmol/mg protein; peptide 1: Table 5) than
UGT1A6 (~0.029 % w/w; ~4.8 pmol/mg protein; peptide 4: Table 5). Human
intestinal microsomes contain less of each enzyme (UGT1A1 concentrations
were approximately 30 % those of HLMs, and UGT1A6 concentrations were
below the limit of quantification). Concentrations obtained by LC-MS/MS were
found to correlate with relative values obtained by Western blot analysis.
Excellent correlations seen for UGT1A1 were better than for UGT1A6, possibly
due to UGT1A6 concentrations being at the lower end of the calibration curve
and/or possibly due to greater specificity of the UGT1A1 antibody. The method
can potentially be applied to the entire UGT family of proteins and other
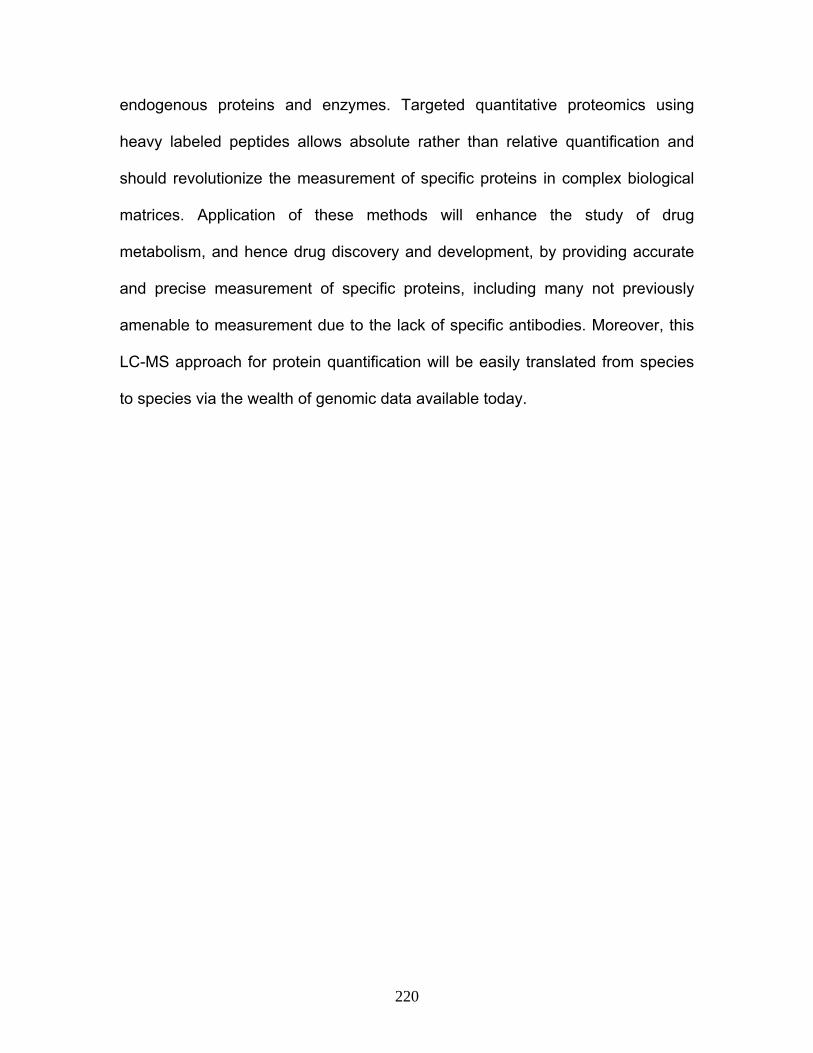
220
endogenous proteins and enzymes. Targeted quantitative proteomics using
heavy labeled peptides allows absolute rather than relative quantification and
should revolutionize the measurement of specific proteins in complex biological
matrices. Application of these methods will enhance the study of drug
metabolism, and hence drug discovery and development, by providing accurate
and precise measurement of specific proteins, including many not previously
amenable to measurement due to the lack of specific antibodies. Moreover, this
LC-MS approach for protein quantification will be easily translated from species
to species via the wealth of genomic data available today.
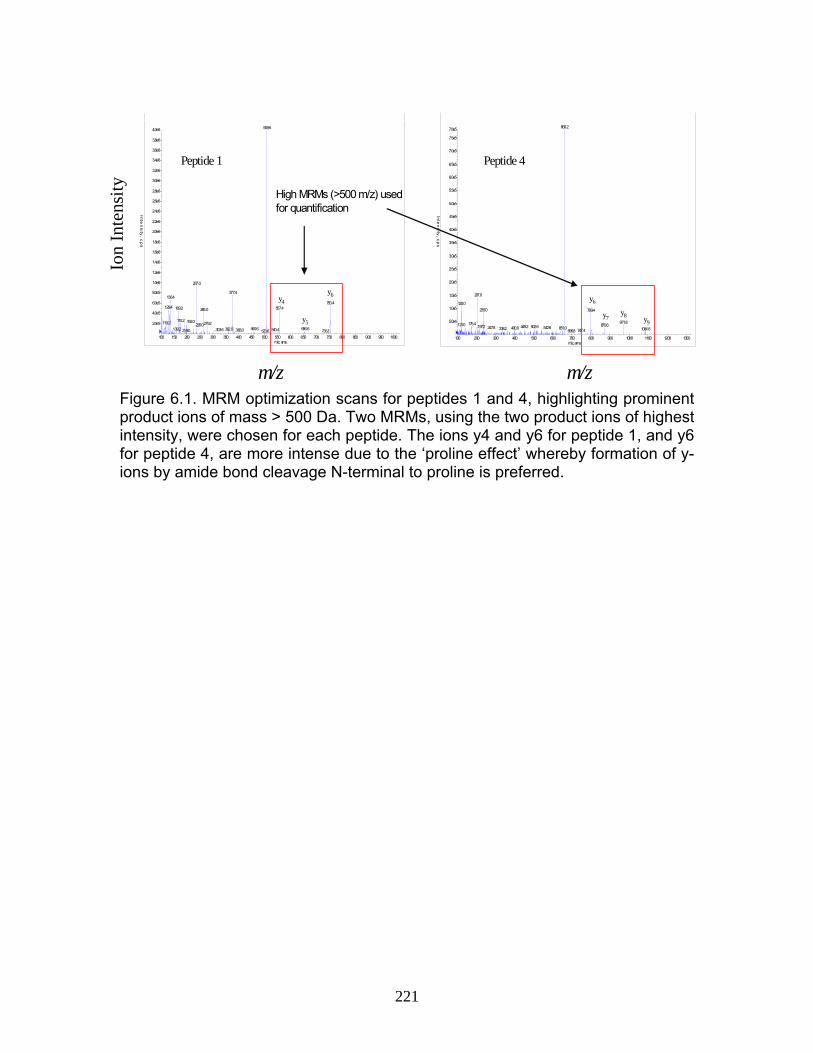
221
Figure 6.1. MRM optimization scans for peptides 1 and 4, highlighting prominent product ions of mass > 500 Da. Two MRMs, using the two product ions of highest intensity, were chosen for each peptide. The ions y4 and y6 for peptide 1, and y6 for peptide 4, are more intense due to the ‘proline effect’ whereby formation of y-ions by amide bond cleavage N-terminal to proline is preferred.
100 150 200 250 300 350 400 450 500 550 600 650 700 750 800 850 900 950 1000m/z, amu
2.0e5
4.0e5
6.0e5
8.0e5
1.0e6
1.2e6
1.4e6
1.6e6
1.8e6
2.0e6
2.2e6
2.4e6
2.6e6
2.8e6
3.0e6
3.2e6
3.4e6
3.6e6
3.8e6
4.0e6
Inten
sity, cp
s
509.6
237.0
377.4136.4
753.4129.4 557.4169.2 265.0
174.2 192.0119.2 279.2226.0656.6460.6362.0139.2 540.4303.6 383.0219.0 735.8523.6
100 200 300 400 500 600 700 800 900 1000 1100 1200 1300m/z, amu
5.0e4
1.0e5
1.5e5
2.0e5
2.5e5
3.0e5
3.5e5
4.0e5
4.5e5
5.0e5
5.5e5
6.0e5
6.5e5
7.0e5
7.5e5
7.8e5
Inten
sity, cp
s
660.2
207.0
120.0235.0 799.4
971.8175.4121.0 870.6502.6449.2197.2 542.6247.8 651.0400.0338.2 1084.6747.4696.8
High MRMs (>500 m/z) used for quantification
m/z m/z
Ion
Inte
nsity
y4
y5
y6 y6
y7y8 y9
Peptide 1 Peptide 4
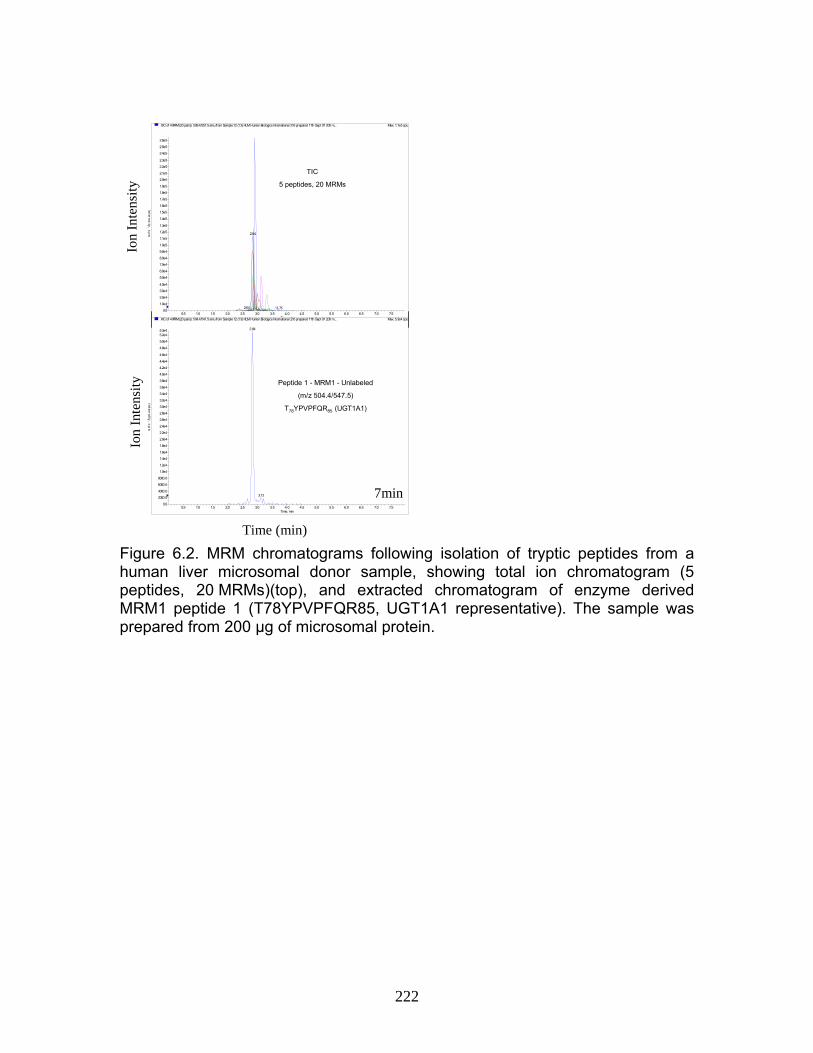
222
Figure 6.2. MRM chromatograms following isolation of tryptic peptides from a human liver microsomal donor sample, showing total ion chromatogram (5 peptides, 20 MRMs)(top), and extracted chromatogram of enzyme derived MRM1 peptide 1 (T78YPVPFQR85, UGT1A1 representative). The sample was prepared from 200 μg of microsomal protein.
XIC of +MRM (20 pairs): 509.4/557.5 amu from Sample 12 (13) HLM Human Biologics International 216 prepared 11th Sept 07 200 m... Max. 1.1e5 cps.
0.5 1.0 1.5 2.0 2.5 3.0 3.5 4.0 4.5 5.0 5.5 6.0 6.5 7.0 7.5Time, min
0.0
1.0e4
2.0e4
3.0e4
4.0e4
5.0e4
6.0e4
7.0e4
8.0e4
9.0e4
1.0e5
1.1e5
1.2e5
1.3e5
1.4e5
1.5e5
1.6e5
1.7e5
1.8e5
1.9e5
2.0e5
2.1e5
2.2e5
2.3e5
2.4e5
2.5e5
2.6e5
Inten
sity, cp
s 2.84
2.64 3.75
XIC of +MRM (20 pairs): 504.4/547.5 amu from Sample 12 (13) HLM Human Biologics International 216 prepared 11th Sept 07 200 m... Max. 5.3e4 cps.
0.5 1.0 1.5 2.0 2.5 3.0 3.5 4.0 4.5 5.0 5.5 6.0 6.5 7.0 7.5Time, min
0.0
2000.0
4000.0
6000.0
8000.0
1.0e4
1.2e4
1.4e4
1.6e4
1.8e4
2.0e4
2.2e4
2.4e4
2.6e4
2.8e4
3.0e4
3.2e4
3.4e4
3.6e4
3.8e4
4.0e4
4.2e4
4.4e4
4.6e4
4.8e4
5.0e4
5.2e45.3e4
Inte
nsity, c
ps
2.84
3.12
TIC
5 peptides, 20 MRMs
Peptide 1 - MRM1 - Unlabeled
(m/z 504.4/547.5)
T78YPVPFQR85 (UGT1A1)
Ion
Inte
nsity
Ion
Inte
nsity
Time (min)
7min
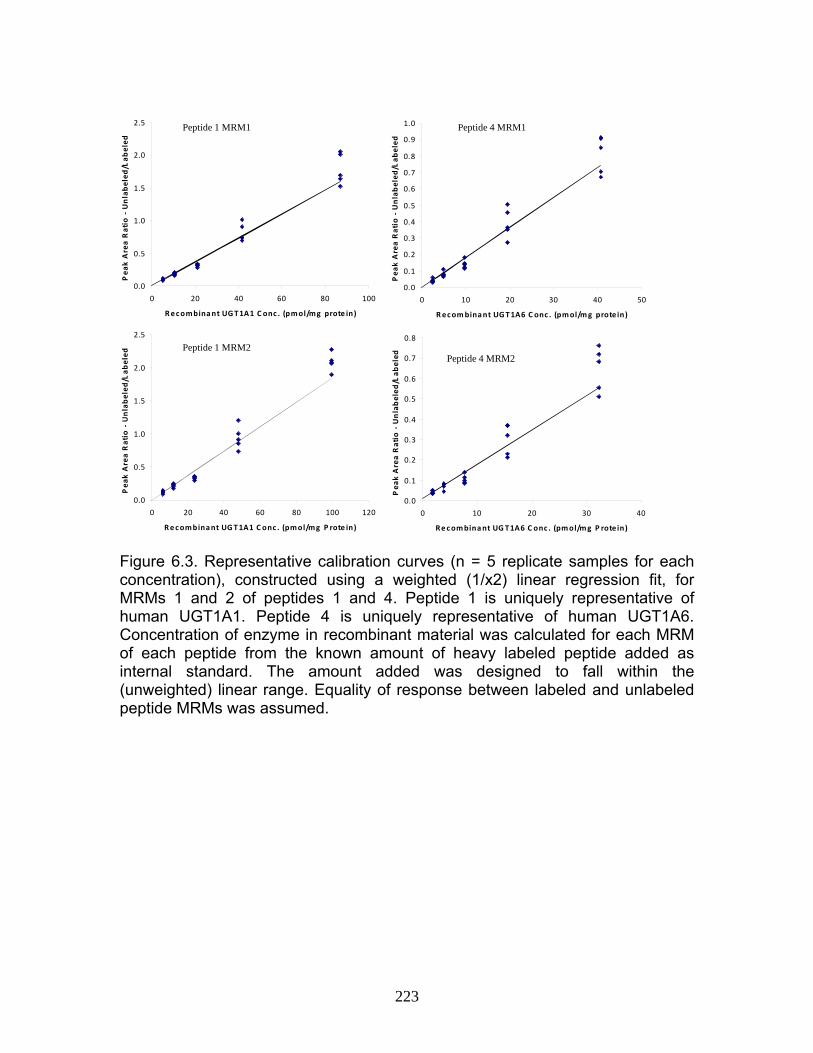
223
Figure 6.3. Representative calibration curves (n = 5 replicate samples for each concentration), constructed using a weighted (1/x2) linear regression fit, for MRMs 1 and 2 of peptides 1 and 4. Peptide 1 is uniquely representative of human UGT1A1. Peptide 4 is uniquely representative of human UGT1A6. Concentration of enzyme in recombinant material was calculated for each MRM of each peptide from the known amount of heavy labeled peptide added as internal standard. The amount added was designed to fall within the (unweighted) linear range. Equality of response between labeled and unlabeled peptide MRMs was assumed.
0.0
0.1
0.2
0.3
0.4
0.5
0.6
0.7
0.8
0 10 20 30 40
Recombinant UGT1A6 C onc . (pmol/mg P rote in)
Pea
k Area Ratio ‐ Unlabeled
/Lab
eled
0.0
0.1
0.2
0.3
0.4
0.5
0.6
0.7
0.8
0.9
1.0
0 10 20 30 40 50
Recombinant UGT1A6 C onc . (pmol/mg prote in)
Pea
k Area Ratio ‐ U
nlabeled
/Lab
eled
0.0
0.5
1.0
1.5
2.0
2.5
0 20 40 60 80 100
Recombinant UGT1A1 C onc . (pmol/mg prote in)
Pea
k Area Ratio ‐ Unlabeled
/Lab
eled
0.0
0.5
1.0
1.5
2.0
2.5
0 20 40 60 80 100 120
Recombinant UGT1A1 C onc . (pmol/mg P rote in)
Pea
k Area Ratio ‐ Unlabeled
/Lab
eled
Peptide 1 MRM1
Peptide 1 MRM2
Peptide 4 MRM1
Peptide 4 MRM2

224
Figure 6.4. Western immunoblot analysis of human liver microsome library of ten individual donors. Also shown are images of four highest concentration calibrant samples, two of which had not been digested by trypsin and two of which had been digested.
HB
216
HB
218
HB
219
HB
222
HB
224
HB
225
HB
228
HB
230
HB
233
HB
234
1A 1B 1C 1D
No trypsin Trypsin
UGT1A1
UGT1A6
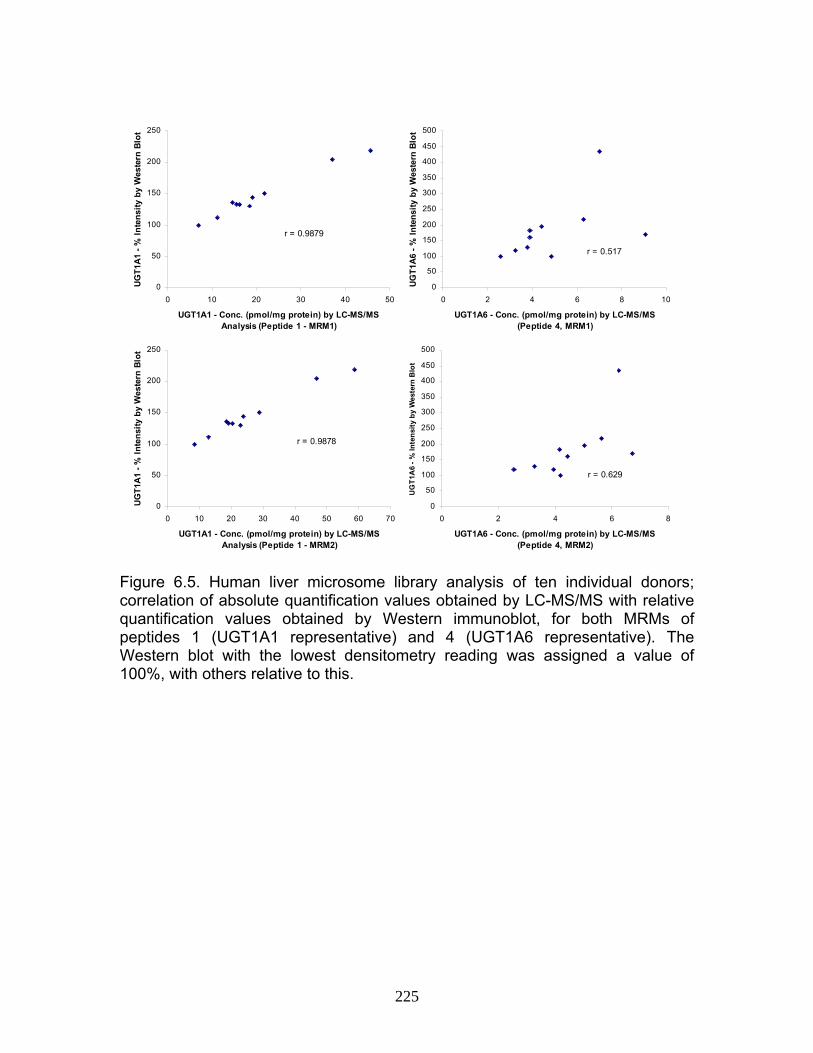
225
Figure 6.5. Human liver microsome library analysis of ten individual donors; correlation of absolute quantification values obtained by LC-MS/MS with relative quantification values obtained by Western immunoblot, for both MRMs of peptides 1 (UGT1A1 representative) and 4 (UGT1A6 representative). The Western blot with the lowest densitometry reading was assigned a value of 100%, with others relative to this.
0
50
100
150
200
250
0 10 20 30 40 50
UGT1A1 - Conc. (pmol/mg protein) by LC-MS/MS Analysis (Peptide 1 - MRM1)
UGT1
A1 -
% In
tens
ity b
y W
este
rn B
lot
r = 0.9879
0
50
100
150
200
250
0 10 20 30 40 50 60 70
UGT1A1 - Conc. (pmol/mg protein) by LC-MS/MS Analysis (Peptide 1 - MRM2)
UG
T1A
1 - %
Inte
nsity
by
Wes
tern
Blo
t
r = 0.9878
0
50
100
150
200
250
300
350
400
450
500
0 2 4 6 8 10
UGT1A6 - Conc. (pmol/mg protein) by LC-MS/MS(Peptide 4, MRM1)
UGT1
A6 -
% In
tens
ity b
y W
este
rn B
lot
r = 0.517
0
50
100
150
200
250
300
350
400
450
500
0 2 4 6 8
UGT1A6 - Conc. (pmol/mg protein) by LC-MS/MS(Peptide 4, MRM2)
UG
T1A
6 - %
Inte
nsity
by
Wes
tern
Blo
t
r = 0.629

226
Table 6.1. Unique human UGTs 1A1 and 1A6 representative heavy labeled peptides selected for use as internal standards for absolute quantification.
Peptide Number UGT Isoform Amino Acid Sequence
Peptide 1 UGT1A1 T78YPVPF(13C9,15N)QR85
Peptide 2 UGT1A1 D70GAF(13C9,15N)YTLK77
Peptide 3 UGT1A6 D44IVEV(13C5,15N)LSDR52
Peptide 4 UGT1A6 S103FLTAP(13C5,15N)QTEYR113
Peptide 5 UGT1A6 I77YPVP(13C5,15N)YDQEELK88

227
Table 6.2 MRM Transitions for UGT stable isotope standards Peptide 1 Peptide 2 Peptide 3 Peptide 4 Peptide 5 MRM1 MRM2 MRM1 MRM2 MRM1 MRM2 MRM1 MRM2 MRM1 MRM2 Product
Ion y4 y6 y4 y5 y6 y7 y6 y8 y8 y10
Labeled (internal standards) MRM 509.4/557.5 509.4/753.7462.8/524.4462.8/681.5 526.5/724.6526.5/823.6 660.1/799.6660.1/971.6750.5/1027.5750.5/1223.8
Label a Yes Yes No Yes Yes Yes Yes Yes Yes Yes Unlabeled (calibrants)
MRM 504.4/547.5 504.4/743.7457.8/524.4457.8/671.5 523.5/718.6523.5/817.6 657.1/793.6657.1/965.6747.5/1021.5747.5/1217.8a: Retention of heavy isotope label in product ion. Table 6.2. Chosen MRM transitions (transitions of highest sensitivity product ions) for synthetic heavy labeled and recombinant enzyme derived tryptic peptides showing product ion position in peptide, and whether product ions for the internal standards contain the labeled amino acid. Peptides 1 and 2 are uniquely representative of human UGT1A1, and peptides 3, 4 and 5 are uniquely representative of human UGT1A6.
227
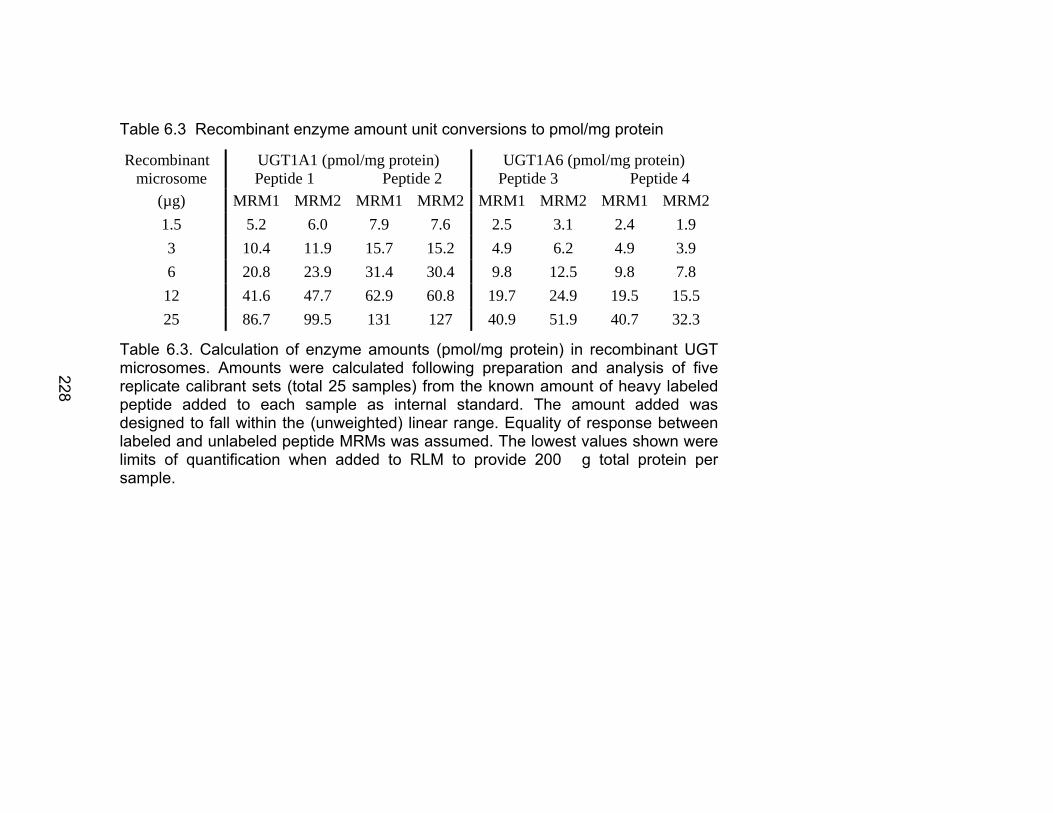
228
Table 6.3 Recombinant enzyme amount unit conversions to pmol/mg protein
Table 6.3. Calculation of enzyme amounts (pmol/mg protein) in recombinant UGT microsomes. Amounts were calculated following preparation and analysis of five replicate calibrant sets (total 25 samples) from the known amount of heavy labeled peptide added to each sample as internal standard. The amount added was designed to fall within the (unweighted) linear range. Equality of response between labeled and unlabeled peptide MRMs was assumed. The lowest values shown were limits of quantification when added to RLM to provide 200 �g total protein per sample.
Recombinant microsome
UGT1A1 (pmol/mg protein) Peptide 1 Peptide 2
UGT1A6 (pmol/mg protein) Peptide 3 Peptide 4
(µg) MRM1 MRM2 MRM1 MRM2 MRM1 MRM2 MRM1 MRM21.5 5.2 6.0 7.9 7.6 2.5 3.1 2.4 1.9 3 10.4 11.9 15.7 15.2 4.9 6.2 4.9 3.9 6 20.8 23.9 31.4 30.4 9.8 12.5 9.8 7.8 12 41.6 47.7 62.9 60.8 19.7 24.9 19.5 15.5 25 86.7 99.5 131 127 40.9 51.9 40.7 32.3
228
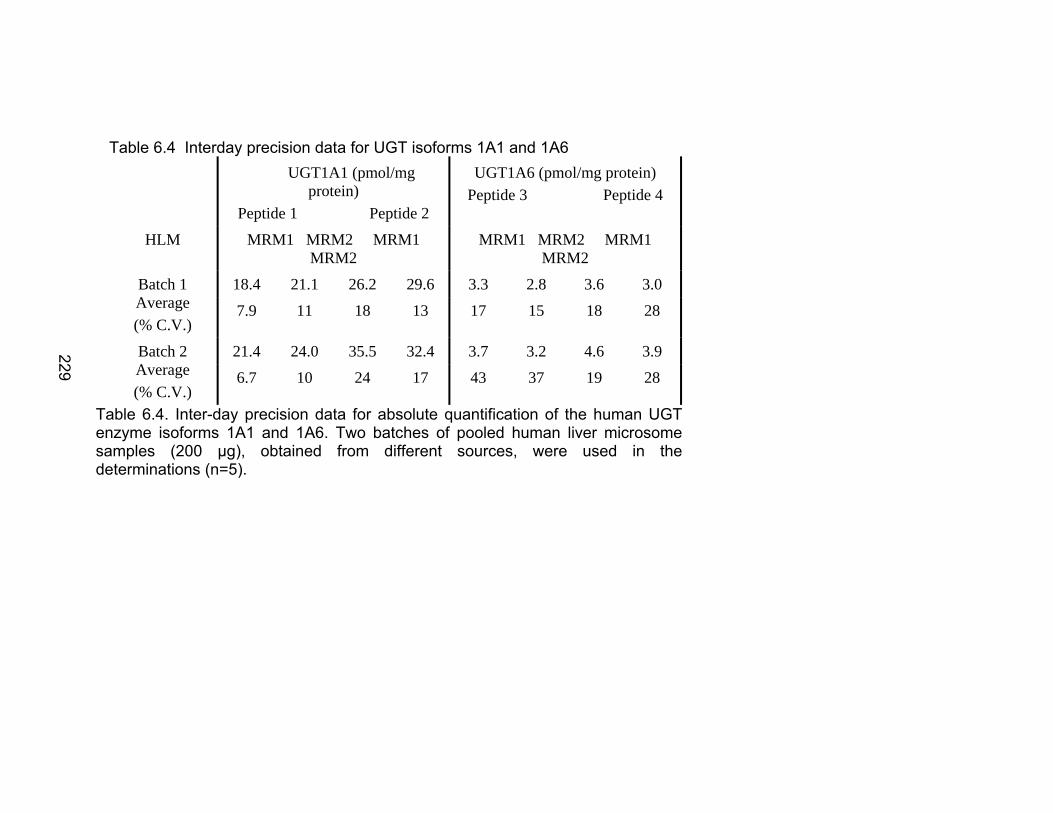
229
Table 6.4 Interday precision data for UGT isoforms 1A1 and 1A6
UGT1A1 (pmol/mg protein)
Peptide 1 Peptide 2
UGT1A6 (pmol/mg protein) Peptide 3 Peptide 4
HLM MRM1 MRM2 MRM1 MRM2
MRM1 MRM2 MRM1 MRM2
18.4 21.1 26.2 29.6 3.3 2.8 3.6 3.0 Batch 1 Average (% C.V.)
7.9 11 18 13 17 15 18 28
21.4 24.0 35.5 32.4 3.7 3.2 4.6 3.9 Batch 2 Average (% C.V.)
6.7 10 24 17 43 37 19 28
Table 6.4. Inter-day precision data for absolute quantification of the human UGT enzyme isoforms 1A1 and 1A6. Two batches of pooled human liver microsome samples (200 μg), obtained from different sources, were used in the determinations (n=5).
229
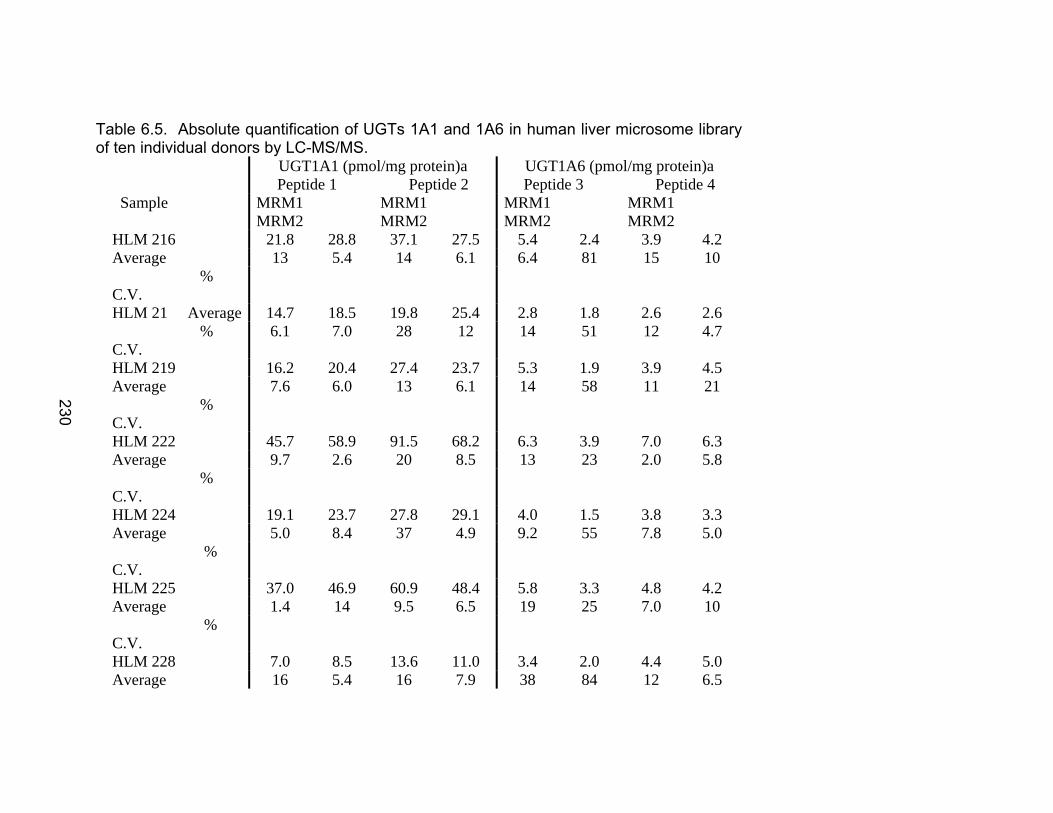
230
Table 6.5. Absolute quantification of UGTs 1A1 and 1A6 in human liver microsome library of ten individual donors by LC-MS/MS.
UGT1A1 (pmol/mg protein)a Peptide 1 Peptide 2
UGT1A6 (pmol/mg protein)a Peptide 3 Peptide 4
Sample MRM1
MRM2 MRM1 MRM2
MRM1 MRM2
MRM1 MRM2
21.8 28.8 37.1 27.5 5.4 2.4 3.9 4.2 13 5.4 14 6.1 6.4 81 15 10
HLM 216 Average % C.V.
14.7 18.5 19.8 25.4 2.8 1.8 2.6 2.6 6.1 7.0 28 12 14 51 12 4.7
HLM 21 Average % C.V.
16.2 20.4 27.4 23.7 5.3 1.9 3.9 4.5 7.6 6.0 13 6.1 14 58 11 21
HLM 219 Average % C.V.
45.7 58.9 91.5 68.2 6.3 3.9 7.0 6.3 9.7 2.6 20 8.5 13 23 2.0 5.8
HLM 222 Average % C.V.
19.1 23.7 27.8 29.1 4.0 1.5 3.8 3.3 5.0 8.4 37 4.9 9.2 55 7.8 5.0
HLM 224 Average % C.V.
37.0 46.9 60.9 48.4 5.8 3.3 4.8 4.2 1.4 14 9.5 6.5 19 25 7.0 10
HLM 225 Average % C.V.
7.0 8.5 13.6 11.0 3.4 2.0 4.4 5.0 HLM 228 Average 16 5.4 16 7.9 38 84 12 6.5
230
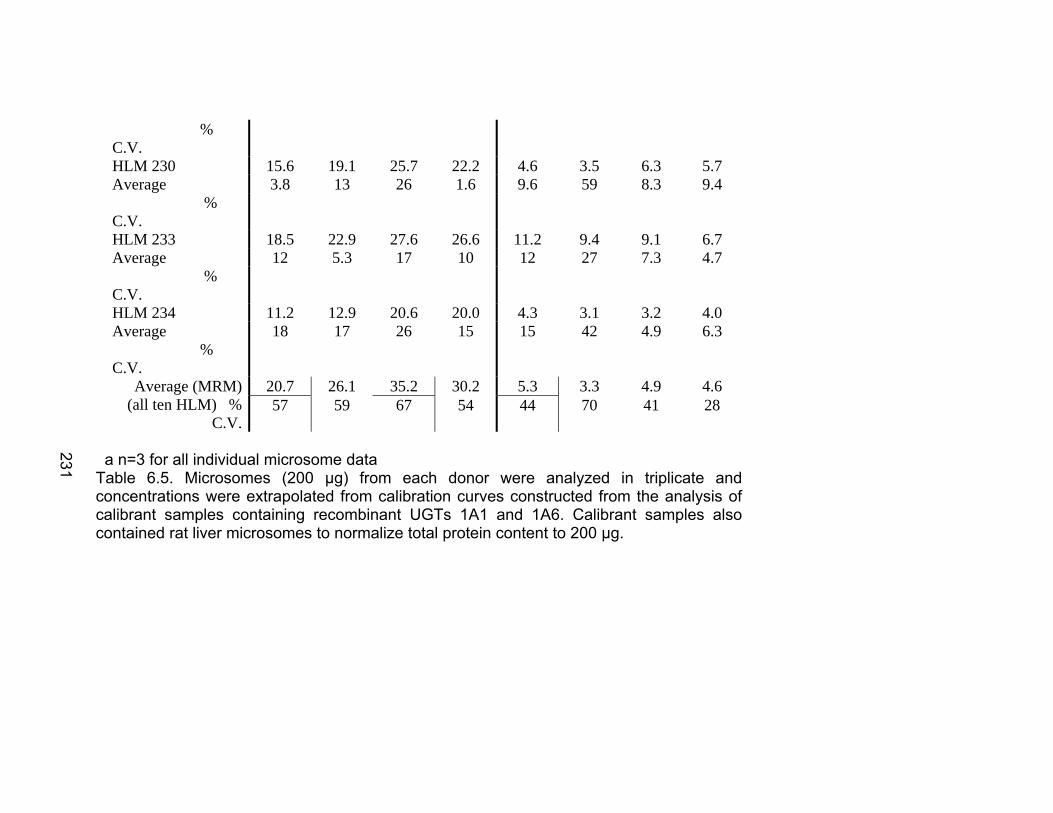
231
% C.V.
15.6 19.1 25.7 22.2 4.6 3.5 6.3 5.7 3.8 13 26 1.6 9.6 59 8.3 9.4
HLM 230 Average % C.V.
18.5 22.9 27.6 26.6 11.2 9.4 9.1 6.7 12 5.3 17 10 12 27 7.3 4.7
HLM 233 Average % C.V.
11.2 12.9 20.6 20.0 4.3 3.1 3.2 4.0 18 17 26 15 15 42 4.9 6.3
HLM 234 Average % C.V.
20.7 26.1 35.2 30.2 5.3 3.3 4.9 4.6 Average (MRM) (all ten HLM) %
C.V. 57 59 67 54 44 70 41 28
a n=3 for all individual microsome data Table 6.5. Microsomes (200 μg) from each donor were analyzed in triplicate and concentrations were extrapolated from calibration curves constructed from the analysis of calibrant samples containing recombinant UGTs 1A1 and 1A6. Calibrant samples also contained rat liver microsomes to normalize total protein content to 200 μg.
231

232
E. References
Akaba K, Kimura T, Sasaki A, Tanabe S, Ikegami T, Hashimoto M, Umeda H, Yoshida H, Umetsu K, Chiba H, Yuasa I, Hayasaka K. Neonatal hyperbilirubinemia and mutation of the bilirubin uridine diphosphate-glucuronosyltransferase gene: a common missense mutation among Japanese, Koreans and Chinese. Biochem. Mol. Biol. Int., 1998, 46(1), 21-6. Anderson L, Hunter CL. Quantitative Mass Spectrometric Multiple Reaction Monitoring Assays for Major Plasma Proteins. Mol. Cell Proteomics, 2006, 5(4), 573-88. Barnidge DR, Goodmanson MK, Klee GG, Muddiman DC. Absolute quantification of the model biomarker prostate-specific antigen in serum by LC-Ms/MS using protein cleavage and isotope dilution mass spectrometry. J. Proteome Res., 2004, 3(3), 644-52. Barr JR, Maggio VL, Patterson DG. Jr, Cooper GR, Henderson LO, Turner WE, Smith SJ, Hannon WH, Needham LL, Sampson EJ. Isotope dilution--mass spectrometric quantification of specific proteins: model application with apolipoprotein A-I. Clin. Chem., 1996, 42(10), 1676-82. Basu NK, Kovarova M, Garza A, Kubota S, Saha T, Mitra PS, Banerjee R, Rivera J, Owens IS. Proc. Nat. Acad. Sci., 2005, 102(18), 6285-90. Basu NK, Kubota S, Meselhy MR, Ciotti M, Chowdhury B, Hartori M, Owens IS. J. Biol. Chem., 2004, 279(27), 28320-29. Beynon RJ, Doherty MK, Pratt JM, Gaskell SJ. Multiplexed absolute quantification in proteomics using artificial QCAT proteins of concatenated signature peptides. Nat. Methods, 2005, 2(8), 587-9. Chen S, Beaton D, Nguyen N, Senekeo-Effenberger K, Brace-Sinnokrak E, Argikar U, Remmel RP, Trottier J, Barbier O, Ritter JK, Tukey RH. Tissue-specific, inducible, and hormonal control of the human UDP-glucuronosyltransferase-1 (UGT1) locus. J. Biol. Chem., 2005, 280(45), 37547–557. Ciotti M, Marrone A, Potter C, Owens IS. Genetic polymorphism in the human UGT1A6 (planar phenol) UDP-glucuronosyltransferase: pharmacological implications. Pharmacogenetics, 1997, 7(6), 485-95. Evans WE, Relling MV. Pharmacogenomics: translating functional genomics into rational therapeutics. Science, 1999, 286(5439), 487-91.
233
Fledelius C, Johnsen AH, Cloos PA, Bonde M, Qvist P. Characterization of urinary degradation products derived from type I collagen. Identification of a beta-isomerized Asp-Gly sequence within the C-terminal telopeptide (alpha1) region. J. Biol. Chem., 1997, 272(15), 9755-63. Friedman DB. Quantitative proteomics for two-dimensional gels using difference gel electrophoresis. Methods Mol. Biol., 2007, 367, 219-39. Gerber SA, Rush J, Stemman O, Kirschner MW, Gygi SP. Absolute quantification of proteins and phosphoproteins from cell lysates by tandem MS. Proc. Natl. Acad. Sci. U S A, 2003, 100(12), 6940–45. Guillemette C. Pharmacogenomics of human UDP-glucuronosyltransferase enzymes. Pharmacogenomics J., 2003, 3(3), 136-58. Gygi SP, Rist B, Gerber SA, Turecek F, Gelb MH, Aebersold R. Quantitative analysis of complex protein mixtures using isotope-coded affinity tags. Nat. Biotechnol., 1999, 17(10), 994-9. Jenkins RE, Kitteringham NR, Hunter CL, Webb S, Hunt TJ, Elsby R, Watson RB, Williams D, Pennington SR, Park BK. Relative and absolute quantitative expression profiling of cytochromes P450 using isotope-coded affinity tags. Proteomics, 2006, 6(6), 1934-47. Kamiie J, Ohtsuki S, Iwase R, Ohmine K, Katsukura Y, Yanai K, Sekine Y, Uchida Y, Ito S, Terasaki T. Quantitative atlas of membrane transporter proteins: development and application of a highly sensitive simultaneous LC/MS/MS method combined with novel in-silico peptide selection criteria. 2008 Pharm. Res., Jan 25 [Epub ahead of print]. Kirsch S, Widart J, Louette J, Focant JF, De Pauw E. Development of an absolute quantification method targeting growth hormone biomarkers using liquid chromatography coupled to isotope dilution mass spectrometry. J. Chromatogr. A, 2007, 1153(1-2), 300-6. Kuhn E, Wu J, Karl J, Liao H, Zolg W, Guild B. Quantification of C-reactive protein in the serum of patients with rheumatoid arthritis using multiple reaction monitoring mass spectrometry and 13C-labeled peptide standards. Proteomics, 2004, 4(4), 1175-86. Lin S, Shaler TA, Becker CH. Quantification of intermediate-abundance proteins in serum by multiple reaction monitoring mass spectrometry in a single-quadrupole ion trap. Anal. Chem., 2006, 78(16), 5762-7.

234
Maruo Y, Iwai M, Mori A, Sato H, Takeuchi Y. Polymorphism of UDP-glucuronosyltransferase and drug metabolism. Curr. Drug Metab., 2005, 6(2), 91-9. Meech R and Mackenzie PI. Structure and function of uridine diphosphate glucuronosyltransferases. Clin. Exp. Pharmacol. Physiol., 1997, 24(12), 907-15. Ong SE, Blagoev B, Kratchmarova I, Kristensen DB, Steen H, Pandey A, Mann M. Stable isotope labeling by amino acids in cell culture, SILAC, as a simple and accurate approach to expression proteomics. Mol. Cell Proteomics, 2002, 1(5), 376–86. Ritter JK, Kessler FK, Thompson MT, Grove AD, Auyeung DJ, Fisher RA. Expression and inducibility of the human bilirubin UDP-glucuronosyltransferase UGT1A1 in liver and cultured primary hepatocytes: evidence for both genetic and environmental influences. Hepatology, 1999, 30(2), 476–84. Roepstorff P and Fohlman J. Proposal for a common nomenclature for sequence ions in mass spectra of peptides. Biomed. Mass Spectrom., 1984, 11(11), 601. Ross P.L.; Huang Y.N.; Marchese J.N.; Williamson B.; Parker K.; Hattan S.; Khainovski N, Pillai S, Dey S, Daniels S, Purkayastha S, Juhasz P, Martin S, Bartlet-Jones M, He F, Jacobson A, Pappin DJ. Multiplexed protein quantitation in Saccharomyces cerevisiae using amine-reactive isobaric tagging reagents. Mol. Cell Proteomics, 2004, 3(12), 1154-69. Skalnikova H, Rehulka P, Chmelik J, Martinkova J, Zilvarova M, Gadher SJ, Kovarova H. Relative quantitation of proteins fractionated by the ProteomeLabtrade mark PF 2D system using isobaric tags for relative and absolute quantitation (iTRAQ). Anal. Bioanal. Chem., 2007, 389(5), 1639-45. Smolka MB, Zhou H, Purkayastha S, Aebersold R. Optimization of the isotope-coded affinity tag-labeling procedure for quantitative proteome analysis. Anal. Biochem., 2001, 297(1), 25-31. Tonge R, Shaw J, Middleton B, Rowlinson R, Rayner S, Young J, Pognan F, Hawkins E, Currie I, Davison M. Validation and development of fluorescence two-dimensional differential gel electrophoresis proteomics technology. Proteomics, 2001, 1(3), 377-96. Tukey RH and Strassburg CP. Human UDP-glucuronosyltransferases: metabolism, expression, and disease. Annu. Rev. Pharmacol. Toxicol., 2000, 40, 581-616.
235
Turecek F. Mass spectrometry in coupling with affinity capture-release and isotope-coded affinity tags for quantitative protein analysis. J. Mass Spectrom., 2002, 37(1), 1-14. Vinther A, Holm A, Hoeg-Jensen T, Jespersen A.M, Klausen NK, Christensen T, Sorensen HH. Synthesis of stereoisomers and isoforms of a tryptic heptapeptide fragment of human growth hormone and analysis by reverse-phase HPLC and capillary electrophoresis. Eur. J. Biochem., 1996, 235(1-2), 304-9. Wang H, Qian WJ, Mottaz HM, Clauss TR, Anderson DJ, Moore RJ, Camp DG, Khan AH, Sforza DM, Pallavicini M, Smith DJ, Smith RD. Development and evaluation of a micro- and nanoscale proteomic sample preparation method.J. Proteome Res., 2005, 4(6), 2397-403. Wang MZ, Wu Q, Bridges AS, Smith PC, Kornbluth S, Tidwell RR, Paine MF, Hall JE. A gel-free MS-based quantitative proteomic approach accurately measures cytochrome P450 protein concentrations in human liver microsomes. ISSX 14th National Meeting, San Juan, Puerto Rico, October 22-26, 2006. Wellmann A, Wollscheid V, Lu H, Ma ZL, Albers P, Schutze K, Rohde V, Behrens P, Dreschers S, Ko Y, Wernert N. Analysis of microdissected prostate tissue with ProteinChip(R) arrays - a way to new insights into carcinogenesis and to diagnostic tools. Int. J. Mol. Med., 2002, 9(4), 341-7. Wells PG, Mackenzie PI, Chowdhury JR, Guillemette C, Gregory PA, Ishii Y, Hansen AJ, Kessler FK, Kim PM, Chowdhury NR, Ritter JK. Glucuronidation and the UDP-glucuronosyltransferases in health and disease. Drug Metab. Dispos., 2004, 32(3), 281-90. Wen Z, Tallman MN, Ali SY, Smith PC. UDP-glucuronosyltransferase 1A1 is the principal enzyme responsible for etoposide glucuronidation in human liver and intestinal microsomes: structural characterization of phenolic and alcoholic glucuronides of etoposide and estimation of enzyme kinetics. Drug Metab. Dispos., 2007, 35(3), 371-80.