The Role of Bacterial Products and Intestinal Microbiota in Non … · 2015-11-24 · NAFLD...
133
The Role of Bacterial Products and Intestinal Microbiota in Non-Alcoholic Fatty Liver Disease by Hannah Elizabeth Da Silva A thesis submitted in conformity with the requirements for the degree of Master of Science Department of Nutritional Sciences University of Toronto © Copyright by Hannah E Da Silva, 2015
Transcript of The Role of Bacterial Products and Intestinal Microbiota in Non … · 2015-11-24 · NAFLD...
The Role of Bacterial Products and Intestinal Microbiota in Non-Alcoholic Fatty Liver Disease
by
Hannah Elizabeth Da Silva
A thesis submitted in conformity with the requirements for the degree of Master of Science
Department of Nutritional Sciences University of Toronto
© Copyright by Hannah E Da Silva, 2015
ii
The Role of Bacterial Products and Intestinal Microbiota in
Non-Alcoholic Fatty Liver Disease
Hannah Elizabeth Da Silva
Master of Science
Department of Nutritional Sciences
University of Toronto
2015
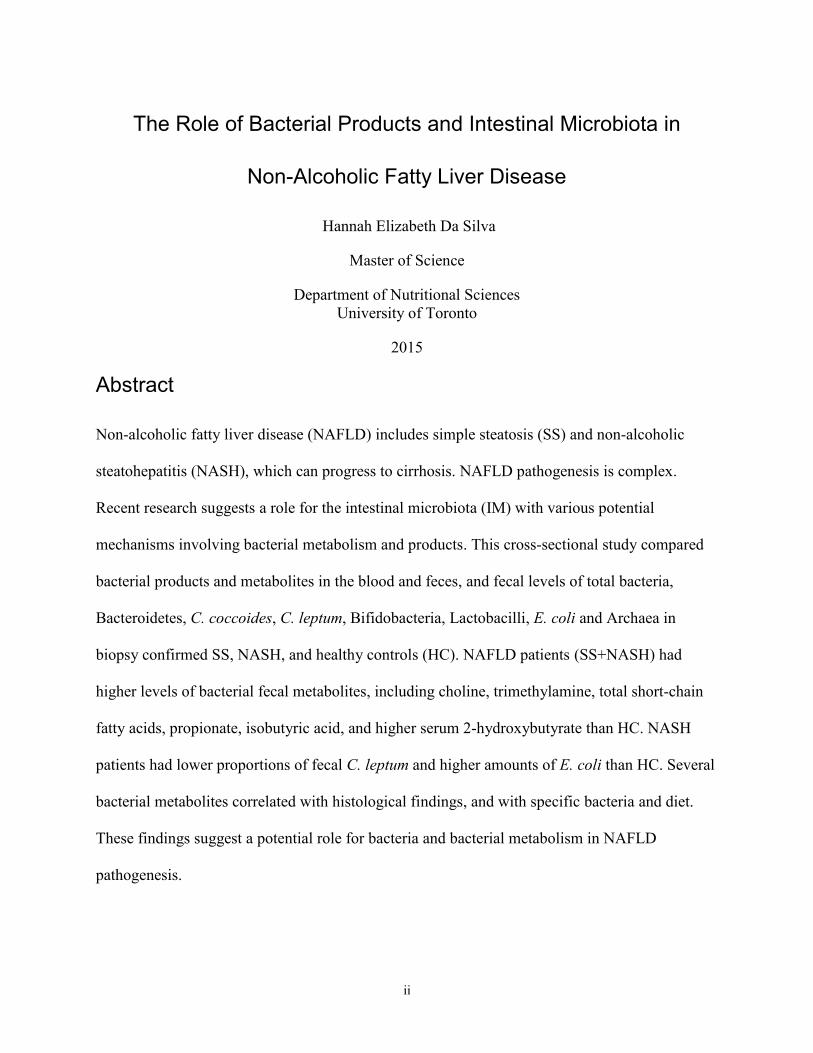
Abstract
Non-alcoholic fatty liver disease (NAFLD) includes simple steatosis (SS) and non-alcoholic
steatohepatitis (NASH), which can progress to cirrhosis. NAFLD pathogenesis is complex.
Recent research suggests a role for the intestinal microbiota (IM) with various potential
mechanisms involving bacterial metabolism and products. This cross-sectional study compared
bacterial products and metabolites in the blood and feces, and fecal levels of total bacteria,
Bacteroidetes, C. coccoides, C. leptum, Bifidobacteria, Lactobacilli, E. coli and Archaea in
biopsy confirmed SS, NASH, and healthy controls (HC). NAFLD patients (SS+NASH) had
higher levels of bacterial fecal metabolites, including choline, trimethylamine, total short-chain
fatty acids, propionate, isobutyric acid, and higher serum 2-hydroxybutyrate than HC. NASH
patients had lower proportions of fecal C. leptum and higher amounts of E. coli than HC. Several
bacterial metabolites correlated with histological findings, and with specific bacteria and diet.
These findings suggest a potential role for bacteria and bacterial metabolism in NAFLD
pathogenesis.
iii
Acknowledgments
I would like to thank the many individuals who have contributed to this study and assisted me
during my graduate studies.
First, I must thank our study participants who were willing to sacrifice their time to be part of our
study during what was often a very stressful period in their lives.
Thank you to Dr. Allard who has been a constant source of motivation, support, and inspiration.
You are and will continue to be a great role model for my career.
Thank you as well to the members of my advisory committee: Dr. Elena Comelli, Dr. Thomas
Wolever, and Dr. Eberhard Renner. Your expertise and support has been influential throughout
this process. It was an honour to work with each of you.
A very special thank you is owed to Dr. Bianca Arendt who was involved in planning and
conducting this research long before me. Without your help in patient recruitment, grant writing,
presentation edits, and guidance in the lab, this thesis would not have been possible.
I am very grateful for the expertise and support of our wonderful statistician, Anastasia Teterina.
Thank you for your assistance with everything from course work to abstract writing to my final
analyses and your veterinary expertise. Our research group is very lucky to have you.
Thank you to my other officemates past and present, especially Katherine Schwenger and Sultan
Alenezi who have been with me since day one. A special thanks goes to Dr. Paulina Pettinelli
who assisted with stool homogenization.
Thank you to Dr. Amel Taibi who completed our DNA extractions and the qPCR analyses. I am
also very grateful for your willingness to answer all of my other laboratory associated questions.
Thank you to our many collaborators. Thank you to Dr. Scott Fung and Dr. David Wong who
assisted with the recruitment of NAFLD patients. Thank you to Dr. Ian McGilvray and the entire
Toronto General Hospital Multi-Organ Transplant Program team who assisted with recruiting

iv
healthy controls. I am very appreciative of the excellent work of Dr. Sandra Fischer who
assessed all liver biopsies.
Thank you to my colleagues and manager, Karen Smith, at Sunnybrook Health Science Centre
for continuing to keep me on as a Registered Dietitian while also giving me the time to complete
my graduate studies in a timely manner.
Lastly, but most importantly, I would like to thank my friends and family who have been a
source of encouragement and support and who have accepted my absence in the last several
months with understanding. Thank you to my brilliant husband Michael who believes that I can
do amazing things. Your patience and encouragement have not gone unnoticed.
v
Table of Contents
Acknowledgments.......................................................................................................................... iii
Table of Contents .............................................................................................................................v
List of Tables ................................................................................................................................. ix
List of Figures ................................................................................................................................ xi
List of Appendices ....................................................................................................................... xiii
List of Abbreviations ................................................................................................................... xiv
1 Introduction .................................................................................................................................1
2 Review of the Literature..............................................................................................................3
2.1 An Introduction to Non-Alcoholic Fatty Liver Disease Pathogenesis.................................3
2.1.1 Insulin Resistance ....................................................................................................3
2.1.2 Lipid Peroxidation and Lipotoxicity ........................................................................3
2.1.3 Mitochondrial and Endoplasmic Reticulum Stress ..................................................4
2.1.4 Genetic Factors ........................................................................................................4
2.1.5 Diet and Physical Activity .......................................................................................5
2.1.5.1 Carbohydrates ............................................................................................5
2.1.5.2 Fat ..............................................................................................................6
2.1.5.3 Vitamins ....................................................................................................7
2.2 Role of intestinal microbiota in non-alcoholic fatty liver disease .......................................7
2.2.1 Increase energy uptake .............................................................................................8
2.2.2 Increase Chronic Inflammation..............................................................................10
2.2.2.1 Toll-Like Receptor 4 and Inflammatory Cytokines ................................10
2.2.2.2 Endotoxin ................................................................................................10
2.2.2.3 Intestinal Permeability .............................................................................11
vi
2.2.3 The Role of Products of Bacterial Metabolism in NAFLD ...................................12
2.2.3.1 Short-Chain Fatty Acids ..........................................................................12
2.2.3.1.1 Butyrate .................................................................................................. 12
2.2.3.1.2 Propionate ............................................................................................... 13
2.2.3.1.3 Acetate .................................................................................................... 14
2.2.3.2 Ethanol .....................................................................................................14
2.2.3.3 Choline metabolism .................................................................................14
2.2.4 NAFLD and the Intestinal Microbiota: Clinical Studies .......................................15
2.2.5 Probiotic and Prebiotic Trials ................................................................................18
2.2.6 Proposed Mechanism .............................................................................................20
3 Research Aim and Hypotheses .................................................................................................21
4 Materials and Methods ..............................................................................................................22
4.1 Study Design ......................................................................................................................22
4.2 Clinical Data, Environmental Questionnaire, and Anthropometric Measurements ..........23
4.3 Nutrition and Activity Assessment ....................................................................................23
4.4 Clinical Biochemistry ........................................................................................................25
4.5 Liver Histology ..................................................................................................................26
4.6 Plasma Endotoxin ..............................................................................................................28
4.7 Serum Metabolites .............................................................................................................29
4.8 Stool Sample Collection and Analysis ...............................................................................31
4.8.1 Stool Homogenization ...........................................................................................31
4.8.2 Fecal Metabolite Analysis......................................................................................32
4.8.3 DNA Extraction .....................................................................................................32
4.8.4 Quantitative Real-time PCR ..................................................................................32

vii
4.9 Statistical Analysis .............................................................................................................33
4.9.1 Data Analysis .........................................................................................................33
4.9.2 Power Calculations ................................................................................................34
5 Results .......................................................................................................................................35
5.1 Subjects ..............................................................................................................................35
5.2 Dietary Intake and Physical Activity .................................................................................40
5.3 Bacterial Products ..............................................................................................................45
5.3.1 Plasma Endotoxin ..................................................................................................45
5.3.2 Short Chain Fatty Acids and Other Organic Acids ................................................46
5.3.3 Metabolites Related to the Bacterial Metabolism of Choline ................................49
5.3.4 Ethanol ...................................................................................................................52
5.4 Intestinal Microbiota ..........................................................................................................52
5.5 Relationships between Bacterial Metabolites, Bacteria of Interest, Disease Status, and
Diet .....................................................................................................................................55
6 Discussion .................................................................................................................................66
6.1 Endotoxin ...........................................................................................................................66
6.2 SCFA and Related Metabolites ..........................................................................................68
6.3 Metabolites Related to the Bacterial Metabolism of Choline ............................................71
6.4 Ethanol ...............................................................................................................................73
6.5 Intestinal Microbiota ..........................................................................................................73
6.6 Diet and Physical Activity .................................................................................................75
6.7 Potential Confounders ........................................................................................................76
7 Strengths and Limitations .........................................................................................................79
8 Conclusions ...............................................................................................................................81
9 Future Directions .......................................................................................................................82
References ......................................................................................................................................84

viii
Appendices ...................................................................................................................................104
ix
List of Tables
Page
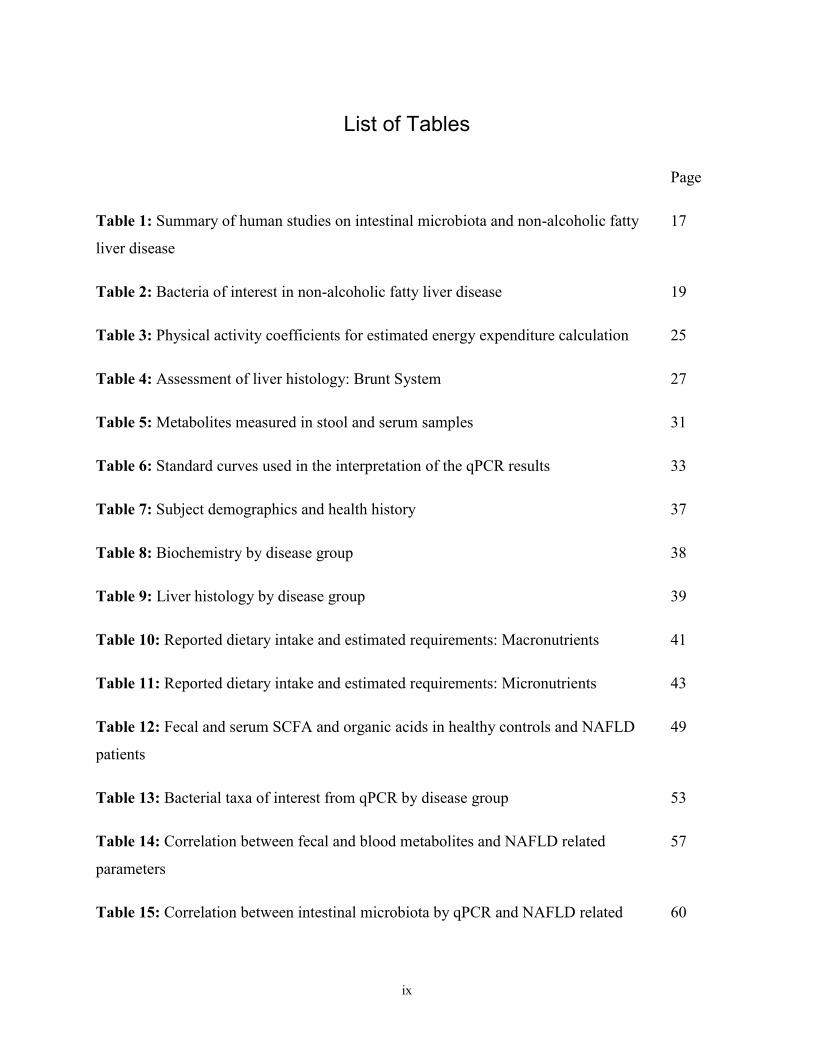
Table 1: Summary of human studies on intestinal microbiota and non-alcoholic fatty
liver disease
17
Table 2: Bacteria of interest in non-alcoholic fatty liver disease 19
Table 3: Physical activity coefficients for estimated energy expenditure calculation 25
Table 4: Assessment of liver histology: Brunt System 27
Table 5: Metabolites measured in stool and serum samples 31
Table 6: Standard curves used in the interpretation of the qPCR results 33
Table 7: Subject demographics and health history 37
Table 8: Biochemistry by disease group 38
Table 9: Liver histology by disease group 39
Table 10: Reported dietary intake and estimated requirements: Macronutrients 41
Table 11: Reported dietary intake and estimated requirements: Micronutrients 43
Table 12: Fecal and serum SCFA and organic acids in healthy controls and NAFLD
patients
49
Table 13: Bacterial taxa of interest from qPCR by disease group 53
Table 14: Correlation between fecal and blood metabolites and NAFLD related
parameters
57
Table 15: Correlation between intestinal microbiota by qPCR and NAFLD related 60
x
parameters
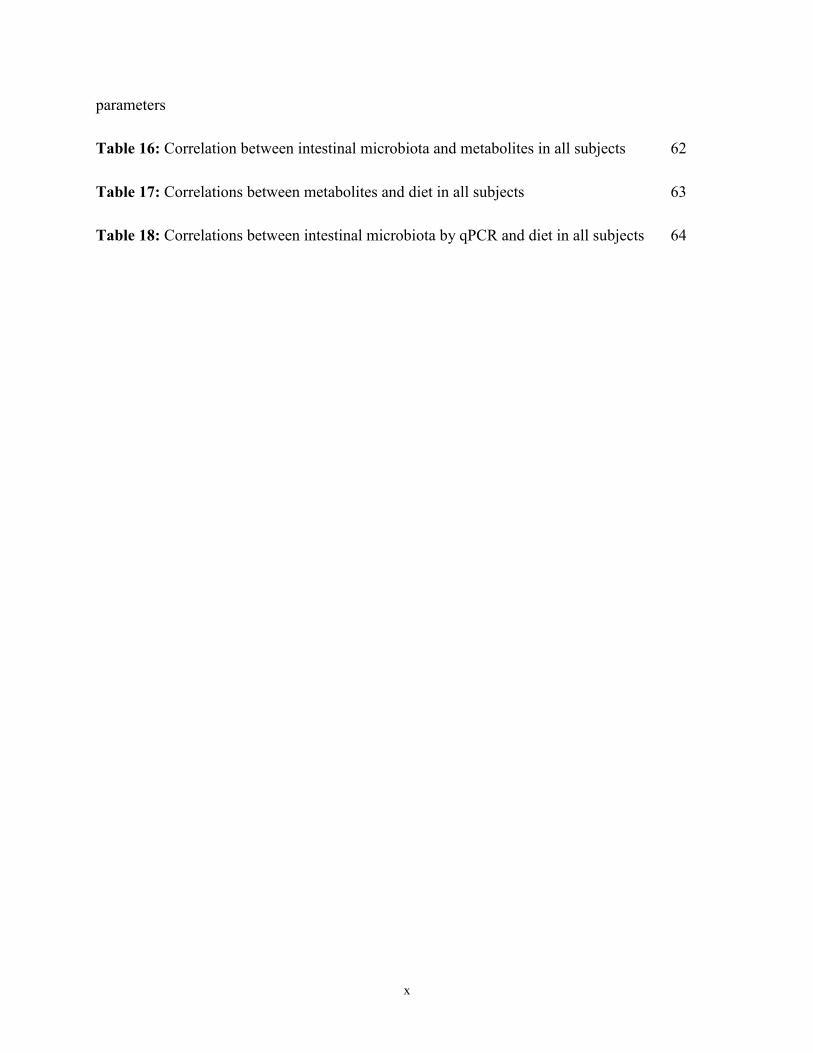
Table 16: Correlation between intestinal microbiota and metabolites in all subjects 62
Table 17: Correlations between metabolites and diet in all subjects 63
Table 18: Correlations between intestinal microbiota by qPCR and diet in all subjects 64

xi
List of Figures
Page
Figure 1: Reported proportion of estimated energy requirement consumed 42
Figure 2: Reported proportion of basal metabolic rate consumed 42
Figure 3: Reported total daily physical activity completed 44
Figure 4: Reported daily minutes of strenuous and very strenuous physical activity 44
Figure 5: Comparison of plasma endotoxin concentration between groups 45
Figure 6: Comparison of fecal butyric acid between groups 47
Figure 7: Comparison of fecal propionate between groups 47
Figure 8: Comparison of fecal acetic acid between groups 48
Figure 9: Comparison of serum acetic acid between groups 48
Figure 10: Fecal choline in healthy controls and NAFLD patients 50
Figure 11: Fecal trimethylamine in healthy controls and NAFLD patients 50
Figure 12: Serum choline in healthy controls and NAFLD patients 51
Figure 13: Serum trimethylamine N-oxide in healthy controls and NAFLD patients 51
Figure 14: Serum ethanol in healthy controls and NAFLD patients 52
Figure 15: C. leptum relative abundance in stool samples from three study groups 54
Figure 16: E. coli count in stool samples from three study groups 55
Figure 17: Relationship between fecal formic acid and total inflammation in NAFLD 58

xii
patients
Figure 18: Relationship between fecal choline and body mass index in all subjects 58
Figure 19: Relationship between fecal trimethylamine and body mass index in all
subjects
59
Figure 20: Relationship between serum acetic acid and hepatocyte ballooning intensity
in NAFLD patients
59
Figure 21: Relationship between serum choline and liver steatosis in NAFLD patients 60
Figure 22: Relationship between Firmicutes count and liver steatosis in NAFLD
patients
61
Figure 23: Relationship between C. leptum count and fecal butyric acid in all subjects 61
Figure 24: Relationship between relative abundance of C. leptum and reported dietary
fibre intake in all subjects
65
Figure 25: Relationship between plasma endotoxin and reported carbohydrate intake in
all subjects
65
xiii
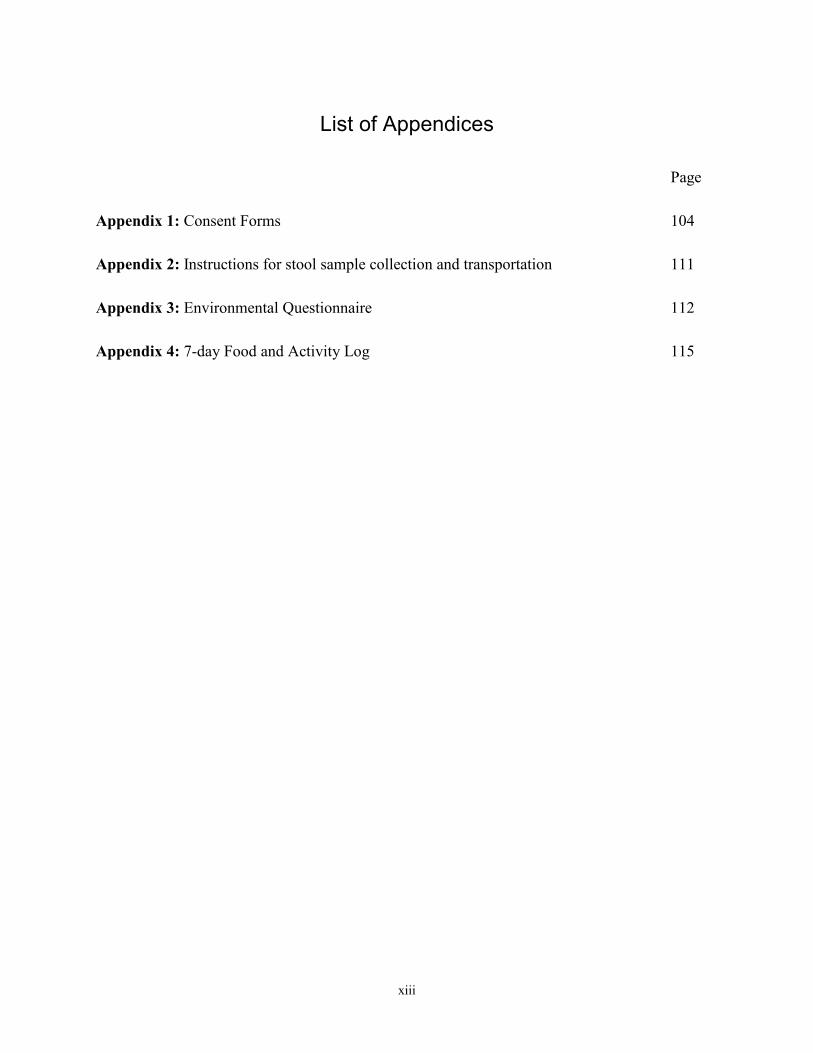
List of Appendices
Page
Appendix 1: Consent Forms 104
Appendix 2: Instructions for stool sample collection and transportation 111
Appendix 3: Environmental Questionnaire 112
Appendix 4: 7-day Food and Activity Log 115
xiv
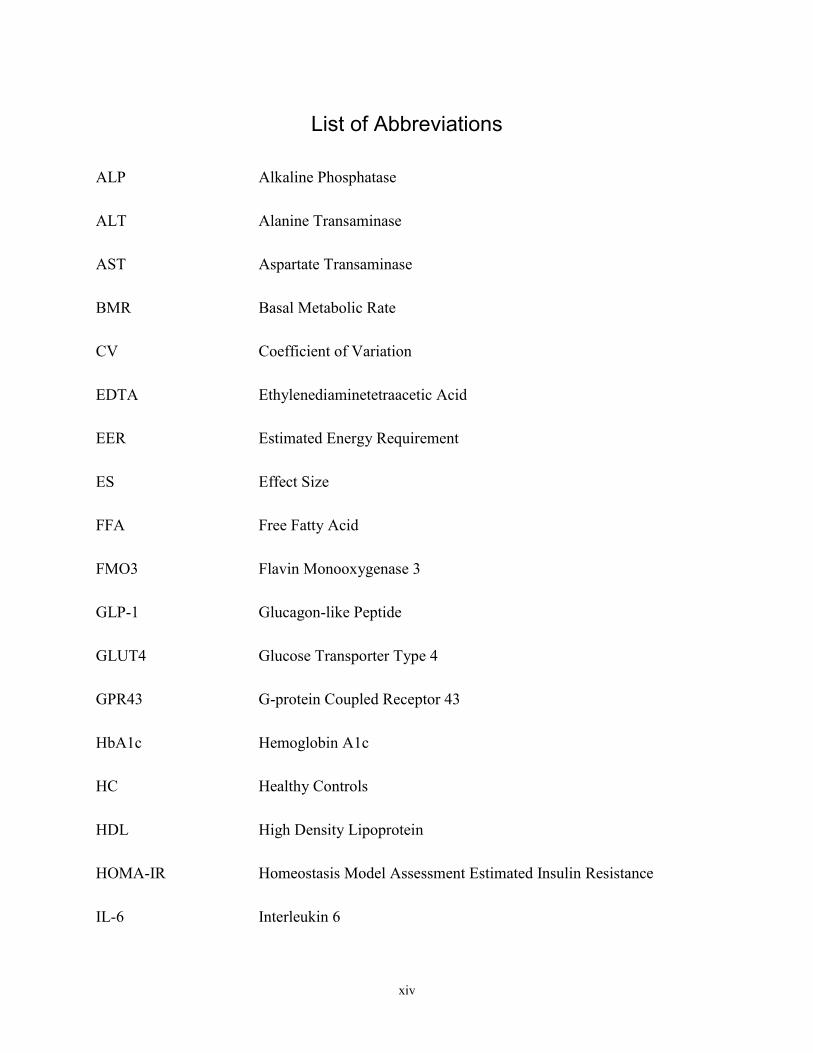
List of Abbreviations
ALP Alkaline Phosphatase
ALT Alanine Transaminase
AST Aspartate Transaminase
BMR Basal Metabolic Rate
CV Coefficient of Variation
EDTA Ethylenediaminetetraacetic Acid
EER Estimated Energy Requirement
ES Effect Size
FFA Free Fatty Acid
FMO3 Flavin Monooxygenase 3
GLP-1 Glucagon-like Peptide
GLUT4 Glucose Transporter Type 4
GPR43 G-protein Coupled Receptor 43
HbA1c Hemoglobin A1c
HC Healthy Controls
HDL High Density Lipoprotein
HOMA-IR Homeostasis Model Assessment Estimated Insulin Resistance
IL-6 Interleukin 6
xv
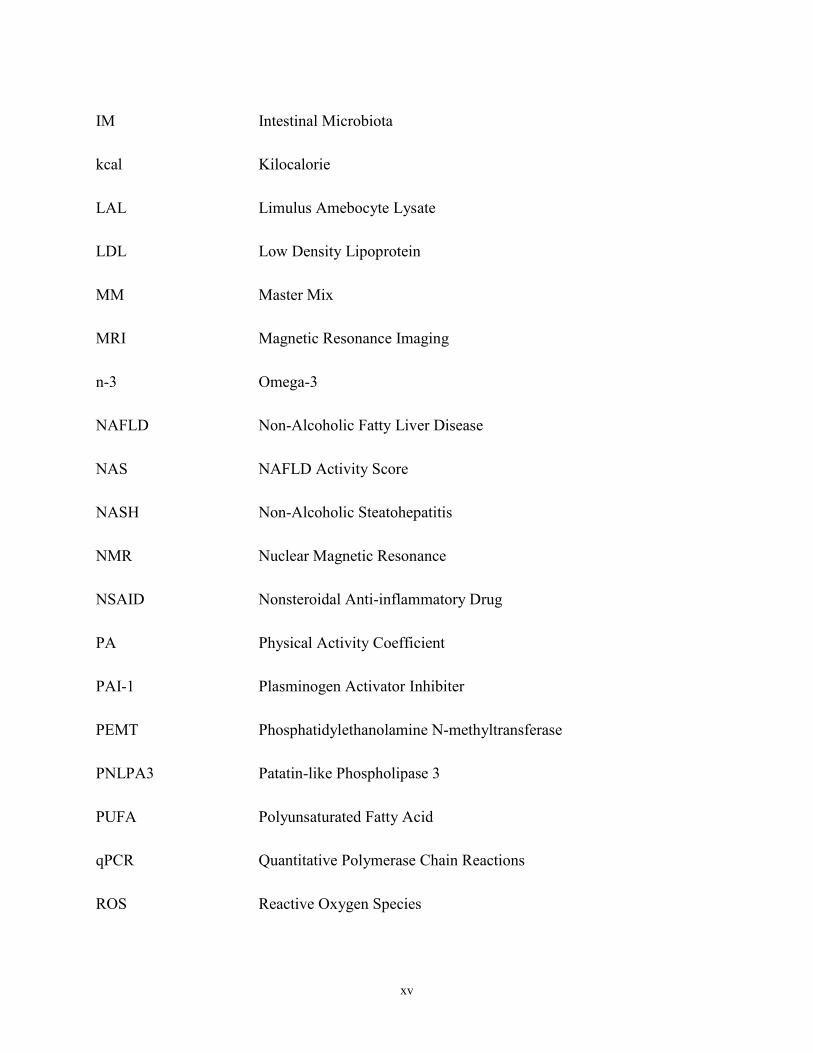
IM Intestinal Microbiota
kcal Kilocalorie
LAL Limulus Amebocyte Lysate
LDL Low Density Lipoprotein
MM Master Mix
MRI Magnetic Resonance Imaging
n-3 Omega-3
NAFLD Non-Alcoholic Fatty Liver Disease
NAS NAFLD Activity Score
NASH Non-Alcoholic Steatohepatitis
NMR Nuclear Magnetic Resonance
NSAID Nonsteroidal Anti-inflammatory Drug
PA Physical Activity Coefficient
PAI-1 Plasminogen Activator Inhibiter
PEMT Phosphatidylethanolamine N-methyltransferase
PNLPA3 Patatin-like Phospholipase 3
PUFA Polyunsaturated Fatty Acid
qPCR Quantitative Polymerase Chain Reactions
ROS Reactive Oxygen Species
xvi
SCFA Short-Chain Fatty Acid
SD Standard Deviation
SS Simple Steatosis
TG Triglycerides
TLR-4 Toll-like Receptor 4
TMAO Trimethylamine N-oxide
TNF-α Tumor Necrosis Factor Alpha
VLDL Very Low Density Lipoprotein
1
1 Introduction
Non-alcoholic fatty liver disease (NAFLD) is the most common chronic liver disease in the
Western World [1]. NAFLD describes a spectrum of disease severity from simple steatosis (SS)
to non-alcoholic steatohepatitis (NASH) in the absence of significant alcohol consumption
(<20g/day) [2]. SS is defined by the accumulation of fat (triglycerides) within the hepatocytes
without hepatocyte injury and is considered a benign condition [2]. NASH involves steatosis and
inflammation as well as hepatocyte injury which presents as ballooning and may also include
spotty necrosis and/or fibrosis [2]. The gold standard for the diagnosis of NASH is liver biopsy
[2] where histology is assessed using the Brunt scale to classify SS versus NASH and to grade
disease severity using the NAFLD Activity Score (NAS) [3].
The World Gastroenterology Organisation estimates the prevalence of NALFD in the Western
World to be approximately 27-34% in the general population, upwards of 75% in those with
diabetes or obesity, and 75-92% in the morbidly obese [1]. The prevalence of NASH is
significantly lower, estimated at 2-3% in the general population [4], but upwards of 18.5-30% in
obese individuals [4, 5], and 55% in diabetics [6]. Approximately 3-15% of individuals with
NASH will advance to cirrhosis, while 38-45% of those with cirrhosis will advance to liver
failure within 7-10 years [1]. NASH cirrhosis is the third most common indication for liver
transplant in the United States and has increased as the primary indication for liver transplant
from 1.2% to 9.7% of all transplants performed from 2001 to 2009 [7].
Currently there are limited treatment options for NAFLD. The American College of
Gastroenterology guidelines (2012) recommends weight loss via diet and exercise or bariatric
surgery. Vitamin E supplementation is also recommended in non-diabetics [2]. However, due to
difficulties achieving adequate weight loss, eligibility criteria limiting the number of candidates
for, and the risk and invasiveness of bariatric procedures [8], few viable options exist for treating
NAFLD and preventing its progression.
A significant barrier in developing these treatments is that the pathogenesis of NAFLD is
complex and it is still not completely understood why some remain with only SS while others
progress to the more severe form, NASH, with risks of developing cirrhosis and liver failure [9].
Lately, there has been emerging literature on the role of the intestinal microbiota in the

2
pathogenesis of NAFLD [10-15]. The aim of this research project was to characterize the
intestinal microbiota of patients with NASH or SS versus healthy controls (HC) and determine if
there were any differences in bacterial products or metabolites that could play a role in the
pathogenesis of this disease.
3
2 Review of the Literature
2.1 An Introduction to Non-Alcoholic Fatty Liver Disease Pathogenesis
2.1.1 Insulin Resistance
Individuals with NAFLD are universally insulin resistant [16] and this is considered to be a
driving factor behind much of NAFLD pathogenesis. Traditionally, the first stage of NAFLD
pathogenesis is the accumulation of lipids within the hepatocytes, called steatosis. This occurs
when the supply of free fatty acids (FFA) to the liver exceeds the needs for mitochondrial
oxidation, phospholipid synthesis, and cholesterol ester synthesis [17-19]. Insulin resistance is
associated with lipolysis from adipose tissue leading to increased circulating FFA and uptake by
the liver [20]. FFA may also be supplied to the liver through dietary intake and absorption as
chylomicrons. FFA uptake by the liver is unregulated [21] and therefore thought to be
responsible for about two thirds of the lipid accumulation in the liver [22]. Elevated insulin
levels resulting from insulin resistance also inhibit mitochondrial β-oxidation [23] and increase
de novo lipogenesis in the liver via glycolysis [24]. High insulin levels can also inhibit the
hepatic release of fatty acids as very low density lipoproteins (VLDL) by decreasing the
production of apolipoprotein B100 [24].
The majority of lipids in steatosis are stored as triglycerides [25] which are benign [26] and have
recently even been considered as protective against the oxidative stress and cellular damage that
is seen in the progression from SS to NASH [27, 28]. It is therefore the FFA accumulation which
causes the deleterious effects of steatohepatitis.
2.1.2 Lipid Peroxidation and Lipotoxicity
An increased presence of FFA in the liver leads to lipid peroxidation causing the release of
inflammatory cytokines such as tumor-necrosis factor alpha (TNF-α) and interleukin six (IL-6)
and reactive oxygen species (ROS) [29-31]. The resulting inflammation and oxidative stress
from the release of these molecules leads to disease progression from the benign SS to the
cellular damage and inflammation seen in NASH [32, 33]. Oxidative stress has also been shown
to impair the proliferation of hepatocyte progenitors leading to impaired tissue recovery, fibrosis,
and cirrhosis [34, 35].
4
The presence of FFA in hepatocytes may also have a direct toxic effect [36]. FFA is thought to
be responsible for the significantly higher presence of apoptosis in NASH patients compared to
healthy controls [37-39]. The type of fatty acid also seems to have an effect with saturated fatty
acids causing more apoptosis [40] than monounsaturated [36] or polyunsaturated fatty acids [41].
2.1.3 Mitochondrial and Endoplasmic Reticulum Stress
Another important component of NAFLD pathogenesis is the stress that the influx of fatty acids
causes to the cellular organelles, particularly the mitochondria and endoplasmic reticulum.
Mitochondrial stress and resulting dysfunction further promotes cellular damage through TNF-α
and over-production of ROS [30, 42]. An accumulation of FFA can also lead to endoplasmic
reticulum stress [43] which triggers the unfolded protein response. The unfolded protein response
is an adaptive response initiated by the endoplasmic reticulum when its main function, protein
folding, is disrupted by a variety of causes including the accumulation of FFA, a lack of energy
from glucose, or an insufficient presence of calcium [44]. This response may start an
inflammatory cascade which has been associated with apoptosis and exacerbation of metabolic
diseases including obesity and insulin resistance, contributing to NAFLD pathogenesis [45].
2.1.4 Genetic Factors
Research has shown that genetic factors may play some role in NAFLD development and
progression. The most consistent finding has been with polymorphisms in patatin-like
phospholipase three (PNLPA3) [46-48]. Polymorphisms in PNLPA3 have been associated with
an increased percentage of steatosis in NAFLD [49]. The homozygous 148M polymorphism for
PNLPA3 has also been associated with NAFLD severity, including inflammation and fibrosis
[50-52]. The Genetics of Obesity-Related Liver Disease Consortium found four additional gene
polymorphisms that were associated with NAFLD. These were found in or near the genes:
lysophospholipase like 1, protein phosphatase 1 regulatory subunit 3b, neurocan, and
glucokinase regulatory protein [53]. Peterson et al. additionally found that the polymorphisms C-
482T and T-455C in the gene for apolipoprotein 3C were associated with NAFLD and insulin
resistance [54]. The role of genetics in NAFLD pathogenesis is still emerging.
5
2.1.5 Diet and Physical Activity
As obesity is a main risk factor for the development of SS and NASH it follows that energy
balance, the difference between energy intake through diet and energy expenditure through the
basal metabolic rate, thermic effect of food, and physical activity, could play an important role in
NAFLD pathogenesis. Observational studies have consistently found that individuals with
NAFLD have significantly lower fitness level and/or participation rates in physical activity [55-
60]. The association between NAFLD and excessive energy intake, however, has only been
shown in a few studies [61-63]. This relatively weak association in the literature may be due to
underreporting by study participants, which is consistently encountered in studies using food
frequency questionnaires and self-reported diet records, especially among obese individuals [64,
65]. This led to a more significant focus on the composition of the food consumed rather than the
caloric content. A study from our research group, for instance, found that energy intake and
macronutrient composition did not differ between healthy controls and biopsy confirmed SS and
NASH patients, but that NASH patients were significantly more likely to have inadequate
consumptions of micronutrients such as vitamin B6, folate, and zinc [60]. It is difficult at this
point to think of a role for these micronutrients in the pathogenesis of NASH as other reports on
low micronutrient intakes were primarily focused on antioxidants [66-68]. There is also
additional literature on macronutrients, particularly fat and carbohydrates. Further details
regarding dietary composition are discussed below.
2.1.5.1 Carbohydrates
Two observational studies have found an association between the percent of energy consumed
from carbohydrates and the risk of advanced NAFLD [69, 70]. Solga et al. investigated dietary
intake using a 24 hour recall in obese patients undergoing bariatric surgery. Liver biopsies taken
at the time of surgery were evaluated for markers of inflammation and fibrosis. Higher percent of
energy from carbohydrates was associated with higher odds of having inflammation on liver
histology [69]. A similar study using a non-validated dietary questionnaire found that higher
percent of energy from carbohydrates was associated with a greater risk of fibrosis [70].
Carbohydrate quality also appears to be important. The consumption of sugar sweetened
beverages [71], soft drinks [57, 72], and fructose [73, 74] have been associated with a higher risk
of NAFLD. Fructose has been of particular interest in NAFLD pathogenesis, upregulating de
6
novo lipogenesis, promoting lipogenesis, inhibiting β-oxidation, and contributing to the
inflammatory cascade [75]. Fructose may also promote hepatic insulin resistance, further
contributing to NAFLD development and progression [76, 77].
Diets low in beneficial carbohydrates such as fibre have also been observed in NAFLD patients
[62, 78]. There are two main mechanisms through which fibre intake can influence NAFLD
pathogenesis. Some fibres, such as cellulose and pectins can be fermented by the intestinal
microbiota (IM) to produce short-chain fatty acids (SCFA) [79] which can exert many potentially
beneficial roles in preventing NAFLD. There is more discussion on this in section 2.2.3.1 as this
is relevant to this project. Fibre can also aid in increasing satiety [80-82] and improving glycemic
control [83], including insulin sensitivity in NAFLD patients [84].
2.1.5.2 Fat
Several observational studies have found a higher dietary fat intake in individuals with NAFLD
[62, 85-87] and NASH [88, 89] compared to healthy controls. Of these, saturated fats may
increase hepatic inflammation, fibrosis and apoptosis [90, 91]. Several studies have found that
there was a greater consumption of saturated fats in NAFLD patients [62, 73, 78, 85]. On the
other hand, mono- and polyunsaturated fatty acids (PUFA), particularly omega-3 fatty acids, may
be of benefit because of their anti-inflammatory effect [92]. Inadequate intake of these fatty acids
in NAFLD patients was reported in several studies [62, 73, 78, 93], particularly for omega-3 (n-
3) fatty acids [73, 89, 94].
As discussed in section 2.1.2, dietary fat is a main source of FFA in the liver and those with
several double-bonds, like PUFA, are susceptible to lipid peroxidation, triggering oxidative
stress and inflammation [29-31]. PUFA are fatty acids with multiple double bonds which can be
classified at n-3, n-6, or n-9 depending on the placement of the first double bond. PUFA are
particularly susceptible to lipid peroxidation due to their many double bonds. However,
elongation of n-3 causes the production of anti-inflammatory eicosanoids but elongation of n-6
results in the production of pro-inflammatory prostaglandins and leukotrienes [92]. Therefore,
the ratio of n-3:n-6 fatty acids can be important when considering disease progression through
hepatic inflammation. Several studies found differences in fatty composition with reduction in n-
3 or n-3:n-6 ratio in NASH [95-98]. Of additional note are findings that low levels of hepatic
7
PUFA, especially n-3 PUFA, are associated with a predisposition to lipogenesis over β-oxidation
and export as VLDL [95, 99, 100].
2.1.5.3 Vitamins
Due to the driving force of oxidative stress in NAFLD pathogenesis it follows that diets deficient
in antioxidant nutrients, including vitamin C and E, could promote NAFLD development and
progression. Cross-sectional studies have found that dietary vitamin C [62, 78] and vitamin E
[78] intake are lower in NAFLD patients compared to healthy controls. Vos et al. found that
patients with lower vitamin E consumption had a higher grade of steatosis [66]. Plasma vitamin
C and E levels have also been associated with disease status. Cankutaran et al. found that
NAFLD patients with vitamin E deficiency had worse steatosis [67] while another study found
that plasma vitamin E and C were lower in patients with NASH than with SS [68]. Given these
findings and positive results from clinical trials [101] the current treatment guidelines suggest
treating all non-diabetic, biopsy-proven NASH patients with 800 IU of vitamin E daily [2].
Choline is another nutrient found to play a role in NAFLD pathogenesis. It is discussed in the
context of intestinal microbiota in section 2.2.3.3.
Therefore, there are several factors playing a role in the pathogenesis of NAFLD and lack of a
healthy diet and sedentary lifestyle are important contributors. However, there is emerging
literature suggesting that the intestinal microbiota may also play a role, possibly influenced by
environmental factors such as diet and lifestyle. A role for intestinal microbiota is supported by a
recent study from our group [13], showing a lower percentage of Bacteroidetes in NASH patients
compared to healthy controls, independent of diet and body mass index. Therefore the present
project was developed to further assess this relationship and determine if certain bacterial
products or metabolites were associated with NAFLD.
2.2 Role of intestinal microbiota in non-alcoholic fatty liver disease
The human intestinal microbiota (IM) is composed of all microorganisms present in the gut. The
IM is estimated to contain more than 1013 microorganisms [102] with between 15 000 and 35
000 species of bacteria [103]. The dominant phyla, Bacteroidetes and Firmicutes, make up
approximately 90% of the bacteria in the human digestive system [104-107]. Until recently, very
8
little was known about the human IM composition because most IM bacteria are obligate
anaerobes making them difficult to culture. Recent technological advances now allow
researchers to identify IM species and groups and their relative abundance through the
sequencing of the 16s rRNA gene in bacterial DNA [108]. Since the advent of this technology,
researchers have discovered the many roles that the IM plays in human health and disease,
including its potential role in NAFLD pathogenesis.
2.2.1 Increase energy uptake
One of the primary mechanisms through which the IM is thought to influence NAFLD
development is by increasing energy absorption from the intestinal tract. In 2004, Bäckhed et al.
colonized germ-free mice with the IM of conventionally raised mice [109]. Within 14 days, the
colonized mice had a 60% increase in body fat and development of insulin resistance despite
lower oral intake [109]. The proposed mechanism for this adiposity was an increased absorption
of monosaccharides resulting from alterations in the IM which then lead to an increase in de
novo lipogenesis [109]. The increased absorption was proposed to be due to an increase in the
vascularization of the small intestinal villus epithelium [110]. An alternative mechanism was
suggested by Turnbaugh et al. when metagenomic analyses from the microbiota of ob/ob and
lean mice found that the ob/ob microbiome was enriched with genes coding for proteins involved
in the breakdown of “indigestible” polysaccharides and import of fermentation products. The
feces of these ob/ob mice also showed lower caloric content when measured by bomb
calorimetry in comparison to lean mice [111]. A subsequent study from Bäckhed et al. found that
germ-free mice were protected from diet induced obesity, gaining less weight and maintaining
lower blood insulin, glucose, and FFA levels than conventionally raised mice when consuming a
high-fat, high-sugar Western diet [112].
This relationship has also been studied by treating obese mice with antibiotics when exposed to
an obesogenic (high fat, high sugar) diet. Changes in IM related to antibiotic treatment resulted
in decreased body weight, fat mass, and glucose intolerance compared to controls [113] and a
significant decrease in hepatic lipids after steatosis development on a fructose rich diet [114]. Le
Roy et al. ran an interesting study that determined that NAFLD risk may be related to the IM,
independent of obesity. Mice were fed a high fat diet leading to weight gain. Even though all
mice gained weight, some mice also developed hyperglycemia and increased circulating
9
inflammatory cytokines [115]. These mice were called “responders”. Other mice remained
normoglycemic with low cytokine levels and were called “nonresponders”. A donor mouse was
selected from each group and IM was transplanted into recipient mice who were also placed on a
high fat diet. All recipient mice became obese. Mice who received IM from a “responder”
developed hepatic steatosis and insulin resistance with higher HOMA-IR, blood glucose, and
insulin, and increased expression of genes involved in de novo lipogenesis than mice who
received IM from the “non-responder”. Responder and non-responder recipients had distinct IM,
suggesting that a certain IM composition lead to increased risk of developing NAFLD in
response to high dietary fat intake [115]. Therefore, animal studies support the role of IM in
obesity. Since obesity is associated with NAFLD, it is possible that IM will also contribute to
NAFLD pathogenesis.
Human studies on obesity have also reported differences in the bacterial communities of lean
versus obese adults [116-121] which are similar to animal studies. The first landmark study that
suggested an association between obesity and the IM was published by Ley et al. in 2006 [116].
This simple study measured the IM of 12 obese patients for one year as they undertook a calorie-
restricted diet that was either low-fat or low-carbohydrate. Before starting the diet obese patients
had fewer Bacteroidetes and proportionally more Firmicutes. Through the course of their weight
loss, Bacteroidetes increased and Firmicutes decreased with a significant positive correlation
between proportion of Bacteroidetes and percentage of body weight lost. This was the start of a
long debate on whether obesity in humans is associated with a lower abundance of Bacteroidetes
and a proportionally increased abundance of Firmicutes. Most studies agree that there is a
relationship [116, 117, 120, 121].
In studies that have also investigated bacterial function via metagenomics this difference in
bacterial community was accompanied by an increase in genes associated with macronutrient
metabolism [118, 119, 121]. The first study of this kind looked at the IM and microbiome
(bacterial genes) of monozygotic and dizygotic twins and their mothers [119]. Obesity was
associated with a lower overall bacterial diversity. At the metagenomics level they found that
383 genes were significantly different between obese and lean subjects and that 75% of the
obesity enriched genes were from Actinobacteria (versus 0% of the lean enriched genes) and
42% of the lean enriched genes were from Bacteroidetes (versus 0% of the obese enriched
genes). Functionally, these genes were associated with carbohydrate, lipid, and amino acid
10
metabolism [119]. This, again, suggests a role of bacterial energy harvest in obesity. Jumpertz et
al. found that a 20% increase in Firmicutes was associated with a 150 kilocalorie (kcal) increase
in energy harvest [121], a value that, if it occurred daily, would amount to about 1.3lb weight
gain in one month or a nearly 16lb weight gain over the course of a year. It is therefore clear that
alterations in the IM can be associated with increased energy absorption, leading to increased
adiposity, which could in turn result in a greater risk of NAFLD.
2.2.2 Increase Chronic Inflammation
IM can also contribute to chronic systemic inflammation through several mechanisms.
Considering that chronic systemic inflammation plays a role in insulin resistance and obesity
[122], this certainly has relevance to NAFLD.
2.2.2.1 Toll-Like Receptor 4 and Inflammatory Cytokines
There are several mechanisms leading to the increased production of inflammatory cytokines in
NAFLD. One of them is the accumulation of hepatic triglycerides and particularly FFA
promoting inflammation through the activation of toll-like receptor 4 (TLR-4). This mechanism
is supported by animal studies. Cai et al. used a transgenic mouse model to show that hepatic
triglyceride accumulation leads to the activation of NF-kB by TLR-4 which causes the release of
inflammatory cytokines such as IL-6 and TNF-α [123]. TLR-4 activation has also been
associated with insulin resistance [124], the activation of Kupffer cells (involved in
fibrogenesis), and worsening liver histology [125]. The IM can also play a role in this as another
mechanism activating TLR-4 is through exposure to lipopolysaccharide or endotoxin, which is a
constituent of the outer membrane of Gram negative bacteria, which can cross the intestinal
epithelium [126]. Several studies support a role for endotoxin, which is discussed in the next
section.
2.2.2.2 Endotoxin
Increased endotoxin levels have been associated with NAFLD pathogenesis in both animal [124,
127, 128] and human studies [129-132]. Cani et al. found that after four weeks on a high-fat diet
mice developed a chronic increase in plasma endotoxin with an increased proportion of
endotoxin producing IM [127]. To further examine the effect of endotoxemia on mice the
investigators provided a constant infusion of endotoxin which resulted in increased fasting

11
glucose, insulin, and weight, including increased liver size and adipose tissue [127]. Brun et al.
found that obese, leptin deficient mice had higher levels of endotoxin leading to inflammatory
and fibrogenic hepatic responses [128]. Similar findings were published by Song et al. from
mouse and tissue culture experiments [124] and Spruss et al. in studies on mice fed a fructose
rich diet [133].
The first study that examined the role of endotoxin in NAFLD pathogenesis in humans was by
Thuy et al. [129]. This cross-sectional study found that NAFLD patients had elevated hepatic
expression of plasminogen activator inhibitor (PAI-1), which is used as a marker for hepatic
damage, compared to healthy controls. PAI-1 was associated with an increased endotoxin
concentration and hepatic expression of TLR-4. Harte et al. found that NAFLD patients had a
significantly higher plasma endotoxin level than healthy controls and that endotoxin
concentration was positively correlated with insulin resistance [130]. Another study measured
IgG levels against endotoxin as a marker of chronic low level endotoxin exposure over time in
severely obese NASH patients and severely obese healthy controls [131]. They found that
despite both groups being obese, there was a significantly higher IgG level in NASH patients,
which increased with NASH grade (severity) [131]. Volynets et al. similarly found that NAFLD
patients had higher endotoxin and PAI-1, and additionally higher blood ethanol levels, and
increased intestinal permeability than healthy controls [132].
2.2.2.3 Intestinal Permeability
Endotoxemia is present when there is an increase in intestinal permeability and this may also be
influenced by IM. The finding of increased intestinal permeability is further supported by Miele
et al. who found that NAFLD patients had higher gut permeability and prevalence of small
intestinal bacterial overgrowth, and lower expression of tight junction protein ZO-1 than healthy
controls, however, the barrier deficiency was not as severe as in untreated celiac disease patients
[134]. A recent study by Jiang et al. found significant differences in the IM community between
NAFLD patients and healthy controls. They also saw increased tight junction gaps, decreased
numbers of vital immune factors (CD4+ and CD8+ T lymphocytes), and increased expression of
inflammatory markers (TNF-α, IL-6) in the duodenal mucosa of NAFLD patients compared to
healthy controls [15]. These studies suggest that NAFLD patients have increased blood
endotoxin levels from an increase in endotoxin producing gram negative bacteria and/or
12
increased intestinal permeability which may lead to hepatic inflammation through the activation
of TLR-4. However, these studies do not differentiate between patients with the generally benign
SS and the more detrimental NASH. In addition, other bacterial products or metabolites may also
play a role.
2.2.3 The Role of Products of Bacterial Metabolism in NAFLD
2.2.3.1 Short-Chain Fatty Acids
One potential cause of the increased intestinal permeability observed in NAFLD patients is a
decrease in the colonic production of butyrate. About 10-30% of consumed energy reaches the
colon without being absorbed [135, 136]. These substrates, primarily starches and components of
the plant cell-wall including cellulose, pectins, xylans, arabinogalactans, gums and mucilage, are
fermented by the IM to form SCFA [79] and gases including CO2, CH4, and H2 [137]. The main
SCFA produced in the human colon are acetate, propionate, and butyrate in a molar ratio of
about 60:20:20 which remains in the same proportions in the feces [138-140]. SCFA are a source
of caloric intake and account for up to 10% of required daily energy intake in humans [135].
SCFA can also have other significant functions in NAFLD pathogenesis pathways. Lin et al.
conducted a study on mice to look at the effects of SCFA on obesity and related measures [141].
They found that the administration of any of the three main SCFA protected against the
development of obesity and insulin resistance on a high fat diet, but that only butyrate and
propionate regulated food intake through the stimulation of gut hormones [141]. SCFA have also
been shown to upregulate fatty acid oxidation [142]. Other important functions of butyrate,
propionate, and acetate are discussed below.
2.2.3.1.1 Butyrate
Butyrate’s main functional role is as an energy source for colonic mucosal cells, however it also
strengthens this important immunological barrier through involvement in cell proliferation and
differentiation [137, 143, 144]. Butyrate decreases intestinal permeability through effects on tight
junction proteins [145-147] and may have anti-carcinogenic effects in the colon [148, 149].
Butyrate has also been demonstrated to have a significant anti-inflammatory role through the
inhibition of NF-κB [150, 151] and may exhibit beneficial antioxidant functions, reducing the
production of reactive oxygen species [152]. All of these functions could prove useful in
preventing the progression of SS to NASH.

13
Butyrate producers are strict anaerobes and more than 90% belong to the Eubacterium or
Roseburia genus from clostridium cluster XIVa or are Faecalibacterium prausnitzii from
clostridium cluster IV [153]. A study by Wong et al. found that patients with NASH had a lower
abundance of Faecalibacterium and therefore perhaps produced less butyrate, however,
unfortunately SCFA were not measured in this study [14]. A probiotic supplementation study in
rats on a NAFLD inducing choline deficient diet found that providing a probiotic that includes
butyrate producing bacteria (Clostridium butyricum, MIYAIRI 588) led to lower blood
endotoxin, insulin resistance, hepatic markers of inflammation, and hepatic lipid deposition
[154]. The treated rats also had increased expression of tight junction proteins and decreased
hepatic fibrosis and hepatocarcinogenesis [154]. A similar study in a mice model found that
supplementation with the VSL#3 probiotic led to alterations in the IM, reduction in insulin
resistance, weight, inflammatory markers (TNF-α, IL-6), FFA, and steatosis [155]. These
beneficial effects were associated with increased levels of butyrate in the feces and plasma [155].
These findings suggest that butyrate and butyrate producing bacteria may have a beneficial effect
in NAFLD by reducing intestinal permeability and translocation of bacterial products, thereby
reducing chronic inflammation and insulin resistance. However, no human studies have assessed
both butyrate and IM in stools.
2.2.3.1.2 Propionate
Propionate is primarily produced by colonic fermentation by Bacteroides, Prevotella, and
Clostridium [156]. Thirty to fifty percent of propionate is taken up by the liver and the rest is
taken up by the peripheral tissues [157, 158]. Propionate inhibits lipolysis in adipocytes,
reducing plasma FFA, through the activation of free fatty acid receptor 2 [159, 160] and inhibits
the production of new fatty acids in the liver [161, 162]. Propionate also has several anti-
inflammatory properties, reducing the production of pro-inflammatory eicosanoids [163] and
resistin, a pro-inflammatory cytokine [164]. Propionate has also been shown to inhibit the release
of TNF-α by neutrophils in response to bacterial endotoxin, a proposed significant contributor to
the inflammation seen in NASH [165]. As briefly mentioned above, propionate may also play a
role in increasing satiety and has been shown to promote the release of leptin [159, 164, 166] and
improve glucose uptake by peripheral tissues though increasing glucose transporter type four
(GLUT4) [167]. Therefore, propionate may have beneficial effects in NAFLD.

14
2.2.3.1.3 Acetate
Acetate is produced by many bacteria, particularly Bacteroidetes and Bifidobacterium [156, 168].
It is primarily used as an energy source in the liver and for the production of cholesterol [158].
Acetate may also have an anti-inflammatory function through interaction with G-protein coupled
receptor 43 (GPR43) [169]. Lastly, a study by Fukuda et al. suggested that the main source of
Bifidobacterium’s prevention against intestinal infection by pathogens (E. coli) was its
production of acetate [170]. The various functions of butyrate, propionate, and acetate are closely
linked with various steps in NAFLD pathogenesis and warrant further investigation in NAFLD
populations. Human studies in this area are lacking.
2.2.3.2 Ethanol
One of the bacterial products of particular interest to NAFLD pathogenesis is ethanol. Ethanol is
formed during the fermentation of carbohydrates by the IM and absorbed into the portal vein for
delivery to the liver where it is metabolized [171, 172]. Ethanol is a known hepatotoxic agent
which has also been associated with increasing intestinal permeability [173]. Two studies have
looked at blood ethanol levels in NAFLD patients. Volynets et al. found that NAFLD patients
had a significantly higher blood ethanol concentration than healthy controls. Unfortunately this
could not be tied back to the microbiota as IM characterization was not performed [132]. Zhu et
al., however, measured both blood ethanol and IM composition in 22 children with NASH
compared to 25 obese children and 16 healthy controls [11]. They found that blood ethanol
concentrations were higher in NASH compared to healthy controls and obese subjects who did
not differ significantly. When examining IM composition, NASH patients were found to have a
higher abundance of Proteobacteria than the other groups, particularly Enterobacteriaceae which
include Escherichia which are ethanol producers [11]. The role of bacterial ethanol production in
NAFLD development warrants further investigation.
2.2.3.3 Choline metabolism
Several studies have used choline deficient diets to induce NAFLD in test subjects [10, 125,
154]. Choline deficiency is thought to induce NAFLD through the inhibition of VLDL
formation and consequent accumulation of triglycerides within the liver [174], through
mitochondrial dysfunction causing increased levels of reactive oxygen species [175-177] and
through endoplasmic reticulum stress [178]. Choline is converted to trimethylamines by the IM
15
[179]. This could lead to reduced choline absorption from the colon despite adequate dietary
intake. The resulting choline deficiency may promote NAFLD development via the mechanisms
described above.
In a well-controlled inpatient study by Spencer et al. 15 women were placed on a choline
deficient diet and were monitored for steatosis via magnetic resonance imaging (MRI) [10]. IM
composition at baseline was associated with the development of steatosis during choline
deficient diet. Specifically, Gammaproteobacteria abundance at baseline was negatively
correlated with steatosis and Erysipelotrichi abundance at baseline was positively associated with
steatosis development on MRI. This study also found that phosphatidylethanolamine N-
methyltransferase (PEMT) genotype was an effective predictor of steatosis accumulation. The
mechanism behind the relationship between choline, PEMT, and NAFLD pathogenesis is quite
clear. The active form of choline, phosphatidylcholine, which is needed in the liver for VLDL
formation, is lower in NAFLD patients [180]. The formation of this active form is catalyzed by
PEMT; a polymorphism in PEMT has also been associated with NAFLD [181]. The role of the
IM metabolism of choline in this process, however, remains unclear.
2.2.4 NAFLD and the Intestinal Microbiota: Clinical Studies
There have been six human studies that have identified significant differences between the IM in
NAFLD patients and healthy controls. Table 1 summarizes the design and results of these
studies. The first study, discussed above in section 2.2.3.3, found that a particular IM
composition put participants at a greater risk of developing steatosis while on a choline deficient
diet [10]. This study did not, however, look at liver histology and therefore no conclusion can be
made regarding differences between NASH and SS. Additionally, this study was conducted
using healthy women where steatosis was artificially induced therefore results cannot necessarily
be extrapolated to the NAFLD population. A cross-sectional study from our research group
investigated the intestinal microbiota of biopsy confirmed SS and NASH patients compared to
healthy controls [13]. We found that patients with NASH had significantly lower fecal
Bacteroidetes compared to both SS and healthy controls even when controlling for BMI and
dietary intake [13]. This study, however, was conducted using quantitative polymerase chain
reactions (qPCR) rather than pyrosequencing, therefore only selected bacterial groups were
investigated and measurements of bacterial products were not conducted [13]. Raman et al.
16
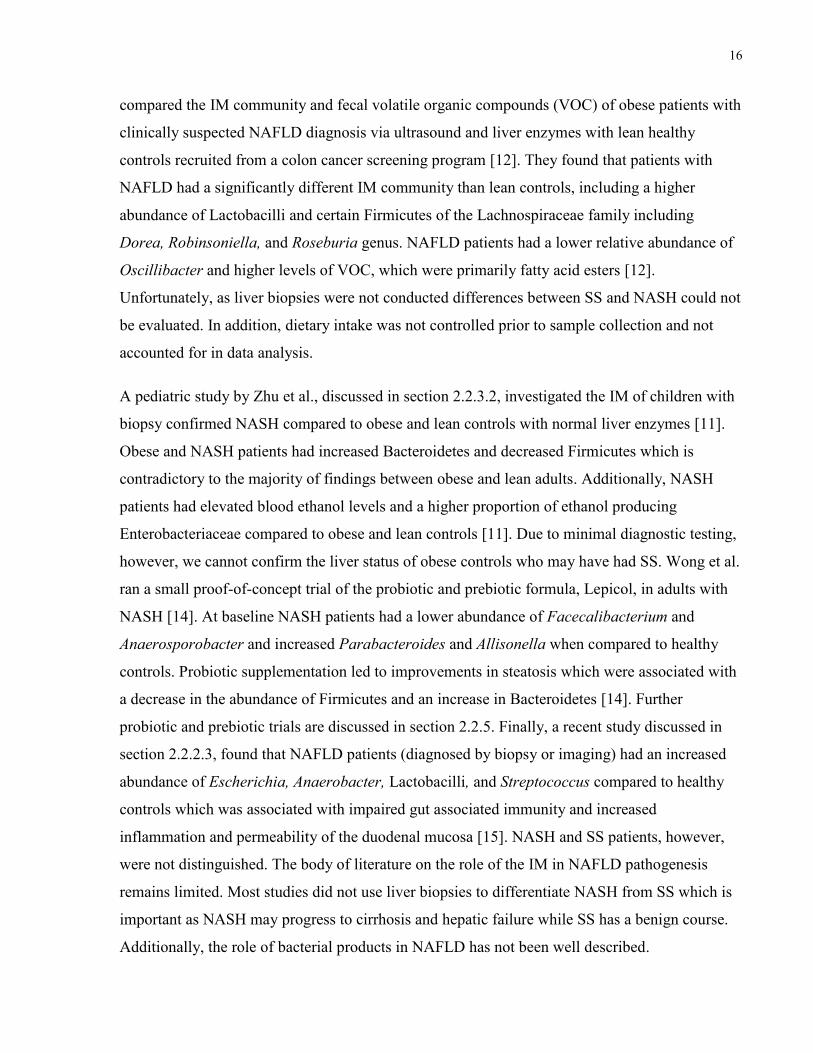
compared the IM community and fecal volatile organic compounds (VOC) of obese patients with
clinically suspected NAFLD diagnosis via ultrasound and liver enzymes with lean healthy
controls recruited from a colon cancer screening program [12]. They found that patients with
NAFLD had a significantly different IM community than lean controls, including a higher
abundance of Lactobacilli and certain Firmicutes of the Lachnospiraceae family including
Dorea, Robinsoniella, and Roseburia genus. NAFLD patients had a lower relative abundance of
Oscillibacter and higher levels of VOC, which were primarily fatty acid esters [12].
Unfortunately, as liver biopsies were not conducted differences between SS and NASH could not
be evaluated. In addition, dietary intake was not controlled prior to sample collection and not
accounted for in data analysis.
A pediatric study by Zhu et al., discussed in section 2.2.3.2, investigated the IM of children with
biopsy confirmed NASH compared to obese and lean controls with normal liver enzymes [11].
Obese and NASH patients had increased Bacteroidetes and decreased Firmicutes which is
contradictory to the majority of findings between obese and lean adults. Additionally, NASH
patients had elevated blood ethanol levels and a higher proportion of ethanol producing
Enterobacteriaceae compared to obese and lean controls [11]. Due to minimal diagnostic testing,
however, we cannot confirm the liver status of obese controls who may have had SS. Wong et al.
ran a small proof-of-concept trial of the probiotic and prebiotic formula, Lepicol, in adults with
NASH [14]. At baseline NASH patients had a lower abundance of Facecalibacterium and
Anaerosporobacter and increased Parabacteroides and Allisonella when compared to healthy
controls. Probiotic supplementation led to improvements in steatosis which were associated with
a decrease in the abundance of Firmicutes and an increase in Bacteroidetes [14]. Further
probiotic and prebiotic trials are discussed in section 2.2.5. Finally, a recent study discussed in
section 2.2.2.3, found that NAFLD patients (diagnosed by biopsy or imaging) had an increased
abundance of Escherichia, Anaerobacter, Lactobacilli, and Streptococcus compared to healthy
controls which was associated with impaired gut associated immunity and increased
inflammation and permeability of the duodenal mucosa [15]. NASH and SS patients, however,
were not distinguished. The body of literature on the role of the IM in NAFLD pathogenesis
remains limited. Most studies did not use liver biopsies to differentiate NASH from SS which is
important as NASH may progress to cirrhosis and hepatic failure while SS has a benign course.
Additionally, the role of bacterial products in NAFLD has not been well described.
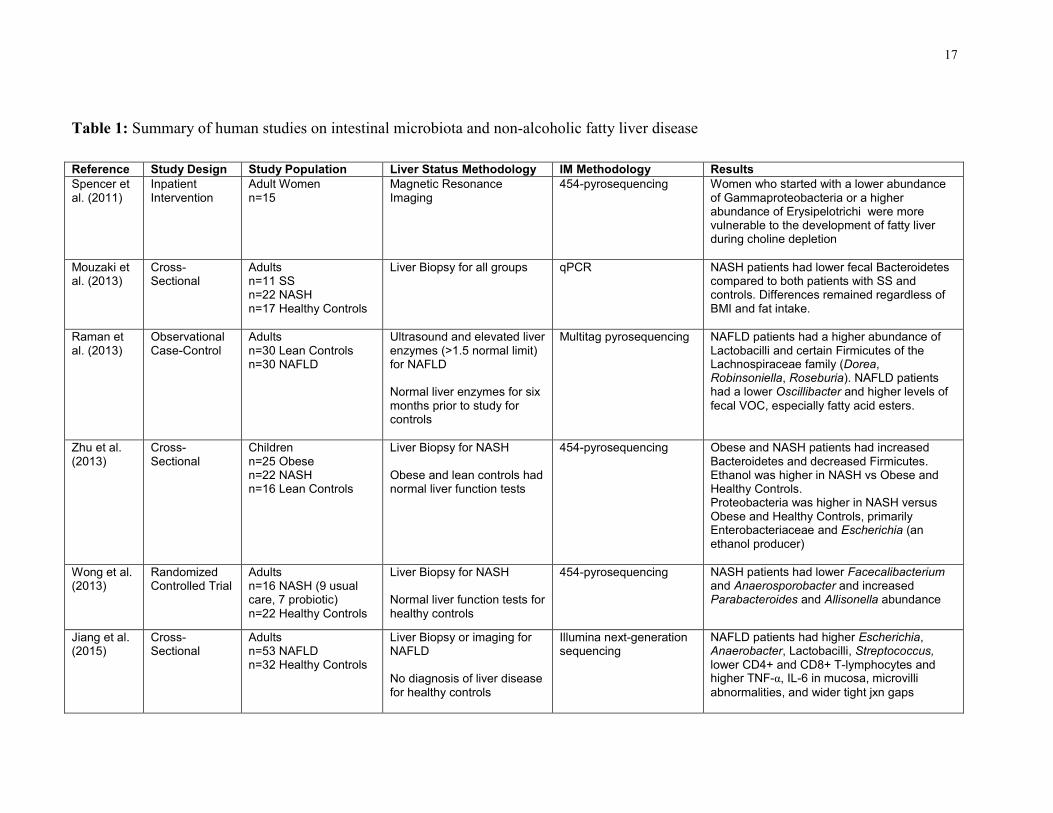
17
Table 1: Summary of human studies on intestinal microbiota and non-alcoholic fatty liver disease
Reference Study Design Study Population Liver Status Methodology IM Methodology Results
Spencer et al. (2011)
Inpatient Intervention
Adult Women n=15
Magnetic Resonance Imaging
454-pyrosequencing Women who started with a lower abundance of Gammaproteobacteria or a higher abundance of Erysipelotrichi were more vulnerable to the development of fatty liver during choline depletion
Mouzaki et al. (2013)
Cross-Sectional
Adults n=11 SS n=22 NASH n=17 Healthy Controls
Liver Biopsy for all groups qPCR NASH patients had lower fecal Bacteroidetes compared to both patients with SS and controls. Differences remained regardless of BMI and fat intake.
Raman et al. (2013)
Observational Case-Control
Adults n=30 Lean Controls n=30 NAFLD
Ultrasound and elevated liver enzymes (>1.5 normal limit) for NAFLD Normal liver enzymes for six months prior to study for controls
Multitag pyrosequencing NAFLD patients had a higher abundance of Lactobacilli and certain Firmicutes of the Lachnospiraceae family (Dorea, Robinsoniella, Roseburia). NAFLD patients had a lower Oscillibacter and higher levels of
fecal VOC, especially fatty acid esters.
Zhu et al. (2013)
Cross-Sectional
Children n=25 Obese n=22 NASH n=16 Lean Controls
Liver Biopsy for NASH Obese and lean controls had normal liver function tests
454-pyrosequencing Obese and NASH patients had increased Bacteroidetes and decreased Firmicutes. Ethanol was higher in NASH vs Obese and Healthy Controls. Proteobacteria was higher in NASH versus Obese and Healthy Controls, primarily Enterobacteriaceae and Escherichia (an ethanol producer)
Wong et al. (2013)
Randomized Controlled Trial
Adults n=16 NASH (9 usual care, 7 probiotic) n=22 Healthy Controls
Liver Biopsy for NASH Normal liver function tests for healthy controls
454-pyrosequencing NASH patients had lower Facecalibacterium and Anaerosporobacter and increased Parabacteroides and Allisonella abundance
Jiang et al. (2015)
Cross-Sectional
Adults n=53 NAFLD n=32 Healthy Controls
Liver Biopsy or imaging for NAFLD No diagnosis of liver disease for healthy controls
Illumina next-generation sequencing
NAFLD patients had higher Escherichia, Anaerobacter, Lactobacilli, Streptococcus, lower CD4+ and CD8+ T-lymphocytes and higher TNF-α, IL-6 in mucosa, microvilli
abnormalities, and wider tight jxn gaps

18
2.2.5 Probiotic and Prebiotic Trials
Given the potential relationship between the IM and NAFLD pathogenesis, several studies have
attempted to prevent or improve NAFLD with the provision of pre- or probiotic supplements. In
animal studies, probiotic treatment led to improved steatosis, insulin resistance, and
inflammation in mice on a high fat diet [182] and in rats on a choline deficient diet [154].
Probiotic supplementation in rats led to decreased hepatic expression of genes involved in
lipogenesis and increased excretion of cholesterol transporters, reducing steatosis while on a high
fat diet [183]. VSL#3, a probiotic used in many trials, reversed insulin resistance, inflammation,
and NASH caused by increased intestinal permeability in mice [184]. Yadev et al. recently
explored the function of VSL#3 in mice, showing that it prevented and treated genetic and diet
induced obesity, reducing weight (fat mass), insulin resistance, steatosis, and inflammatory
markers [155]. The beneficial effects of VSL#3 were associated with increased fecal and plasma
butyrate which triggered increased expression of free fatty acid receptor 3, upregulating the
release of glucagon-like peptide 1 (GLP-1) which is involved in appetite regulation, and
therefore decreasing food intake [155]. VSL#3 also significantly altered the IM, decreasing
Firmicutes and increasing Bacteriodetes and Bifidobacteria. Similarly, supplementary
oligofructose (a prebiotic) in obese (fa/fa) rats led to slower weight gain and lower hepatic
triglyceride concentrations when compared to controls [185].
Results have been equally promising in human studies; however, many studies are not able to
sufficiently explain the mechanism behind the benefits of probiotic supplementation. Two
studies have tested VSL#3 supplementation. Alisi et al. provided children with biopsy proven
NAFLD either VSL#3 or a placebo for 4 months [186]. Children who received the probiotic had
a significantly decreased probability of having severe NAFLD after four months than children
receiving the placebo; 21% had no NAFLD after 4 months. VSL#3 supplementation was also
associated with a higher plasma GLP-1 level and lower body mass index [186]. Loguercio et al.
previously looked at VSL#3 supplementation in patients with NAFLD and other chronic liver
disease, finding lower markers of lipid peroxidation and oxidative stress post-supplementation
[187]. Aller et al. and Vajro et al. ran trials with other probiotic formulations, resulting in
decreased liver enzymes, but no change in inflammatory measures, insulin resistance, or fatty
liver [188, 189]. Trials with synbiotics (pre- and probiotics delivered together) appear more

19
promising, including the small trial discussed in section 2.2.4 [14]. Malaguarnera et al. found
that synbiotic supplementation for 24 weeks resulted in a greater reduction in AST, insulin
resistance, inflammatory markers, endotoxin levels, steatosis, and NASH activity score than diet
and exercise alone [190]. Taken together these studies seem to suggest a beneficial role of
probiotics, particularly VSL#3 or synbiotic combinations, in treating NAFLD. The mechanism of
this improvement is unclear, but likely multifactorial. IM that may be of particular interest in
NAFLD pathogenesis, considering the findings of previous studies, are included in Table 2.
Table 2: Bacteria of interest in non-alcoholic fatty liver disease
Bacteria of Interest Expected Finding Notes on Mechanism
Reference
Bacteroidetes Lower in NASH vs SS & HC Increased energy
absorption
[13]
Proteobacteria Higher in NAFLD
[11, 12]
Erysipelotrichi Higher abundance increased
susceptibility to NAFLD
[10]
Gammaproteobacteria Mixed results with lower or higher
abundance in NAFLD
[10, 12]
Enterobacteriaceae,
especially Escherichia
Higher in NAFLD/NASH vs HC Ethanol producer
[11, 15]
Ruminococcaceae Higher in HC Butyrate producer
[15]
Faecalibacterium Lower in NASH vs HC Butyrate producer
[14]
Lactobacilli Higher in NAFLD (SS &NASH)
[45, 78]
Prevotella Higher in HC Butyrate producer
[15]
Streptococcus Higher in NAFLD vs HC
[15]
Clostridium Clusters
XIVa and IV
Lower in NASH vs HC & SS Butyrate producers Not
extensively
studied in
NAFLD
population
20
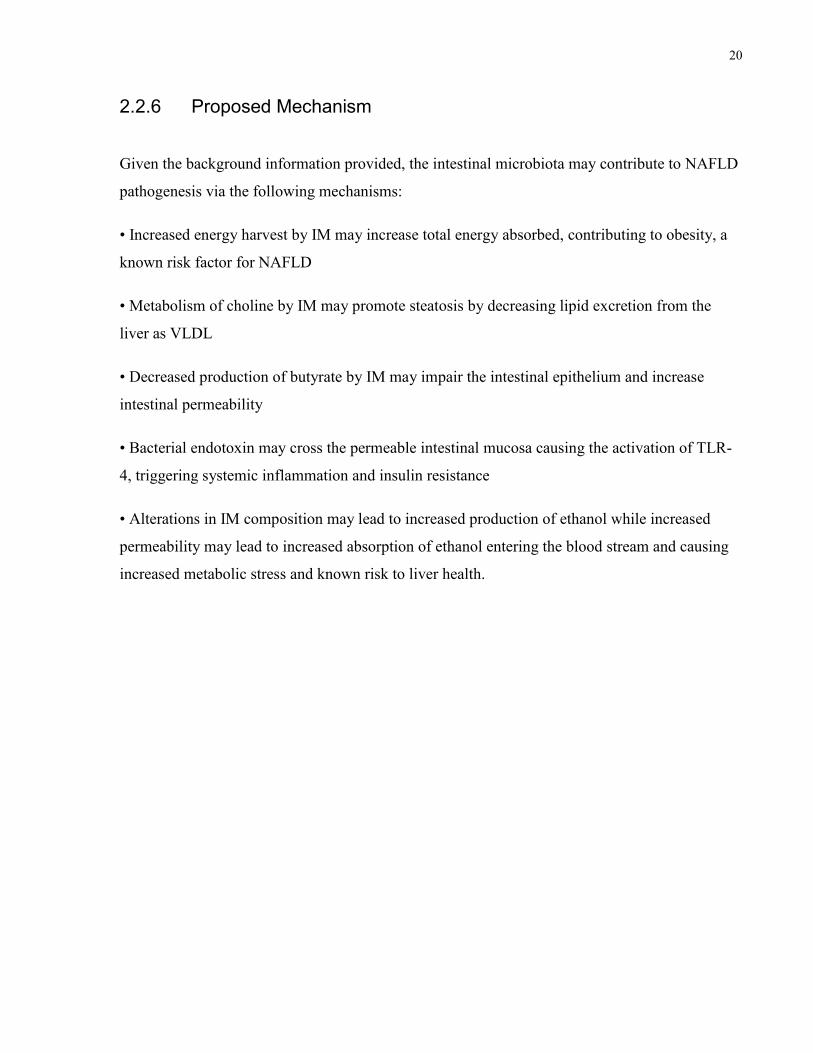
2.2.6 Proposed Mechanism
Given the background information provided, the intestinal microbiota may contribute to NAFLD
pathogenesis via the following mechanisms:
• Increased energy harvest by IM may increase total energy absorbed, contributing to obesity, a
known risk factor for NAFLD
• Metabolism of choline by IM may promote steatosis by decreasing lipid excretion from the
liver as VLDL
• Decreased production of butyrate by IM may impair the intestinal epithelium and increase
intestinal permeability
• Bacterial endotoxin may cross the permeable intestinal mucosa causing the activation of TLR-
4, triggering systemic inflammation and insulin resistance
• Alterations in IM composition may lead to increased production of ethanol while increased
permeability may lead to increased absorption of ethanol entering the blood stream and causing
increased metabolic stress and known risk to liver health.

21
3 Research Aim and Hypotheses
Aim: The aim of this research project is to compare bacterial products between biopsy confirmed
SS, NASH and healthy controls (HC) as well as to further assess the IM between groups.
Main Hypothesis: Patients with NASH have higher plasma endotoxin compared to those with
SS and HC.
Secondary Hypothesis: Patients with NASH have lower fecal butyrate compared to SS and HC.
Additional Outcomes: We will also measure whether there is a difference in serum choline,
ethanol and other serum and fecal metabolites between the three groups and assess if there is any
association with differences in IM and diet.

22
4 Materials and Methods
4.1 Study Design
This is a cross-sectional study comparing patients with liver biopsy proven simple steatosis (SS),
non-alcoholic steatohepatitis (NASH) and healthy controls (HC).
Adult subjects seen by hepatologists of the University Health Network, Toronto, were
approached for this study. Patients with a clinical suspicion of NAFLD, typically due to
persistently elevated liver enzymes and obesity, were assessed by a hepatologist using standard
medical practice. Patients were given general advice to lose weight and increase physical
activity; no specific instructions for lifestyle change were provided. Patients who returned for
their follow-up appointment approximately six months later without success in lifestyle
improvement or weight loss were booked for a liver biopsy to assess the severity of NAFLD.
During this visit (study visit 1) the study was explained in detail and informed consent was
obtained from interested participants. See Appendix 1 for consent forms. Following consent,
subjects were provided with detailed instructions for the completion of a 7-day food record, 7-
day activity record, and environmental questionnaire (see below for further details). Patients
were also provided with instructions for the collection and transport of their stool sample
(Appendix 2), which they were asked to return along with their food/activity record on the day
of their liver biopsy (study visit 2). On study visit 2, subjects underwent anthropometric
measurements and provided a fasting blood sample for clinical (section 4.4) and study specific
(section 4.6 and 4.7) bloodwork.
For healthy controls, individuals undergoing candidacy assessment as potential healthy living
liver donors at Toronto General Hospital were approached during their first screening
appointment. The study details were explained and informed consent was provided by interested
participants. At this visit (study visit 1) the same instructions for the food/activity records,
environmental questionnaire, and stool sample collection were provided. Approximately one
week prior to liver donation, healthy controls returned for study visit 2 where they underwent
anthropometric measurements, provided a fasting blood sample, and returned their stool sample
and food/activity record. On study visit 3, during their donation surgery, a wedge liver biopsy
was collected for histological analysis.
23
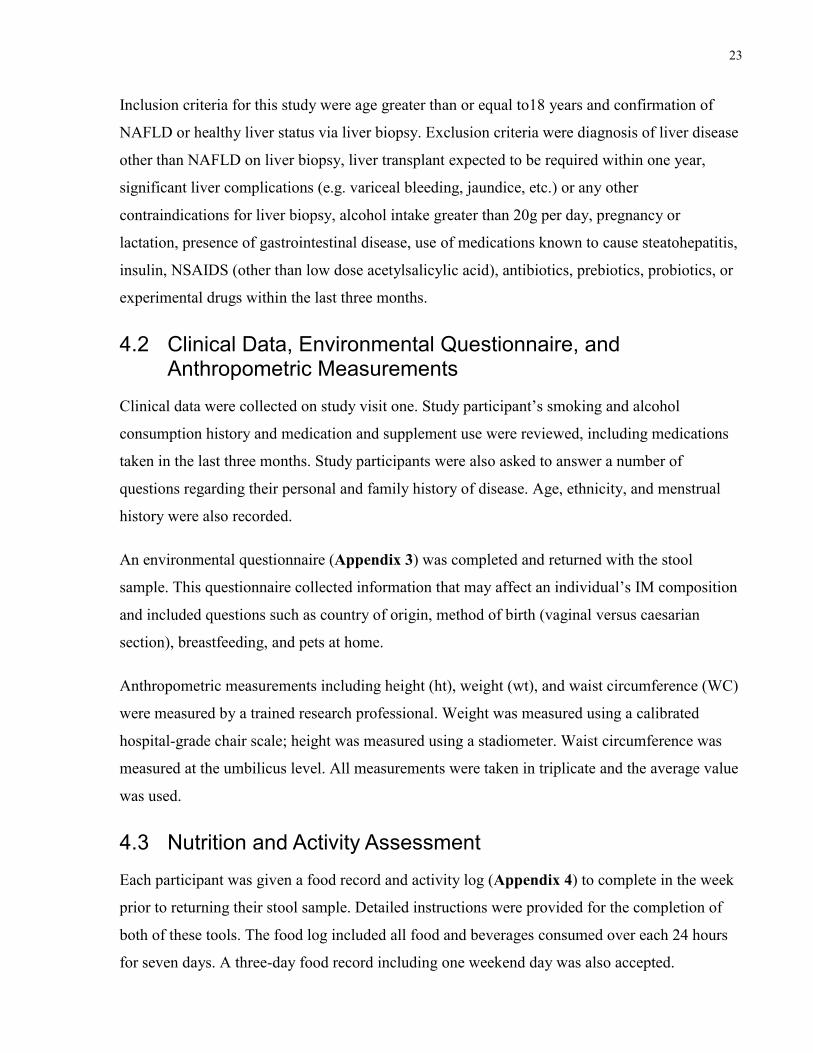
Inclusion criteria for this study were age greater than or equal to18 years and confirmation of
NAFLD or healthy liver status via liver biopsy. Exclusion criteria were diagnosis of liver disease
other than NAFLD on liver biopsy, liver transplant expected to be required within one year,
significant liver complications (e.g. variceal bleeding, jaundice, etc.) or any other
contraindications for liver biopsy, alcohol intake greater than 20g per day, pregnancy or
lactation, presence of gastrointestinal disease, use of medications known to cause steatohepatitis,
insulin, NSAIDS (other than low dose acetylsalicylic acid), antibiotics, prebiotics, probiotics, or
experimental drugs within the last three months.
4.2 Clinical Data, Environmental Questionnaire, and Anthropometric Measurements
Clinical data were collected on study visit one. Study participant’s smoking and alcohol
consumption history and medication and supplement use were reviewed, including medications
taken in the last three months. Study participants were also asked to answer a number of
questions regarding their personal and family history of disease. Age, ethnicity, and menstrual
history were also recorded.
An environmental questionnaire (Appendix 3) was completed and returned with the stool
sample. This questionnaire collected information that may affect an individual’s IM composition
and included questions such as country of origin, method of birth (vaginal versus caesarian
section), breastfeeding, and pets at home.
Anthropometric measurements including height (ht), weight (wt), and waist circumference (WC)
were measured by a trained research professional. Weight was measured using a calibrated
hospital-grade chair scale; height was measured using a stadiometer. Waist circumference was
measured at the umbilicus level. All measurements were taken in triplicate and the average value
was used.
4.3 Nutrition and Activity Assessment
Each participant was given a food record and activity log (Appendix 4) to complete in the week
prior to returning their stool sample. Detailed instructions were provided for the completion of
both of these tools. The food log included all food and beverages consumed over each 24 hours
for seven days. A three-day food record including one weekend day was also accepted.
24
Participants used the 2D Food Portion Visual Chart (Nutrition Consulting Enterprises,
Framingham, MA) to estimate portion sizes. This is a validated tool which has been used in our
previous studies [60, 191, 192]. Food records were reviewed by an experienced registered
dietitian and were analyzed using Food Processor Diet and Nutrition Analysis Software (Version
7, ESHA Research, Salem, OR).
Physical activity logs were recorded for 7 days concurrent with the food records. Participants
were asked to record any activity, including household chores, the duration of the activity, and
the intensity level. Detailed instructions were provided including examples for each intensity
level (mild, moderate, strenuous, and very strenuous). For details see Appendix 4. This
information was used to calculate daily physical activity units: 1 unit = 30 minutes mild, 20
minutes moderate, 10 minutes strenuous, or 5 minutes very strenuous activity. This is a validated
method for measuring physical activity level [193]. Basal metabolic rate (BMR) was calculated
using the Harris-Benedict equation: BMR for men = 66.5 + [13.75 × wt(kg)] + [5.003 × ht(cm)]
– [6.755 × age(y)], BMR for women = 655.1 [9.563 × wt(kg)] + [1.850 × ht(cm)] – [4.676 ×
age(y)]. Estimated energy requirement (EER) was calculated using Health Canada Guidelines:
EER for men = 662 – [9.53 x age(y)] + PA x {[15.91 x wt(kg])] + [539.6 x ht(m)]}, and EER for
women = 354 – [6.91 x age(y)] + PA x {[9.36 x wt(kg)] + (726 x ht(m)]} where PA is the
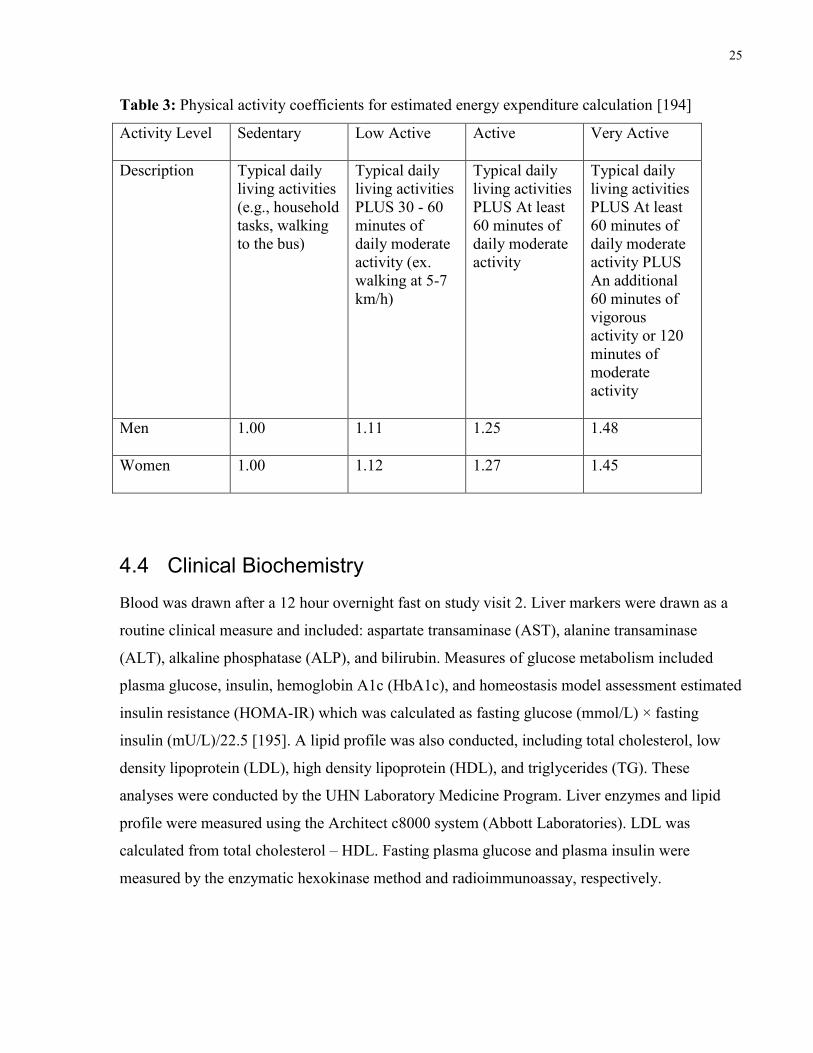
physical activity coefficients which are included in Table 3 [194].
25
Table 3: Physical activity coefficients for estimated energy expenditure calculation [194]
Activity Level Sedentary Low Active Active Very Active
Description Typical daily
living activities
(e.g., household
tasks, walking
to the bus)
Typical daily
living activities
PLUS 30 - 60
minutes of
daily moderate
activity (ex.
walking at 5-7
km/h)
Typical daily
living activities
PLUS At least
60 minutes of
daily moderate
activity
Typical daily
living activities
PLUS At least
60 minutes of
daily moderate
activity PLUS
An additional
60 minutes of
vigorous
activity or 120
minutes of
moderate
activity
Men 1.00 1.11 1.25 1.48
Women 1.00 1.12 1.27 1.45
4.4 Clinical Biochemistry
Blood was drawn after a 12 hour overnight fast on study visit 2. Liver markers were drawn as a
routine clinical measure and included: aspartate transaminase (AST), alanine transaminase
(ALT), alkaline phosphatase (ALP), and bilirubin. Measures of glucose metabolism included
plasma glucose, insulin, hemoglobin A1c (HbA1c), and homeostasis model assessment estimated
insulin resistance (HOMA-IR) which was calculated as fasting glucose (mmol/L) × fasting
insulin (mU/L)/22.5 [195]. A lipid profile was also conducted, including total cholesterol, low
density lipoprotein (LDL), high density lipoprotein (HDL), and triglycerides (TG). These
analyses were conducted by the UHN Laboratory Medicine Program. Liver enzymes and lipid
profile were measured using the Architect c8000 system (Abbott Laboratories). LDL was
calculated from total cholesterol – HDL. Fasting plasma glucose and plasma insulin were
measured by the enzymatic hexokinase method and radioimmunoassay, respectively.
26
4.5 Liver Histology
Liver biopsies were taken percutaneously (needle biopsy) for NAFLD patients and
intraoperatively (wedge biopsy) for HC and preserved immediately in formalin. Liver biopsies
were assessed by the same pathologist using standard stains for the diagnosis of NAFLD,
morphologic evaluation, and to rule out any iron overload. The evaluation of NAFLD related
measures of steatosis, inflammation, and fibrosis were conducted using the validated and
reproducible Brunt system (Table 4) [196]. Disease severity was also evaluated using the NAS
which accounts for degree of steatosis, lobular inflammation, and hepatocellular ballooning for a
final score of 0-8 [197].
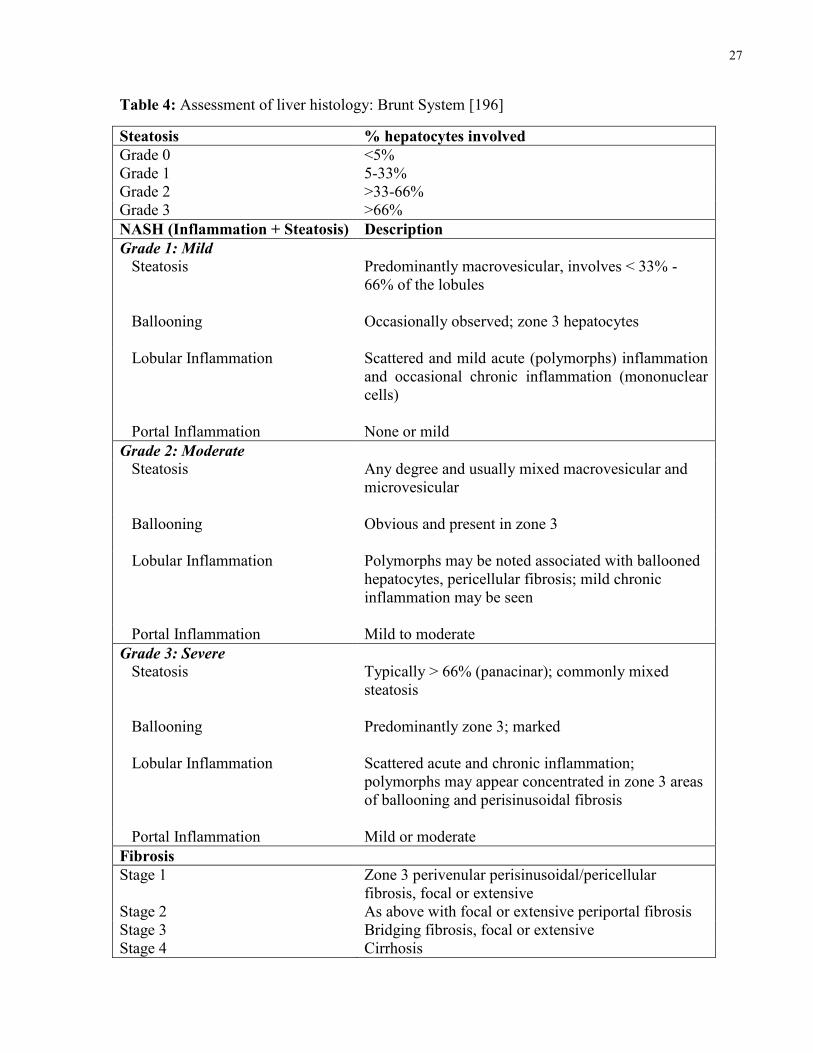
27
Table 4: Assessment of liver histology: Brunt System [196]
Steatosis % hepatocytes involved
Grade 0 <5%
Grade 1 5-33%
Grade 2 >33-66%
Grade 3 >66%
NASH (Inflammation + Steatosis) Description
Grade 1: Mild
Steatosis Predominantly macrovesicular, involves < 33% -
66% of the lobules
Ballooning Occasionally observed; zone 3 hepatocytes
Lobular Inflammation Scattered and mild acute (polymorphs) inflammation
and occasional chronic inflammation (mononuclear
cells)
Portal Inflammation None or mild
Grade 2: Moderate
Steatosis Any degree and usually mixed macrovesicular and
microvesicular
Ballooning Obvious and present in zone 3
Lobular Inflammation Polymorphs may be noted associated with ballooned
hepatocytes, pericellular fibrosis; mild chronic
inflammation may be seen
Portal Inflammation Mild to moderate
Grade 3: Severe
Steatosis Typically > 66% (panacinar); commonly mixed
steatosis
Ballooning Predominantly zone 3; marked
Lobular Inflammation Scattered acute and chronic inflammation;
polymorphs may appear concentrated in zone 3 areas
of ballooning and perisinusoidal fibrosis
Portal Inflammation Mild or moderate
Fibrosis
Stage 1 Zone 3 perivenular perisinusoidal/pericellular
fibrosis, focal or extensive
Stage 2 As above with focal or extensive periportal fibrosis
Stage 3 Bridging fibrosis, focal or extensive
Stage 4 Cirrhosis
28
4.6 Plasma Endotoxin
Blood was drawn in a fasting state using an ethylenediaminetetraacetic acid (EDTA) coated
vacutainer and separated by centrifugation at 2400 rpm for 10 minutes at 20oC. Plasma was then
stored at -80°C until the time of measurement. Endotoxin quantification was conducted using the
QCL-1000 chromogenic limulus amebocyte lysate (LAL) endpoint assay (Lonza, Walkersville,
MD) in our own laboratory. This assay has been effectively used in the literature [130, 198-201].
The assay is based on the principle that endotoxin catalyzes the activation of a proenzyme that is
found in LAL. The rate of activation is determined by the amount of endotoxin present. Once
activated, the enzyme catalyzes the splitting of pNA from the colourless substrate. Once the
reaction is stopped, the separated pNA can be measured via photometry at 405-410nm. The
correlation between absorbance and endotoxin concentration is linear from 0.1 to 1.0 EU/mL.
Endotoxin concentration is determined using a standard curve.
The LAL assay was optimized for use with our samples prior to study measurements. The ideal
dilution and processing of samples was determined using a positive product control or “spiked”
sample. Each sample dilution was spiked with 0.4 EU/mL. The spiked and unspiked sample
dilution were then measured as per the study protocol (see below). Optimization occurred when
spike recovery was in the 75-125% range, indicating that significant inhibition or enhancement
has not occurred.
Following this process the optimal LAL assay protocol was developed. Plasma samples were
thawed at room temperature. An initial 1:5 dilution was heat treated at 70°C for 15 minutes to
deactivate interference from plasma proteins. Samples were then cooled. Meanwhile a standard
curve was produced, using the provided endotoxin standard and endotoxin free water. The
standard curve including five points: 0.4 EU/mL, 0.3 EU/mL, 0.2 EU/mL, 0.1 EU/mL, and 0.05
EU/mL.
Once the 1:5 plasma dilution was cooled, a 1:60 dilution was produced by adding 0.1 mL of the
1:5 solution to 1.1 mL of 10mM MgCl2. MgCl2 was used to overcome the inhibitory effect of
EDTA. An endotoxin-free 96 well plate was filled with 50 µL of each 1:60 sample dilution, the
standard curve, and a water blank in triplicate. A sample blank was also plated in duplicate to
control of any absorbance due to colour present in the sample prior to assay. The plate was then
placed on a block heater and preheated to 37°C. Meanwhile the LAL reagent and substrate were
29
reconstituted with endotoxin-free water and the substrate was heated to 37°C in a water bath. All
pipetting was done using endotoxin-free pipette tips and dilutions were made in endotoxin-free
test tubes.
The timed test protocol then occurred as follows: at T=0, 50 µL of LAL reagent was added to
each standard, blank, and test well using a repeater pipette. The plate was then tapped to mix and
left to incubate for 10 minutes. At T=10 minutes, 100 µL of substrate (heated to 37°C) was
added to each of these wells and the plate was tapped to mix. At T=16 minutes, 50 µL of a stop
solution (10g/100mL sodium dodecylsulfate) was added to all wells, including the sample blanks
and the plate was tapped to mix. Any bubbles present in the wells were then popped using a
sterile syringe. Absorbance was measured at 405nm using the PHERAstar FS plate reader (BMG
Labtech, Offenburg, Germany) and endotoxin concentrations were extrapolated from the
standard curve using the MARS Data Analysis software (Version 3.01 R2, BMG Labtech, 2013).
4.7 Serum Metabolites
Serum metabolites, including choline, ethanol, and TMAO, were measured to evaluate potential
implications of bacterial metabolism at a systemic level. For the list of metabolites measured see
Table 5. Serum was drawn in a fasting state using a gel serum separation vacutainer and was
immediately placed in an insulated container with cooling elements. Blood was separated by
centrifuge at 4°C at 2800 x g for 20 minutes. Serum was then aliquoted and stored at -80°C until
all study samples were collected. Serum samples were shipped to the Metabolomic Innovation
Centre (Edmonton, AB) where metabolites were analyzed using nuclear magnetic resonance
(NMR) spectrometry [202]. The following method was used by the centre [202]: serum samples
were deproteinized using ultrafiltration. Filtrates were checked visually for a red tint, which
indicates that the membrane was compromised. For those “membrane compromised” samples,
the filtration process was repeated with a different filter and filtrates were inspected again. Then,
each filtrate (300 μL) was combined with 35 μL of D2O and 15 μL of a standard buffer solution.
The serum sample (350 μL) was then transferred to a standard Shigemi microcell NMR tube for
subsequent spectral analysis.
All 1H-NMR spectra were collected on a 500 MHz Inova (Varian Inc., Palo Alto, CA)
spectrometer.1H-NMR spectra were acquired at 25°C using the first transient of the tnnoesy-
presaturation pulse sequence, which was chosen for its high degree of quantitative accuracy
30
[203]. Spectra were collected with 128 transients and 8 steady-state scans using a 4 second
acquisition time and a 1 second recycle delay.
All free induction decay NMR signals were zero-filled to 64k data points and subjected to line
broadening of 0.5 Hz. The singlet produced by a known quantity of DSS methyl groups was used
as an internal standard (set to 0 ppm). All 1H-NMR spectra were processed and analyzed using
the Chenomx NMR Suite Professional software package version 6.0 (Chenomx Inc., Edmonton,
AB), as previously described [204]. Each spectrum was processed and analyzed by at least two
experienced NMR spectroscopists to minimize compound mis-identification and mis-
quantification.
Serum trimethylamine N-oxide (TMAO) was not detectable using NMR therefore TMAO was
measured using a targeted quantitative metabolomics approach by Liquid Chromatography Mass
Spectrometry (LCMS). Isotopically-labeled internal standards were added to the serum to
facilitate metabolite quantification. Sample extraction was performed on a 96 well plate with a
0.2 µm solvent filter. 10 µL of serum was spiked with the internal standard (TMAO D9) and then
150 µL of methanol with 10 mM ammonium acetate was added for extraction. Each sample was
diluted with 150 μL of water. Seven calibrant solutions with known concentrations went through
the same extraction steps. LCMS analysis was performed on AB SCIEX 4000 QTrap mass
spectrometer with Agilent 1100 HPLC. 10 µL of the extracted samples were injected onto the
Kinetex C18 (2.6 µm, 3.0x100mm, 100A) Column with guard column. Isobaric elution was
performed with 90% A (10 mM ammonium formate in water, PH3) and 10% B (10 mM
ammonium formate in 90:10 acetonitrile:water, PH3). Total LC method run time was 3 min with
flow rate of 500 µl/min. A seven-point calibration curve was generated to quantify the
concentration of TMAO in samples.

31
Table 5: Metabolites measured in stool and serum samples
Stool Metabolites Serum Metabolites
Acetic Acid* Acetic Acid*
Butyric Acid Choline*
Choline* Ethanol
Formic Acid* Formic Acid*
Isobutyric Acid 2-Hydroxybutyrate
Isovalerate L-Lactic Acid*
L-Lactic Acid* Trimethylamine N-Oxide*
Propionate
Succinate
Trimethylamine*
* Metabolite measured in both stool and serum
4.8 Stool Sample Collection and Analysis
Stool collection kits included a plastic collection/storage container with a tightly closing lid, an
insulated bag, and cooling elements. Within 24 hours of study visit 2, subjects collected one stool
sample, which was frozen immediately after defecation in their home freezer (-20°C). Subjects
brought the frozen sample in the insulated bag with cooling elements to the hospital, where it
was stored at -80C until homogenization. This method of stool collection was used in a
landmark study to establish a human gut microbial gene catalogue [205].
4.8.1 Stool Homogenization
Stool samples were homogenized prior to DNA extraction and metabolite measurements. The
entire sample was first transferred into a sterile masticator bag. The sample was allowed to thaw
until a smooth consistency was reached, typically 2-3 hours depending on sample size. Once
32
thawed, excess air was released from the bag and the sample was homogenized for two minutes
using a masticator blender (IUL, S.A., Barcelona, Spain). This was followed by one minute of
hand mastication of any areas that were missed. The corner of the masticator bag was then cut
and the sample was aliquoted: 1-2 g samples were stored for metabolite analysis and 0.1-0.2 g
aliquots were stored for DNA extraction. Samples were immediately placed on dry ice and then
transferred to -80°C for storage until analysis. Weight was recorded for each aliquot and pH was
measured for each sample.
4.8.2 Fecal Metabolite Analysis
Homogenized fecal samples were transferred to the Metabolomic Innovation Centre on dry ice
and were analyzed by NMR spectroscopy to identify 10 metabolites of interest (Table 5). Fecal
samples were prepared by mixing 20 mg of frozen fecal material with 1 mL of saline phosphate
buffer in deuterium oxide, followed by centrifugation (18 000 × g, 1 minute). Fecal supernatants
were removed and filtered through 0.2 μm membrane filters as described by Le Gall and
colleagues [206]. The measurement in fecal supernatant was then conducted as described above
in section 4.7 for serum metabolites.
4.8.3 DNA Extraction
DNA was extracted using the E.Z.N.A. Stool DNA Kit (Omega Bio-Tek, Norcross, GA) and a
modified manufacturer’s protocol with the addition of a lysozyme and proteinase digestion step
(incubation at 37°C for 30 minutes) as used by Mouzaki et al. [13]. An elution volume of 100 µL
was used. DNA was analyzed for purity and concentration using the Nanodrop 1000
Spectrophotometer (ThermoScientific, Rockford, IL). DNA samples were stored at -80°C.
4.8.4 Quantitative Real-time PCR
Total bacteria and selected microbial groups of interest: Bacteroidetes, Bifidobacteria,
Clostridium leptum, Clostridium coccoides, Lactobacilli, E. coli, and Archaea were analyzed by
qPCR. Assays were run in triplicate in a 384 well optical plate using a 7900HT thermocycler
(Applied Biosystems, Foster City, CA) under default thermocycling conditions. Fifty nanograms
of DNA with TaqMan Gene Expression Master Mix (MM) and specific TaqMan primers
(Applied Biosystems) were used. Custom-made TaqMan primers for total bacteria, Lactobacilli,
C. coccoides, C. leptum, Bacteroidetes, Bifidobacteria, and Archaea were used [207-209]. Real-

33
time PCR for E. coli was done using SYBR Green Gene Expression MM (Applied Biosystems)
and the specific forward and reverse primer [207]. The ramping profile for SYBR Green
amplifications was similar and a dissociation stage was added in the end. The number of cells of
each microorganism in fecal samples was calculated by interpolation from pre-constructed
standard curves (Table 6) and expressed as CFU/g of wet feces.
Table 6: Standard curves used in the interpretation of the qPCR results
Microorganism Standard curve Efficiency (%)
Total bacteria y=-3.325x + 37.670 99.87
Bacteroidetes y=-3.289x + 33.635 101.39
C. leptum y=-3.315x + 38.932 100.29
C. coccoides y=-3.3236x + 37.013 99.93
Lactobacilli y=-3.371x + 37.660 97.99
Bifidobacteria y=-3.357x + 37.826 98.56
E. coli y=-3.2928x + 34.939 101.23
Archaea y=-3.351x + 39.680 98.80
4.9 Statistical Analysis
4.9.1 Data Analysis
Descriptive summaries of all measurements were calculated: means and standard deviations (SD)
for normal variables, medians and first quartile and third quartile for skewed variables, and
proportions for categorical variables. Plots were used as appropriate to examine the data.
Bivariate relationships were assessed using Pearson’s or Spearman’s correlation coefficients,
Chi-square and Fisher exact tests where appropriate. Comparisons across diagnosis groups were
performed for normally distributed data using one-way ANOVA followed by the t-test (if
necessary, data were log-transformed to normalize distribution), or for non-normally distributed
data using the Kruskal-Wallis test followed by Wilcoxon rank-sums test. All tests were two-
sided and performed at the 5% significance (alpha) level. Bonferroni’s correction method was
34
used to account for multiple comparisons. Outliers were identified by visual inspection and
sensitivity analyses were run. If the exclusion of outliers altered the result of the statistical test
this was noted in the results section. All statistical analyses were conducted using SAS version
9.4 (SAS Institute Inc., Cary, NC).
4.9.2 Power Calculations
Calculations were performed using standard statistical software packages, primarily SAS version
9.3 (SAS Institute Inc., Cary, NC). Calculations for the main variable (endotoxin) was based on a
sample size of n=30 per group and estimates from Harte et al. obtained from a similar patient
population of HC, SS, and NASH [130]. SD and effect size (ES), where ES=mean difference,
were estimated from Harte et al. (SD=5.22, ES=3.84 EU/mL). The significance level was set at
5%. Power calculations were performed for one-way ANOVA. We estimated the power to detect
differences between our three groups in ANOVA as >0.999.
35
5 Results
5.1 Subjects
A total of 30 HC, 15 SS, and 24 NASH patients were found eligible and provided consent to
participate in this study. Demographics, health history, and anthropometric data for these
subjects are described in Table 7. Both SS and NASH groups were significantly older than HC,
but did not differ by sex. BMI in NASH patients was significantly higher than HC, but BMI did
not differ between HC and SS or SS and NASH groups. Waist circumference also followed this
pattern. There appeared to be a difference in diabetes prevalence between groups, but when
Bonferroni correction was used for multiple comparisons this significance was lost. Prevalence
of hypertension was greater in both patient groups than in HC and corresponded with a higher
use of cardiovascular drugs which included antihypertensive medications. The use of lipid
lowering drugs such as statins was higher in NASH patients and the use of mild non-steroidal
anti-inflammatory drugs (low dose acetylsalicylic acid only) was higher in SS than in HC.
Biochemistry data is described in Table 8. ALT was significantly higher in SS patients versus
HC and in NASH patients versus both SS and HC. AST was significantly higher in NASH
patients than in both HC and SS patients. Fasting glucose appeared to be higher in NASH
patients but this did not remain significant in post-hoc pairwise comparisons. Fasting insulin was
significantly higher in NASH patients than in HC and SS patients, however, HOMA-IR and
HbA1c where only significantly different between HC and NASH patients with NASH patients
having higher levels. Lipids did not differ significantly between the groups with the exception of
triglycerides which were significantly higher in NASH patients versus HC.
Liver biopsies were available for 17 HC, 15 SS, and 23 NASH patients. Healthy controls who
did not have a liver biopsy had liver health confirmed via several diagnostic tests including blood
measurements of liver enzymes (ALT, AST, ALP), computerized tomography and MRI scans
which were reviewed by a panel of surgeons and hepatologists and confirmed to be healthy and
without fat deposits. One NASH patient was diagnosed via liver biopsy at an outside facility and
therefore histological analysis by our study pathologist was not possible.
Histological analysis is displayed in Table 9. Occasionally biopsies were not of sufficient size or
quality for all analyses and the total inflammation score was not measured consistently for all
36
patients. The sample size available for each histological feature is therefore noted. NASH
patients appear to have relatively mild disease with a median NAS of 5 out of a possible 8.
Environmental questionnaires were only received from 53% of study participants and were often
incomplete therefore statistical analysis was limited. Patient’s country of birth was also collected
as part of demography in 22 HC, 9 SS, and 16 NASH patients. There was a significant difference
in the proportion of patients born in Canada between groups with more HC (86%) being born in
Canada than SS (0%) and NASH (31%) patients (p<0.0001). Ethnicity, however, did not differ
by group as shown in Table 7.

37
Table 7: Subject demographics and health history
Variable n HC n SS n NASH p-value
Age (years) 30 37 (10)ab 15 47 (8)a 24 48 (9)b 0.0001
Sex (% female) 30 50% (15) 15 40% (6) 24 54 (13) 0.7
Ethnicity (%
Caucasian)
19 84% (16) 9 44% (4) 12 58% (7) 0.09
BMI (kg/m2) 30 26.2 (23.6,
28.8)a
15 27.4 (24.9,
32.5)
24 32.1 (29.7,
34.3)a
<0.0001
Waist Circumference
(cm)
28 89.9 (84.4,
94.8)a
13 97.1 (89.6,
106)
22 103 (97.8,
109)a
0.0002
Diabetes 30 0% (0) 15 7% (1) 24 17% (4) 0.049
Cardiovascular
Disease
30 0% (0) 15 7% (1) 24 7% (1) 0.2
Hypertension 30 0% (0)ab 15 27% (4)a 24 38% (9)b 0.0003
Renal Disease 30 0% (0) 15 0% (0) 24 8% (2) 0.16
Cardiovascular Drugs 30 0% (0)ab 15 33% (5)a 24 25% (6)b 0.001
Diabetes Drugs 30 0% (0) 15 7% (1) 24 13% (4) 0.049
Lipid Lowering Drugs 30 3% (1)a 15 27% (4) 24 33% (8)a 0.008
Anti-Depressants 30 7% (2) 15 7% (1) 24 0% (0) 0.4
NSAID† 30 0% (0)a 15 27% (4)a 24 13% (3) 0.011
Continuous variables are expressed as mean (standard deviation) for normal variables and
median (1st quartile, 3
rd quartile) for non-normally distributed variables.
Categorical variables are expressed as prevalence in percentage (count).
Values with the same superscript are significantly different.
† NSAID = nonsteroidal anti-inflammatory drug
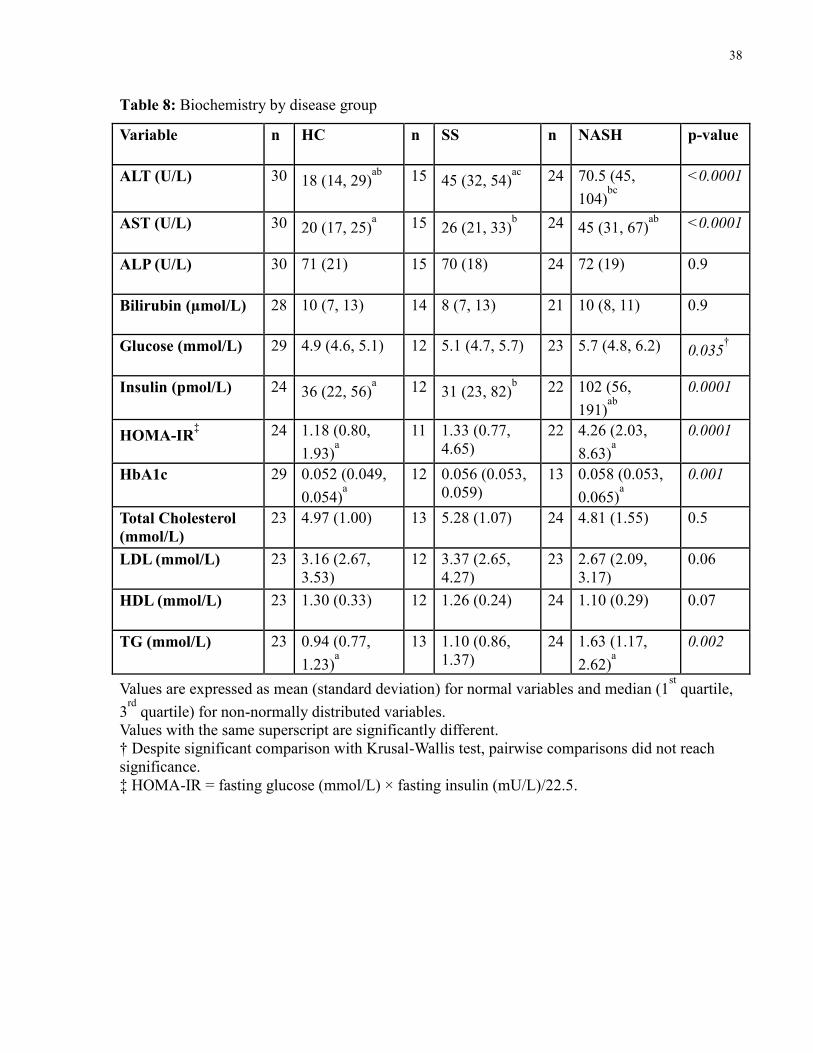
38
Table 8: Biochemistry by disease group
Variable n HC n SS n NASH p-value
ALT (U/L) 30 18 (14, 29)ab
15 45 (32, 54)ac
24 70.5 (45,
104)bc
<0.0001
AST (U/L) 30 20 (17, 25)a 15 26 (21, 33)
b 24 45 (31, 67)
ab <0.0001
ALP (U/L) 30 71 (21) 15 70 (18) 24 72 (19) 0.9
Bilirubin (µmol/L) 28 10 (7, 13) 14 8 (7, 13) 21 10 (8, 11) 0.9
Glucose (mmol/L) 29 4.9 (4.6, 5.1) 12 5.1 (4.7, 5.7) 23 5.7 (4.8, 6.2) 0.035†
Insulin (pmol/L) 24 36 (22, 56)a 12 31 (23, 82)
b 22 102 (56,
191)ab
0.0001
HOMA-IR‡ 24 1.18 (0.80,
1.93)a
11 1.33 (0.77,
4.65)
22 4.26 (2.03,
8.63)a
0.0001
HbA1c 29 0.052 (0.049,
0.054)a
12 0.056 (0.053,
0.059)
13 0.058 (0.053,
0.065)a
0.001
Total Cholesterol
(mmol/L)
23 4.97 (1.00) 13 5.28 (1.07) 24 4.81 (1.55) 0.5
LDL (mmol/L) 23 3.16 (2.67,
3.53)
12 3.37 (2.65,
4.27)
23 2.67 (2.09,
3.17)
0.06
HDL (mmol/L) 23 1.30 (0.33) 12 1.26 (0.24) 24 1.10 (0.29) 0.07
TG (mmol/L) 23 0.94 (0.77,
1.23)a
13 1.10 (0.86,
1.37)
24 1.63 (1.17,
2.62)a
0.002
Values are expressed as mean (standard deviation) for normal variables and median (1st quartile,
3rd
quartile) for non-normally distributed variables.
Values with the same superscript are significantly different.
† Despite significant comparison with Krusal-Wallis test, pairwise comparisons did not reach
significance.
‡ HOMA-IR = fasting glucose (mmol/L) × fasting insulin (mU/L)/22.5.
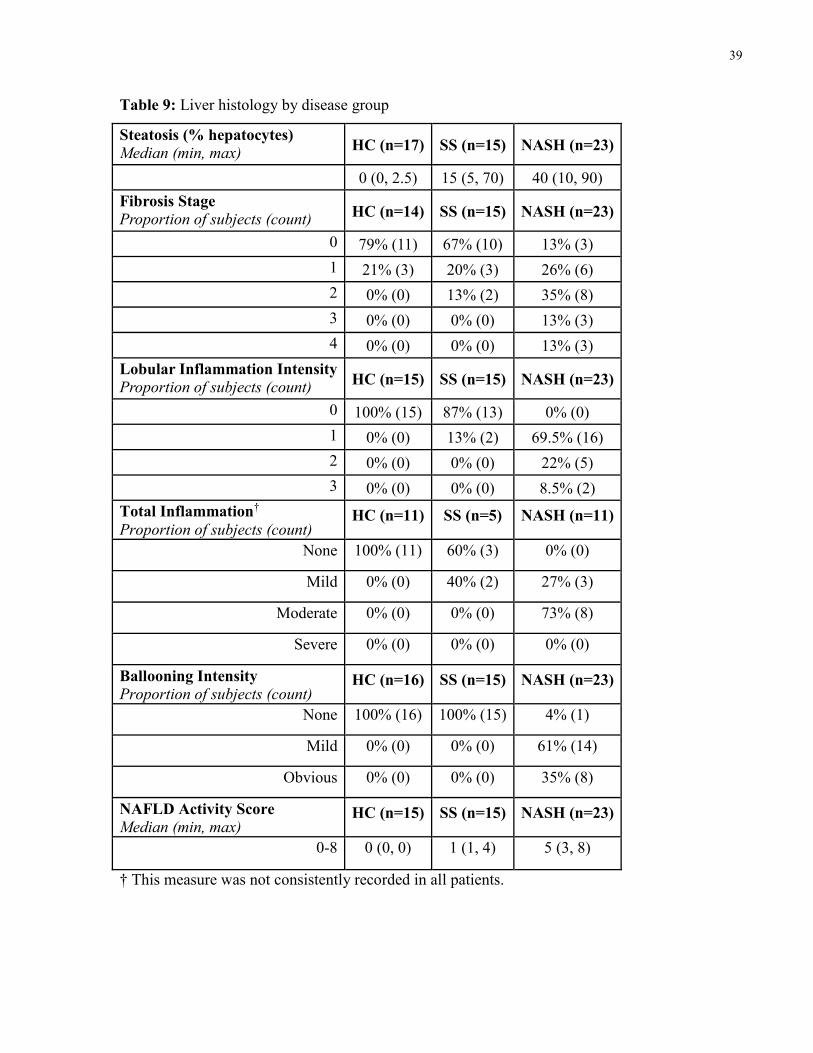
39
Table 9: Liver histology by disease group
Steatosis (% hepatocytes) Median (min, max)
HC (n=17) SS (n=15) NASH (n=23)
0 (0, 2.5) 15 (5, 70) 40 (10, 90)
Fibrosis Stage Proportion of subjects (count)
HC (n=14) SS (n=15) NASH (n=23)
0 79% (11) 67% (10) 13% (3)
1 21% (3) 20% (3) 26% (6)
2 0% (0) 13% (2) 35% (8)
3 0% (0) 0% (0) 13% (3)
4 0% (0) 0% (0) 13% (3)
Lobular Inflammation Intensity Proportion of subjects (count)
HC (n=15) SS (n=15) NASH (n=23)
0 100% (15) 87% (13) 0% (0)
1 0% (0) 13% (2) 69.5% (16)
2 0% (0) 0% (0) 22% (5)
3 0% (0) 0% (0) 8.5% (2)
Total Inflammation†
Proportion of subjects (count) HC (n=11) SS (n=5) NASH (n=11)
None 100% (11) 60% (3) 0% (0)
Mild 0% (0) 40% (2) 27% (3)
Moderate 0% (0) 0% (0) 73% (8)
Severe 0% (0) 0% (0) 0% (0)
Ballooning Intensity
Proportion of subjects (count) HC (n=16) SS (n=15) NASH (n=23)
None 100% (16) 100% (15) 4% (1)
Mild 0% (0) 0% (0) 61% (14)
Obvious 0% (0) 0% (0) 35% (8)
NAFLD Activity Score
Median (min, max) HC (n=15) SS (n=15) NASH (n=23)
0-8 0 (0, 0) 1 (1, 4) 5 (3, 8)
† This measure was not consistently recorded in all patients.
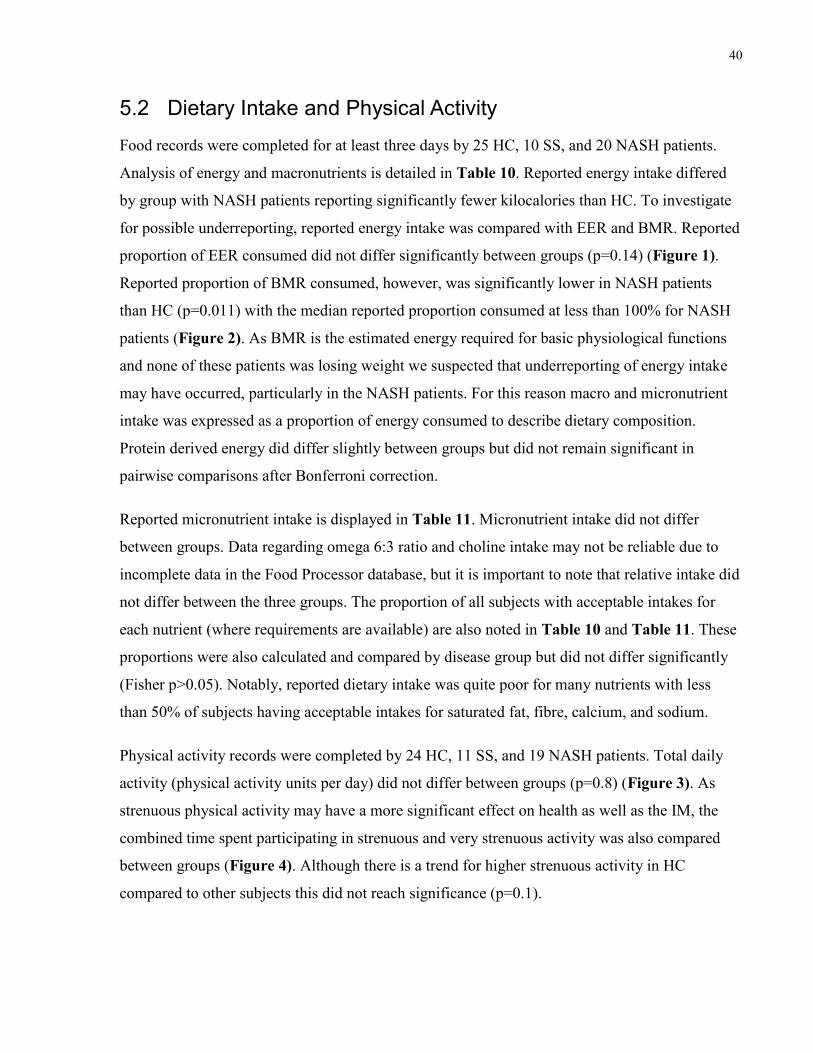
40
5.2 Dietary Intake and Physical Activity
Food records were completed for at least three days by 25 HC, 10 SS, and 20 NASH patients.
Analysis of energy and macronutrients is detailed in Table 10. Reported energy intake differed
by group with NASH patients reporting significantly fewer kilocalories than HC. To investigate
for possible underreporting, reported energy intake was compared with EER and BMR. Reported
proportion of EER consumed did not differ significantly between groups (p=0.14) (Figure 1).
Reported proportion of BMR consumed, however, was significantly lower in NASH patients
than HC (p=0.011) with the median reported proportion consumed at less than 100% for NASH
patients (Figure 2). As BMR is the estimated energy required for basic physiological functions
and none of these patients was losing weight we suspected that underreporting of energy intake
may have occurred, particularly in the NASH patients. For this reason macro and micronutrient
intake was expressed as a proportion of energy consumed to describe dietary composition.
Protein derived energy did differ slightly between groups but did not remain significant in
pairwise comparisons after Bonferroni correction.
Reported micronutrient intake is displayed in Table 11. Micronutrient intake did not differ
between groups. Data regarding omega 6:3 ratio and choline intake may not be reliable due to
incomplete data in the Food Processor database, but it is important to note that relative intake did
not differ between the three groups. The proportion of all subjects with acceptable intakes for
each nutrient (where requirements are available) are also noted in Table 10 and Table 11. These
proportions were also calculated and compared by disease group but did not differ significantly
(Fisher p>0.05). Notably, reported dietary intake was quite poor for many nutrients with less
than 50% of subjects having acceptable intakes for saturated fat, fibre, calcium, and sodium.
Physical activity records were completed by 24 HC, 11 SS, and 19 NASH patients. Total daily
activity (physical activity units per day) did not differ between groups (p=0.8) (Figure 3). As
strenuous physical activity may have a more significant effect on health as well as the IM, the
combined time spent participating in strenuous and very strenuous activity was also compared
between groups (Figure 4). Although there is a trend for higher strenuous activity in HC
compared to other subjects this did not reach significance (p=0.1).
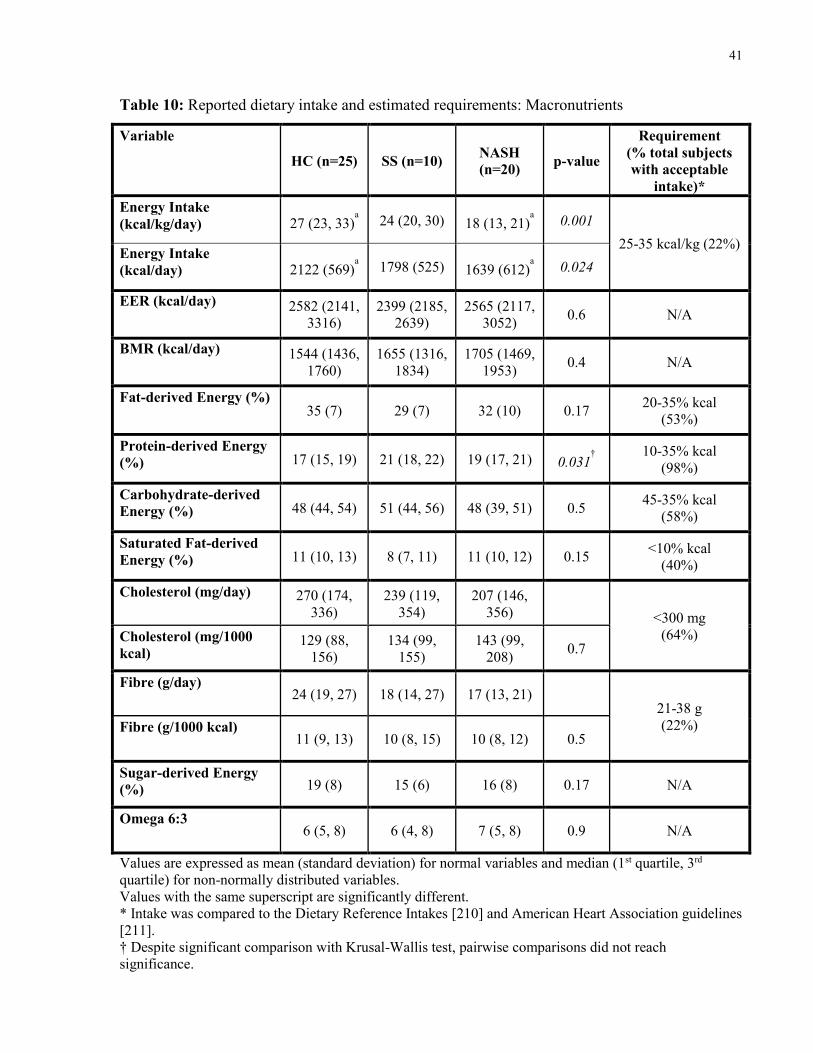
41
Table 10: Reported dietary intake and estimated requirements: Macronutrients
Variable
HC (n=25) SS (n=10) NASH
(n=20) p-value
Requirement
(% total subjects
with acceptable
intake)*
Energy Intake
(kcal/kg/day) 27 (23, 33)a
24 (20, 30) 18 (13, 21)a
0.001
25-35 kcal/kg (22%) Energy Intake
(kcal/day) 2122 (569)a
1798 (525) 1639 (612)a
0.024
EER (kcal/day) 2582 (2141,
3316)
2399 (2185,
2639)
2565 (2117,
3052) 0.6 N/A
BMR (kcal/day) 1544 (1436,
1760)
1655 (1316,
1834)
1705 (1469,
1953) 0.4 N/A
Fat-derived Energy (%) 35 (7) 29 (7) 32 (10) 0.17
20-35% kcal
(53%)
Protein-derived Energy
(%) 17 (15, 19) 21 (18, 22) 19 (17, 21) 0.031†
10-35% kcal
(98%)
Carbohydrate-derived
Energy (%) 48 (44, 54) 51 (44, 56) 48 (39, 51) 0.5 45-35% kcal
(58%)
Saturated Fat-derived
Energy (%) 11 (10, 13) 8 (7, 11) 11 (10, 12) 0.15 <10% kcal
(40%)
Cholesterol (mg/day) 270 (174,
336)
239 (119,
354)
207 (146,
356) <300 mg
(64%) Cholesterol (mg/1000
kcal) 129 (88,
156)
134 (99,
155)
143 (99,
208) 0.7
Fibre (g/day) 24 (19, 27) 18 (14, 27) 17 (13, 21)
21-38 g
(22%) Fibre (g/1000 kcal) 11 (9, 13) 10 (8, 15) 10 (8, 12) 0.5
Sugar-derived Energy
(%) 19 (8) 15 (6) 16 (8) 0.17 N/A
Omega 6:3 6 (5, 8) 6 (4, 8) 7 (5, 8) 0.9 N/A
Values are expressed as mean (standard deviation) for normal variables and median (1st quartile, 3rd
quartile) for non-normally distributed variables.
Values with the same superscript are significantly different.
* Intake was compared to the Dietary Reference Intakes [210] and American Heart Association guidelines
[211].
† Despite significant comparison with Krusal-Wallis test, pairwise comparisons did not reach
significance.
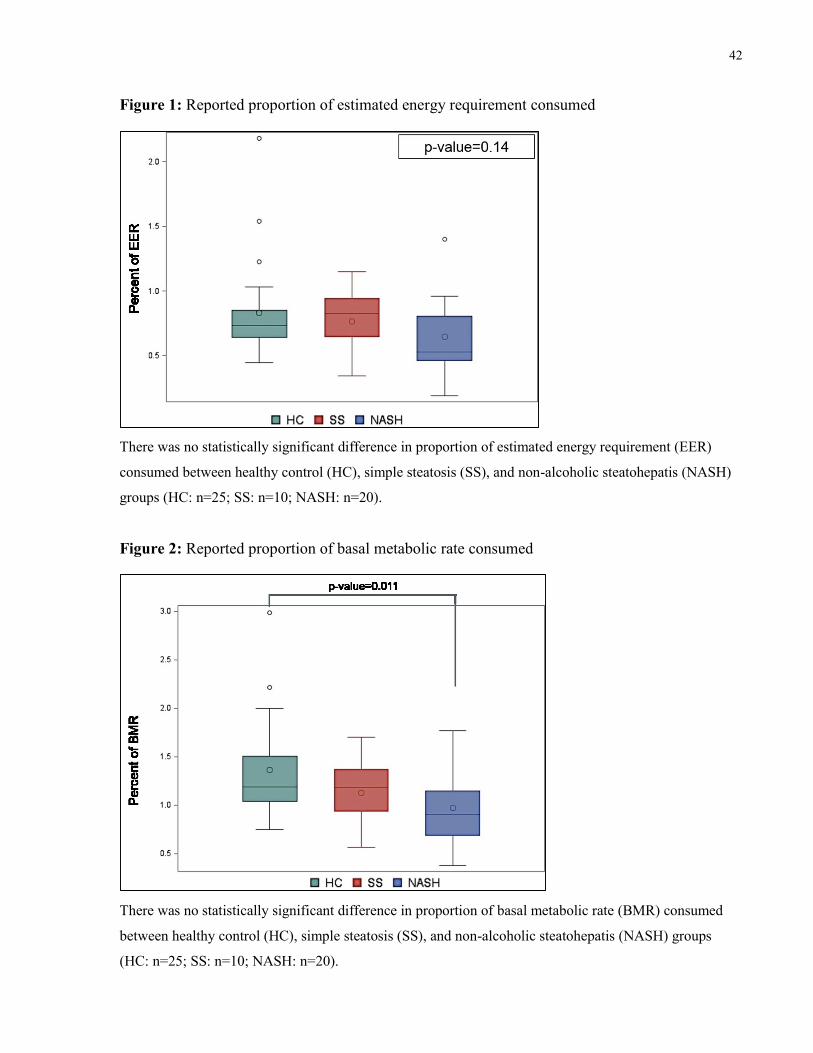
42
Figure 1: Reported proportion of estimated energy requirement consumed
There was no statistically significant difference in proportion of estimated energy requirement (EER)
consumed between healthy control (HC), simple steatosis (SS), and non-alcoholic steatohepatis (NASH)
groups (HC: n=25; SS: n=10; NASH: n=20).
Figure 2: Reported proportion of basal metabolic rate consumed
There was no statistically significant difference in proportion of basal metabolic rate (BMR) consumed
between healthy control (HC), simple steatosis (SS), and non-alcoholic steatohepatis (NASH) groups
(HC: n=25; SS: n=10; NASH: n=20).
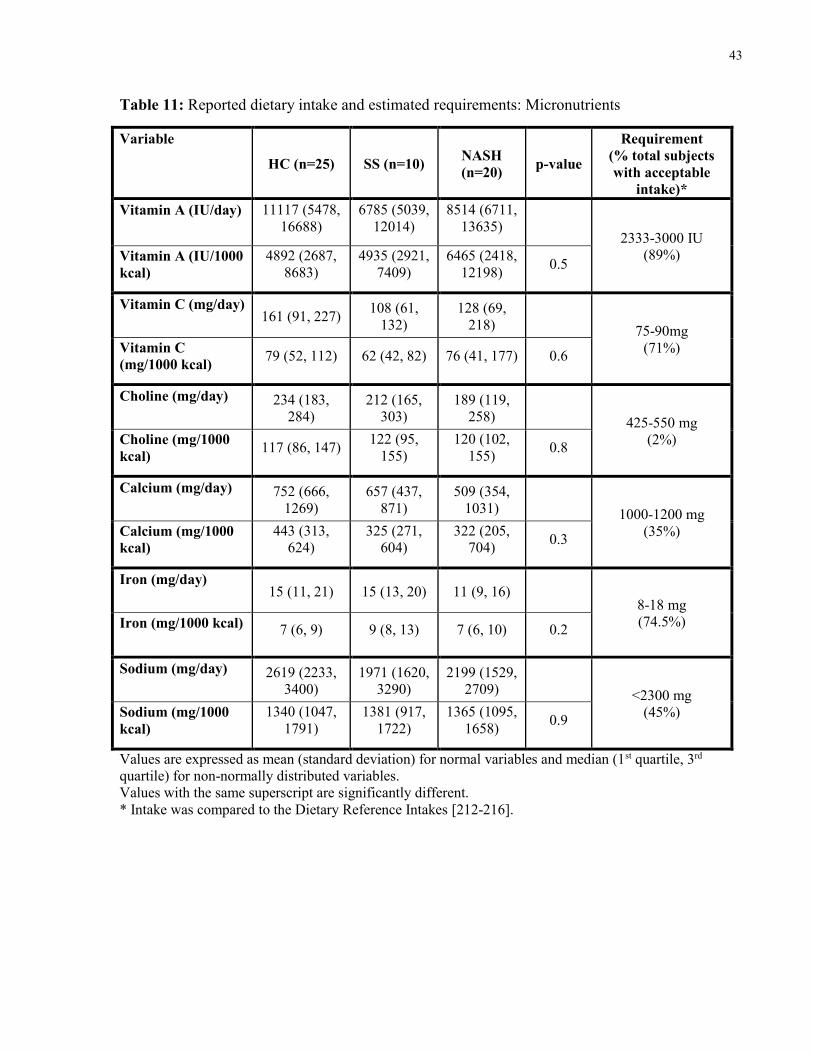
43
Table 11: Reported dietary intake and estimated requirements: Micronutrients
Variable
HC (n=25) SS (n=10) NASH
(n=20) p-value
Requirement
(% total subjects
with acceptable
intake)*
Vitamin A (IU/day) 11117 (5478,
16688)
6785 (5039,
12014)
8514 (6711,
13635) 2333-3000 IU
(89%) Vitamin A (IU/1000
kcal)
4892 (2687,
8683)
4935 (2921,
7409)
6465 (2418,
12198) 0.5
Vitamin C (mg/day) 161 (91, 227)
108 (61,
132)
128 (69,
218) 75-90mg
(71%) Vitamin C
(mg/1000 kcal) 79 (52, 112) 62 (42, 82) 76 (41, 177) 0.6
Choline (mg/day) 234 (183,
284)
212 (165,
303)
189 (119,
258) 425-550 mg
(2%) Choline (mg/1000
kcal) 117 (86, 147)
122 (95,
155)
120 (102,
155) 0.8
Calcium (mg/day) 752 (666,
1269)
657 (437,
871)
509 (354,
1031) 1000-1200 mg
(35%) Calcium (mg/1000
kcal)
443 (313,
624)
325 (271,
604)
322 (205,
704) 0.3
Iron (mg/day) 15 (11, 21) 15 (13, 20) 11 (9, 16)
8-18 mg
(74.5%) Iron (mg/1000 kcal) 7 (6, 9) 9 (8, 13) 7 (6, 10) 0.2
Sodium (mg/day) 2619 (2233,
3400)
1971 (1620,
3290)
2199 (1529,
2709) <2300 mg
(45%) Sodium (mg/1000
kcal)
1340 (1047,
1791)
1381 (917,
1722)
1365 (1095,
1658) 0.9
Values are expressed as mean (standard deviation) for normal variables and median (1st quartile, 3rd
quartile) for non-normally distributed variables.
Values with the same superscript are significantly different.
* Intake was compared to the Dietary Reference Intakes [212-216].

44
Figure 3: Reported total daily physical activity completed
There was no statistically significant difference in average daily physical activity units completed
between healthy control (HC), simple steatosis (SS), and non-alcoholic steatohepatis (NASH) groups
(HC: n=24; SS: n=11; NASH: n=19).
Figure 4: Reported daily minutes of strenuous and very strenuous physical activity
There was no statistically significant difference in average daily physical activity units completed
between healthy control (HC), simple steatosis (SS), and non-alcoholic steatohepatis (NASH) groups
(HC: n=24; SS: n=11; NASH: n=19).
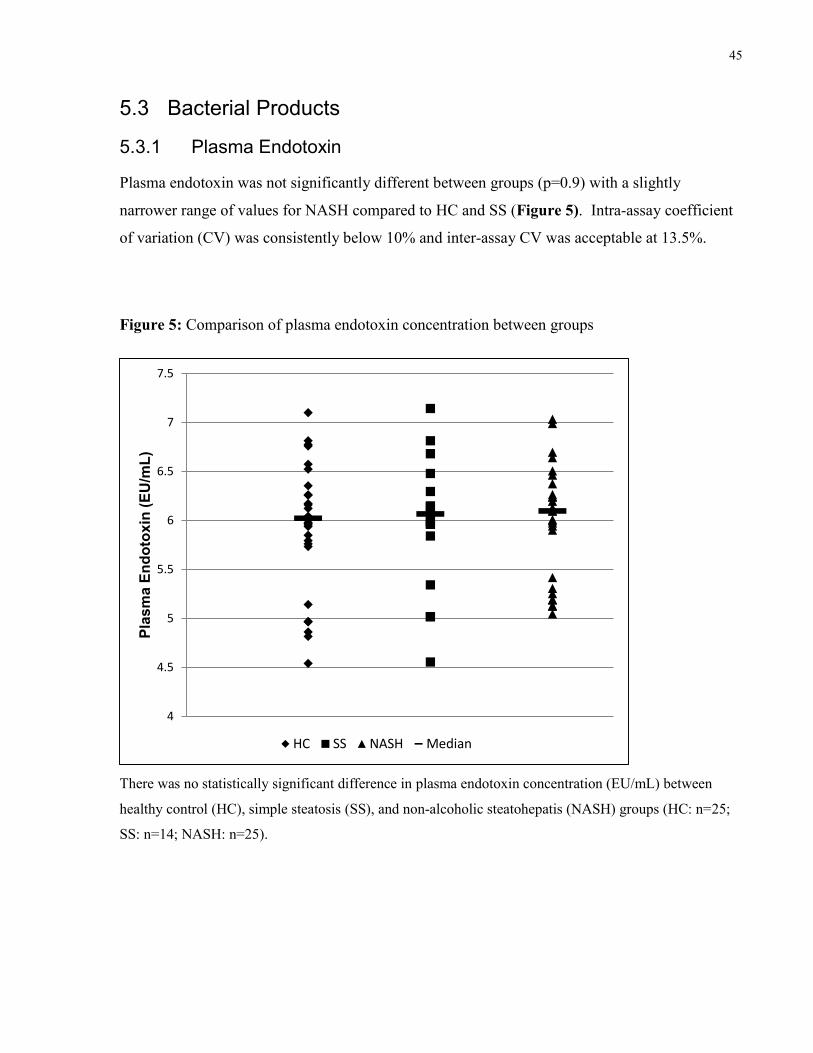
45
5.3 Bacterial Products
5.3.1 Plasma Endotoxin
Plasma endotoxin was not significantly different between groups (p=0.9) with a slightly
narrower range of values for NASH compared to HC and SS (Figure 5). Intra-assay coefficient
of variation (CV) was consistently below 10% and inter-assay CV was acceptable at 13.5%.
Figure 5: Comparison of plasma endotoxin concentration between groups
There was no statistically significant difference in plasma endotoxin concentration (EU/mL) between
healthy control (HC), simple steatosis (SS), and non-alcoholic steatohepatis (NASH) groups (HC: n=25;
SS: n=14; NASH: n=25).
4
4.5
5
5.5
6
6.5
7
7.5
Pla
sm
a E
nd
oto
xin
(E
U/m
L)
HC SS NASH Median

46
5.3.2 Short Chain Fatty Acids and Other Organic Acids
Our secondary outcome, fecal butyric acid, was not significantly different between groups
(p=0.4) (Figure 6). Along with butyric acid the other main SCFA, propionate and acetate
(measured as acetic acid), were also examined. Fecal propionate was significantly higher in SS
patients than in HC (Figure 7). Fecal acetic acid and serum acetic acid did not differ between
groups, p=0.19 and p=0.09 respectively (Figure 8 and 9).
The small number of subjects per group, particularly for SS, and the absence of significant
differences between the three disease groups despite a tendency for SS and NASH values to be
similar and HC to be different from SS and NASH led us to suspect that there might have not
been sufficient power for 3-way comparisons. We therefore chose to combine the SS and NASH
group into one NAFLD group for further metabolite analyses. Comparisons between HC and
NAFLD for the above SCFA and other related organic acids are displayed below in Table 12.
When comparing these organic acids between HC and NAFLD subjects, total fecal SCFA, fecal
propionate and isobutyric acid and serum 2-hydroxybutyrate were all significantly higher in
NAFLD patients versus HC. The ratio of median acetate:propionate:butyrate in fecal samples for
HC was 62.4:22.6:15.0 and was similar for NAFLD patients with a ratio of 61.5:22.6:15.9.

47
Figure 6: Comparison of fecal butyric acid between groups
There was no statistically significant difference in fecal butyric acid concentration (µM) between healthy
control (HC), simple steatosis (SS), and non-alcoholic steatohepatis (NASH) groups (HC: n=28; SS:
n=14; NASH: n=24).
Figure 7: Comparison of fecal propionate between groups
Patients with simple steatosis (SS) had a significantly higher fecal propionate concentration (µM) than
healthy controls (HC). HC and SS patients did not have a significantly different fecal propionate
concentration than non-alcoholic steatohepatitis (NASH) patients (HC: n=28; SS: n=14; NASH: n=24).
0
1000
2000
3000
4000
5000
6000
7000
8000F
ecal B
uty
ric A
cid
(µ
M)
HC SS NASH Median
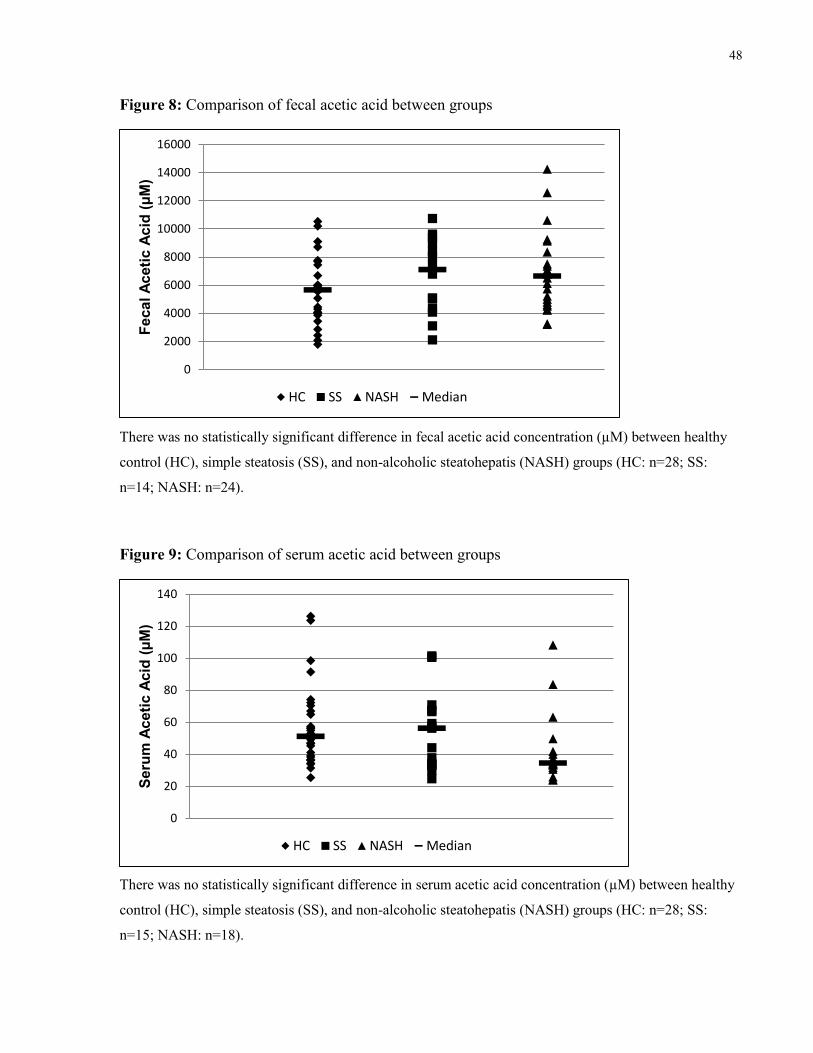
48
Figure 8: Comparison of fecal acetic acid between groups
There was no statistically significant difference in fecal acetic acid concentration (µM) between healthy
control (HC), simple steatosis (SS), and non-alcoholic steatohepatis (NASH) groups (HC: n=28; SS:
n=14; NASH: n=24).
Figure 9: Comparison of serum acetic acid between groups
There was no statistically significant difference in serum acetic acid concentration (µM) between healthy
control (HC), simple steatosis (SS), and non-alcoholic steatohepatis (NASH) groups (HC: n=28; SS:
n=15; NASH: n=18).
0
2000
4000
6000
8000
10000
12000
14000
16000F
ecal A
ceti
c A
cid
(µ
M)
HC SS NASH Median
0
20
40
60
80
100
120
140
Seru
m A
ceti
c A
cid
(µ
M)
HC SS NASH Median
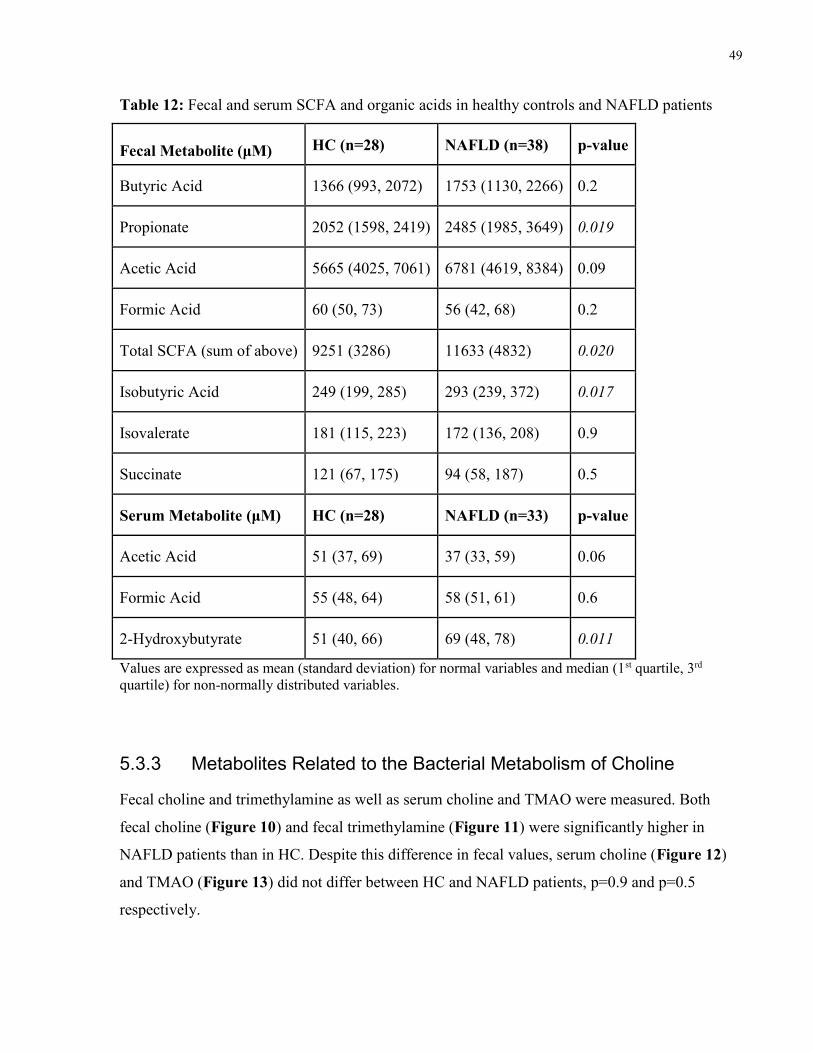
49
Table 12: Fecal and serum SCFA and organic acids in healthy controls and NAFLD patients
Fecal Metabolite (μM) HC (n=28) NAFLD (n=38) p-value
Butyric Acid 1366 (993, 2072) 1753 (1130, 2266) 0.2
Propionate 2052 (1598, 2419) 2485 (1985, 3649) 0.019
Acetic Acid 5665 (4025, 7061) 6781 (4619, 8384) 0.09
Formic Acid 60 (50, 73) 56 (42, 68) 0.2
Total SCFA (sum of above) 9251 (3286) 11633 (4832) 0.020
Isobutyric Acid 249 (199, 285) 293 (239, 372) 0.017
Isovalerate 181 (115, 223) 172 (136, 208) 0.9
Succinate 121 (67, 175) 94 (58, 187) 0.5
Serum Metabolite (μM) HC (n=28) NAFLD (n=33) p-value
Acetic Acid 51 (37, 69) 37 (33, 59) 0.06
Formic Acid 55 (48, 64) 58 (51, 61) 0.6
2-Hydroxybutyrate 51 (40, 66) 69 (48, 78) 0.011
Values are expressed as mean (standard deviation) for normal variables and median (1st quartile, 3rd
quartile) for non-normally distributed variables.
5.3.3 Metabolites Related to the Bacterial Metabolism of Choline
Fecal choline and trimethylamine as well as serum choline and TMAO were measured. Both
fecal choline (Figure 10) and fecal trimethylamine (Figure 11) were significantly higher in
NAFLD patients than in HC. Despite this difference in fecal values, serum choline (Figure 12)
and TMAO (Figure 13) did not differ between HC and NAFLD patients, p=0.9 and p=0.5
respectively.
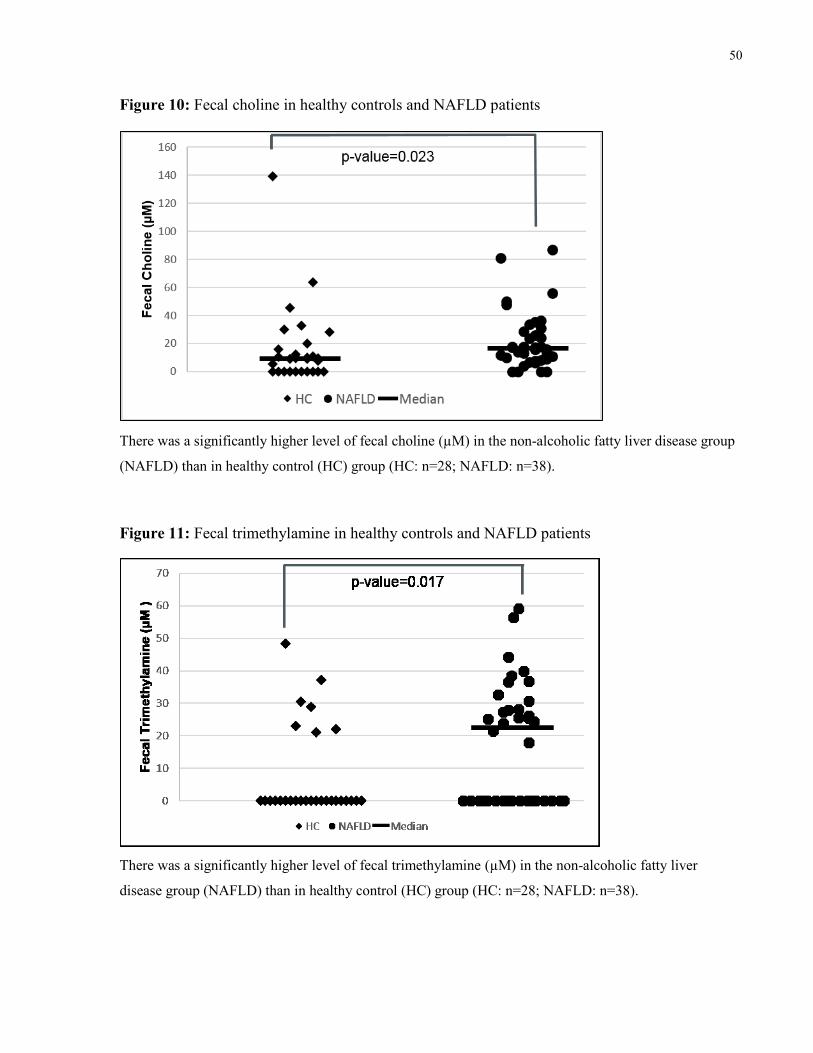
50
Figure 10: Fecal choline in healthy controls and NAFLD patients
There was a significantly higher level of fecal choline (µM) in the non-alcoholic fatty liver disease group
(NAFLD) than in healthy control (HC) group (HC: n=28; NAFLD: n=38).
Figure 11: Fecal trimethylamine in healthy controls and NAFLD patients
There was a significantly higher level of fecal trimethylamine (µM) in the non-alcoholic fatty liver
disease group (NAFLD) than in healthy control (HC) group (HC: n=28; NAFLD: n=38).
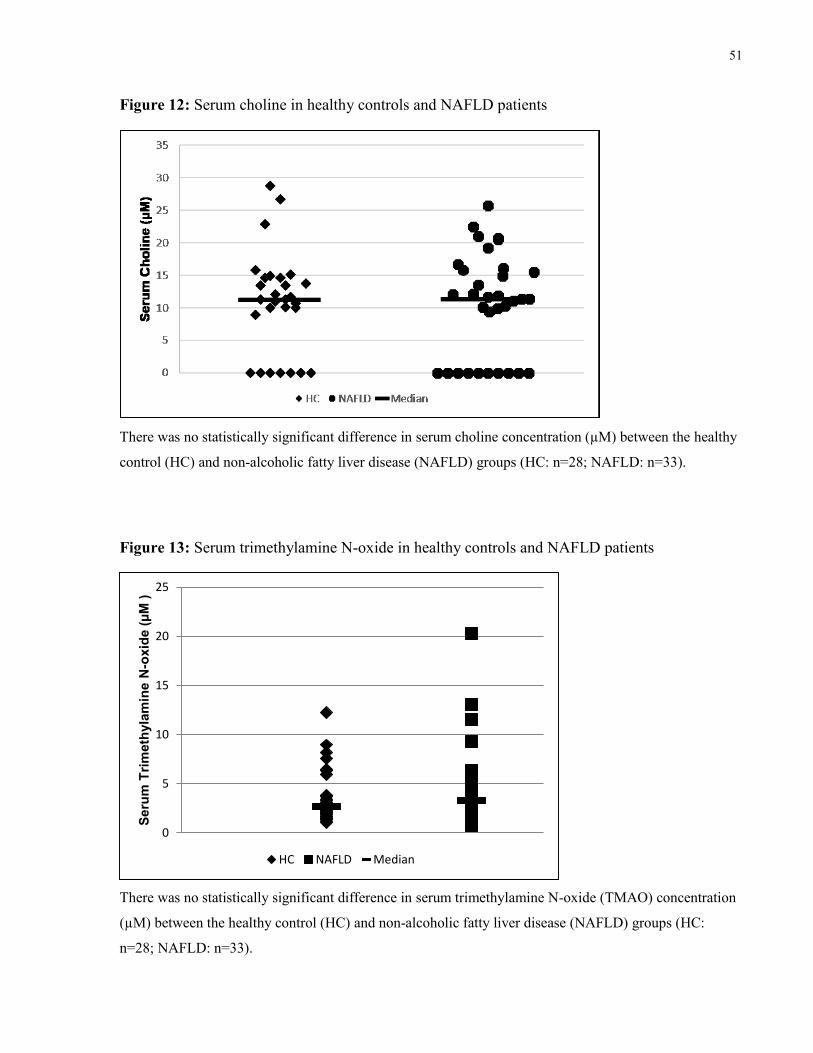
51
Figure 12: Serum choline in healthy controls and NAFLD patients
There was no statistically significant difference in serum choline concentration (µM) between the healthy
control (HC) and non-alcoholic fatty liver disease (NAFLD) groups (HC: n=28; NAFLD: n=33).
Figure 13: Serum trimethylamine N-oxide in healthy controls and NAFLD patients
There was no statistically significant difference in serum trimethylamine N-oxide (TMAO) concentration
(µM) between the healthy control (HC) and non-alcoholic fatty liver disease (NAFLD) groups (HC:
n=28; NAFLD: n=33).
0
5
10
15
20
25
Seru
m T
rim
eth
yla
min
e N
-ox
ide (
µM
)
HC NAFLD Median
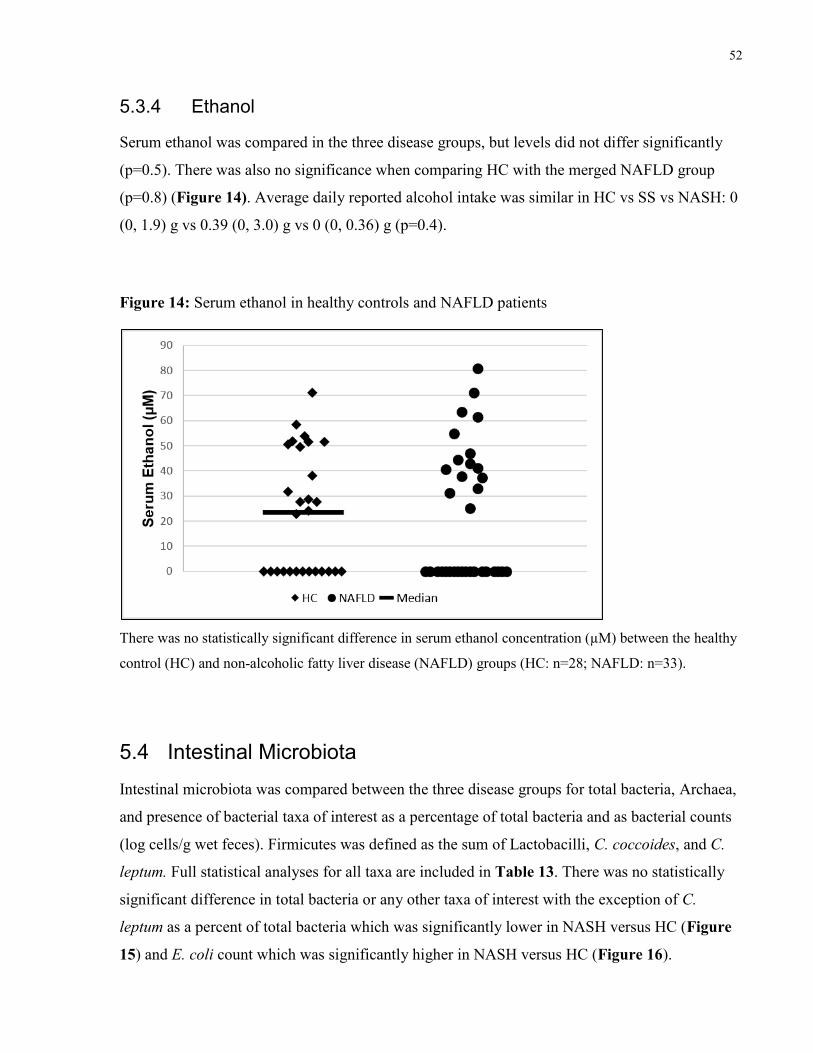
52
5.3.4 Ethanol
Serum ethanol was compared in the three disease groups, but levels did not differ significantly
(p=0.5). There was also no significance when comparing HC with the merged NAFLD group
(p=0.8) (Figure 14). Average daily reported alcohol intake was similar in HC vs SS vs NASH: 0
(0, 1.9) g vs 0.39 (0, 3.0) g vs 0 (0, 0.36) g (p=0.4).
Figure 14: Serum ethanol in healthy controls and NAFLD patients
There was no statistically significant difference in serum ethanol concentration (µM) between the healthy
control (HC) and non-alcoholic fatty liver disease (NAFLD) groups (HC: n=28; NAFLD: n=33).
5.4 Intestinal Microbiota
Intestinal microbiota was compared between the three disease groups for total bacteria, Archaea,
and presence of bacterial taxa of interest as a percentage of total bacteria and as bacterial counts
(log cells/g wet feces). Firmicutes was defined as the sum of Lactobacilli, C. coccoides, and C.
leptum. Full statistical analyses for all taxa are included in Table 13. There was no statistically
significant difference in total bacteria or any other taxa of interest with the exception of C.
leptum as a percent of total bacteria which was significantly lower in NASH versus HC (Figure
15) and E. coli count which was significantly higher in NASH versus HC (Figure 16).
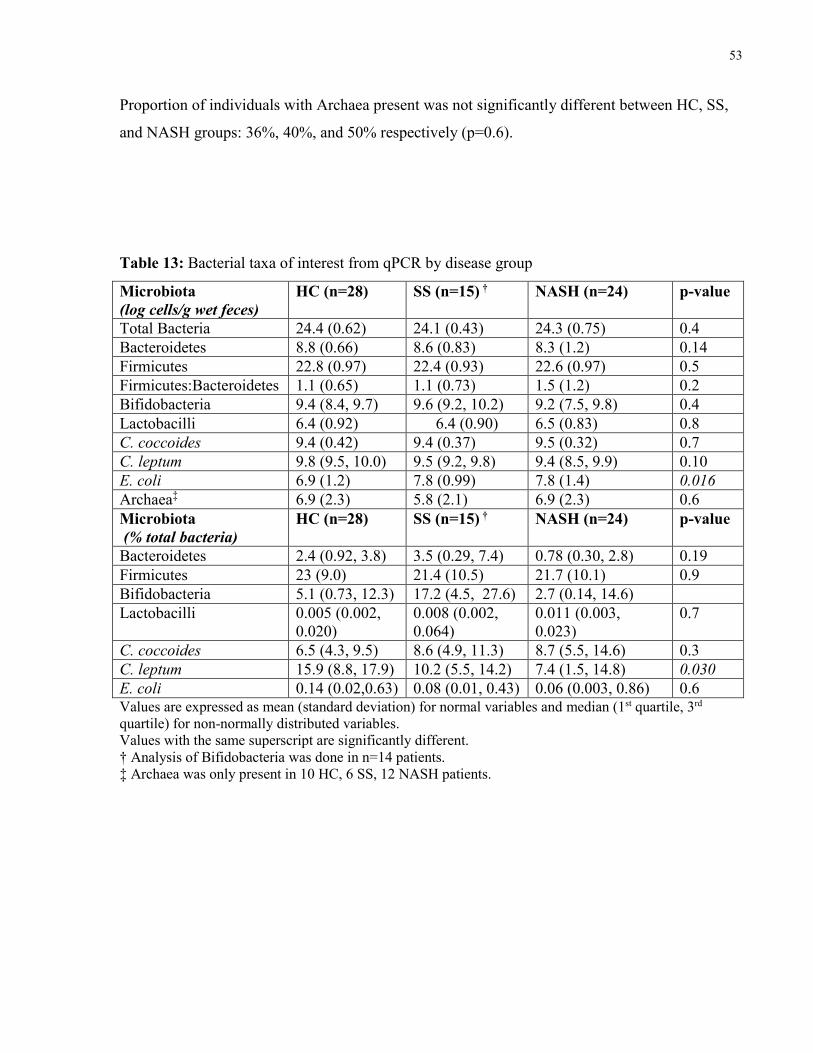
53
Proportion of individuals with Archaea present was not significantly different between HC, SS,
and NASH groups: 36%, 40%, and 50% respectively (p=0.6).
Table 13: Bacterial taxa of interest from qPCR by disease group
Microbiota
(log cells/g wet feces)
HC (n=28) SS (n=15) † NASH (n=24) p-value
Total Bacteria 24.4 (0.62) 24.1 (0.43) 24.3 (0.75) 0.4
Bacteroidetes 8.8 (0.66) 8.6 (0.83) 8.3 (1.2) 0.14
Firmicutes 22.8 (0.97) 22.4 (0.93) 22.6 (0.97) 0.5
Firmicutes:Bacteroidetes 1.1 (0.65) 1.1 (0.73) 1.5 (1.2) 0.2
Bifidobacteria 9.4 (8.4, 9.7) 9.6 (9.2, 10.2) 9.2 (7.5, 9.8) 0.4
Lactobacilli 6.4 (0.92) 6.4 (0.90) 6.5 (0.83) 0.8
C. coccoides 9.4 (0.42) 9.4 (0.37) 9.5 (0.32) 0.7
C. leptum 9.8 (9.5, 10.0) 9.5 (9.2, 9.8) 9.4 (8.5, 9.9) 0.10
E. coli 6.9 (1.2) 7.8 (0.99) 7.8 (1.4) 0.016
Archaea‡ 6.9 (2.3) 5.8 (2.1) 6.9 (2.3) 0.6
Microbiota
(% total bacteria)
HC (n=28) SS (n=15) † NASH (n=24) p-value
Bacteroidetes 2.4 (0.92, 3.8) 3.5 (0.29, 7.4) 0.78 (0.30, 2.8) 0.19
Firmicutes 23 (9.0) 21.4 (10.5) 21.7 (10.1) 0.9
Bifidobacteria 5.1 (0.73, 12.3) 17.2 (4.5, 27.6) 2.7 (0.14, 14.6)
Lactobacilli 0.005 (0.002,
0.020)
0.008 (0.002,
0.064)
0.011 (0.003,
0.023)
0.7
C. coccoides 6.5 (4.3, 9.5) 8.6 (4.9, 11.3) 8.7 (5.5, 14.6) 0.3
C. leptum 15.9 (8.8, 17.9) 10.2 (5.5, 14.2) 7.4 (1.5, 14.8) 0.030
E. coli 0.14 (0.02,0.63) 0.08 (0.01, 0.43) 0.06 (0.003, 0.86) 0.6 Values are expressed as mean (standard deviation) for normal variables and median (1st quartile, 3rd
quartile) for non-normally distributed variables.
Values with the same superscript are significantly different.
† Analysis of Bifidobacteria was done in n=14 patients.
‡ Archaea was only present in 10 HC, 6 SS, 12 NASH patients.
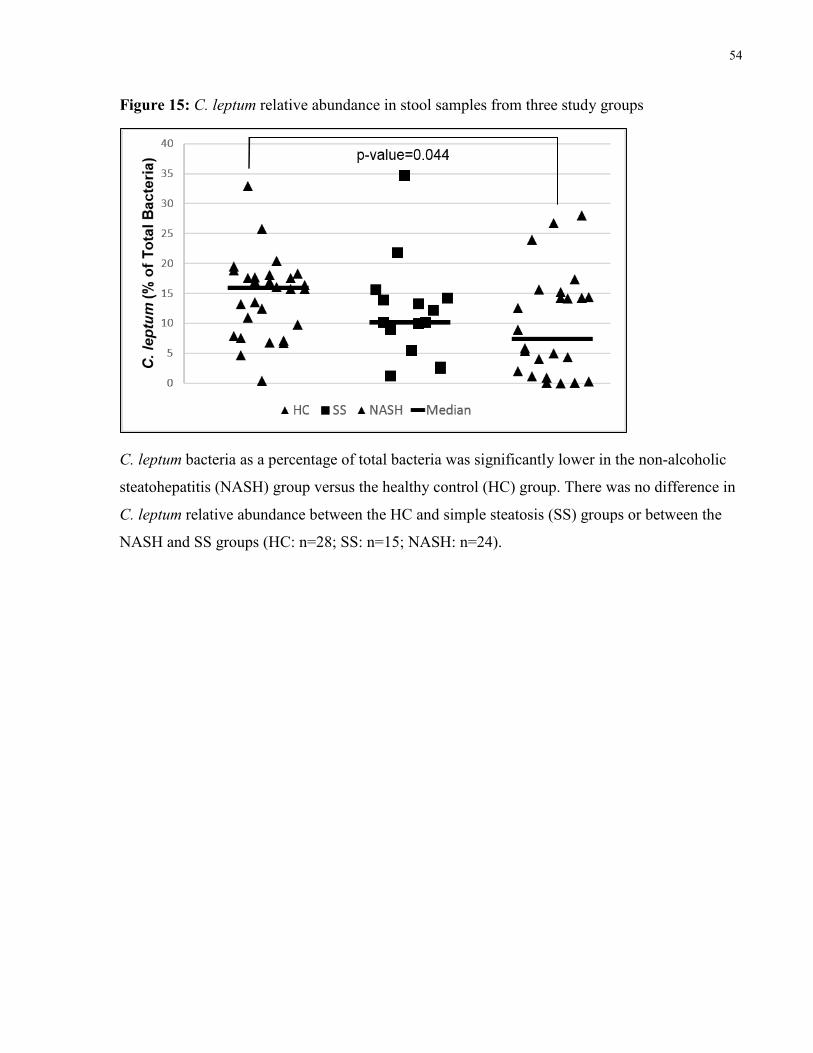
54
Figure 15: C. leptum relative abundance in stool samples from three study groups
C. leptum bacteria as a percentage of total bacteria was significantly lower in the non-alcoholic
steatohepatitis (NASH) group versus the healthy control (HC) group. There was no difference in
C. leptum relative abundance between the HC and simple steatosis (SS) groups or between the
NASH and SS groups (HC: n=28; SS: n=15; NASH: n=24).
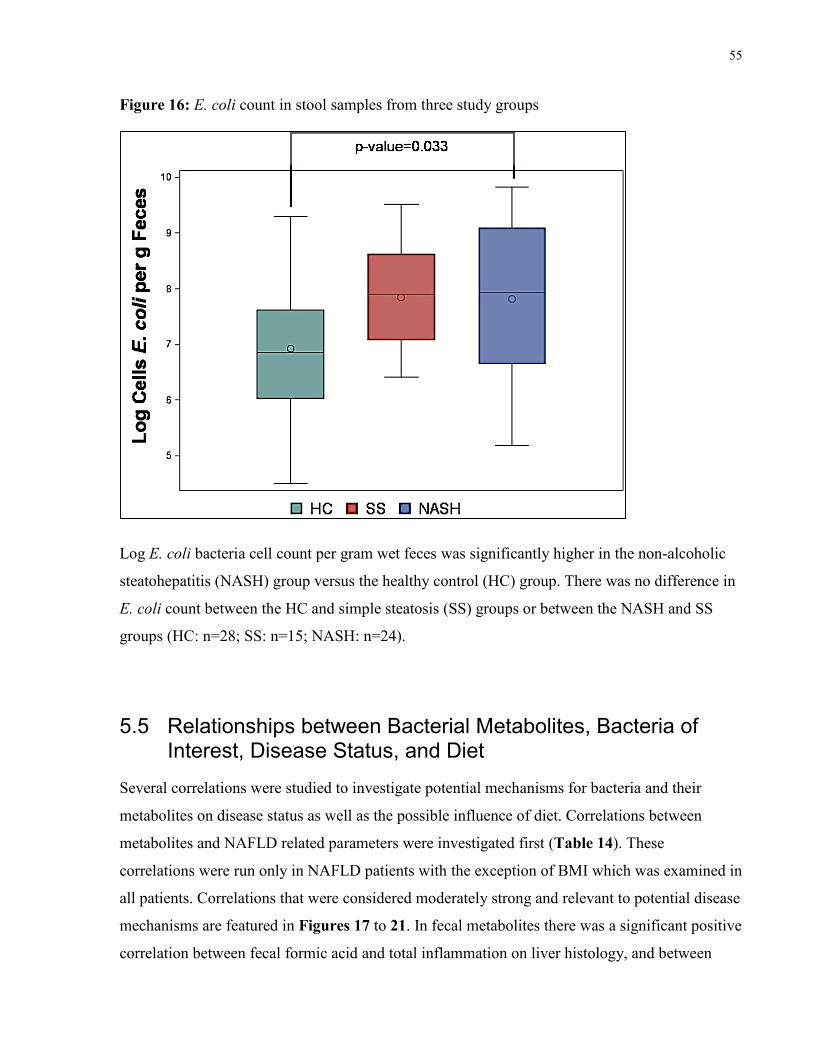
55
Figure 16: E. coli count in stool samples from three study groups
Log E. coli bacteria cell count per gram wet feces was significantly higher in the non-alcoholic
steatohepatitis (NASH) group versus the healthy control (HC) group. There was no difference in
E. coli count between the HC and simple steatosis (SS) groups or between the NASH and SS
groups (HC: n=28; SS: n=15; NASH: n=24).
5.5 Relationships between Bacterial Metabolites, Bacteria of Interest, Disease Status, and Diet
Several correlations were studied to investigate potential mechanisms for bacteria and their
metabolites on disease status as well as the possible influence of diet. Correlations between
metabolites and NAFLD related parameters were investigated first (Table 14). These
correlations were run only in NAFLD patients with the exception of BMI which was examined in
all patients. Correlations that were considered moderately strong and relevant to potential disease
mechanisms are featured in Figures 17 to 21. In fecal metabolites there was a significant positive
correlation between fecal formic acid and total inflammation on liver histology, and between
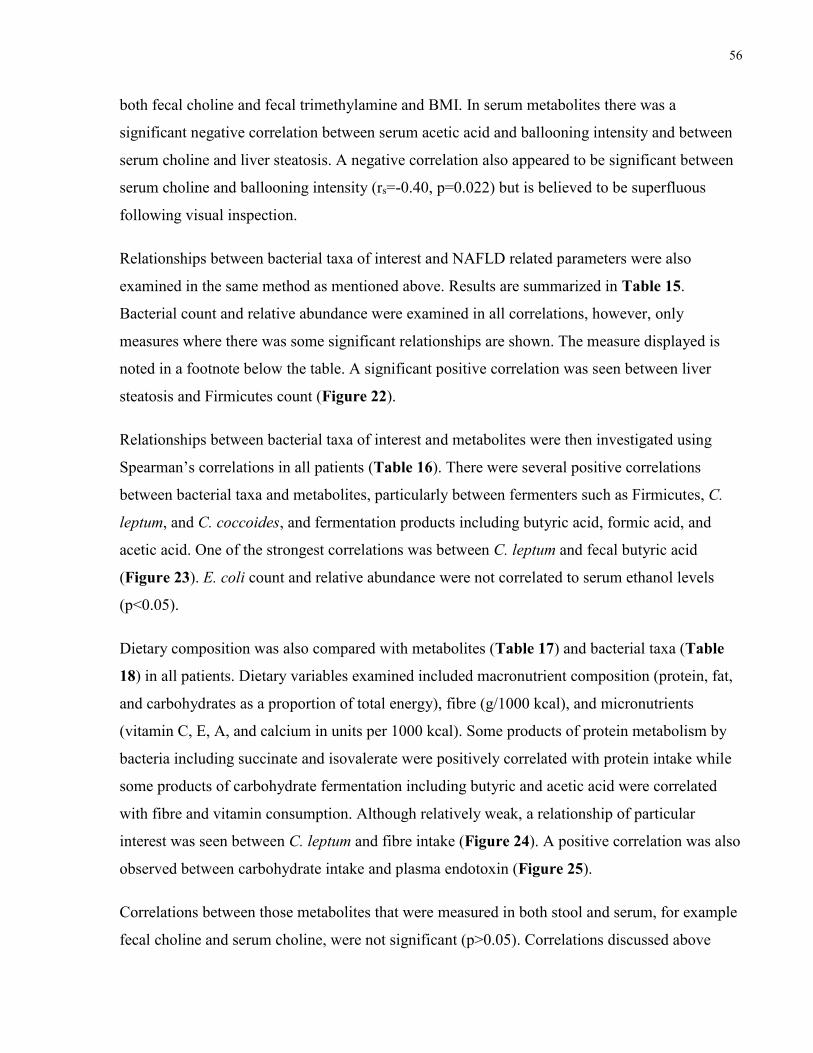
56
both fecal choline and fecal trimethylamine and BMI. In serum metabolites there was a
significant negative correlation between serum acetic acid and ballooning intensity and between
serum choline and liver steatosis. A negative correlation also appeared to be significant between
serum choline and ballooning intensity (rs=-0.40, p=0.022) but is believed to be superfluous
following visual inspection.
Relationships between bacterial taxa of interest and NAFLD related parameters were also
examined in the same method as mentioned above. Results are summarized in Table 15.
Bacterial count and relative abundance were examined in all correlations, however, only
measures where there was some significant relationships are shown. The measure displayed is
noted in a footnote below the table. A significant positive correlation was seen between liver
steatosis and Firmicutes count (Figure 22).
Relationships between bacterial taxa of interest and metabolites were then investigated using
Spearman’s correlations in all patients (Table 16). There were several positive correlations
between bacterial taxa and metabolites, particularly between fermenters such as Firmicutes, C.
leptum, and C. coccoides, and fermentation products including butyric acid, formic acid, and
acetic acid. One of the strongest correlations was between C. leptum and fecal butyric acid
(Figure 23). E. coli count and relative abundance were not correlated to serum ethanol levels
(p<0.05).
Dietary composition was also compared with metabolites (Table 17) and bacterial taxa (Table
18) in all patients. Dietary variables examined included macronutrient composition (protein, fat,
and carbohydrates as a proportion of total energy), fibre (g/1000 kcal), and micronutrients
(vitamin C, E, A, and calcium in units per 1000 kcal). Some products of protein metabolism by
bacteria including succinate and isovalerate were positively correlated with protein intake while
some products of carbohydrate fermentation including butyric and acetic acid were correlated
with fibre and vitamin consumption. Although relatively weak, a relationship of particular
interest was seen between C. leptum and fibre intake (Figure 24). A positive correlation was also
observed between carbohydrate intake and plasma endotoxin (Figure 25).
Correlations between those metabolites that were measured in both stool and serum, for example
fecal choline and serum choline, were not significant (p>0.05). Correlations discussed above

57
were also done for HC and NAFLD groups separately in an attempt to investigate differences in
bacterial metabolism. Relationships were generally similar between disease groups.
Table 14: Correlation between fecal and blood metabolites and NAFLD related parameters
Fecal Metabolite
Steatosis
(%) Fibrosis
Total
Inflammation
Lobular
Inflammation
Ballooning
Intensity NAS
HOMA-
IR BMI
Butyric Acid NS NS NS NS NS NS NS NS
Propionate NS NS NS NS NS NS NS NS
Acetic Acid NS NS NS NS NS NS NS NS
Formic Acid NS NS
rs=0.61
p=0.015
n=15
NS NS NS NS NS
Isobutyric Acid NS NS NS NS NS NS NS NS
Isovalerate NS NS NS NS NS NS
rs=0.36
p=0.040
n=32
NS
Succinate NS NS NS NS NS NS NS NS
Choline NS NS NS NS NS NS NS
rs=0.43
p=0.0003
N=66
Trimethylamine NS NS NS NS NS NS NS
rs=0.32
p=0.010
N=66
Blood Metabolite Steatosis
(%) Fibrosis
Total
Inflammation
Lobular
Inflammation
Ballooning
Intensity NAS
HOMA-
IR BMI
Acetic Acid NS NS NS NS
rs=-0.44
p=0.012
n=32
NS NS NS
Formic Acid NS NS NS NS NS NS NS NS
2-
Hydroxybutyrate NS NS NS NS NS NS NS
rs=0.37
p=0.003
n=61
Ethanol NS NS NS NS NS NS NS NS
Choline
rs=-0.40
p=0.022
n=32
NS NS NS
rs=-0.40
p=0.022
n=32
rs=-0.48
p=0.005
n=32
NS NS
TMAO NS
rs=0.38
p=0.025
n=34
NS NS NS NS NS NS
Endotoxin NS NS NS NS NS NS NS NS
Correlations are for NAFLD patients only for all parameters except for BMI which was compared in all
patients.
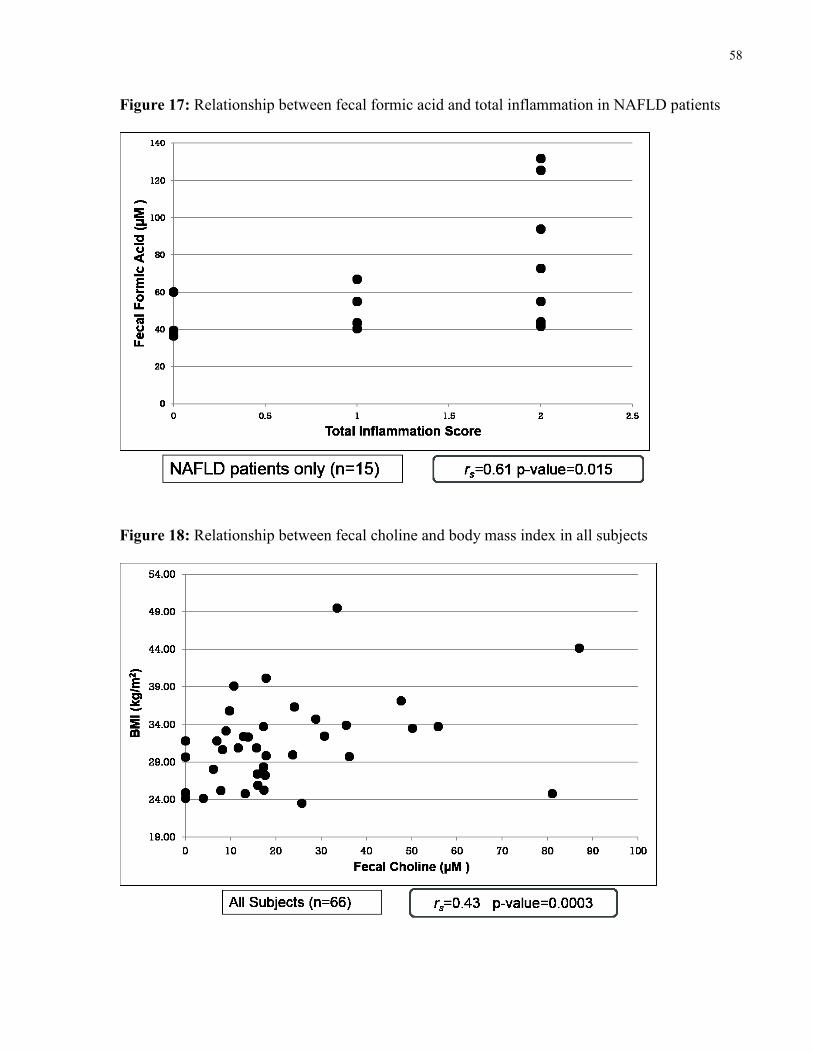
58
Figure 17: Relationship between fecal formic acid and total inflammation in NAFLD patients
Figure 18: Relationship between fecal choline and body mass index in all subjects

59
Figure 19: Relationship between fecal trimethylamine and body mass index in all subjects
Figure 20: Relationship between serum acetic acid and hepatocyte ballooning intensity in
NAFLD patients

60
Figure 21: Relationship between serum choline and liver steatosis in NAFLD patients
Table 15: Correlation between intestinal microbiota by qPCR and NAFLD related parameters
Steatosis
(%) Fibrosis
Total
Inflammation
Lobular
Inflammation
Ballooning
Intensity NAS HOMA-IR BMI
Bacteroidetes NS NS NS NS NS NS NS NS
Lactobacilli NS NS NS NS NS NS NS NS
C. coccoides NS NS NS NS NS NS NS NS
C. leptum
rs=0.41
p=0.012
n=38
NS NS NS NS NS NS NS
Bifidobacteria NS NS NS NS NS NS NS NS
E. coli NS NS NS NS NS NS NS
rs=0.25
p=0.038
n=67
Archaea NS NS NS NS NS NS
rs=0.48
p=0.005
n=33
NS
Firmicutes
rs=0.47
p=0.003
n=38
NS NS NS NS NS NS NS
Correlations are for % of total bacteria except for E. coli and Archaea where count/g wet feces was used.
Correlations are for NAFLD patients only for all parameters except for BMI which was compared in all
patients.

61
Figure 22: Relationship between Firmicutes count and liver steatosis in NAFLD patients
Figure 23: Relationship between C. leptum count and fecal butyric acid in all subjects
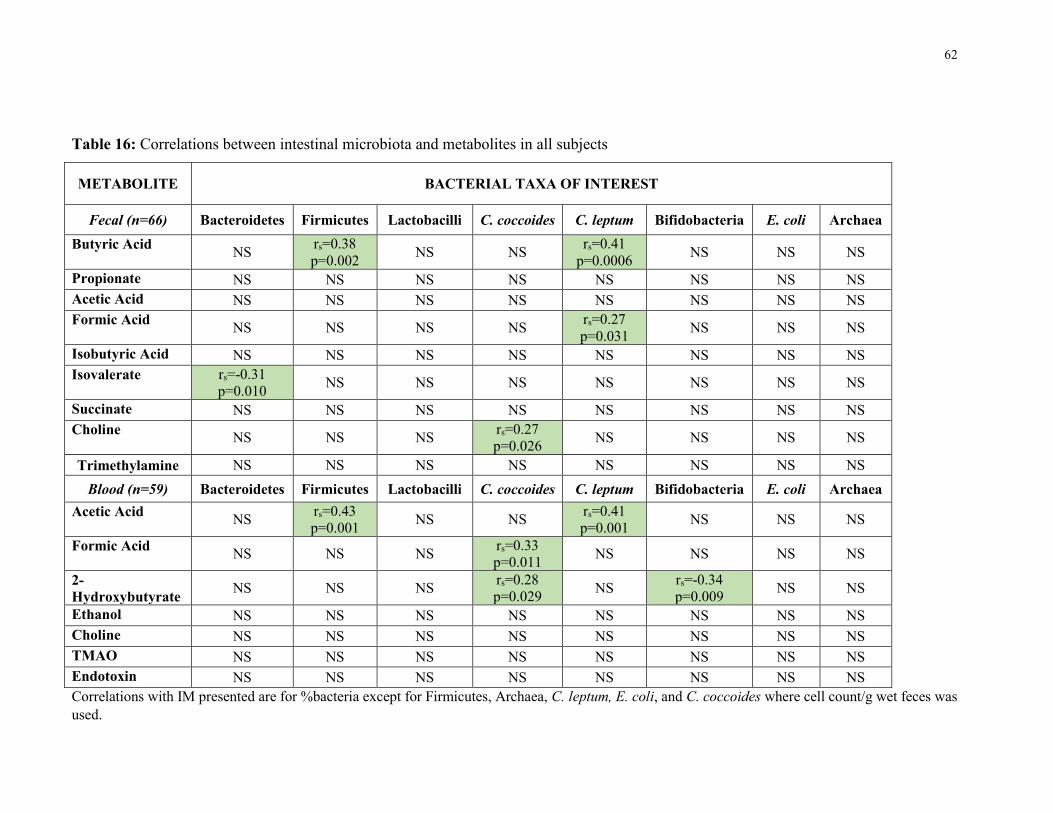
62
Table 16: Correlations between intestinal microbiota and metabolites in all subjects
METABOLITE BACTERIAL TAXA OF INTEREST
Fecal (n=66) Bacteroidetes Firmicutes Lactobacilli C. coccoides C. leptum Bifidobacteria E. coli Archaea
Butyric Acid NS
rs=0.38
p=0.002 NS NS
rs=0.41
p=0.0006 NS NS NS
Propionate NS NS NS NS NS NS NS NS
Acetic Acid NS NS NS NS NS NS NS NS
Formic Acid NS NS NS NS
rs=0.27
p=0.031 NS NS NS
Isobutyric Acid NS NS NS NS NS NS NS NS
Isovalerate rs=-0.31
p=0.010 NS NS NS NS NS NS NS
Succinate NS NS NS NS NS NS NS NS
Choline NS NS NS
rs=0.27
p=0.026 NS NS NS NS
Trimethylamine NS NS NS NS NS NS NS NS
Blood (n=59) Bacteroidetes Firmicutes Lactobacilli C. coccoides C. leptum Bifidobacteria E. coli Archaea
Acetic Acid NS
rs=0.43
p=0.001 NS NS
rs=0.41
p=0.001 NS NS NS
Formic Acid NS NS NS
rs=0.33
p=0.011 NS NS NS NS
2-
Hydroxybutyrate NS NS NS
rs=0.28
p=0.029 NS
rs=-0.34
p=0.009 NS NS
Ethanol NS NS NS NS NS NS NS NS
Choline NS NS NS NS NS NS NS NS
TMAO NS NS NS NS NS NS NS NS
Endotoxin NS NS NS NS NS NS NS NS
Correlations with IM presented are for %bacteria except for Firmicutes, Archaea, C. leptum, E. coli, and C. coccoides where cell count/g wet feces was
used.
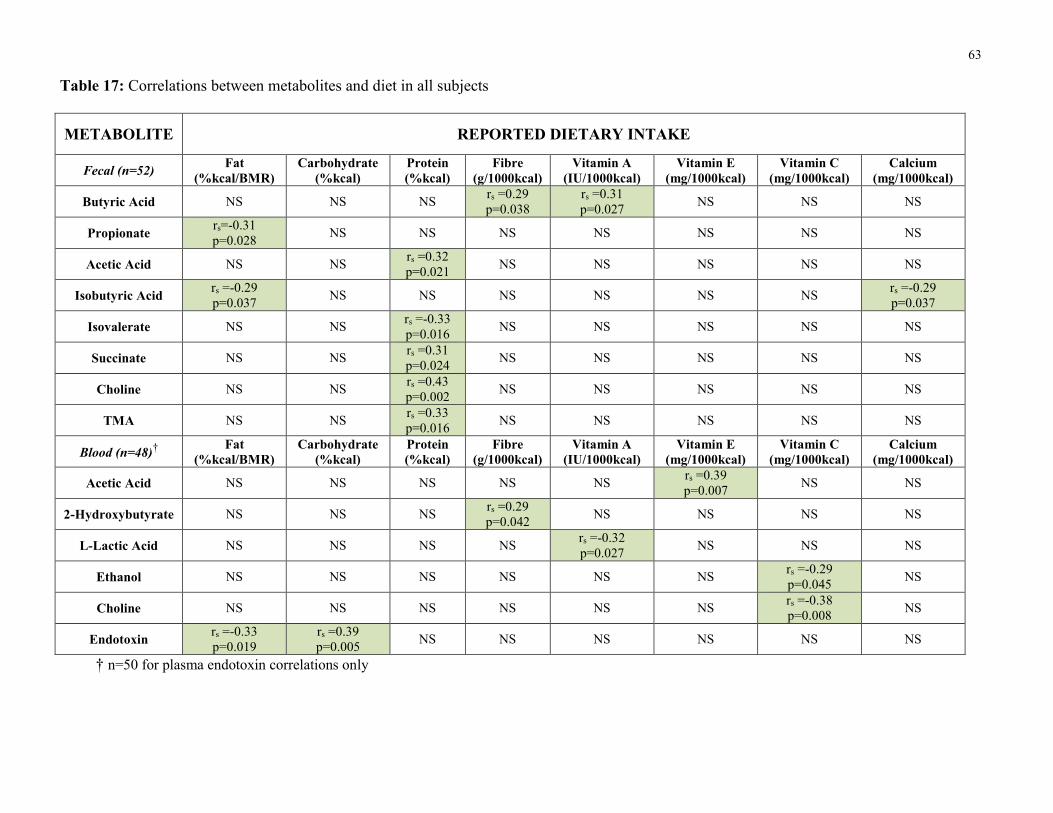
63
Table 17: Correlations between metabolites and diet in all subjects
METABOLITE REPORTED DIETARY INTAKE
Fecal (n=52) Fat
(%kcal/BMR)
Carbohydrate
(%kcal)
Protein
(%kcal)
Fibre
(g/1000kcal)
Vitamin A
(IU/1000kcal)
Vitamin E
(mg/1000kcal)
Vitamin C
(mg/1000kcal)
Calcium
(mg/1000kcal)
Butyric Acid NS NS NS rs =0.29
p=0.038
rs =0.31
p=0.027 NS NS NS
Propionate rs=-0.31
p=0.028 NS NS NS NS NS NS NS
Acetic Acid NS NS rs =0.32
p=0.021 NS NS NS NS NS
Isobutyric Acid rs =-0.29
p=0.037 NS NS NS NS NS NS
rs =-0.29
p=0.037
Isovalerate NS NS rs =-0.33
p=0.016 NS NS NS NS NS
Succinate NS NS rs =0.31
p=0.024 NS NS NS NS NS
Choline NS NS rs =0.43
p=0.002 NS NS NS NS NS
TMA NS NS rs =0.33
p=0.016 NS NS NS NS NS
Blood (n=48)†
Fat
(%kcal/BMR)
Carbohydrate
(%kcal)
Protein
(%kcal)
Fibre
(g/1000kcal)
Vitamin A
(IU/1000kcal)
Vitamin E
(mg/1000kcal)
Vitamin C
(mg/1000kcal)
Calcium
(mg/1000kcal)
Acetic Acid NS NS NS NS NS rs =0.39
p=0.007 NS NS
2-Hydroxybutyrate NS NS NS rs =0.29
p=0.042 NS NS NS NS
L-Lactic Acid NS NS NS NS rs =-0.32
p=0.027 NS NS NS
Ethanol NS NS NS NS NS NS rs =-0.29
p=0.045 NS
Choline NS NS NS NS NS NS rs =-0.38
p=0.008 NS
Endotoxin rs =-0.33
p=0.019
rs =0.39
p=0.005 NS NS NS NS NS NS
† n=50 for plasma endotoxin correlations only

64
Table 18: Correlations between intestinal microbiota by qPCR and diet in all subjects
Bacterial Taxa
of Interest
Fat
(%kcal/BMR)
Carbohydrate
(%kcal)
Protein
(%kcal)
Fibre
(g/1000kcal)
Vitamin A
(IU/1000kcal)
Vitamin E
(mg/1000kcal)
Vitamin C
(mg/1000kcal)
Calcium
(mg/1000kcal)
Bacteroidetes NS NS NS NS NS NS NS NS
Lactobacilli NS NS NS NS NS NS NS NS
C. coccoides NS NS NS NS NS NS NS NS
C. leptum NS NS NS rs=0.29
p=0.032
n=53
rs=0.33
p=0.015
n=53
NS
rs=0.38
p=0.005
n=53
rs=0.33
p=0.015
n=53
Bifidobacteria NS NS NS NS NS NS NS NS
E. coli NS NS NS NS NS NS NS NS
Archaea NS NS NS NS NS NS NS NS
Firmicutes NS NS NS NS
rs=0.38
p=0.005
n=53
NS
rs=0.33
p=0.016
n=53
NS
Correlations with IM displayed are for bacterial taxa as a percent of total bacteria except for Firmicutes, E. coli and Archea where count/g
wet feces is shown.
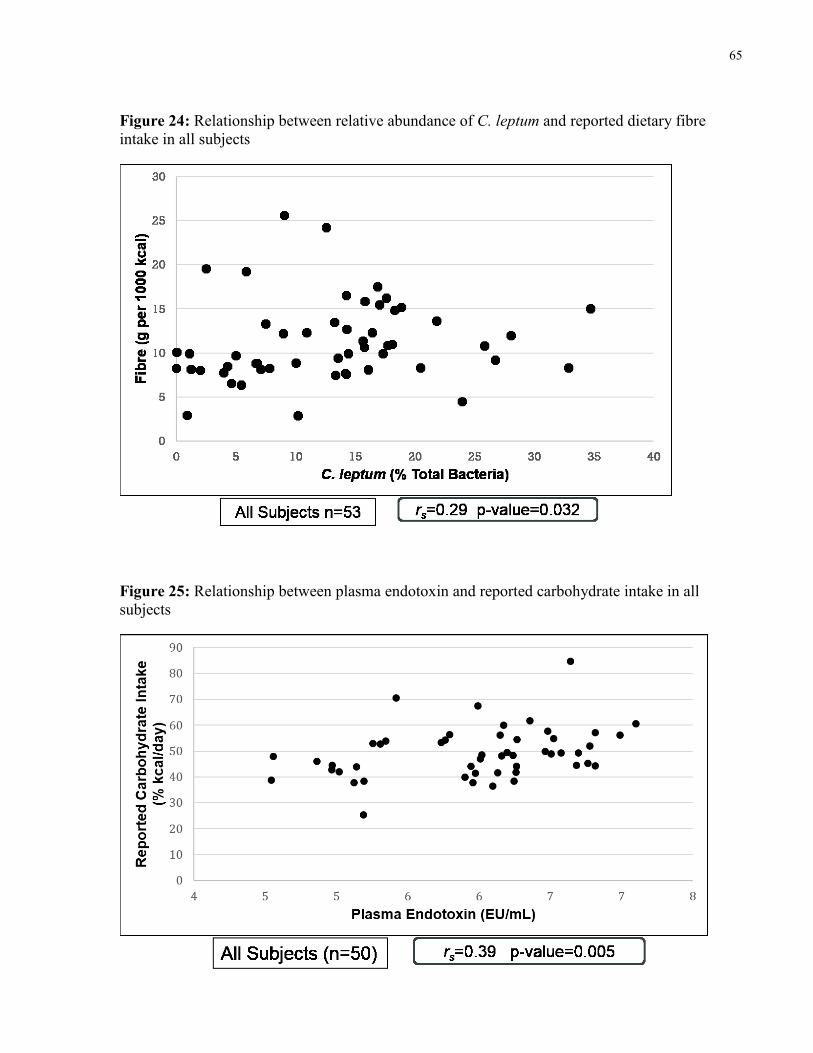
65
Figure 24: Relationship between relative abundance of C. leptum and reported dietary fibre
intake in all subjects
Figure 25: Relationship between plasma endotoxin and reported carbohydrate intake in all
subjects
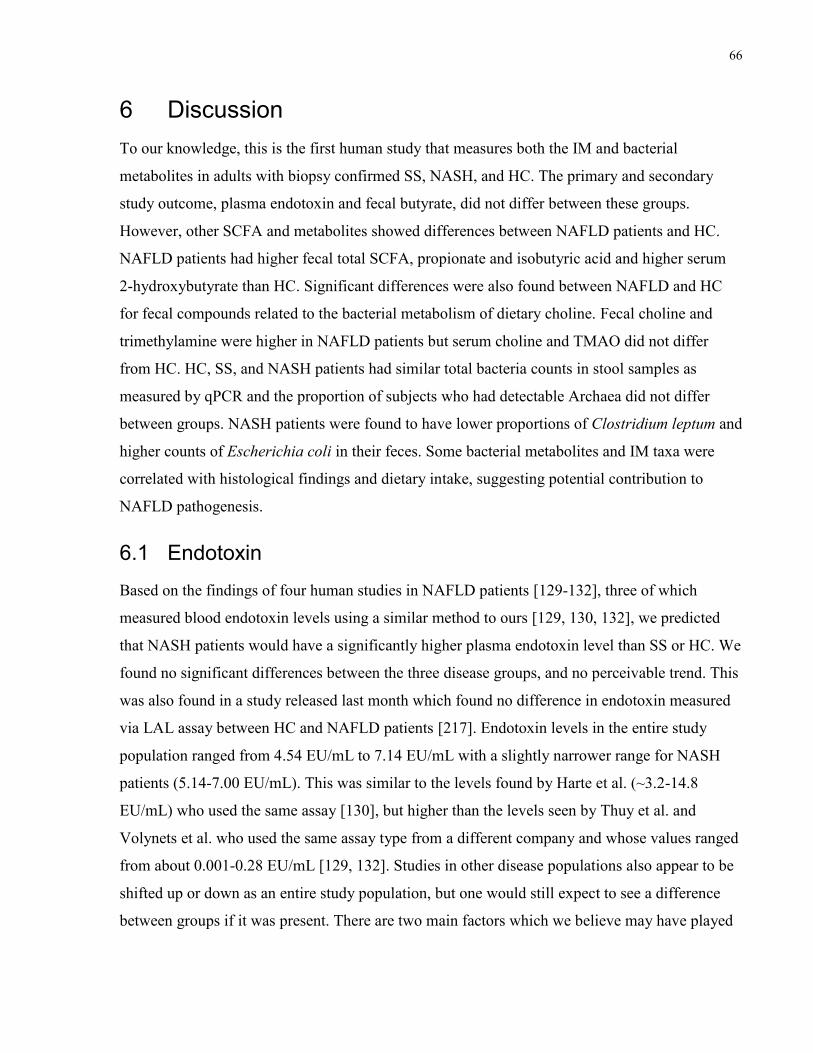
66
6 Discussion
To our knowledge, this is the first human study that measures both the IM and bacterial
metabolites in adults with biopsy confirmed SS, NASH, and HC. The primary and secondary
study outcome, plasma endotoxin and fecal butyrate, did not differ between these groups.
However, other SCFA and metabolites showed differences between NAFLD patients and HC.
NAFLD patients had higher fecal total SCFA, propionate and isobutyric acid and higher serum
2-hydroxybutyrate than HC. Significant differences were also found between NAFLD and HC
for fecal compounds related to the bacterial metabolism of dietary choline. Fecal choline and
trimethylamine were higher in NAFLD patients but serum choline and TMAO did not differ
from HC. HC, SS, and NASH patients had similar total bacteria counts in stool samples as
measured by qPCR and the proportion of subjects who had detectable Archaea did not differ
between groups. NASH patients were found to have lower proportions of Clostridium leptum and
higher counts of Escherichia coli in their feces. Some bacterial metabolites and IM taxa were
correlated with histological findings and dietary intake, suggesting potential contribution to
NAFLD pathogenesis.
6.1 Endotoxin
Based on the findings of four human studies in NAFLD patients [129-132], three of which
measured blood endotoxin levels using a similar method to ours [129, 130, 132], we predicted
that NASH patients would have a significantly higher plasma endotoxin level than SS or HC. We
found no significant differences between the three disease groups, and no perceivable trend. This
was also found in a study released last month which found no difference in endotoxin measured
via LAL assay between HC and NAFLD patients [217]. Endotoxin levels in the entire study
population ranged from 4.54 EU/mL to 7.14 EU/mL with a slightly narrower range for NASH
patients (5.14-7.00 EU/mL). This was similar to the levels found by Harte et al. (~3.2-14.8
EU/mL) who used the same assay [130], but higher than the levels seen by Thuy et al. and
Volynets et al. who used the same assay type from a different company and whose values ranged
from about 0.001-0.28 EU/mL [129, 132]. Studies in other disease populations also appear to be
shifted up or down as an entire study population, but one would still expect to see a difference
between groups if it was present. There are two main factors which we believe may have played
67
a role in the lack of significant differences in endotoxin level between our groups: diet and
disease severity.
Dietary intake was measured in both Thuy et al. and Volynets et al. and in both of these studies
NAFLD patients were found to have a higher dietary intake of carbohydrates, particularly
fructose in Thuy’s study [129, 132]. Volynets also found a positive correlation between
carbohydrate intake and endotoxin level. Although the mechanism for this correlation is unclear
it is possible that in both of these studies the higher endotoxin level in the NAFLD group was
due to higher carbohydrate intake levels rather than disease state. Interestingly, we also found a
positive correlation between plasma endotoxin and dietary carbohydrate intake, but our disease
groups did not differ in levels of carbohydrate intake. It is conceivable therefore that we did not
see a difference in endotoxin between groups because their carbohydrate intake was equal.
Notably a negative correlation was detected in our patients between reported fat intake and
endotoxin level. This is in contradiction to previous animal studies that have found a positive
correlation between these two variables [127, 218-220]. This is thought to be due to a fat
mediated uptake of endotoxin whereby fats are incorporated into chylomicrons, which also have
a high affinity for endotoxin, and therefore endotoxin enters circulation along with chylomicrons
[221, 222]. It is important to note that the blood used for endotoxin analysis in our patients was
drawn after a 12 hour fast therefore recent fat intake would not have had a significant effect on
endotoxin intake. Fat absorption occurs in the small intestine rather than the colon so colonic
endotoxin as a result of microbiota should not be influenced by fat uptake. It is therefore
plausible that this is a superfluous correlation that reflects a dietary composition with high
carbohydrate intake rather than low fat intake being related to higher endotoxin levels.
The third study that measured plasma endotoxin in a NAFLD population did not account for
dietary intake, but endotoxin levels were positively correlated with HOMA-IR [130]. We did see
a difference in HOMA-IR between our HC and NASH group, but the magnitude of this
difference was far lower than that seen in Harte’s study [130]. In their study NASH patients were
much more insulin resistant with a median HOMA-IR of 8.6 whereas our NASH patients only
had a HOMA-IR of 4.26. This is likely because the diabetic individuals in our study were taking
medication and were well controlled. If our patients had poorer control and greater insulin
resistance we may have seen a greater level of endotoxin in this group. A study by Verdam et al.
68
that looked at IgG levels against endotoxin rather than blood endotoxin concentration found that
IgG levels were positively correlated with NASH severity [131]. In our study the NASH patients
had relatively mild disease with a median NAS of only 5 out of a possible 8. It is conceivable
that the severity of the disease was not great enough to cause endotoxin differences between
disease groups.
6.2 SCFA and Related Metabolites
This is the first human study to measure fecal butyric acid in biopsy confirmed NAFLD patients
versus HC. A study by Wong et al. found that NASH patients had a lower prevalence of butyrate
producing Faecalibacterium, but they did not measure butyrate levels [14]. Animal studies
showed beneficial effects of butyrate producing probiotic supplementation including
improvements in weight, steatosis, FFA, inflammation, and reduced intestinal permeability [154,
155]. One of these studies was also able to correlate these beneficial improvements with fecal
and plasma butyrate concentrations [155]. In our study there was no difference in fecal butyrate
between the three groups or between the combined NAFLD group and HC. There was, however,
a significant difference in the prevalence of the butyrate producing C. lepum bacteria, with a
significantly lower relative abundance in NASH patients. This will be discussed separately
below.
It is perhaps naïve to presume that we would see a clear connection between bacterial prevalence
of butyrate producers, fecal butyrate, and disease state. The concentration of fecal SCFA is
frequently used as a proxy for measuring the bacterial production of these compounds, but it
does not account for differences in colonic absorption. We assume that a higher concentration of
fecal butyrate means that more butyrate was produced and more butyrate will therefore be
absorbed in the colon. A study by Vogt and Wolever, however, found otherwise [223]. Vogt and
Wolever conducted a study where subjects infused a SCFA solution into their colon, retained it
for several minutes, and then voided. Absorption of the three main SCFA as well as
combinations thereof were measured and compared with SCFA composition in the subject’s
normal feces. They found that the acetate absorption from the colonic infusion was negatively
correlated with acetate concentration in normal stools and that other SCFA did not have
significant correlation between these two measures [223]. This could mean that a lower fecal
concentration of a certain SCFA indicates a greater absorption rather than a lower production
69
from the IM. The amount of SCFA produced and absorbed can also be influenced by fecal transit
time, which was not measured in this study [224]. Further research is needed to better understand
the production and uptake of butyrate in different disease states. It is also important to note that
the proposed mechanism for the beneficial role of butyrate uptake in healthy patients was in
preventing excessive intestinal permeability. Jiang et al. and Volynets et al. did find increased
intestinal permeability in NAFLD patients, but did not look at relationships between
permeability, IM, and SCFA production [15, 132].
The ratio of SCFA in our NAFLD patients and HC (approximately 62:23:15
acetate:propionate:butyrate) was fairly similar to the commonly quoted ratio of 60:20:20 and
60:25:15 noted in the literature [224]. When looking at the other main SCFA and related
carboxylic acids in fecal and serum samples we found a significantly greater level of total fecal
SCFA, fecal propionate, fecal isobutyric acid, and serum 2-hydroxybutyrate in NAFLD patients
compared to HC. A greater amount of total fecal SCFA, particularly propionate, was previously
found in overweight and obese adults compared to lean controls [118, 225]. As discussed in
section 2.2.1 it has been suggested that the human obese IM is enriched with genes that code for
the bacterial metabolism of macronutrients leading to an increased energy absorption of up to
150 kcal per day [119, 121]. The increased energy harvest from SCFA is one potential
mechanism through which these metabolites may affect NAFLD pathogenesis. However, in
order to confirm this we would have needed to conduct bomb calorimetry on stool samples,
which was not included in our study protocol.
The primary role of propionate, once absorbed and taken up by the liver, is to function as a
substrate for gluconeogenesis [226]. As an additional energy substrate propionate could increase
adiposity and potentially contribute to steatosis. Further studies on the mechanistic role of
propionate on steatosis and energy balance, including gene expression would be helpful.
Fecal isobutyric acid is a branched chain fatty acid that is formed by the bacterial catabolism of
branched chain amino acids [224]. Isobutyric acid is an isomer of butyric acid and is also closely
related to propionate (with the addition of a methyl branch) [227]. The functional role of
isobutyric acid is not well described, but as it is an intermediate in protein breakdown it is
possible that elevated levels in the NAFLD group are secondary to the increased protein intake
that was observed in these individuals.
70
2-hydroxybutyrate (alpha-hydroxybutyrate) is a metabolite formed during amino acid catabolism
and glutathione anabolism [228]. Although this compound has been mentioned as an
intermediary in the bacterial metabolism of amino acids, it is not clear how much is actually
produced and absorbed in the human colon and incorporated into the blood [229]. It is therefore
more likely that the serum levels measured in our study, which were found to be significantly
higher in NAFLD patients, are due to the presence of NAFLD and its related metabolic
syndrome. Oxidative stress can increase the production of glutathione in the liver and may
therefore increase the amount of 2–hydroxybutyrate produced [228]. Research has recently
suggested that the oxidative stress triggered by insulin resistance, a primary mechanism in
NAFLD pathogenesis, can increase circulating levels of 2–hydroxybutyrate [230, 231]. Li et al.
conducted metabolic profiling in 48 diabetic patients and 31 healthy controls [230]. They found 5
biomarkers that accurately distinguished diabetic patients from healthy controls, including 2–
hydroxybutyrate [230]. Similarly, a study by Gall et al. conducted non-targeted biochemical
profiling on 399 subjects who also underwent the gold-standard hyperinsulinemic euglycemic
clamp testing and oral glucose tolerance testing for identification and grading of insulin
resistance [231]. After statistical analysis, 2–hydroxybutyrate was identified as the best candidate
biochemical to separate insulin resistant from insulin sensitive individuals independent of age,
sex, or BMI [231]. It is therefore likely that the higher 2–hydroxybutyrate levels that we see in
NAFLD patients are due to insulin resistance and resulting oxidative stress rather than alterations
in IM metabolism. Indeed, 2-hydroxybutyrate was the only serum metabolite correlated with
BMI, pointing to its potential relationship to the metabolic state of NAFLD patients.
Two SCFA were also correlated with markers of disease severity in NAFLD patients. Fecal
formic acid, the smallest of the SCFA, was positively correlated with total inflammation. This is
a novel finding in NAFLD and little research exists on the physiological effects of formic acid.
One study found an increased level of serum formic acid in patients with inflammatory bowel
disease in comparison to healthy controls, which may also support a pro-inflammatory role, but
the mechanism remains unknown [232]. Serum acetic acid seemed to have a more beneficial
effect in NAFLD patients with a negative correlation with hepatocyte ballooning intensity.
Recently it was suggested that acetate may have an anti-inflammatory function through
interaction with GPR43, but the exact mechanism through which acetic acid may reduce
ballooning intensity is not known [169].
71
In relation to dietary intake, some of the fecal and serum metabolites measured were positively
correlated with potential substrates for their production. Fecal isovalerate and succinate, products
of the catabolism of protein by IM, were positively correlated with protein intake [224]. Fecal
butyric acid was correlated with fibre and vitamin A intake. Although not all fibres are
fermentable, many of the substrates used for butyrate production would be categorized as a fibre
by the data analysis software. Vitamin A may also be a marker of these substrates as they are
both primarily found in plant-based foods. Serum acetic acid was positively correlated with
Vitamin E, which is again a primarily plant-derived vitamin which may be an indicator of a
relationship between this SCFA and plant-based substrates available for fermentation.
6.3 Metabolites Related to the Bacterial Metabolism of Choline
Another proposed mechanism for IM in NAFLD pathogenesis is through the bacterial
metabolism of dietary choline to trimethylamine. We hypothesized that NAFLD patients would
have a lower circulating choline level due to an increased bacterial breakdown of choline which
would also result in increased fecal trimethylamine and serum TMAO. We did observe a higher
fecal trimethylamine level as well as a higher fecal choline level. Unfortunately we cannot link
fecal choline with dietary choline intake as this dietary information was incomplete in our
database. We did, however, see a slightly higher intake of proteins in NAFLD patients which
may include choline rich foods such as eggs, meat, and fish. This may have led to a higher
amount of choline reaching the colon. This is supported by the positive correlation that we found
between both fecal choline and fecal trimethylamine and reported dietary protein intake. We
could therefore suggest that a higher fecal choline (substrate) level resulted in a higher fecal
trimethylamine (product) level. Serum choline and TMAO, however, did not differ between
groups.
Previous human studies looking at the role of choline in NAFLD pathogenesis have not
consistently measured serum choline. The only study that did so was by Nehra et al. They were
looking at a potential role for choline deficiency as a result of celiac sprue in NAFLD
pathogenesis [233]. They found no correlations between disease severity and serum choline
levels. They did not compare choline levels in NAFLD patients to HC. It is important to note that
the proposed role for choline deficiency in NAFLD pathogenesis is through a decreased
production and export of VLDL from the liver as a result of lower phosphatidylcholine
72
availability. A previous study from our research group did find that SS and NASH patients had
lower hepatic phosphatidylcholine than HC [180]. It is plausible therefore that although serum
levels are not different between our groups, phosphatidylcholine levels are reduced as a result of
reduced choline bioavailability. The issue with this theory is that fecal choline levels were higher
in NAFLD patients. Like SCFA, however, we are unsure of whether a high fecal level reflects a
high colonic absorption or a low colonic absorption.
Our study is the first in humans to measure both serum choline and NAFLD characteristics on
liver histology. Interestingly, serum choline was negatively correlated with liver steatosis and
hepatic ballooning intensity in NAFLD patients. The role of dietary choline deficiency in
steatosis is well known [10, 119, 154] and a potential role of low choline availability in disease
progression through oxidative and endoplasmic reticulum stress has also been discussed [175-
178]. Despite no significant difference in levels between disease groups our findings still support
the role of reduced choline availability in NAFLD pathogenesis.
As mentioned previously, trimethylamine is absorbed in the colon and processed in the liver to
form TMAO. This conversion is catalyzed by flavin monooxygenase 3 (FMO3) [234]. The
expression of FMO, however, can vary from person to person and result in varying levels of
serum TMAO [235]. It is therefore plausible that a significantly greater amount of fecal TMA is
absorbed in NAFLD patients but may not have resulted in a significantly higher level of TMAO.
The effect of high TMA levels in the liver and circulation appear to be benign. Individuals who
lack FMO3 due to a genetic mutation develop a condition called trimethylaminuria where high
levels of TMA results in a fishy odour in the patient’s sweat, urine, and saliva, however no other
physiological consequences are mentioned [235]. Serum TMAO levels, however, has been
associated with several chronic diseases including cardiovascular disease [236-238] and it is
known that NAFLD patients are at increased risk of cardiovascular disease [239]. However, our
current findings do not show higher levels of TMAO in NALFD patients or associations with
NAFLD pathogenesis.
Lastly, it is important to note that both fecal choline and fecal trimethylamine were correlated
with BMI. It is possible that as individuals with NAFLD are heavier, greater BMI but not disease
state is associated with higher levels of these two metabolites. Unfortunately as our groups differ
significantly by BMI it is not possible to decipher the effect of disease versus BMI. Further
73
studies with a sufficient sample size of obese healthy controls would better distinguish the
difference between BMI and NAFLD.
6.4 Ethanol
The last metabolite of particular interest in our study was serum ethanol. We predicted, in line
with the findings of Zhu et al., that patients with NASH would have a significantly higher
ethanol level than HC and SS patients and that this would be related to a higher prevalence of
ethanol producing bacteria such as E. coli [11]. We did not find a significant difference in serum
ethanol levels between disease groups, but our mean levels were quite similar to the mean level
for the HC and obese patients in the Zhu et al. study which was approximately 25 µM compared
to their NASH group which was approximately 35 µM [11]. It is important to consider, however,
that the Zhu study was conducted on children who were assumed to have zero alcohol intake. It
is known that increased exposure to ethanol leads to increased metabolic tolerance, meaning that
ethanol is more readily metabolized and blood ethanol levels decrease more quickly after
repeated exposures [240]. It is therefore possible that as our NAFLD patients were adults they
were better able to tolerate ethanol exposure and therefore their serum levels quickly returned to
the normal levels seen in the HC, whereas in the children a slight increase in ethanol exposure
had a more lasting effect and continued to be elevated in serum. This does not mean that ethanol
exposure from bacterial metabolism in adult NAFLD patients is benign as the ethanol will still
travel directly from the colon to the liver, potentially causing an increased production of toxic
metabolic intermediates such as acetaldehyde or increased intestinal permeability [173, 241].
6.5 Intestinal Microbiota
Disease groups did not differ significantly in the relative abundance or counts of Bacteroidetes,
Firmicutes, Archaea, Bifidobacteria, Lactobacilli, or C. coccoides. Two main differences,
however, were found in the bacterial composition of fecal samples in NASH patients compared
to healthy controls. NASH patients had a significantly lower proportion of the C. leptum
bacterial group as a percent of total bacteria and a significantly higher count of E. coli compared
to healthy controls.
The C. leptum bacterial group was lower in NASH patients. It is also known as Clostridial
Cluster IV which compose approximately 16-25% of the intestinal bacteria [242, 243]. The
74
bacteria contained in this group ferment carbohydrates in the colon to produce SCFA,
particularly the most abundant bacteria in this group, Faecalibacterium prausnitzii which is a
butyrate producer [153]. Indeed, C. leptum was positively correlated with dietary fibre intake
which would include potential substrates for this fermentation. One of the few human studies on
NAFLD and microbiota by Wong et al. similarly found that patients with NASH had a
significantly lower abundance of Faecalibacterium [14]. They suggested that F. prausnitzii may
have protective anti-inflammatory properties, preventing NASH [244]. Another possible
mechanism could be that lower Faecalibacterium in that study’s NASH group could reduce the
production of butyrate which is known to have anti-inflammatory action [150, 151] and
strengthening effects on the intestinal epithelium [145-147]. Although differences in fecal
butyric acid between disease groups was not significant in our study, we did see a positive
correlation between C. leptum abundance and fecal butyric acid levels.
The significantly higher abundance of E. coli in NASH patients in comparison to healthy
controls is also supported by the literature. Zhu et al. found that children with NASH had a
significantly higher abundance of Escherichia than both HC and obese children [11]. This was
associated with higher serum ethanol in NASH patients [11]. As discussed above our study did
not find a significant difference in ethanol levels between groups and additionally serum ethanol
was not correlated with E. coli abundance. This again may be due to adults’ capacity to clear
ethanol efficiently. Future metagenomic studies may be able to look at the genetic capacity of the
entire IM to better understand if the bacterial production of ethanol is associated with NASH.
A previous study by our research group, using some of the same subjects, found a significantly
lower relative abundance of Bacteroidetes in NASH patients compared to HC [13]. Although we
saw a trend towards this relationship, it did not reach significance. It is possible that this is
simply because the relationship was lost with a larger sample size, particularly of healthy
controls, or this may be influenced by length of stool sample storage. Research has shown that
with extended storage of stool samples at -80 °C the ratio of Firmicutes:Bacteroidetes increases
[245]. It is therefore possible that the relationship that was previously seen is no longer
significant due to changes that occurred in storage. A sub-analysis comparing results from the
subjects with qPCR from DNA extracted in 2012 and DNA extracted in 2014 is planned to
further investigate differences in IM that may occur during storage.
75
Lastly, although Firmicutes did not differ between groups, Firmicutes count was positively
correlated with hepatic steatosis. The Firmicutes phylum contains many fermenting bacteria and
is therefore responsible for much of the SCFA production [111]. It is therefore possible that the
difference in the amount of total fecal SCFA in the feces of the NAFLD patients compared to HC
is due, in part, to a higher count of Firmicutes which produce an influx of energy to the liver,
contributing to fat accumulation.
6.6 Diet and Physical Activity
The dietary data used in this study was collected from a 7-day food record with the assistance of
validated 2D visual models for portion estimates and clear instructions provided by a nutrition
expert. All food records were reviewed and follow-up questions were asked of the subject to
clarify any missing or unclear details regarding method of preparation or ingredients consumed.
The use of a 7-day food record in this study is superior to the food frequency questionnaires used
in many studies because it accounts for recent dietary intake which is of greatest importance for
the IM and metabolites and is a better estimate of individual micro and macronutrient intake
[246]. In addition, 7-day food records are completed at the time of consumption and therefore
reduce the risk of memory-related errors.
Dietary intake between the three disease groups was similar with the exception of energy intake.
A trend was seen for higher protein intake in SS patients but was not significant after Bonferroni
correction for multiple comparisons. Reported kilocalorie intake was significantly lower in
NASH patients compared to HC, however, there was no difference between HC and SS patients
or NASH and SS patients. The EER (energy requirements including needs for reported physical
activity) and BMR (energy required for basic physiological functioning) were then compared
with reported energy intake, a method used to estimate underreporting [247]. The proportion of
EER reported was not different between groups, but the proportion of BMR reported was. The
NASH patients reported consuming a significantly smaller proportion of their BMR than the HC
with a median that was below 100%. Physiologically someone who is consuming less than their
BMR should be losing weight, however, none of our subjects reported weight loss. There are two
possible explanations for this discrepancy. One is that the BMR did not accurately estimate these
patients’ metabolic rate, which may be depressed secondary to metabolic disturbances, reduced
lean body mass or a sedentary lifestyle. The second is that NASH patients may be underreporting
76
their dietary intake. Underreporting is particularly suspected as this has been reported
disproportionally in overweight and obese individuals [65, 248, 249].
To address the possibility of underreporting in study subjects we chose to focus on dietary
composition rather than energy intake. We have therefore expressed nutrients as a proportion of
energy intake and in the case of fat have also adjusted for age and weight by dividing the percent
of kilocalories from fat by BMR as was done in one of our previous publications [13]. These
energy-controlled values were used for all statistical analyses and dietary intake remained similar
between groups. Notably dietary quality was quite poor in all patient groups, reflecting a typical
Western-style diet with low dietary fibre intake and high intakes of saturated fat and sodium.
This was also seen in a previous study from our lab [60].
Physical activity was recorded in a self-reported 7-day activity record. Average daily physical
activity units completed and average daily minutes of strenuous and very strenuous physical
activity did not differ between disease groups, however, a trend was observed for a lower level of
high intensity physical activity in SS and NASH patients. Previous work from our team saw a
significantly greater proportion of NASH patients than HC who were classified as sedentary
[60]. This is significant as physical activity can reduce excess body weight and improve insulin
resistance and other metabolic abnormalities that contribute to NAFLD [56, 250-252]. However,
only vigorous activity was reported to be associated with decreased risk of developing NASH
and advanced fibrosis [58]. Like dietary intake, it is possible that physical activity was
overestimated in our obese subjects who may have perceived some physical activities as more
strenuous than HC [253, 254]. Literature in the field of IM only saw differences in bacteria based
on physical activity between sedentary individuals and athletes therefore it is unlikely that any
small, statistically insignificant, differences between physical activity in our groups affected IM
and metabolites [255].
6.7 Potential Confounders
Aside from the variables already discussed above there were a few other demographic and
clinical variables that differed between disease groups: age, country of origin, BMI, insulin
resistance, chronic disease diagnosis and medication use. Many of these differences were
expected as they are risk factors for or part of the pathogenesis of NAFLD. The potentially
confounding effect of each is discussed below.
77
Patients in both the SS and NASH group were significantly older than HC. This was expected
because age is a risk factor for the development of NAFLD [1]. Age may affect the production of
bacterial metabolites secondary to an increase in colonic transit time [224, 256, 257], however,
the research regarding the effect of age on transit time is mixed [258, 259]. It is also unclear at
what age transit time slows with the majority of studies focusing on seniors who were older than
our patient population. IM composition has also been shown to change with age, but remains
relatively stable in adults until they are elderly meaning that age is unlikely to affect the IM
composition of our subjects [260].
Although the ethnicity of our patients does not differ significantly between groups, we did see a
significantly higher proportion of Canadian-born individuals in the HC group than in the SS and
NASH groups. The intestinal microbiota of children and adults has been shown to differ
significantly between countries [261-264]. The differences between these populations, however,
have been largely attributed to dietary differences such as an increased amount of fermentable
fibre in the diet of African children versus those in Europe [261]. What is unknown is whether
individuals who immigrate to Canada develop a ‘Westernized IM’ or retain their original IM
composition. Further studies are needed to understand this transition.
BMI was significantly higher in the NASH group than HC and trended higher for SS versus HC
but this difference did not reach statistical significance. This was expected as BMI is a primary
risk factor for NAFLD [1]. This was also expected because although the HC group did have a
median BMI in the overweight range, the BMI of these patients was somewhat limited secondary
to the nature of their recruitment. HC were recruited from a group of healthy living liver donors.
Due to the high prevalence of NAFLD in obese individuals, typically obese people are not
considered as potential donors. Due to the fact that BMI and disease status were closely related
in our patient samples, the representation of diagnostic groups within each BMI category was
very unbalanced, which prevented the possibility of stratified analysis or ANCOVA to control
for BMI in order to distinguish the effect of BMI from that of disease diagnosis. Interestingly
only fecal choline, fecal trimethylamine, and serum 2-hydroxybutyrate were significantly
correlated with BMI.
Biochemical differences between disease groups were also secondary to disease state including
higher AST and ALT in SS and NASH patients than in HC and higher insulin, HOMA-IR, and
78
blood triglyceride level in NASH patients. NASH patients also had an increased prevalence of
hypertension, which is unsurprising as obesity is a known risk factor for both diseases [1, 265].
Medication use differed in accordance with clinical conditions with a significantly higher
proportion of NASH and SS patients taking cardiovascular medications, primarily
antihypertensives, than HC and with significantly more NASH patients taking lipid lowering
drugs than HC. Interestingly, SS patients took significantly more NSAIDS than HC. Only
patients taking low dose NSAIDS were included in this study, but it is possible that without these
anti-inflammatory medications some of these patients may have progressed on to NASH. No
studies to date have investigated this potential preventative treatment.
79
7 Strengths and Limitations
This was the first study in humans to measure both intestinal microbiota and bacterial products in
biopsy confirmed SS and NASH patients in comparison to healthy controls. This is one step
forward in our understanding of the role of IM in NAFLD pathogenesis through various bacterial
products. Given the high prevalence of NAFLD and limited treatment options it is worthwhile to
consider the role of the IM and its metabolites for further research on potential therapies or
preventative strategies.
With the exception of one previous study from our group [13] no other human study has
compared the IM of NAFLD patients with HC where all patient groups had liver biopsies
available for histological analysis. Liver biopsies are currently the gold standard for NASH
diagnosis and disease grading [2] but previous studies have been limited by the ethical issue for
obtaining a liver biopsy from a healthy patient. Our healthy living liver donor group allows us to
obtain this vital data without a separate invasive procedure. Even in HC who were unable to
undergo surgery and therefore did not provide a liver biopsy, analysis of liver health was
significantly more detailed than previous studies which relied primarily on normal liver enzymes.
Although dietary and physical activity data may have been limited by self-reporting, it is a
strength of this study that we were able to compare these lifestyle factors between groups and
examine the relationship between diet, IM, and metabolite composition. This data therefore
allowed us to make connections that were limited in other studies.
There were some limitations in this study as well. As this was a cross-sectional study, causal
relationships cannot be drawn and further work is therefore necessary to understand the
physiological mechanisms behind the relationships that we observed. A significant limitation
was the small sample size in our SS group which was half of what was determined to be required
a priori. This was due to the fact that SS is largely a benign and asymptomatic disease that is
usually detected by ultrasound and does not require a liver biopsy. Although our SS patients had
elevated liver enzymes that necessitated a referral to a hepatologist and subsequent liver biopsy,
those patients are now generally followed with new surrogate markers such as Fibrotest [266] or
Fibroscan [267] as per the American Gastroenterological Association guidelines [2], so liver
biopsies are no longer performed unless patients demonstrate features suggestive of NASH or
80
fibrosis. Despite this limitation ours is one of few studies on NAFLD and IM that diagnosed SS
via liver biopsy.
In this study IM composition was limited to the taxa selected for qPCR, meaning that an
understanding of the full IM community is not possible. The value of having bacterial counts,
however, is not to be underestimated as the actual amount of bacteria present is of particular
interest when comparing bacteria and metabolites. Future analyses that compare the full IM
community using Illumina 16s rRNA sequencing and metagenomics are in progress.
81
8 Conclusions
The findings of this study provide further evidence for a relationship between the IM, bacterial
products, and disease severity in NAFLD. More specifically we have observed in NAFLD
patients: a higher presence of some fermentation products, the production of potentially harmful
metabolites, the altered metabolism of an essential nutrient (choline), and differences in IM
composition. In relation to the study aims, hypotheses, and proposed mechanisms, the study
results were as follows:
The study did not find a significant difference in plasma endotoxin or fecal butyric acid
levels between HC, SS, and NASH patients.
NAFLD patients had higher fecal total SCFA, propionate, isobutyric acid, choline, and
trimethylamine, and serum 2-hydroxybutyrate than HC. Fecal choline and trimethylamine
and serum 2-hydroxybutyrate were positively correlated with BMI.
Metabolites including fecal formic acid, serum choline, and serum acetic acid were
correlated with histological features of NAFLD.
NASH patients had lower prevalence of C. leptum and higher amounts of E. coli in their
stool. No other differences existed for IM composition.
Reported energy intake was significantly lower in NASH patients than in HC and tended
to be higher in protein derived energy for SS and NASH patients than for HC.
Positive correlations were observed between substrates and products of bacterial
metabolism: protein with succinate and isovalerate, and sources of fermentable
carbohydrates with butyric and acetic acid.
Bacterial taxa were also correlated with substrates and in some cases, products of their
metabolic processes, including: C. leptum with sources of fermentable carbohydrates and
serum acetic acid, and Firmicutes with sources of fermentable carbohydrates, fecal
butyric acid, and serum acetic acid.
This study contributes to growing evidence suggesting the potential benefit of therapeutic
alteration of the IM in NAFLD prevention and treatment. Future research is necessary to further
evaluate the role of the IM and bacterial products in NAFLD pathogenesis and to investigate the
potential exploitation of this relationship for disease prevention and treatment.

82
9 Future Directions
There are several future research projects that could expand on the findings presented in this
thesis. Of primary interest would be the metagenomics analysis of the bacterial IM of these
patients. This data would allow us to fill in some of the gaps in the mechanistic information
coming from the current study. We would, for instance, be able to look at the gene expression for
carbohydrate fermentation and butyrate production to better understand if the higher relative
abundance of butyrate producers that we observed actually results in a higher butyrate
production. Current methods are limited by our incomplete understanding of the relevance of
fecal SCFA content in relation to SCFA production and absorption. Metagenomic studies would
also be able to determine if a higher E. coli count results in a greater production of ethanol or if
the overall metagenome results in differences in ethanol production between NASH patients and
HC. Planning for this type of study is underway.
Another important step to undertake in order to better understand the potential role of butyrate
would be to measure the abundance of butyrate producers, or ideally the bacterial gene
expression for butyrate production, while at the same time measuring fecal butyrate and
intestinal permeability/integrity. Similar studies, although not as comprehensive, have been able
to look at the role of butyrate producing probiotics with fecal butyrate and intestinal permeability
in mice, but this has not been examined in humans [154, 155]. Intestinal permeability can be
measured in a variety of ways in adults with NAFLD. Previous studies have used transmission
electron microscopy to observe microvilli and tight junctions or immunohistochemical analysis
of zona occludins-1 expression in intestinal biopsies [15, 134] or less invasive techniques
including the measurement of lactulose/mannitol or (51)Cr-ethylene diamine tetraacetate in urine
[132, 134].
Of particular interest in the role of bacterial metabolism of choline would be to look at the
expression of flavin monooxygenases in the liver, which is responsible for the conversion of
trimethylamine to TMAO. This may help us to better understand whether trimethylamine
metabolism after absorption is related to NAFLD disease status. Comparisons of fecal and serum
choline to phosphatidylcholine and expression of genes involved in the conversion of choline to
this active form, e.g. PEMT, would also be of interest since we did not see the expected lower
serum choline level in NAFLD patients, despite a higher production of trimethylamine.
83
A useful method for future studies would be to match NAFLD and HC by BMI. As BMI is so
closely tied to the NAFLD disease pathogenesis this will be a difficult task, but larger centers, or
multicenter trials may be able to accomplish this matching which would allow for a better
understanding of factors involved in NAFLD pathogenesis irrespective of weight.
The use of chemostat models, recently adapted to allow for the growth and manipulation of
human IM communities may be of particular use in future research [268]. Chemostats may be
particularly interesting when trialing the effects of potential pre or probiotic supplements or
dietary modifications as researchers can observe how these interventions alter IM and bacterial
metabolites directly. These basic science studies may then provide the data needed to plan for
larger human intervention trials with supplementation or potentially fecal transplantation. Fecal
transplantation has been successfully used for the treatment of Clostridium difficile infection
[269, 270] and was recently shown to improve insulin sensitivity [271].
84
References
1. LaBrecque, D.R., et al., World Gastroenterology Organisation global guidelines:
Nonalcoholic fatty liver disease and nonalcoholic steatohepatitis. J Clin Gastroenterol,
2014. 48(6): p. 467-73.
2. Chalasani, N., et al., The diagnosis and management of non-alcoholic fatty liver disease:
Practice guideline by the American Association for the Study of Liver Diseases, American
College of Gastroenterology, and the American Gastroenterological Association. Am J
Gastroenterol, 2012. 107(6): p. 811-26.
3. Brunt, E.M., Pathology of nonalcoholic fatty liver disease. Nat Rev Gastroenterol
Hepatol, 2010. 7(4): p. 195-203.
4. Yu, A.S. and E.B. Keeffe, Nonalcoholic fatty liver disease. Rev Gastroenterol Disord,
2002. 2(1): p. 11-9.
5. Wanless, I.R. and J.S. Lentz, Fatty liver hepatitis (steatohepatitis) and obesity: an
autopsy study with analysis of risk factors. Hepatology, 1990. 12(5): p. 1106-10.
6. Festi, D., et al., Hepatic steatosis in obese patients: clinical aspects and prognostic
significance. Obes Rev, 2004. 5(1): p. 27-42.
7. Charlton, M.R., et al., Frequency and outcomes of liver transplantation for nonalcoholic
steatohepatitis in the United States. Gastroenterology, 2011. 141(4): p. 1249-53.
8. Gastrointestinal Surgery for Severe Obesity. NIH Consensus Statment Online, 1991. 9.
9. Vernon, G., A. Baranova, and Z.M. Younossi, Systematic review: the epidemiology and
natural history of non-alcoholic fatty liver disease and non-alcoholic steatohepatitis in
adults. Aliment Pharmacol Ther, 2011. 34(3): p. 274-85.
10. Spencer, M.D., et al., Association between composition of the human gastrointestinal
microbiome and development of fatty liver with choline deficiency. Gastroenterology,
2011. 140(3): p. 976-86.
11. Zhu, L., et al., Characterization of gut microbiomes in nonalcoholic steatohepatitis
(NASH) patients: a connection between endogenous alcohol and NASH. Hepatology,
2013. 57(2): p. 601-9.
12. Raman, M., et al., Fecal microbiome and volatile organic compound metabolome in
obese humans with nonalcoholic fatty liver disease. Clin Gastroenterol Hepatol, 2013.
11(7): p. 868-75.e1-3.
13. Mouzaki, M., et al., Intestinal microbiota in patients with nonalcoholic fatty liver disease.
Hepatology, 2013. 58(1): p. 120-7.
85
14. Wong, V.W., et al., Molecular characterization of the fecal microbiota in patients with
nonalcoholic steatohepatitis--a longitudinal study. PLoS One, 2013. 8(4): p. e62885.
15. Jiang, W., et al., Dysbiosis gut microbiota associated with inflammation and impaired
mucosal immune function in intestine of humans with non-alcoholic fatty liver disease.
Sci Rep, 2015. 5: p. 8096.
16. Bugianesi, E., et al., Fibrosis in genotype 3 chronic hepatitis C and nonalcoholic fatty
liver disease: Role of insulin resistance and hepatic steatosis. Hepatology, 2006. 44(6): p.
1648-55.
17. Fong, D.G., et al., Metabolic and nutritional considerations in nonalcoholic fatty liver.
Hepatology, 2000. 32(1): p. 3-10.
18. Van Steenbergen, W. and S. Lanckmans, Liver disturbances in obesity and diabetes
mellitus. Int J Obes Relat Metab Disord, 1995. 19 Suppl 3: p. S27-36.
19. Fisher, R.L., Hepatobiliary abnormalities associated with total parenteral nutrition.
Gastroenterol Clin North Am, 1989. 18(3): p. 645-66.
20. Fabbrini, E., et al., Alterations in adipose tissue and hepatic lipid kinetics in obese men
and women with nonalcoholic fatty liver disease. Gastroenterology, 2008. 134(2): p. 424-
31.
21. Bradbury, M.W., Lipid metabolism and liver inflammation. I. Hepatic fatty acid uptake:
possible role in steatosis. Am J Physiol Gastrointest Liver Physiol, 2006. 290(2): p.
G194-8.
22. Donnelly, K.L., et al., Sources of fatty acids stored in liver and secreted via lipoproteins
in patients with nonalcoholic fatty liver disease. J Clin Invest, 2005. 115(5): p. 1343-51.
23. McGarry, J.D. and D.W. Foster, Regulation of hepatic fatty acid oxidation and ketone
body production. Annu Rev Biochem, 1980. 49: p. 395-420.
24. Angulo, P., Nonalcoholic fatty liver disease. N Engl J Med, 2002. 346(16): p. 1221-31.
25. Browning, J.D. and J.D. Horton, Molecular mediators of hepatic steatosis and liver
injury. J Clin Invest, 2004. 114(2): p. 147-52.
26. Monetti, M., et al., Dissociation of hepatic steatosis and insulin resistance in mice
overexpressing DGAT in the liver. Cell Metab, 2007. 6(1): p. 69-78.
27. McClain, C.J., S. Barve, and I. Deaciuc, Good fat/bad fat. Hepatology, 2007. 45(6): p.
1343-6.
28. Yamaguchi, K., et al., Inhibiting triglyceride synthesis improves hepatic steatosis but
exacerbates liver damage and fibrosis in obese mice with nonalcoholic steatohepatitis.
Hepatology, 2007. 45(6): p. 1366-74.
86
29. Baeuerle, P.A. and T. Henkel, Function and activation of NF-kappa B in the immune
system. Annu Rev Immunol, 1994. 12: p. 141-79.
30. Feldstein, A.E., et al., Free fatty acids promote hepatic lipotoxicity by stimulating TNF-
alpha expression via a lysosomal pathway. Hepatology, 2004. 40(1): p. 185-94.
31. Libermann, T.A. and D. Baltimore, Activation of interleukin-6 gene expression through
the NF-kappa B transcription factor. Mol Cell Biol, 1990. 10(5): p. 2327-34.
32. Farrell, G.C. and C.Z. Larter, Nonalcoholic fatty liver disease: from steatosis to cirrhosis.
Hepatology, 2006. 43(2 Suppl 1): p. S99-s112.
33. Sanyal, A.J., et al., Nonalcoholic steatohepatitis: association of insulin resistance and
mitochondrial abnormalities. Gastroenterology, 2001. 120(5): p. 1183-92.
34. Dowman, J.K., J.W. Tomlinson, and P.N. Newsome, Pathogenesis of non-alcoholic fatty
liver disease. Qjm, 2010. 103(2): p. 71-83.
35. Jou, J., S.S. Choi, and A.M. Diehl, Mechanisms of disease progression in nonalcoholic
fatty liver disease. Semin Liver Dis, 2008. 28(4): p. 370-9.
36. Malhi, H., et al., Free fatty acids induce JNK-dependent hepatocyte lipoapoptosis. J Biol
Chem, 2006. 281(17): p. 12093-101.
37. Feldstein, A.E., et al., Hepatocyte apoptosis and fas expression are prominent features of
human nonalcoholic steatohepatitis. Gastroenterology, 2003. 125(2): p. 437-43.
38. Susca, M., et al., Liver inflammatory cells, apoptosis, regeneration and stellate cell
activation in non-alcoholic steatohepatitis. Dig Liver Dis, 2001. 33(9): p. 768-77.
39. Ribeiro, P.S., et al., Hepatocyte apoptosis, expression of death receptors, and activation
of NF-kappaB in the liver of nonalcoholic and alcoholic steatohepatitis patients. Am J
Gastroenterol, 2004. 99(9): p. 1708-17.
40. Kong, J.Y. and S.W. Rabkin, Palmitate-induced apoptosis in cardiomyocytes is mediated
through alterations in mitochondria: prevention by cyclosporin A. Biochim Biophys
Acta, 2000. 1485(1): p. 45-55.
41. Wang, D., Y. Wei, and M.J. Pagliassotti, Saturated fatty acids promote endoplasmic
reticulum stress and liver injury in rats with hepatic steatosis. Endocrinology, 2006.
147(2): p. 943-51.
42. Mari, M., et al., Mitochondrial free cholesterol loading sensitizes to TNF- and Fas-
mediated steatohepatitis. Cell Metab, 2006. 4(3): p. 185-98.
43. Wei, Y., et al., Saturated fatty acids induce endoplasmic reticulum stress and apoptosis
independently of ceramide in liver cells. Am J Physiol Endocrinol Metab, 2006. 291(2):
p. E275-81.
87
44. Malhotra, J.D. and R.J. Kaufman, The endoplasmic reticulum and the unfolded protein
response. Semin Cell Dev Biol, 2007. 18(6): p. 716-31.
45. Ozcan, U., et al., Endoplasmic reticulum stress links obesity, insulin action, and type 2
diabetes. Science, 2004. 306(5695): p. 457-61.
46. Kantartzis, K., et al., Dissociation between fatty liver and insulin resistance in humans
carrying a variant of the patatin-like phospholipase 3 gene. Diabetes, 2009. 58(11): p.
2616-23.
47. Kotronen, A., et al., A common variant in PNPLA3, which encodes adiponutrin, is
associated with liver fat content in humans. Diabetologia, 2009. 52(6): p. 1056-60.
48. Sookoian, S. and C.J. Pirola, Meta-analysis of the influence of I148M variant of patatin-
like phospholipase domain containing 3 gene (PNPLA3) on the susceptibility and
histological severity of nonalcoholic fatty liver disease. Hepatology, 2011. 53(6): p.
1883-94.
49. Romeo, S., et al., Genetic variation in PNPLA3 confers susceptibility to nonalcoholic
fatty liver disease. Nat Genet, 2008. 40(12): p. 1461-5.
50. Valenti, L., et al., Homozygosity for the patatin-like phospholipase-3/adiponutrin I148M
polymorphism influences liver fibrosis in patients with nonalcoholic fatty liver disease.
Hepatology, 2010. 51(4): p. 1209-17.
51. Rotman, Y., et al., The association of genetic variability in patatin-like phospholipase
domain-containing protein 3 (PNPLA3) with histological severity of nonalcoholic fatty
liver disease. Hepatology, 2010. 52(3): p. 894-903.
52. Speliotes, E.K., et al., PNPLA3 variants specifically confer increased risk for histologic
nonalcoholic fatty liver disease but not metabolic disease. Hepatology, 2010. 52(3): p.
904-12.
53. Speliotes, E.K., et al., Genome-wide association analysis identifies variants associated
with nonalcoholic fatty liver disease that have distinct effects on metabolic traits. PLoS
Genet, 2011. 7(3): p. e1001324.
54. Petersen, K.F., et al., Apolipoprotein C3 gene variants in nonalcoholic fatty liver disease.
N Engl J Med, 2010. 362(12): p. 1082-9.
55. Perseghin, G., et al., Habitual physical activity is associated with intrahepatic fat content
in humans. Diabetes Care, 2007. 30(3): p. 683-8.
56. Krasnoff, J.B., et al., Health-related fitness and physical activity in patients with
nonalcoholic fatty liver disease. Hepatology, 2008. 47(4): p. 1158-66.
57. Zelber-Sagi, S., et al., Role of leisure-time physical activity in nonalcoholic fatty liver
disease: a population-based study. Hepatology, 2008. 48(6): p. 1791-8.

88
58. Kistler, K.D., et al., Physical activity recommendations, exercise intensity, and
histological severity of nonalcoholic fatty liver disease. Am J Gastroenterol, 2011.
106(3): p. 460-8; quiz 469.
59. Church, T.S., et al., Association of cardiorespiratory fitness, body mass index, and waist
circumference to nonalcoholic fatty liver disease. Gastroenterology, 2006. 130(7): p.
2023-30.
60. Da Silva, H.E., et al., A cross-sectional study assessing dietary intake and physical
activity in Canadian patients with nonalcoholic fatty liver disease vs healthy controls. J
Acad Nutr Diet, 2014. 114(8): p. 1181-94.
61. Anderson, E.L., et al., Childhood energy intake is associated with nonalcoholic Fatty
liver disease in adolescents. J Nutr, 2015. 145(5): p. 983-9.
62. Ferolla, S.M., et al., Dietary patterns in Brazilian patients with nonalcoholic fatty liver
disease: a cross-sectional study. Clinics (Sao Paulo), 2013. 68(1): p. 11-7.
63. Capristo, E., et al., Nutritional aspects in patients with non-alcoholic steatohepatitis
(NASH). Eur Rev Med Pharmacol Sci, 2005. 9(5): p. 265-8.
64. Dhurandhar, N.V., et al., Energy balance measurement: when something is not better
than nothing. Int J Obes (Lond), 2014.
65. Bedard, D., B. Shatenstein, and S. Nadon, Underreporting of energy intake from a self-
administered food-frequency questionnaire completed by adults in Montreal. Public
Health Nutr, 2004. 7(5): p. 675-81.
66. Vos, M.B., et al., Correlation of vitamin E, uric acid, and diet composition with
histologic features of pediatric NAFLD. J Pediatr Gastroenterol Nutr, 2012. 54(1): p. 90-
6.
67. Cankurtaran, M., et al., Serum vitamin-E levels and its relation to clinical features in
nonalcoholic fatty liver disease with elevated ALT levels. Acta Gastroenterol Belg, 2006.
69(1): p. 5-11.
68. Canbakan, B., et al., Clinical, biochemical and histological correlations in a group of
non-drinker subjects with non-alcoholic fatty liver disease. Acta Gastroenterol Belg,
2007. 70(3): p. 277-84.
69. Solga, S., et al., Dietary composition and nonalcoholic fatty liver disease. Dig Dis Sci,
2004. 49(10): p. 1578-83.
70. Ricci, G., et al., Nutrient intake in Italian obese patients: relationships with insulin
resistance and markers of non-alcoholic fatty liver disease. Nutrition, 2011. 27(6): p.
672-6.
71. Ma, J., et al., Sugar-sweetened beverage, diet soda, and fatty liver disease in the
Framingham Heart Study cohorts. J Hepatol, 2015.
89
72. Abid, A., et al., Soft drink consumption is associated with fatty liver disease independent
of metabolic syndrome. J Hepatol, 2009. 51(5): p. 918-24.
73. Mager, D.R., et al., Dietary and physical activity patterns in children with fatty liver. Eur
J Clin Nutr, 2010. 64(6): p. 628-35.
74. Ouyang, X., et al., Fructose consumption as a risk factor for non-alcoholic fatty liver
disease. J Hepatol, 2008. 48(6): p. 993-9.
75. Lim, J.S., et al., The role of fructose in the pathogenesis of NAFLD and the metabolic
syndrome. Nat Rev Gastroenterol Hepatol, 2010. 7(5): p. 251-64.
76. Morino, K., K.F. Petersen, and G.I. Shulman, Molecular mechanisms of insulin
resistance in humans and their potential links with mitochondrial dysfunction. Diabetes,
2006. 55 Suppl 2: p. S9-s15.
77. Wei, Y., et al., Fructose-mediated stress signaling in the liver: implications for hepatic
insulin resistance. J Nutr Biochem, 2007. 18(1): p. 1-9.
78. Musso, G., et al., Dietary habits and their relations to insulin resistance and postprandial
lipemia in nonalcoholic steatohepatitis. Hepatology, 2003. 37(4): p. 909-16.
79. Cummings, J.H. and G.T. Macfarlane, The control and consequences of bacterial
fermentation in the human colon. J Appl Bacteriol, 1991. 70(6): p. 443-59.
80. Solah, V.A., et al., Dose-response effect of a novel functional fibre, PolyGlycopleX((R)),
PGX((R)), on satiety. Appetite, 2014. 77: p. 72-6.
81. Pentikainen, S., et al., Enrichment of biscuits and juice with oat beta-glucan enhances
postprandial satiety. Appetite, 2014. 75: p. 150-6.
82. Blundell, J.E. and V.J. Burley, Satiation, satiety and the action of fibre on food intake. Int
J Obes, 1987. 11 Suppl 1: p. 9-25.
83. Bhupathiraju, S.N., et al., Glycemic index, glycemic load, and risk of type 2 diabetes:
results from 3 large US cohorts and an updated meta-analysis. Am J Clin Nutr, 2014.
100(1): p. 218-32.
84. Rocha, R., et al., [Non alcoholic fatty liver disease: treatment with soluble fibres]. Arq
Gastroenterol, 2007. 44(4): p. 350-2.
85. Chan, W.K., et al., Low physical activity and energy dense Malaysian foods are
associated with non-alcoholic fatty liver disease in centrally obese but not in non-
centrally obese patients with diabetes mellitus. Asia Pac J Clin Nutr, 2015. 24(2): p. 289-
98.
86. Mollard, R.C., et al., Dietary determinants of hepatic steatosis and visceral adiposity in
overweight and obese youth at risk of type 2 diabetes. Am J Clin Nutr, 2014. 99(4): p.
804-12.
90
87. Sathiaraj, E., et al., A case-control study on nutritional risk factors in non-alcoholic fatty
liver disease in Indian population. Eur J Clin Nutr, 2011. 65(4): p. 533-7.
88. Vilar, L., et al., High-fat diet: a trigger of non-alcoholic steatohepatitis? Preliminary
findings in obese subjects. Nutrition, 2008. 24(11-12): p. 1097-102.
89. Cortez-Pinto, H., et al., How different is the dietary pattern in non-alcoholic
steatohepatitis patients? Clin Nutr, 2006. 25(5): p. 816-23.
90. Charlton, M., et al., Fast food diet mouse: novel small animal model of NASH with
ballooning, progressive fibrosis, and high physiological fidelity to the human condition.
Am J Physiol Gastrointest Liver Physiol, 2011. 301(5): p. G825-34.
91. Chai, W. and Z. Liu, p38 mitogen-activated protein kinase mediates palmitate-induced
apoptosis but not inhibitor of nuclear factor-kappaB degradation in human coronary
artery endothelial cells. Endocrinology, 2007. 148(4): p. 1622-8.
92. Calder, P.C., n-3 polyunsaturated fatty acids, inflammation, and inflammatory diseases.
Am J Clin Nutr, 2006. 83(6 Suppl): p. 1505s-1519s.
93. Yasutake, K., et al., Nutritional investigation of non-obese patients with non-alcoholic
fatty liver disease: the significance of dietary cholesterol. Scand J Gastroenterol, 2009.
44(4): p. 471-7.
94. Oya, J., et al., Intake of n-3 polyunsaturated fatty acids and non-alcoholic fatty liver
disease: a cross-sectional study in Japanese men and women. Eur J Clin Nutr, 2010.
64(10): p. 1179-85.
95. Araya, J., et al., Increase in long-chain polyunsaturated fatty acid n - 6/n - 3 ratio in
relation to hepatic steatosis in patients with non-alcoholic fatty liver disease. Clin Sci
(Lond), 2004. 106(6): p. 635-43.
96. Puri, P., et al., A lipidomic analysis of nonalcoholic fatty liver disease. Hepatology, 2007.
46(4): p. 1081-90.
97. Arendt, B.M., et al., Altered hepatic gene expression in nonalcoholic fatty liver disease is
associated with lower hepatic n-3 and n-6 polyunsaturated fatty acids. Hepatology, 2015.
61(5): p. 1565-78.
98. Allard, J.P., et al., Nutritional assessment and hepatic fatty acid composition in non-
alcoholic fatty liver disease (NAFLD): a cross-sectional study. J Hepatol, 2008. 48(2): p.
300-7.
99. Clarke, S.D., Polyunsaturated fatty acid regulation of gene transcription: a molecular
mechanism to improve the metabolic syndrome. J Nutr, 2001. 131(4): p. 1129-32.
100. Nakamura, M.T., H.P. Cho, and S.D. Clarke, Regulation of hepatic delta-6 desaturase
expression and its role in the polyunsaturated fatty acid inhibition of fatty acid synthase
gene expression in mice. J Nutr, 2000. 130(6): p. 1561-5.
91
101. Sanyal, A.J., et al., Pioglitazone, vitamin E, or placebo for nonalcoholic steatohepatitis.
N Engl J Med, 2010. 362(18): p. 1675-85.
102. Mai, V. and P.V. Draganov, Recent advances and remaining gaps in our knowledge of
associations between gut microbiota and human health. World J Gastroenterol, 2009.
15(1): p. 81-5.
103. Frank, D.N., et al., Molecular-phylogenetic characterization of microbial community
imbalances in human inflammatory bowel diseases. Proc Natl Acad Sci U S A, 2007.
104(34): p. 13780-5.
104. Eckburg, P.B., et al., Diversity of the human intestinal microbial flora. Science, 2005.
308(5728): p. 1635-8.
105. Zhang, H., et al., Human gut microbiota in obesity and after gastric bypass. Proc Natl
Acad Sci U S A, 2009. 106(7): p. 2365-70.
106. Gosalbes, M.J., et al., Metatranscriptomic approach to analyze the functional human gut
microbiota. PLoS One, 2011. 6(3): p. e17447.
107. Arumugam, M., et al., Enterotypes of the human gut microbiome. Nature, 2011.
473(7346): p. 174-80.
108. Wu, G.D. and J.D. Lewis, Analysis of the human gut microbiome and association with
disease. Clin Gastroenterol Hepatol, 2013. 11(7): p. 774-7.
109. Backhed, F., et al., The gut microbiota as an environmental factor that regulates fat
storage. Proc Natl Acad Sci U S A, 2004. 101(44): p. 15718-23.
110. Stappenbeck, T.S., L.V. Hooper, and J.I. Gordon, Developmental regulation of intestinal
angiogenesis by indigenous microbes via Paneth cells. Proc Natl Acad Sci U S A, 2002.
99(24): p. 15451-5.
111. Turnbaugh, P.J., et al., An obesity-associated gut microbiome with increased capacity for
energy harvest. Nature, 2006. 444(7122): p. 1027-31.
112. Backhed, F., et al., Mechanisms underlying the resistance to diet-induced obesity in
germ-free mice. Proc Natl Acad Sci U S A, 2007. 104(3): p. 979-84.
113. Cani, P.D., et al., Changes in gut microbiota control metabolic endotoxemia-induced
inflammation in high-fat diet-induced obesity and diabetes in mice. Diabetes, 2008.
57(6): p. 1470-81.
114. Bergheim, I., et al., Antibiotics protect against fructose-induced hepatic lipid
accumulation in mice: role of endotoxin. J Hepatol, 2008. 48(6): p. 983-92.
115. Le Roy, T., et al., Intestinal microbiota determines development of non-alcoholic fatty
liver disease in mice. Gut, 2013. 62(12): p. 1787-94.

92
116. Ley, R.E., et al., Microbial ecology: human gut microbes associated with obesity. Nature,
2006. 444(7122): p. 1022-3.
117. Armougom, F., et al., Monitoring bacterial community of human gut microbiota reveals
an increase in Lactobacillus in obese patients and Methanogens in anorexic patients.
PLoS One, 2009. 4(9): p. e7125.
118. Schwiertz, A., et al., Microbiota and SCFA in lean and overweight healthy subjects.
Obesity (Silver Spring), 2010. 18(1): p. 190-5.
119. Turnbaugh, P.J., et al., A core gut microbiome in obese and lean twins. Nature, 2009.
457(7228): p. 480-4.
120. Furet, J.P., et al., Differential adaptation of human gut microbiota to bariatric surgery-
induced weight loss: links with metabolic and low-grade inflammation markers. Diabetes,
2010. 59(12): p. 3049-57.
121. Jumpertz, R., et al., Energy-balance studies reveal associations between gut microbes,
caloric load, and nutrient absorption in humans. Am J Clin Nutr, 2011. 94(1): p. 58-65.
122. Gregor, M.F. and G.S. Hotamisligil, Inflammatory mechanisms in obesity. Annu Rev
Immunol, 2011. 29: p. 415-45.
123. Cai, D., et al., Local and systemic insulin resistance resulting from hepatic activation of
IKK-beta and NF-kappaB. Nat Med, 2005. 11(2): p. 183-90.
124. Song, M.J., et al., Activation of Toll-like receptor 4 is associated with insulin resistance
in adipocytes. Biochem Biophys Res Commun, 2006. 346(3): p. 739-45.
125. Rivera, C.A., et al., Toll-like receptor-4 signaling and Kupffer cells play pivotal roles in
the pathogenesis of non-alcoholic steatohepatitis. J Hepatol, 2007. 47(4): p. 571-9.
126. Miyake, K., Innate immune sensing of pathogens and danger signals by cell surface Toll-
like receptors. Semin Immunol, 2007. 19(1): p. 3-10.
127. Cani, P.D., et al., Metabolic endotoxemia initiates obesity and insulin resistance.
Diabetes, 2007. 56(7): p. 1761-72.
128. Brun, P., et al., Increased intestinal permeability in obese mice: new evidence in the
pathogenesis of nonalcoholic steatohepatitis. Am J Physiol Gastrointest Liver Physiol,
2007. 292(2): p. G518-25.
129. Thuy, S., et al., Nonalcoholic fatty liver disease in humans is associated with increased
plasma endotoxin and plasminogen activator inhibitor 1 concentrations and with fructose
intake. J Nutr, 2008. 138(8): p. 1452-5.
130. Harte, A.L., et al., Elevated endotoxin levels in non-alcoholic fatty liver disease. J
Inflamm (Lond), 2010. 7: p. 15.
93
131. Verdam, F.J., et al., Novel evidence for chronic exposure to endotoxin in human
nonalcoholic steatohepatitis. J Clin Gastroenterol, 2011. 45(2): p. 149-52.
132. Volynets, V., et al., Nutrition, intestinal permeability, and blood ethanol levels are
altered in patients with nonalcoholic fatty liver disease (NAFLD). Dig Dis Sci, 2012.
57(7): p. 1932-41.
133. Spruss, A., et al., Toll-like receptor 4 is involved in the development of fructose-induced
hepatic steatosis in mice. Hepatology, 2009. 50(4): p. 1094-104.
134. Miele, L., et al., Increased intestinal permeability and tight junction alterations in
nonalcoholic fatty liver disease. Hepatology, 2009. 49(6): p. 1877-87.
135. Bergman, E.N., Energy contributions of volatile fatty acids from the gastrointestinal tract
in various species. Physiol Rev, 1990. 70(2): p. 567-90.
136. Parker, D.S., The measurement of production rates of volatile fatty acids in the caecum of
the conscious rabbit. Br J Nutr, 1976. 36(1): p. 61-70.
137. Topping, D.L. and P.M. Clifton, Short-chain fatty acids and human colonic function:
roles of resistant starch and nonstarch polysaccharides. Physiol Rev, 2001. 81(3): p.
1031-64.
138. Cummings, J.H., et al., The effect of meat protein and dietary fiber on colonic function
and metabolism. II. Bacterial metabolites in feces and urine. Am J Clin Nutr, 1979.
32(10): p. 2094-101.
139. Hijova, E. and A. Chmelarova, Short chain fatty acids and colonic health. Bratisl Lek
Listy, 2007. 108(8): p. 354-8.
140. Binder, H.J., Role of colonic short-chain fatty acid transport in diarrhea. Annu Rev
Physiol, 2010. 72: p. 297-313.
141. Lin, H.V., et al., Butyrate and propionate protect against diet-induced obesity and
regulate gut hormones via free fatty acid receptor 3-independent mechanisms. PLoS One,
2012. 7(4): p. e35240.
142. Gao, Z., et al., Butyrate improves insulin sensitivity and increases energy expenditure in
mice. Diabetes, 2009. 58(7): p. 1509-17.
143. Roediger, W.E., Role of anaerobic bacteria in the metabolic welfare of the colonic
mucosa in man. Gut, 1980. 21(9): p. 793-8.
144. Roediger, W.E., Utilization of nutrients by isolated epithelial cells of the rat colon.
Gastroenterology, 1982. 83(2): p. 424-9.
145. Mariadason, J.M., D.H. Barkla, and P.R. Gibson, Effect of short-chain fatty acids on
paracellular permeability in Caco-2 intestinal epithelium model. Am J Physiol, 1997.
272(4 Pt 1): p. G705-12.
94
146. Peng, L., et al., Effects of butyrate on intestinal barrier function in a Caco-2 cell
monolayer model of intestinal barrier. Pediatr Res, 2007. 61(1): p. 37-41.
147. Peng, L., et al., Butyrate enhances the intestinal barrier by facilitating tight junction
assembly via activation of AMP-activated protein kinase in Caco-2 cell monolayers. J
Nutr, 2009. 139(9): p. 1619-25.
148. Hinnebusch, B.F., et al., The effects of short-chain fatty acids on human colon cancer cell
phenotype are associated with histone hyperacetylation. J Nutr, 2002. 132(5): p. 1012-7.
149. Comalada, M., et al., The effects of short-chain fatty acids on colon epithelial
proliferation and survival depend on the cellular phenotype. J Cancer Res Clin Oncol,
2006. 132(8): p. 487-97.
150. Inan, M.S., et al., The luminal short-chain fatty acid butyrate modulates NF-kappaB
activity in a human colonic epithelial cell line. Gastroenterology, 2000. 118(4): p. 724-
34.
151. Yin, L., G. Laevsky, and C. Giardina, Butyrate suppression of colonocyte NF-kappa B
activation and cellular proteasome activity. J Biol Chem, 2001. 276(48): p. 44641-6.
152. Hamer, H.M., et al., Butyrate modulates oxidative stress in the colonic mucosa of healthy
humans. Clin Nutr, 2009. 28(1): p. 88-93.
153. De Vuyst, L. and F. Leroy, Cross-feeding between bifidobacteria and butyrate-producing
colon bacteria explains bifdobacterial competitiveness, butyrate production, and gas
production. Int J Food Microbiol, 2011. 149(1): p. 73-80.
154. Endo, H., et al., Butyrate-producing probiotics reduce nonalcoholic fatty liver disease
progression in rats: new insight into the probiotics for the gut-liver axis. PLoS One,
2013. 8(5): p. e63388.
155. Yadav, H., et al., Beneficial metabolic effects of a probiotic via butyrate-induced GLP-1
hormone secretion. J Biol Chem, 2013. 288(35): p. 25088-97.
156. Puertollano, E., S. Kolida, and P. Yaqoob, Biological significance of short-chain fatty
acid metabolism by the intestinal microbiome. Curr Opin Clin Nutr Metab Care, 2014.
17(2): p. 139-44.
157. Cummings, J.H., et al., Short chain fatty acids in human large intestine, portal, hepatic
and venous blood. Gut, 1987. 28(10): p. 1221-7.
158. Bloemen, J.G., et al., Short chain fatty acids exchange across the gut and liver in humans
measured at surgery. Clin Nutr, 2009. 28(6): p. 657-61.
159. Hong, Y.H., et al., Acetate and propionate short chain fatty acids stimulate adipogenesis
via GPCR43. Endocrinology, 2005. 146(12): p. 5092-9.

95
160. Ge, H., et al., Activation of G protein-coupled receptor 43 in adipocytes leads to
inhibition of lipolysis and suppression of plasma free fatty acids. Endocrinology, 2008.
149(9): p. 4519-26.
161. Demigne, C., et al., Effect of propionate on fatty acid and cholesterol synthesis and on
acetate metabolism in isolated rat hepatocytes. Br J Nutr, 1995. 74(2): p. 209-19.
162. Nishina, P.M. and R.A. Freedland, Effects of propionate on lipid biosynthesis in isolated
rat hepatocytes. J Nutr, 1990. 120(7): p. 668-73.
163. Bos, C.L., et al., Prostanoids and prostanoid receptors in signal transduction. Int J
Biochem Cell Biol, 2004. 36(7): p. 1187-205.
164. Al-Lahham, S.H., et al., Regulation of adipokine production in human adipose tissue by
propionic acid. Eur J Clin Invest, 2010. 40(5): p. 401-7.
165. Tedelind, S., et al., Anti-inflammatory properties of the short-chain fatty acids acetate
and propionate: a study with relevance to inflammatory bowel disease. World J
Gastroenterol, 2007. 13(20): p. 2826-32.
166. Xiong, Y., et al., Short-chain fatty acids stimulate leptin production in adipocytes
through the G protein-coupled receptor GPR41. Proc Natl Acad Sci U S A, 2004. 101(4):
p. 1045-50.
167. Al-Lahham, S.H., et al., Biological effects of propionic acid in humans; metabolism,
potential applications and underlying mechanisms. Biochim Biophys Acta, 2010.
1801(11): p. 1175-83.
168. den Besten, G., et al., The role of short-chain fatty acids in the interplay between diet, gut
microbiota, and host energy metabolism. J Lipid Res, 2013. 54(9): p. 2325-40.
169. Maslowski, K.M., et al., Regulation of inflammatory responses by gut microbiota and
chemoattractant receptor GPR43. Nature, 2009. 461(7268): p. 1282-6.
170. Fukuda, S., et al., Bifidobacteria can protect from enteropathogenic infection through
production of acetate. Nature, 2011. 469(7331): p. 543-7.
171. Blomstrand, R., Observations of the formation of ethanol in the intestinal tract in man.
Life Sci II, 1971. 10(10): p. 575-82.
172. Krebs, H.A. and J.R. Perkins, The physiological role of liver alcohol dehydrogenase.
Biochem J, 1970. 118(4): p. 635-44.
173. Ferrier, L., et al., Impairment of the intestinal barrier by ethanol involves enteric
microflora and mast cell activation in rodents. Am J Pathol, 2006. 168(4): p. 1148-54.
174. Noga, A.A. and D.E. Vance, A gender-specific role for phosphatidylethanolamine N-
methyltransferase-derived phosphatidylcholine in the regulation of plasma high density
and very low density lipoproteins in mice. J Biol Chem, 2003. 278(24): p. 21851-9.
96
175. Guo, W.X., et al., Mitochondrial dysfunction in choline deficiency-induced apoptosis in
cultured rat hepatocytes. Free Radic Biol Med, 2005. 39(5): p. 641-50.
176. Teodoro, J.S., et al., Differential alterations in mitochondrial function induced by a
choline-deficient diet: understanding fatty liver disease progression. Mitochondrion,
2008. 8(5-6): p. 367-76.
177. Pacelli, C., et al., Dietary choline deprivation impairs rat brain mitochondrial function
and behavioral phenotype. J Nutr, 2010. 140(6): p. 1072-9.
178. Soon, R.K., Jr., et al., Stress signaling in the methionine-choline-deficient model of
murine fatty liver disease. Gastroenterology, 2010. 139(5): p. 1730-9, 1739.e1.
179. Dumas, M.E., et al., Metabolic profiling reveals a contribution of gut microbiota to fatty
liver phenotype in insulin-resistant mice. Proc Natl Acad Sci U S A, 2006. 103(33): p.
12511-6.
180. Arendt, B.M., et al., Nonalcoholic fatty liver disease is associated with lower hepatic and
erythrocyte ratios of phosphatidylcholine to phosphatidylethanolamine. Appl Physiol
Nutr Metab, 2013. 38(3): p. 334-40.
181. Song, J., et al., Polymorphism of the PEMT gene and susceptibility to nonalcoholic fatty
liver disease (NAFLD). Faseb j, 2005. 19(10): p. 1266-71.
182. Li, Z., et al., Probiotics and antibodies to TNF inhibit inflammatory activity and improve
nonalcoholic fatty liver disease. Hepatology, 2003. 37(2): p. 343-50.
183. Seo, M., et al., Clostridium butyricum MIYAIRI 588 improves high-fat diet-induced non-
alcoholic fatty liver disease in rats. Dig Dis Sci, 2013. 58(12): p. 3534-44.
184. Mencarelli, A., et al., VSL#3 resets insulin signaling and protects against NASH and
atherosclerosis in a model of genetic dyslipidemia and intestinal inflammation. PLoS
One, 2012. 7(9): p. e45425.
185. Daubioul, C.A., et al., Dietary oligofructose lessens hepatic steatosis, but does not
prevent hypertriglyceridemia in obese zucker rats. J Nutr, 2000. 130(5): p. 1314-9.
186. Alisi, A., et al., Randomised clinical trial: The beneficial effects of VSL#3 in obese
children with non-alcoholic steatohepatitis. Aliment Pharmacol Ther, 2014. 39(11): p.
1276-85.
187. Loguercio, C., et al., Beneficial effects of a probiotic VSL#3 on parameters of liver
dysfunction in chronic liver diseases. J Clin Gastroenterol, 2005. 39(6): p. 540-3.
188. Aller, R., et al., Effect of a probiotic on liver aminotransferases in nonalcoholic fatty liver
disease patients: a double blind randomized clinical trial. Eur Rev Med Pharmacol Sci,
2011. 15(9): p. 1090-5.
97
189. Vajro, P., et al., Effects of Lactobacillus rhamnosus strain GG in pediatric obesity-related
liver disease. J Pediatr Gastroenterol Nutr, 2011. 52(6): p. 740-3.
190. Malaguarnera, M., et al., Bifidobacterium longum with fructo-oligosaccharides in
patients with non alcoholic steatohepatitis. Dig Dis Sci, 2012. 57(2): p. 545-53.
191. Mohammed, S.S., et al., HIV-positive patients with nonalcoholic fatty liver disease have
a lower body mass index and are more physically active than HIV-negative patients. J
Acquir Immune Defic Syndr, 2007. 45(4): p. 432-8.
192. Madill, J., et al., Oxidative stress and nutritional factors in hepatitis C virus-positive liver
recipients, controls, and hepatitis C virus-positive nontransplant patients. Transplant
Proc, 2010. 42(5): p. 1744-9.
193. Pan, X.R., et al., Effects of diet and exercise in preventing NIDDM in people with
impaired glucose tolerance. The Da Qing IGT and Diabetes Study. Diabetes Care, 1997.
20(4): p. 537-44.
194. Roza, A.M. and H.M. Shizgal, The Harris Benedict equation reevaluated: resting energy
requirements and the body cell mass. Am J Clin Nutr, 1984. 40(1): p. 168-82.
195. Matthews, D.R., et al., Homeostasis model assessment: insulin resistance and beta-cell
function from fasting plasma glucose and insulin concentrations in man. Diabetologia,
1985. 28(7): p. 412-9.
196. Brunt, E.M., et al., Nonalcoholic steatohepatitis: a proposal for grading and staging the
histological lesions. Am J Gastroenterol, 1999. 94(9): p. 2467-74.
197. Kleiner, D.E., et al., Design and validation of a histological scoring system for
nonalcoholic fatty liver disease. Hepatology, 2005. 41(6): p. 1313-21.
198. Dehghan, P., et al., Inulin controls inflammation and metabolic endotoxemia in women
with type 2 diabetes mellitus: a randomized-controlled clinical trial. Int J Food Sci Nutr,
2014. 65(1): p. 117-23.
199. Clemente-Postigo, M., et al., Endotoxin increase after fat overload is related to
postprandial hypertriglyceridemia in morbidly obese patients. J Lipid Res, 2012. 53(5):
p. 973-8.
200. Monte, S.V., et al., Reduction in endotoxemia, oxidative and inflammatory stress, and
insulin resistance after Roux-en-Y gastric bypass surgery in patients with morbid obesity
and type 2 diabetes mellitus. Surgery, 2012. 151(4): p. 587-93.
201. Basu, S., et al., Pregravid obesity associates with increased maternal endotoxemia and
metabolic inflammation. Obesity (Silver Spring), 2011. 19(3): p. 476-82.
202. Psychogios, N., et al., The human serum metabolome. PLoS One, 2011. 6(2): p. e16957.

98
203. Saude, E.J., C.M. Slumpsky, and B.D. Sykes, Optimization of NMR analysis of biological
fluids for quantitative accuracy. Metabolomics, 2006(2): p. 113-123.
204. Wishart, D.S., et al., The human cerebrospinal fluid metabolome. J Chromatogr B Analyt
Technol Biomed Life Sci, 2008. 871(2): p. 164-73.
205. Qin, J., et al., A human gut microbial gene catalogue established by metagenomic
sequencing. Nature, 2010. 464(7285): p. 59-65.
206. Le Gall, G., et al., Metabolomics of fecal extracts detects altered metabolic activity of gut
microbiota in ulcerative colitis and irritable bowel syndrome. J Proteome Res, 2011.
10(9): p. 4208-18.
207. Furet, J.P., et al., Comparative assessment of human and farm animal faecal microbiota
using real-time quantitative PCR. FEMS Microbiol Ecol, 2009. 68(3): p. 351-62.
208. Suzuki, M.T., L.T. Taylor, and E.F. DeLong, Quantitative analysis of small-subunit
rRNA genes in mixed microbial populations via 5'-nuclease assays. Appl Environ
Microbiol, 2000. 66(11): p. 4605-14.
209. Haarman, M. and J. Knol, Quantitative real-time PCR analysis of fecal Lactobacillus
species in infants receiving a prebiotic infant formula. Appl Environ Microbiol, 2006.
72(4): p. 2359-65.
210. Trumbo, P., et al., Dietary reference intakes for energy, carbohydrate, fiber, fat, fatty
acids, cholesterol, protein and amino acids. J Am Diet Assoc, 2002. 102(11): p. 1621-30.
211. Krauss, R.M., et al., Revision 2000: a statement for healthcare professionals from the
Nutrition Committee of the American Heart Association. J Nutr, 2001. 131(1): p. 132-46.
212. Institute of Medicine Standing Committee on the Scientific Evaluation of Dietary
Reference, I., The National Academies Collection: Reports funded by National Institutes
of Health, in Dietary Reference Intakes for Calcium, Phosphorus, Magnesium, Vitamin
D, and Fluoride. 1997, National Academies Press (US). National Academy of Sciences.:
Washington (DC).
213. Institute of Medicine Standing Committee on the Scientific Evaluation of Dietary
Reference, I., O.B.V. its Panel on Folate, and Choline, The National Academies
Collection: Reports funded by National Institutes of Health, in Dietary Reference Intakes
for Thiamin, Riboflavin, Niacin, Vitamin B6, Folate, Vitamin B12, Pantothenic Acid,
Biotin, and Choline. 1998, National Academies Press (US). National Academy of
Sciences.: Washington (DC).
214. Institute of Medicine Panel on, M., in Dietary Reference Intakes for Vitamin A, Vitamin
K, Arsenic, Boron, Chromium, Copper, Iodine, Iron, Manganese, Molybdenum, Nickel,
Silicon, Vanadium, and Zinc. 2001, National Academies Press (US). Copyright 2001 by
the National Academy of Sciences. All rights reserved.: Washington (DC).
99
215. Medicine, I.o., Dietary Reference Intakes for Water, Potassium, Sodium, Chloride, and
Sulfate. 2004, Washington, DC: National Academies Press.
216. Institute of Medicine Panel on Dietary, A. and C. Related, in Dietary Reference Intakes
for Vitamin C, Vitamin E, Selenium, and Carotenoids. 2000, National Academies Press
(US). Copyright 2000 by the National Academy of Sciences. All rights reserved.:
Washington (DC).
217. Wong, V.W., et al., Bacterial endotoxin and non-alcoholic fatty liver disease in the
general population: a prospective cohort study. Aliment Pharmacol Ther, 2015.
218. Serino, M., et al., Metabolic adaptation to a high-fat diet is associated with a change in
the gut microbiota. Gut, 2012. 61(4): p. 543-53.
219. de La Serre, C.B., et al., Propensity to high-fat diet-induced obesity in rats is associated
with changes in the gut microbiota and gut inflammation. Am J Physiol Gastrointest
Liver Physiol, 2010. 299(2): p. G440-8.
220. Amar, J., et al., Energy intake is associated with endotoxemia in apparently healthy men.
Am J Clin Nutr, 2008. 87(5): p. 1219-23.
221. Miller, M.A., et al., Ethnic and sex differences in circulating endotoxin levels: A novel
marker of atherosclerotic and cardiovascular risk in a British multi-ethnic population.
Atherosclerosis, 2009. 203(2): p. 494-502.
222. Dixon, A.N., et al., Effect of the orlistat on serum endotoxin lipopolysaccharide and
adipocytokines in South Asian individuals with impaired glucose tolerance. Int J Clin
Pract, 2008. 62(7): p. 1124-9.
223. Vogt, J.A. and T.M. Wolever, Fecal acetate is inversely related to acetate absorption
from the human rectum and distal colon. J Nutr, 2003. 133(10): p. 3145-8.
224. Macfarlane, S. and G.T. Macfarlane, Regulation of short-chain fatty acid production.
Proc Nutr Soc, 2003. 62(1): p. 67-72.
225. Fernandes, J., et al., Adiposity, gut microbiota and faecal short chain fatty acids are
linked in adult humans. Nutr Diabetes, 2014. 4: p. e121.
226. den Besten, G., et al., Gut-derived short-chain fatty acids are vividly assimilated into host
carbohydrates and lipids. Am J Physiol Gastrointest Liver Physiol, 2013. 305(12): p.
G900-10.
227. Isobutyric Acid. National Center for Biotechnology Information. PubChem Compound
Database; CID=6590, https://pubchem.ncbi.nlm.nih.gov/compound/6590 (accessed July
20, 2015).
228. 2-Hydroxybutyric acid. HMDB Version 3.6.,
http://www.hmdb.ca/metabolites/hmdb00008 (accessed July 20, 2015).
100
229. Doelle, H.W., Bacterial Metabolism. 1969, New York: Academic Press, Inc.
230. Li, X., et al., Comprehensive two-dimensional gas chromatography/time-of-flight mass
spectrometry for metabonomics: Biomarker discovery for diabetes mellitus. Anal Chim
Acta, 2009. 633(2): p. 257-62.
231. Gall, W.E., et al., alpha-hydroxybutyrate is an early biomarker of insulin resistance and
glucose intolerance in a nondiabetic population. PLoS One, 2010. 5(5): p. e10883.
232. Schicho, R., et al., Quantitative metabolomic profiling of serum, plasma, and urine by
(1)H NMR spectroscopy discriminates between patients with inflammatory bowel disease
and healthy individuals. J Proteome Res, 2012. 11(6): p. 3344-57.
233. Nehra, V., et al., Nutritional and metabolic considerations in the etiology of nonalcoholic
steatohepatitis. Dig Dis Sci, 2001. 46(11): p. 2347-52.
234. Baker, J.R. and S. Chaykin, The biosynthesis of trimethylamine-N-oxide. J Biol Chem,
1962. 237: p. 1309-13.
235. Messenger, J., et al., A review of trimethylaminuria: (fish odor syndrome). J Clin Aesthet
Dermatol, 2013. 6(11): p. 45-8.
236. Tang, W.H., et al., Intestinal microbial metabolism of phosphatidylcholine and
cardiovascular risk. N Engl J Med, 2013. 368(17): p. 1575-84.
237. Tang, W.H., et al., Gut microbiota-dependent trimethylamine N-oxide (TMAO) pathway
contributes to both development of renal insufficiency and mortality risk in chronic
kidney disease. Circ Res, 2015. 116(3): p. 448-55.
238. Bae, S., et al., Plasma choline metabolites and colorectal cancer risk in the Women's
Health Initiative Observational Study. Cancer Res, 2014. 74(24): p. 7442-52.
239. Athyros, V.G., et al., Cardiovascular risk across the histological spectrum and the
clinical manifestations of non-alcoholic fatty liver disease: An update. World J
Gastroenterol, 2015. 21(22): p. 6820-6834.
240. Tabakoff, B., N. Cornell, and P.L. Hoffman, Alcohol tolerance. Ann Emerg Med, 1986.
15(9): p. 1005-12.
241. Zakhari, S., Overview: how is alcohol metabolized by the body? Alcohol Res Health,
2006. 29(4): p. 245-54.
242. Sghir, A., et al., Quantification of bacterial groups within human fecal flora by
oligonucleotide probe hybridization. Appl Environ Microbiol, 2000. 66(5): p. 2263-6.
243. Lay, C., et al., Colonic microbiota signatures across five northern European countries.
Appl Environ Microbiol, 2005. 71(7): p. 4153-5.
101
244. Sokol, H., et al., Faecalibacterium prausnitzii is an anti-inflammatory commensal
bacterium identified by gut microbiota analysis of Crohn disease patients. Proc Natl
Acad Sci U S A, 2008. 105(43): p. 16731-6.
245. Bahl, M.I., A. Bergstrom, and T.R. Licht, Freezing fecal samples prior to DNA extraction
affects the Firmicutes to Bacteroidetes ratio determined by downstream quantitative PCR
analysis. FEMS Microbiol Lett, 2012. 329(2): p. 193-7.
246. Basiotis, P.P., et al., Number of days of food intake records required to estimate
individual and group nutrient intakes with defined confidence. J Nutr, 1987. 117(9): p.
1638-41.
247. Park, H.A., J.S. Lee, and L.H. Kuller, Underreporting of dietary intake by body mass
index in premenopausal women participating in the Healthy Women Study. Nutr Res
Pract, 2007. 1(3): p. 231-6.
248. Mendez, M.A., et al., Under- and overreporting of energy is related to obesity, lifestyle
factors and food group intakes in Jamaican adults. Public Health Nutr, 2004. 7(1): p. 9-
19.
249. Hill, R.J. and P.S. Davies, The validity of self-reported energy intake as determined using
the doubly labelled water technique. Br J Nutr, 2001. 85(4): p. 415-30.
250. York, L.W., S. Puthalapattu, and G.Y. Wu, Nonalcoholic fatty liver disease and low-
carbohydrate diets. Annu Rev Nutr, 2009. 29: p. 365-79.
251. Gill, H.K. and G.Y. Wu, Non-alcoholic fatty liver disease and the metabolic syndrome:
effects of weight loss and a review of popular diets. Are low carbohydrate diets the
answer? World J Gastroenterol, 2006. 12(3): p. 345-53.
252. Thoma, C., C.P. Day, and M.I. Trenell, Lifestyle interventions for the treatment of non-
alcoholic fatty liver disease in adults: a systematic review. J Hepatol, 2012. 56(1): p. 255-
66.
253. Warner, E.T., et al., Differential accuracy of physical activity self-report by body mass
index. Am J Health Behav, 2012. 36(2): p. 168-78.
254. Brown, B.B. and C.M. Werner, Using accelerometer feedback to identify walking
destinations, activity overestimates, and stealth exercise in obese and nonobese
individuals. J Phys Act Health, 2008. 5(6): p. 882-93.
255. Clarke, S.F., et al., Exercise and associated dietary extremes impact on gut microbial
diversity. Gut, 2014. 63(12): p. 1913-20.
256. Madsen, J.L. and J. Graff, Effects of ageing on gastrointestinal motor function. Age
Ageing, 2004. 33(2): p. 154-9.
257. Madsen, J.L., Effects of gender, age, and body mass index on gastrointestinal transit
times. Dig Dis Sci, 1992. 37(10): p. 1548-53.
102
258. Orr, W.C. and C.L. Chen, Aging and neural control of the GI tract: IV. Clinical and
physiological aspects of gastrointestinal motility and aging. Am J Physiol Gastrointest
Liver Physiol, 2002. 283(6): p. G1226-31.
259. Metcalf, A.M., et al., Simplified assessment of segmental colonic transit.
Gastroenterology, 1987. 92(1): p. 40-7.
260. Lakshminarayanan, B., et al., Compositional dynamics of the human intestinal microbiota
with aging: implications for health. J Nutr Health Aging, 2014. 18(9): p. 773-86.
261. De Filippo, C., et al., Impact of diet in shaping gut microbiota revealed by a comparative
study in children from Europe and rural Africa. Proc Natl Acad Sci U S A, 2010.
107(33): p. 14691-6.
262. Lin, A., et al., Distinct distal gut microbiome diversity and composition in healthy
children from Bangladesh and the United States. PLoS One, 2013. 8(1): p. e53838.
263. Nam, Y.D., et al., Comparative analysis of Korean human gut microbiota by barcoded
pyrosequencing. PLoS One, 2011. 6(7): p. e22109.
264. Yatsunenko, T., et al., Human gut microbiome viewed across age and geography. Nature,
2012. 486(7402): p. 222-7.
265. National High Blood Pressure Education, P., in The Seventh Report of the Joint National
Committee on Prevention, Detection, Evaluation, and Treatment of High Blood Pressure.
2004, National Heart, Lung, and Blood Institute (US): Bethesda (MD).
266. Poynard, T., et al., Validation of liver fibrosis biomarker (FibroTest) for assessing liver
fibrosis progression: proof of concept and first application in a large population. J
Hepatol, 2012. 57(3): p. 541-8.
267. Pathik, P., et al., Fibroscan versus simple noninvasive screening tools in predicting
fibrosis in high-risk nonalcoholic fatty liver disease patients from Western India. Ann
Gastroenterol, 2015. 28(2): p. 281-286.
268. McDonald, J.A., et al., Evaluation of microbial community reproducibility, stability and
composition in a human distal gut chemostat model. J Microbiol Methods, 2013. 95(2): p.
167-74.
269. Cammarota, G., et al., Randomised clinical trial: faecal microbiota transplantation by
colonoscopy vs. vancomycin for the treatment of recurrent Clostridium difficile infection.
Aliment Pharmacol Ther, 2015. 41(9): p. 835-43.
270. Stollman, N., et al., Frozen encapsulated stool in recurrent Clostridium difficile:
exploring the role of pills in the treatment hierarchy of fecal microbiota transplant
nonresponders. Am J Gastroenterol, 2015. 110(4): p. 600-1.

103
271. Vrieze, A., et al., Transfer of intestinal microbiota from lean donors increases insulin
sensitivity in individuals with metabolic syndrome. Gastroenterology, 2012. 143(4): p.
913-6.e7.
104
Appendices
APPENDIX 1
Patient Information Sheet & Consent Form
Study Title: Non-alcoholic Steato-hepatitis (NASH) Versus Simple Hepatic Steatosis: Is
There a Difference in the Nutritional Factors Influencing Lipid Peroxidation and
Inflammation?
PRINCIPAL INVESTIGATOR: Dr. Johane P. Allard Tel: (416) 340-5159
SPONSOR: Canadian Liver Foundation & Canadian Institutes of Health Research
Introduction
You were referred to a liver specialist because of elevated liver enzymes and/or fat infiltration in
your liver detected by blood work or abdominal ultrasound. As part of standard medical care, a
hepatologist (liver specialist) ordered a liver biopsy to make a diagnosis. A biopsy consists of a
very small sample of your liver taken with a needle. Prior to having the liver biopsy, a research
study coordinator will contact you to ask you if you would be interested in participating in a
research study. The only way to determine if you are eligible for the study is to examine the
sample of tissue taken from your liver biopsy, but, we first need your permission to be able to
look at the tissue.
If you agree to allowing us to look at a portion of the liver biopsy, and if the tissue confirms the
diagnosis of liver steatosis (fat in the liver) or non-alcoholic steatohepatitis (fat with
inflammation) and no other causes are found or you have a completely normal liver biopsy
result, the research coordinator will contact you to see if you agree to have further assessments.
It is important that you understand the purpose, procedures, benefits, discomfort, risks and
precautions associated with the study before you agree to participate, so that you can make an
informed decision. This is known as the informed consent process. If there is anything in this
form that you do not understand, please consult the study coordinator. Make sure all your
questions have been answered to your satisfaction before signing this document.
Of course, you have the right to refuse to participate and also the right to withdraw from the
study at any time.
Purpose of the Study
Fatty infiltration of the liver can be associated with alcohol, obesity, diabetes and abnormal fat
and sugar handling by your body. When alcohol intake is excluded, this is called a “Non-
Alcoholic Fatty Liver” or “NAFLD”. If it is associated with inflammation (cell damage), it is
called “Non-Alcoholic Steato-Hepatitis” or “NASH”. No one knows why some patients with
excess fat in their liver remain stable while others progress to a more advanced disease like
cirrhosis.
Therefore, the purpose of this study is to determine if nutritional factors measured in your blood
and diet or the kind of bacteria that are found in the intestinal tract can have an effect on liver
tissue damage, the type of fat deposited in the liver and also the genes involved in fat and sugar
metabolism. We are also measuring bacterial products in stool and blood samples.
105
About 190 patients with liver-biopsy proven simple steatosis (fat infiltration), NASH (fat with
inflammation) or people with minimal findings on liver biopsy will participate in this study at
The Toronto General Hospital and The Toronto Western Hospital. For the purpose of this study,
nutritional assessment and blood work will be done only in one occasion, and we will ask the
participants for one single stool sample. Fifty patients with healthy liver will serve as a control
group.
Study Procedures
If you consent to participate in this study, the following study procedures are to be performed at
each study visit.
First Visit: (Approximately 30 minutes)
This visit is the present clinical appointment with your liver specialist where the decision is made
to do the liver biopsy. You are now presented with the consent form for the study and meet with
the study coordinator who explains the study and ask you to sign the consent. You will be
instructed to record your food intake and physical activity for a period of 7 days. You will also
receive instructions and the material to collect a stool sample.
Second Visit
According to standard care, you need a liver biopsy. This is an in-hospital procedure performed
by a liver specialist using local anesthesia. Local anesthesia means that a small area of your skin
over the liver will be frozen with a very small needle and then a specially designed needle will be
inserted between the ribs into the liver. The biopsy takes only a moment and there is slight
discomfort during the procedure. In some cases, the liver specialist cannot perform the liver
biopsy due to anatomical reasons. In this case, you will be referred to the ultrasound department
for your liver biopsy. The procedure is the same, but ultrasound is used to locate the best place to
obtain the liver sample, and the person performing the procedure will be an interventional
radiologist.
During the procedure, usually 1 – 2 small standard samples (3.0 cm long x 1 cm thickness (liver
specialist) or 2.5 cm long x 1 mm thickness (radiology)) will be taken from your liver to assess
for the presence of fat and inflammation (you will be provided with the standard consent form
routinely used for performing liver biopsy procedure). The study coordinator is present during
the liver biopsy and takes a portion of the sample for future tests.
After the biopsy you will be kept under observation for 2 to 4 hours.
We will ask you to collect a stool sample the day before your liver biopsy and bring the sample
with you to the hospital, where you give it to the study coordinator. We will ask you to fill out an
environmental questionnaire that inquires about factors that could influence the bacteria
composition in your stool.
The saved portion of the liver biopsy and the stool sample will be identified by a code and if you
decide not to participate in the study, they will be destroyed.
This entire visit will last 4-5 hours.
Third Visit: Follow-up with liver specialist for liver biopsy results (1-2 months after)
After the liver biopsy, you will need a follow-up appointment with the liver specialist to discuss
the results of the liver biopsy and possible treatments. You will be contacted by the study
106
coordinator about 10 days before the follow-up visit if the diagnosis of simple steatosis or NASH
is made and you qualify for the rest of the study. You will be instructed to record your food
intake for a period of 7 days (forms will be given to you in the first visit). Before your visit, you
will need to be in a fasting state for 12 hours (nothing to eat or drink overnight) for blood work
and nutritional assessment.
During this visit, you will return the 7-days food and activity record. The study coordinator will
record your medical history and review your medical chart for your drug regimen and previous
blood results. Your body fat will be measured (by taking the circumferences of your waist and
hip). Using a device, your skinfold thickness will be measured at several sites on your body
(mainly at your arms and at the back of your shoulders). You will have blood taken (5 table
spoons) for different measurements.
This visit will take 30 minutes with the study coordinator.
Participation and Withdrawal
Your participation in this study is voluntary. You can choose not to participate and you may
withdraw at any time without affecting your medical care. During the course of the study, you
will be kept informed of any new treatments or finding that may influence your participation in
the study. It is your responsibility to follow the directions and rules of the study. The data
gathered from this study is being monitored on an on-going basis by the study coordinator. You
will be notified of the results of the study once the study is completed.
Risks
There is always a small risk involved in invasive procedures such as the liver biopsy. These
risks are not related to research procedures and they are associated with your routine clinical
care. To minimize this risk, the biopsies will be done in the hospital premises by a very
experienced liver specialist or interventional radiologist. There may be some pain (in about 10%
of cases), which is usually mild and does not last long. Occasionally the pain is more severe and
requires painkillers. However, this also usually passes within a few hours. Bleeding may occur
in about 1 in 5000 to 1 in 10,000 cases. Rarely the needle will penetrate another organ, such as
the gall bladder. All such complications are usually managed without requiring surgery.
There may also be a risk associated with drawing blood with a needle which include discomfort,
bruising, or infection where the needle goes in.
Benefits
You may not receive any medical benefit from your participation in this study. However,
depending on the results of your tests, you may be asked in the near future (2-3 months) to
participate in another study where an intervention will be proposed to improve your liver
condition.
Remuneration
There will be no costs to you for participating in the study and you will not be charged for any
research procedure. You will receive $50.00 for participating in the study to compensate for
your time and traveling expenses once you complete the study. If you leave the study early, you
will be reimbursed for the time you have spent in the study.
107
Compensation
If you become ill or are physically injured as a result of participation in this study, medical
treatment will be provided. The reasonable costs of such treatment will be covered by your
health insurance for any injury or illness that is directly a result of participation in this trial. In
no way does signing this consent form waive your legal rights nor does it relieve the
investigators, sponsors or involved institutions from their legal and professional responsibilities”.
Confidentiality
All information obtained during the study will be held in strict confidence. All the samples will
be identified by a code. No names or identifying information will be used in any publication or
presentations. For the purpose of verification of clinical trial procedures and/or data, members of
specific agencies in the presence of the investigator or his/her staff may look at sections of your
medical records that are related to the study without participant’s names attached. These
agencies include: members of the Research Ethic Board and a representative from the Canadian
Liver Foundation and the Canadian Institutes of Health Research. By signing this form, you are
agreeing to make your study records available to the above-mentioned individuals. The above-
mentioned individuals will not see information that is not related to the study. No information
identifying you will be transferred outside the investigators in this study.
Contact Person
If you have any questions about the study, please contact Bianca Arendt (Study Coordinator) at
(416) 340-4104 or Dr. Johane Allard at (416) 340-5159.
If you have any questions about your rights as a research subjects, please call the chair of the
University Health Network Research Ethics Board at (416) 340-4557.
Consent
I have had the opportunity to discuss this study and my questions have been answered to my
satisfaction. I consent to take part in the study with the understanding that I may withdraw at any
time without affecting my medical care. I have received a signed copy of this consent form. I
voluntarily consent to participate in this study. I also understand that there is no guarantee that
this study will provide any benefit to me.
_______________________ __________________________ ____________
Patient’s Name (Please Print) Patient’ Signature Date
The potential benefits, risks and procedures associated with this study have been fully explained
to the volunteer and he/she has had ample time and opportunity to ask questions and to decide
whether or not to participate in the study. A copy of the signed consent form has been given to
the participant.
______________________ _________________________ __________
Name of Person Obtaining Signature Date
Consent

108
Patient Information Sheet & Consent Form
Healthy Liver Donors
Study Title: Non-alcoholic Steato-hepatitis (NASH) Versus Simple Hepatic Steatosis: Is
There a Difference in the Nutritional Factors Influencing Lipid Peroxidation and
Inflammation?
PRINCIPAL INVESTIGATOR: Dr. Johane P. Allard Tel: (416) 340-5159
SPONSOR: Canadian Liver Foundation & Canadian Institutes of Health Research
Introduction
You were seen in the Transplant Clinic of the University Health Network and you have
consented to operative and treatment procedures to donate part of your liver for liver
transplantation. In addition, you have signed consent to store a sample of your liver tissue for
future research. We are seeking your permission to use a portion of your liver, and samples of
your subcutaneous (fat under your skin) and mesenteric fat (fat around the internal organs) tissue
(0.5-1 g) as a control for a nutritional study.
If you agree to allow us to look at portions of your liver and fat tissue, the research coordinator
will contact you to see if you agree to have further nutritional assessments.
It is important that you understand the purpose, procedures, benefits, discomfort, risks and
precautions associated with the study before you agree to participate, so that you can make an
informed decision. This is known as the informed consent process. If there is anything in this
form that you do not understand, please consult the study coordinator. Make sure all your
questions have been answered to your satisfaction before signing this document.
Of course, you have the right to refuse to participate and also the right to withdraw from the
study at any time.
Purpose of the Study
Fatty infiltration of the liver can be associated with alcohol, obesity, diabetes and abnormal fat
and sugar handling by your body. When alcohol intake is excluded, this is called a “Non-
Alcoholic Fatty Liver” or “NAFLD”. If it is associated with inflammation (cell damage), it is
called “Non-Alcoholic Steato-Hepatitis” or “NASH”. No one knows why some patients with
excess fat in their liver remain stable while others progress to a more advanced disease like
cirrhosis and liver failure requiring liver transplantation. The purpose of this study is to
determine if nutritional factors measured in the blood and diet or the kind of bacteria that are
found in the intestinal tract can have an effect on liver tissue damage, the type of fat deposited in
the liver and also the genes involved in fat and sugar metabolism. We are also measuring
bacterial products in stool and blood samples.
You are asked to serve as a healthy control subject for this study. We would like to have similar
measurements from people with a healthy liver for comparison.
About 190 patients with liver-biopsy proven simple steatosis (fat infiltration), NASH (fat with
inflammation) or people with minimal findings on liver biopsy will participate in this study at
The Toronto General Hospital and The Toronto Western Hospital. For the purpose of this study,
nutritional assessment and blood work will be done only in one occasion, and we will ask the

109
participants for one single stool sample. Fifty patients with healthy liver will serve as a control
group.
Study Procedures
If you consent to participate in this study, the following study procedures are to be performed.
First Visit: (Approximately 30 minutes)
This visit is the present clinical appointment in the Transplant Clinic. You are now presented
with the consent form for the study and meet with the study coordinator who explains the study
and ask you to sign the consent. The study coordinator will review your medical chart and may
ask you some questions regarding your medical history and medications that you are taking. You
will then be instructed to record your food intake and physical activity for a period of 7 days.
Your body fat will be measured (by taking the circumferences of your waist and hip). Using a
device, your skinfold thickness will be measured at several sites on your body (mainly at your
arms and at the back of your shoulders).
You will need to be in a fasting state for 12 hours (nothing to eat or drink overnight) for blood
work. If you are fasting for this visit, you will have blood taken (5 table spoons) for different
measurements. If you are not in a fasting state, this will be done in the next visit. You will also
receive instructions and the material to collect a stool sample and an environmental questionnaire
that inquires about factors that could influence the bacteria composition in your stool. This form
should be filled out on the same day you are collecting the stool.
Second Visit (The day of the surgery)
During this visit, you will return the 7-days food, the activity record, the environmental
questionnaire and the stool sample. The study coordinator is present during the surgery and
takes the samples for future tests. The stool sample and the saved tissue portions will be
identified by a code and if you decide not to participate in the study, they will be destroyed.
Participation and Withdrawal
Your participation in this study is voluntary. You can choose not to participate and you may
withdraw at any time without affecting your medical care. It is your responsibility to follow the
directions and rules of the study. The data gathered from this study is being monitored on an
on-going basis by the study coordinator.
Risks
There may be a small risk associated with drawing blood with a needle which include
discomfort, bruising, or infection where the needle goes in.
Benefits
You may not receive any medical benefit personally from your participation in this study.
However, your participation will help understand the mechanism by which fatty liver disease can
develop and progress.
Remuneration
There will be no costs to you for participating in the study and you will not be charged for any
research procedure. You will receive $50.00 for participating in the study to compensate for
your time once you complete the study. If you leave the study early, you will be reimbursed for
the time you have spent in the study.
Compensation
If you become ill or are physically injured as a result of participation in this study, medical
treatment will be provided. The reasonable costs of such treatment will be covered by your
110
health insurance for any injury or illness that is directly a result of participation in this trial. In
no way does signing this consent form waives your legal rights nor does it relieve the
investigators, sponsors or involved institutions from their legal and professional responsibilities”.
Confidentiality
All information obtained during the study will be held in strict confidence. All the samples will
be identified by a code. No names or identifying information will be used in any publication or
presentations. For the purpose of verification of clinical trial procedures and/or data, members of
specific agencies in the presence of the investigator or his/her staff may look at sections of your
medical records that are related to the study without participant’s names attached. These
agencies include: members of the Research Ethic Board and a representative from the Canadian
Liver Foundation and the Canadian Institutes of Health Research. By signing this form, you are
agreeing to make your study records available to the above-mentioned individuals. The above-
mentioned individuals will not see information that is not related to the study. No information
identifying you will be transferred outside the investigators in this study.
Contact Person
If you have any questions about the study, please contact Bianca Arendt (Study Coordinator) at
(416) 340-4104 or Dr. Johane Allard at (416) 340-5159.
If you have any questions about your rights as a research subjects, please call the chair of the
University Health Network Research Ethics Board at (416) 340-4557.
Consent
I have had the opportunity to discuss this study and my questions have been answered to my
satisfaction. I consent to take part in the study with the understanding that I may withdraw at any
time without affecting my medical care. I have received a signed copy of this consent form. I
voluntarily consent to participate in this study. I also understand that there is no guarantee that
this study will provide any benefit to me.
_______________________ __________________________ ____________
Patient’s Name (Please Print) Patient’ Signature Date
The potential benefits, risks and procedures associated with this study have been fully explained
to the volunteer and he/she has had ample time and opportunity to ask questions and to decide
whether or not to participate in the study. A copy of the signed consent form has been given to
the participant.
______________________ _________________________ __________
Name of Person Obtaining Signature Date
Consent

111
APPENDIX 2
Subject Instructions for Stool Collection
You will be provided by a Plastic Buff Bag with: 1- Collection Bowl
2- Re-sealable plastic bag
3- Storage Ziploc container
4- Two ice bags
5- Cooler bag
Please follow these instructions carefully.
Important: As soon as you are at home, please put the ice bags in the freezer.
Collection Bowl and Package of Plastic Bag
You will note that the collection bowl has no bottom.
This is so you can insert the re-sealable plastic bag through it and
Fold the edge of the bag over top of the collection bowl.
The collection bowl is then lowered into centre of the toilet insert.
Plastic Toilet Insert
-Insert the collection bowl with bag into the toilet insert.
-Raise the toilet seat and place insert directly on porcelain rim of bowl.
-Lower seat and sit as usual.
Collection of Stool samples:
-Collect feces in a plastic bag folded over the top of a no-bottom collection bowl placed into the
toilet insert
-Close the bag tightly then put it in the storage Ziploc container
-Keep the sample at 4C (Freezer) until the date of liver biopsy.
-For sample transportation to the Toronto General Hospital, maintain the sample between the 2
frozen ice bags in the cooler bag during transportation to the Toronto General Hospital ( the stool
should be collected as early as possible to the liver biopsy date, ideally within 24 hours)

112
APPENDIX 3
Environmental Questionnaire
Patient ID ____________ Visit Date _____________
1. What country were you born in? _____________________________
2. If you were not born in Canada, when did you immigrate? ___________
3. What is your ethnic background? (Check all that apply)
□ African-Canadian □ Asian □ Caucasian
□ First Nation □ Hispanic □ Hispanic-Black
□ Middle Eastern □ Other _________________ (specify)
4. How were you born? □ Caesarian section (C-section) □ Natural birth □ I don’t know
5a. As an infant, were you ever breastfed?
□ Yes □ Never □ I don’t know
5b. If “Yes”, how long were you breastfed?
□ Less than 6 month □ More than 6 months □ I don’t know
6a. Do you have any allergies or food intolerances?
□ Yes □ No □ I don’t know
6b. If “Yes”, please specify: ________________________
7a. Do you have any history of gastro-intestinal diseases (e.g. inflammatory
bowel disease, celiac disease, gastric ulcer)?
□ Yes □ No □ I don’t know
7b. If “Yes”, please specify: _____________________
8a. Did you ever have any major abdominal surgery?
□ Yes □ No □ I don’t know

113
8b. If “Yes”, please specify: ________________________
Date of surgery: _____________________ (mm/yyyy)
9a. During the last 6 months, did you use any antibiotics?
□ Yes □ No □ I don’t know
9b. If “Yes”, when was the last time you used antibiotics?
________________________ (dd/mm/yy)
10a. During the last 6 months, did you use any laxatives?
□ Yes □ No □ I don’t know
10b. If “Yes”, how often do you use a laxative? __________________
10c. If “Yes”, when was the last time you used a laxative?
_________________ (dd/mm/yy)
11. Are you using any pre- or probiotic or synbiotic products on a regular basis (as
a food product or as a supplement such as tablets, powder, etc.)?
□ Yes □ No □ I don’t know
Name(s) of the product(s): ________________________
12. Did you travel outside of North-America during the last 6 months?
□ Yes Country: __________________ □ No
13a. Did you have any gastrointestinal infections during the last 6 months
(e.g. traveller’s diarrhea)
□ Yes □ No □ I don’t know
13b. If “Yes”, when did you have the last infection?
________________________ (dd/mm/yy)
14. Do you have any pets at home?
□ Yes What animal(s)? __________________ □ No
15a. Female Participants ONLY: Are you using any contraceptives?
□ Yes Specify: _______________________ □ No

114
15b. When was the first day of your last period? ____________________ (dd/mm/yy) □ I am past my menopause
15c. Usual length of your menstrual cycle? ___ days □ I don’t know
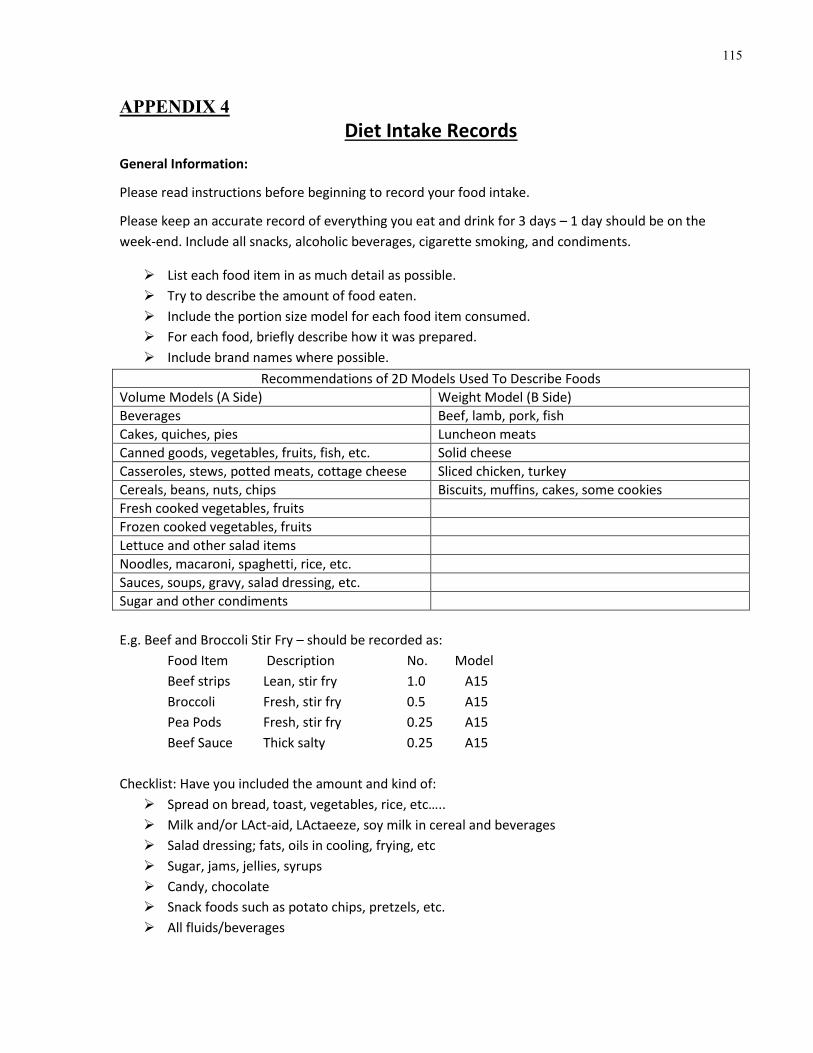
115
APPENDIX 4
Diet Intake Records
General Information:
Please read instructions before beginning to record your food intake.
Please keep an accurate record of everything you eat and drink for 3 days – 1 day should be on the
week-end. Include all snacks, alcoholic beverages, cigarette smoking, and condiments.
List each food item in as much detail as possible.
Try to describe the amount of food eaten.
Include the portion size model for each food item consumed.
For each food, briefly describe how it was prepared.
Include brand names where possible.
Recommendations of 2D Models Used To Describe Foods
Volume Models (A Side) Weight Model (B Side)
Beverages Beef, lamb, pork, fish
Cakes, quiches, pies Luncheon meats
Canned goods, vegetables, fruits, fish, etc. Solid cheese
Casseroles, stews, potted meats, cottage cheese Sliced chicken, turkey
Cereals, beans, nuts, chips Biscuits, muffins, cakes, some cookies
Fresh cooked vegetables, fruits
Frozen cooked vegetables, fruits
Lettuce and other salad items
Noodles, macaroni, spaghetti, rice, etc.
Sauces, soups, gravy, salad dressing, etc.
Sugar and other condiments
E.g. Beef and Broccoli Stir Fry – should be recorded as:
Food Item Description No. Model
Beef strips Lean, stir fry 1.0 A15
Broccoli Fresh, stir fry 0.5 A15
Pea Pods Fresh, stir fry 0.25 A15
Beef Sauce Thick salty 0.25 A15
Checklist: Have you included the amount and kind of:
Spread on bread, toast, vegetables, rice, etc…..
Milk and/or LAct-aid, LActaeeze, soy milk in cereal and beverages
Salad dressing; fats, oils in cooling, frying, etc
Sugar, jams, jellies, syrups
Candy, chocolate
Snack foods such as potato chips, pretzels, etc.
All fluids/beverages

116
DAILY FOOD INTAKE
ID: _________________________ Day of Week: ____________ Date: ________________
Time Food Item Description (frozen, fried, broiled; salted; brand name; etc.)
No. of serving
Amount/Model
Multiple/ B side Thickness

117
Activity Log Form
Please complete this activity log sheet for a period of the 7 days before your clinic visit.
According to the table provided below, please let us know how many units of exercise you
have performed in a day.
Activities required for one unit of exercise:
Intensity Time (min) Type of activity
Mild 30 Slow walking, Traveling by bus, Shopping,
Housecleaning
Moderate 20 Faster walking or walking down stairs, Cycling, Doing
heavy laundry, Ballroom dancing (slow)
Strenuous 10 Slow running, Climbing stairs, Disco dancing for the
elderly, Playing volley ball or table tennis
Very Strenuous 5 Jumping rope, Playing basketball, Swimming
ID: ________________________ DAY: _____________ DATE: _____________
Activity Log Sheet
Type of Activity Start
Time
Stop
Time
Intensity Level Duration of
Activity
Unit of
Exercise