The MRO Market & Key Trends - aviationsuppliers.org · THE MRO MARKET & KEY TRENDS ASA Annual...
37
ICF proprietary and confidential. © ICF 2018 THE MRO MARKET & KEY TRENDS ASA Annual Conference 26 June 2018 Richard Brown Principal [email protected]
Transcript of The MRO Market & Key Trends - aviationsuppliers.org · THE MRO MARKET & KEY TRENDS ASA Annual...

ICF proprietary and confidential. © ICF 2018
THE MRO MARKET & KEY TRENDSASA Annual Conference26 June 2018
Richard BrownPrincipal
ICF proprietary and confidential. © ICF 2018ICF proprietary and confidential. © ICF 2018
Today’s Agenda
1. Industry Context
2.MRO Market
3.Trends to watch
226 June 2018
ICF proprietary and confidential. © ICF 2018ICF proprietary and confidential. © ICF 2018
Industry
Context
326 June 2018

ICF proprietary and confidential. © ICF 2018ICF proprietary and confidential. © ICF 2018
Global airline industry achieved a record profitability of $38B USD in 2017, which is forecast to decrease to $33.8B in 2018
INDUSTRY CONTEXT
GLOBAL AIRLINE PROFITABILITY, 1998 – 2018F
-$30
-$20
-$10
$0
$10
$20
$30
$40
$USD
Billions
Europe, $8.6B
Africa, -$0.1B
North America, $15.0B
Asia Pacific, $8.2B
Middle East, $1.3BLatin America, $0.9B
$33.8B
4
Source: IATA/ ICF Analysis
26 June 2018

ICF proprietary and confidential. © ICF 2018ICF proprietary and confidential. © ICF 2018
…but many airlines continue to struggle though North America has been a bright spot and was leading the way in 2017
INDUSTRY CONTEXT
-1.8%
-4.7%
0.1%
2.3%
1.0%
-0.9%
3.4%
4.7%
0.7%1.5%
3.0%
-0.4%
12.9%
5.2%
4.5%
2.9%
0.7%
-3.6%-5%
0%
5%
10%
15% 2008 2012 2017 2018F
Source: IATA/ ICF Analysis
GLOBAL AIRLINE EBIT MARGIN BY REGION
526 June 2018

ICF proprietary and confidential. © ICF 2018ICF proprietary and confidential. © ICF 2018
0%
1%
2%
3%
4%
5%
6%
7%
8%
9%
0.0
0.5
1.0
1.5
2.0
2.5
3.0
3.5
Jan
-10
Apr-
10
Jul-
10
Oct-
10
Jan
-11
Apr-
11
Jul-
11
Oct-
11
Jan
-12
Apr-
12
Jul-
12
Oct-
12
Jan
-13
Apr-
13
Jul-
13
Oct-
13
Jan
-14
Apr-
14
Jul-
14
Oct-
14
Jan
-15
Apr-
15
Jul-
15
Oct-
15
Jan
-16
Apr-
16
Jul-
16
Oct-
16
Jan
-17
Apr-
17
Jul-
17
Oct-
17
Jan
-18
Apr-
18
Traffic growth driven by low fuel prices is slowly reversing, as 2018 has shown YTD growth of ~6.0%
INDUSTRY CONTEXT
Source: EIA; IATA
Fuel prices
declined ~50%
Air traffic growth rates increased from 5%
annually to >7.5% …
… but YTD growth limited at 6.0%
Jet fuel spot
price
($ per gallon)
Air traffic annual
growth rate
Fuel edging
back up
26 June 2018 6

ICF proprietary and confidential. © ICF 2018ICF proprietary and confidential. © ICF 2018
0%
10%
20%
30%
40%
50%
60%
70%
0
2,000
4,000
6,000
8,000
10,000
12,000
14,000
16,000
COMMERCIAL AIRCRAFT OEM PRODUCTION BACKLOG DRIVERS OF OEM BACKLOG
Backlog more than doubled
between 2010 and 2014,
driven by:
– Emerging market growth
– Very low interest rates and
plentiful capital
– High oil and commodity
prices
– Introduction of new
technology aircraft/engines
In 2017, total backlog
decreased for the first time
since 2009 as deliveries ramp-
up and orders slowdown
Commercial aircraft OEM production backlog remains at historical highs
INDUSTRY CONTEXT
Source: CAPA, ICF Analysis
Order
BacklogBacklog/
% Active Fleet
# of aircraft
726 June 2018

ICF proprietary and confidential. © ICF 2018ICF proprietary and confidential. © ICF 2018
MRO Market
826 June 2018

ICF proprietary and confidential. © ICF 2018ICF proprietary and confidential. © ICF 2018
NarrowbodyJet
WidebodyJet
Turboprop
Regional Jet
55%
13%
19%
13%
The current commercial air transport fleet consists of ~29,100 aircraft; ~8,500 are located in North America
MRO MARKET
2017 GLOBAL COMMERCIAL AIR TRANSPORT FLEET
Source: ICF Analysis: CAPA 2017
BY AIRCRAFT TYPE
~29,100
Aircraft
BY GLOBAL REGION
29%
29%
24%
7%
6%5%
Latin America
Africa North
America
(~8,500)
Asia
Pacific
Middle East
~29,100
Aircraft
Europe
926 June 2018
ICF proprietary and confidential. © ICF 2018ICF proprietary and confidential. © ICF 2018
29%35%
37%
29%
23%
20%24%
23%
22%
7%
8%
8%
7%
7%
5%
0
5,000
10,000
15,000
20,000
25,000
30,000
35,000
40,000
45,000
50,000
2017 2027 2037
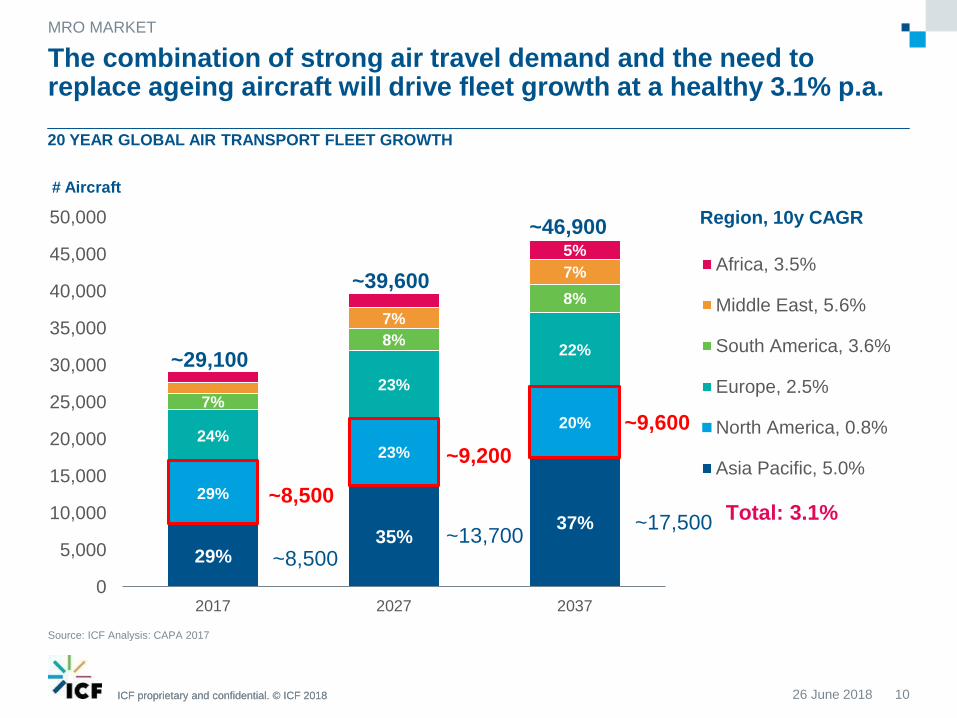
Africa, 3.5%
Middle East, 5.6%
South America, 3.6%
Europe, 2.5%
North America, 0.8%
Asia Pacific, 5.0%
The combination of strong air travel demand and the need to replace ageing aircraft will drive fleet growth at a healthy 3.1% p.a.
MRO MARKET
20 YEAR GLOBAL AIR TRANSPORT FLEET GROWTH
Source: ICF Analysis: CAPA 2017
~29,100
~39,600
Region, 10y CAGR
Total: 3.1%
# Aircraft
~46,900
10
~9,600
~17,500
~8,500
~8,500
~9,200
~13,700
26 June 2018
ICF proprietary and confidential. © ICF 2018ICF proprietary and confidential. © ICF 2018
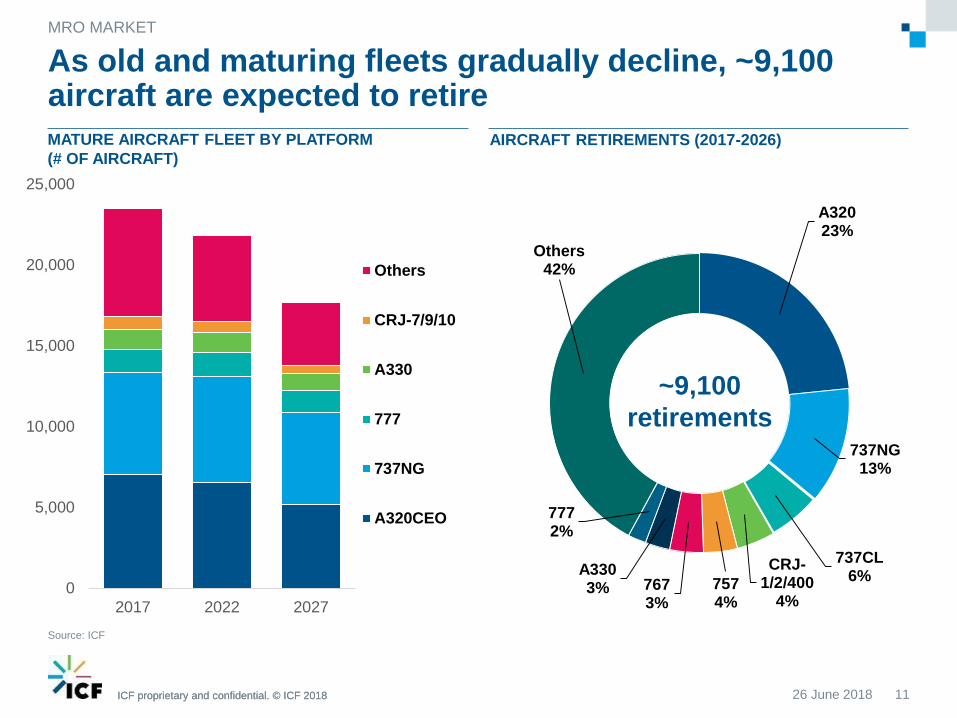
A32023%
737NG13%
737CL6%
CRJ-1/2/400
4%7574%
7673%
A3303%
7772%
Others42%
As old and maturing fleets gradually decline, ~9,100 aircraft are expected to retire
MRO MARKET
MATURE AIRCRAFT FLEET BY PLATFORM
(# OF AIRCRAFT)
AIRCRAFT RETIREMENTS (2017-2026)
0
5,000
10,000
15,000
20,000
25,000
2017 2022 2027
Others
CRJ-7/9/10
A330
777
737NG
A320CEO
Source: ICF
~9,100
retirements
26 June 2018 11

ICF proprietary and confidential. © ICF 2018ICF proprietary and confidential. © ICF 2018
Engines
Components
Line
Airframe
Modifications
42%
13%
17%
7%
2017 commercial air transport MRO demand is $75.5B; Asia is now larger than North America and Europe in market size
MRO MARKET
2017 COMMERCIAL AIR TRANSPORT GLOBAL MRO DEMAND
Source: ICF Analysis: CAPA 2017
BY MRO SEGMENT
$75.5B
BY GLOBAL REGION
31%
26%
25%
8%
6% 4%Middle
East
Africa
Asia
Pacific
North America
$19.4B
South
America
$75.5B
Europe
21%
1226 June 2018
ICF proprietary and confidential. © ICF 2018
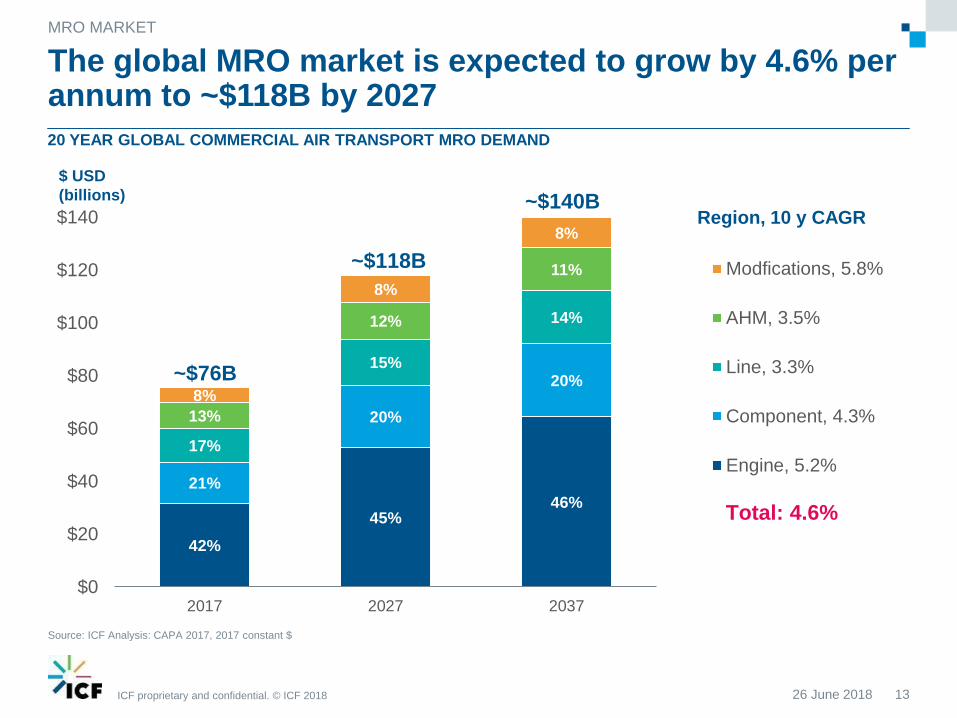
42%
45%46%
21%
20%
20%
17%
15%
14%
13%
12%
11%
8%
8%
8%
$0
$20
$40
$60
$80
$100
$120
$140
2017 2027 2037
Modfications, 5.8%
AHM, 3.5%
Line, 3.3%
Component, 4.3%
Engine, 5.2%
The global MRO market is expected to grow by 4.6% per annum to ~$118B by 2027
MRO MARKET
20 YEAR GLOBAL COMMERCIAL AIR TRANSPORT MRO DEMAND
Source: ICF Analysis: CAPA 2017, 2017 constant $
~$76B
~$118B
Total: 4.6%
$ USD
(billions) ~$140BRegion, 10 y CAGR
1326 June 2018

ICF proprietary and confidential. © ICF 2018ICF proprietary and confidential. © ICF 2018
31%
36%38%
26%
19%
18%
25%
23%
21%
8%
11%
10%
6%
7%
7%
5%
$0
$20
$40
$60
$80
$100
$120
$140
2017 2027 2037
Africa, 6.1%
South America, 5.7%
Middle East, 7.9%
Europe, 3.3%
North America, 1.7%
Asia Pacific, 6.1%
Asia continues to grow strongly and will generate 38% of MRO demand by 2037…
MRO MARKET
20 YEAR GLOBAL COMMERCIAL AIR TRANSPORT MRO DEMAND
Source: ICF Analysis: CAPA 2017, 2017 constant $
~$76B
~$118B
Total: 4.6%
$ USD
(billions) ~$140BRegion, 10y CAGR
14
~$24.6B
~$19.3B
~$22.9B
26 June 2018

ICF proprietary and confidential. © ICF 2018
40%42% 43%
20%
21%21%17%
16%15%
16%
14%13%
8%
7%
8%
$0
$5
$10
$15
$20
$25
2017 2027 2037
Modifications, 1.3%
Airframe, 0.7%
Line, 1.0%
Component, 1.9%
Engine, 2.4%
North American MRO spend exhibits marginal growth, increasing by 1.7% per annum to $22.9B by 2027
MRO MARKET
20 YEAR NORTH AMERICAN COMMERCIAL AIR TRANSPORT MRO DEMAND
Source: ICF Analysis: CAPA 2017, 2017 constant $
Category, 10y CAGR
Total: 1.7%
$ USD
(billions)
$19.3B
$22.9B
$24.6B
26 June 2018 15

ICF proprietary and confidential. © ICF 2018
49%
58% 57%
31%
30%29%16%
9%12%
$0
$5
$10
$15
$20
$25
2017 2027 2037
Turboprop, -1.5%
Regional Jet, -3.8%
Widebody Jet, 1.5%
Narrowbody Jet, 3.3%
North American MRO spend exhibits marginal growth, increasing by 1.7% per annum to $22.9B by 2027
MRO MARKET
20 YEAR NORTH AMERICAN COMMERCIAL AIR TRANSPORT MRO DEMAND
Source: ICF Analysis: CAPA 2017, 2017 constant $
Category, 10y CAGR
Total: 1.7%
$ USD
(billions)
$19.3B
$22.9B
$24.6B
26 June 2018 16

ICF proprietary and confidential. © ICF 2018ICF proprietary and confidential. © ICF 2018
Trends To
Watch
1726 June 2018

ICF proprietary and confidential. © ICF 2018
PMA Outlook
26 June 2018 18
ICF proprietary and confidential. © ICF 2018
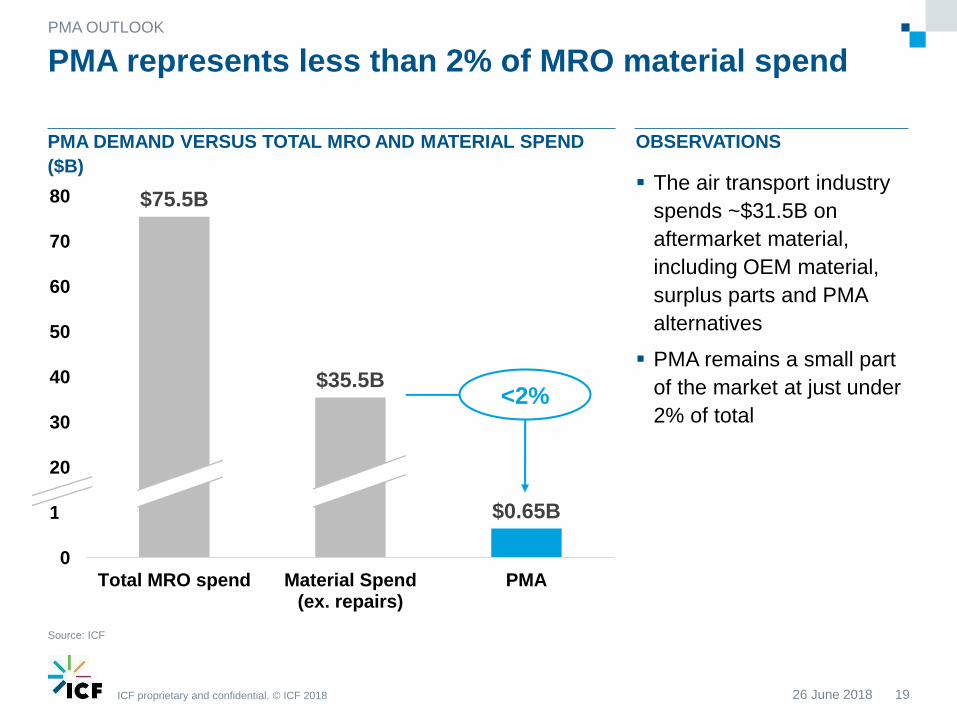
OBSERVATIONS
The air transport industry
spends ~$31.5B on
aftermarket material,
including OEM material,
surplus parts and PMA
alternatives
PMA remains a small part
of the market at just under
2% of total
PMA represents less than 2% of MRO material spend
26 June 2018 19
PMA OUTLOOK
Source: ICF
$75.5B
$35.5B
$0.65B
0
10
20
30
40
50
60
70
80
Total MRO spend Material Spend(ex. repairs)
PMA
PMA DEMAND VERSUS TOTAL MRO AND MATERIAL SPEND
($B)
<2%

ICF proprietary and confidential. © ICF 2018
Cabin & Components
Engine
Airframe
2017 commercial air transport PMA demand was ~$650M, N. America and Europe remain the key regions
PMA OUTLOOK
2017 COMMERCIAL AIR TRANSPORT GLOBAL PMA DEMAND
Source: ICF
BY MRO SEGMENT BY GLOBAL REGION
37%
27%
23%
5%5%3%Middle
East
Africa
Asia
Pacific
North
America
South
America
Europe
26 June 2018 20
60%
33%
7%
~$650M ~$650M

ICF proprietary and confidential. © ICF 2018
16,37336,202
61,439
220,074
356,683
468,689
107,737
0
100,000
200,000
300,000
400,000
500,000
<1991 1991 - 1995 1996 - 2000 2001 - 2005 2006 - 2010 2011 - 2015 2016-18YTD
Volume of PMA approvals has steadily grown since 1990; the pace appears to have slowed in 2016 and 2017
26 June 2018 21
PMA OUTLOOK
FAA APPROVED PMA PART NUMBERS BY APPROVAL YEAR
Source: Federal Aviation Administration – PMA Database extract June 2018

ICF proprietary and confidential. © ICF 2018
$654
$1,158
0
200
400
600
800
1,000
1,200
2017 2027
Airframe, 5%
Engine, 0.2%
Cabin &Components, 8.1%
PMA is set to grow significantly over the next decade, growing at a 5.8% CAGR to >$1.15B by 2027
PMA OUTLOOK
10 YEAR GLOBAL COMMERCIAL AIR TRANSPORT PMA DEMAND (CONSTANT 2017 US$)
Source: ICF, 2017 constant $
PMA Part Category, CAGR
Total: 5.8%
$ USD
(millions)
26 June 2018 22

ICF proprietary and confidential. © ICF 2018 23
M&A Activity
26 June 2018

ICF proprietary and confidential. © ICF 2018ICF proprietary and confidential. © ICF 2018
Consolidation continues among System OEMs
TRENDS TO WATCH
Melrose acquires GKN
2018
Splits off 2 divisions,
keeps Aerospace
2017Rockwell Collins
acquires B/E
Aerospace
2016
Safran acquires
Zodiac
2017
UTC plans to
acquires
Rockwell Collins
2017
?
24
Next?Acquisitions?
Divestments?
BOEING
Boeing announces
acquisition of KLX
2018
?
26 June 2018
ICF proprietary and confidential. © ICF 2018
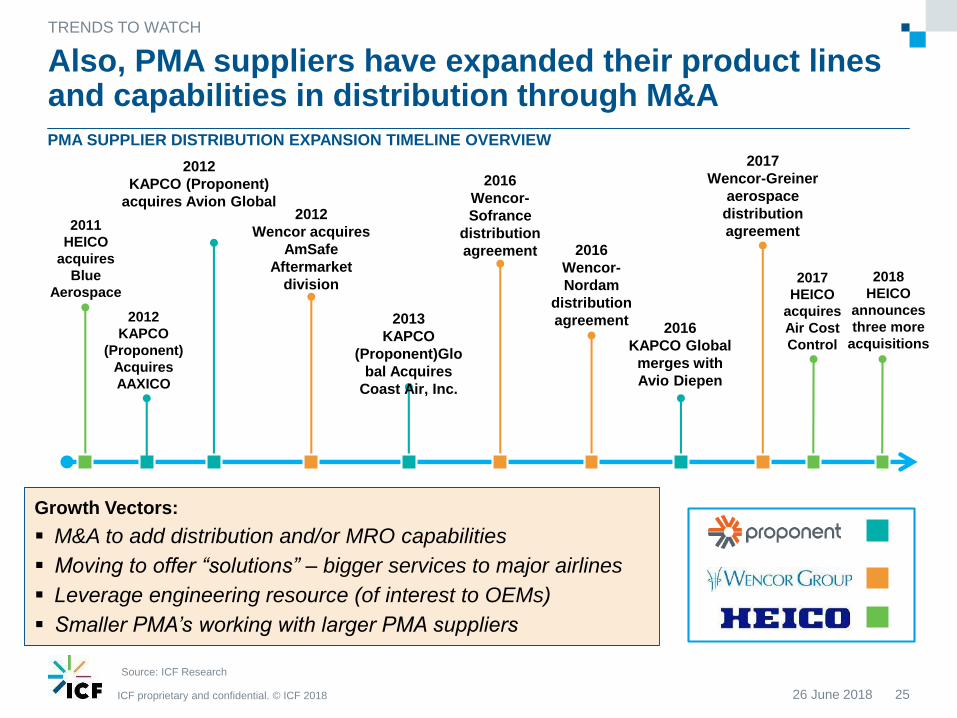
Also, PMA suppliers have expanded their product lines and capabilities in distribution through M&A
26 June 2018 25
TRENDS TO WATCH
PMA SUPPLIER DISTRIBUTION EXPANSION TIMELINE OVERVIEW
Source: ICF Research
2012
KAPCO
(Proponent)
Acquires
AAXICO
2012
KAPCO (Proponent)
acquires Avion Global
2013
KAPCO
(Proponent)Glo
bal Acquires
Coast Air, Inc.
2016
KAPCO Global
merges with
Avio Diepen
2017
HEICO
acquires
Air Cost
Control
2011
HEICO
acquires
Blue
Aerospace
2016
Wencor-
Nordam
distribution
agreement
2017
Wencor-Greiner
aerospace
distribution
agreement2012
Wencor acquires
AmSafe
Aftermarket
division
2016
Wencor-
Sofrance
distribution
agreement
Growth Vectors:
M&A to add distribution and/or MRO capabilities
Moving to offer “solutions” – bigger services to major airlines
Leverage engineering resource (of interest to OEMs)
Smaller PMA’s working with larger PMA suppliers
2018
HEICO
announces
three more
acquisitions
ICF proprietary and confidential. © ICF 2018ICF proprietary and confidential. © ICF 2018
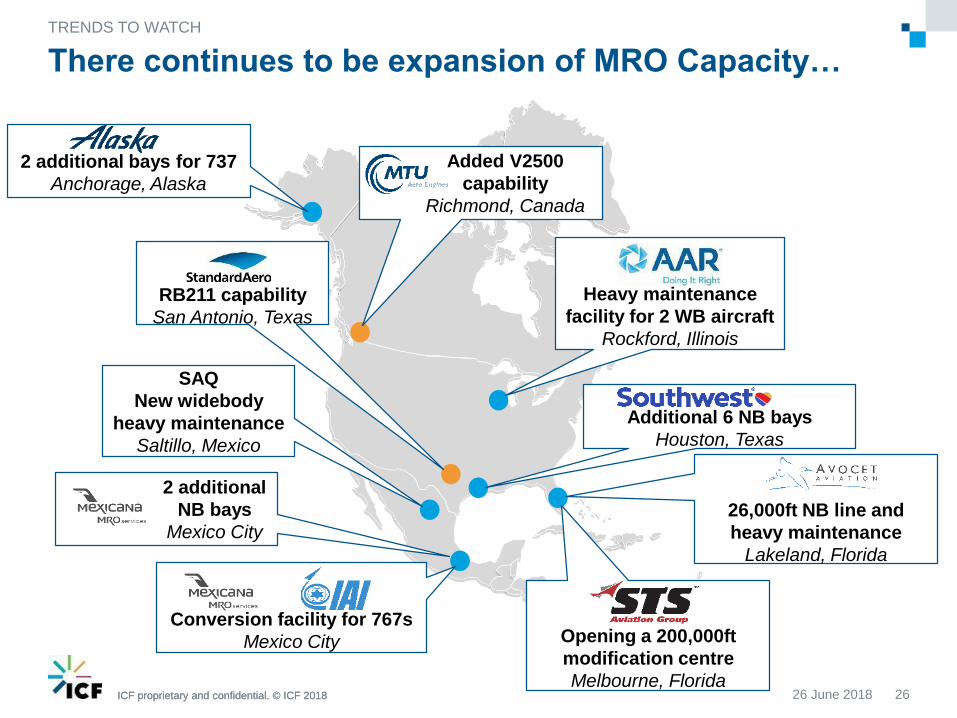
There continues to be expansion of MRO Capacity…
TRENDS TO WATCH
2 additional bays for 737
Anchorage, Alaska
Heavy maintenance
facility for 2 WB aircraft
Rockford, Illinois
2 additional
NB bays
Mexico City
SAQ
New widebody
heavy maintenance
Saltillo, Mexico
26,000ft NB line and
heavy maintenance
Lakeland, Florida
Additional 6 NB bays
Houston, Texas
Opening a 200,000ft
modification centre
Melbourne, Florida
Added V2500
capability
Richmond, Canada
Conversion facility for 767s
Mexico City
RB211 capability
San Antonio, Texas
2626 June 2018

ICF proprietary and confidential. © ICF 2018ICF proprietary and confidential. © ICF 2018 27
Impact of New
Technology
Aircraft
26 June 2018

ICF proprietary and confidential. © ICF 2018ICF proprietary and confidential. © ICF 2018
~9k
17k
24k
~29k
~35k
~39k
0
10,000
20,000
30,000
40,000
2017 2022 2027
# aircraft
Limited AHM, -2.7%
AHM, 10.4%
ICF IN-SERVICE AIR TRANSPORT FLEET FORECAST OBSERVATION
ICF expects ~23,500 aircraft
will be equipped with Aircraft
Health Monitoring (AHM) by
2027, growing at 10.4% CAGR
This is driving a digitisation of
aircraft operations, which will
see high growth in the e-
enabled services and further
advances in health
management
The fleet of e-enabled aircraft is set to more than double over the next decade
28
IMPACT OF NEW TECHNOLOGY AIRCRAFT
Source: ICF
AHM adoption,
2017 – 2027
CAGR
TOTAL = 3.0%
~60%
~50%
~30%
26 June 2018
ICF proprietary and confidential. © ICF 2018ICF proprietary and confidential. © ICF 2018
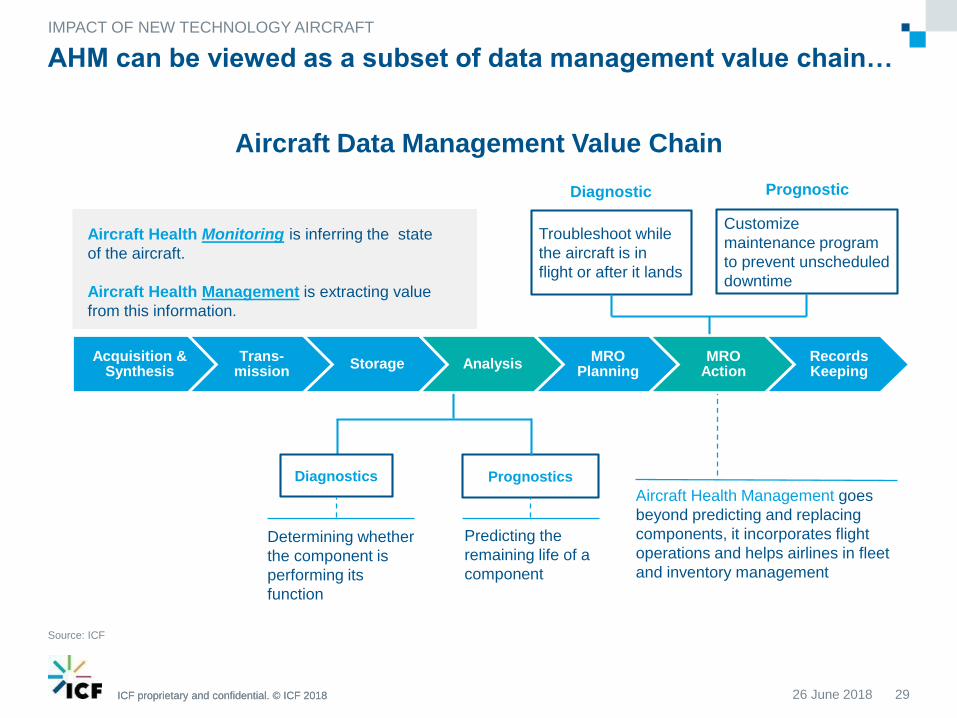
AHM can be viewed as a subset of data management value chain…
29
IMPACT OF NEW TECHNOLOGY AIRCRAFT
Source: ICF
Diagnostics Prognostics
Determining whether
the component is
performing its
function
Predicting the
remaining life of a
component
Troubleshoot while
the aircraft is in
flight or after it lands
Customize
maintenance program
to prevent unscheduled
downtime
Diagnostic Prognostic
Aircraft Health Monitoring is inferring the state
of the aircraft.
Aircraft Health Management is extracting value
from this information.
Aircraft Health Management goes
beyond predicting and replacing
components, it incorporates flight
operations and helps airlines in fleet
and inventory management
Acquisition & Synthesis
Trans-mission
Storage AnalysisMRO
PlanningMRO
ActionRecords Keeping
Aircraft Data Management Value Chain
26 June 2018

ICF proprietary and confidential. © ICF 2018ICF proprietary and confidential. © ICF 2018
The race is on… new battlegrounds are emerging across the MRO market
30
IMPACT OF NEW TECHNOLOGY AIRCRAFT
Source: ICF
2017
AnalytX
BOEING
Avasio
2015
2015
Analytics
Division
Skywise
2017
2017
Aviatar2017
R2 Data Labs
2017
FlightPulse
2017
United
Technologies
Digital Division
Digital Solutions
2017
Prognos
2016
Availability
Centre
2017
EngineWise
2017
Predictive
Maintenance
Partnership
2018
2015
Digital
Collaboration
Centre in Dubai
26 June 2018

ICF proprietary and confidential. © ICF 2018ICF proprietary and confidential. © ICF 2018
Digitisation could enable airlines to save in excess of $5B/year through lower fuel, maintenance and delay costs
31
IMPACT OF NEW TECHNOLOGY AIRCRAFT
Health Monitoring and Predictive Maintenance
Airline Industry savings: ~$3B (conservative estimate)
Driven by improved dispatch reliability, No Fault Found reduction, Inventory reduction
and Improved labour productivity
Fuel Cost Savings
Airline Industry savings: ~$1.7B (conservative estimate)
Continuous flight optimisation through live
weather updates, speed and altitude
optimisation…
Delay Reduction
Airline Industry savings:
~$0.8B (conservative
estimate)
Improved turnaround process,
in-flight routing optimisation
Source: ICF
26 June 2018
ICF proprietary and confidential. © ICF 2018ICF proprietary and confidential. © ICF 2018
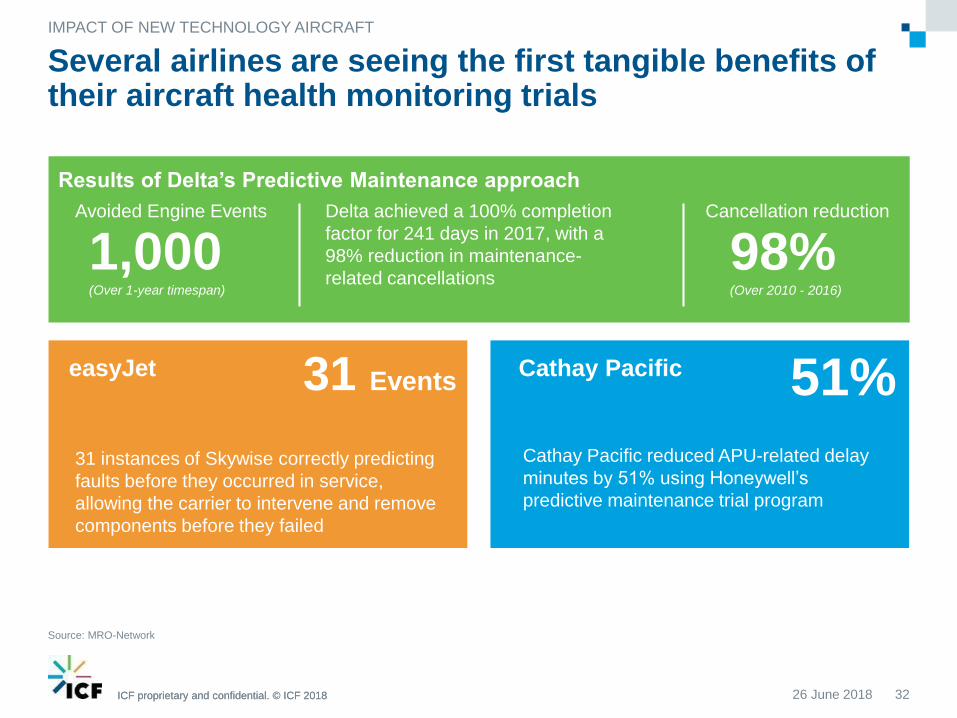
Several airlines are seeing the first tangible benefits of their aircraft health monitoring trials
IMPACT OF NEW TECHNOLOGY AIRCRAFT
Source: MRO-Network
Delta achieved a 100% completion
factor for 241 days in 2017, with a
98% reduction in maintenance-
related cancellations
Results of Delta’s Predictive Maintenance approach
1,000(Over 1-year timespan)
Drop in maintenance-related cancellations of…
Southwest to install AHM on complete 737 NG
fleet to improve performance
98%(Over 2010 - 2016)
Avoided Engine Events Cancellation reduction
31 Events
31 instances of Skywise correctly predicting
faults before they occurred in service,
allowing the carrier to intervene and remove
components before they failed
easyJet 51%
Cathay Pacific reduced APU-related delay
minutes by 51% using Honeywell’s
predictive maintenance trial program
Cathay Pacific
3226 June 2018

ICF proprietary and confidential. © ICF 2018ICF proprietary and confidential. © ICF 2018
Considerations
3326 June 2018

ICF proprietary and confidential. © ICF 2018ICF proprietary and confidential. © ICF 2018
In Conclusion…
CONSIDERATIONS
34
• The Global Air Transport MRO
market outlook remains robust at
$76B growing to $118B over the
next decade (an expected growth of
4.6% per annum)
• North America generates $19.4B of
MRO demand and will grow to $23B
by 2027
• New technology aircraft and engines
are creating both new challenges
and opportunities for aviation
stakeholders including how best to
leverage big data to reduce operator
costs, help increase efficiency and
increase reliability
26 June 2018

ICF proprietary and confidential. © ICF 201835
Let’s Make Big
Things PossibleConsulting for the
Global Aviation Industry
Airlines | Airports | Aircraft | Aerospace and Maintenance
Helping you manage assets and
operations, mitigate risk, and maximize
return on investment.
+44 7718 893 833

ICF proprietary and confidential. © ICF 2018ICF proprietary and confidential. © ICF 2018
ICF supports clients across the aviation industry
Serving the
Aviation
Community
Since 1963
Broad Perspective.
Compelling Results. ICF offers our team of nearly 100 aviation experts dedicated to
strategic and operations consulting for the aviation industry. Our
aviation practice was founded as SH&E in 1963 and expanded with
the acquisition of AeroStrategy in 2011. Today we are one of the
world’s largest aviation consulting organizations. We provide objective,
independent commercial, financial, technical, and regulatory guidance
to aviation clients, including airlines, airports, lessors, financial
institutions, manufacturers, governments, and VIPs. From our offices
around the globe, ICF helps aviation clients manage assets and
operations, mitigate risk, and maximize return on investment.
Visit us online at icf.com/aviation.
ICF Aviation
Comprehensive Services:
Airlines
Fleet and network planning, pricing
and revenue management, OTP and
operational efficiency
Airports
Strategic planning, policy, route
development, concessions planning
Aircraft
Valuations, cash flow forecasts,
portfolio due diligence, market analysis,
technical services
Aerospace & MRO
Operations assessment, M&A support,
marketing analysis, strategy development
3626 June 2018

ICF proprietary and confidential. © ICF 2018ICF proprietary and confidential. © ICF 2018
Aerospace and MRO
ICF guides manufacturers, airlines, independent MROs, suppliers, and
the financial community through every step of the aerospace and MRO
supply chain to realize value and deliver strategies that drive growth.
We understand and focus on the key aspects of the industry, and have
the proprietary tools necessary for successful operations. Below, we
briefly describe our core aerospace & MRO services and proprietary
supporting products.
ICF focuses on
key aspects of the
industry that drive
value in both
revenue growth
and cost control.
Strategy Development
Leveraging years of aerospace and
MRO advisory experience as well as
proprietary market intelligence, ICF
delivers data-driven, objective insight
to underpin sustainable strategies.
Transaction Support
For clients’ investment decisions,
ICF combines global thought
leadership in aerospace and MRO
supply chain with accurate market
intelligence, operations expertise,
and unparalleled industry contacts.
Operations and Supply Chain
ICF’s proven tools and methodologies
offer improved performance and cost
reduction across manufacturing,
operations, and all phases of
make-buy supply chain planning
and execution.
MRO Business Improvement
For airlines, OEMs, and independent
MROs, ICF has deep experience in
comprehensive operational and
financial diagnostics based on
extensive proprietary benchmarks,
followed by results-oriented
improvement programs.
AEROSPACE AND MRO PRODUCTS
ICF’s suite of proprietary aerospace & MRO
tools, models, and databases helps
stakeholders navigate key business
challenges to their advantage.
Fleet &
MRO ForecastsValue
Database
MRO Best Practices
and Benchmarks
Proprietary, independent
forecasts for commercial and
business aviation, industrial
gas turbine, and military
markets.
Production value breakdown
by component category and
raw material content across
the aerospace supply chain.
Comprehensive, proprietary
databases on processes,
costs, and organization.
3726 June 2018