MRO Forecast and Market Trends
28
0 MRO Forecast and Market Trends Presented by: Jonathan M. Berger Vice President ICF International [email protected] January 21-22, 2016 Lima, Peru
Transcript of MRO Forecast and Market Trends

0
MRO Forecast and Market Trends
Presented by: Jonathan M. Berger Vice President ICF International [email protected]
January 21-22, 2016 Lima, Peru

1 1
Today’s Agenda
MRO Forecast
Meet the Frackers!
The not-so-mighty-mighty BRIC House
The Next Big Thing!

2 2
MRO Forecast

3 3
The current commercial air transport fleet consists of over 27K aircraft
Source: CAPA 2015
2015 Global Commercial Air Transport Fleet
NarrowbodyJet
Widebody Jet
Turboprop
Regional Jet
27,114 Aircraft
14%
53% 14%
19%
By Aircraft Type By Global Region
North America
Asia Pacific
Europe
Latin America
Middle East
31%
27%
25%
8% 5% 5%
27,114 Aircraft

4 4
The combination of strong air travel demand and the need to replace ageing aircraft will drive fleet growth at 3.4% annually
Source: ICF International, CAPA 2015
10 Year Global Air Transport Fleet Growth
Air travel growth of ~4.1%
Fuel costs in $55/bbl range
~19,600 aircraft deliveries
~8,800 aircraft retirements
0
5,000
10,000
15,000
20,000
25,000
30,000
35,000
40,000
2015 2025
AfricaMiddle EastSouth AmericaEuropeAsia PacificNorth America
27,114
27% 32%
37,932
31%
25%
8%
26%
23%
8%
# Aircraft
3.8%
2.5%
1.6%
5.2%
5.3%
5.1%
CAGR
3.4% Avg.

5 5
Current air transport MRO demand is $64.3B; with Asia equivalent to North America and Europe in market size
Source: ICF International; Forecast in 2015 $USD, exclusive of inflation
2015 Global MRO Demand
Engines
Components
Line
Airframe
Modifications
14%
17%
22%
40%
7% North
America
Asia Pacific
Europe
Middle East
Latin America Africa
29%
28%
26%
8%
6% 4%
$64.3B $64.3B
By MRO Segment By Global Region

6 6
The global MRO market is expected to grow by 4.1% per annum to $96B by 2025
Source: ICF International; Forecast in 2015 $USD, exclusive of inflation
10 Year Global MRO Demand Growth
The strongest drivers of growth are the engine and component markets
Reduced labor intensity of airframe heavy checks as the fleet renews and increased intervals...offset in emerging markets by increasing labor rates
Aircraft upgrades (e.g. interiors, winglets) drive high modifications growth $0
$10
$20
$30
$40
$50
$60
$70
$80
$90
$100
2015 2025
ModificationsAirframeLineComponentEngine
40%
22%
14%
17%
$64.3B
$96.0B
2.8%
3.6%
4.3%
4.4%
CAGR
4.1% Avg.
5.3%
41%
22%
16%
13%

7 7
The current Latin American commercial air transport fleet consists of over 2,100 aircraft
Source: CAPA 2015
2015 Latin American Commercial Air Transport Fleet
NarrowbodyJet
Widebody Jet
Turboprop
Regional Jet
2,123 Aircraft
8%
51%
16%
25%
By Aircraft Type By Country
Brazil
Mexico
Colombia Chile
Venezuela
Panama
Other
2,123 Aircraft
28%
17% 7%
21%
11%
6% 6% 5%
8 8
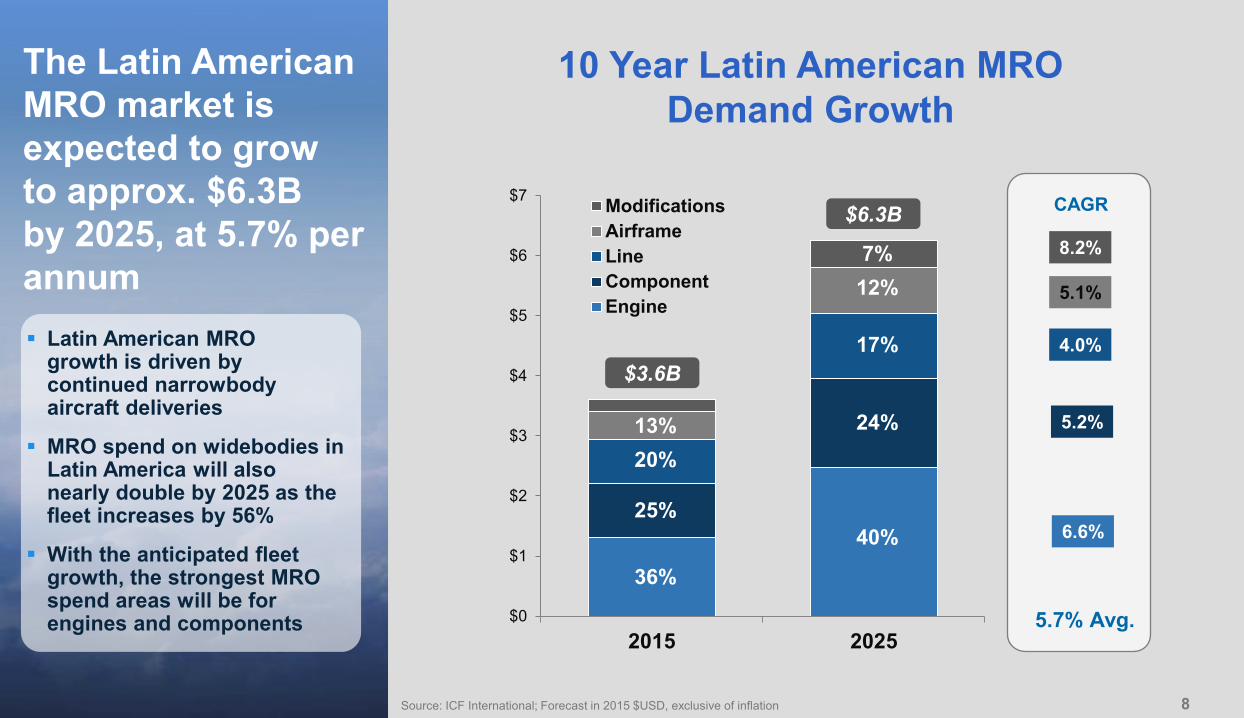
The Latin American MRO market is expected to grow to approx. $6.3B by 2025, at 5.7% per annum
Source: ICF International; Forecast in 2015 $USD, exclusive of inflation
10 Year Latin American MRO Demand Growth
Latin American MRO growth is driven by continued narrowbody aircraft deliveries
MRO spend on widebodies in Latin America will also nearly double by 2025 as the fleet increases by 56%
With the anticipated fleet growth, the strongest MRO spend areas will be for engines and components $0
$1
$2
$3
$4
$5
$6
$7
2015 2025
ModificationsAirframeLineComponentEngine
36%
25%
13% 20%
$3.6B
$6.3B
5.1%
4.0%
5.2%
6.6%
CAGR
5.7% Avg.
8.2%
40%
24%
17%
12% 7%

9 9
Meet the Frackers!

10 10
Breakthrough technologies in horizontal drilling and hydraulic fracturing (aka fracking) resulted in a US-led energy revolution
Source: ICF International analysis
North American crude oil and natural gas production have soared in recent years…
3,500
4,500
5,500
6,500
7,500
8,500
9,500
10 year growth = 105% (7.45% CAGR)
Thousands
1,250
1,450
1,650
1,850
2,050
2,250
2,45010 year growth = 66%
(5.22% CAGR)
Billion cu. ft.
U.S. Crude Oil Production (Barrels / day)
U.S. Natural Gas Production (Monthly marketed production)

11 11
The US energy revolution has completely upset the global economic and geopolitical balance of power
Source: BP Statistical Review of World Energy June 2015, ICF International Analysis
…making the U.S. a global powerhouse in energy production
728
579
177 173 162 135
109 108 83 73
0
100
200
300
400
500
600
700
800
[VALUE] 11.5 10.8
4.3 4.2 3.7 3.6 3.3 3.1 2.8
0
2
4
6
8
10
12
14
Global Oil Production (Million barrels / day as of June 2015)
Global Natural Gas Production (Billions of cubic meters as of June 2015)

12 12
The potential for sustained reduction in oil revenues could further destabilize many already fragile economies
Source: BP Statistical Review of World Energy June 2015, ICF International Analysis
Low oil prices are exerting tremendous stress on economies dependent on energy exports
Brent Crude Oil Price, $ per barrel
$40
$60
$80
$100
$120
$140
$160 Venezuela Iran Nigeria Ecuador
Iraq Libya
Saudi Arabia Angola
UAE Qatar
Russia
Deficit
Surplus
Brent Crude Oil Price, USD$ per barrel
National Government Fiscal Budgets’ Break-Even Oil Price (2014)

13 13
Continued low fuel costs will have significant repercussions throughout the aviation & MRO supply chain
Source: EIA; ICF International analysis
Aviation fuel costs have dropped over 55% during the past 24 months
U.S. Gulf Coast Jet Fuel Price per Gallon
$1.2
$1.4
$1.6
$1.8
$2.0
$2.2
$2.4
$2.6
$2.8
$3.0
$ USD
~55%

14 14
Continued low fuel costs will have significant repercussions throughout the aviation & MRO supply chain
Source: EIA; ICF International analysis
Aviation fuel costs have dropped over 55% during the past 24 months
Global Airline Profitability
-$30
-$20
-$10
$0
$10
$20
$30
$40
$USD Billions
$36B
North America $19B
Rest of World $17B

15 15
The Not-So-Mighty-Mighty BRIC House

16 16
China’s seemingly insatiable demand for global commodities was a key driver of the BRICS economic growth
Source: IMF, World Economic Outlook Database October 2015, ICF International Analysis
After years of staggering GDP growth, China’s economy has been steadily slowing
5%
7%
9%
11%
13%
15%
2007 2008 2009 2010 2011 2012 2013 2014 2015F 2016F2015F 2016F
China GDP Year-on-Year Growth (%)

17 17
Latin American economies must continue to diversify away from commodities in order to minimize the adverse economic impact of plunging commodity prices
Source: ICF analysis
Over the past 5 years, commodity prices have plummeted more than 55%
Dow Jones Commodity Indices (DJCI) (January 2011 Indexed to 100)
40
50
60
70
80
90
100
110
- 56.0%
Indexed Values

18 18
Russian Ruble -55.1%
Brazilian Real -41.1%
S. African Rand -34.1%
Mexican Peso -25.9%
Can Dollars -23.1%
Aus Dollars -20.8%
Euro -20.0%
British Pound -12.8%
Japanese Yen -11.9%
Indian Rupee -7.8%
Chinese Yuan -7.2%
-60%
-50%
-40%
-30%
-20%
-10%
0%
10%
The dramatic increase in oil & gas market supply and reduced demand for commodities has led to a stronger US Dollar
Source: Oanda historical exchange rates, ICF International Analysis
Global Currency Exchange Rates vs USD
Partially offsets the positive impact of low fuel costs for operators
Increases the cost of dollar based flight hour agreements (and parts/material in general)
Cost of labor for in-country MROs is cheaper driving up margins for US dollar based contracts
FOREX Impact
% Value Change Jan. 2014 – Jan. 2016
B
R
C
S
I

19 19
Latin America GDP growth continues to be negatively impacted by the global economic slowdown (more specifically China and commodities)
Note: All GDP Growth are calculated based on constant price (nation currency) Source: IMF Economic Outlook Oct 15
United States
Brazil
0.0%2.0%4.0%6.0%
0.0%
5.0%
10.0%
0.0%
5.0%
10.0%
0.0%
5.0%
10.0%
0.0%
2.0%
4.0%
0.0%
2.0%
4.0%
-2.0%0.0%2.0%4.0%
-5.0%
0.0%
5.0%

20 20
While North American carriers are enjoying historic profitability, Latin American carriers continue to struggle
Source: Company websites, IATA, ICF International Analysis
Copa Q3 2015 Net Profit: $6.2M Q3 2015 Net Margin: 1.1%
AeroMexico Q1-3 2015 Net Profit: $737M Q1-3 2015 Net Margin: 5.9%
GOL
Q1-3 2015 Net Profits: ($788.7M) Q1-3 2015 Net Margin: -44.3%
Avianca
Q1-3 2015 Net Profit: $112.M Q1-3 2015 Net Margin: 3.4%
LAN & TAM (LATAM)
Q1-3 2015 Net Profits: ($203M) Q1-3 2015 Net Margin: -2.7%
$ Billions
-$0.5
$0.0
$0.5
$1.0
$1.5 Latin America Airline Profitability
Aerolinas Argentinas
Jan-Aug 2015 Net Profits: ($85.8M) Jan-Aug Net Margin: -6.4%
United States
Brazil

21 21
March of the Middle East Titans; coming soon to an airport near you!
Source: OAG Data, ICF International Analysis
European Secondary Airports Average Number of Seats per Departure in 2015
Lufthansa’s Frankfurt hub has lost nearly a 3rd of its market share on routes between Europe and Asia since 2005, with more than
three million people now flying annually from Germany to other destinations via Gulf hubs – The Economist
333 328 354 354
324
370
339 354 354
264
174
141 121
140
111
153 150
109 121
148
100
150
200
250
300
350
400 Gulf Carriers Non-Gulf Carriers

22 22
The Next Big Thing…

23 23
ICF believes that virtual reality (VR) technology will be as disruptive to MRO training as 3D-printing is to parts manufacturing

24 24
The US energy revolution has disrupted global economics and geopolitics
The economic slowdown in China has dramatically impacted commodity export dependent BRICS
Latin America’s exposure to commodity prices and impact of currency exchange rates will continue to drive economic headwinds in the region
Virtual reality has the ability to transform the way technicians are trained
In Summary…

25
For questions regarding this presentation, please contact:
Jonathan M. Berger Vice President Aerospace & MRO [email protected] +1 404.819.7669
January 21-22, 2016 Lima, Peru
THANK YOU!

26 26
Market Research & Analysis
Airline Maintenance Benchmarking
M&A Commercial Due Diligence
OEM Aftermarket Strategy
Aviation Asset Valuations & Appraisals
MRO Information Technology (IT) Advisory
Strategic Sourcing & Supply Chain Mgt.
LEAN Continuous Process Improvement
Military Aircraft Sustainment
ICF provides a full range of MRO advisory services

27 27
ICF is one of the world’s largest and most experienced aviation & aerospace consulting firms 53 years in business (founded 1963) 100+ professional staff
− Dedicated exclusively to aviation and aerospace − Blend of consulting professionals and experienced
aviation executives
Specialized, focused expertise and proprietary knowledge
Broad functional capabilities More than 10,000 private and public sector
assignments Backed by parent company ICF International
(2014 revenue - $1.05B) Global presence –– offices around the world
joined ICF in 2011
joined ICF in 2007
New York • Boston • Ann Arbor • London • Singapore • Beijing • Hong Kong
Aerospace & MRO
Aircraft Asset Advisory
Airline Advisory
Airports