MRO Market Update and Industry Trends
36
0 MRO Market Update & Industry Trends Presented by: Jonathan M. Berger Vice President Aerospace & MRO Advisory [email protected] October 18-20, 2016 Amsterdam, Netherlands
Transcript of MRO Market Update and Industry Trends

0
MRO Market Update & Industry Trends
Presented by:
Jonathan M. BergerVice President Aerospace & MRO Advisory
October 18-20, 2016
Amsterdam, Netherlands

11
Today’s Agenda
Bizarro Aviation
MRO Forecast
Trend Watch:
Aircraft Cabin Interiors
New Technology Aircraft
Virtual Reality

22
“Bizarro Aviation”

33
Four external
macro-economic
forces are having a
significant impact
on the aviation
industry and the
MRO supply chain
Source: ICF analysis
The “CRABS”

44
The dramatic increase
in oil & gas market
supply and reduceddemand for
commodities has led
to a strong US Dollar
Partially offsets the positive impact of low fuel costs for operators
Increases the cost of dollar based flight hour agreements (and parts/material in general)
Cost of labor for in-country MROs is cheaper driving up margins for US dollar based contracts
Buying/leasing aircraft becomes more expensive
FOREX Impact
Source: USForex, ICF analysis
The “CRABS”: Countries with economies that are
heavily dependent on commodity exports
Global Currency Exchange Rates vs USD% Value Change, September 2014 – September 2016
Russian Ruble-37.6%
Brazilian Real-24.6%
S. African Rand-19.1%
Can Dollars-15.3%
Aus Dollars-12.5%
Euro-11.7%
Indian Rupee-7.8%
Chinese Yuan-7.8%
-50%
-40%
-30%
-20%
-10%
0%
10%
B
R
A
SC

55
Commercial aircraft
OEM production
backlog remains at
historical record
levels driven by:
Source: CAPA, ICF Analysis
Commercial Aircraft OEM Production Backlog
0%
10%
20%
30%
40%
50%
60%
70%
0
2,000
4,000
6,000
8,000
10,000
12,000
14,000
16,000
Order
Backlog
Backlog/
% Active Fleet
Emerging market growth
Low interest rates
Previously high oil and
commodity prices
Introduction of new
technology aircraft/engines

66
Low fuel costs
appear to be
reversing aircraft
retirements trends
Source: CAPA, Airline Monitor, ICF analysis
Industry Impact:
MRO Suppliers - Positive:
Increased spend on older
airframes & engines
Surplus Market - Negative:
Reduced part-out “feed
stock”
- OEMs: Improved new
part sales
- Distributors: Improved
used part values /
pricing
- Operators: Increased
material costs
Commercial Air Transport Annual Aircraft Retirements
0.0%
0.5%
1.0%
1.5%
2.0%
2.5%
3.0%
3.5%
0
200
400
600
800
1,000
1,200
# Retirements
Retirement as % of installed fleet
% Installed
Fleet
1991-1999 Average: 203
2000-2009 Average: 473

77
Airline return on
invested capital
(ROIC) is clearly
correlated with the
drop in fuel costs
Source: IATA, ICF Analysis
Fuel Price as a % of Airline Operating Expenses
17%
22%
28% 30%
36%
28% 28%31%
33% 33% 32%28%
20%
0
20
40
60
80
100
120
0%
10%
20%
30%
40%
% of Airline
Operating
Expenses
Crude Oil
Price/BBL

88
Airline return on
invested capital
(ROIC) is clearly
correlated with the
drop in fuel costs
Source: IATA, ICF Analysis
Fuel Price and Global Airline Return On Invested Capital (ROIC)
0.0%
2.0%
4.0%
6.0%
8.0%
10.0%
12.0%
$0
$20
$40
$60
$80
$100
$120
$140
Jet Fuel Price ($/barrel) Airline ROIC (%)
Airline ROIC
Jet Fuel Price
$$$
99
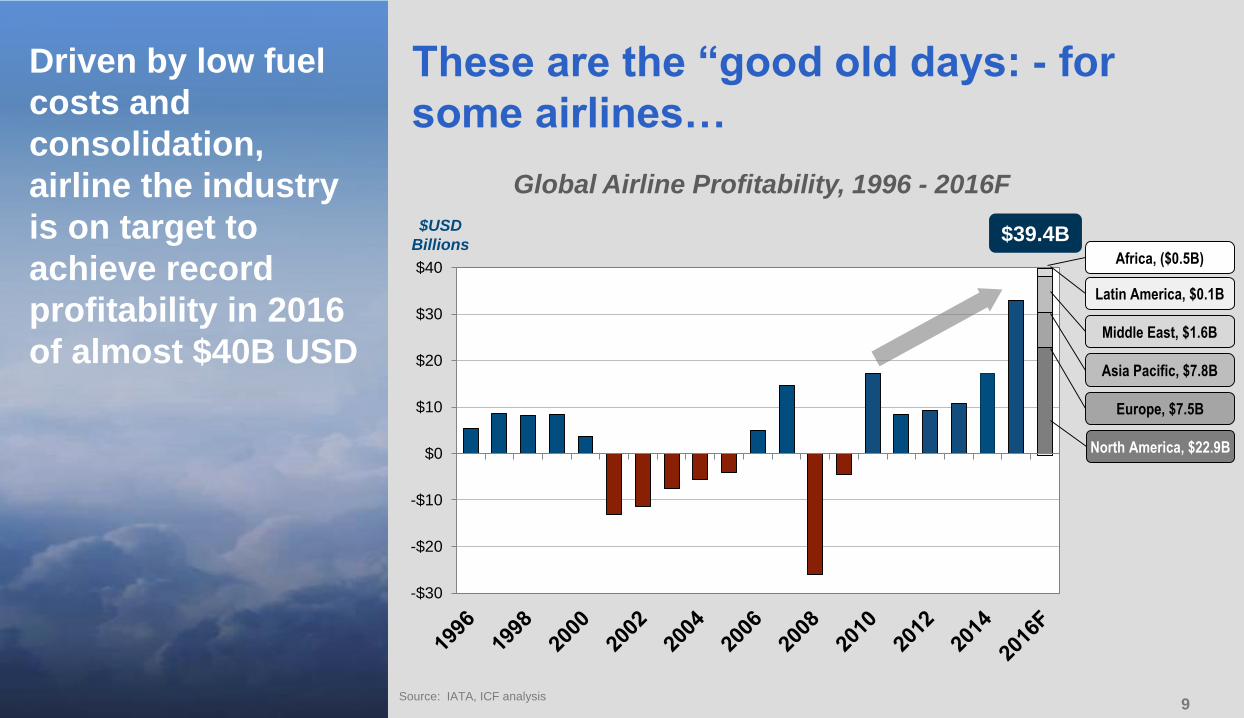
Driven by low fuel
costs and
consolidation,
airline the industry
is on target to
achieve record
profitability in 2016
of almost $40B USD
Source: IATA, ICF analysis
These are the “good old days: - for
some airlines…
Global Airline Profitability, 1996 - 2016F
-$30
-$20
-$10
$0
$10
$20
$30
$40
$USD
Billions$39.4B
Asia Pacific, $7.8B
North America, $22.9B
Europe, $7.5B
Middle East, $1.6B
Latin America, $0.1B
Africa, ($0.5B)

1010
However, profit
margin
improvement has
been largely limited
to carriers in North
America and
Europe
Source: IATA, ICF Analysis
-1.8%
-4.7%
0.1%
2.3%1.0%
-0.9%
3.4%4.7%
0.7%1.5%
3.0%
-0.4%
15.4%
8.4%
5.6%
2.6% 2.8%
-1.1%
-10.0%
-5.0%
0.0%
5.0%
10.0%
15.0%
20.0%
2008
2012
2016F
Global Airline EBIT Margin by Region
…but not all – many airlines continue
to struggle

1111
Brexit has clearly
had an impact on
European airline
stock performance;
specifically UK
based carriers
Source: Company websites
Share Performance of European Airlines Since Brexit
23 June 2016 – 13 October 2016
SAS, -6.3%
Lufthansa, -15.2%
Ryan Air, -16.2%
Norwegian, -16.5%
Wizz, -23.2%
Air France-KLM, -24.8%
IAG, -28.1%
Easy Jet, -41.5%
-50% -40% -30% -20% -10% 0%

1212
Follow the Money:
Airlines are
spending their hard
earned profits in
three primary areas
Source: Company Reports, ICF Analysis
Airline Profit Spend Analysis
Labor, 20%
Capex,38%
Investors, 42%
Profit Sharing15%
Wage Increases
5%Fleet23%
Equity Investments
5%
Other capex10%
Debt Repayments
16%
Stock Buy-Back &
Dividends26%
1. Labor ~ 20%:
Profit sharing
Wage increases
2. Capex ~ 38%:
Fleet renewal & cabin
upgrades
Facilities, offices, lounges
Equity partner investments
3. Investors ~ 42%:
Stock buy-backs
Dividends
Debt repayment

1313
After positive signs
in 2014, air cargo
supply continues to
exceed demand
Source: IATA, ICF Analysis
0.4%
-0.9%
0.6%
5.0%
2.3%2.1%
6.0%
3.0%
3.7%
5.4%6.3%
6.3%
-2%
0%
2%
4%
6%
8% Traffic (FTK)
Capacity (AFTK)
Global Freight Traffic (FTK) and Capacity Growth (AFTK)
Year-Over-Year Percent Change
- $$$

1414
$0
$5
$10
$15
$20
$25
$30
$35
$40
Amazon Quarterly Revenue
Amazon is very well
positioned to lead a
major disruption of
the air cargo industry
Source: Amazon SEC Filings
Amazon’s Growing Revenue & Shipping Costs
0%
2%
4%
6%
8%
10%
12%
14%
Shipping Costs as a Percentage of Revenue
$B
USD
1515
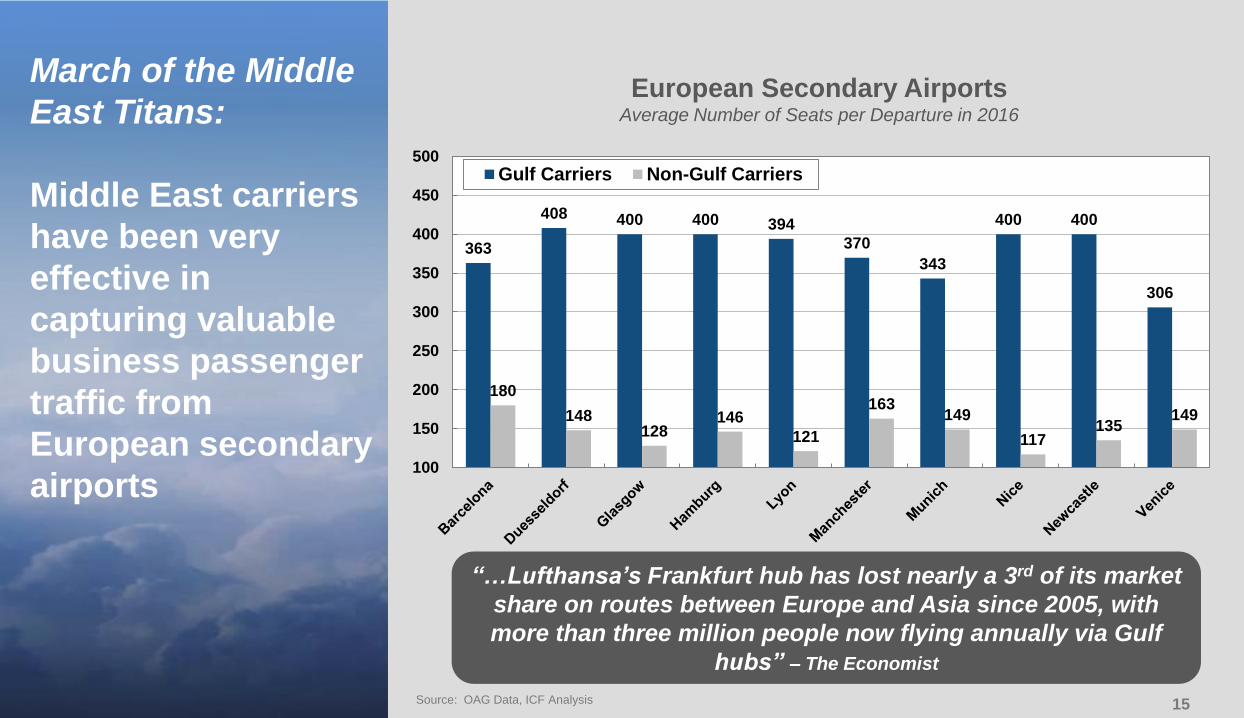
March of the Middle
East Titans:
Middle East carriers
have been very
effective in
capturing valuable
business passenger
traffic from
European secondary
airports
Source: OAG Data, ICF Analysis
European Secondary AirportsAverage Number of Seats per Departure in 2016
“…Lufthansa’s Frankfurt hub has lost nearly a 3rd of its market
share on routes between Europe and Asia since 2005, with
more than three million people now flying annually via Gulf
hubs” – The Economist
363
408 400 400 394
370
343
400 400
306
180
148128
146
121
163149
117135
149
100
150
200
250
300
350
400
450
500
Gulf Carriers Non-Gulf Carriers

1616
MRO Forecast

1717
The current
commercial
air transport fleet
consists of over
27K aircraft; over
half are narrowbody
aircraft
Source: CAPA 2015
NarrowbodyJet
WidebodyJet
Turboprop
Regional Jet
27,114
Aircraft
14%
53%14%
19%
By Aircraft Type By Global Region
North America
Asia Pacific
Europe
Latin America
Middle East
31%
27%
25%
8%
5% 5%
27,114
Aircraft
2015 Global Commercial Air Transport Fleet

1818
The combination of
strong air travel
demand and the
need to replace
ageing aircraft will
drive fleet growth at
a healthy 3.4%
annually
Source: ICF analysis: CAPA 2015
0
5,000
10,000
15,000
20,000
25,000
30,000
35,000
40,000
2015 2025
Africa
Middle East
Latin America
EuropeAsia Pacific
North America
27,100
31% 26%
37,900
27%
25%
8%
32%
23%
8%
# Aircraft
3.8%
2.5%
1.6%
5.2%
5.3%
5.1%
CAGR
3.4% Avg.
5%
6%
10 Year Global Air Transport Fleet Growth

1919
Current commercial
air transport MRO
demand is $64.3B;
with Asia equivalent
to North America
and Europe in
market size
Source: ICF analysis; Forecast in 2015 $USD, exclusive of inflation
Engines
Components
Line
Airframe
Modifications
14%
17%
22%
40%
7%North
America
Asia Pacific
Europe
Middle East
Latin America
Africa
29%
28%
26%
8%
6%4%
$64.3B$64.3B
By MRO Segment By Global Region
2015 Commercial Air Transport Global MRO Demand
2020
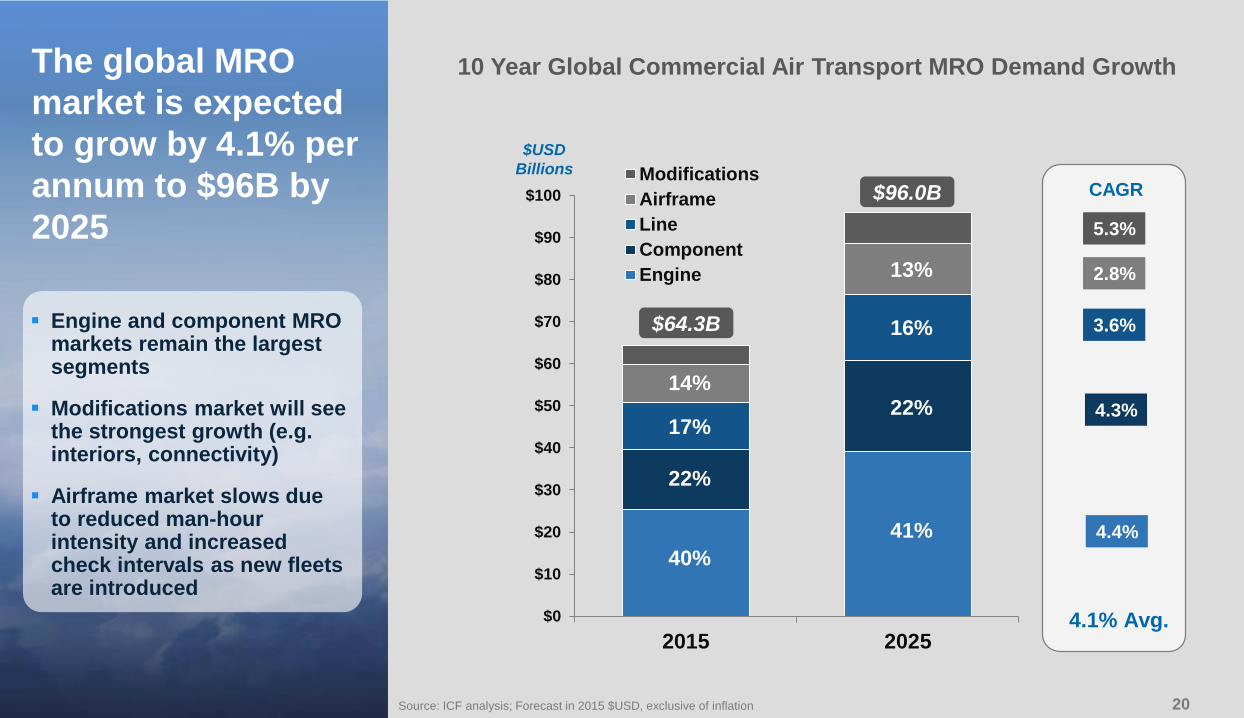
The global MRO
market is expected
to grow by 4.1% per
annum to $96B by
2025
Source: ICF analysis; Forecast in 2015 $USD, exclusive of inflation
Engine and component MRO markets remain the largest segments
Modifications market will see the strongest growth (e.g. interiors, connectivity)
Airframe market slows due to reduced man-hour intensity and increased check intervals as new fleets are introduced
$0
$10
$20
$30
$40
$50
$60
$70
$80
$90
$100
2015 2025
Modifications
Airframe
Line
Component
Engine
40%
22%
14%
17%
$64.3B
$96.0B
2.8%
3.6%
4.3%
4.4%
CAGR
4.1% Avg.
5.3%
41%
22%
16%
13%
10 Year Global Commercial Air Transport MRO Demand Growth
$USD
Billions

2121
The current
European fleet
consists of over
6,700 aircraft; with
almost 60%
consisting of
narrowbody
Source: CAPA 2015
NarrowbodyJet
WidebodyJet
Turboprop
Regional Jet
6,746
Aircraft
11%
59%
12%
18%
By Aircraft Type By Country
United Kingdom
Russia
Germany
Turkey
FranceIreland
Spain
Others
6,746
Aircraft
28%
17%
7%
21%
11%
6%6%5%
2015 European Commercial Air Transport Fleet

2222
The European MRO
market is expected
to grow
to approx. $21.3B
by 2025, at 2.3% per
annum
Source: ICF analysis; Forecast in 2015 $USD, exclusive of inflation
Modifications is the fastest
growing MRO segment in
Europe
MRO spend on engines will
experience the largest
absolute growth
$0
$5
$10
$15
$20
$25
2015 2025
Modifications
Airframe
Line
Component
Engine
39%
22%
15%
16%
$17.0B
$21.3B
1.0%
2.5%
2.7%
2.3%
CAGR
2.3% Avg.
3.0%
39%
23%
17%
13%
8%
10-Year Global European MRO Demand Growth
$USD
Billions
7%

2323
Trend Watch:
A New Golden Age of Aircraft
Cabin Interiors

2424
Modifications growth
is driven by airlines
seeking differentiation
in the cabin and
customer experience
Modifications demand includes labor and material spend
*Passenger-To-Freighter Conversions
**Airworthiness Directives / Service Bulletins
Source: ICF analysis, constant 2015 US$
MRO modification market
growth drivers include:
Premium lie-flat seats are
now the minimum standard
Premium economy
Wi-fi, on-board connectivity
Coming soon: ADS-B Mod
program
Capacity (ASM/K) increase
Commercial Air Transport Modifications Forecast
$2.7
$4.9
$0.6
$1.1
$0.4
$0.5
$0.4
$0.4
$0.3
$0.5
$0
$1
$2
$3
$4
$5
$6
$7
$8
2015 2025
AD/SB**
PTF Conversions*
Painting
Avionics Upgrades
Interiors
$4.4B
$7.4B
0.0%
3.7%
6.9%
5.9%
CAGR
5.3% Avg.
3.6%
$USD
Billions

2525
Cabin “densification”
has emerged as cost
effective strategy for
airlines to increase
capacity and drive
bottom line growth
2015 - 2025 Capacity Bridge
0 2 4 6 8 10
2025 ASMs
IncreasedSeat Density
Longer StageLengths
Fleet Growth
2015 ASMs
Available Seat-Miles (ASMs), Trillions
6.2T
8.8T
84%
8%
8%
12 Seats 16 Seats
130 Seats120 Seats
Total = 150 Seats
Total = 164 Seats
Example: Delta A320 Interior
Modification Program
New seats, outlets, IFE, overhead bins
Space-saving galleys to add a row of seats
Source: ICF analysis, delta.com
18 Seats18 Seats
Cabin Upgrades:
Slim seats
Slim lavatories
Slim galleys
Slim coat closets

2626
Trend Watch:
New Technology Aircraft

2727
Over the next
decade, the global
fleet of new
generation aircraft
fleet will grow by
approx. 531% to
nearly 19,000
aircraft
10-Year Fleet Forecast by Aircraft Generation
2,993
18,896
22,212
18,487
2015 2025
Global
New Gen
Mid Gen
Old Gen
Old Gen: 727, 737 Classic, 747 Classic, DC10, L1011, A300
Mid Gen: 757, 767, 747-400, A320 Family, A330/A340, 737NG, 777, ERJ, CRJ
New Gen:, 777X, 787, A350, A330neo, A380, E170/175/190/195, CRJ-7/9/1000, 737MAX
Source: ICF analysis
Europe
+531%
-70%
-17%
612
4,045
5,689
4,487
2015 2025
+561%
-21%
-74%

2828
Over the next
decade, MRO spend
on new technology
Airbus A350 &
Boeing 787 aircraft
will double every
three years
Source: ICF analysis; Forecast in 2015 $USD, exclusive of inflation, includes Boeing 787 and Airbus A350
10-Year MRO Spend for New Technology A350 and 787 Aircraft
$ USD Billions
$0.35
$0.46
$0.47
$0.52
$0.53
$0.62
$0.5$1.0
$1.6
$2.3
$3.3
$4.4
$5.8
$7.1
$8.4
$9.7
$11.1
2015 2016 2017 2018 2019 2020 2021 2022 2023 2024 2025
Africa
Latin America
Middle East
North America
Europe
Asia Pacific
+2000%

2929
New technology
aircraft challenge
traditional MRO
sourcing strategies
= Heavy C-Check= Light C-Check
767
A/C Age 1 2 3 4 5 6 7 8 9 10 11 12
787
Volume(C-checks)
Intensity(man-hours)
Days(Hangar)
767 8 95,000 136
787 4 33,000 47
Impact
Cost Savings: ~65% fewer routine airframe heavy maintenance
man-hours drives an estimated savings of ~$3.5M
Asset Utilization: ~90 additional available flying days enables
increased revenue generation potential
12 Year Heavy Maintenance Schedule
*Based on 4,000 FH/yr utilization
767 C-check = 18mo, 4C = 72mo; 787 C-check = 36mo, 4C = 144mo
Assumed industry standard labor man-hour rate
Aircraft out of Service (AooS) calculated for C/4C/8C checks assuming industry standard MRO hangar productivity
Return on investment
challenges:
Facilities
Tooling & Equipment
Training
IT Systems
Source: ICF analysis

3030
Challenge: How best
to realize value from
the disparate
terabytes of data
generated by new
technology aircraft
Source: ICF analysis
Number of AHM
Parameters
A320: 15,000
B787: 100,000
Stakeholder Battle:
Who will control and
benefit most from the
operating data IP?
Operators
Lessors
OEMs
MRO Suppliers
767: 10,000
Yr 1 Yr 10
~ 137TB
~11TB
777 787
~ 28MB
< 1MB
Transmittable Data(MB/Flt)
A/C Data Generated(TB/Year)
~1,100%
Aircraft Health Monitoring and Data Generation Outlook

3131
ICF believes that
virtual reality (VR)
technology will be
as disruptive to
MRO training as 3D-
printing is to parts
manufacturing
Training 2.0: Virtual Reality

32
For questions regarding this
presentation, please contact:
Jonathan M. BergerVice President Aerospace & MRO Advisory
[email protected] +1 404.819.7669
THANK YOU!
October 18-20, 2016
Amsterdam, Netherlands

3333
Market Research & Analysis
Airline Maintenance Benchmarking
M&A Commercial Due Diligence
OEM Aftermarket Strategy
Aviation Asset Valuations & Appraisals
MRO Information Technology (IT) Advisory
Strategic Sourcing & Supply Chain Mgt.
LEAN Continuous Process Improvement
Military Aircraft Sustainment
ICF provides a full range of Aerospace &
MRO advisory services

3434
ICF is one of the
world’s largest and
most experienced
aviation and
aerospace
consulting firms
Airports • Airlines • Aerospace & MRO • Aircraft
53 years in business (founded 1963)
80+ professional staff
− Dedicated exclusively to aviation and aerospace
− Blend of consulting professionals and experienced aviation executives
Specialized, focused expertise and proprietary knowledge
Broad functional capabilities
More than 10,000 private sector and public sector assignments
Backed by parent ICF International (2015 revenue: 1.13 billion USD)
Global presence –– offices around the world
joined in 2011joined in 2007 joined in 2012 joined in 2014
New York • Boston • Ann Arbor • London • Singapore • Beijing • Hong Kong

3535
Acronyms AD/SB = airworthiness directives / service bulletins AFTK = Capacity Growth ASMs = Available Seat-Miles BBL = oil barrel CAGR = compound annual growth rate CRABS = Canada, Russia, Australia, Brazil, and South Africa EBIT = Earnings Before Interest and Taxes FTK = Global Freight Traffic IP = intellectual property MRO = maintenance, repair, and overhaul OEM = original equipment manufacturer PTF = Passenger-To-Freighter ROIC = return on invested capital VR – virtual reality