ST JOHN’S COLLEGE CAMBRIDGE Annual Report … · Dr R.H. Prince Professor E.D. Laue Dr T.P.J....
51
ST JOHN’S COLLEGE CAMBRIDGE Annual Report and Financial Statements for the year ended 30 June 2015 Registered Charity number 1137428
Transcript of ST JOHN’S COLLEGE CAMBRIDGE Annual Report … · Dr R.H. Prince Professor E.D. Laue Dr T.P.J....

ST JOHN’S COLLEGE CAMBRIDGE
Annual Report and
Financial Statements
for the year ended 30 June 2015
Registered Charity number 1137428

Contents Page
Trustees’ Report 1
Reference and administrative information 1
Governance 3
Objects and aims 4
Activities, performance and future plans 5
Financial review 6
Principal risks and uncertainties 11
Responsibilities of the College Council 11
Statement of internal control 12
Outlook 13
Independent Auditor’s Report to the Governing Body of St John’s College 14
Statement of Principal Accounting Policies 16
Consolidated Income and Expenditure Account 24
Consolidated Statement of Total Recognised Gains and Losses 25
Consolidated Balance Sheet 26
College Balance Sheet 27
Consolidated Cash Flow Statement 28
Notes to the Financial Statements 29

Trustees’ Report
1
Trustees’ Report
REFERENCE AND ADMINISTRATIVE INFORMATION
Status St John’s College, Cambridge was founded in 1511 by Lady Margaret Beaufort, the mother of Henry VII, and is one of the largest of the 31 colleges within the University of Cambridge, each of which is an independent, self‐governing, body with its own property and income. Formerly an exempt charity, the College became a registered charity on 1 August 2010 with registration number 1137428 and is subject to regulation by the Charity Commission for England and Wales. The formal title of the College is the ‘College of St John the Evangelist in the University of Cambridge’. The short title is ‘St John’s College, Cambridge’.
Address and website St John’s Street Cambridge CB2 1TP www.joh.cam.ac.uk
Charity trustees The charity trustees of the College, who are the members of the College Council, during the year were: The Master, Professor C.M. Dobson (Chairman) Mr D.J. Dormor Dr S.M. Colwell (to 30 September 2014) Dr D.M. Fox (to 30 September 2014) Dr M. Ni Mhaonaigh (to 30 September 2014) Dr M. Dörrzapf Mr C.F. Ewbank Professor J.S. Rink Professor R.A. Evans Professor A‐L. Kinmonth Dr H.P. Hughes Dr A.M. Nicholls Professor J. Toland Dr H.E. Watson (from 1 October 2014) Miss S. Tomaselli (from 1 October 2014) Dr A.O. Wilshaw (from 1 October 2014)
Senior Officers Master (or Head of House) Professor C.M. DobsonPresident Mr D.J. DormorSenior Tutor Dr M. DörrzapfSenior Bursar Mr C.F. Ewbank

Trustees’ Report (continued)
2
Membership of the Governing Body
The members of the Governing Body of the College as at 30 June 2015 are set out below Master: Professor C.M. Dobson
President: Mr D.J. Dormor
Other Fellows (in order of election)
Dr E.D. James Colonel R.H. Robinson Dr T. Larsson
Professor R.A. Hinde Professor S. Conway Morris Dr R.D. Mullins
Dr R.H. Prince Professor E.D. Laue Dr T.P.J. Knowles
Professor Sir J.R. Goody Dr S.A. Edgley Dr J.J.W.A. Robinson
Dr J.A. Charles Professor R.A. Evans Dr G.L. Evans
Dr D.J.H. Garling Dr S.M. Colwell Dr M. Atatüre
Dr G.A. Reid Dr H.E. Watson Dr A.B. Reddy
Professor P. Boyde Dr J.P. McDermott Professor Z. Ghahramani
Dr J.A. Leake Professor C.O. Lane Professor J.S. Rink
Dr P.A. Linehan Dr C.J. Robinson Dr T.E.C. Button
Dr A.J. Macfarlane Professor Y.M. Suhov Dr E. Reisner
Professor D.L. McMullen Professor S.R.S. Szreter Professor J. Toland
Dr E.K. Matthews Professor D.J. Howard Professor O. Paulsen
Mr R.G. Jobling Professor M.M.G. Lisboa Dr N.L. Roberts
Dr A.A. Macintosh Professor U.C. Rublack Dr I. Palacios
Professor J. Staunton Professor B.D. Simons Dr K. Franze
Dr C.M.P. Johnson Dr K.C. Plaisted Grant Dr A. Lamacraft
Professor M.A. Clarke Dr M. Ní Mhaonaigh Dr J.P. Slight
Dr A.G. Smith Professor D.C. McFarlane Dr U. Paszkowski
Professor J.A. Emerton Professor C.D. Gray Dr N. MacDonald
Professor J. Iliffe Dr I.M. Winter Dr A.O. Wilshaw
Professor M. Schofield Professor N.S. Manton Dr J.R. Taylor
Dr G.A. Lewis Dr N.S. Arnold Dr P. Murray
Professor R.F. Griffin Dr S. Castelvecchi Dr A. Bouayad
Professor T.P. Bayliss‐Smith Professor A‐L. Kinmonth Dr M.J.V.P. Worthington
Professor S.F. Gull Dr J.M. Lees Dr A.K. Arsan
Dr H.P. Hughes Professor A.D.H. Wyllie Dr M.T.G Humphreys
Dr P. Goddard Professor S.C. Reif Dr R.S. Weatherup
Professor P.T. Johnstone Dr D.M. Fox Dr S.I.A. Cohen
Professor I.M. Hutchings Dr D.M.A. Stuart Dr M.A. Crowley
Professor H.R.L. Beadle Dr A.M. Nicholls Professor S.J. Peacock
Dr J.B. Hutchison Dr M. Dörrzapf Dr M.F.L. De Volder
Professor S.F.C. Milsom Dr P. Antonello Dr H.J. Joyce
Dr D.G.D. Wight Dr P.T. Miracle Dr S. Shao
Professor Sir R.H. Friend Professor A.W. Woods Dr T.M. Adamo
Dr R.E. Glasscock Commodore J.W.R. Harris Dr O. Da Rold
Professor R.P. Tombs Professor S.M. Best Mr M.N. Wells
Dr R.E. McConnel Dr P.M. Geraats Dr S.H. Martin
Professor D.R. Midgley Dr P.T. Wood Dr S. McDowell
Professor P.H. Matthews Dr E.J. Gowers
Dr A. Albors‐Llorens
Dr M. Richards Professor U.C. Goswami Professor T.J.G. Whitmarsh
Professor J.F. Kerrigan Professor R.J. Samworth
Dr E.T. Tipper
Professor G.J. Burton Professor G.W.W. Barker
Dr E.M. Steiner
Professor G.C. Horrocks Dr D.L. Williams
Mr T J. Watts
Professor Sir P.S. Dasgupta
Miss S. Tomaselli Dr A.Y. Chau
Professor Sir M.E. Welland Mr C.F. Ewbank Dr E.M. Bexley
Dr H.R. Matthews Dr F.E. Salmon
Dr M.G. Elliot
Professor B.J. Heal Dr C.G. Warnes
Miss H.S. Knowles
Dr T.P. Hynes
Professor C.D. Jiggins
Dr F. Vella
Professor I.N. McCave Mr S.W. Teal
Dr A.C. Metaxas
Mr A.M.Nethsingha
Trustees’ Report (continued)
3
Principal Advisers
Actuaries
Cartwright Group Ltd, 250 Fowler Avenue, Farnborough Business Park,
Farnborough, Hants, GU14 7JP
Auditor Deloitte LLP, City House, 126‐130 Hills Road, Cambridge, CB2 1RY
Bankers
Barclays Bank PLC, PO Box 885, Mortlock House, Histon, Cambridge, CB24
9DE
Custodian Northern Trust, 50 Bank Street, London E14 5NT
Investment Consultant
Towers Watson Ltd, Watson House, London Road, Reigate, Surrey, RH2 9PQ
Property Advisers Savills (L&P) Ltd, Unex House, 132‐134 Hills Road, Cambridge, CB2 2PA
Savills (L&P) Ltd, Wytham Court, 11 West Way, Oxford, OX2 0QL
Carter Jonas LLP, 6‐8 Hills Road, Cambridge, CB2 1NH
Solicitors
Mills & Reeve, Botanic House, 100 Hills Road, Cambridge, CB2 1PH
GOVERNANCE The Governing documents of the College are its letters patent of 7 August 1509, its deed of foundation of 9 April 1511 and its Statutes of 1926 as variously amended from time to time (the Statutes). The Statutes describe, among other things, the membership and responsibilities of the Governing Body and Council; the election and duties of the Master and President; the election, admission, tenure and removal of Fellows; and the appointment and duties of College officers. The Statutes are supplemented by orders for the regulation of the College’s affairs, made by the Council in accordance with the Statutes. The members of the College Council, which is responsible for the day‐to‐day administration of the affairs of the College, are the charity trustees and are responsible for ensuring compliance with charity law. The members of the Council are the Master and twelve Fellows elected by the College’s Governing Body for rotating four year terms. The members of the Council during the year ended 30 June 2015 are set out in ‘Reference and administrative information’ above. The Governing Body of the College consists of the Master and all Fellows, and is the ultimate authority in the government of the College. It meets termly or more frequently as necessary. All members of the Council are given, on appointment, an induction pack containing key Charity Commission guidance on public benefit and the good governance of charities, and the policy of the College for the management of conflicts of interest. Members of the Council are also required to complete a Register of Interests and declarations of interest are made systematically at meetings. Elected representatives of the junior members of the College attend College Council meetings for the discussion of matters directly affecting the interests of undergraduates and post‐graduates. The Master of the College is elected to office by the Fellows until retirement or earlier resignation. He is responsible for general oversight of the affairs of the College. The Master chairs the Governing Body and the Council.

Trustees’ Report (continued)
4
The other College officers most involved in the governance of the College are as follows: the President, who is elected by the Fellows for a period of up to four years and, among other duties, acts as the Master’s deputy in his absence; the Senior Tutor, who has overall responsibility for the admission, education and welfare of students; the Deans, who are responsible for overseeing the Chapel and the conduct of junior members of the College; the Senior Bursar, who is responsible for managing the College’s finances; and the Domestic Bursar, who manages the domestic affairs of the College. It is the duty of the Council to keep under review the effectiveness of the College’s internal systems of financial and other controls. The Council appoints the Audit Committee of the Council whose duty it is to advise the Council on the appointment of external auditors; to consider reports submitted by the auditors; to monitor the implementation of recommendations made by the auditors; and to monitor risk management and control arrangements. The Audit Committee of the Council makes an annual report to the Council. Membership of the Audit Committee of the Council comprises three members of the Council who are not College Officers. The Council also appoints a separate Audit Committee (Board of Scrutiny) which acts as a Board of Scrutiny and reports to the Governing Body. St John’s College School has its own Governors, who are appointed by the College Council. As at 30 June 2015, six of the twelve Governors of the School were Fellows of the College. The School Governors are responsible to the College Council for the educational policy, management and finances of the School. The Visitor of the College is the Bishop of Ely. OBJECTS AND AIMS Objects The charitable objects of the College are, for the public benefit, to advance education, religion, learning and research, particularly but not exclusively through the provision of a College within the University of Cambridge and through the provision of facilities for, and the conduct of, divine service within the College. Aims The College has developed a series of aims that summarise its approach to achieving its charitable objects, which are:
To admit students on the basis of academic ability and potential alone irrespective of financial circumstances and social, religious or ethnic background, to preserve the College’s ability to select the best students and to provide financial support to students;
To maintain a balanced mix of undergraduate, taught graduate and research graduate students, and to preserve a broad range of academic activity whilst remaining small enough to retain a sense of community and individuality;
To deliver an outstanding education for undergraduates and graduate students, and to sustain the supervision and tutorial welfare systems that are pivotal to the University’s tradition of excellence;
To encourage and support research of international importance by Fellows and graduate students, and to introduce undergraduates to the nature and excitement of original research;
To carry forward the tradition, maintained continuously since its foundation, of being a place of reflection on matters of religious faith;
To provide outstanding social, cultural, musical and sporting opportunities that are a key part of the experience offered by the College and which contribute to the personal development of its members;
To conserve and enhance the College’s historic buildings and grounds, an important part of the world’s architectural heritage, whilst at the same time providing first‐class facilities and infrastructure for the activities that take place within them;

Trustees’ Report (continued)
5
• To preserve the College’s independence and self‐determination, which with that of other Colleges is a fundamental ingredient in the diversity and success of the collegiate University;
• To take a lead in sustaining and enhancing the ability of the University to continue as one of the world's very top academic institutions, in the face of increasing international competition;
• To recognise and value all our alumni as life‐long members of the College community, appreciated for their continuing involvement in, and support of, the College; and
• To operate on a sustainable basis, deploying our resources in a way that preserves intergenerational equity, and living within our means.
The aims of St John’s College School are:
• To educate and accommodate as boarders the Choristers of St John’s College Choir who are admitted on the basis of vocal and musical ability;
• Otherwise, to continue a largely non‐selective admissions policy;
• To offer an outstanding education that fosters the aptitudes and nurtures the growth of each pupil at the School;
• To match its commitment to academic excellence with outstanding non‐academic tuition and activities to provide a rich and fulfilling curriculum;
• To give the highest priority to pastoral care and to provide excellent boarding provision;
• To foster a genuine sense of community among pupils, parents and staff as well as past pupils and parents; and
• To offer significant financial support through fee remission and bursaries. ACTIVITIES, PERFORMANCE AND FUTURE PLANS Activities and Performance In setting objectives and planning activities, the College Council has given careful consideration to the Charity Commission’s general guidance on public benefit and, in particular, to its supplementary public benefit guidance on advancing education, advancing religion and on fee‐charging. The principal objectives of the College for the year were: to continue to strengthen the College’s access and outreach programme; to enhance the very substantial financial support provided to its students; to strengthen the teaching capabilities of the College; to continue to improve academic performance in Tripos exams; to continue to contribute to the research capabilities of the University through the College’s Research Fellowship scheme; to strengthen the opportunities for University post‐doctoral researchers to become associated with the College; to continue with the College’s major capital buildings programme; and to continue the College’s successful fundraising programme.
Highlights of activities and achievements in the year were: hosting four general open days, nine subject specific open days, including two brand new subjects, and three Sutton Trust Summer Schools, in addition to visiting some 40 schools and hosting approximately 100 school visits to the College; continued contribution to the Cambridge Access Bursary scheme which provides means‐tested bursary support at levels far in excess of the Office for Fair Access requirements with some 105 bursaries being provided in the year, of which 66 were at the maximum bursary level; continued significant investment in graduate scholarship provision, ensuring strong support to graduate students; the continuation of the College Teaching Associate scheme to enhance the teaching resource of the College and provide the flexibility to cover short and medium term teaching needs; the election of four teaching Fellows to start in 2015‐16 in the following subjects – Pharmacology, Philosophy, Spanish and Statistics; the appointment of five new College Teaching Associates in Anatomy (two appointments), Reproductive Biology, Physical Natural Sciences and Economics; the election of five outstanding new Research Fellows in Classics, Pure Mathematics, History, Modern & Medieval Languages and English; the election of eight new College Research Associates offering a College affiliation to a significant number of talented post‐doctoral researchers in the University; with regard to facilities, the final phase of the Cripps building refurbishment was completed during the year as was the redevelopment of the School of Pythagoras as an archive centre; and donors to the College in the year were very generous, with funds received to

Trustees’ Report (continued)
6
support College building activities, Library projects and pre‐admission prizes among many other activities.
The principal objectives of the School for the year were: to complete the necessary redevelopment of its teaching facilities for younger children and to proceed with a range of curricular developments.
Highlights of activities and achievements in the year were: 56 leaving pupils gained a record 31 scholarships to their destination schools; the pass rate for the Common Entrance Examination was 100%. This year saw the extensive redevelopment of teaching facilities for children in Years 1 to 4 and a wide range of curricular developments across the School including: Digitally Enhanced Learning, Outdoor Learning, Creative Curriculum and Critical Thinking, Self‐Organised Learning Environments, Philosophy and Mindfulness. The year also saw the implementation of a new My Mind curriculum for older pupils, the introduction of a new Arts Options programme and the creation of a new Computer Coding curriculum.
Future Plans The College has a Strategic Plan covering the period 2011‐16. This sets out the College’s ambitions to: enhance its outreach activities; provide greater financial support for students; further strengthen its teaching capabilities and raise academic performance; increase the number of Research Fellows; improve extracurricular opportunities; complete the current major building refurbishment programme; modernise its approach to human resources; and build on fundraising success to date by launching new fundraising initiatives aimed at building the College’s Endowment.
For the school, the further redevelopment of the School’s Outdoor Learning and Recreational provision will be undertaken and educational innovation and development will continue, including: review of Homework, development of Pupil Improvement monitoring and strategic planning for each child, extension of My Mind curriculum to year 4, implementation of new Computing curriculum throughout KS1 and KS2, continued development of Digitally Enhanced Learning, Extension of the most able, Child Initiated Learning, Arts Award and an outreach project in conjunction with the Farms for City Children charity.
FINANCIAL REVIEW Scope of the Financial Statements The consolidated financial statements include the College itself, St John’s College School and the College’s wholly‐owned trading subsidiaries which are:
St John’s Enterprises Limited, which undertakes principally conference and tourism activities and activities in relation to healthcare for the College;
Aquila Investments Limited, which undertakes building construction and repair, property development, energy supply and farming;
St John’s Innovation Centre Limited, which manages St John’s Innovation Centre on behalf of the College, and provides advice and guidance to early‐stage knowledge‐based businesses in the Cambridge sub‐region; and
Lomas Developments Limited, which principally undertakes property development. The accounts of dormant companies are also consolidated. The financial statements are produced by the College in the Recommended Cambridge College Account (RCCAs) format introduced through revisions to Statute G,III of the University which replaced the previous format introduced in 1926 by the University of Cambridge Commissioners.

Trustees’ Report (continued)
7
Results overview The College’s Consolidated Income and Expenditure Accounts for the years ended 30 June 2015 and 2014 are summarised below:
2015£’000
2014 £’000
% change
Income 35,011 32,814 6.7%Expenditure before depreciation 31,463 29,787 5.6%
Operating surplus before depreciation 3,548 3,027 17.2%Depreciation 5,350 4,927 8.6%
Operating deficit after depreciation (1,802) (1,900) 5.2%Contribution under Statute G,II 766 765 ‐Deficit after Contribution under Statute G,II (2,568) (2,665) 3.6%Net transfers from accumulated income in Endowment funds
9 21 (57.1%)
Retained deficit for the year (2,559) (2,644) 3.2%
Total income was higher by £2,197k (6.7%) and total expenditure excluding depreciation increased by £1,676k (5.6%) in the year, generating an operating surplus before depreciation for the Group of £3,548k, an increase of £521k from an operating surplus before depreciation of £3,027k in the prior year. After depreciation, the operating deficit was £1,802k, an improvement of £98k from the prior year. The Contribution under Statute G,II for the year 2014‐15 increased by £1k (‐%) to £766k against the prior year (£765k). This contribution is an intercollegiate taxation charge which is contributed to the Colleges Fund which makes grants to colleges with inadequate endowments. After the payment of the Contribution under Statute G,II, the College incurred a deficit of £2,568k compared with a deficit of £2,665k in the previous year. Following the transfer of £9k from accumulated income in Endowment funds, the College made a deficit for the year of £2,559k retained within general reserves, compared with a deficit of £2,644k in the previous year. The deficit for the year was after taking into account a non‐cash adjustment of £992k (2014: £641k) in line with the requirements of FRS 17 – Retirement Benefits. Income Income increased overall by £2,197k (6.7%) in 2014‐15 as a result of changes across various activities. The main sources of income for the College and a description of key changes are set out below:
Academic fees and charges: these represented 10.5% of income in the year (10.8% in the previous year) and totalled £3,652k, up £121k (3.4%) from £3,531k in the prior year. This was due primarily to increases in fees from privately‐funded undergraduates and other educational income.
Residences, catering and conferences: this represented 17.7% of income in the year (17.2% in the previous year) and totalled £6,199k, up £559k (9.9%) from the previous year (£5,640k). The increase results from the return of the Cripps Building to full use and the reversal of the impact of the kitchens shutdown in summer 2013 which caused a reduction in catering and conference income.
Endowment and investment income: this represented 50.3% of income in the year (50.9% in the previous year). Gross endowment and investment income was £17,621k in the year, an increase of £914k (5.5%) on the previous year (£16,707k); the endowment drawdown from

Trustees’ Report (continued)
8
permanent funds accounted for on a total return basis increased during the year, while income from expendable funds and permanent funds accounted for under the standard method continued to reduce in the year.
Revenue donations: this represented 2.9% of income (2.1% in the previous year) and totalled £1,007k, up £308k (44.1%) from the prior year (£699k). Donation income increased across the board with unrestricted, restricted and income released from deferred capital grants all up on the prior year.
School: this represented 18.2% of income in the year (18.8% in the previous year). School income consolidated was £6,386k in the year, up £232k (3.8%) from the prior year (£6,154k) primarily as a result of a year on year increase in fee levels.
Other income: this represented 0.4% of income in the year (0.2% in the previous year).
Expenditure Total expenditure was £36,813k in 2014‐15, an increase of £2,099k (6.0%) on the prior year (£34,714k). The main areas of expenditure for the College and a description of key changes are set out below:
Education: this represented 29.5% of expenditure (28.8% in the prior year) and totalled £10,863k, up £856k (8.6%) on the prior year (£10,007k). Staff costs and other operating expenditure continue to grow as the College maintains its investment in teaching resource and student support.
Residences, catering and conferences: this represented 35.2% of expenditure in the year (35.5% in the prior year) and totalled £12,938k, up £623k (5.1%) on the prior year (£12,315k). Staff costs increased year‐on‐year in line with income, and depreciation charges relating to the College’s buildings refurbishment programme continue to grow.
Investment expenditure: this represented 13.2% of expenditure (13.6% in the prior year) and totalled £4,858k in the year, an increase of £130k (2.7%) on the prior year (£4,728k), with the main movements being an increase in expenditure on investment properties partially offset by a reduction in investment consultant, custodian and cash management fees.
School: this represented 16.6% of expenditure in the year (16.6% in the prior year) and totalled £6,125k in the year, up £377k (6.6%) from the prior year (£5,748k) in the main due to higher depreciation and staff costs.
Other: this represented 5.5% of expenditure (5.5% in the prior year) and totalled £2,029k, up £113k (5.9%) on the prior year (£1,916k) due to an increase in staff costs with other operating expenditure remaining broadly static.
The expenditure for each of the activities described above is made up of staff costs, other operating expenses, depreciation, and interest and other finance costs, and these are described below:
Staff costs: these represented 43.6% of expenditure (42.9% in the prior year) and totalled £16,048k in the year, an increase of £1,163k (7.8%) on the prior year (£14,885k). Staff costs have increased across the board driven predominantly by increased investment in teaching and student support and volume related staff costs in residences, catering and conferences.
Other operating expenses: this represented 38.2% of expenditure (39.0% in the prior year) and totalled £14,070k, an increase of £525k (3.9%) on the prior year (£13,545k). The increase derived from two main areas, higher investment costs relating to the College’s investment property portfolio and the increased investment in teaching and student support.
Trustees’ Report (continued)
9
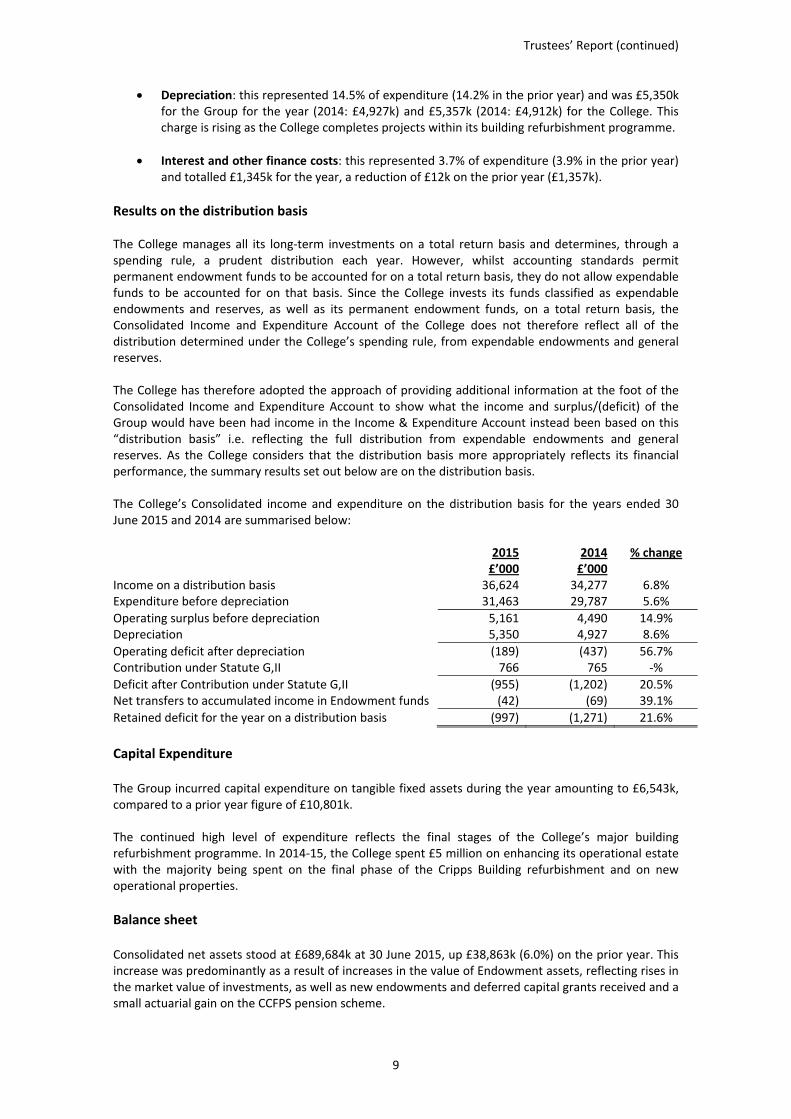
Depreciation: this represented 14.5% of expenditure (14.2% in the prior year) and was £5,350k for the Group for the year (2014: £4,927k) and £5,357k (2014: £4,912k) for the College. This charge is rising as the College completes projects within its building refurbishment programme.
Interest and other finance costs: this represented 3.7% of expenditure (3.9% in the prior year) and totalled £1,345k for the year, a reduction of £12k on the prior year (£1,357k).
Results on the distribution basis The College manages all its long‐term investments on a total return basis and determines, through a spending rule, a prudent distribution each year. However, whilst accounting standards permit permanent endowment funds to be accounted for on a total return basis, they do not allow expendable funds to be accounted for on that basis. Since the College invests its funds classified as expendable endowments and reserves, as well as its permanent endowment funds, on a total return basis, the Consolidated Income and Expenditure Account of the College does not therefore reflect all of the distribution determined under the College’s spending rule, from expendable endowments and general reserves. The College has therefore adopted the approach of providing additional information at the foot of the Consolidated Income and Expenditure Account to show what the income and surplus/(deficit) of the Group would have been had income in the Income & Expenditure Account instead been based on this “distribution basis” i.e. reflecting the full distribution from expendable endowments and general reserves. As the College considers that the distribution basis more appropriately reflects its financial performance, the summary results set out below are on the distribution basis. The College’s Consolidated income and expenditure on the distribution basis for the years ended 30 June 2015 and 2014 are summarised below:
2015£’000
2014 £’000
% change
Income on a distribution basis 36,624 34,277 6.8%Expenditure before depreciation 31,463 29,787 5.6%
Operating surplus before depreciation 5,161 4,490 14.9%Depreciation 5,350 4,927 8.6%
Operating deficit after depreciation (189) (437) 56.7%Contribution under Statute G,II 766 765 ‐%
Deficit after Contribution under Statute G,II (955) (1,202) 20.5%Net transfers to accumulated income in Endowment funds (42) (69) 39.1%
Retained deficit for the year on a distribution basis (997) (1,271) 21.6%
Capital Expenditure The Group incurred capital expenditure on tangible fixed assets during the year amounting to £6,543k, compared to a prior year figure of £10,801k. The continued high level of expenditure reflects the final stages of the College’s major building refurbishment programme. In 2014‐15, the College spent £5 million on enhancing its operational estate with the majority being spent on the final phase of the Cripps Building refurbishment and on new operational properties. Balance sheet Consolidated net assets stood at £689,684k at 30 June 2015, up £38,863k (6.0%) on the prior year. This increase was predominantly as a result of increases in the value of Endowment assets, reflecting rises in the market value of investments, as well as new endowments and deferred capital grants received and a small actuarial gain on the CCFPS pension scheme.

Trustees’ Report (continued)
10
The increase in the pension deficit from £10,280k to £10,930k is largely as a result of a lower discount rate assumption and a shortfall in contributions versus the calculated service cost, partially offset by better than expected investment returns and an experience gain. Creditors falling due after more than one year reduced by £515k from £30,241k to £29,726k due to the commencement of bank loan repayments in 2015‐16. Reserves Consolidated total funds stood at £689,615k at 30 June 2015, up £38,794k (6.0%) on the prior year. At 30 June 2015, reserves (including the fixed asset revaluation reserve, but excluding the pension reserve and Corporate Capital reserve) stood at £247,461k. Endowment and Investment Performance The College has a pool of capital invested for the long‐term to support the charitable activities of the College by providing a reliable source of funding for the College’s operations in perpetuity. This is known as the College’s ‘Endowment’ though it includes assets other than ‘endowment assets’ as set out in note 13. The investment objective of the Endowment is to produce the highest total return consistent with the preservation of long‐term capital value in real terms (such that the College itself can fulfil its charitable objectives in perpetuity and be even handed between the interests of present and future beneficiaries), an acceptable degree of risk and the maintenance of appropriate liquidity. The total value of the Endowment was £470,750k at 30 June 2015, up £39,209k from its value at 30 June 2014. The assets and liabilities of the Endowment fall under a number of headings in the accounts, with the following breakdown:
2015£’000
2014£’000
% change
Fixed Asset Investments 31,435 29,829 5.4% Endowment Assets 431,176 389,644 10.7% Stock 116 119 (2.5%) Debtors 2,178 2,280 (4.5%) Cash at bank 9,265 13,119 (29.4%)
Sub‐total assets 474,170 434,991 9.0% Creditors falling due within one year (3,420) (3,450) (0.9%)
Total 470,750 431,541 9.1% As at 30 June 2015, £253,573k or 53.9% (£224,632k or 52.1% in prior year) of the Endowment was invested in direct UK property, in a mix of agricultural, commercial and residential properties (those residential properties which are let or intended to be let to students, Fellows and staff are considered and valued as operational buildings and appear as part of tangible fixed assets rather than investments). Net other investments had a value of £217,177k (£206,909k in the prior year), representing 46.1% (47.9% in the prior year) of the overall Endowment. The College is exposed to foreign exchange risk on the investments it holds in foreign currencies and seeks to mitigate these risks by entering into partial foreign exchange hedges, which are managed by its custodian. The College operates an ethical investments policy relating to the Endowment. Under the terms of that policy and having regard to the requirements of charity law to maximise returns, the College seeks to ensure that investments are not made in companies whose practices are in conflict with the charitable purposes of the College or are likely to alienate the members or benefactors of the College.
Trustees’ Report (continued)
11
Development and Fundraising College fundraising is focused on the support of a number of activities across the College: teaching and research; student support, including bursaries and scholarships and outreach and access; the maintenance and development of the fabric of the estate; extracurricular activities including sport, music and the arts; general purposes, and a new annual fund. In 2014‐15, donations and benefactions received by the College totalled £3,797k (£2,374k in the prior year).
PRINCIPAL RISKS AND UNCERTAINTIES
The principal risks the College must address are the long‐term ability to maintain and develop its educational and research activities, to attract the best staff and students, and to maintain and renew its physical facilities. The key financial uncertainties and risks are: • The long‐term impact of the changed student financing and fee model on College fee income; • The costs of future student financial support; • Movements in investment markets reducing the real value of the Endowment; • Unexpected building maintenance expenditure; and • The long‐term cost of defined benefit pension provision.
RESPONSIBILITIES OF THE COLLEGE COUNCIL In accordance with the College’s Statutes, the Council is responsible for the administration of the Group’s and College’s affairs. The Council is responsible for preparing the Annual Report and Financial Statements in accordance with applicable law and United Kingdom Accounting Standards (United Kingdom Generally Accepted Accounting Practice). The College’s Statutes and the Statutes and Ordinances of the University of Cambridge require the Council to prepare financial statements for each financial year which give a true and fair view of the state of affairs of the Group and the College and of the surplus or deficit of the Group for that period. In preparing these financial statements the Council is required to:
select suitable accounting policies and then apply them consistently;
make judgements and estimates that are reasonable and prudent;
state whether applicable accounting standards have been followed, subject to any material departures disclosed and explained in the financial statements; and
prepare the financial statements on a going concern basis unless it is inappropriate to presume that the Group and College will continue in operation.
The Council is responsible for keeping accounting records which disclose with reasonable accuracy at any time the financial position of the Group and the College and enable them to ensure that the financial statements comply with the Statutes of the University of Cambridge. They are also responsible for safeguarding the assets of the Group and the College and hence for taking reasonable steps for the prevention and detection of fraud and other irregularities. The Council is responsible for the maintenance and integrity of the corporate and financial information included on the College’s website. Legislation in the United Kingdom governing the preparation and dissemination of financial statements may differ from legislation in other jurisdictions.

Trustees’ Report (continued)
12
STATEMENT OF INTERNAL CONTROL The Council is responsible for maintaining a sound system of internal control that supports the achievement of policy, aims and objectives while safeguarding the public and other funds and assets for which the Council is responsible, in accordance with the College’s Statutes. The system of internal control is designed to manage rather than eliminate the risk of failure to achieve policies, aims and objectives; it therefore provides reasonable but not absolute assurance of effectiveness. The system of internal control is designed to identify the principal risks to the achievement of policies, aims and objectives, to evaluate the nature and extent of those risks and to manage them efficiently, effectively and economically. This process was in place for the year ended 30 June 2015 and up to the date of approval of the financial statements. The Council is responsible for reviewing the effectiveness of the system of internal control. The following processes have been established:
The Council has nineteen regular meetings each year and gives consideration to the major risks to which the College and its subsidiary undertakings are exposed and satisfies itself that systems or procedures are established in order to manage those risks.
Key controls used by the College include:
Formal agendas for all Committee and Council activity;
Clear terms of reference for all committees;
Strategic planning, budgeting, management accounting and cash flow forecasting;
Established organisational structure and lines of reporting;
Formal written policies in key areas such as health and safety and child protection; and
Authorisation and approval levels. The College is seeking to enhance these controls through a formal risk‐management process involving the creation of a risk register. The relevant individuals in the College will be charged with responsibility for evaluating the risks coming within their areas of responsibility and advising the Council on the nature of the risk, the probability of occurrence and severity of impact, as well as steps taken to mitigate the risk. Through the risk register, the College will seek to identify and manage risks. However, the nature of the College’s activities is such that the College is faced with a large number of risks, not all of which can be mitigated. The Council’s review of the effectiveness of the system of internal control is informed by the work of the various Committees, the Bursars and College Officers who have responsibility for the development and maintenance of the internal control framework, and by comments made by the external auditors in their management letter and other reports.

Trustees’ Report (continued)
13
OUTLOOK Whilst the College is fortunate in being a relatively well‐endowed college, its commitments and role in the University are commensurately significant and the College has experienced, and will continue to face, a number of significant financial challenges many of which are common to the University and other Cambridge colleges. Chief among these are the need to increase student support, to cope with increased cost of pension provision and to steward the Endowment through difficult financial markets. On the other hand, the completion of the College’s building refurbishment programme which stretched from 2006 to 2015, has resulted in a welcome, albeit temporary, diminution in the level of capital expenditure on College buildings. The College seeks to respond to these financial challenges by focusing on efficient financial management and endeavouring to manage its resources to best effect. However, if it is to be able to sustain and develop the activities that are critical to its mission and achieve its full potential, it is clear that the College will need to continue to raise additional funds over the coming years. On behalf of the College Council
Professor Christopher Dobson Master
Chris EwbankSenior Bursar
13 November 2015

Independent Auditor’s Report
14
Independent Auditor’s Report to the Governing Body of St John’s College, Cambridge
We have audited the financial statements of St John’s College for the year ended 30 June 2015 which comprise the statement of principal accounting policies, the consolidated income and expenditure account, the consolidated statement of total recognised gains and losses, the consolidated and College balance sheets, the consolidated cash flow statement and the related notes 1 to 32. The financial reporting framework that has been applied in their preparation is applicable law and United Kingdom Accounting Standards (United Kingdom Generally Accepted Accounting Practice) and the Statement of Recommended Practice: Accounting for Further and Higher Education. This report is made solely to the Governing Body in accordance with the College’s Statutes and the Statutes of the University of Cambridge, section 144 of the Charities Act 2011 and regulations made under section 154 of that Act. Our audit work has been undertaken so that we might state to the Governing Body those matters we are required to state to it in an auditor’s report and for no other purpose. To the fullest extent permitted by law, we do not accept or assume responsibility to anyone other than the College and the Governing Body, for our audit work, for this report, or for the opinions we have formed.
Respective responsibilities of the trustees and auditor As explained more fully in the statement of responsibilities of the College Council, the College Council is responsible for the preparation of the financial statements that give a true and fair view. Our responsibility is to audit and express an opinion on the financial statements in accordance with applicable law and International Standards on Auditing (UK and Ireland). Those standards require us to comply with the Auditing Practices Board’s Ethical Standards for Auditors.
Scope of the audit of the financial statements An audit involves obtaining evidence about the amounts and disclosures in the financial statements sufficient to give reasonable assurance that the financial statements are free from material misstatement, whether caused by fraud or error. This includes an assessment of: whether the accounting policies are appropriate to the College’s and the Group’s circumstances and have been consistently applied and adequately disclosed; the reasonableness of significant accounting estimates made by the Council; and the overall presentation of the financial statements. In addition, we read all the financial and non‐financial information in the annual report to identify material inconsistencies with the audited financial statements and to identify any information that is apparently materially incorrect based on, or materially inconsistent with, the knowledge acquired by us in the course of performing the audit. If we become aware of any apparent material misstatements or inconsistencies we consider the implications for our report.
Opinion on financial statements In our opinion the financial statements:
give a true and fair view of the state of the Group and of the College’s affairs as at 30 June 2015 and of its deficit for the year then ended;
have been properly prepared in accordance with United Kingdom Generally Accepted Accounting Practice and the Statement of Recommended Practice: Accounting for Further and Higher Education; and
have been prepared in accordance with the requirements of the Charities Act 2011, the College’s Statutes and the Statutes of the University of Cambridge.

Independent Auditor’s Report
15
Opinion on other matters prescribed by the Statutes of the University of Cambridge In our opinion:
the contribution due from the College to the University has been correctly computed as advised in provisional assessment by the University of Cambridge and in accordance with the provisions of Statute G,II, of the University of Cambridge; and
in all material respects, income during the year ended 30 June 2015 has been applied in accordance with the University’s statutes.
Matters on which we are required to report by exception We have nothing to report in respect of the following matters where the Higher Education Funding Council for England Audit Code of Practice or the Charities Act 2011 requires us to report to you if, in our opinion:
the information given in the Trustees’ Report is inconsistent in any material respect with the financial statements; or
sufficient accounting records have not been kept; or
the financial statements are not in agreement with the accounting records and returns; or
we have not received all the information and explanations we require for our audit.
Deloitte LLP Chartered Accountants and Statutory Auditor Cambridge, United Kingdom
13 November 2015

Statement of Principal Accounting Policies
16
Statement of Principal Accounting Policies BASIS OF PREPARATION The Financial Statements have been prepared in accordance with the provisions of the Statutes of the College and of the University of Cambridge and applicable United Kingdom Accounting Standards and have been produced in accordance with the Recommended Cambridge College Accounts (RCCA) format introduced through revisions to Statute G,III of the University which replaced the previous format introduced in 1926 by the University of Cambridge Commissioners. In addition, the financial statements comply with the Statement of Recommended Practice: Accounting for Further and Higher Education (“the SORP”).
The income and expenditure account includes an activity analysis in order to demonstrate that the College is satisfying its obligations to the University of Cambridge with regard to use of public funds. The analysis required by the SORP is set out at note 9.
The College’s activities and financial position, together with the factors likely to affect its future development, performance and position, are set out in the Trustees’ Report which forms part of this Annual Report. The College annually prepares a high‐level, ten‐year, financial plan and a detailed cashflow forecast covering a period of at least twelve months from the date of the approval and signature of the financial statements, and on that basis has a reasonable expectation that the College has adequate resources to continue in operational existence for the foreseeable future. Thus it continues to adopt a going concern basis of accounting in preparing the annual Financial Statements.
BASIS OF ACCOUNTING The Financial Statements have been prepared under the historical cost convention, modified in respect of the treatment of investments which are included at valuation.
BASIS OF CONSOLIDATION The consolidated Financial Statements include the College and its subsidiary undertakings. Details of the subsidiary undertakings included are set out in note 32. Intra‐group balances are eliminated on consolidation. The consolidated Financial Statements do not include the activities of student societies as these are separate bodies in which the College has no financial interest and because these are viewed as autonomous activities.
RECOGNITION OF INCOME Academic Fees Academic fees for the College and the School are recognised in the period to which they relate and include all fees chargeable to students or their sponsors. The cost of any fees waived or written off by the College and the School is included as expenditure.
Rental Income Rental income is recognised on an accruals basis according to the terms of the lease.
Donations and Benefactions
Charitable donations are recognised on receipt or when there is certainty of future receipt and the value can be measured reliably. The accounting treatment of a donation depends on the nature and extent of restrictions specified by the donor. Donations with no substantial restrictions are recognised as income in the Consolidated Income and Expenditure Account. Donations which are to be retained for the future benefit of the College, and other donations with substantially restricted purposes, other than for acquisition or construction of tangible fixed assets, are recognised in the Consolidated Statement of Total Recognised Gains and Losses as new endowments.

Statement of Principal Accounting Policies
17
Gifts, donations and benefactions that are expected to be spent within two years of receipt are shown as income in the year in which they are received, provided that they have been fully expended on that purpose within the year of receipt. Otherwise the gift may be deferred in full or in part and held within liabilities pending release. Gifts, benefactions and legacies are treated as capital if there is a legally binding restriction or it can be inferred that the sum is intended to be retained or if the College does not expect to be able to fully spend the donation within two years. In determining the accounting treatment the Council considers the donor's correspondence and association with the College together with the size of the sum involved. Gifts, benefactions, and legacies treated in this way are recognised in the Consolidated Statement of Total Recognised Gains and Losses as new endowments received.
Capital Grants and Donations Grants and donations are received for the purposes of funding the acquisition and construction of tangible fixed assets. In the case of depreciable assets these are credited to deferred capital grants and released to income over the estimated useful life of the respective assets in line with the depreciation policy. Grants and donations of, or for the acquisition of, freehold land or heritage assets, which are non‐depreciable assets, are credited to the Income and Expenditure account in the year of acquisition.
Residences, catering and conferences income Income received in relation to the supply of accommodation and catering and conferences income is recognised in the period in which the related goods or services are delivered. Other Income Income is received from a range of activities including choir engagements and alumni events and other services rendered. Income is recognised in the period in which the related goods or services are delivered.
Endowment and Investment Income All investment income, excluding endowment income from permanent endowments accounted for on a total return basis, is credited to the Consolidated Income and Expenditure Account in the period in which it is earned. For endowment income from permanent endowments accounted for on a total return basis, the College applies either a total return or a standard method of accounting for fund investment returns, depending on the nature of the fund, as set out below:
Permanent Funds Unrestricted For all unrestricted permanent funds a total return accounting policy is applied, thus a proportion of the related earnings and capital appreciation is allocated to the Consolidated Income and Expenditure Account as a drawdown in accordance with the total return concept with any excess income remaining in the unapplied total return segment of the endowment fund. The surplus or deficiency of total return, after deducting the annual Endowment drawdown, is included in the Consolidated Statement of Total Recognised Gains and Losses and is carried forward as unapplied total return. Restricted For restricted permanent funds where the level of distributable reserves has not yet reached at least 20% of original capital, the standard method accounting policy is applied and the investment income

Statement of Principal Accounting Policies
18
allocated to the Consolidated Income and Expenditure Account is the actual income earned in the year limited by the qualifying expenditure incurred in the year. For restricted permanent funds where the level of distributable reserves has reached at least 20% of original capital a total return accounting policy is applied as above, except that the sum allocated to the Income and Expenditure Account is limited to the qualifying expenditure incurred in the year.
Expendable Funds Income from expendable restricted funds not spent in accordance with the restrictions of the endowment is transferred from the Consolidated Income and Expenditure Account to the unspent income segment of the endowment. When there is subsequent expenditure of accumulated income from a restricted capital fund, income is credited back to the Income and Expenditure Account from the restricted capital fund to match the expenditure through transfers from unspent income.
Total Return Under the total return method, the Endowment drawdown is determined by a spending rule which is designed to provide stable annual spending levels and to preserve the real value of the endowment portfolio over time. The spending rule adopted by the College is a ‘Constant Growth with Cap and Floor’ rule under which the drawdown from the Endowment for a particular year is the previous year’s drawdown increased by RPI+1%, subject to a minimum payout of 3% and a maximum payout of 4% of a trailing 3 year average Endowment value. The target spending rate is 3.5%, which reflects long‐run expected real returns given the College’s asset allocation and long‐run expected College inflation. However, the actual spending rate in any year will depend on the results of the spending rule and will therefore vary from the 3.5% target rate. The spending rule provides for the drawdown to be adjusted to reflect additions to the Endowment through donations.
INVESTMENT COSTS Investment costs associated with the management of the College’s securities investment portfolio are capitalised. As such, they are not included in the Income and Expenditure Account. Other investment costs, associated predominantly with the management of the College’s property portfolio and its investment subsidiaries, are included in the Income and Expenditure Account in the year to which they relate.
FOREIGN CURRENCY TRANSLATION Transactions denominated in foreign currencies are recorded at the rate of exchange ruling at the date of the transactions. Monetary assets and liabilities denominated in foreign currencies are translated into sterling at year‐end rates or, where there are related forward foreign‐exchange contracts, at contract rates. The resulting exchange differences are dealt with in the determination of income and expenditure for the financial year. Gains or losses on forward foreign‐exchange contracts and foreign currency bank accounts within the investment portfolio are however taken to reserves through the Consolidated Statement of Total Recognised Gains and Losses, as these are in substance part of the change in market value of the portfolio.
JOINT VENTURE ACCOUNTING In accordance with FRS 9 “Associates and Joint Ventures”, the College accounts for its share in a joint venture as a fixed asset investment shown at cost in the investing entity’s individual financial statements and on a gross equity basis in the consolidated financial statements.
Statement of Principal Accounting Policies
19
TANGIBLE FIXED ASSETS
Land and Buildings In accordance with the transitional provisions of Financial Reporting Standard 15 as applied to the College Accounts, land and buildings are stated at valuation on the basis of depreciated replacement cost. The valuation as at 30 June 2004 was carried out by Carter Jonas LLP, Chartered Surveyors. This valuation will not be updated and will be carried forward as the gross value to be depreciated over its expected useful economic life. It is not possible to quantify the difference between depreciation based on historic cost and depreciation based on this valuation because records of the historic cost of land and buildings were not required to be kept under the accounting regime applicable to Colleges within the University of Cambridge prior to 2004. Freehold land is not shown separately. Freehold buildings are depreciated on a straight‐line basis over their expected useful economic lives of 50 years. Freehold land is not depreciated. Where buildings are acquired with the aid of specific bequests or donations they are capitalised and depreciated in accordance with the depreciation policy for that asset class. The related benefactions are credited to a deferred capital grant and are released to the Income and Expenditure Account over the expected useful life of the related asset on a basis consistent with the depreciation policy. Buildings under construction are valued at cost, based on the value of architects’ certificates and other direct costs incurred. They are not depreciated until they are brought into use. Finance costs which are directly attributable to the construction of buildings are not capitalised as part of the cost of those assets. A review for impairment of a fixed asset is carried out if events or changes in circumstances indicate that the carrying amount of the fixed asset may not be recoverable. Land held specifically for development, investment and subsequent sale is included in endowment assets at market value. The cost of additions to operational property shown in the balance sheet includes the cost of land, where applicable.
Maintenance of Premises The College has a five‐year rolling maintenance plan which is reviewed on an annual basis. The cost of routine maintenance is charged to the Income and Expenditure Account as it is incurred. The cost of major refurbishment and maintenance which restores value is capitalised when the project valuation is above the capitalisation threshold of £20,000. Expenditure capitalised is depreciated on a straight‐line basis over the expected useful economic life.
Equipment Furniture, fittings and equipment costing less than £20,000 per individual item or group of related items are written off in the year of acquisition. All other assets are capitalised at cost and depreciated on a straight‐line basis over their expected useful life as follows: Furniture and equipment: Plant and machinery (long life) 10 years Plant and machinery (short life) 5 years Motor vehicles 5 years Furniture and soft furnishings 5 yearsComputer equipment: Computer network and equipment 5 years
Where equipment is acquired with the aid of specific bequests or donations, it is capitalised and depreciated as above, which is the same rate at which the associated deferred capital grant is released to the Consolidated Income and Expenditure Account.
Statement of Principal Accounting Policies
20
Leased Assets Rental costs under operating leases are charged to expenditure in equal amounts over the periods of the leases. Assets purchased under finance leases are capitalised and depreciated over their useful life.
Heritage Assets The College holds and conserves a number of collections, exhibits, artefacts and other assets of historical, artistic or scientific importance. In accordance with FRS 15 and FRS 30 (Heritage Assets) heritage assets acquired before 1 July 2007 have not been capitalised since reliable estimates of cost or value are not available on a cost benefit basis, and the volume of items and valuation issues (e.g. age, origin, veracity) mean that it is neither practical nor beneficial to identify and value them. Acquisitions since 1 July 2007 and valued at over £20k are capitalised and recognised in the Balance Sheet at the cost or, in the case of donated assets, at valuation on receipt where such a cost or valuation is reasonably obtainable. Heritage assets are not depreciated since their long economic life and high residual value mean that any depreciation would not be material. Operational assets are those that the College uses in the course of meeting its charitable purposes of education, learning, research and religion. Once an asset has been classified as an operational asset it is not reclassified as a heritage asset.
INVESTMENTS Fixed asset investments and Endowment assets are included in the Consolidated Balance Sheet at market value, except for investments in subsidiary undertakings which are stated in the College’s Balance Sheet at cost and eliminated on consolidation. Investments for which no market value is readily obtainable are carried at historical cost less any provision for impairment in their value. Realised and unrealised capital gains and losses are recognised as increases or decreases of market value of investment assets or endowment assets as appropriate within the Consolidated Statement of Total Recognised Gains and Losses. The investment property portfolio is valued annually at open market value (using the desktop valuation method) by the College's principal property advisers, Savills (L&P) Limited, with the exception of certain residential long leasehold properties which are valued by Carter Jonas LLP. Due to the length of ownership of many of the investment properties, realised capital gains cannot be recognised with reference to historic cost.
STOCKS Stocks are stated at the lower of cost and net realisable value after making provision for slow moving and obsolete items. PROVISIONS Provisions are recognised when the College has a present legal or constructive obligation as a result of a past event, it is probable that a transfer of economic benefits will be required to settle the obligation, and a reliable estimate can be made of the amount of the obligation.
Statement of Principal Accounting Policies
21
TAXATION The College is a registered charity (number 1137428) and also a charity within the meaning of section 506(1) of the Taxes Act 1988. Accordingly, the College is exempt from taxation in respect of income or capital gains received within the categories covered by Section 505 of the Taxes Act 1988 or Section 256 of the Taxation of Chargeable Gains Act 1992, to the extent that such income or gains are applied to exclusively charitable purposes. The College receives no similar exemption in respect of Value Added Tax.
CONTRIBUTION UNDER STATUTE G,II The College is liable to be assessed for Contribution under the provisions of Statute G,II of the University of Cambridge. Contribution is used to fund grants to Colleges from the Colleges Fund. The liability for the year is as advised to the College by the University based on an assessable amount derived from the value of the College’s assets as at the end of the previous financial year.
PENSION COSTS
The College and its subsidiary undertakings participate in a number of pension schemes of both defined‐benefit and defined‐contribution types.
Cambridge Colleges Federated Pension Scheme
The College contributes to the Cambridge Colleges Federated Pension Scheme (“CCFPS”), which is a defined‐benefit pension scheme. Unlike the other defined‐benefit schemes (as noted below), this scheme has assets and liabilities directly attributable to the College. Amounts charged to operating expenditure are the current service costs and gains and losses on settlements and curtailments. They are included as part of staff costs. Past‐service costs are recognised immediately in the Consolidated Income and Expenditure Account if the benefits have vested. If the benefits have not vested immediately, the costs are recognised over the period until vesting occurs. The interest cost and the expected return on assets are shown as a net amount of other finance costs or credits to interest. Actuarial gains and losses are recognised immediately in the Consolidated Statement of Total Recognised Gains and Losses. The scheme is funded, with the assets of the scheme held separately from those of the group, in separate trustee administered funds. The scheme assets are measured at fair value and liabilities are measured on an actuarial basis using the projected unit method and discounted at a rate equivalent to the current rate of return on a high quality corporate bond of equivalent currency and term to the scheme liabilities. The actuarial valuations are obtained at least triennially and are updated at each balance sheet date. The resulting defined‐benefit liability is presented separately after other net assets on the face of the Balance Sheet.
Other Defined‐Benefit Pension Schemes
The College also makes contributions to the defined‐benefit schemes set out below. The College is unable to identify its share of the assets and liabilities of these schemes on a consistent and reasonable basis. Therefore, these schemes are accounted for as if they were defined‐contribution pension schemes. Contributions are charged to the Consolidated Income and Expenditure Account as they are incurred. Differences between contributions payable in the year and contributions actually paid are shown as either accruals or prepayments in the Balance Sheet. (i) The College participates in the Universities Superannuation Scheme (USS), a defined benefit
scheme which is contracted out of the State Second Pension (S2P). The assets of the scheme are held in a separate trustee‐administered fund. Because of the mutual nature of the scheme, the scheme’s assets are not hypothecated to individual institutions and a scheme‐wide contribution rate is set. The institution is therefore exposed to actuarial risks associated with other institutions’ employees and is unable to identify its share of the underlying assets and liabilities of the scheme on a consistent and reasonable basis and therefore, as required by FRS 17 “Retirement benefits”, accounts for the scheme as if it were a defined contribution scheme. As a
Statement of Principal Accounting Policies
22
result, the amount charged to the Consolidated Income and Expenditure Account represents the contributions payable to the scheme in respect of the accounting period.
(ii) Church of England Funded Pensions Scheme: The College participates in the Church of England
Funded Pensions Scheme. This is a defined‐benefit scheme but the College is unable to identify its share of the underlying assets and liabilities.
(iii) Teachers’ Pension Scheme: The College participates in the Teachers’ Pension Scheme which is a
statutory, contributory, final‐salary scheme. The College is unable to identify its share of the underlying assets and liabilities.
Defined‐Contribution Pension Schemes The College and its subsidiaries also contribute to a number of defined‐contribution pension schemes. For defined‐contribution schemes the amount charged to the Consolidated Income and Expenditure Account in respect of pension costs and other post‐retirement benefits is the contributions payable in the year. Differences between contributions payable in the year and contributions actually paid are shown as either accruals or prepayments in the Consolidated Balance Sheet.
FUNDS AND RESERVES The RCCA format requires the College to distinguish between Deferred Capital Grants, Endowments, and Reserves.
Deferred Capital Grants These are grants and donations used to purchase depreciating tangible fixed assets, which are released to income over the expected useful life of the assets concerned. Interest earned on the grant prior to the purchase of the asset is credited to the capital of the grant.
Endowments Where the College receives donations that cannot be spent within 2 years of receipt, these are credited to endowment funds. Endowment funds are subdivided into:
Permanent restricted endowments: where the College can spend the income from the fund on expenditure that meets the fund's objectives. Expendable restricted endowments: where the College can spend both the income and the capital of the fund on expenditure that meets the fund's objectives. Permanent unrestricted funds: where the College can spend the income from the fund on any activity of the College.
Corporate Capital The College’s Corporate Capital has certain features of a permanent unrestricted Endowment (in that the majority is invested in perpetuity to provide an income to support the College’s charitable activities) and certain features of a permanent reserve (in that it is established practice that Cambridge Colleges can borrow against their Corporate Capital to invest in operational property.) The portion of the College’s Corporate Capital that is currently acting as an Endowment is included in permanent unrestricted endowments, while the portion that is currently acting as a reserve is included in reserves, but disclosed separately on account of its materiality. The exact split between these two components varies over time. When Corporate Capital buys and sells investment assets the portion that falls within endowment assets varies, and the change is represented by an annual transfer between the Endowments note and the Reserves note.

Statement of Principal Accounting Policies
23
Reserves Funds that are neither Endowments nor Deferred Capital Grants are classed as reserves. The College's reserves are disclosed under the following four headings:
General reserves excluding pension reserve (containing all reserves not included in another category below); Pension reserve (containing the surplus or deficit on the College's defined benefit pension schemes where this can be identified. When the schemes are in deficit, this reserve will necessarily be overdrawn as a consequence); Corporate Capital reserve (containing the portion of the College's Corporate Capital, as described above, that is currently being used as a reserve rather than as an endowment); and Fixed asset investment revaluation reserve (containing the unrealised investment gains on fixed asset investments held within the College's consolidated trust fund. These are the cumulative gains less cumulative losses since the underlying assets in the fund were acquired by the College, rather than acquired by the particular fund that currently holds them).
ST JOHN'S COLLEGE SCHOOL The School is viewed as a separate activity of the College. Control of its reserves has been delegated to its Board of Governors. Its reserves, including those representing its tangible fixed assets, are included in general reserves (except for its prize and trust funds which, being restricted rather than designated funds, are treated on an individual basis).
24
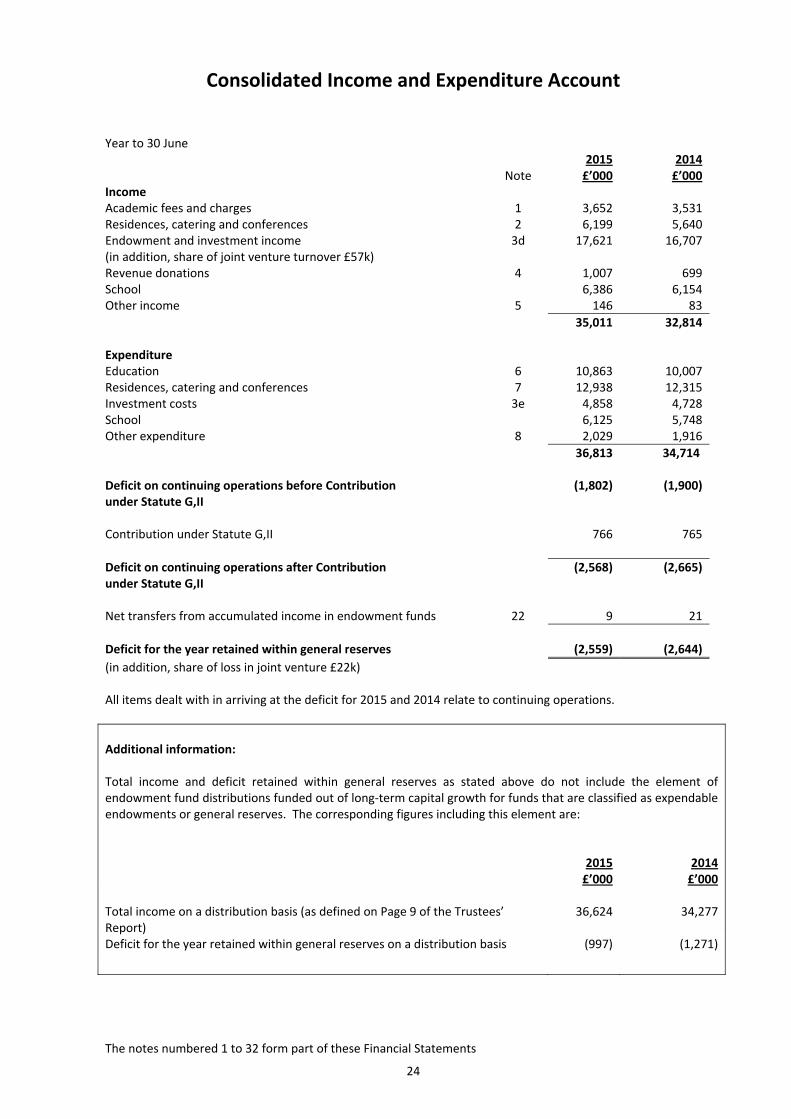
Consolidated Income and Expenditure Account
Year to 30 June
Note 2015 £’000
2014£’000
Income Academic fees and charges 1 3,652 3,531Residences, catering and conferences 2 6,199 5,640Endowment and investment income (in addition, share of joint venture turnover £57k)
3d 17,621 16,707
Revenue donations School
4
1,007 6,386
6996,154
Other income 5 146 83
35,011 32,814 Expenditure Education 6 10,863 10,007Residences, catering and conferences Investment costs School
73e
12,938 4,858 6,125
12,3154,7285,748
Other expenditure 8 2,029 1,916
36,813 34,714 Deficit on continuing operations before Contribution under Statute G,II
(1,802) (1,900)
Contribution under Statute G,II 766 765
Deficit on continuing operations after Contribution under Statute G,II
(2,568) (2,665)
Net transfers from accumulated income in endowment funds 22 9 21
Deficit for the year retained within general reserves (2,559) (2,644)
(in addition, share of loss in joint venture £22k) All items dealt with in arriving at the deficit for 2015 and 2014 relate to continuing operations.
Additional information: Total income and deficit retained within general reserves as stated above do not include the element of endowment fund distributions funded out of long‐term capital growth for funds that are classified as expendable endowments or general reserves. The corresponding figures including this element are:
2015 £’000
2014£’000
Total income on a distribution basis (as defined on Page 9 of the Trustees’Report)
36,624 34,277
Deficit for the year retained within general reserves on a distribution basis (997) (1,271)
The notes numbered 1 to 32 form part of these Financial Statements

25
Consolidated Statement of Total Recognised Gains and Losses
Year to 30 June
Note
2015Restricted
Funds£’000
2015 Unrestricted
Funds £’000
2015 Total Funds £’000
2014Total Funds£’000
Deficit on Income and Expenditure account ‐ (2,559) (2,559) (2,644) Decrease in cumulative unspent endowment fund income
22 (9) ‐ (9) (21)
Increase in market value of investments: Endowment assets 22 6,473 30,757 37,230 24,811 Fixed asset investments 23 ‐ 2,836 2,836 1,799 Share of joint venture 22 ‐ 195 195 ‐ Foreign exchange (losses)/gains linked to investments
(936) (1,248) (2,184) 1,881
New endowments 22 2,268 390 2,658 956New deferred capital grants 21 487 ‐ 487 783Release of Grant income 21 (202) ‐ (202) (163) Transfers (790) 790 ‐ ‐ Actuarial gain/(loss) in respect of pension schemes
20 ‐ 342 342 (1,874)
Total recognised gains relating to the year 7,291 31,503 38,794 25,528
Reconciliation: Opening capital and reserves 92,580 558,241 650,821 625,293 Total recognised gains relating to the year 7,291 31,503 38,794 25,528
Closing capital and reserves 99,871 589,744 689,794 650,821
The notes numbered 1 to 32 form part of these Financial Statements

26
Consolidated Balance Sheet
As at 30 June Note
2015 £’000
2015 £’000
2014 £’000
2014£’000
Fixed Assets Tangible assets 11 253,147 251,954Investments 12 31,435 29,829
284,582 281,783Endowment Assets Endowment Assets before investment in joint venture 430,445 389,721Investment in Joint Venture: Share of gross assets 1,694 ‐ Share of gross liabilities (884) 810 ‐ ‐
13 431,255 389,721Current Assets Stock 14 688 713Debtors 15 2,752 2,679Current asset investments 16 2,631 6,087Cash at bank and in hand 16,382 18,191
22,453 27,670Current Liabilities Creditors: amounts falling due within one year 17 (8,019) (7,832)
Net current assets 14,434 19,838 Total Assets less current liabilities 730,271 691,342 Creditors: amounts falling due after more than one year
18 (29,726) (30,241)
Net assets excluding pension liability 700,545 661,101 Net pension liability 20 (10,930) (10,280)
Net assets including pension liability 689,615 650,821
Represented by:
2015 Restricted
Funds £’000
2015 Unrestricted
Funds £’000
2015 Total Funds £’000
2014Total Funds£’000
Deferred capital grants 21 9,192 ‐ 9,192 8,907Endowments Expendable endowments 22 25,046 ‐ 25,046 23,717 Permanent endowments
(including investment in joint venture £810k)
22 65,633 340,576 406,209 366,004
Reserves General reserves excluding pension
reserve 23 ‐ 241,249 241,249 243,884
Pension reserve 23 ‐ (10,930) (10,930) (10,280) Corporate capital reserve 23 ‐ 12,637 12,637 16,737 Fixed asset investment revaluation reserve 23 ‐ 6,212 6,212 1,852
Total Funds 99,871 589,744 689,615 650,821
These Financial Statements were approved by the College Council and authorised for issue on 12 November 2015 and signed on their behalf by:
Professor Christopher Dobson Master
Chris EwbankSenior Bursar
The notes numbered 1 to 32 form part of these Financial Statements

27
College Balance Sheet
As at 30 June Note
2015 £’000
2014£’000
Fixed Assets Tangible assets 11 253,465 252,312Investments 12 31,435 29,829
284,900 282,141 Endowment Assets 13 435,946 395,472 Current Assets Stock 14 558 582Debtors 15 2,717 3,999Current asset investments 16 2,631 6,087Cash at bank and in hand 15,886 17,753
21,792 28,421Current Liabilities Creditors: amounts falling due within one year 17 (12,028) (13,840)
Net current assets 9,764 14,581 Total Assets less current liabilities 730,610 692,194 Creditors: amounts falling due after more than one year
18 (29,726) (30,241)
Net assets excluding pension liability 700,884 661,953 Net pension liability 20 (10,930) (10,280)
Net assets including pension liability 689,954 651,673
Represented by:
2015 Restricted
Funds £’000
2015 Unrestricted
Funds £’000
2015 Total Funds £’000
2014 Total Funds £’000
Deferred capital grants 21 9,192 ‐ 9,192 8,907Endowments Expendable endowments 22 25,046 ‐ 25,046 23,717 Permanent endowments 22 65,633 345,267 410,900 371,755Reserves General reserves excluding pension reserve 23 ‐ 241,583 241,583 244,286 Pension reserve 23 ‐ (10,930) (10,930) (10,280) Corporate capital reserve 23 ‐ 7,951 7,951 11,436 Fixed asset investment revaluation reserve 23 ‐ 6,212 6,212 1,852
Total Funds 99,871 590,083 689,954 651,673
These Financial Statements were approved by the College Council and authorised for issue on 12 November 2015 and signed on their behalf by:
Professor Christopher Dobson Master
Chris EwbankSenior Bursar
The notes numbered 1 to 32 form part of these Financial Statements
28
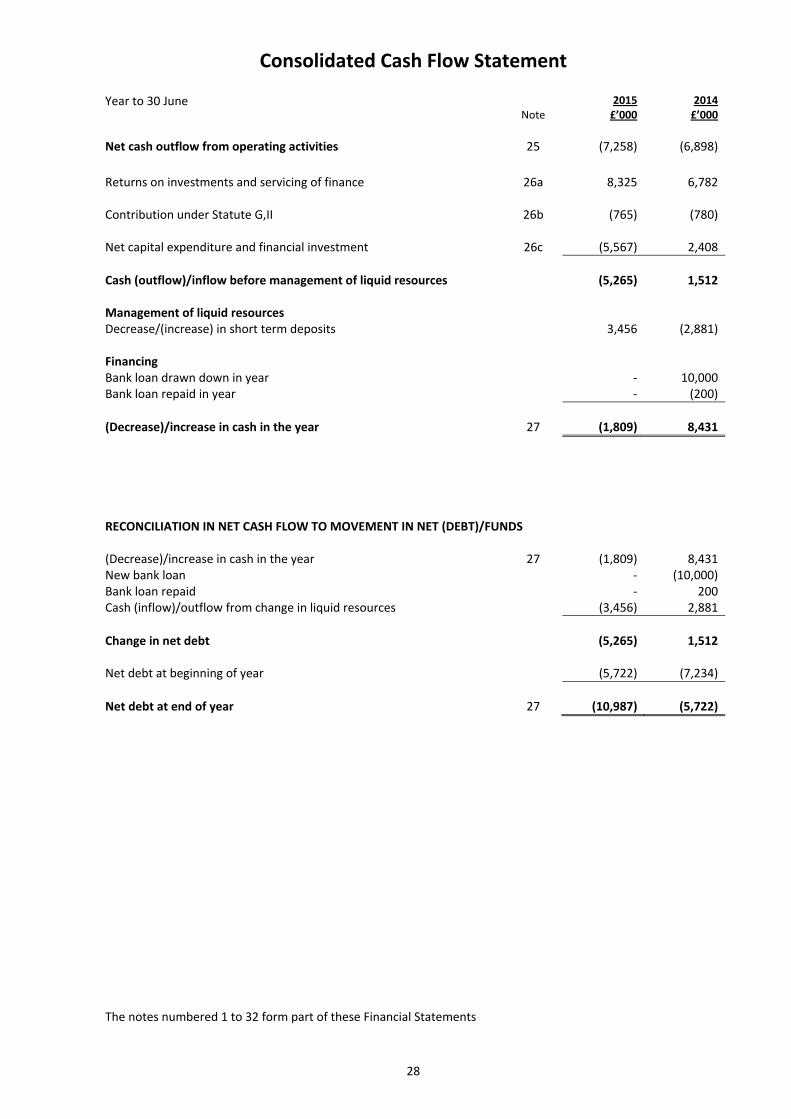
Consolidated Cash Flow Statement Year to 30 June
Note 2015 £’000
2014 £’000
Net cash outflow from operating activities 25 (7,258) (6,898)
Returns on investments and servicing of finance 26a 8,325 6,782 Contribution under Statute G,II 26b (765) (780) Net capital expenditure and financial investment 26c (5,567) 2,408
Cash (outflow)/inflow before management of liquid resources Management of liquid resources Decrease/(increase) in short term deposits
(5,265)
3,456
1,512
(2,881)
Financing Bank loan drawn down in year ‐ 10,000Bank loan repaid in year ‐ (200)
(Decrease)/increase in cash in the year 27 (1,809) 8,431
RECONCILIATION IN NET CASH FLOW TO MOVEMENT IN NET (DEBT)/FUNDS (Decrease)/increase in cash in the year 27 (1,809) 8,431New bank loan ‐ (10,000)Bank loan repaid ‐ 200Cash (inflow)/outflow from change in liquid resources (3,456) 2,881
Change in net debt (5,265) 1,512 Net debt at beginning of year (5,722) (7,234)
Net debt at end of year 27 (10,987) (5,722)
The notes numbered 1 to 32 form part of these Financial Statements

29
Notes to the Financial Statements
1. ACADEMIC FEES AND CHARGES 2015
£’000 2014 £’000
College Fees
Fee income paid on behalf of undergraduates at the regulated undergraduate fee rate (per capita fee £4,185/£4,500) (2014: £4,068/£4,500))
2,173 2,194
Unregulated undergraduate fee income (per capita fee £5,600(2014: £5,386))
482 390
Fee income received at the Graduate fee rate (per capita fee £2,547(2014: £2,424))
560 542
3,215 3,126 Other Educational income 437 405
Total 3,652 3,531
2. RESIDENCES, CATERING AND CONFERENCES INCOME 2015
£’000 2014 £’000
Accommodation: College Members 3,827 3,595 Conferences 462 362 Catering: College Members 1,206 1,208 Conferences 704 475
Total 6,199 5,640
3. ENDOWMENT AND INVESTMENT INCOME
3a Analysis of Income Note
2015 £’000
2014 £’000
Freehold land and buildings 10,450 10,482 Quoted securities – equities 368 788 Fixed interest securities ‐ 110 Cash 107 93 St John’s Innovation Centre Limited 1,212 1,202 Endowment income in Aquila Investments Limited 2,590 151 Lomas Developments Limited 1 1
Total 3b 14,728 12,827
3b Allocation of Income
Note 2015 £’000
2014 £’000
Income belonging to:
Permanent funds accounted for on a Total Return basis 3c 14,608 12,571 Permanent funds accounted for on a Standard Income basis 3d 11 26 Expendable funds 3d 109 230
Total Income 3a 14,728 12,827

Notes to Financial Statements
30
3. ENDOWMENT AND INVESTMENT INCOME (continued)
3c Permanent Funds Accounted for on a Total Return Basis
Note 2015 £’000
2014 £’000
Endowment Income 3b 14,608 12,571 Apportioned gains on Endowment assets 36,250 28,876
Total Return for the year 50,858 41,447 Endowment drawdown included in Income & Expenditure 3d (17,501) (16,451) Unapplied Total Return for the year included within change in market
value of Endowment assets in the Consolidated Statement of Total
Recognised Gains & Losses 24 33,357 24,996 For the Permanent Endowment Funds invested on a Total Return basis, the total actual income and gains/losses
in the year are taken to a reserve from which the planned Endowment drawdown is released to the Income and Expenditure Account. The remaining balance of the Total Return, after deducting the drawdown, is accumulated within the endowment fund as set out in Note 22.
3d Reconciliation of Endowment and investment income included in the
Income and Expenditure Account Note 2015 £’000
2014 £’000
Endowment drawdown from permanent funds accounted for on a Total Return basis
3c 17,501 16,451
Endowment income from permanent funds accounted for on a Standard Income basis
3b 11 26
Endowment and investment income from Expendable funds 3b 109 230
Total Endowment and investment income 3f 17,621 16,707
3e Investment Costs 2015 £’000
2014 £’000
Investment portfolio 865 815
Investment management costs associated with the management of the College’s investment portfolio are
capitalised. These have not, therefore, been included in the Income and Expenditure Account.
Other Investment costs were as follows: Note
2015 £’000
2014 £’000
Investment property portfolio costs 3,478 3,096 Trading costs of St John’s Innovation Centre Limited 993 1,096 Trading costs of Aquila Investments Limited 113 140 Trading costs of Lomas Development Limited 10 13 Investment consultant, custodian and cash management fees 162 295 Other securities portfolio operating costs 102 88
Total 3f 4,858 4,728
3f Net Endowment and investment income Note 2015 £’000
2014 £’000
Income 3d 17,621 16,707 Costs 3e (4,858) (4,728)
Net Income 12,763 11,979
(being Endowment and investment income as defined by RCCA)

Notes to Financial Statements
31
4. REVENUE DONATIONS
Note 2015 £’000
2014 £’000
Unrestricted donations 251 148 Restricted donations 554 388 Released from deferred capital grants 21 202 163
Total revenue donations 1,007 699
Additional Information: Reconciliation of Donations and Benefactions Received The College received the following gifts in the year ended 30 June 2015 (including donations of shares)
At beginning of year £’000
Received £’000
Recognised in Income &
Expenditure Account
£’000
At end of year 2015£’000
Revenue donations of cash and shares 582 652 805 429 Deferred capital grants 8,907 487 202 9,192 Capital benefactions and donations 2,658
Total funds raised during the year, excluding heritage assets
3,797
Donations of heritage assets ‐
Total Revenue donations 1,007
5. OTHER INCOME
2015 £’000
2014 £’000
Miscellaneous income 146 83
6. EDUCATION EXPENDITURE 2015
£’000 2014 £’000
Teaching 4,128 3,730 Tutorial 1,735 1,714 Admissions 664 596 Research 1,537 1,314 Scholarships and awards 2,435 2,319 Other educational facilities 364 334
Total 10,863 10,007
7. RESIDENCES, CATERING AND CONFERENCES EXPENDITURE 2015
£’000 2014 £’000
Accommodation: College Members 9,393 9,038 Conferences 336 242 Catering: College Members 2,890 2,710 Conferences 319 325
Total 12,938 12,315

Notes to Financial Statements
32
8. OTHER EXPENDITURE 2015
£’000 2014£’000
Fundraising and alumni relations 839 821 Chapel & Choir (other than Tutorial related) 1,011 895 Miscellaneous expenditure (including charitable gifts) 179 200
Total 2,029 1,916
9. ANALYSIS OF EXPENDITURE BY ACTIVITY 9a 2015 Expenditure Staff
Costs (note 10)
£’000
Other Operating Expenses
£’000
Depreciation (note 11)
£’000
Interest and other
finance costs £’000
2015 Total
£’000
Education 6 5,002 4,522 1,095 244 10,863
Residences, catering and conferences 7 5,344 2,782 3,936 876 12,938
Investment costs 3e 818 4,038 ‐ 2 4,858
School 3,980 1,603 319 223 6,125
Other 8 904 1,125 ‐ ‐ 2,029
Total expenditure 16,048 14,070 5,350 1,345 36,813
9b 2014 Expenditure
Staff Costs
(note 10)
£’000
Other Operating Expenses
£’000
Depreciation (note 11)
£’000
Interest and other
finance costs £’000
2014 Total
£’000
Education 6 4,575 4,167 1,019 246 10,007
Residences, catering and conferences 7 4,984 2,783 3,662 886 12,315
Investment costs 3e 790 3,912 24 2 4,728
School 3,738 1,565 222 223 5,748
Other 8 798 1,118 ‐ ‐ 1,916
Total expenditure 14,885 13,545 4,927 1,357 34,714
9c Auditors’ remuneration 2015
£’000 2014 £’000
Other operating expenses include:
Audit fees payable to the College’s external auditor 75 74 Taxation compliance fees payable to the College’s external auditor 14 15 Other taxation advisory fees payable to the College’s external auditor 10 13
Total fees payable to the College’s external auditor 99 102 Audit fees payable to other firms 12 6
Total auditors’ remuneration 111 108
9d Operating leases 2015
£’000 2014£’000
Other operating expenses include the following operating lease rentals: For equipment 56 70
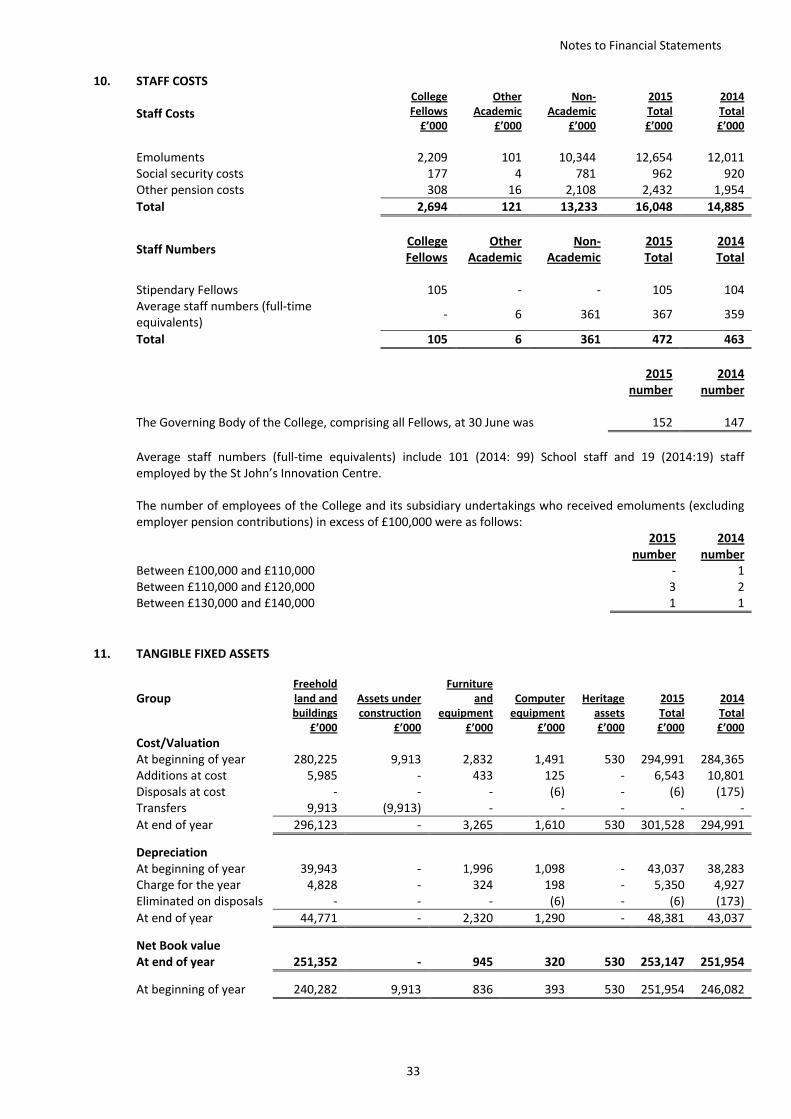
Notes to Financial Statements
33
10. STAFF COSTS
Staff Costs
College Fellows £’000
Other Academic
£’000
Non‐ Academic
£’000
2015 Total £’000
2014 Total £’000
Emoluments 2,209 101 10,344 12,654 12,011 Social security costs 177 4 781 962 920 Other pension costs 308 16 2,108 2,432 1,954
Total 2,694 121 13,233 16,048 14,885
Staff Numbers College Fellows
Other Academic
Non‐ Academic
2015Total
2014Total
Stipendary Fellows 105 ‐ ‐ 105 104 Average staff numbers (full‐time
equivalents) ‐ 6 361 367 359
Total 105 6 361 472 463
2015
number 2014
number The Governing Body of the College, comprising all Fellows, at 30 June was 152 147
Average staff numbers (full‐time equivalents) include 101 (2014: 99) School staff and 19 (2014:19) staff
employed by the St John’s Innovation Centre. The number of employees of the College and its subsidiary undertakings who received emoluments (excluding
employer pension contributions) in excess of £100,000 were as follows: 2015
number 2014
number Between £100,000 and £110,000 ‐ 1 Between £110,000 and £120,000 3 2 Between £130,000 and £140,000 1 1
11. TANGIBLE FIXED ASSETS
Group
Freehold land and buildings
£’000
Assets under construction
£’000
Furniture and
equipment £’000
Computer equipment
£’000
Heritage assets £’000
2015 Total £’000
2014 Total £’000
Cost/Valuation At beginning of year 280,225 9,913 2,832 1,491 530 294,991 284,365 Additions at cost 5,985 ‐ 433 125 ‐ 6,543 10,801 Disposals at cost ‐ ‐ ‐ (6) ‐ (6) (175) Transfers 9,913 (9,913) ‐ ‐ ‐ ‐ ‐ At end of year 296,123 ‐ 3,265 1,610 530 301,528 294,991
Depreciation At beginning of year 39,943 ‐ 1,996 1,098 ‐ 43,037 38,283 Charge for the year 4,828 ‐ 324 198 ‐ 5,350 4,927 Eliminated on disposals ‐ ‐ ‐ (6) ‐ (6) (173) At end of year 44,771 ‐ 2,320 1,290 ‐ 48,381 43,037
Net Book value At end of year 251,352 ‐ 945 320 530 253,147 251,954
At beginning of year 240,282 9,913 836 393 530 251,954 246,082

Notes to Financial Statements
34
11. TANGIBLE FIXED ASSETS (continued)
College
Freehold land and buildings
£’000
Assets under construction
£’000
Furniture and
equipment £’000
Computer equipment
£’000
Heritage assets £’000
2015 Total £’000
2014 Total £’000
Cost/Valuation At beginning of year 280,626 9,913 2,829 1,495 530 295,393 284,694 Additions at cost 5,985 ‐ 400 125 ‐ 6,510 10,801 Disposals at cost ‐ ‐ ‐ (6) ‐ (6) (102) Transfers 9,913 (9,913) ‐ ‐ ‐ ‐ ‐ At end of year 296,524 ‐ 3,229 1,614 530 301,897 295,393
Depreciation At beginning of year 39,985 ‐ 2,001 1,095 ‐ 43,081 38,269 Charge for the year 4,837 ‐ 324 196 ‐ 5,357 4,912 Eliminated on disposals ‐ ‐ ‐ (6) ‐ (6) (100) At end of year 44,822 ‐ 2,325 1,285 ‐ 48,432 43,081
Net Book value At end of year 251,702 ‐ 904 329 530 253,465 252,312
At beginning of year 240,641 9,913 828 400 530 252,312 246,425
Freehold land and buildings comprise the operational buildings and site of the College and heritage assets are books gifted to the College. The insured value of freehold buildings as at 30 June 2015 was £261,715k (2014: £255,989k). The cost to the group of freehold buildings consists of the costs incurred by the College less the surplus recorded in the accounts of Aquila Investments Limited, a subsidiary undertaking, and eliminated on consolidation. Furniture and equipment for College and Group includes the following in respect of assets purchased under finance leases:
Cost/ Valuation
Depreciation Net Book Value
£’000 £’000 £’000 At beginning of year 37 (6) 31 Additions at cost ‐ (8) (8)
At end of year 37 (14) 23
Heritage Assets The College holds and conserves certain collections, artefacts and other assets of historical, artistic or scientific importance. As stated in the statement of principal accounting policies, heritage assets acquired since 1 July 2007 have been capitalised. However, the majority of assets held in the College’s collections were acquired prior to this date. As reliable estimates of cost or valuation are not available for these on a cost‐benefit basis, they have not been capitalised. As a result, the total included in the balance sheet is partial. Amounts for the current and previous four years were as follows:
2015£’000
2014£’000
2013 £’000
2012£’000
2011£’000
Value of acquisitions by donation ‐ ‐ 60 89 53
Total Acquisitions Capitalised ‐ ‐ 60 89 53
All the above recognised Heritage Assets were donated to the College rather than purchased by the College.
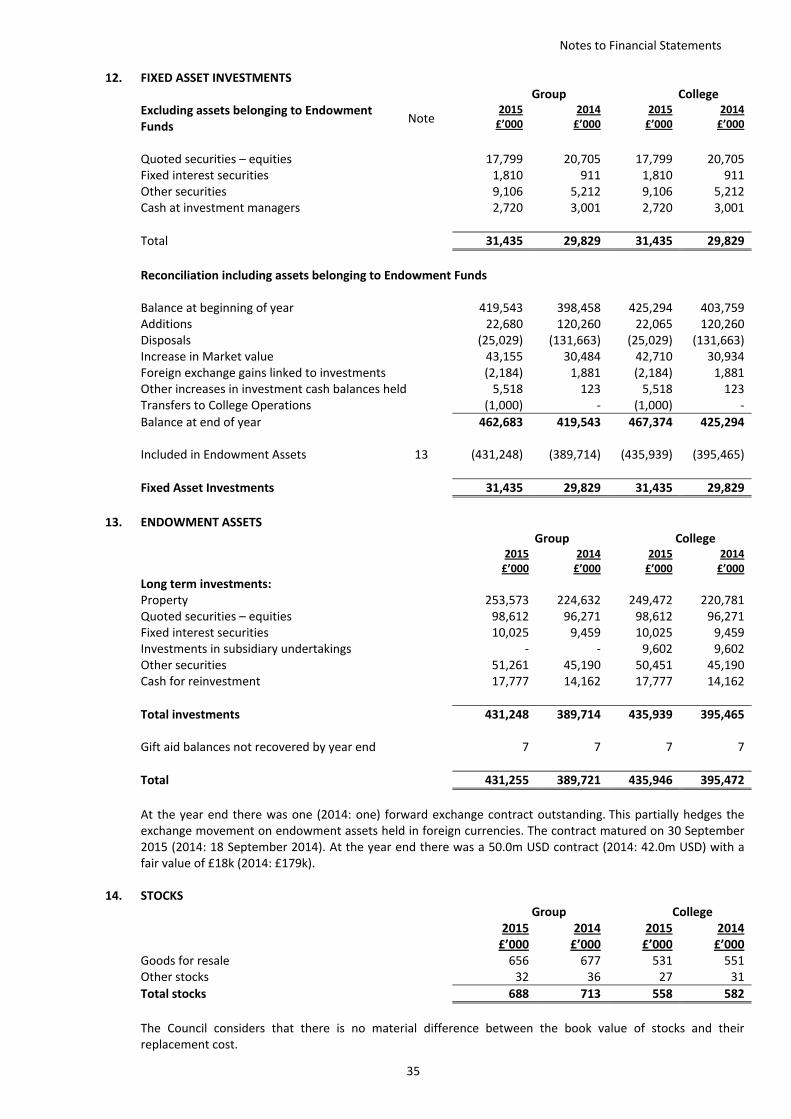
Notes to Financial Statements
35
12. FIXED ASSET INVESTMENTS
Group College
Excluding assets belonging to Endowment Funds
Note 2015 £’000
2014 £’000
2015 £’000
2014 £’000
Quoted securities – equities 17,799 20,705 17,799 20,705 Fixed interest securities 1,810 911 1,810 911 Other securities 9,106 5,212 9,106 5,212 Cash at investment managers 2,720 3,001 2,720 3,001
Total 31,435 29,829 31,435 29,829
Reconciliation including assets belonging to Endowment Funds Balance at beginning of year 419,543 398,458 425,294 403,759 Additions 22,680 120,260 22,065 120,260 Disposals (25,029) (131,663) (25,029) (131,663) Increase in Market value 43,155 30,484 42,710 30,934 Foreign exchange gains linked to investments (2,184) 1,881 (2,184) 1,881 Other increases in investment cash balances held 5,518 123 5,518 123 Transfers to College Operations (1,000) ‐ (1,000) ‐
Balance at end of year 462,683 419,543 467,374 425,294 Included in Endowment Assets 13 (431,248) (389,714) (435,939) (395,465)
Fixed Asset Investments 31,435 29,829 31,435 29,829
13. ENDOWMENT ASSETS Group College
2015 £’000
2014 £’000
2015 £’000
2014 £’000
Long term investments: Property 253,573 224,632 249,472 220,781 Quoted securities – equities 98,612 96,271 98,612 96,271 Fixed interest securities 10,025 9,459 10,025 9,459 Investments in subsidiary undertakings ‐ ‐ 9,602 9,602 Other securities 51,261 45,190 50,451 45,190 Cash for reinvestment 17,777 14,162 17,777 14,162
Total investments 431,248 389,714 435,939 395,465 Gift aid balances not recovered by year end 7 7 7 7
Total 431,255 389,721 435,946 395,472
At the year end there was one (2014: one) forward exchange contract outstanding. This partially hedges the exchange movement on endowment assets held in foreign currencies. The contract matured on 30 September 2015 (2014: 18 September 2014). At the year end there was a 50.0m USD contract (2014: 42.0m USD) with a fair value of £18k (2014: £179k).
14. STOCKS Group College
2015£’000
2014 £’000
2015£’000
2014£’000
Goods for resale 656 677 531 551 Other stocks 32 36 27 31
Total stocks 688 713 558 582
The Council considers that there is no material difference between the book value of stocks and their replacement cost.

Notes to Financial Statements
36
15. DEBTORS Group College 2015
£’000 2014 £’000
2015£’000
2014£’000
Amounts due within one year:
Net sums due from members of the College 269 287 269 287 Amounts due from subsidiary undertakings ‐ ‐ 226 1,835 Other trade debtors 1,187 1,329 1,017 871 Other loans 11 12 11 12 Other taxes 29 31 15 20 Prepayments 320 359 274 340 Accrued income 803 518 772 491
2,619 2,536 2,584 3,856 Amounts due after more than one
year:
Other loans 133 143 133 143
Total Debtors 2,752 2,679 2,717 3,999
16. CURRENT ASSET INVESTMENTS Group and College
2015£’000
2014£’000
Short term bank deposits 2,631 6,087
17. CREDITORS: AMOUNTS FALLING DUE WITHIN ONE YEAR Group College 2015
£’000 2014 £’000
2015 £’000
2014 £’000
Trade creditors 1,092 1,073 804 1,015 Members of the College 87 134 87 134 Amounts due to subsidiary undertakings ‐ ‐ 4,582 6,756 Contribution under Statute G,II 766 765 766 765 Bank loans due within one year 444 ‐ 444 ‐ Other creditors 1,131 742 1,131 1,036 Other taxation and social security 791 502 758 438 Accruals and deferred income 3,708 4,616 3,456 3,696
Total 8,019 7,832 12,028 13,840
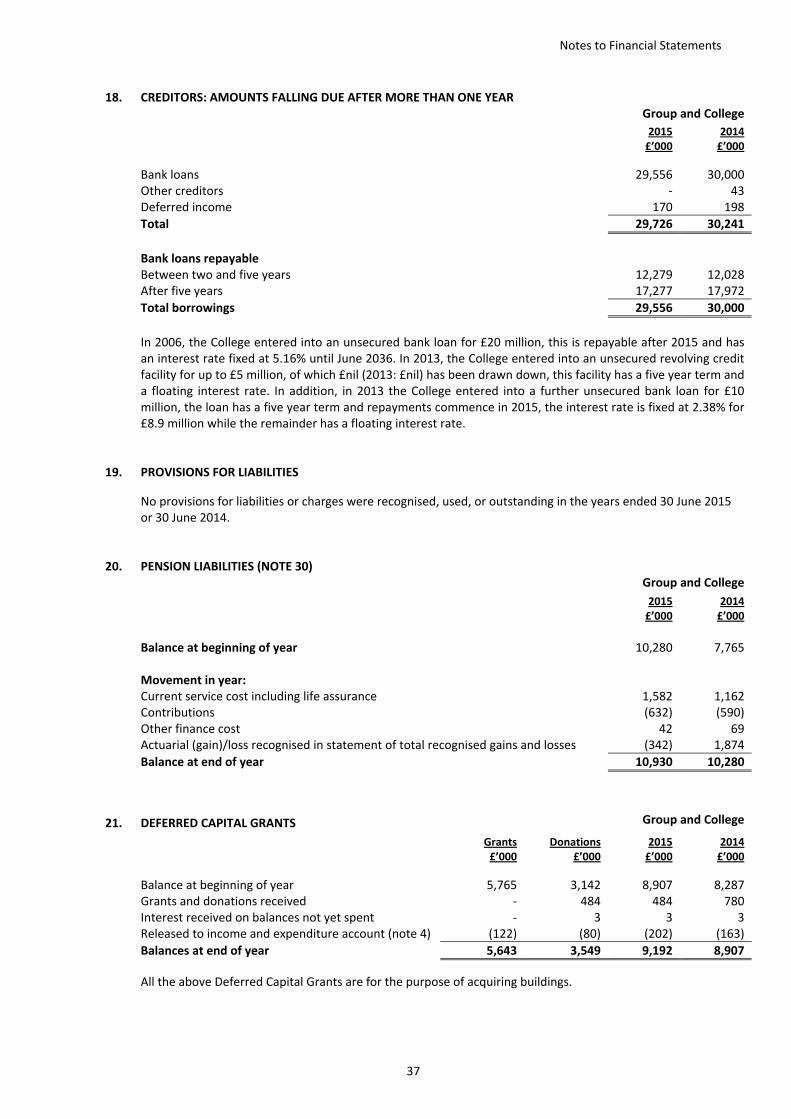
Notes to Financial Statements
37
18. CREDITORS: AMOUNTS FALLING DUE AFTER MORE THAN ONE YEAR Group and College
2015 £’000
2014 £’000
Bank loans 29,556 30,000 Other creditors ‐ 43 Deferred income 170 198
Total 29,726 30,241
Bank loans repayable Between two and five years 12,279 12,028 After five years 17,277 17,972
Total borrowings 29,556 30,000
In 2006, the College entered into an unsecured bank loan for £20 million, this is repayable after 2015 and has an interest rate fixed at 5.16% until June 2036. In 2013, the College entered into an unsecured revolving credit facility for up to £5 million, of which £nil (2013: £nil) has been drawn down, this facility has a five year term and a floating interest rate. In addition, in 2013 the College entered into a further unsecured bank loan for £10 million, the loan has a five year term and repayments commence in 2015, the interest rate is fixed at 2.38% for £8.9 million while the remainder has a floating interest rate.
19. PROVISIONS FOR LIABILITIES
No provisions for liabilities or charges were recognised, used, or outstanding in the years ended 30 June 2015 or 30 June 2014.
20. PENSION LIABILITIES (NOTE 30)
Group and College
2015
£’000 2014 £’000
Balance at beginning of year 10,280 7,765
Movement in year:
Current service cost including life assurance 1,582 1,162 Contributions (632) (590) Other finance cost 42 69 Actuarial (gain)/loss recognised in statement of total recognised gains and losses (342) 1,874
Balance at end of year 10,930 10,280
21. DEFERRED CAPITAL GRANTS Group and College
Grants £’000
Donations £’000
2015 £’000
2014 £’000
Balance at beginning of year 5,765 3,142 8,907 8,287 Grants and donations received ‐ 484 484 780 Interest received on balances not yet spent ‐ 3 3 3 Released to income and expenditure account (note 4) (122) (80) (202) (163)
Balances at end of year 5,643 3,549 9,192 8,907
All the above Deferred Capital Grants are for the purpose of acquiring buildings.
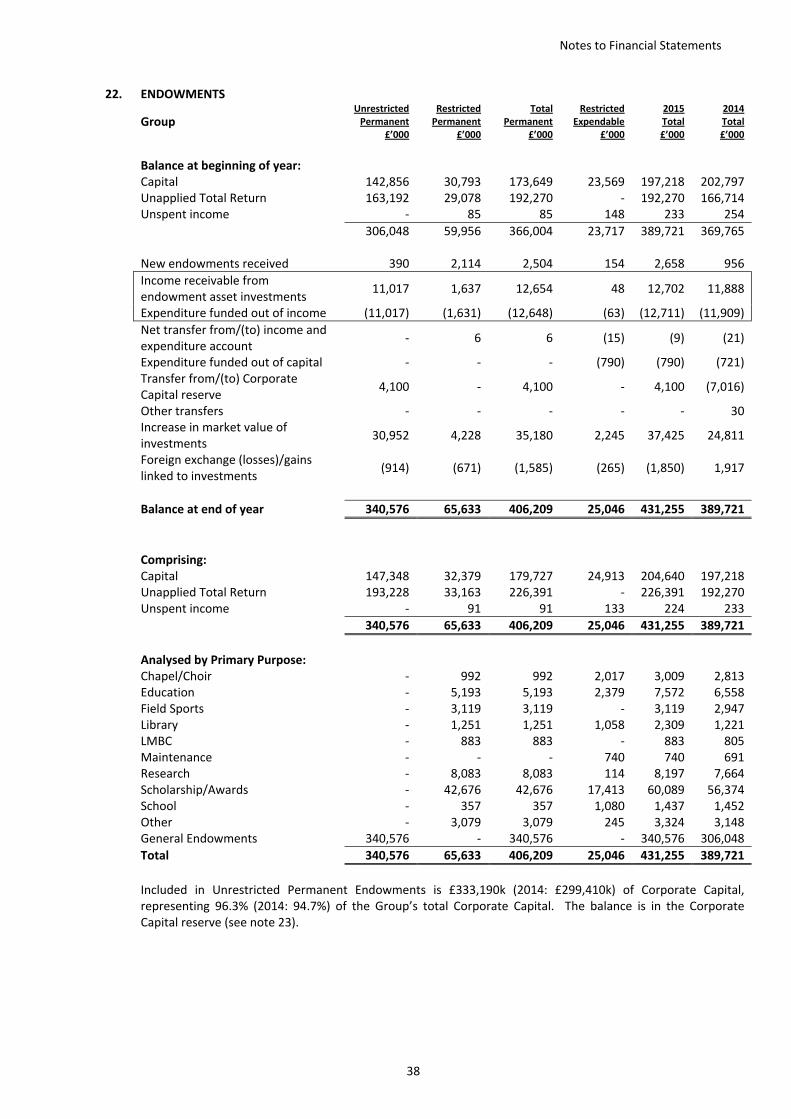
Notes to Financial Statements
38
22. ENDOWMENTS
Group UnrestrictedPermanent
£’000
RestrictedPermanent
£’000
TotalPermanent
£’000
Restricted Expendable
£’000
2015Total £’000
2014Total £’000
Balance at beginning of year: Capital 142,856 30,793 173,649 23,569 197,218 202,797 Unapplied Total Return 163,192 29,078 192,270 ‐ 192,270 166,714 Unspent income ‐ 85 85 148 233 254
306,048 59,956 366,004 23,717 389,721 369,765
New endowments received 390 2,114 2,504
154 2,658 956
Income receivable from endowment asset investments
11,017 1,637 12,654 48 12,702 11,888
Expenditure funded out of income (11,017) (1,631) (12,648) (63) (12,711) (11,909)
Net transfer from/(to) income and expenditure account
‐ 6 6 (15) (9) (21)
Expenditure funded out of capital ‐ ‐ ‐ (790) (790) (721)
Transfer from/(to) Corporate Capital reserve
4,100 ‐ 4,100 ‐ 4,100 (7,016)
Other transfers ‐ ‐ ‐ ‐ ‐ 30
Increase in market value of investments
30,952 4,228 35,180 2,245 37,425 24,811
Foreign exchange (losses)/gains linked to investments
(914) (671) (1,585) (265) (1,850) 1,917
Balance at end of year 340,576 65,633 406,209 25,046 431,255 389,721
Comprising: Capital 147,348 32,379 179,727 24,913 204,640 197,218 Unapplied Total Return 193,228 33,163 226,391 ‐ 226,391 192,270 Unspent income ‐ 91 91 133 224 233
340,576 65,633 406,209 25,046 431,255 389,721
Analysed by Primary Purpose: Chapel/Choir ‐ 992 992 2,017 3,009 2,813 Education ‐ 5,193 5,193 2,379 7,572 6,558 Field Sports ‐ 3,119 3,119 ‐ 3,119 2,947 Library ‐ 1,251 1,251 1,058 2,309 1,221 LMBC ‐ 883 883 ‐ 883 805 Maintenance ‐ ‐ ‐ 740 740 691 Research ‐ 8,083 8,083 114 8,197 7,664 Scholarship/Awards ‐ 42,676 42,676 17,413 60,089 56,374 School ‐ 357 357 1,080 1,437 1,452 Other ‐ 3,079 3,079 245 3,324 3,148 General Endowments 340,576 ‐ 340,576 ‐ 340,576 306,048
Total 340,576 65,633 406,209 25,046 431,255 389,721
Included in Unrestricted Permanent Endowments is £333,190k (2014: £299,410k) of Corporate Capital, representing 96.3% (2014: 94.7%) of the Group’s total Corporate Capital. The balance is in the Corporate Capital reserve (see note 23).

Notes to Financial Statements
39
22. ENDOWMENTS (continued)
College UnrestrictedPermanent
£’000
RestrictedPermanent
£’000
TotalPermanent
£’000
Restricted Expendable
£’000
2015Total £’000
2014Total £’000
Balance at beginning of year:
Capital 148,157 30,793 178,950 23,569 202,519 208,099 Unapplied Total Return 163,642 29,078 192,720 ‐ 192,720 166,713 Unspent income ‐ 85 85 148 233 254
311,799 59,956 371,755 23,717 395,472 375,066
New endowments received 390 2,114 2,504
154 2,658 956
Income receivable from endowment asset investments
11,017 1,637 12,654 48 12,702 11,888
Expenditure funded out of income (11,017) (1,631) (12,648) (63) (12,711) (11,909)
Net transfer from/(to) income and expenditure account
‐ 6 6 (15) (9) (21)
Expenditure funded out of capital ‐ ‐ ‐ (790) (790) (721)
Transfer from/(to) Corporate Capital reserve
3,485 ‐ 3,485 ‐ 3,485 (7,016)
Other transfers ‐ ‐ ‐ ‐ ‐ 30
Increase in market value of investments
30,507 4,228 34,735 2,245 36,980 25,261
Foreign exchange (losses)/gains linked to investments
(914) (671) (1,585) (265) (1,850) 1,917
Balance at end of year 345,267 65,633 410,900 25,046 435,946 395,472
Comprising: Capital 152,034 32,379 184,413 24,913 209,326 202,519 Unapplied Total Return 193,233 33,163 226,396 ‐ 226,396 192,720 Unspent income ‐ 91 91 133 224 233
345,267 65,633 410,900 25,046 435,946 395,472
Analysed by Primary Purpose: Chapel/Choir ‐ 992 992 2,017 3,009 2,813 Education ‐ 5,193 5,193 2,379 7,572 6,558 Field Sports ‐ 3,119 3,119 ‐ 3,119 2,947 Library ‐ 1,251 1,251 1,058 2,309 1,221 LMBC ‐ 883 883 ‐ 883 805 Maintenance ‐ ‐ ‐ 740 740 691 Research ‐ 8,083 8,083 114 8,197 7,664 Scholarship/Awards ‐ 42,676 42,676 17,413 60,089 56,374 School ‐ 357 357 1,080 1,437 1,452 Other ‐ 3,079 3,079 245 3,324 3,148 General Endowments 345,267 ‐ 345,267 ‐ 345,267 311,799
Total 345,267 65,633 410,900 25,046 435,946 395,472
Included in Unrestricted Permanent Endowments is £337,881k (2014: £294,558k) of Corporate Capital, representing 97.7% (2014: 94.6%) of the College’s total Corporate Capital. The balance is in the Corporate Capital reserve (see note 23).
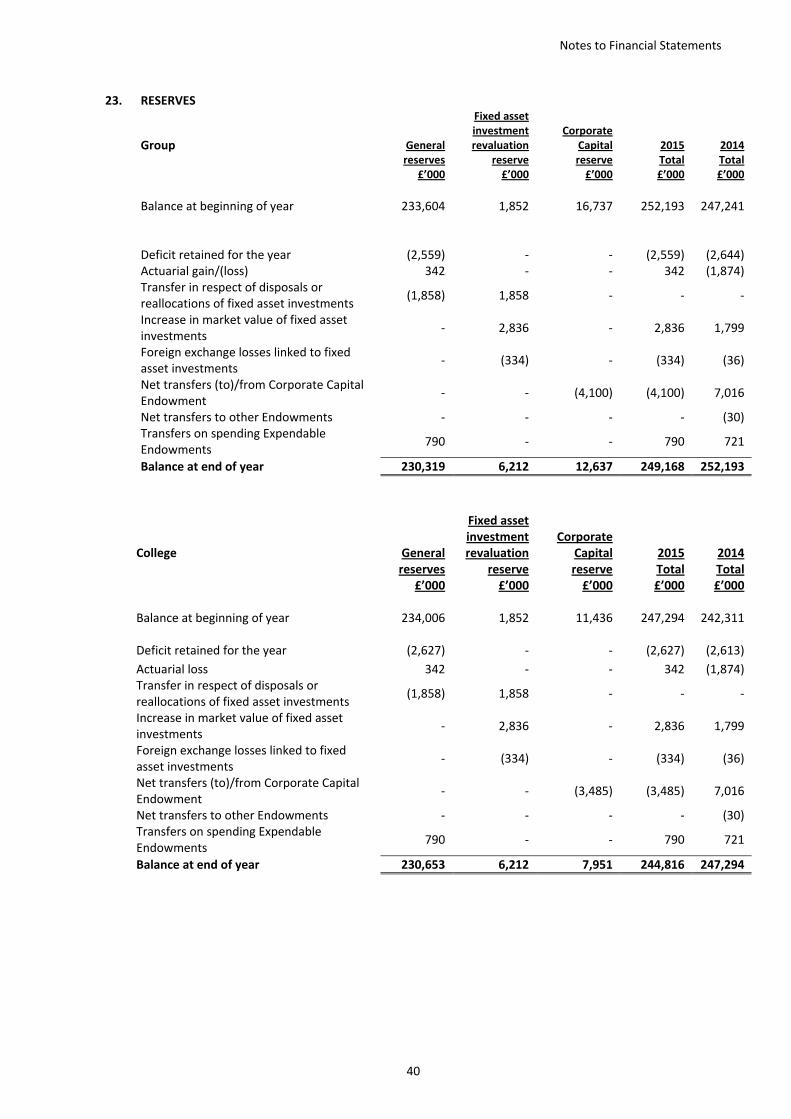
Notes to Financial Statements
40
23. RESERVES
Group General reserves
£’000
Fixed asset investment revaluation
reserve £’000
Corporate Capital reserve £’000
2015 Total £’000
2014 Total £’000
Balance at beginning of year 233,604 1,852 16,737 252,193 247,241 Deficit retained for the year (2,559) ‐ ‐ (2,559) (2,644) Actuarial gain/(loss) 342 ‐ ‐ 342 (1,874) Transfer in respect of disposals or
reallocations of fixed asset investments (1,858) 1,858 ‐ ‐ ‐
Increase in market value of fixed asset investments
‐ 2,836 ‐ 2,836 1,799
Foreign exchange losses linked to fixed asset investments
‐ (334) ‐ (334) (36)
Net transfers (to)/from Corporate Capital Endowment
‐ ‐ (4,100) (4,100) 7,016
Net transfers to other Endowments ‐ ‐ ‐ ‐ (30) Transfers on spending Expendable
Endowments 790 ‐ ‐ 790 721
Balance at end of year 230,319 6,212 12,637 249,168 252,193
College General reserves
£’000
Fixed asset investment revaluation
reserve£’000
Corporate Capital reserve £’000
2015Total£’000
2014Total£’000
Balance at beginning of year 234,006 1,852 11,436 247,294 242,311 Deficit retained for the year (2,627) ‐ ‐ (2,627) (2,613)
Actuarial loss 342 ‐ ‐ 342 (1,874) Transfer in respect of disposals or
reallocations of fixed asset investments (1,858) 1,858 ‐ ‐ ‐
Increase in market value of fixed asset investments
‐ 2,836 ‐ 2,836 1,799
Foreign exchange losses linked to fixed asset investments
‐ (334) ‐ (334) (36)
Net transfers (to)/from Corporate Capital Endowment
‐ ‐ (3,485) (3,485) 7,016
Net transfers to other Endowments ‐ ‐ ‐ ‐ (30) Transfers on spending Expendable
Endowments 790 ‐ ‐ 790 721
Balance at end of year 230,653 6,212 7,951 244,816 247,294

Notes to Financial Statements
41
24. MEMORANDUM OF UNAPPLIED TOTAL RETURN
Included within endowments, the following amounts represent the Unapplied Total Return of the College’s Permanent funds managed on a total return basis:
Group Note 2015 £’000
2014 £’000
Unapplied Total Return at beginning of year 22 192,270 166,714
Opening Unapplied Total Return of funds adopting total return for the first time in the year
764 560
Unapplied Total Return for the year 3c 33,357 24,996
Unapplied Total Return at end of year 22 226,391 192,270
College Note
2015 £’000
2014 £’000
Unapplied Total Return at beginning of year 22 192,720 166,714
Opening Unapplied Total Return of funds adopting total return for the first time in the year
764 560
Unapplied Total Return for the year 32,912 25,446
Unapplied Total Return at end of year 22 226,396 192,720
25. RECONCILIATION OF CONSOLIDATED OPERATING DEFICIT TO NET CASH OUTFLOW FROM OPERATING ACTIVITIES
2015 £’000
2014 £’000
Deficit on continuing operations before Contribution under Statute G,II (1,802) (1,900)
Depreciation of tangible fixed assets 5,350 4,927
Deferred capital grants released to income (202) (163)
Endowment and investment income less costs (12,763) (11,979)
Interest payable 1,345 1,357
Pension costs less contributions payable 992 641
Decrease/(increase) in operational stocks 23 (8)
Decrease in operational debtors 63 36
(Decrease)/increase in operational creditors (264) 191
Net cash outflow from operating activities (7,258) (6,898)
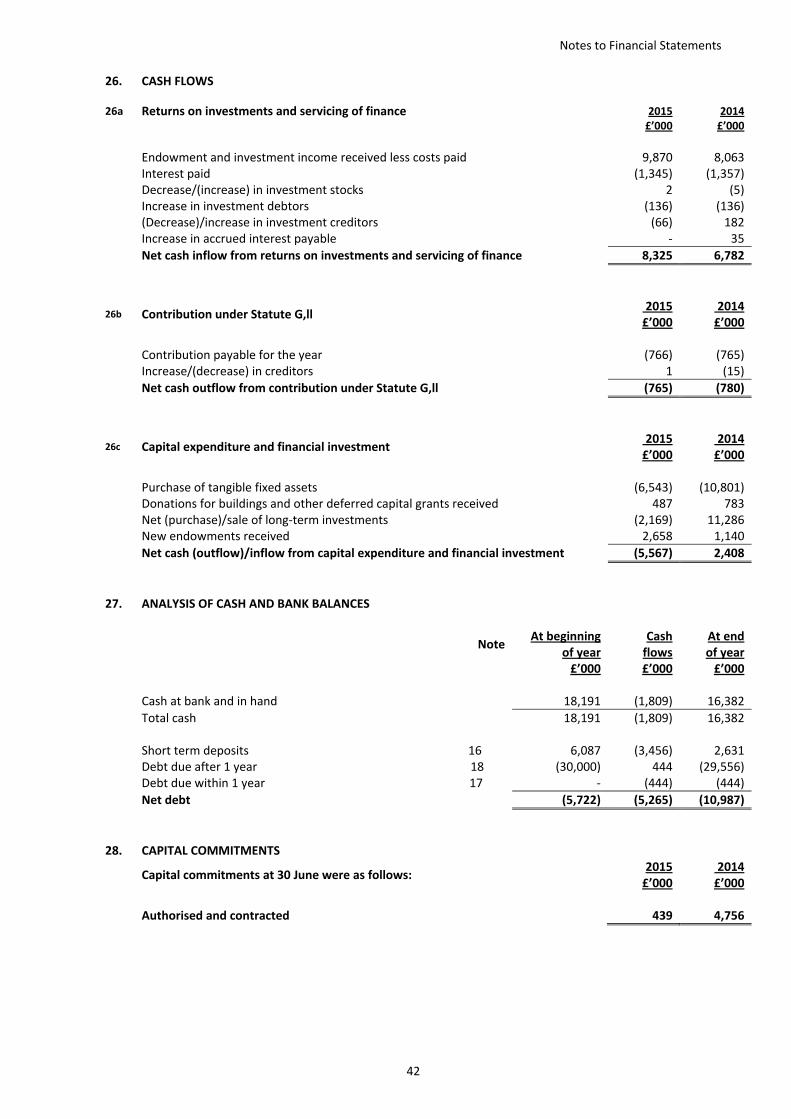
Notes to Financial Statements
42
26. CASH FLOWS
26a Returns on investments and servicing of finance 2015 £’000
2014 £’000
Endowment and investment income received less costs paid 9,870 8,063 Interest paid (1,345) (1,357) Decrease/(increase) in investment stocks 2 (5) Increase in investment debtors (136) (136) (Decrease)/increase in investment creditors (66) 182 Increase in accrued interest payable ‐ 35
Net cash inflow from returns on investments and servicing of finance 8,325 6,782
26b Contribution under Statute G,ll 2015£’000
2014£’000
Contribution payable for the year (766) (765) Increase/(decrease) in creditors 1 (15) Net cash outflow from contribution under Statute G,ll (765) (780)
26c Capital expenditure and financial investment 2015£’000
2014£’000
Purchase of tangible fixed assets (6,543) (10,801) Donations for buildings and other deferred capital grants received 487 783 Net (purchase)/sale of long‐term investments (2,169) 11,286 New endowments received 2,658 1,140
Net cash (outflow)/inflow from capital expenditure and financial investment (5,567) 2,408
27. ANALYSIS OF CASH AND BANK BALANCES
Note
At beginning
of year £’000
Cash flows£’000
At endof year£’000
Cash at bank and in hand 18,191 (1,809) 16,382
Total cash 18,191 (1,809) 16,382 Short term deposits 16 6,087 (3,456) 2,631 Debt due after 1 year 18 (30,000) 444 (29,556) Debt due within 1 year 17 ‐ (444) (444)
Net debt (5,722) (5,265) (10,987)
28. CAPITAL COMMITMENTS
Capital commitments at 30 June were as follows: 2015£’000
2014£’000
Authorised and contracted 439 4,756
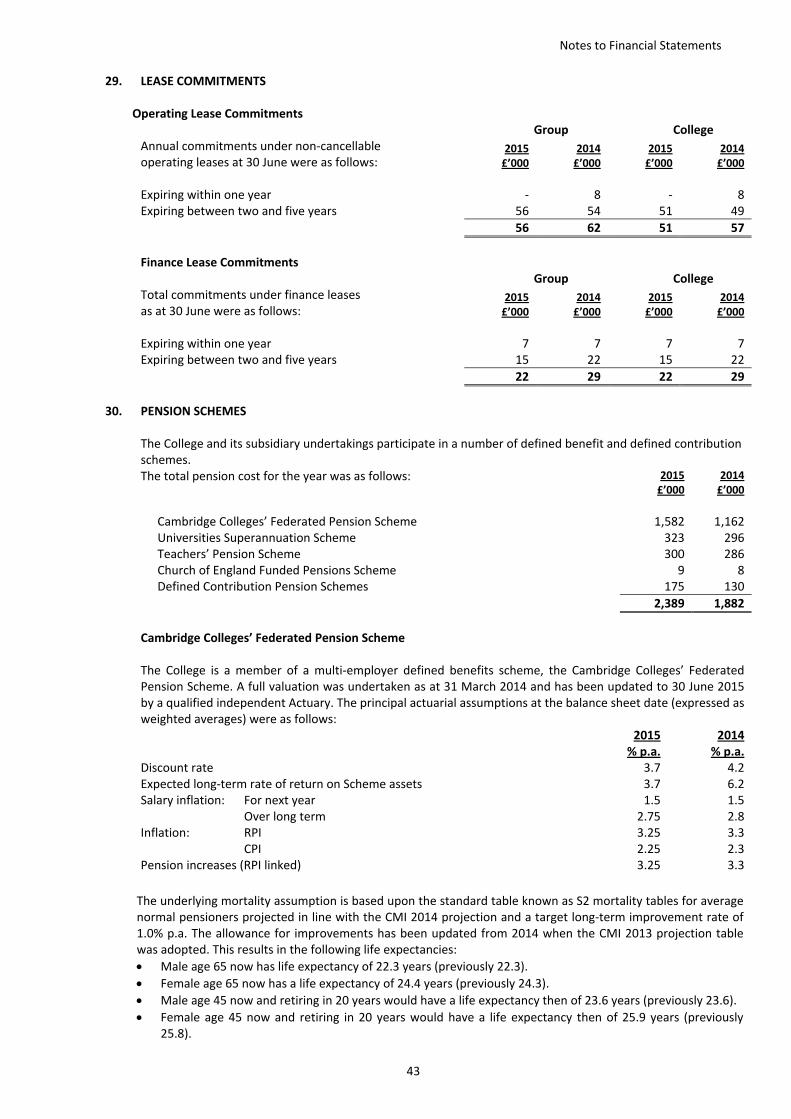
Notes to Financial Statements
43
29. LEASE COMMITMENTS Operating Lease Commitments Group College
Annual commitments under non‐cancellable operating leases at 30 June were as follows:
2015 £’000
2014 £’000
2015 £’000
2014 £’000
Expiring within one year ‐ 8 ‐ 8 Expiring between two and five years 56 54 51 49
56 62 51 57
Finance Lease Commitments Group College
Total commitments under finance leases as at 30 June were as follows:
2015 £’000
2014 £’000
2015 £’000
2014 £’000
Expiring within one year 7 7 7 7 Expiring between two and five years 15 22 15 22
22 29 22 29
30. PENSION SCHEMES
The College and its subsidiary undertakings participate in a number of defined benefit and defined contribution schemes.
The total pension cost for the year was as follows: 2015 £’000
2014 £’000
Cambridge Colleges’ Federated Pension Scheme 1,582 1,162 Universities Superannuation Scheme 323 296 Teachers’ Pension Scheme 300 286 Church of England Funded Pensions Scheme 9 8 Defined Contribution Pension Schemes 175 130
2,389 1,882
Cambridge Colleges’ Federated Pension Scheme The College is a member of a multi‐employer defined benefits scheme, the Cambridge Colleges’ Federated Pension Scheme. A full valuation was undertaken as at 31 March 2014 and has been updated to 30 June 2015 by a qualified independent Actuary. The principal actuarial assumptions at the balance sheet date (expressed as weighted averages) were as follows:
2015% p.a.
2014% p.a.
Discount rate 3.7 4.2 Expected long‐term rate of return on Scheme assets 3.7 6.2 Salary inflation: For next year 1.5 1.5 Over long term 2.75 2.8 Inflation: RPI 3.25 3.3 CPI 2.25 2.3 Pension increases (RPI linked) 3.25 3.3
The underlying mortality assumption is based upon the standard table known as S2 mortality tables for average
normal pensioners projected in line with the CMI 2014 projection and a target long‐term improvement rate of 1.0% p.a. The allowance for improvements has been updated from 2014 when the CMI 2013 projection table was adopted. This results in the following life expectancies:
Male age 65 now has life expectancy of 22.3 years (previously 22.3).
Female age 65 now has a life expectancy of 24.4 years (previously 24.3).
Male age 45 now and retiring in 20 years would have a life expectancy then of 23.6 years (previously 23.6).
Female age 45 now and retiring in 20 years would have a life expectancy then of 25.9 years (previously 25.8).

Notes to Financial Statements
44
30. PENSION SCHEMES (continued)
Employee Benefit Obligations
The amounts recognised in the Balance Sheet as at 30 June 2015 (with comparative figures as at 30 June 2014) are as follows: 2015
£’0002014 £’000
Present value of Scheme liabilities (32,805) (29,473) Market value of Scheme assets 21,875 19,193
Deficit in the Scheme (10,930) (10,280)
The amounts to be recognised in Income and Expenditure for the year ended 30 June 2015 (with comparative figures for the year ended 30 June 2014) are as follows: 2015
£’0002014 £’000
Current service cost 1,582 1,162 Interest on Scheme liabilities 1,260 1,202 Expected return on Scheme assets (1,217) (1,132)
Total 1,625 1,232
Actual return on Scheme assets 2,648 1,122
Changes in the present value of the Scheme liabilities for the year ended 30 June 2015 (with comparative figures for the year ended 30 June 2014) are as follows: 2015
£’0002014 £’000
Present value of Scheme liabilities at beginning of period 29,473 25,811 Service cost including Employee contributions 1,859 1,434 Interest cost 1,260 1,201 Actuarial losses 1,088 1,864 Benefits paid (875) (837)
Present value of Scheme liabilities at end of period 32,805 29,473
Changes in the fair value of the Scheme assets for the year ended 30 June 2015 (with comparative figures for the year ended 30 June 2014) are as follows: 2015
£’0002014 £’000
Market value of Scheme assets at beginning of period 19,193 18,046 Expected return 1,217 1,132 Actuarial gains/(losses) 1,431 (9) Contributions paid by the College 632 590 Employee contributions 277 271 Benefits paid (875) (837)
Market value of Scheme assets at end of period 21,875 19,193
The expected contributions to be paid by the College for the forthcoming year are:
From 1 July 2015 to 31 March 2016 18.12% of Contribution Pay for non salary sacrifice members (24.12% of Contribution Pay for salary sacrifice members);
From 1 April 2016 to 30 June 2016 15.91% of Contribution Pay for non salary sacrifice members (21.91% of Contribution Pay for salary sacrifice members),
Plus Recovery Plan payments of £401,899 and £44,256 to cover expenses. The above rates exclude PHI and are subject to review at future actuarial valuations.

Notes to Financial Statements
45
30. PENSION SCHEMES (continued)
The major categories of Scheme assets as a percentage of total Scheme assets for the year ended 30 June 2015 (with comparative figures for the year ended 30 June 2014) are as follows: 2015 2014 Equities & Hedge Funds 69% 70% Bonds & Cash 25% 23% Property 6% 7%
Total 100% 100%
The expected long term rate of return on the Scheme assets has been set in line with the discount rate, i.e. 3.7%. The analysis of the amount recognisable in the Consolidated Statement of Total Recognised Gains and Losses (STRGL) for the year ended 30 June 2015 (with comparative figures for the year ended 30 June 2014) is as follows: 2015
£’0002014 £’000
Actual return less expected return on Scheme assets 1,430 (9) Experience gains and losses arising on Scheme liabilities 421 230 Changes in assumptions underlying the present value of Scheme liabilities (1,509) (2,095)
Actuarial gain/(loss) recognised in STRGL 342 (1,874)
The cumulative amount of actuarial gains and losses recognised in the STRGL for the year ended 30 June 2015 (with comparative figures for the year ended 30 June 2014) is as follows: 2015
£’0002014 £’000
Cumulative actuarial loss at beginning of period (8,159) (6,285) Recognised during the period 342 (1,874)
Cumulative actuarial loss at end of period (7,817) (8,159)
Movements in the deficit during the year ended 30 June 2015 (with comparative figures for the year ended 30 June 2014) are as follows: 2015
£’0002014 £’000
Deficit in Scheme at beginning of year (10,280) (7,765) Service Cost (Employer Only) (1,582) (1,162) Contributions paid by the College 632 590 Finance Cost (42) (69) Actuarial losses 342 (1,874)
Deficit in Scheme at the end of the year (10,930) (10,280)
Amounts for the current and previous four accounting periods are as follows: 2015
£’000 2014£’000
2013 £’000
2012 £’000
2011£’000
Present value of Scheme liabilities
(32,805) (29,473) (25,811) (20,999) (18,945)
Market value of Scheme assets 21,875 19,193 18,046 15,839 16,790
Deficit in the Scheme (10,930) (10,280) (7,765) (5,160) (2,155)
Actual return less expected return on Scheme assets
1,431 (9) 1,018 (2,932) 1,113
Experience gain/(loss) arising on Scheme liabilities
421 230 12 (105) 80
Change in assumptions underlying present value of Scheme liabilities
(1,509) (2,095) (3,261) (278) 2,443
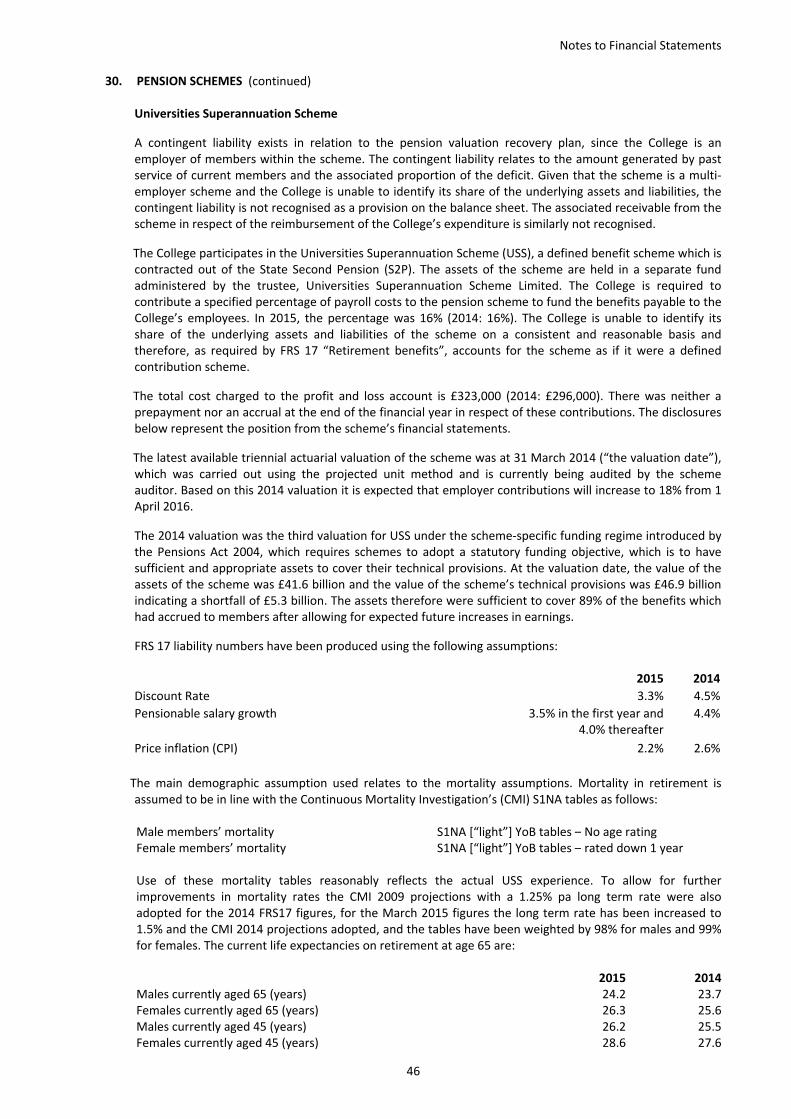
Notes to Financial Statements
46
30. PENSION SCHEMES (continued)
Universities Superannuation Scheme
A contingent liability exists in relation to the pension valuation recovery plan, since the College is an employer of members within the scheme. The contingent liability relates to the amount generated by past service of current members and the associated proportion of the deficit. Given that the scheme is a multi‐employer scheme and the College is unable to identify its share of the underlying assets and liabilities, the contingent liability is not recognised as a provision on the balance sheet. The associated receivable from the scheme in respect of the reimbursement of the College’s expenditure is similarly not recognised.
The College participates in the Universities Superannuation Scheme (USS), a defined benefit scheme which is contracted out of the State Second Pension (S2P). The assets of the scheme are held in a separate fund administered by the trustee, Universities Superannuation Scheme Limited. The College is required to contribute a specified percentage of payroll costs to the pension scheme to fund the benefits payable to the College’s employees. In 2015, the percentage was 16% (2014: 16%). The College is unable to identify its share of the underlying assets and liabilities of the scheme on a consistent and reasonable basis and therefore, as required by FRS 17 “Retirement benefits”, accounts for the scheme as if it were a defined contribution scheme.
The total cost charged to the profit and loss account is £323,000 (2014: £296,000). There was neither a prepayment nor an accrual at the end of the financial year in respect of these contributions. The disclosures below represent the position from the scheme’s financial statements.
The latest available triennial actuarial valuation of the scheme was at 31 March 2014 (“the valuation date”), which was carried out using the projected unit method and is currently being audited by the scheme auditor. Based on this 2014 valuation it is expected that employer contributions will increase to 18% from 1 April 2016.
The 2014 valuation was the third valuation for USS under the scheme‐specific funding regime introduced by the Pensions Act 2004, which requires schemes to adopt a statutory funding objective, which is to have sufficient and appropriate assets to cover their technical provisions. At the valuation date, the value of the assets of the scheme was £41.6 billion and the value of the scheme’s technical provisions was £46.9 billion indicating a shortfall of £5.3 billion. The assets therefore were sufficient to cover 89% of the benefits which had accrued to members after allowing for expected future increases in earnings.
FRS 17 liability numbers have been produced using the following assumptions:
2015 2014
Discount Rate 3.3% 4.5%
Pensionable salary growth 3.5% in the first year and4.0% thereafter
4.4%
Price inflation (CPI) 2.2% 2.6%
The main demographic assumption used relates to the mortality assumptions. Mortality in retirement is
assumed to be in line with the Continuous Mortality Investigation’s (CMI) S1NA tables as follows:
Male members’ mortality S1NA [“light”] YoB tables – No age ratingFemale members’ mortality S1NA [“light”] YoB tables – rated down 1 year Use of these mortality tables reasonably reflects the actual USS experience. To allow for further improvements in mortality rates the CMI 2009 projections with a 1.25% pa long term rate were also adopted for the 2014 FRS17 figures, for the March 2015 figures the long term rate has been increased to 1.5% and the CMI 2014 projections adopted, and the tables have been weighted by 98% for males and 99% for females. The current life expectancies on retirement at age 65 are:
2015 2014Males currently aged 65 (years) 24.2 23.7Females currently aged 65 (years) 26.3 25.6Males currently aged 45 (years) 26.2 25.5Females currently aged 45 (years) 28.6 27.6

Notes to Financial Statements
47
30. PENSION SCHEMES (continued)
Existing benefits 2015 2014Scheme assets £49.0bn £41.6bnFRS 17 liabilities £67.6bn £55.5bnFRS 17 deficit £18.6bn £13.9bnFRS 17 funding level 72% 75%
Teachers’ Pension Scheme
The College participates in the Teachers’ Pension Scheme. This is a statutory, contributory, final salary scheme and it is not possible to identify the College’s share of the underlying assets and liabilities of the scheme. The College contributes 14.1% of teachers’ gross salary for those in the scheme while since January 2007 members have contributed 6.4%. From April 2012, this changed to a tiered pensions scheme, with employees paying between 6.4% and 8.8%, and from April 2013, these tiers became 6.4% to 11.2%. For schemes such as the Teachers’ Pension Scheme, paragraph 9(b) of FRS17 requires the College to account for pension costs on the basis of contributions actually payable to the scheme in the period. The total pension cost for the College was £300,000 (2014: £286,000).
Church of England Funded Pensions Scheme
The College participates in the Church of England Funded Pensions Scheme and employs 1 member of the Scheme (2014: 1) out of a total membership of approximately 8,400 active members.
The Church of England Funded Pensions Scheme is a defined benefit scheme but the College is unable to identify its share of the underlying assets and liabilities ‐ each employer in that scheme pays a common contribution rate. A valuation of the Scheme was carried out as at 31 December 2012. This revealed a shortfall of £293m, with assets of £896m and a funding target of £1,189m, assessed using the following assumptions:
An investment strategy of: • for investments backing liabilities for pensions in payment, an allocation to gilts, increasing linearly
from 10% at 31 December 2012 to 2/3 by 31 December 2029, with the balance in return‐seeking assets; and
• for investments backing liabilities prior to retirement, a 100% allocation to return‐seeking assets.
Investment returns of 3.2% pa on gilts and 5.2% pa on equities;
RPI inflation of 3.2% pa (and pension increases consistent with this);
Increase in pensionable stipends of 3.2% pa; and
Post‐retirement mortality in accordance with 80% of the S1NMA and S1NFA tables, with allowance made for improvements in mortality rates from 2003 in line with CMI 2012 core projections, with a long term annual rate of improvement of 1.5% for males and females.
For schemes such as the Church of England Funded Pensions Scheme, paragraph 9(b) of FRS 17 requires the College to account for pension costs on the basis of contributions actually payable to the Scheme in the year. Following the results of the 2012 valuation, the College’s contribution rate is due to increase from 38.2% to 39.9% of pensionable stipends from 1 January 2015 (of which 14.1% will be in respect of the £293m shortfall in the Scheme and 25.8% is in respect of accrual of future benefits and the day‐to‐day expenses of running the Scheme). Contribution rates will be reviewed at the next valuation of the Scheme, due as at 31 December 2015.
Defined Contribution Pension Schemes
The College and its subsidiaries operate a number of defined contribution schemes for which the pension cost charged for the period amounted to £175,000 (2014: £130,000).

Notes to Financial Statements
48
31. RELATED PARTY TRANSACTIONS
Owing to the nature of the College’s operations and the composition of its College Council, it is inevitable that transactions will take place with organisations in which a College Council member may have an interest. All transactions involving organisations in which a member of the College Council may have an interest are conducted at arm’s length and in accordance with the College’s normal procedures. The College maintains a register of interests for all College Council members, and where any member of the College Council has a material interest in a matter of business before the Council they are obliged under the standing orders of the College to declare that fact. During the year no fees or expenses were paid to Fellows in respect of their duties as trustees, except that one Fellow was paid £1k (2014: £1k) in their role as Secretary of the College Council. Fellows are remunerated for teaching, research and other duties within the College, Fellows are billed for any private catering. The College also offers Fellows and staff assistance with housing costs on a shared equity basis and has a housing allowance scheme to assist Fellows in the first four years after joining the Fellowship.
The School provides a discount on school fees to its staff as part of its terms of appointment; where children of Fellows and other staff attend the School, they pay fees on the normal terms. The College has a number of trading and dormant subsidiary undertakings which are consolidated into these accounts. All subsidiary undertakings are 100% owned by the College and are registered and operating in England and Wales. The College is taking advantage of the exemption within FRS 8 “Related Party Disclosures” not to disclose transactions with wholly owned group companies that are related parties.
32. SUBSIDIARY UNDERTAKINGS AND JOINT VENTURES Subsidiaries
The College’s principal trading and dormant subsidiary undertakings at 30 June 2015 and 30 June 2014 are set
out below.
Subsidiary Activity Holding % St John’s Enterprises Limited
The provision of conference facilities and tourism administration at St John’s College, Cambridge. The Company also undertakes activities in relation to healthcare for the College.
2 ordinary shares of £1 each
100%
Aquila Investments Limited
Building construction and repair, property development, energy supply and farming.
74,805,020 ordinary shares of 1p each
100%
St John’s Innovation Centre Limited
The management of St John’s Innovation Centre on behalf of the College, and the provision of advice and guidance to early‐stage knowledge‐based businesses in the Cambridge sub‐region.
113,429 ordinary shares of £1 each
100%
Lomas Developments Limited
Property development. 5,000,004 ordinary shares of 10p each
100%
St John’s College Development Limited
Dormant 820,004 ordinary shares of 50p each
100%
Aquivar Management Services Limited
Dormant 100 ordinary shares
at £1 each 100%

Notes to Financial Statements
49
32. SUBSIDIARY UNDERTAKINGS AND JOINT VENTURES (continued) Joint Ventures
The College’s joint ventures at 30 June 2015 are set out below; it had no joint ventures at 30 June 2014.
Joint venture Activity Country of Incorporation % Holding Barberry Nottingham LLP
Property development.
United Kingdom 75%
Distribution of reserves by Barberry Nottingham LLP requires the unanimous agreement of LLP members and is subject to the terms of a loan agreement taken out by the LLP. The College is a member of another joint venture, Barberry Willenhall LLP, which is registered in the United Kingdom. The joint venture has no principal business activity. The College has not provided any capital to the joint venture nor has the College committed to do so as of the date of these accounts.