RESEARCHED & PRODUCED BY: Industrial SAMPE REPORT...2015 Gale Media Inc. Page 3. 2015 COMPETITIVE...
12
www.mdm.com ©2015 by Gale Media, Inc. All rights reserved. Material may not be reproduced in whole or in part in any form whatsoever without permission from the publisher. To request permission to copy, republish, or quote material, please call 888-742-5060. RESEARCHED & PRODUCED BY: $395.95 Competitive Landscape for Wholesale Distribution: Industrial ANNUAL MARKET DATA, TRENDS AND ANALYSIS FOR THE NORTH AMERICAN WHOLESALE DISTRIBUTION INDUSTRY 2015 SAMPLE REPORT
Transcript of RESEARCHED & PRODUCED BY: Industrial SAMPE REPORT...2015 Gale Media Inc. Page 3. 2015 COMPETITIVE...
www.mdm.com
©2015 by Gale Media, Inc. All rights reserved. Material may not be reproduced in whole or in part in any form whatsoever without permission from the publisher. To request permission to copy, republish, or quotematerial, please call 888-742-5060.
RESEARCHED& PRODUCED BY:
$395.95
Competitive Landscapefor Wholesale Distribution:IndustrialANNUAL MARKET DATA, TRENDS AND ANALYSIS FOR THE NORTH AMERICANWHOLESALE DISTRIBUTION INDUSTRY
2015
SAMPLE REPORT
Page 2© 2015 Gale Media, Inc.
2015 COMPETITIVE LANDSCAPE FOR WHOLESALE DISTRIBUTION
www.mdm.com
Overview
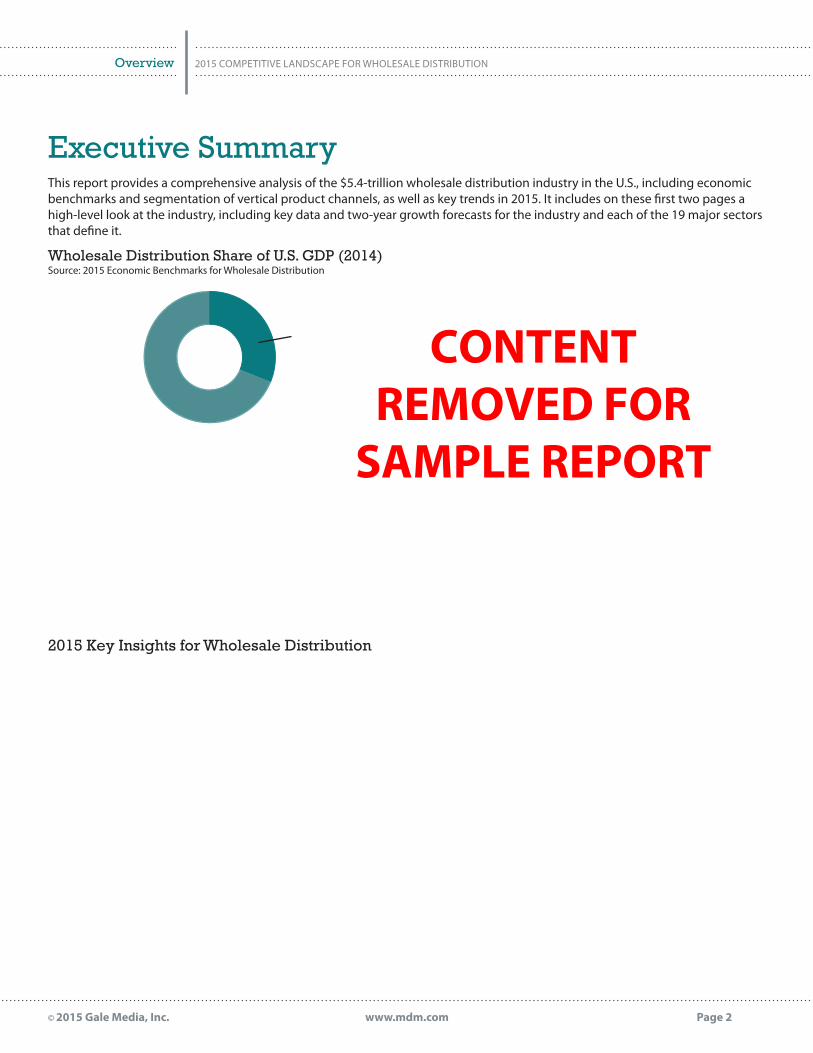
Executive SummaryThis report provides a comprehensive analysis of the $5.4-trillion wholesale distribution industry in the U.S., including economic benchmarks and segmentation of vertical product channels, as well as key trends in 2015. It includes on these first two pages a high-level look at the industry, including key data and two-year growth forecasts for the industry and each of the 19 major sectors that define it.
2015 Key Insights for Wholesale Distribution
Wholesale Distribution Share of U.S. GDP (2014)Source: 2015 Economic Benchmarks for Wholesale Distribution
CONTENTREMOVED FOR
SAMPLE REPORT
Page 3© 2015 Gale Media, Inc.
2015 COMPETITIVE LANDSCAPE FOR WHOLESALE DISTRIBUTION
www.mdm.com
Overview
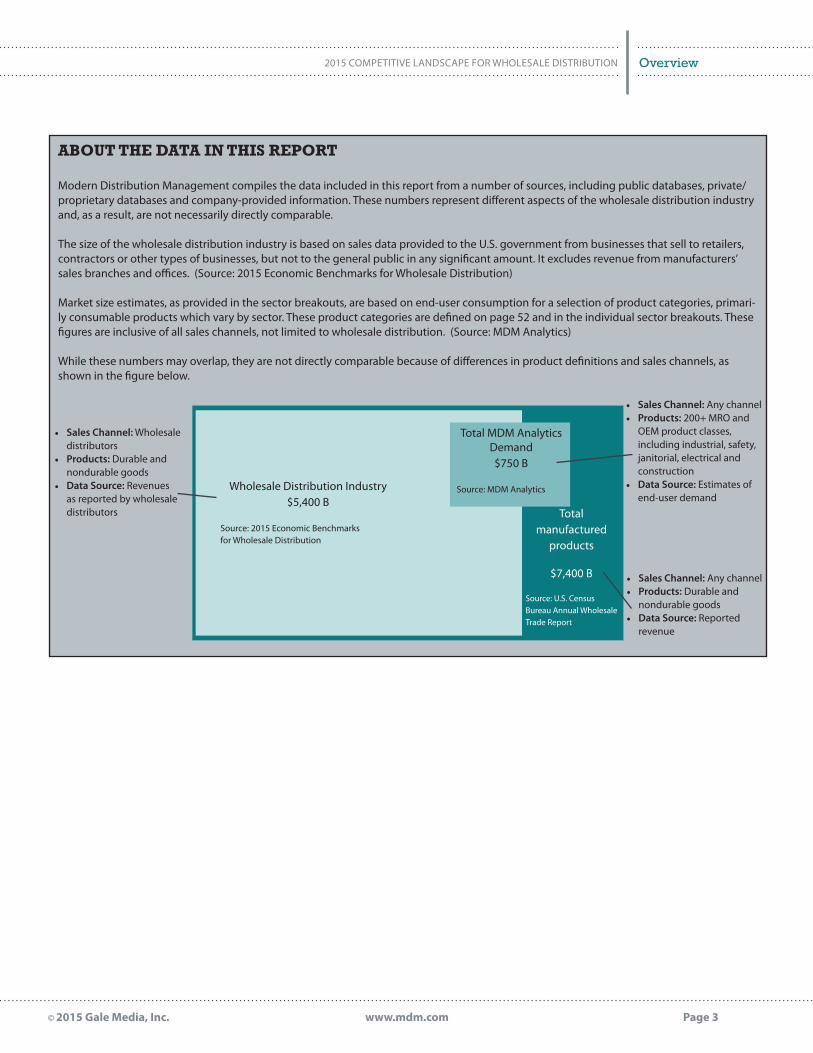
ABOUT THE DATA IN THIS REPORT
Modern Distribution Management compiles the data included in this report from a number of sources, including public databases, private/proprietary databases and company-provided information. These numbers represent different aspects of the wholesale distribution industry and, as a result, are not necessarily directly comparable.
The size of the wholesale distribution industry is based on sales data provided to the U.S. government from businesses that sell to retailers, contractors or other types of businesses, but not to the general public in any significant amount. It excludes revenue from manufacturers’ sales branches and offices. (Source: 2015 Economic Benchmarks for Wholesale Distribution)
Market size estimates, as provided in the sector breakouts, are based on end-user consumption for a selection of product categories, primari-ly consumable products which vary by sector. These product categories are defined on page 52 and in the individual sector breakouts. These figures are inclusive of all sales channels, not limited to wholesale distribution. (Source: MDM Analytics)
While these numbers may overlap, they are not directly comparable because of differences in product definitions and sales channels, as shown in the figure below.
Wholesale Distribution Industry$5,400 B
Source: 2015 Economic Benchmarks for Wholesale Distribution
Total MDM Analytics Demand$750 B
Source: MDM Analytics
Total manufactured
products
$7,400 B
Source: U.S. Census Bureau Annual Wholesale Trade Report
• Sales Channel: Wholesale distributors
• Products: Durable and nondurable goods
• Data Source: Revenues as reported by wholesale distributors
• Sales Channel: Any channel• Products: 200+ MRO and
OEM product classes, including industrial, safety, janitorial, electrical and construction
• Data Source: Estimates of end-user demand
• Sales Channel: Any channel• Products: Durable and
nondurable goods• Data Source: Reported
revenue
Page 4© 2015 Gale Media, Inc.
2015 COMPETITIVE LANDSCAPE FOR WHOLESALE DISTRIBUTION
www.mdm.com
Overview
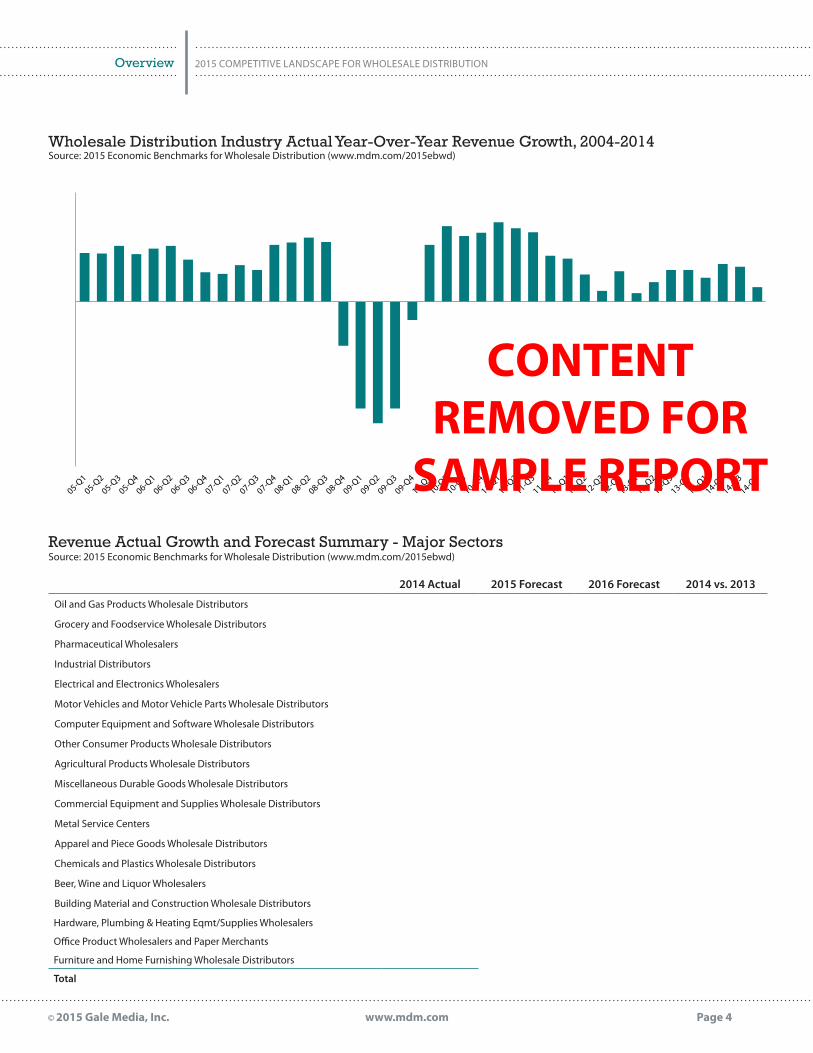
Revenue Actual Growth and Forecast Summary - Major SectorsSource: 2015 Economic Benchmarks for Wholesale Distribution (www.mdm.com/2015ebwd)
2014 Actual 2015 Forecast 2016 Forecast 2014 vs. 2013
Oil and Gas Products Wholesale Distributors
Grocery and Foodservice Wholesale Distributors
Pharmaceutical Wholesalers
Industrial Distributors
Electrical and Electronics Wholesalers
Motor Vehicles and Motor Vehicle Parts Wholesale Distributors
Computer Equipment and Software Wholesale Distributors
Other Consumer Products Wholesale Distributors
Agricultural Products Wholesale Distributors
Miscellaneous Durable Goods Wholesale Distributors
Commercial Equipment and Supplies Wholesale Distributors
Metal Service Centers
Apparel and Piece Goods Wholesale Distributors
Chemicals and Plastics Wholesale Distributors
Beer, Wine and Liquor Wholesalers
Building Material and Construction Wholesale Distributors
Hardware, Plumbing & Heating Eqmt/Supplies Wholesalers
Office Product Wholesalers and Paper Merchants
Furniture and Home Furnishing Wholesale Distributors
Total
Wholesale Distribution Industry Actual Year-Over-Year Revenue Growth, 2004-2014 Source: 2015 Economic Benchmarks for Wholesale Distribution (www.mdm.com/2015ebwd)
CONTENTREMOVED FOR
SAMPLE REPORT
Page 5© 2015 Gale Media, Inc.
2015 COMPETITIVE LANDSCAPE FOR WHOLESALE DISTRIBUTION
www.mdm.com
Industrial
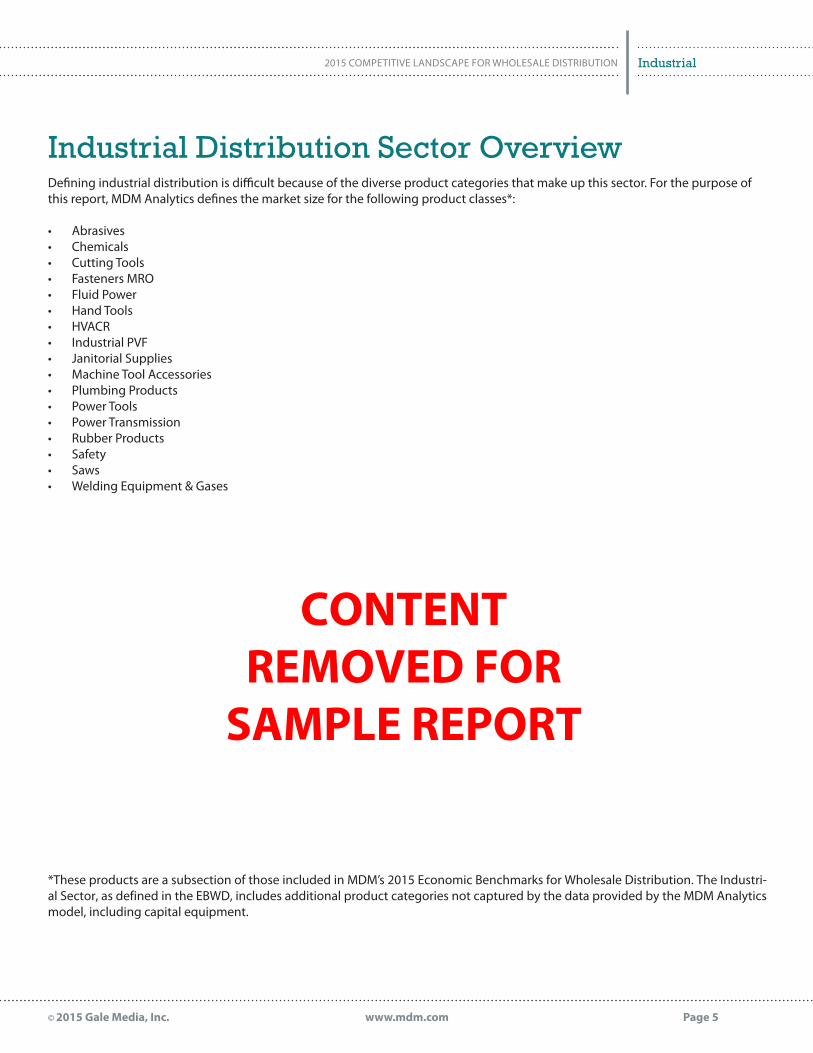
Industrial Distribution Sector OverviewDefining industrial distribution is difficult because of the diverse product categories that make up this sector. For the purpose of this report, MDM Analytics defines the market size for the following product classes*:
• Abrasives• Chemicals• Cutting Tools• Fasteners MRO• Fluid Power• Hand Tools• HVACR• Industrial PVF• Janitorial Supplies• Machine Tool Accessories• Plumbing Products• Power Tools• Power Transmission• Rubber Products• Safety• Saws• Welding Equipment & Gases
*These products are a subsection of those included in MDM’s 2015 Economic Benchmarks for Wholesale Distribution. The Industri-al Sector, as defined in the EBWD, includes additional product categories not captured by the data provided by the MDM Analyticsmodel, including capital equipment.
CONTENTREMOVED FOR
SAMPLE REPORT
Page 6© 2015 Gale Media, Inc.
2015 COMPETITIVE LANDSCAPE FOR WHOLESALE DISTRIBUTION
www.mdm.com
Industrial
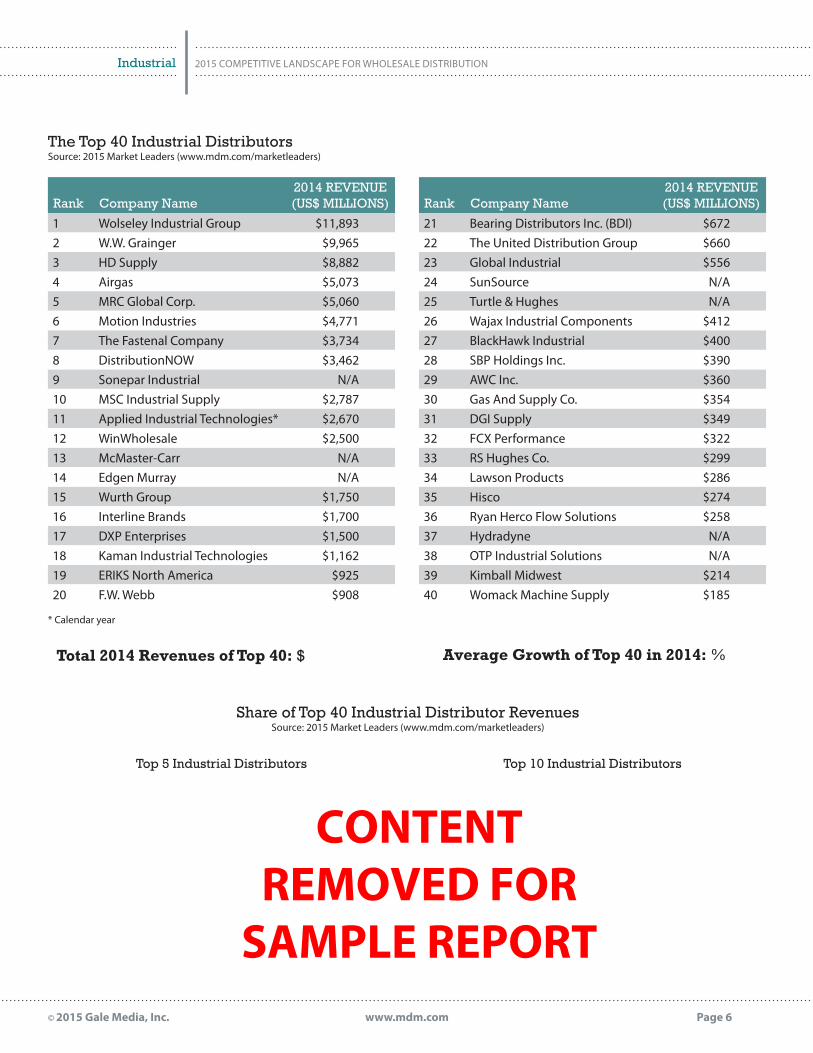
Rank Company Name2014 REVENUE(US$ MILLIONS)
1 Wolseley Industrial Group $11,893 2 W.W. Grainger $9,965 3 HD Supply $8,882 4 Airgas $5,073 5 MRC Global Corp. $5,060 6 Motion Industries $4,771 7 The Fastenal Company $3,734 8 DistributionNOW $3,462 9 Sonepar Industrial N/A10 MSC Industrial Supply $2,787 11 Applied Industrial Technologies* $2,670 12 WinWholesale $2,500 13 McMaster-Carr N/A14 Edgen Murray N/A15 Wurth Group $1,750 16 Interline Brands $1,700 17 DXP Enterprises $1,500 18 Kaman Industrial Technologies $1,162 19 ERIKS North America $925 20 F.W. Webb $908
The Top 40 Industrial DistributorsSource: 2015 Market Leaders (www.mdm.com/marketleaders)
Total 2014 Revenues of Top 40: $
Top 10 Industrial Distributors
Rank Company Name2014 REVENUE(US$ MILLIONS)
21 Bearing Distributors Inc. (BDI) $672 22 The United Distribution Group $660 23 Global Industrial $556 24 SunSource N/A25 Turtle & Hughes N/A26 Wajax Industrial Components $412 27 BlackHawk Industrial $400 28 SBP Holdings Inc. $390 29 AWC Inc. $360 30 Gas And Supply Co. $354 31 DGI Supply $349 32 FCX Performance $322 33 RS Hughes Co. $299 34 Lawson Products $286 35 Hisco $274 36 Ryan Herco Flow Solutions $258 37 Hydradyne N/A38 OTP Industrial Solutions N/A39 Kimball Midwest $214 40 Womack Machine Supply $185
Top 5 Industrial Distributors
Average Growth of Top 40 in 2014: %
Share of Top 40 Industrial Distributor RevenuesSource: 2015 Market Leaders (www.mdm.com/marketleaders)
* Calendar year
CONTENTREMOVED FOR
SAMPLE REPORT
Page 7© 2015 Gale Media, Inc.
2015 COMPETITIVE LANDSCAPE FOR WHOLESALE DISTRIBUTION
www.mdm.com
Industrial
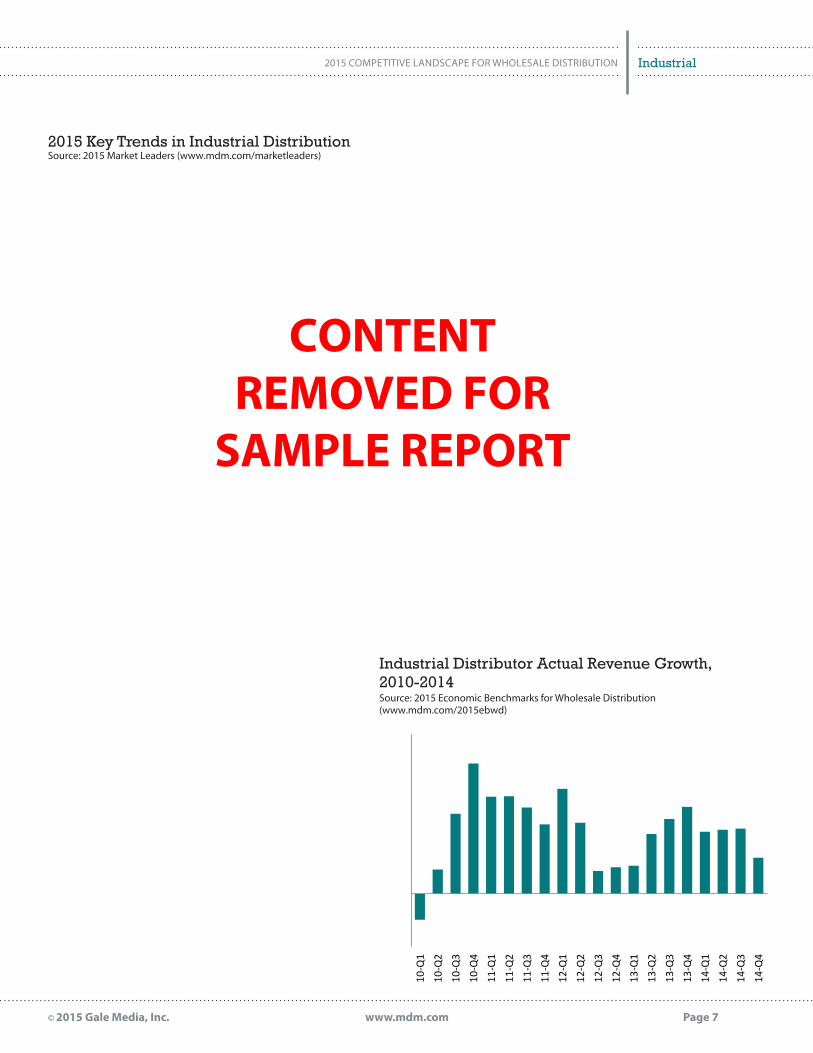
Industrial Distributor Actual Revenue Growth,2010-2014Source: 2015 Economic Benchmarks for Wholesale Distribution(www.mdm.com/2015ebwd)
10-Q
1
10-Q
2
10-Q
3
10-Q
4
11-Q
1
11-Q
2
11-Q
3
11-Q
4
12-Q
1
12-Q
2
12-Q
3
12-Q
4
13-Q
1
13-Q
2
13-Q
3
13-Q
4
14-Q
1
14-Q
2
14-Q
3
14-Q
4
2015 Key Trends in Industrial DistributionSource: 2015 Market Leaders (www.mdm.com/marketleaders)
CONTENTREMOVED FOR
SAMPLE REPORT
Page 8© 2015 Gale Media, Inc.
2015 COMPETITIVE LANDSCAPE FOR WHOLESALE DISTRIBUTION
www.mdm.com
Industrial
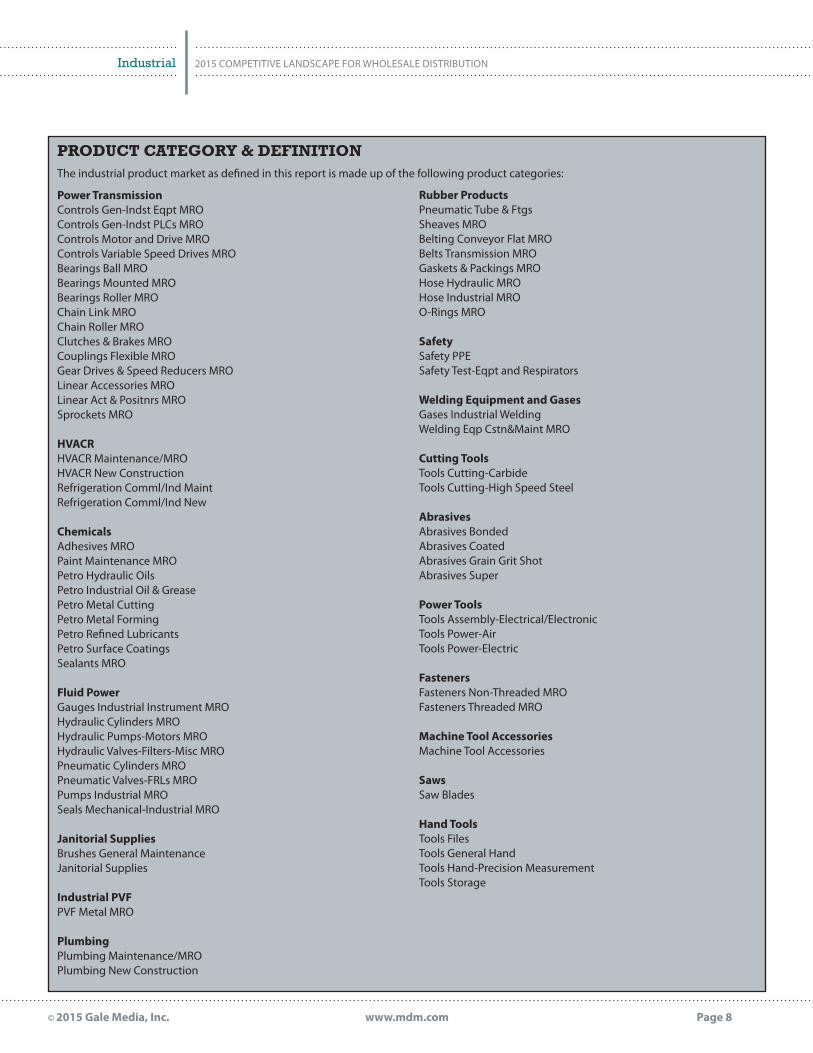
PRODUCT CATEGORY & DEFINITIONThe industrial product market as defined in this report is made up of the following product categories:
Power TransmissionControls Gen-Indst Eqpt MROControls Gen-Indst PLCs MROControls Motor and Drive MROControls Variable Speed Drives MROBearings Ball MROBearings Mounted MROBearings Roller MROChain Link MROChain Roller MROClutches & Brakes MROCouplings Flexible MROGear Drives & Speed Reducers MROLinear Accessories MROLinear Act & Positnrs MROSprockets MRO
HVACRHVACR Maintenance/MRO HVACR New ConstructionRefrigeration Comml/Ind MaintRefrigeration Comml/Ind New
ChemicalsAdhesives MROPaint Maintenance MROPetro Hydraulic OilsPetro Industrial Oil & GreasePetro Metal CuttingPetro Metal FormingPetro Refined LubricantsPetro Surface CoatingsSealants MRO
Fluid PowerGauges Industrial Instrument MROHydraulic Cylinders MROHydraulic Pumps-Motors MROHydraulic Valves-Filters-Misc MROPneumatic Cylinders MROPneumatic Valves-FRLs MROPumps Industrial MROSeals Mechanical-Industrial MRO
Janitorial SuppliesBrushes General MaintenanceJanitorial Supplies
Industrial PVFPVF Metal MRO
PlumbingPlumbing Maintenance/MROPlumbing New Construction
Rubber ProductsPneumatic Tube & FtgsSheaves MROBelting Conveyor Flat MROBelts Transmission MROGaskets & Packings MROHose Hydraulic MROHose Industrial MROO-Rings MRO
SafetySafety PPESafety Test-Eqpt and Respirators
Welding Equipment and GasesGases Industrial Welding Welding Eqp Cstn&Maint MRO
Cutting ToolsTools Cutting-CarbideTools Cutting-High Speed Steel
AbrasivesAbrasives BondedAbrasives CoatedAbrasives Grain Grit ShotAbrasives Super
Power ToolsTools Assembly-Electrical/ElectronicTools Power-AirTools Power-Electric
FastenersFasteners Non-Threaded MROFasteners Threaded MRO
Machine Tool AccessoriesMachine Tool Accessories
SawsSaw Blades
Hand ToolsTools FilesTools General HandTools Hand-Precision MeasurementTools Storage
Page 9© 2015 Gale Media, Inc.
2015 COMPETITIVE LANDSCAPE FOR WHOLESALE DISTRIBUTION
www.mdm.com
Industrial
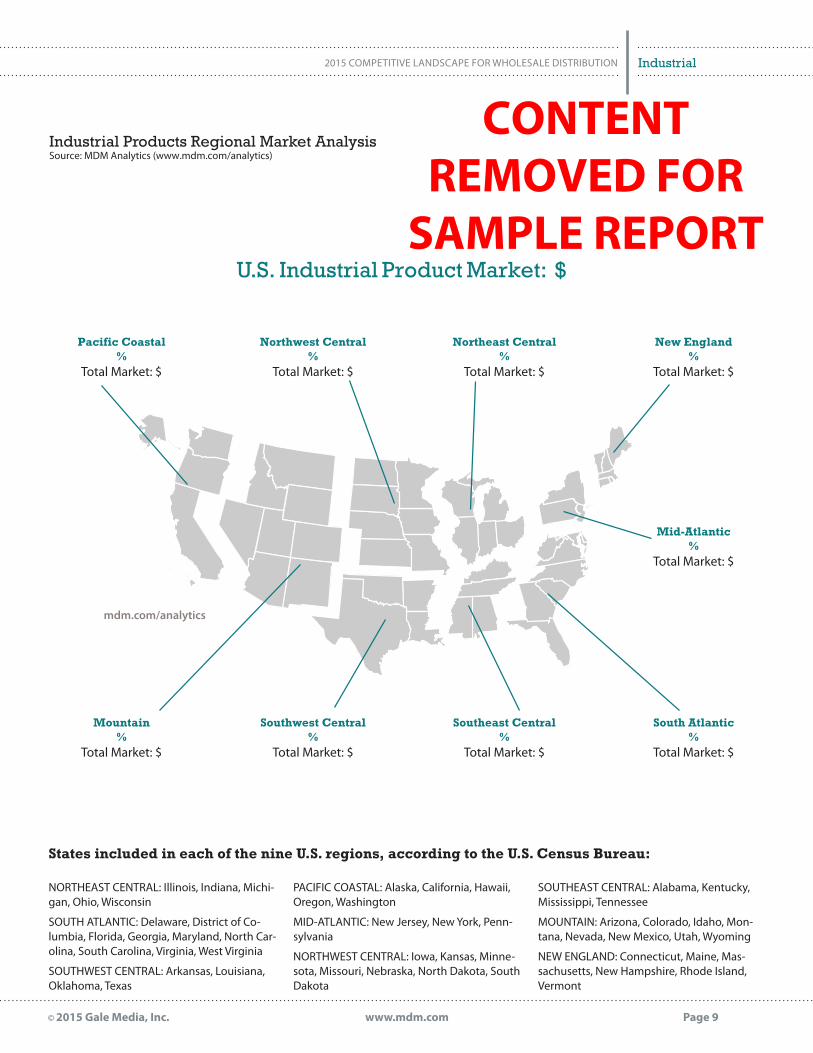
NORTHEAST CENTRAL: Illinois, Indiana, Michi-gan, Ohio, Wisconsin
SOUTH ATLANTIC: Delaware, District of Co-lumbia, Florida, Georgia, Maryland, North Car-olina, South Carolina, Virginia, West Virginia
SOUTHWEST CENTRAL: Arkansas, Louisiana, Oklahoma, Texas
PACIFIC COASTAL: Alaska, California, Hawaii, Oregon, Washington
MID-ATLANTIC: New Jersey, New York, Penn-sylvania
NORTHWEST CENTRAL: Iowa, Kansas, Minne-sota, Missouri, Nebraska, North Dakota, South Dakota
SOUTHEAST CENTRAL: Alabama, Kentucky, Mississippi, Tennessee
MOUNTAIN: Arizona, Colorado, Idaho, Mon-tana, Nevada, New Mexico, Utah, Wyoming
NEW ENGLAND: Connecticut, Maine, Mas-sachusetts, New Hampshire, Rhode Island, Vermont
States included in each of the nine U.S. regions, according to the U.S. Census Bureau:
Northeast Central %
Total Market: $
New England%
Total Market: $
Mid-Atlantic%
Total Market: $
South Atlantic%
Total Market: $
Southeast Central %
Total Market: $
Southwest Central %
Total Market: $
Mountain%
Total Market: $
Pacific Coastal %
Total Market: $
Northwest Central %
Total Market: $
Industrial Products Regional Market AnalysisSource: MDM Analytics (www.mdm.com/analytics)
U.S. Industrial Product Market: $
mdm.com/analytics
CONTENTREMOVED FOR
SAMPLE REPORT
Page 10© 2015 Gale Media, Inc.
2015 COMPETITIVE LANDSCAPE FOR WHOLESALE DISTRIBUTION
www.mdm.com
Industrial
NAICS6 Definition
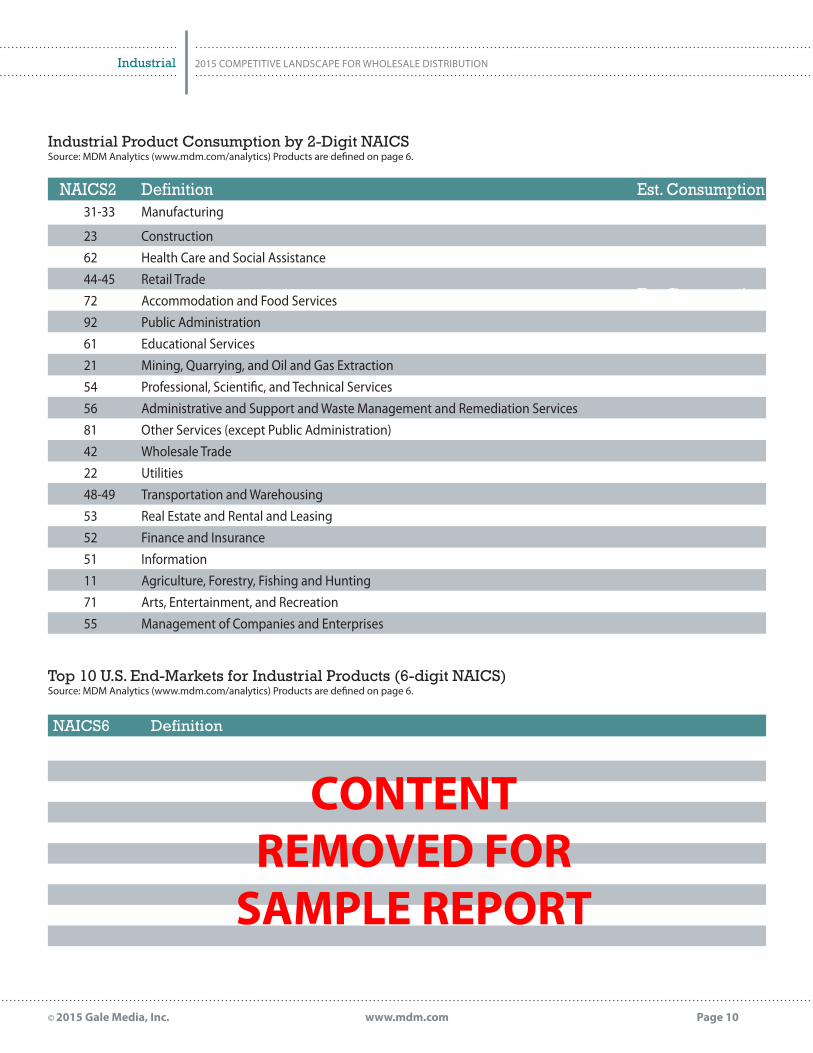
Top 10 U.S. End-Markets for Industrial Products (6-digit NAICS)Source: MDM Analytics (www.mdm.com/analytics) Products are defined on page 6.
NAICS2 Definition31-33 Manufacturing
23 Construction62 Health Care and Social Assistance44-45 Retail Trade72 Accommodation and Food Services92 Public Administration61 Educational Services21 Mining, Quarrying, and Oil and Gas Extraction54 Professional, Scientific, and Technical Services56 Administrative and Support and Waste Management and Remediation Services81 Other Services (except Public Administration)42 Wholesale Trade22 Utilities48-49 Transportation and Warehousing53 Real Estate and Rental and Leasing52 Finance and Insurance51 Information11 Agriculture, Forestry, Fishing and Hunting71 Arts, Entertainment, and Recreation55 Management of Companies and Enterprises
Est. Consumption
Est. Consumption
Industrial Product Consumption by 2-Digit NAICSSource: MDM Analytics (www.mdm.com/analytics) Products are defined on page 6.
CONTENTREMOVED FOR
SAMPLE REPORT
Page 11© 2015 Gale Media, Inc.
2015 COMPETITIVE LANDSCAPE FOR WHOLESALE DISTRIBUTION
www.mdm.com
About
About This Report
Due to slight variations in product groups included, as well as updates to the U.S. government database, data previously published by MDM on the size of the MRO market are not directly comparable to the data in this report.
Market size estimates use MDM Analytics’ proprietary predictive modeling, which starts with a public aggregate market size esti-mate by product category for a given geography. MDM Analytics then uses a combination of public and private databases to allo-cate estimated demand to deeper geographic levels and to specific customer segments, as defined by the 6-digit North American Industry Classification System (NAICS). This approach provides a total market size estimate without regard to market channels.
All estimates in this report are in U.S. dollars and represent the end-user market demand that includes an estimated average dis-tributor margin by product category in the calculations.
MDM Analytics is the data division of Modern Distribution Management. Both are owned by Gale Media, Inc.
About MDM Market Leaderswww.mdm.com/marketleaders
About the 2015 Distribution Trends Special Issuewww.mdm.com/2015-Distribution-Trends-Special-Issue
About the 2015 Economic Benchmarks for Wholesale Distributionwww.mdm.com/EBWD
The MDM Market Leaders includes lists of the top distributors in 15 sectors. The 2015 lists are ranked in order of 2014 revenue size alone; no other factors were used to compile these lists. These lists reflect North American revenues where they are clearly broken out by the global distributors. For specific sectors, such as jan-san or safety, where applicable, the revenue shown is just for those segments if that breakout is available.
The 2015 Wholesale Distribution Trends Special Issue was researched and written by MDM editors based on interviews with dozens of wholesaler-distributors, as well as industry experts and manufacturers. MDM also conducted a survey of its readers to uncover the trends outlined in this report.
The MDM Economic Benchmarks for Wholesale Distribution is the best source for accurate statistics on the distribution industry, including segment and overall industry revenue trends, inventory levels, 2015-2016 sales forecasts and other critical benchmark data on distribution.
Page 12© 2015 Gale Media, Inc.
2015 COMPETITIVE LANDSCAPE FOR WHOLESALE DISTRIBUTION
www.mdm.com
About
MDM Analytics is the leading market analytics firm for industrial and construction products in North America. Since 1987, MDM Analytics has helped clients reach their full market potential with data services, dashboards and sales force management tools to target high-potential customers and markets.
MDM Analytics is an essential resource for clients seeking to:
• identify market penetration & untapped potential;• target the highest potential geographic regions, customer segments & product categories;• assess individual customer & prospect potential;• more effectively deploy resources; and• improve sales growth, margins and return on capital.
MDM Analytics’ capabilities are built on a team of seasoned professionals and a unique database delivering reliable market size and segmentation services for more than 200 MRO/OEM products.
COPYRIGHT AND TERMS OF USE
Copyright © 2015 by Modern Distribution Management and MDM Analytics/Gale Media, Inc. All rights reserved. This report is protected by copy-right law and may not be copied or otherwise reproduced, repackaged, further transmitted, transferred, disseminated, redistributed or resold, in whole or in part, in any form or manner or by any means whatsoever, by any person without prior written consent from Gale Media, Inc. This report may not be used in commercial documents without the written permission of the copyright holder. You may make one machine readable copy and/or one print copy for your personal use. You may also include limited excerpts of this content in printed memos, reports and presen-tations for non-commercial use. We ask that you attribute this information by including “Source: 2015 Competitive Landscape for Wholesale Distribution ©2015 Gale Media, Inc. All rights reserved.”
Gale Media, Inc., 2569 Park Lane, Suite 200, Lafayette, CO 80026
Wholesale Distribution News, Expert Analysis & Market Research
Modern
Distribution Management
Modern Distribution Management is the only specialized information business that provides high-level in-depth resources to executives who are in or serve the wholesale distribution industry. With MDM’s information services, you’ll find fresh analysis, accurate reporting and good ideas to practice across many lines of trade. We provide original, in-depth thinking - and you won’t find MDM’s content anywhere else.
MDM’s editors have received several Editorial Excellence Awards from the Specialized Information Publishers Association and are regularly recognized by industry groups as content leaders in wholesale distribution.