Research of ETFs
29
Research of ETFs A guide for Financial Advisors Exercise better, tighter control over clients’ asset allocation Select and monitor the best funds for each client with new analytical tools suitable for any investment strategy Provide highly tailored, ongoing investment oversight Trademarks and Service Marks contained herein are the property of their respective owners. Important additional disclosure information can be found on the last page of this report . © 2010 AltaVista Research, LLC. All rights reserved.
Transcript of Research of ETFs
8/8/2019 Research of ETFs
http://slidepdf.com/reader/full/research-of-etfs 1/28

8/8/2019 Research of ETFs
http://slidepdf.com/reader/full/research-of-etfs 2/28
AltaVista Research RESEARCH OF ETFS
2 www.etfresearchcenter.com
8/8/2019 Research of ETFs
http://slidepdf.com/reader/full/research-of-etfs 3/28

8/8/2019 Research of ETFs
http://slidepdf.com/reader/full/research-of-etfs 4/28
8/8/2019 Research of ETFs
http://slidepdf.com/reader/full/research-of-etfs 5/28
RESEARCH OF ETFS AltaVista Research
www.etfresearchcenter.com 5
IntroductionExchange Traded Funds are part of a larger, secular trend towards index investing.
While many financial advisors have embraced ETFs others view them as a threat or
are unsure how they can use them to add value for clients. Often, one’s view of ETFs
is tied to his or her view on the merits of active versus passive investing.
But the debate over active versus passive management largely misses the point
when it comes to financial planning. The central drawback of actively managed
funds is that investors don’t really know what they own. This needlessly complicates
portfolio building.
ETFs overcome this thanks to their transparency, allowing investors to know exactly
what they own at any point in time. And with so many variations available—from
the broadest to most narrow indices— ETFs fit the bill in a way that opaque mutual
funds cannot, whether the advisor aims to simply provide clean, transparent asset
allocation or highly tailored, ongoing tactical investment management.
This also has important implications for the business of investment advice. Advisors
who entrust client assets to mutual fund managers are essentially outsourcing asset
allocation and portfolio management to some degree. But adopting ETFs for
widespread use in clients’ portfolios reverses this, putting the advisor in full control.
For those who manage portfolios of individual stocks, ETFs are the ideal bridge to
transition clients from a transaction-based account to a fee-based account while still
providing full-service, individualized financial planning and oversight.
However, this increased role requires a heightened level of commitment from
advisors as well. Selecting the right mix of ETFs for each client takes more than
examination of issuers’ websites and a quick check of rating systems that were
designed to evaluate actively managed mutual funds.
This guide explains how advisors can seize the opportunity to provide more effective
financial planning services by adopting ETFs for widespread use in clients’ portfolios
and build better, more enduring relationships in the process. We will walk readers
through the inadequacies of existing research methods, argue the benefits of a
fundamentally-driven, forward-looking analysis, and illustrate how advisors can put
these tools to work in the real world.
We assume the reader is already familiar with the basic structure and workings of
exchange traded funds, including their advantages and disadvantages versus
traditional mutual funds in terms of costs, tax efficiency, and trading flexibility. For
those wanting more information, Appendix B includes a list of resources on these
and other topics.
The central drawback
of actively managed
funds is that investors
don’t really know
what they own
Adopting ETFs for use
in clients’ portfolios
puts the advisor in
full control
8/8/2019 Research of ETFs
http://slidepdf.com/reader/full/research-of-etfs 6/28
AltaVista Research RESEARCH OF ETFS
6 www.etfresearchcenter.com
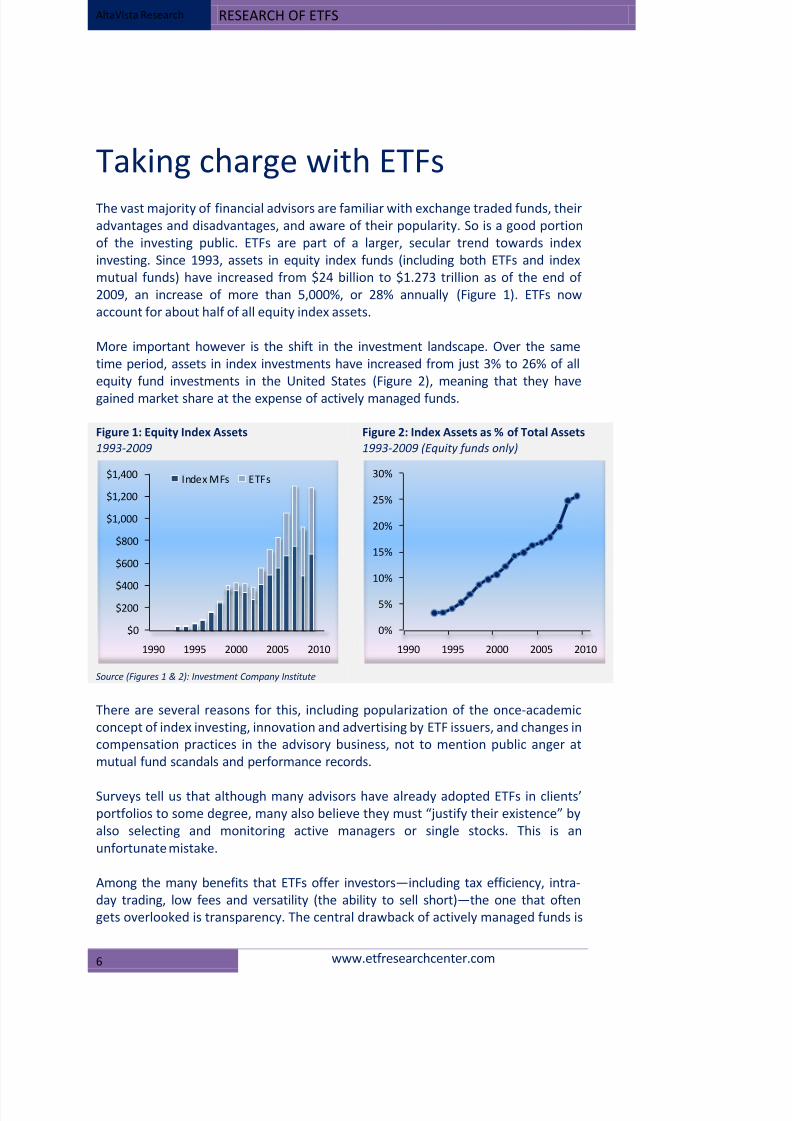
Taking charge with ETFsThe vast majority of financial advisors are familiar with exchange traded funds, their
advantages and disadvantages, and aware of their popularity. So is a good portion
of the investing public. ETFs are part of a larger, secular trend towards index
investing. Since 1993, assets in equity index funds (including both ETFs and index
mutual funds) have increased from $24 billion to $1.273 trillion as of the end of
2009, an increase of more than 5,000%, or 28% annually (Figure 1). ETFs now
account for about half of all equity index assets.
More important however is the shift in the investment landscape. Over the same
time period, assets in index investments have increased from just 3% to 26% of all
equity fund investments in the United States (Figure 2), meaning that they have
gained market share at the expense of actively managed funds.
Figure 1: Equity Index Assets
1993-2009 Figure 2: Index Assets as % of Total Assets
1993-2009 (Equity funds only)
Source (Figures 1 & 2): Investment Company Institute
There are several reasons for this, including popularization of the once-academic
concept of index investing, innovation and advertising by ETF issuers, and changes in
compensation practices in the advisory business, not to mention public anger at
mutual fund scandals and performance records.
Surveys tell us that although many advisors have already adopted ETFs in clients’
portfolios to some degree, many also believe they must “justify their existence” by
also selecting and monitoring active managers or single stocks. This is an
unfortunate mistake.
Among the many benefits that ETFs offer investors—including tax efficiency, intra-
day trading, low fees and versatility (the ability to sell short)—the one that often
gets overlooked is transparency. The central drawback of actively managed funds is
$0
$200
$400
$600
$800
$1,000
$1,200
$1,400
1990 1995 2000 2005 2010
Index MFs ETFs
0%
5%
10%
15%
20%
25%
30%
1990 1995 2000 2005 2010
8/8/2019 Research of ETFs
http://slidepdf.com/reader/full/research-of-etfs 7/28
RESEARCH OF ETFS AltaVista Research
www.etfresearchcenter.com 7
that the manager doesn’t know each investor’s overall financial picture and
investors don’t know what they own, a point the debate over active versus passive
management tends to ignore.
Let’s examine that from both sides. The active mutual fund manager knows what
the portfolio holds, of course, but is selecting securities on behalf of thousands or
millions of end investors he has never met, and whose investment preferences he
has no knowledge of. In a sense, this disconnected structure violates the first rule of
the investing profession, “Know thy client.”
Besides serving investors with many different goals and preferences, the manager
cannot know what else the investor holds. If the manager decides to overweight the
technology sector, for example, an investor (or his advisor) who also reached the
same conclusion and bought a technology fund separately would have an
unintended and possibly dangerous concentration in the sector.
The investor is also flying blind. Most actively managed funds provide only a range
of possible investment choices: a “global equity” fund may say in its prospectus that
it will invest between 0% and 30% of its assets in emerging markets, for example.
Disclosure of actual holdings is only given periodically after the fact, and then
usually incomplete.
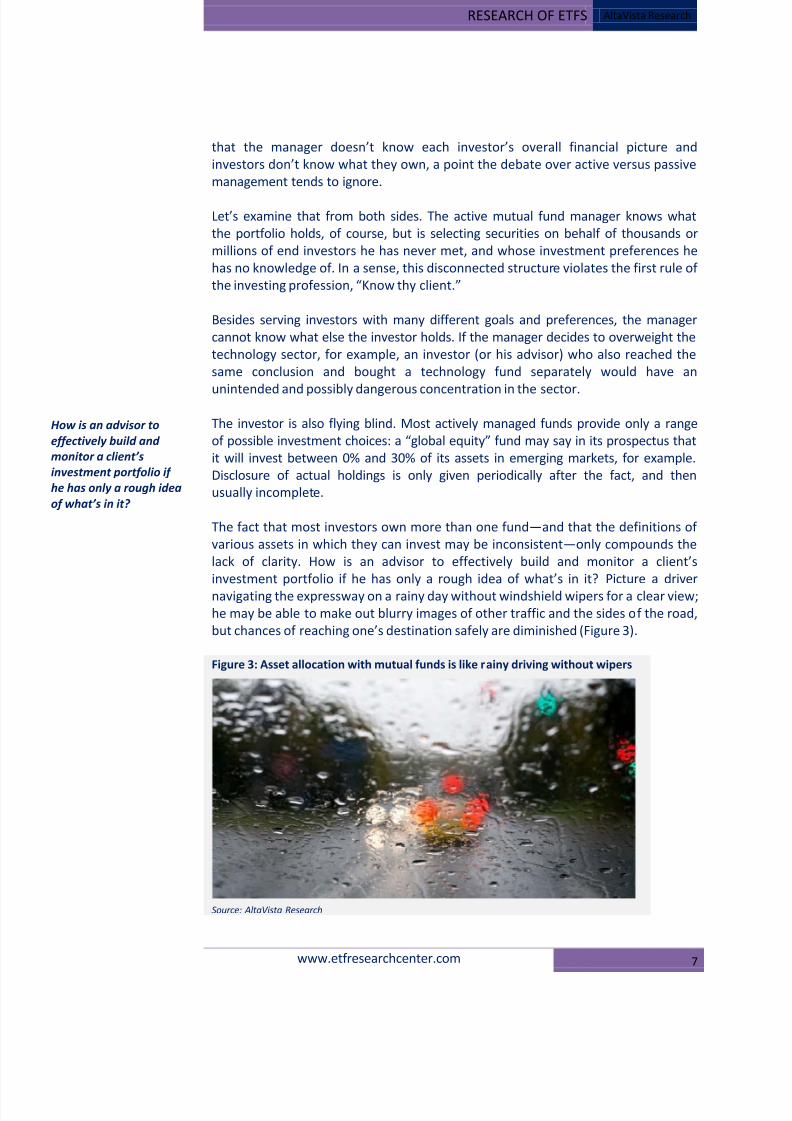
The fact that most investors own more than one fund—and that the definitions of
various assets in which they can invest may be inconsistent—only compounds the
lack of clarity. How is an advisor to effectively build and monitor a client’s
investment portfolio if he has only a rough idea of what’s in it? Picture a driver
navigating the expressway on a rainy day without windshield wipers for a clear view;
he may be able to make out blurry images of other traffic and the sides of the road,
but chances of reaching one’s destination safely are diminished (Figure 3).
Figure 3: Asset allocation with mutual funds is like rainy driving without wipers
Source: AltaVista Research
How is an advisor to
effectively build and
monitor a client’s
investment portfolio if
he has only a rough idea
of what’s in it?
8/8/2019 Research of ETFs
http://slidepdf.com/reader/full/research-of-etfs 8/28
AltaVista Research RESEARCH OF ETFS
8 www.etfresearchcenter.com
Changing the Dynamic
This presents both an opportunity and a challenge for advisors. Instead of acting as
middleman between investor and the mutual fund by “handing over” client assets
to an outside manager, the advisor using ETFs can assume direct control over
clients’ portfolios.
Whether that means simple, clean asset allocation (more “passive” investing) or
highly tailored, ongoing tactical investment oversight (more “active” investing) is a
matter for agreement between client and advisor. In either case, the advisor is in a
unique position to fill this role as the only one with a complete view of a client’s
overall financial picture.
The advisor using ETFs will not find himself in the uncomfortable position of having
to explain to the client why a mutual fund performed poorly after investing in ways
different from what was intended (so-called “style drift”) which he would not have
chosen for the client if only he had known about it.
However, this increased role also presents a challenge. Previously, due diligence
meant manager due diligence. After selecting several managers and allocating
clients’ assets, the advisor could generally “set it and forget it” until the next
quarterly review. Due diligence did not extend to the underlying securities
themselves, and day-to-day portfolio management was outsourced to the manager,
who made decisions on investors’ behalf (and without their knowledge).
This changes with ETFs. All index funds, including ETFs, simply aim to track their
benchmarks. There is no active manager evaluating underlying securities and
making decisions, such as to get out of emerging markets if they become
overheated or to go bargain hunting in a beaten-up sector. So a portfolio of ETFs is
essentially on auto-pilot.
As a result it falls to the advisor to monitor, analyze and adjust the portfolio.
Although the desired frequency and thoroughness of these functions may differ
among advisors, performing them well requires more than the information provided
on issuers’ websites or from rating systems designed to evaluate actively managed
funds (discussed in more detail later). It requires a comprehensive set of tools
designed specifically for ETFs to make a disciplined, detailed analysis of the funds.
Therein lays the opportunity. Using these tools to provide highly customized
portfolios over which he maintains direct control and responsibility, the advisor can
change the dynamic from being at the mercy of active fund managers claiming “it’s
a stock picker’s market,” to being in charge in “the index picker’s market.”
Advisors are in a uniqu
position to exercise
better control of clients
portfolios
A portfolio of ETFs is
essentially on auto-
pilot. It falls to the
advisor to monitor,
analyze and adjust it.

8/8/2019 Research of ETFs
http://slidepdf.com/reader/full/research-of-etfs 9/28
RESEARCH OF ETFS AltaVista Research
www.etfresearchcenter.com 9
Analyzing ETFsThe marketplace for ETF research can be broken into four basic types: 1) Mutual
fund-style research, 2) Portfolio strategy, 3) Industry reporting, and 4) Trading
metrics. Each has helpful elements but significant shortcomings as a comprehensive
tool for advisors. We briefly discuss each of these below before turning to the case
for a fundamentally-driven approach.
Mutual fund-style research
The most prominent type of ETF analysis is mutual fund-style research (“MF”),
generally practiced by the same firms that already rate mutual funds. This approach
focuses on past returns to generate a rating for the fund. While this may be helpfulto know, it has serious drawbacks as a rating methodology for ETFs.
No active managers to evaluate
Investors understand that past performance is no guarantee of future results, but
when we examine a mutual fund this way what we’re really doing is evaluating the
manager, so it makes sense to ask how well he or she has performed in the past.
However ETFs do not have active managers making decisions about the portfolio;
the funds are simply meant to track an index. Financial sector ETFs rode bank stocks
all the way down during the financial crisis as they were designed to do, but that
doesn’t make them “bad” funds, and it doesn’t tell the investor much if anything
about likely future performance.
In fact, to the degree one believes in reversion to the mean, using past performance
as the primary factor in a fund’s rating is a contrary indicator. The FTSE/Xinha China
25 fund (FXI) had no such rating until the third anniversary of its listing, when it
received the highest rating possible from a major firm using the MF approach, based
on the fund’s exceptional performance until that point.
The two figures in the sidebar break the fund’s performance into two time series.
The top one shows performance from listing until its third anniversary, when it
received its first rating; the bottom shows the subsequent performance. Though anextreme example, it illustrates our point quite well: while reasonable analysts might
have disagreed about the future prospects for Chinese stocks at the time, rating the
fund so highly based solely on the “hockey-stick” graph on the top is absurd from an
investment perspective. To extend our driving analogy, one can’t drive by looking
only in the rear view mirror. Trying to invest that way can be equally dangerous.
FXI: Performance history
initial listing through rating
performance since rating
Source: Bloomberg
$10
$20
$30
$40
$50
$60
$70
$80
Oct-04 Oct-06
$10
$20
$30
$40
$50
$60
$70
$80
Oct-07 Oct-09
8/8/2019 Research of ETFs
http://slidepdf.com/reader/full/research-of-etfs 10/28
AltaVista Research RESEARCH OF ETFS
10 www.etfresearchcenter.com
Limited history
Any model is only as good as the data put into it, and in the case of ETFs often times
trading history is very limited. More than half of the ETFs available today are lessthan three years old, the minimum trading history that most firms using past
performance need to generate a rating. This puts those products “off limits” to
many advisors who might otherwise have good use for them.
Portfolio Strategy
Another type of ETF research is Portfolio Strategy, practiced by broker/dealers and
prevalent on investing blogs, based on an analysis of economic and market trends.
An investment strategist will generally recommend ETFs poised to benefit if theirpredictions unfold as expected. For example, they may recommend a Consumer
Discretionary ETF to play a rebound in consumer spending, or advise clients to
overweight emerging markets using an Emerging Market ETF, on the basis that they
have fast-growing economies.
Whether very general or specific, this type of investment analysis informs the asset
allocation decision, one of the most important decisions an investor can make. But
although ETFs are an excellent tool for implementing an asset allocation plan, this
isn’t technically ETF analysis. Typically, little if any investment research goes into
selecting the particular funds to be used to implement the strategy.
Which Emerging Market ETF should the advisor use? The default choice of manyinvestors based on the well-known MSCI index may be sufficient for a basic three-
part allocation between domestic, developed foreign and emerging market equities,
but what of the two dozen other diversified emerging markets ETFs, or the dozens
more country funds? Each is different from the others in terms of composition,
exposure, and investment potential, some quite dramatically.
If, for example, the portfolio strategist’s advice to investors is to reduce exposure to
emerging markets on the basis that they have become “overheated,” how would
that differ if the investor instead had a fundamentally-weighted emerging market
ETF, with much different characteristics? High-level asset allocation is a critical part
of the investment process, but it can’t fine tune a portfolio with fund-levelintelligence.
Finally, if the advisor either disagrees with the strategist (consumer spending isn’t
going to rebound, for example) or the advice simply isn’t appropriate for the
particular client (the strategist, like the active fund manager, is providing
generalized advice), then the advisor is at a dead end.
Typically, little if any
research goes into
selecting the particular
funds to be used to
implement the strategy

8/8/2019 Research of ETFs
http://slidepdf.com/reader/full/research-of-etfs 11/28

8/8/2019 Research of ETFs
http://slidepdf.com/reader/full/research-of-etfs 12/28
AltaVista Research RESEARCH OF ETFS
12 www.etfresearchcenter.com
The Case for a Fundamental Approach
All of the approaches discussed up to here fail to make full use of an ETF’s mostimportant advantage—its transparency. The Fundamental Approach relies on it.
Because the holdings of an ETF are public information a completely different type of
analysis becomes possible. By aggregating the fundamental data available—both
historical results and forecasts—for each constituent in an ETF, one can develop a
view of the ETF as a whole based on fundamentals. Essentially, the Fundamental
Approach applies the traditional tools of security analysis first published by Graham
& Dodd1
in 1934 to ETFs. The primary benefit of this approach is that it is forward-
looking.
It is common in the financial press to discuss earnings growth and perhaps price-to-
earnings ratios for well-known indices such as the S&P500. One can do thosecalculations because the composition of the index is made public. Similarly, because
ETF holdings are transparent, it is possible to calculate those figures for any equity
exchange traded fund.
There is no reason to stop at earnings and P/E multiples. In fact, most of the
questions an investor would have when investigating a single stock can—and
should—be answered when investigating an ETF. These questions might include:
o What are expectations for sales and EPS growth?
o What rates of profitability (margins, return on equity, etc.) have these firmsachieved historically and how does that compare to current forecasts?
o How are estimates changing along with economic conditions?
o What's happening on the balance sheet?
o How is it being valued by the market, both in absolute terms and relative to
other investments?
The result of answering these questions allows investors to view and value ETFs in a
very familiar way—in much the same way they might evaluate a single stock. This
also addresses a number of the shortcomings of the other approaches to ETF
analysis (Table 2). Primary among them is that asking and answering questionsabout expectations and how they are changing is inherently more informative about
the future than simply looking at past performance as the MF approach does.
1 Graham, Benjamin and Dodd, David. Security Analysis, McGraw-Hill, 1934
Graham & Dodd, 1934
The primary benefit
of the fundamental
approach is that it is
forward-looking
8/8/2019 Research of ETFs
http://slidepdf.com/reader/full/research-of-etfs 13/28
RESEARCH OF ETFS AltaVista Research
www.etfresearchcenter.com 13
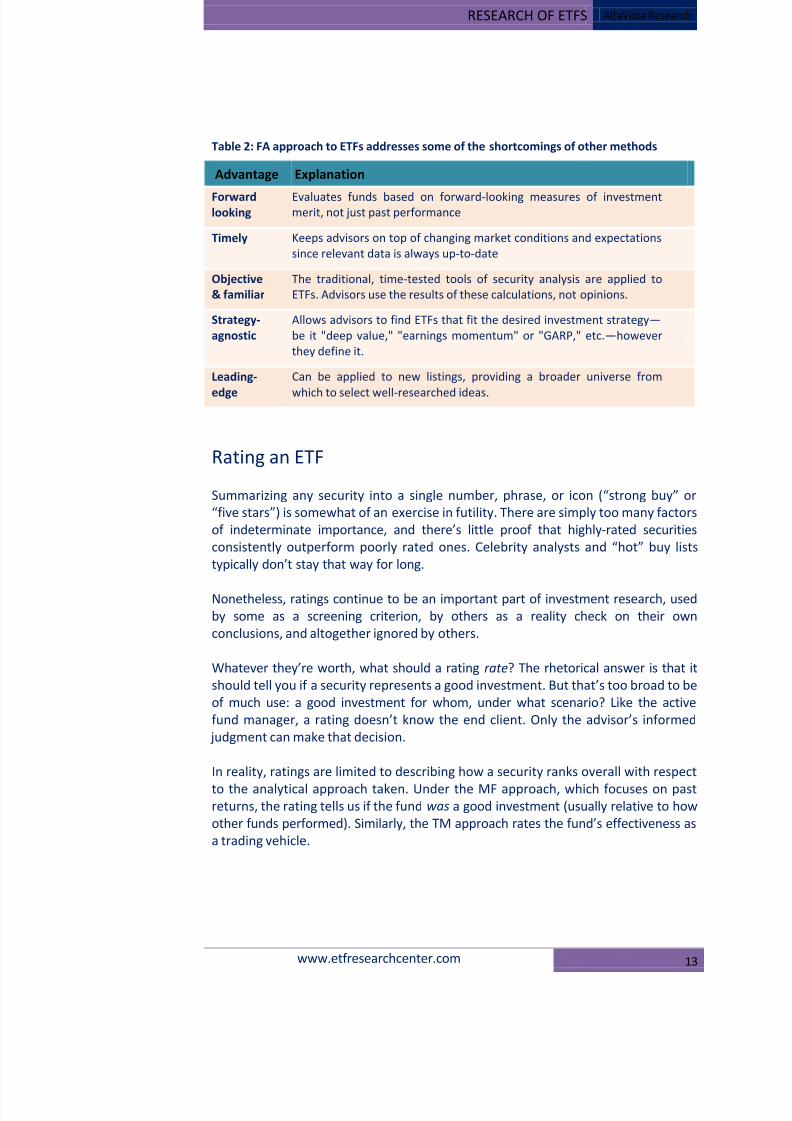
Table 2: FA approach to ETFs addresses some of the shortcomings of other methods
Advantage Explanation
Forwardlooking
Evaluates funds based on forward-looking measures of investmentmerit, not just past performance
Timely Keeps advisors on top of changing market conditions and expectations
since relevant data is always up-to-date
Objective
& familiar The traditional, time-tested tools of security analysis are applied to
ETFs. Advisors use the results of these calculations, not opinions.
Strategy-
agnostic Allows advisors to find ETFs that fit the desired investment strategy—
be it "deep value," "earnings momentum" or "GARP," etc.—however
they define it.
Leading-
edge
Can be applied to new listings, providing a broader universe from
which to select well-researched ideas.
Rating an ETF
Summarizing any security into a single number, phrase, or icon (“strong buy” or
“five stars”) is somewhat of an exercise in futility. There are simply too many factors
of indeterminate importance, and there’s little proof that highly-rated securities
consistently outperform poorly rated ones. Celebrity analysts and “hot” buy lists
typically don’t stay that way for long.
Nonetheless, ratings continue to be an important part of investment research, used
by some as a screening criterion, by others as a reality check on their own
conclusions, and altogether ignored by others.
Whatever they’re worth, what should a rating rate? The rhetorical answer is that it
should tell you if a security represents a good investment. But that’s too broad to be
of much use: a good investment for whom, under what scenario? Like the active
fund manager, a rating doesn’t know the end client. Only the advisor’s informed
judgment can make that decision.
In reality, ratings are limited to describing how a security ranks overall with respect
to the analytical approach taken. Under the MF approach, which focuses on pastreturns, the rating tells us if the fund was a good investment (usually relative to how
other funds performed). Similarly, the TM approach rates the fund’s effectiveness as
a trading vehicle.
8/8/2019 Research of ETFs
http://slidepdf.com/reader/full/research-of-etfs 14/28
AltaVista Research RESEARCH OF ETFS
14 www.etfresearchcenter.com
So it follows that since the purpose of fundamental analysis is to evaluate a
security’s investment potential, a rating consistent with the FA approach needs to
convey an impression of an ETF’s overall investment merit. We created the ALTAR
Score™ for this purpose.
Short for AltaVista Long Term Annual Return forecast, it relates profitability of firms
in the ETF to the stocks’ valuations. Specifically, it compares return on equity to
price-to-book value, two metrics directly related by financial theory (discussed in
more detail in Appendix A). The formula is:
ALTAR Score™ Formula
÷
−
where ROEavg is the average Return on Equity over the course of the business cycle
and P/BV is the price-to-book value multiple for the current forecast year (“FY1”).
Finally, we subtract fund fees, which diminish returns realized by investors but are
not typically a big driver of results.
The aim of this approach is to provide an estimate of returns from an owner’s
perspective. In other words, if an investor had enough money to buy these
businesses outright and operate them for his own benefit, what sort of rate of
return could he expect? Expressed as a percentage—higher being better—this is aninternal rate of return, with no forecast of how the market may value these
securities in the future.
While there are many other profitability and valuation metrics that can be
considered by the advisor, as a fundamental rating it offers several advantages over
“snapshot” metrics such as a price-to-earnings ratio since it facilitates comparisons
across industries and in different stages of the economic cycle, and relates growth
and profitability to valuations.
This is helpful because while an investor might make an informed judgment that a
Tech stock “deserves” a higher P/E than a bank stock, when extended to broader
indices—especially unfamiliar ones—this judgment becomes far less intuitive.
8/8/2019 Research of ETFs
http://slidepdf.com/reader/full/research-of-etfs 15/28
RESEARCH OF ETFS AltaVista Research
www.etfresearchcenter.com 15
Advantages vs. other rating methodologies
Beyond the difference in what it measures, the ALTAR Score™ addresses some of the short-comings inherent in other approaches to ratings, and in particular the MF
approach. Both would seem to be critical to the advisor’s role of acting portfolio
manager on behalf of clients.
Dynamic asset allocation
As we have seen, because the MF rating tells investors if a fund was a good
investment, it suggests increasing allocation to areas that have already risen
substantially, guaranteeing a “buy high, sell low” bias. In contrast, the ALTAR Score™
tends to dynamically allocate assets away from areas that may be overheated and
into areas that may be undervalued, because as prices rise, the ALTAR Score™ will
fall unless there is an offsetting increase in long-term profitability of the underlyingfirms.
Intrinsic measurement
Additionally, the ALTAR Score™ has the benefit of being an intrinsic measure; its
value for one ETF is independent of other funds that the rating firm places in the
same peer group (always a contentious issue). As a result, it facilitates comparisons
not only between funds in the same category but across categories. For example,
advisors can determine not only which are the most attractive funds within the
large cap and small cap categories, but also whether large caps in general appear
more attractive than small caps.
An illustration
Consider again the problem of choosing an emerging market ETF from the dozens
available. Assets of over $50 billion2
suggest that the iShares MSCI Emerging
Markets fund (EEM) is the default choice of many investors/advisors.
But is that really the best fund for a particular investor? What about the lesser
known SPDR S&P Emerging Markets ETF (GMM)? Or perhaps the fundamentally-
weighted WisdomTree Emerging Markets Equity Income fund (DEM)?
When DEM was new in July 2007 and had no trading history and therefore no rating
under the MF approach, Fundamental Analysis was able to give advisors clear
insights into the differences between it and EEM.
2As of November 8, 2010

8/8/2019 Research of ETFs
http://slidepdf.com/reader/full/research-of-etfs 16/28
AltaVista Research RESEARCH OF ETFS
16 www.etfresearchcenter.com
Beyond important differences in sector and geographic allocation, the Fundamental
Approach showed that firms in DEM had higher and more consistent levels of
profitability (Figure 4) over the course of the business cycle yet the stocks traded at
discount valuation multiples. As a result, DEM had a higher ALTAR Score™ of 10.8%compared with 8.9% for EEM.
Further, while at the time many investment strategists insisted that the rest of the
world’s economies would “decouple” from the U.S., FA showed estimates for
emerging markets firms trending lower.
Having this information, the advisor might well have decided to buck the popular
choice and select DEM instead, which from this analysis appeared to be a more
defensive, value-oriented option. They would have been richly rewarded for doing
so: since then DEM has returned 28.4% while EEM has only gained 6.7% (Figure 5).
Of course there is a lot more fundamental data available on which to base such
decisions, and fundamental analysis is rarely clear cut, typically involving trade-offs
of one sort or another. But at a minimum this allows advisors to make more
informed judgments about the suitability of both well-known and relatively obscure
ETFs for particular clients, thereby broadening the opportunities available and
increasing the value an advisor brings to the table.
Figure 4: Return on Equity
EEM vs. DEM, 2005-2011E Figure 5: Relative performance
EEM vs. DEM, July 2007-Sept. 2010
Source: AltaVista Research Source: Bloomberg
0%
5%
10%
15%
20%
25%
2005 2007 2009 2011E
EEM DEM
40
60
80
100
120
140
Jan- 07 Jan- 08 Jan- 09 Jan- 10 Jan- 11
DEM EEM

8/8/2019 Research of ETFs
http://slidepdf.com/reader/full/research-of-etfs 17/28
RESEARCH OF ETFS AltaVista Research
www.etfresearchcenter.com 17
Building ETF portfoliosCombining multiple securities into a disciplined, strategic portfolio is both art and
science. This is where advisors have the most opportunity to add value using ETFs,
since again advisors are in the unique position of having a complete view of the
client’s portfolio.
Modern Portfolio Theory
Unfortunately, many of the portfolio building tools available are based on the
mutual fund approach to ETF analysis, and as a result suffer from the same basic
deficiency of relying on past prices. In a nutshell, they “optimize” a portfolio to
produce the greatest returns for a given amount of risk based on the historical
relationship between the price movements of various securities.
This is known as “Modern Portfolio Theory,” based on the assumption that markets
are perfectly efficient. As readers are likely aware, MPT has taken some hits in
recent years as it misled investors into believing that housing prices could neverfall—because for over 100 years they never had—or that in any case other assets
would be unaffected because up until that point they hadn’t been highly correlated.
Until one day they were.
Although the academic debate will no doubt continue, what is undeniable is that
such models are only as good as they data on which they rely. In the case of ETFs
that data is often very limited, providing far less history on which to base an
Such models are only
as good as they data
on which they rely

8/8/2019 Research of ETFs
http://slidepdf.com/reader/full/research-of-etfs 18/28
AltaVista Research RESEARCH OF ETFS
18 www.etfresearchcenter.com
analysis. Because returns, volatility and covariance between securities all change
over time, portfolio optimizing software often produces wildly different
recommendations depending on length of history examined, periodicity and
weighting given to more recent observations.
This isn’t to say advisors should ignore history or the purpose of MPT, which is to
diversify away unnecessary risk. Rather, on a practical basis these tools have
diminished usefulness when applied to ETFs due to their limited history.
The Fundamental ‘Big Picture’
So how does an advisor build a competitive advantage using ETFs? By leveraging the
additional information that the FA approach provides to build and monitor a custom
portfolio designed specifically for a particular client’s investment strategy.
Most advisors have a strategic asset allocation plan for each client, setting a range
of possible allocations for each category. Within equities, a simple plan might call
for 40-60% U.S. stocks, including 0-20% in small-caps; and 40-60% in foreign stocks,
including 0-20% in emerging markets. It may also specify allocations for sectors.
However the tactical decision as to exactly what portion of assets to allocate to
small caps comes down not only to one’s view of small caps in general (such as
might be provided by a portfolio strategist’s report) but also to the particular fund(s)
that can represent this part of the portfolio. Each option would impact the portfolio
differently, not only in terms of the obvious sector and geographic allocations, but
also in terms of investment merit: even such well known ETFs as the iShares S&PSmall Cap 600 (IJR) and Russell 2000 (IWM) funds are dramatically different in terms
of the profitability and valuations of the underlying securities. Therefore, these
tactical decisions should not be made in isolation.
Fortunately, the fundamental data points for a given fund can be aggregated up to
the portfolio level in the same way we aggregated single-stock fundamentals up to
the fund level. Doing so can provide a clear and up-to-date picture of the portfolio
overall and therefore better information with which to manage it for clients.
8/8/2019 Research of ETFs
http://slidepdf.com/reader/full/research-of-etfs 19/28
RESEARCH OF ETFS AltaVista Research
www.etfresearchcenter.com 19
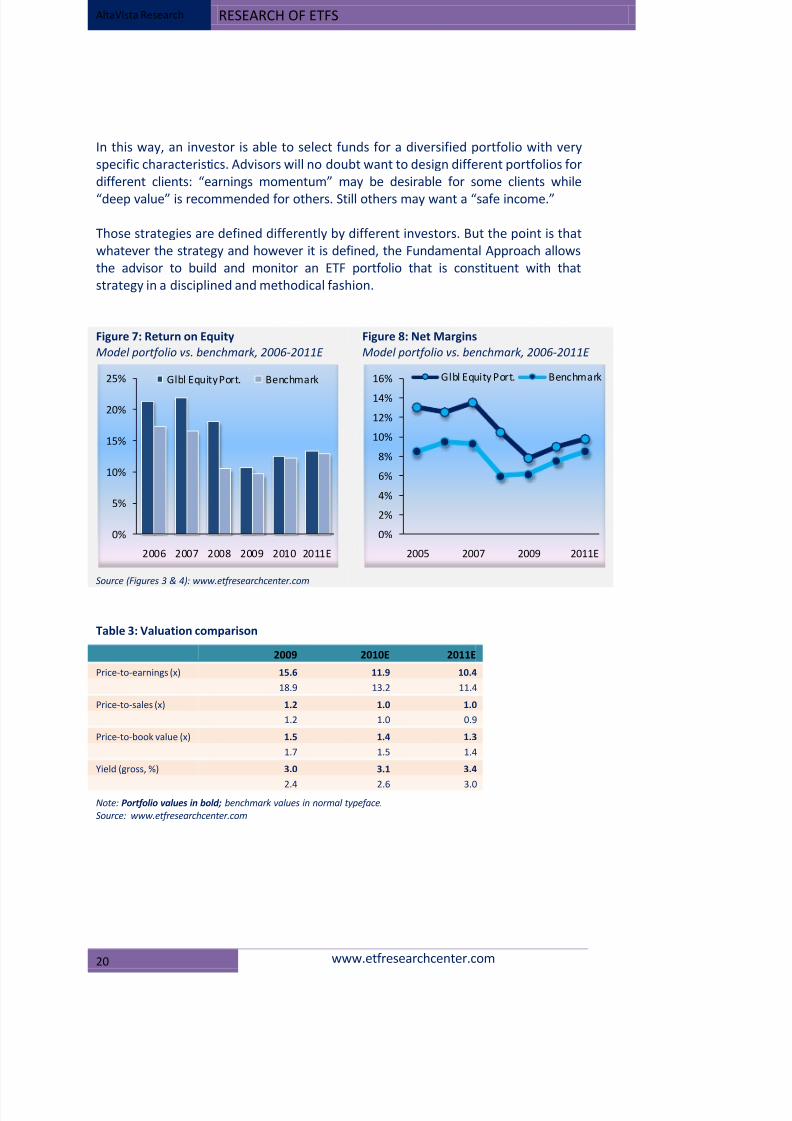
Illustration: global equity portfolio
A sample portfolio is the most effective way to illustrate the benefits. Belowdescribes the construction of a global equity portfolio with a relative value
strategy—i.e., with superior fundamentals and/or more attractive valuations than
the benchmark.
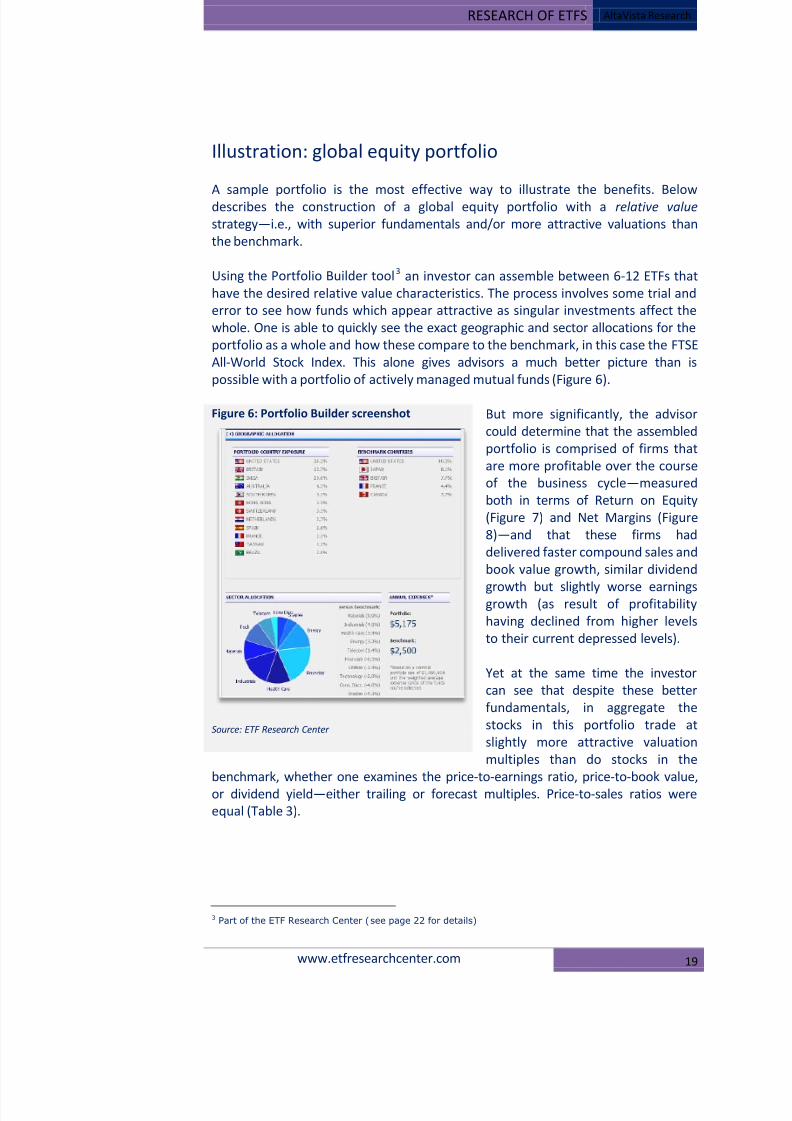
Using the Portfolio Builder tool3
Figure 6
an investor can assemble between 6-12 ETFs that
have the desired relative value characteristics. The process involves some trial and
error to see how funds which appear attractive as singular investments affect the
whole. One is able to quickly see the exact geographic and sector allocations for the
portfolio as a whole and how these compare to the benchmark, in this case the FTSE
All-World Stock Index. This alone gives advisors a much better picture than is
possible with a portfolio of actively managed mutual funds ( ).
But more significantly, the advisor
could determine that the assembled
portfolio is comprised of firms that
are more profitable over the course
of the business cycle—measured
both in terms of Return on Equity
(Figure 7) and Net Margins (Figure
8)—and that these firms had
delivered faster compound sales and
book value growth, similar dividend
growth but slightly worse earningsgrowth (as result of profitability
having declined from higher levels
to their current depressed levels).
Yet at the same time the investor
can see that despite these better
fundamentals, in aggregate the
stocks in this portfolio trade at
slightly more attractive valuation
multiples than do stocks in the
benchmark, whether one examines the price-to-earnings ratio, price-to-book value,
or dividend yield—either trailing or forecast multiples. Price-to-sales ratios were
equal (Table 3).
3 Part of the ETF Research Center (see page 22 for details)
Figure 6: Portfolio Builder screenshot
Source: ETF Research Center
8/8/2019 Research of ETFs
http://slidepdf.com/reader/full/research-of-etfs 20/28
AltaVista Research RESEARCH OF ETFS
20 www.etfresearchcenter.com
In this way, an investor is able to select funds for a diversified portfolio with very
specific characteristics. Advisors will no doubt want to design different portfolios for
different clients: “earnings momentum” may be desirable for some clients while
“deep value” is recommended for others. Still others may want a “safe income.”
Those strategies are defined differently by different investors. But the point is that
whatever the strategy and however it is defined, the Fundamental Approach allows
the advisor to build and monitor an ETF portfolio that is constituent with that
strategy in a disciplined and methodical fashion.
Figure 7: Return on Equity
Model portfolio vs. benchmark, 2006-2011E Figure 8: Net Margins
Model portfolio vs. benchmark, 2006-2011E
Source (Figures 3 & 4): www.etfresearchcenter.com
Table 3: Valuation comparison
2009 2010E 2011E
Price-to-earnings (x) 15.6 11.9 10.4
18.9 13.2 11.4
Price-to-sales (x) 1.2 1.0 1.0
1.2 1.0 0.9
Price-to-book value (x) 1.5 1.4 1.3
1.7 1.5 1.4
Yield (gross, %) 3.0 3.1 3.4
2.4 2.6 3.0
Note: Portfolio values in bold; benchmark values in normal typeface.
Source: www.etfresearchcenter.com
0%
5%
10%
15%
20%
25%
2006 2007 2008 2009 2010 2011E
Glbl Equity Port. Benchmark
0%
2%
4%
6%
8%
10%
12%
14%
16%
2005 2007 2009 2011E
Glbl Equity Port. Benchmark

8/8/2019 Research of ETFs
http://slidepdf.com/reader/full/research-of-etfs 21/28
RESEARCH OF ETFS AltaVista Research
www.etfresearchcenter.com 21
Putting it in practice
Adding value for clients
Indexing has grown rapidly as a piece of the investing pie. Many advisors have
embraced index investments like ETFs to one degree or another, but many also see
them as a threat, or simply aren’t sure how to best use them to add value forclients.
Advisors can add tremendous value by simply having tighter control over clients’
asset allocation. The central drawback to managed funds is that investors (and their
advisors) don’t really know what they own, forcing them to outsource asset
allocation to a degree. ETFs solve this dilemma thanks to their transparency, but
their prudent selection and monitoring is both different and more involved than
with managed funds.
Again, advisors are in a unique position to fill this role, further increasing their
importance in the process of financial planning and hopefully cementing a stronger
relationship with the client. There is a lot of information and analysis available onETFs, but much of it is ill-suited to assist advisors in this regard. However, a
fundamentally-driven approach can fill many of these gaps.
Fundamental Analysis provides advisors with a more complete picture and therefore
allows advisors to better build and monitor ETF portfolios tailored to the individual
needs of each client. Even for very basic tactical asset allocation decisions the FA
approach can help identify opportunities:
8/8/2019 Research of ETFs
http://slidepdf.com/reader/full/research-of-etfs 22/28
AltaVista Research RESEARCH OF ETFS
22 www.etfresearchcenter.com
o Are foreign equities relatively cheap versus a domestic (for example)?
o Enough to justify overweighting the category versus its strategic allocation?
o What if I use index B instead of index A?
The more granular the advisor wishes to be in identifying opportunities in relatively
unknown indices, the more valuable this information likely becomes. In short, the
reasons investors consider fundamental analysis in selecting single stocks are the
same reasons they should consider it for ETFs.
Adopting ETFs for widespread use in clients’ portfolios allows for clear and precise
control over asset allocation—a critical advantage over actively managed mutual
funds. But by using fundamental tools to evaluate ETFs advisors can do far more,
providing clients:
Forward-looking, unbiased due diligence on potential ETF investments
Fund selection tailored for any investment strategy
Day-to-day portfolio management to take advantage of changing opportunities
Full use of new and relatively unknown indices
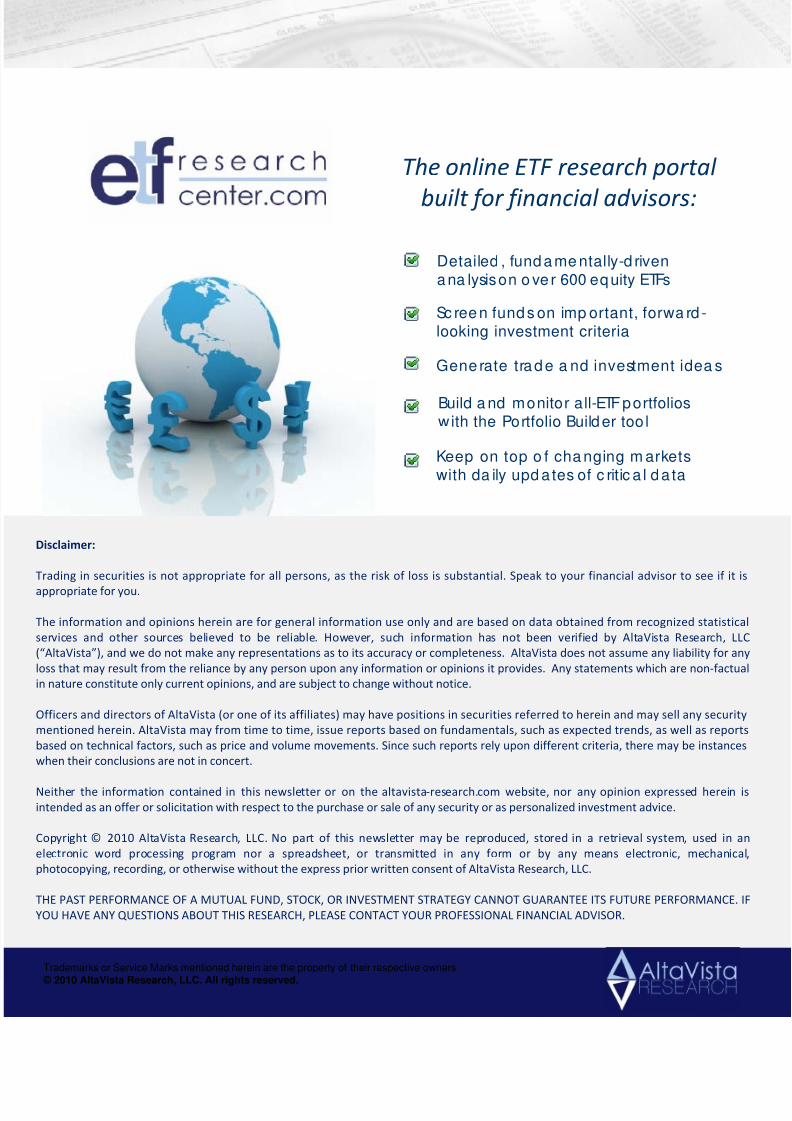
ETF Research Center
Hopefully we’ve made our case on the benefits of fundamental analysis of ETFs in
financial planning. Conducting the analysis however is time-consuming, tedious, and
expensive, given the thousands of securities in hundreds of ETFs available. Advisors
are unlikely to deliver a lot of value for clients doing this number-crunching
themselves, but rather by using the results of this analysis to better inform their
selection and monitoring of funds for clients.
The ETF Research Center (www.etfresearchcenter.com) is built to provide financial
advisors online access to AltaVista’s fundamentally-driven ETF research. The
purpose is to apply the traditional tools of security analysis to ETFs in a transparent,
unbiased manner, and show readers the results. It is up to the advisor—who after
all is the only one who knows the end client—to decide what is the best fit. The site
includes both free and subscription content.
Table 4: Tools and report on ETF Research Center
Online tools Written reports (PDF)
Fund details
Fund screening
Portfolio builder
Hedge finder
ETF Advisor (monthly)
ETF Spotlight (weekly)
Sector SPDR Analyzer (monthly)

8/8/2019 Research of ETFs
http://slidepdf.com/reader/full/research-of-etfs 23/28
RESEARCH OF ETFS AltaVista Research
www.etfresearchcenter.com 23
Register for the Advisor Directory
Although ETFs can be an empowering tool for investors, assuming theresponsibilities of portfolio manager is a full time job. Most individual investors have
better things to do, and some of our customers have asked us to recommend
advisors.
In an effort to handle these requests in a systematic and transparent way, we are
building an ETF Advisor Directory. The database will contain profiles and contact
information for advisors who make exchange traded funds a major focus of their
practice. An advisor profile can include details on the advisor’s services, investment
philosophy, and most importantly, how they incorporate ETFs into their practice and
any special expertise they can offer.
If you provided your name and email at www.etfresearchcenter.com beforedownloading this report you will receive an email invitation to register when the
database is open, scheduled for early Q1 2011. Otherwise you are encouraged to
check the website occasionally for an announcement. The database will be free both
for individual investors to search and for advisors to register (they do not need to be
subscribers to the ETF Research Center).
8/8/2019 Research of ETFs
http://slidepdf.com/reader/full/research-of-etfs 24/28
AltaVista Research RESEARCH OF ETFS
24 www.etfresearchcenter.com
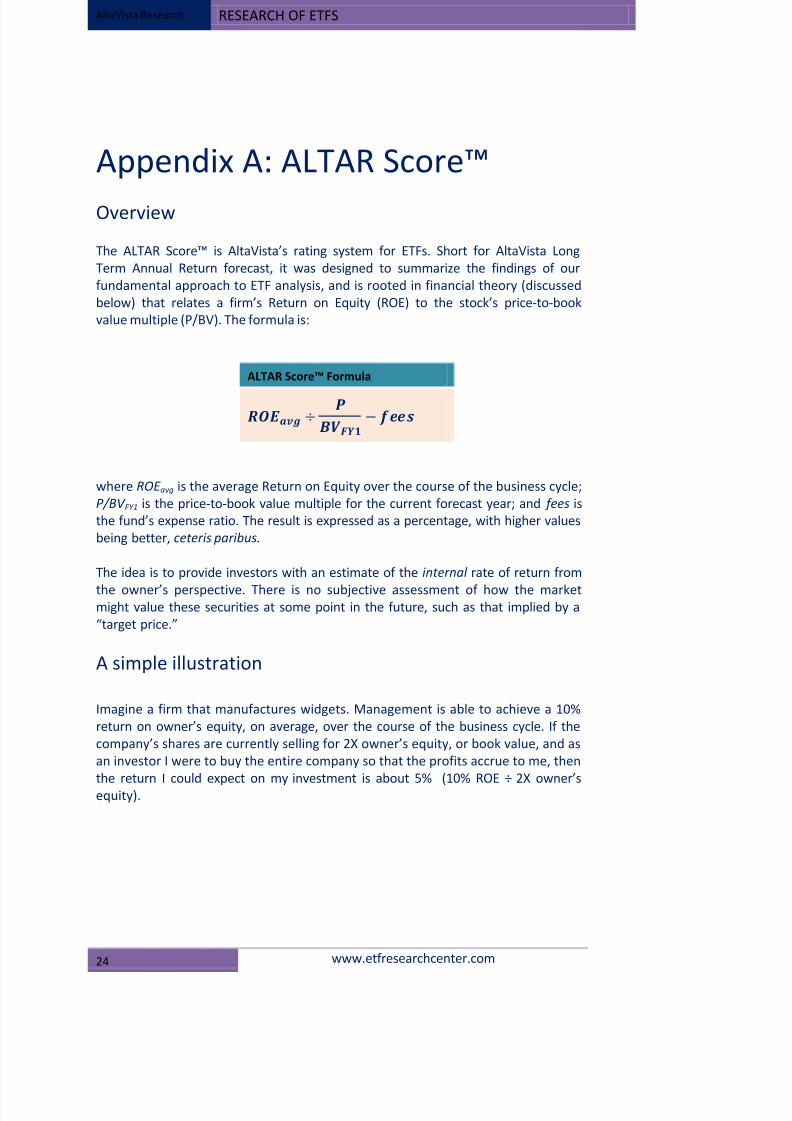
Appendix A: ALTAR Score™
Overview
The ALTAR Score™ is AltaVista’s rating system for ETFs. Short for AltaVista Long
Term Annual Return forecast, it was designed to summarize the findings of our
fundamental approach to ETF analysis, and is rooted in financial theory (discussed
below) that relates a firm’s Return on Equity (ROE) to the stock’s price-to-book
value multiple (P/BV). The formula is:
ALTAR Score™ Formula
÷
−
where ROE avg is the average Return on Equity over the course of the business cycle;
P/BV FY1 is the price-to-book value multiple for the current forecast year; and fees is
the fund’s expense ratio. The result is expressed as a percentage, with higher values
being better, ceteris paribus.
The idea is to provide investors with an estimate of the internal rate of return from
the owner’s perspective. There is no subjective assessment of how the marketmight value these securities at some point in the future, such as that implied by a
“target price.”
A simple illustration
Imagine a firm that manufactures widgets. Management is able to achieve a 10%
return on owner’s equity, on average, over the course of the business cycle. If the
company’s shares are currently selling for 2X owner’s equity, or book value, and as
an investor I were to buy the entire company so that the profits accrue to me, then
the return I could expect on my investment is about 5% (10% ROE ÷ 2X owner’s
equity).
8/8/2019 Research of ETFs
http://slidepdf.com/reader/full/research-of-etfs 25/28
RESEARCH OF ETFS AltaVista Research
www.etfresearchcenter.com 25
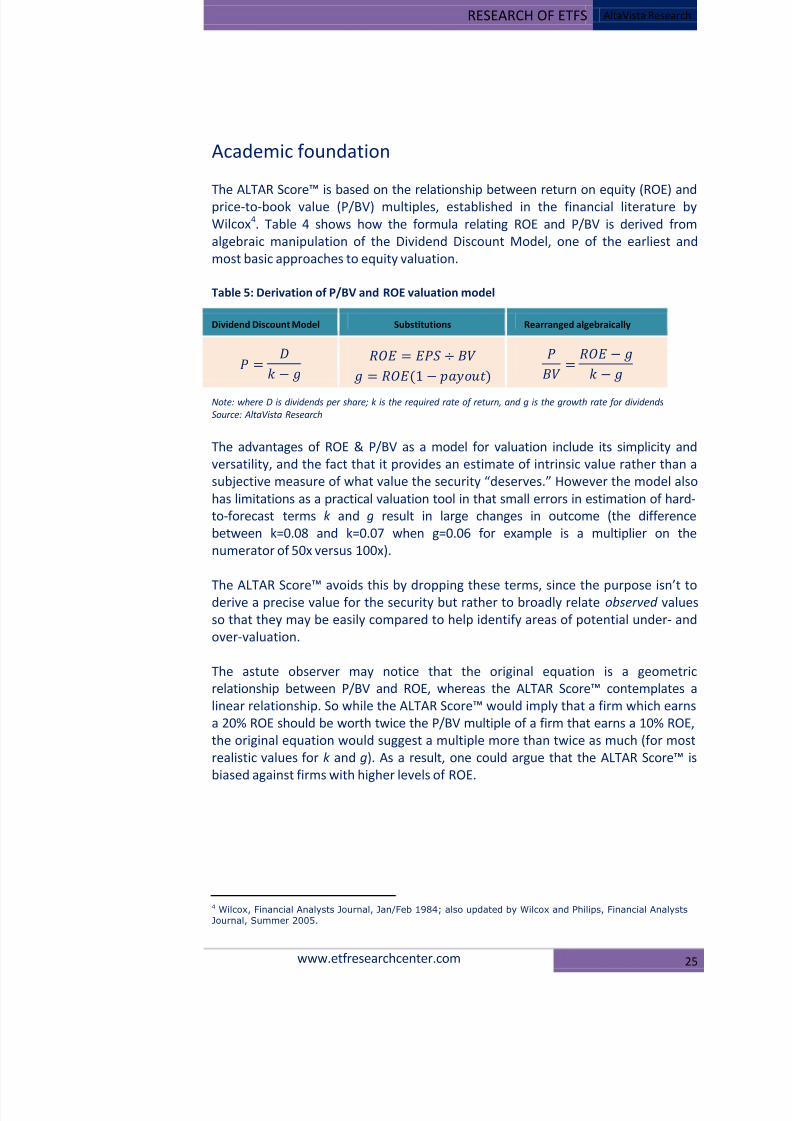
Academic foundation
The ALTAR Score™ is based on the relationship between return on equity (ROE) andprice-to-book value (P/BV) multiples, established in the financial literature by
Wilcox4 Table 4. shows how the formula relating ROE and P/BV is derived from
algebraic manipulation of the Dividend Discount Model, one of the earliest and
most basic approaches to equity valuation.
Table 5: Derivation of P/BV and ROE valuation model
Dividend Discount Model Substitutions Rearranged algebraically
=
−
= ÷
= (1− )
= −
−
Note: where D is dividends per share; k is the required rate of return, and g is the growth rate for dividends
Source: AltaVista Research
The advantages of ROE & P/BV as a model for valuation include its simplicity and
versatility, and the fact that it provides an estimate of intrinsic value rather than a
subjective measure of what value the security “deserves.” However the model also
has limitations as a practical valuation tool in that small errors in estimation of hard-
to-forecast terms k and g result in large changes in outcome (the difference
between k=0.08 and k=0.07 when g=0.06 for example is a multiplier on the
numerator of 50x versus 100x).
The ALTAR Score™ avoids this by dropping these terms, since the purpose isn’t toderive a precise value for the security but rather to broadly relate observed values
so that they may be easily compared to help identify areas of potential under- and
over-valuation.
The astute observer may notice that the original equation is a geometric
relationship between P/BV and ROE, whereas the ALTAR Score™ contemplates a
linear relationship. So while the ALTAR Score™ would imply that a firm which earns
a 20% ROE should be worth twice the P/BV multiple of a firm that earns a 10% ROE,
the original equation would suggest a multiple more than twice as much (for most
realistic values for k and g). As a result, one could argue that the ALTAR Score™ is
biased against firms with higher levels of ROE.
4 Wilcox, Financial Analysts Journal, Jan/Feb 1984; also updated by Wilcox and Philips, Financial Analysts
Journal, Summer 2005.

8/8/2019 Research of ETFs
http://slidepdf.com/reader/full/research-of-etfs 26/28
AltaVista Research RESEARCH OF ETFS
26 www.etfresearchcenter.com
While this is true in theory, in practice we’ve found that, through observations on
thousands of equities across all sectors, the line of best fit as determined by
regression analysis is typically a geometric equation with very low convexity (that is,
a very shallow bend) and in many cases is in fact a linear equation, meaning thedegree to which the ALTAR Score™ may be biased against high-multiple (i.e.,
“growth”) equities is small.
Lastly, the model rests on ROE that is constant (which is why we use average ROE to
estimate a reasonable value for this). In reality, of course, no firm or industry
maintains above-average returns forever, so in the long run a linear relationship
may in fact help correct some of the growth bias inherent in the theoretical model.
8/8/2019 Research of ETFs
http://slidepdf.com/reader/full/research-of-etfs 27/28
RESEARCH OF ETFS AltaVista Research
www.etfresearchcenter.com 27
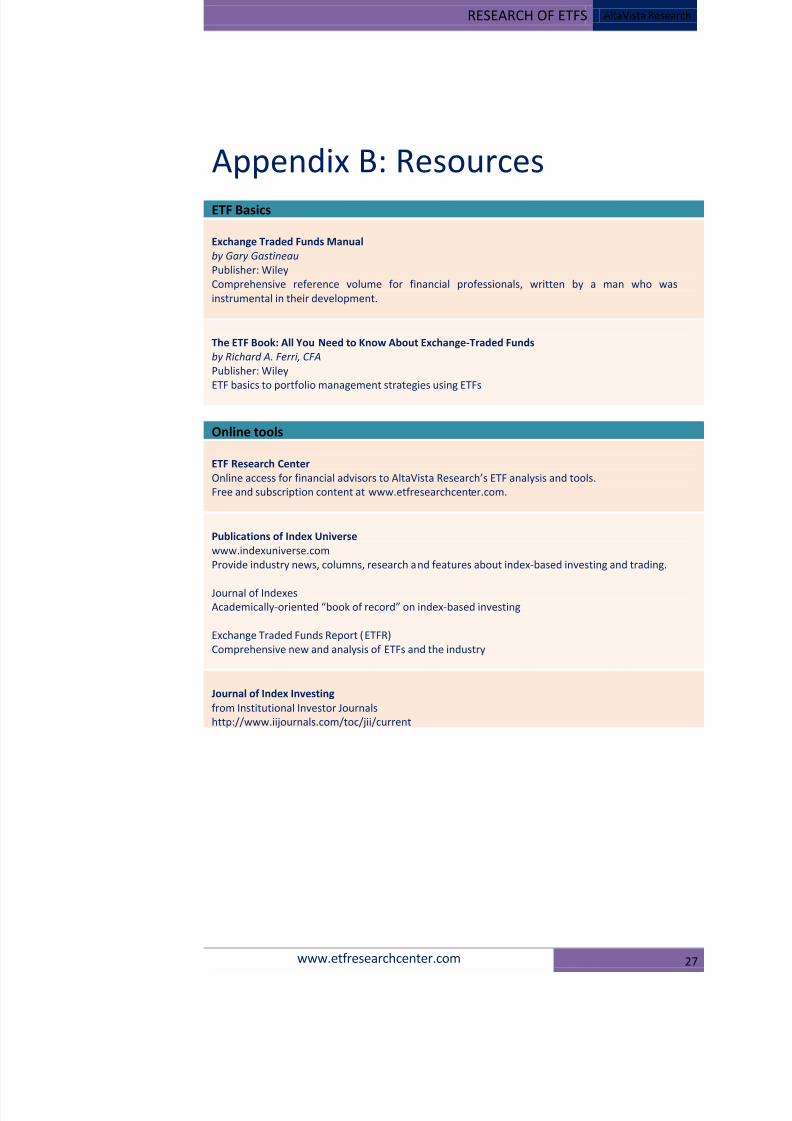
Appendix B: Resources
ETF Basics
Exchange Traded Funds Manual
by Gary Gastineau
Publisher: Wiley
Comprehensive reference volume for financial professionals, written by a man who was
instrumental in their development.
The ETF Book: All You Need to Know About Exchange-Traded Funds
by Richard A. Ferri, CFA
Publisher: Wiley
ETF basics to portfolio management strategies using ETFs
Online tools
ETF Research Center
Online access for financial advisors to AltaVista Research’s ETF analysis and tools.
Free and subscription content at www.etfresearchcenter.com.
Publications of Index Universe
www.indexuniverse.com
Provide industry news, columns, research and features about index-based investing and trading.
Journal of IndexesAcademically-oriented “book of record” on index-based investing
Exchange Traded Funds Report (ETFR)
Comprehensive new and analysis of ETFs and the industry
Journal of Index Investing
from Institutional Investor Journals
http://www.iijournals.com/toc/jii/current
8/8/2019 Research of ETFs
http://slidepdf.com/reader/full/research-of-etfs 28/28
Disclaimer:
Trading in securities is not appropriate for all persons, as the risk of loss is substantial. Speak to your financial advisor to see if it
appropriate for you.
The information and opinions herein are for general information use only and are based on data obtained from recognized statisti
services and other sources believed to be reliable. However, such information has not been verified by AltaVista Research, L
(“AltaVista”), and we do not make any representations as to its accuracy or completeness. AltaVista does not assume any liability for a
loss that may result from the reliance by any person upon any information or opinions it provides. Any statements which are non-fact
in nature constitute only current opinions, and are subject to change without notice.
Officers and directors of AltaVista (or one of its affiliates) may have positions in securities referred to herein and may sell any securi
mentioned herein. AltaVista may from time to time, issue reports based on fundamentals, such as expected trends, as well as repo
based on technical factors, such as price and volume movements. Since such reports rely upon different criteria, there may be instanc
when their conclusions are not in concert.
Neither the information contained in this newsletter or on the altavista-research.com website, nor any opinion expressed herein
intended as an offer or solicitation with respect to the purchase or sale of any security or as personalized investment advice.
Copyright © 2010 AltaVista Research, LLC. No part of this newsletter may be reproduced, stored in a retrieval system, used in
electronic word processing program nor a spreadsheet, or transmitted in any form or by any means electronic, mechanic
photocopying, recording, or otherwise without the express prior written consent of AltaVista Research, LLC.
THE PAST PERFORMANCE OF A MUTUAL FUND, STOCK, OR INVESTMENT STRATEGY CANNOT GUARANTEE ITS FUTURE PERFORMANCE.
YOU HAVE ANY QUESTIONS ABOUT THIS RESEARCH, PLEASE CONTACT YOUR PROFESSIONAL FINANCIAL ADVISOR.
Detailed , fundame ntally-d rivenana lysis on o ve r 600 equity ETFs
Sc reen funds on imp ortant, forwa rd -looking investment criteria
Generate trade a nd investment idea s
Keep on top o f cha nging m arketswith da ily upd ates of c ritic a l da ta
Build a nd monitor all-ETF portfolioswith the Portfolio Builder too l
The online ETF research portal
built for financial advisors: