Sustainable Investing with ETFs - The LANTERN Research · 3/31/2016 · Sustainable Investing with...
36
Sustainable Investing with ETFs Exposure to stocks and bonds of companies with high sustainability profiles UBS Asset Management UBS Exchange Traded Funds For qualified investors only November 2016
Transcript of Sustainable Investing with ETFs - The LANTERN Research · 3/31/2016 · Sustainable Investing with...

Sustainable Investing with ETFs
Exposure to stocks and bonds of companies with high sustainability profiles
UBS Asset Management UBS Exchange Traded Funds
For qualified investors only
November 2016

1
Table of contents
• The Big Picture of Sustainable Investing
• Sustainable Indexed Investing
• Portfolio Applications
• UBS ETF - Sustainable Value Proposition
• Appendix:
• MSCI ESG Scope of Research • MSCI World SRI Index Breakdowns

The Big Picture of Sustainable Investing
Section 1

3
Overarching ESG framework
Sustainable investing is founded on three pillars
Source: European Responsible Investing Fund Survey 2015, KPMG. UBS Asset Management. For illustration purpose only.
Sustainable Investing
Environmental Recognize companies that focus on offering products or services
that contribute to environmentally sustainable economy
Social Recognize companies that support
development of human capital, implement best production
practices and safety principles
Governance Recognize companies with strong
corporate governance
• Climate change
• Renewable and clean energy
• Low carbon
• Forestry investing
• Water investments
• Fossil fuel exclusion
• Social and community impact
• Solidarity funds
• Social entrepreneurship
• Microfinance investing
• Engagement investing
• Business ethics

4
Growing importance of sustainable investing
Global sustainable investments reached USD 21 trillion1
$8'758
$3'740
$589
$134
$40
$13'608
$6'572
$945
$180
$53
0 2'000 4'000 6'000 8'000 10'000 12'000 14'000 16'000
Europe
UnitedStates
Canada
Australia /New
Zealand
Asia
Proportion of SRI assets by region (USD bn)
2014 2012
+15% CAGR
+16% CAGR
+26% CAGR
+32% CAGR
+25% CAGR
Source: Global Sustainable Investment Review 2014. 1) Professionally managed assets in all the regions covered by Global Sustainable Investment Association member organizations, incl. public and private investments that consider environmental, social and governance (ESG) factors in portfolio selection and management. ESG factors aligned with GSIA.

5
UBS becomes a market leader in SRI ETFs in Europe
UBS ETF29.5%
BNP Paribas10.8%
Invesco1.8%
iShares51.2%
Lyxor6.7%
UBS SRI ETFs with fund volume of more than USD 1bn as of October 2016
UBS ETF15.1%
BNP Paribas19.7%
Invesco2.5%
iShares62.7%
UBS ETF19.8%
BNP Paribas13.2%
Invesco2.9%
iShares64.2%
UBS ETF38.5%
BNP Paribas9.9%Invesco
1.1%
iShares39.1%
Lyxor0.4%
Amundi11.0%
2015
EUR 1'360mn
2012
EUR 310mn
2013
EUR 400mn
2014
EUR 798mn
Source: Morningstar, UBS Asset Management.
Data as of end- March 2016.

Sustainable Indexed Investing
Section 2

7
Index solutions development truly innovative
Source: UBS Asset Management. For illustration purpose only.
Launch of Domini 400 Social Index
KLD Analytics
1990
Launch of global Dow
Jones Sustainability
Indexes
1999
Versatility
Evolution
Milestones in the history of the indexed Socially Responsible Investing
MSCI acquires RiskMetrics and KLD to incorporate
the ESG
2010
Launch of Calvert Social
Index
2000
MSCI introduces currency
hedged SRI indices
2013
Barclays and MSCI
introduce a fixed income and currency hedged SRI
indices
2015
Launch of FTSE4Good
Series
2000
S&P Dow Jones as well as Barclays and MSCI introduce
green bond indices
2014 Launch of S&P Global Water
Index
2007

8
UBS ETF partners up with the leading index providers
Source: MSCI. UBS Asset Management. As of May 2016.
1) ESG Rating of A or higher, see Appendix I; 2) ESG rating of BBB or higher; see Appendix I
MSCI ESG research is the key foundation in deriving SRI indices
• MSCI has 40+ years experience based on legacy ESG firms IRRC, KLD & Innovest
• One of the largest ESG providers with a global staff of over 200 supporting ESG research processes
• Assets tracking the MSCI ESG index family have grown globally to USD 45bn at the end of 2015
• MSCI is a signatory to the PRI (Principles for Responsible Investment)
• Broad offering for key equity as well as fixed income markets through a joint venture with Barclays
Parent Index
Asset Class
MSIC ESG
Research
ESG Equity & Fixed Income Index Families
UBS ETFs
MSCI ACWI Barclays Global
Aggregate
Equity Fixed Income
MSCI ESG Research EQ: 5'700 companies; FI: 9'000 issuers
and 350'000 securities
MSCI SRI Indexes1)
MSCI Sustainability Indexes
MSCI Global Norms Indexes
MSCI Environmental Indexes
Barclays MSCI SRI Indexes
Barclays MSCI Sustainability
Indexes2)
Barclays MSCI ESG Weighted Indexes
Barclays MSCI Green Bond Indexes
MSCI World SRI MSCI USA SRI MSCI Japan SRI MSCI Pacific SRI
MSCI Emerging Markets SRI MSCI EMU SRI MSCI UK IMI SRI Barclays MSCI Sustainability

9
MSCI SRI index methodology
Source: MSCI. UBS Asset Management. For illustration purpose.
1 See Appendix I
2 See Appendix I
3 MSCI UK IMI Extended SRI and Barclays MSCI Sustainable ESG
Rating min. BBB and ESG Score min. 2
4 Narrower universes (incl. UK, Emerging Markets,
EMU) apply the 5% capping rule on single issuer to ensure proper diversification.
ESG research with its three dimensions
Intangible Value Assessment (IVA)
MSCI ESG Rating1
37 ESG Issues
ESG Rating (AAA-CCC)
ESG Score (0-10)
30 ESG Indicators
ESG Controversies
MSCI ESG Score2
Targeting of 25% market cap
IVA ESG rating ≥ A
IM ESG score ≥ 4
MSCI Parent Index
(e.g. MSCI World)
MSCI SRI
Index
(e.g. MSCI SRI World4)
Step 1
Business Involvement Screening
Exclusion of certain activities
Step 2
Positive Screening3
A minimum IVA rating of A and Controversy Score of 4
Targeting of 25% market cap in each sector

10
1. Business Involvement Screening
Source: MSCI , UBS Asset Management. For illustration purpose.
MSCI SRI indices exclude companies that are involved in particular activities.
• Alcohol: All 'Producers' (Alcohol Revenue > USD 500 million OR Alcohol Revenue >5%)
• Tobacco: All 'Producers' AND All 'Distributors', 'Retailers' or 'Suppliers' that earn >15% of
revenues from Tobacco-related products.
• Gambling: Operations/ Gambling Support AND (Gambling Revenue > USD 500 million
or Gambling Revenue > 5%)
• Nuclear Power: Utility/ Nuclear Fuel Enrichment/ Nuclear Reactor Design/ Nuclear
Uranium Mine/ (Nuclear Supplier AND Nuclear Revenue >15%)
• Adult Entertainment: Any Producer + (Revenue > USD 500 million OR Revenue >5%)
• GMO: Involvement in GMO and earning any revenue from it
• Weapons: Revenue of >5% OR Weapons Revenue > USD 500 million
• Controversial Weapons: Landmine, Cluster Bomb, Depleted Uranium, Nuclear
Weapon Systems or Components, Bio-Chemical Weapons Systems or Components
Business Involvement
Exclusion of companies involved in particular activates:
Identifies the nature
and extent of
company business
activities to support
particular ESG
portfolio formation
process

11
2. Intangible Value Assessment (IVA) ESG Rating
ESG Rating1)
Environment • Climate Change • Carbon Emissions • Energy Efficiency • …
Rating of companies (AAA to CCC) based on the extensive list of 37 key issues
Social • Labour Management • Health and Safty • Social Opportunities • Human Capital • …
Governance • Corporate Behavior • Business Ethics • Anti-competitive
Practices • …
Source: MSCI , UBS Asset Management. For illustration purpose.
1) See Appendix I for the detail list.
Assessment of how well a company deals with ESG issues within the peer group
The ESG issues fall into three broad categories. Each GICS sector assigns different significance to issues reflecting their materiality, e.g.
• Carbon emission is mostly relevant for the Utilities and Materials sectors
• Water stress is critical in the Consumer Staples industry
• Health and safety fatalities have been mostly predominant in the Energy and Industrials sector
• Business ethics and money fraud issues have high meaning in the Financials and Industrials

12
ESG Rating Report Example
Source: MSCI ESG Manager. UBS Asset Management.
13
3. ESG Controversy Score
Source: MSCI , UBS Asset Management. For illustration purpose.
1) See Appendix I for the detail list.
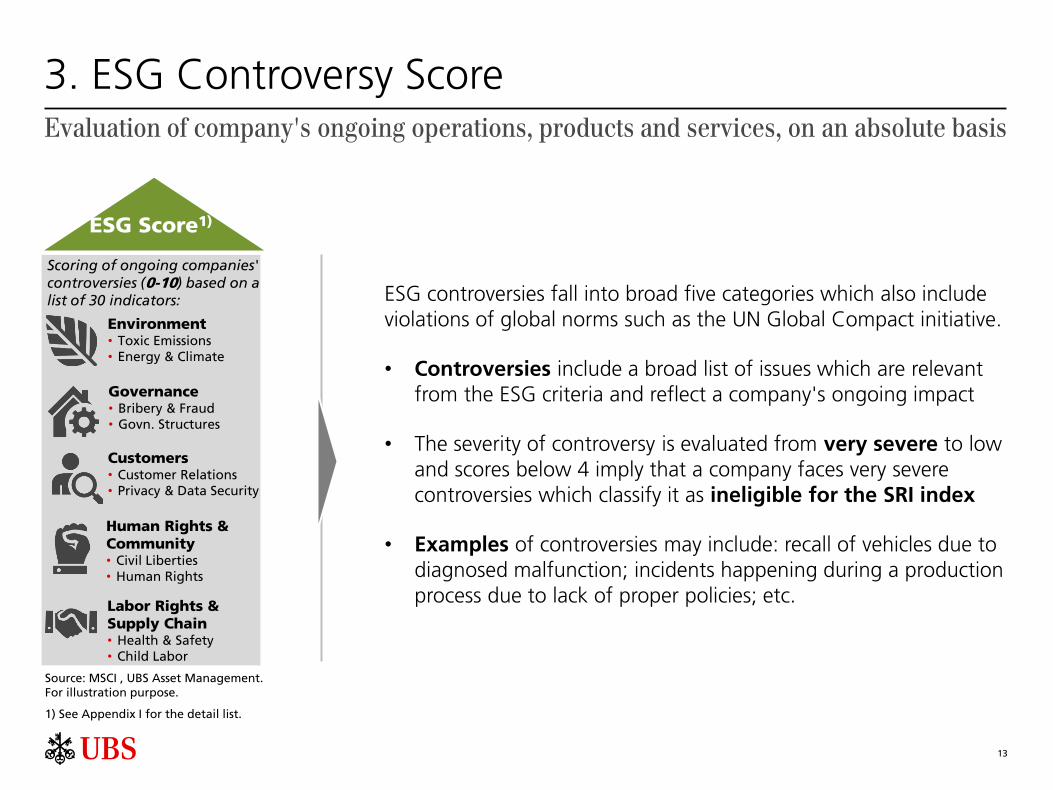
Evaluation of company's ongoing operations, products and services, on an absolute basis
ESG controversies fall into broad five categories which also include violations of global norms such as the UN Global Compact initiative.
• Controversies include a broad list of issues which are relevant from the ESG criteria and reflect a company's ongoing impact
• The severity of controversy is evaluated from very severe to low and scores below 4 imply that a company faces very severe controversies which classify it as ineligible for the SRI index
• Examples of controversies may include: recall of vehicles due to diagnosed malfunction; incidents happening during a production process due to lack of proper policies; etc.
ESG Score1)
Scoring of ongoing companies' controversies (0-10) based on a list of 30 indicators:
Environment • Toxic Emissions • Energy & Climate
Governance • Bribery & Fraud • Govn. Structures
Customers • Customer Relations • Privacy & Data Security
Human Rights & Community • Civil Liberties • Human Rights
Labor Rights & Supply Chain • Health & Safety • Child Labor

14
ESG Controversy Score Report Example
Source: MSCI ESG Manager. UBS Asset Management. Data as of 14 July 2016.

Portfolio Applications
Section 3

16
Why to add SRI investments to a portfolio?
ESG research addresses a wide-ranging number of ESG-related issues
Source: UBS Asset Management. For illustrative purpose only.
Can I reduce carbon exposure in my portfolio through the SRI investing?
Can I get more exposure to companies that consider efficient use of clean technologies or support renewable energy?
Are the companies I invest in committed to having the highest standards with regards to production safety and labour rights?
Do the companies I invest in respect human rights and civil liberties?
Are the companies in my portfolio known to be involved in any anti-competitive practices?
Is the management of these companies involved in any bribery or fraud cases?
E
S
G

17
A. Fostering human rights and labour rights
MSCI SRI indices have a higher Impact Monitor (Controversy) score
Among others the MSCI ESG Impact Monitor considers the below controversies and indicators:
1. Human Rights & Community:
Impact on Human Rights of Local Communities
Civil Liberties
Human Rights Concerns
2. Labour Rights & Supply Chain:
Child Labour
Collective Bargaining & Union
Discrimination & Workforce Diversity
Health & Safety
Labour Management Relations
Supply Chain Labour Standards
7
7.5
8
8.5
9
9.5
10
HumanRightsLocal
CommScore
HumanRights Civil
LibertiesScore
HumanRights
ConcernsScore
HumanRightsOtherScore
LaborRights
Child Score
LaborRights
DiversityScore
LaborRights Emp
Score
LaborRights MgtRel Score
LaborRightsLaborStandScore
LaborRightsOthersScore
MSCI Emerging Markets
7
7.5
8
8.5
9
9.5
10
HumanRightsLocal
CommScore
HumanRights Civil
LibertiesScore
HumanRights
ConcernsScore
HumanRightsOtherScore
LaborRights
Child Score
LaborRights
DiversityScore
LaborRights Emp
Score
LaborRights MgtRel Score
LaborRightsLaborStandScore
LaborRightsOthersScore
MSCI Emerging Markets SRI
Source: MSCI ESG Manager. UBS Asset Management. March 2016.

18
B. Lower carbon emissions (1/2)
MSCI SRI indices significantly reduce the carbon emissions across sectors
0
200
400
600
800
1'000
1'200
1'400
Utilities Energy Materials Industrials ConsumerStaples
ConsumerDiscretionary
Financials InformationTechnology
HealthCare
TelecomServices
MSCI USA Carbon Emissions (mn t CO2e)
Carbon Emission Scope 1 Carbon Emission Scope 2
0
10
20
30
40
50
60
70
80
Utilities Energy Materials Industrials ConsumerStaples
ConsumerDiscretionary
Financials InformationTechnology
HealthCare
TelecomServices
MSCI USA Socially Responsible Index Carbon Emissions (mn t CO2e)
Carbon Emission Scope 1 Carbon Emission Scope 2
The MSCI ESG Intangible Value Assessment caculates the carbon footprint at company level based on two dimensions:
Scope 1: All direct GHG emissions from sources owned or controlled by the company:
Fossil fuels burned on site
Entity-owned or leased vehicles
Scope 2: Indirect GHG emissions from consumption:
Electricity, heat, or steam
Transmission and distribution (T&D) losses associated with some purchased utilities
Source: MSCI ESG Manager. UBS Asset Management. March 2016.

19
B. Lower carbon emissions (2/2)
The MSCI SRI indices deliver a substantial relative reduction across carbon metrics1)
159'655
354'726
182'806
277'553
148'885
121'228
322'513
82'084
159'636
131'953111'268
86'988
50'648
128'965
0
100'000
200'000
300'000
400'000
MSCI World MSCI EmergingMarkets
MSCI Pacific MSCI EMU MSCI UK IMI MSCI USA MSCI Japan
Standard Socially Responsible
Total Carbon Emissions (tons CO2) -50.1%
212
354
293
227
139
211
260
116
171
130115
91 97107
0
100
200
300
400
MSCI World MSCI EmergingMarkets
MSCI Pacific MSCI EMU MSCI UK IMI MSCI USA MSCI Japan
Standard Socially Responsible
Carbon Intensity (tons CO2 / USD M sales)
Source: MSCI ESG Manager. UBS Asset Management. March 2016. 1) See Appendix III
-49.8%

20
-0.6
-0.4
-0.2
0.0
0.2
0.4
0.6
0.8
1.0
-6%
-4%
-2%
0%
2%
4%
6%
8%
10%
World World SRI USA USA SRI EMU EMU SRI Japan Japan SRI UK IMI UK IMI SRI Pacific Pacific SRI EM EM SRI
Since Sep. 28, 2007 inUSD
Since Sep. 28, 2007 inUSD
Since May 26, 2010 inEUR
Since Sep. 28, 2007 inJPY
Since May 31, 2011 inGBP
Since Sep. 28, 2007 iinUSD
Since May 31, 2011 inUSD
Outer Bars - annualized performance of TR net indices since inception (left-hand scale)Inner Bars - Sharpe ratios of TR net indices since inception (right-hand scale)
C. Improved portflio risk/return characteristics MSCI SRI indices have delivered better relative performance* on a risk-adjusted basis
Source: MSCI. UBS Asset Management. Data as of 30 April 2016. Past performance is not reliable indicator for future results. *) The meta-study "The Performance of Socially Responsible Investment" (by Emma Sjöström, Stockholm School of Economics) shows that of twenty‐one studies done recently in academia, five studies report that SRI outperforms conventional investments, seven conclude that SRI investment products have similar performance relative to their conventional peers. Three studies find that SRI generates inferior performance relative to its conventional peers. Finally, six studies report mixed results.

UBS ETF - Sustainable Value Proposition
Section 4

22
SRI investing grows considerably as ESG related issues create risks as well as opportunities and play a more and more significant role in the investment decision.
SRI investing has just become available in a passive format helping to fuel the growing demand for the SRI solutions
MSCI SRI benchmarks build on a rigorous and comprehensive ESG research combining all three SRI pillars
The MSCI SRI benchmark indices offer modest tracking error and solid risk-adjusted performance relative to their parent indices
UBS SRI ETFs allow cost efficiently and flexible to:
– Align the portfolio with personal values
– Create a positive impact on the environment
– Improve the portfolio risk/return
UBS offers a broad range of SRI ETFs and funds for both equity as well as fixed income markets, including currency hedged share classes
SRI - Doing well by doing good!
UBS SRI ETFs deliver financial and social return
Source: UBS Asset Management. UBS Asset Management is a signatory to the Principles for Responsible Investment (PRI)

23
UBS SRI ETFs: Consistent core building blocks
Unique and broad offering
Source: UBS Asset Management, June 2016.
Emerging Markets Equity
Fixed Income
Developed Markets
US
ASSET CLASS EXPOSURE SHARE CLASS
h GBP
h EUR
h CHF
USD
USD
USD
• Consistent core building blocks for Equity and Fixed Income
• Diversified equity exposure for Developed Markets (World, USA, EMU, Pacific, Japan, UK) and Emerging Markets
• Currency hedged share classes in CHF, EUR, USD and GBP
• European exchanges listings at SIX Swiss Exchange, LSE, Borsa Italiana, EuroNext and Xetra
• Physically replicated ETFs

24
UBS SRI ETFs: Sustainable value proposition
Data as of 28 October 2016. * Morningstar Sustainability Rating: Morningstar assigns Sustainability Ratings by ranking all scored funds within a Morningstar Category by their Portfolio Sustainability Scores. The ranked funds are then divided into five groups, based on a normal distribution and each fund receives a rating: "High" (top 10%), Above Average (next 22.5%); Average (next 35%); Below Average (next 22.5%) and Low (bottom 10%).
Fund Name FeeAuM
(CHFm)
NAV
Ccy.Replication Distribution ISIN Bloomberg
Morningstar
Sustainbility
Rating*
Socially Reponsible Equities
UBS ETF (LU) MSCI World Socially Responsible UCITS ETF 0.38% 210 USD Physical Yes LU0629459743 WSRUSA SW High
UBS ETF (LU) MSCI USA Socially Responsible UCITS ETF 0.33% USD Physical Yes LU0629460089 ASRUSA SW
UBS ETF (LU) MSCI USA Socially Responsible hedged CHF UCITS ETF 0.43% CHF Physical Yes LU1273642733 USSRT SW
UBS ETF (LU) MSCI USA Socially Responsible hedged CHF UCITS ETF 0.43% CHF Physical No LU1273641503 USSRS SW
UBS ETF (LU) MSCI USA Socially Responsible hedged EUR UCITS ETF 0.43% EUR Physical Yes LU1280303014 USSRF SW
UBS ETF (LU) MSCI EMU Socially Responsible UCITS ETF 0.28% EUR Physical Yes LU0629460675 ESREUA SW
UBS ETF (LU) MSCI EMU Socially Responsible hedged CHF UCITS ETF 0.38% CHF Physical Yes LU1273642907 EUSRT SW
UBS ETF (LU) MSCI EMU Socially Responsible hedged CHF UCITS ETF 0.38% CHF Physical No LU1273642816 EUSRS SW
UBS ETF (LU) MSCI EMU Socially Responsible hedged USD UCITS ETF 0.38% USD Physical No LU1280300770 EUSRU SW
UBS ETF (LU) MSCI Japan Socially Responsible UCITS ETF 0.40% JPY Physical Yes LU1230561679 JPSRF SW
UBS ETF (LU) MSCI Japan Socially Responsible hedged CHF UCITS ETF 0.50% CHF Physical Yes LU1273488475 JPSRT SW
UBS ETF (LU) MSCI Japan Socially Responsible hedged EUR UCITS ETF 0.50% EUR Physical No LU1273488715 JPSRE SW
UBS ETF (LU) MSCI Japan Socially Responsible hedged USD UCITS ETF 0.50% USD Physical No LU1273489440 JPSRU SW
UBS ETF (IE) MSCI United Kingdom IMI Socially Responsible UCITS ETF 0.28% GBP Physical Yes IE00BMP3HN93 UKSRF SW
UBS ETF (IE) MSCI UK IMI Socially Responsible hedged CHF UCITS ETF 0.38% CHF Physical Yes IE00BZ0RTB90 UKSRT SW
UBS ETF (IE) MSCI UK IMI Socially Responsible hedged EUR UCITS ETF 0.38% EUR Physical No IE00BYNQMK61 UKSRE SW
UBS ETF (IE) MSCI UK IMI Socially Responsible hedged USD UCITS ETF 0.38% USD Physical No IE00BYNQMM85 UKSRU SW
UBS ETF (LU) MSCI Pacific Socially Responsible UCITS ETF 0.40% 36 USD Physical Yes LU0629460832 PSRUSA SW High
UBS ETF (LU) MSCI Emerging Markets Socially Responsible UCITS ETF 0.53% 229 USD Physical Yes LU1048313891 MSRUSA SW High
Sustainable Corporate Bonds
UBS ETF (LU) Barclays MSCI US Liquid Corporates Sustainable UCITS ETF 0.20% USD Physical Yes LU1215461085 CBSUSF SW
UBS ETF (LU) Barclays MSCI US Liquid Corp. Sustainable hedged CHF UCITS ETF 0.25% CHF Physical Yes LU1215461754 CBSUST SW
UBS ETF (LU) Barclays MSCI US Liquid Corp. Sustainable hedged EUR UCITS ETF 0.25% EUR Physical No LU1215461325 CBSUSE SW
UBS ETF (LU) Barclays MSCI US Liquid Corp. Sustainable hedged GBP UCITS ETF 0.25% GBP Physical Yes LU1215461598 CBSUSH SW
High
High
High
High
High
302
90
107
30
85

Appendix I
ESG Scope of Research

26
Intangible Value Assessment (IVA) ESG Rating: AAA-CCC
Source: MSCI ESG Rating Methodology, April 2016.
MSCI ESG Rating process calculates each company’s exposure to key ESG risks based on a granular breakdown of a company’s businesses. To arrive at a final letter rating, the weighted averages of the Key Issue Scores are aggregated and companies’ scores are normalized by their GICS sub-industries. These assessments of company performance are not absolute but are explicitly intended to be relative to the standards and performance of a company’s industry peers.
By The MSCI ESG Rating process covers the following 10 themes capturing 37 ESG issues: 3 Pillars 10 Themes 37 ESG Key Issues
Environment
Climate Change
Carbon Emissions Energy Efficiency Product Carbon Footprint Financing Environmental Impact Climate Change Vulnerability
Natural Resources
Water Stress Biodiversity & Land Use Raw Material Sourcing
Pollution & Waste
Toxic Emissions & Waste Packaging Material & Waste Electronic Waste
Environmental Opportunities Opportunities in Clean Tech Opportunities in Green Building Opportunities in Renewable Energy
Social
Human Capital Labour Management Health & Safety Human Capital Development Supply Chain Labour Standards
Product Liability Product Safety & Quality Chemical Safety Financial Product Safety Privacy & Data Security Responsible Investment Health & Demographic Risk
Stakeholder Opposition Controversial Sourcing
Social Opportunities Access to Communications Access to Finance Access to Health Care Opportunities in Nutrition & Health
Governance
Corporate Governance Board Pay Ownership Accounting
Corporate Behavior Business Ethics Anti-Competitive Practices Corruption & Instability Financial System Instability

27
ESG Controversies Score: 0-10
Source: MSCI ESG Controversies Methodology, May 2016.
MSCI ESG Controversies is designed to provide timely and consistent assessments of ESG controversies involving publicly traded companies and fixed income issuers. The evaluation framework used in ESG Controversies is designed to be consistent with international norms represented in numerous widely accepted global conventions, including the Universal Declaration of Human Rights, the ILO Declaration on Fundamental Principles and Rights at Work, and the UN Global Compact. The MSCI ESG Impact Monitor covers the following five categories of stakeholder impact with 30 specific indicators:
Environment Social Governance
Environment Customers Human Rights and Community
Labour Rights and Supply Chain
Governance
• Biodiversity & Land Use
• Toxic Emissions & Waste
• Energy & Climate Change
• Water Stress • Operational Waste
(Non-Hazardous) • Supply Chain
Management • Other
• Anticompetitive Practices
• Customer Relations • Privacy & Data
Security • Marketing &
Advertising • Product Safety &
Quality • Other
• Impact on Local Communities
• Human Rights Concerns
• Civil Liberties • Other
• Labour Management Relations
• Health & Safety • Collective Bargaining
& Union • Discrimination &
Workforce Diversity • Child Labour • Supply Chain Labour
Standards • Other
• Bribery & Fraud • Governance Structures • Controversial
Investments • Other

28
ESG carbon investigation
Carbon emissions is one of the 37 key IVA ESG issues This issue evaluates the extent to which companies may face increased costs linked to carbon pricing or regulatory caps. Scores are based on exposure to GHG intensive businesses and emerging regulations; carbon reduction targets and mitigation programs; and carbon intensity over time and vs. peers.
Impact • Contribution to climate change
Risk / Opportunity • Increased costs linked to carbon pricing or trading • Facility retrofits or operational disruptions due to regulatory caps
Exposure Metrics • Extent to which companies operate in jurisdictions where regulations on carbon emissions are stringent or becoming more stringent
• Extent to which companies’ main business activities are carbon-intensive based on economic input-output model estimating total GHG emissions relative to sales
Metrics • Efforts to reduce exposure through comprehensive carbon policies and implementation mechanisms, including carbon reduction targets, production process improvements, and installation of depollution or emissions capture equipment, and/or switch to cleaner energy sources.
• Targets: i) Carbon Improvement Targets; ii) Aggressiveness of target in the context of current performance; iii)
Demonstrated track record of achieving carbon reduction targets • Migration: i) Programs or actions to reduce the emissions intensity of core operations • Performance: i) Trend in GHG emissions intensity; ii) GHG emissions intensity vs. peers (GHG Emissions - metric
tons CO2e and GHG Emissions Intensity - metric tons CO2e / USD million sales)
Sectors • Energy; Materials; Industrials; Consumer Staples; Financials; Utilities
Data Sources • Company disclosure and news searches • Carbon Disclosure Project (CDP) • Environment regulatory agencies (EPA, EEA) • Comprehensive Environmental Data Archive (CEDA) • Eurostat – Air Emissions Accounts
Source: MSCI. UBS Asset Management.

Appendix II
MSCI World SRI Index Breakdowns

30
MSCI World SRI
Source: MSCI, UBS Asset Management. Data as of 31 March 2016.
0% 5% 10% 15% 20%
AUT
NZL
PRT
IRL
ISR
NOR
FIN
BEL
SGP
DNK
ITA
SWE
HKG
ESP
NLD
AUS
CHE
DEU
CAN
FRA
GBR
JPN
USA
MSCI World SRI MSCI World
Country breakdown
0% 5% 10% 15% 20%
Utilities
TelecommunicationServices
Materials
Energy
ConsumerStaples
Industrials
HealthCare
ConsumerDiscretionary
InformationTechnology
Financials
MSCI World SRI MSCI World
Sector breakdown
55% 60%

31
MSCI World SRI
Source: MSCI, UBS Asset Management. Data as of 31 March 2016.
Top 15 Overweights Top 15 Underweights
0.0% 1.0% 2.0% 3.0% 4.0% 5.0% 6.0%
United Parcel Service
Allianz
Westpac
SAP
Nike
Vodafone
Novo Nordisk
McDonalds
Gilead Sciences
IBM
Cisco
Walt Disney
Roche Holdings
Procter & Gamble
Microsoft
MSCI World SRI MSCI World
0.0% 0.5% 1.0% 1.5% 2.0% 2.5%
Pfizer
Coca Cola
Jpmorgan Chase
Verizon Communications
Alphabet A
Alphabet C
Amazon Com
Wells Fargo & Co
Nestle
AT&T
General Electric
Johnson & Johnson
Exxon
Apple
MSCI World SRI MSCI World

32
UBS ETF – Contact Information
Raimund Müller, CIIA UBS AG Asset Management UBS Exchange Traded Fund Executive Director Head UBS ETF Switzerland & Liechtenstein Stockerstrasse 64 8002 Zurich, Switzerland Tel. +41-44-234 39 81 Mobile +41-79-588 21 53 [email protected]
Dominik Blunschi UBS AG Asset Management UBS Exchange Traded Fund Director UBS ETF Switzerland & Liechtenstein Stockerstrasse 64 8002 Zurich, Switzerland Tel. +41-44-234 88 06 Mobile: +41-79-587 89 71 [email protected]
Giovanna Cilia UBS AG Asset Management UBS Exchange Traded Fund Director UBS ETF Switzerland & Liechtenstein Stockerstrasse 64 8002 Zurich, Switzerland Tel. +41-44-234 53 68 Mobile +41-79-608 65 86 [email protected]
Adrian Steiner, CAIA UBS AG Asset Management UBS Exchange Traded Fund Associate Director UBS ETF Switzerland & Liechtenstein Stockerstrasse 64 8002 Zurich, Switzerland Tel. +41-44-234 55 39 Mobile +41-79-608 68 52 [email protected]

33
UBS AG Asset Management P.O. Box CH-8098 Zürich
Email [email protected]
www.ubs.com/etf
UBS ETF – Contact Information

34
UBS ETFs – Risk information
UBS ETFs investing in equities UBS Exchange Traded Funds invest in equities and may therefore be subject to high fluctuations in value. For this reason, an investment horizon of at least five years and corresponding risk tolerance and capacity are required. All investments are subject to market fluctuations. Every fund has specific risks, which can significantly increase under unusual market conditions. The fund’s assets are passively managed. As a result, the net asset value of the fund’s assets is directly dependent on the performance of the underlying equities. Losses that could be avoided via active management will not be offset.
UBS ETFs investing in Real Estate Funds The funds invest in real estate funds under Swiss law that are denominated in CHF and invest exclusively in Swiss properties. The price of the underlying fund units is not determined by estimates of market value but by investor supply and demand. All investments are subject to market fluctuations. Every fund has specific risks, which may increase considerably in unusual market conditions. Please contact your client advisor if you wish to receive further information on the investment risks associated with this product.
UBS ETFs investing in Metals The UBS Exchange Traded Fund investing in metals may be subject to considerable fluctuations in value. Investors therefore require an investment horizon of at least five years and corresponding risk tolerance and capacity. All investments are subject to market fluctuations. All funds have specific risks, which may significantly increase under unusual market conditions. The fund’s assets are passively managed. As a result, the net asset value of the fund’s assets is directly dependent on the performance of the underlying equities. Losses that could be avoided via active management will not be offset.
UBS ETFs investing in Oil and Commodities The Fund delivers the returns of a broadly diversified commodity index and may therefore be subject to high fluctuations in value. For this reason, an investment horizon of at least five years and corresponding risk tolerance and capacity are required. The returns payable on the Fund are dependant on payments received by the Fund from the Swap Counterparty under the terms of the Relevant Swap and, therefore, are subject to the credit risk of the Swap Counterparty. In the event that the Swap Counterparty defaults under the terms of the Relevant Swap, the Fund may suffer a loss. Assets are passively managed meaning losses that could be avoided via active management will not be offset. The net asset value of the Fund’s assets are materially dependent on the performance of the underlying investments. In case the currency of the product is different from your reference currency, the return may increase or decrease as a result of currency fluctuations. All investments are subject to market fluctuations. Every fund has specific risks, which can significantly increase under unusual market conditions.
UBS ETFs investing in HFR The Fund delivers the returns of a broadly diversified hedge fund index and may therefore be subject to high fluctuations in value. For this reason, an investment horizon of at least five years and corresponding risk tolerance and capacity are required. The returns payable on the Fund are dependent on payments received by the Fund from the Swap Counterparty under the terms of the Relevant Swap and, therefore, are subject to the credit risk of the Swap Counterparty. In the event that the Swap Counterparty defaults under the terms of the Relevant Swap, the Fund may suffer a loss. Assets are passively managed meaning losses that could be avoided via active management will not be offset. The net asset value of the Fund’s assets are directly dependent on the performance of the underlying investments. In case the currency of the product is different from your reference currency, the return may increase or decrease as a result of currency fluctuations
UBS ETFs investing in Fixed Income This UBS Exchange Traded Fund invests in government bonds of a single country and may therefore be subject to fluctuations in value. For this reason, an investment horizon of at least five years and corresponding risk tolerance and capacity are required. All investments are subject to market fluctuations. Every fund has specific risks, which can significantly increase under unusual market conditions. As a result, the net asset value of the fund's assets is directly dependent on the performance of the underlying index. Losses that could be avoided via active management will not be offset.
UBS ETFs investing in Multi Asset Portfolios The Fund is highly dynamic and may exhibit above-average potential growth and investment performance, depending on the economic environment. For this reason, an investment horizon of at least five years and corresponding risk tolerance and capacity are required. The Fund is exposed to the investment risk arising from the Reference Strategy underlying the Swaps. In the event that the swap counterparty defaults under the terms of the relevant swap, the Fund may suffer a loss. The Fund’s assets are passively managed. As a result, the net asset value of the Fund’s assets is materially dependent on the performance of the underlying investments. Losses that could be avoided via active management will not be offset. The Reference Strategy is a rules based Algorithm designed to target consistent returns but may not be effective in delivering such returns.

35
UBS ETFs – Disclaimer
For marketing and information purposes by UBS.
For qualified investors only. The information and opinions contained in this document have been compiled or arrived at based upon information obtained from sources believed to be reliable and in good faith, but is not guaranteed as being accurate, nor is it a complete statement or summary of the securities, markets or developments referred to in the document. UBS AG and / or other members of the UBS Group may have a position in and may make a purchase and / or sale of any of the securities or other financial instruments mentioned in this document.
UBS funds under Luxembourg and Irish law.
The MSCI indexes are the exclusive property of MSCI INC. (“MSCI”). MSCI and the MSCI index names are service mark(s) of MSCI or its affiliates and have been licensed for use for certain purposes by UBS AG (“UBS”). The financial securities referred to herein are not sponsored, endorsed, or promoted by MSCI, and MSCI bears no liability with respect to any such financial securities. The full prospectus of the UBS ETF Sicav contains a more detailed description of the limited relationship MSCI has with UBS and any related financial securities. No purchaser, seller or holder of this product, or any other person or entity, should use or refer to any MSCI trade name, trademark or service mark to sponsor, endorse, market or promote this product without first contacting MSCI to determine whether MSCI’s permission is required. Under no circumstances may any person or entity claim any affiliation with MSCI without the prior written permission of MSCI.
“Barclays Indices” are trademarks of Barclays Capital or its affiliates and have been licensed for use in connection with UBS Exchange Traded Funds. UBS Exchange Traded Funds based on Barclays Indices are not sponsored or endorsed by Barclays Capital or its affiliates. Neither Barclays Capital nor its affiliates make any representation regarding the advisability of investing in UBS Exchange Traded Funds.
Before investing in a product please read the latest prospectus carefully and thoroughly. Units of UBS funds mentioned herein may not be eligible for sale in all jurisdictions or to certain categories of investors and may not offered, sold or delivered in the United States. The information mentioned herein is not intended to be construed as a solicitation or an offer to buy or sell any securities or related financial instruments. Past performance is not a reliable indicator of future results. The performance shown does not take account of any commissions and costs charged when subscribing to and redeeming units. Commissions and costs have a negative impact on performance. If the currency of a financial product or financial service is different from your reference currency, the return can increase or decrease as a result of currency fluctuations. This information pays no regard to the specific or future investment objectives, financial or tax situation or particular needs of any specific recipient. The details and opinions contained in this document are provided by UBS without any guarantee or warranty and are for the recipient's personal use and information purposes only. This document may not be reproduced, redistributed or republished for any purpose without the written permission of UBS AG. Source for all data and charts (if not indicated otherwise): UBS Asset Management
This document contains statements that constitute “forward-looking statements”, including, but not limited to, statements relating to our future business development. While these forward-looking statements represent our judgments and future expectations concerning the development of our business, a number of risks, uncertainties and other important factors could cause actual developments and results to differ materially from our expectations.
Representative in Switzerland for UBS funds established under foreign law: UBS Fund Management (Switzerland) AG, P.O. Box, CH-4002 Basel. Paying agent: UBS Switzerland AG, Bahnhofstrasse 45, CH-8001 Zurich. Prospectuses, simplified prospectuses or key investor information, the articles of association or the management regulations as well as annual and semi-annual reports of UBS funds are available free of charge from UBS AG, P.O. Box, CH-4002 Basel or from UBS Fund Management (Switzerland) AG, P.O. Box, CH-4002 Basel.
© UBS 2016. The key symbol and UBS are among the registered and unregistered trademarks of UBS. All rights reserved.