red light green light - NWLC
56
red light green light State Child Care Assistance Policies 2016
Transcript of red light green light - NWLC

red lightgreen lightState Child Care Assistance Policies 2016

© 2016 National Women’s Law Center
ABOUT THE CENTERThe National Women’s Law Center is
a non-profit organization working to
expand the possibilities for women and
their families by removing barriers based
on gender, opening opportunities, and
helping women and their families lead
economically secure, healthy, and fulfilled
lives—with a special focus on the needs
of low-income women and their families.
ACKNOWLEDGEMENTSThe authors thank Nancy Duff Campbell,
Co-President of the National Women’s Law
Center, and Anna Chu, Vice President for
Income Security and Education, for their
review of and comment on the report, and
Beth Stover, Graphic and Web Designer
of the National Women’s Law Center, for
designing the report.
The authors are also grateful to the state
child care administrators who provided
the information on their states’ policies
included in this report.
This report would not have been possible
without the generous support for the
Center’s child care and early education
work provided by the Alliance for Early
Success, Ford Foundation, and Heising-
Simons Foundation.
The findings and conclusions of this
report are those of the authors alone,
and do not necessarily reflect the
opinions of these funders.
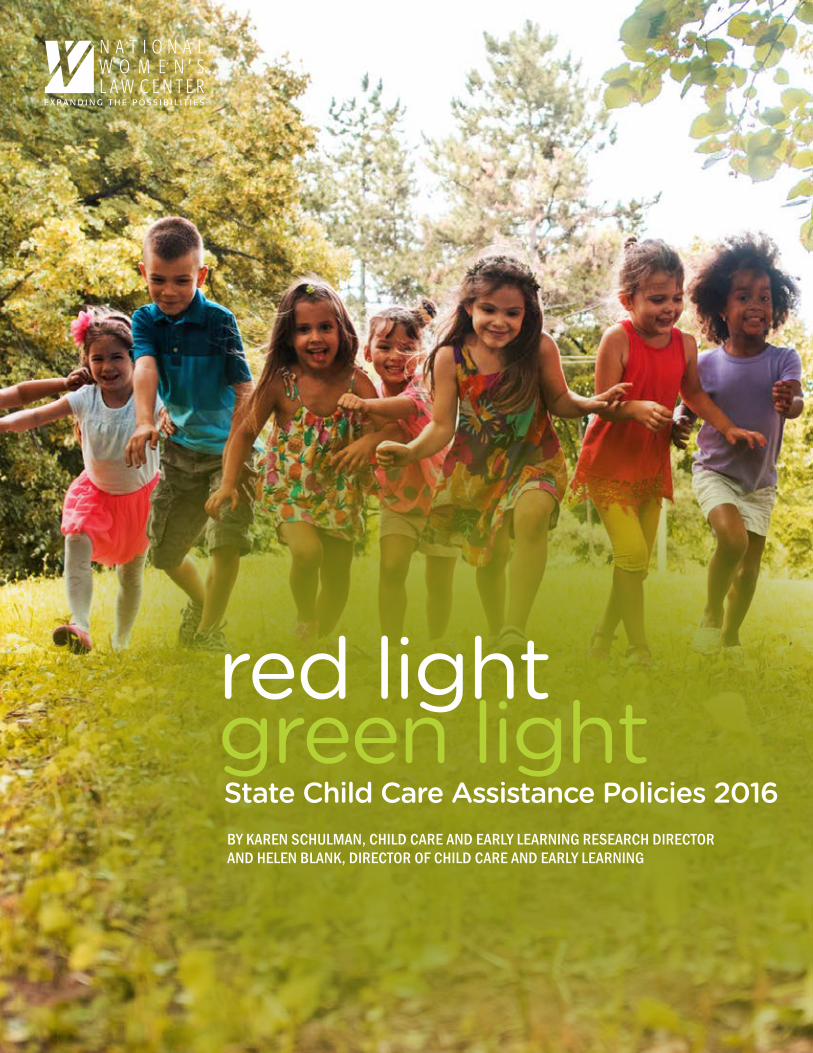
red lightgreen light State Child Care Assistance Policies 2016 by Karen Schulman, chIlD care anD early learnInG reSearch DIrecTOr anD helen blanK, DIrecTOr Of chIlD care anD early learnInG

table of contentsIntroduction 1
Methodology 4
Funding for Child Care Assistance for Low-Income Families 5
Income Eligibility Limits 6
Waiting Lists 7
Copayments 8
Reimbursement Rates 9
Eligibility for Families with Parents Searching for a Job 12
Looking Ahead: Developments Since February 2016 14
Conclusion 19
Endnotes 20
Tables 26
NatioNal WomeN’s laW CeNter
reD lIGhT Green lIGhT: STaTe chIlD care aSSISTance POlIcIeS 2016 1
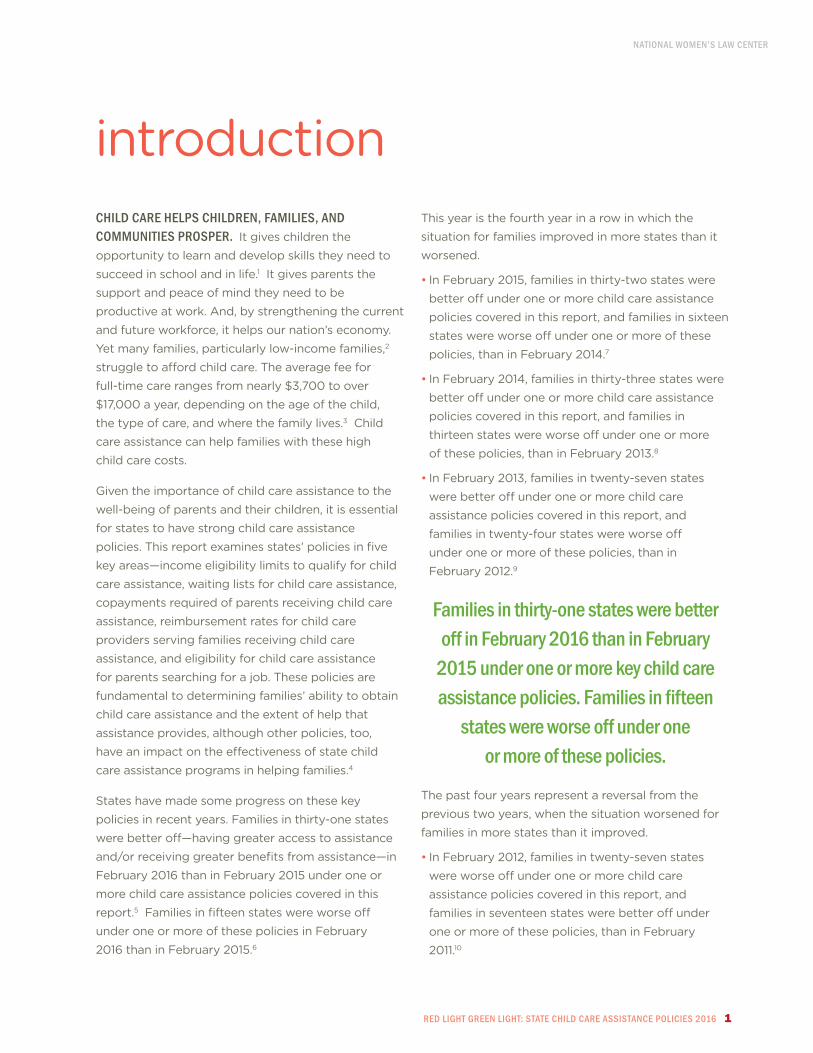
chIlD care helPS chIlDren, famIlIeS, anD cOmmunITIeS PrOSPer. It gives children the opportunity to learn and develop skills they need to succeed in school and in life.1 It gives parents the support and peace of mind they need to be productive at work. And, by strengthening the current and future workforce, it helps our nation’s economy. Yet many families, particularly low-income families,2 struggle to afford child care. The average fee for full-time care ranges from nearly $3,700 to over $17,000 a year, depending on the age of the child, the type of care, and where the family lives.3 Child care assistance can help families with these high child care costs.
Given the importance of child care assistance to the well-being of parents and their children, it is essential for states to have strong child care assistance policies. This report examines states’ policies in five key areas—income eligibility limits to qualify for child care assistance, waiting lists for child care assistance, copayments required of parents receiving child care assistance, reimbursement rates for child care providers serving families receiving child care assistance, and eligibility for child care assistance for parents searching for a job. These policies are fundamental to determining families’ ability to obtain child care assistance and the extent of help that assistance provides, although other policies, too, have an impact on the effectiveness of state child care assistance programs in helping families.4
States have made some progress on these key policies in recent years. Families in thirty-one states were better off—having greater access to assistance and/or receiving greater benefits from assistance—in February 2016 than in February 2015 under one or more child care assistance policies covered in this report.5 Families in fifteen states were worse off under one or more of these policies in February 2016 than in February 2015.6
This year is the fourth year in a row in which the situation for families improved in more states than it worsened.
• In February 2015, families in thirty-two states were better off under one or more child care assistance policies covered in this report, and families in sixteen states were worse off under one or more of these policies, than in February 2014.7
• In February 2014, families in thirty-three states were better off under one or more child care assistance policies covered in this report, and families in thirteen states were worse off under one or more of these policies, than in February 2013.8
• In February 2013, families in twenty-seven states were better off under one or more child care assistance policies covered in this report, and families in twenty-four states were worse off under one or more of these policies, than in February 2012.9
families in thirty-one states were better off in february 2016 than in february
2015 under one or more key child care assistance policies. Families in fifteen
states were worse off under one or more of these policies.
The past four years represent a reversal from the previous two years, when the situation worsened for families in more states than it improved.
• In February 2012, families in twenty-seven states were worse off under one or more child care assistance policies covered in this report, and families in seventeen states were better off under one or more of these policies, than in February 2011.10
introduction
NatioNal WomeN’s laW CeNter
2 reD lIGhT Green lIGhT: STaTe chIlD care aSSISTance POlIcIeS 2016
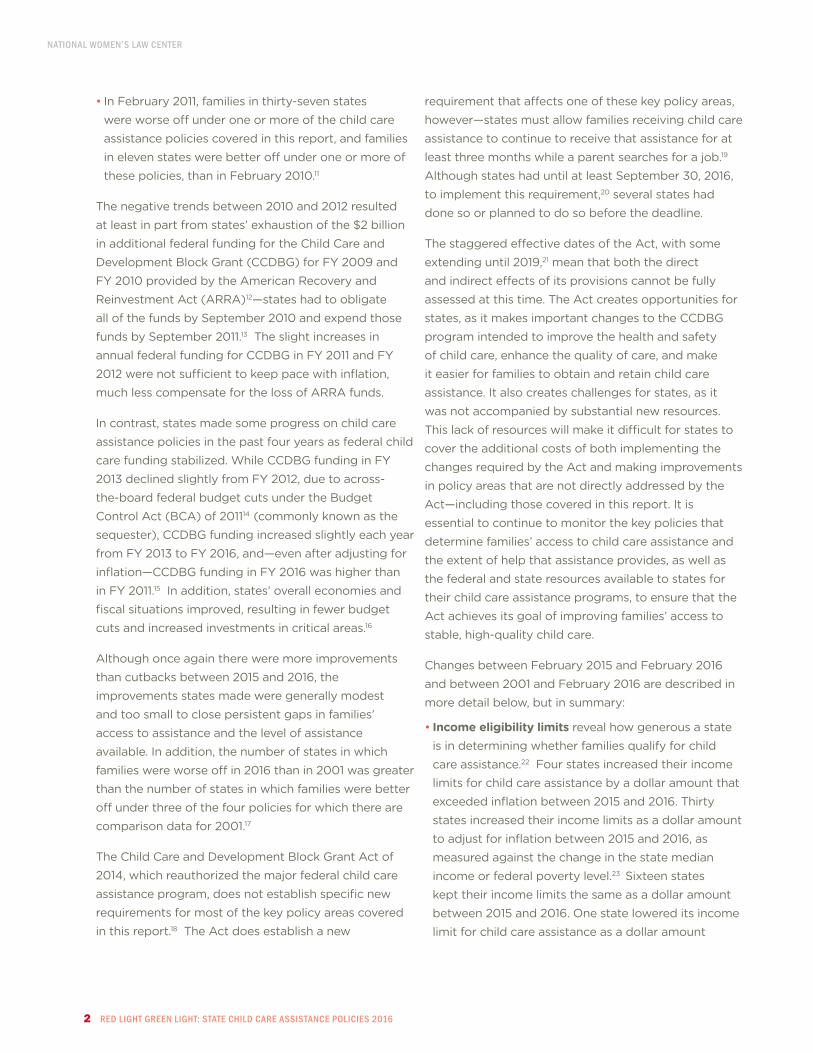
• In February 2011, families in thirty-seven states were worse off under one or more of the child care assistance policies covered in this report, and families in eleven states were better off under one or more of these policies, than in February 2010.11
The negative trends between 2010 and 2012 resulted at least in part from states’ exhaustion of the $2 billion in additional federal funding for the Child Care and Development Block Grant (CCDBG) for FY 2009 and FY 2010 provided by the American Recovery and Reinvestment Act (ARRA)12—states had to obligate all of the funds by September 2010 and expend those funds by September 2011.13 The slight increases in annual federal funding for CCDBG in FY 2011 and FY 2012 were not sufficient to keep pace with inflation, much less compensate for the loss of ARRA funds.
In contrast, states made some progress on child care assistance policies in the past four years as federal child care funding stabilized. While CCDBG funding in FY 2013 declined slightly from FY 2012, due to across- the-board federal budget cuts under the Budget Control Act (BCA) of 201114 (commonly known as the sequester), CCDBG funding increased slightly each year from FY 2013 to FY 2016, and—even after adjusting for inflation—CCDBG funding in FY 2016 was higher than in FY 2011.15 In addition, states’ overall economies and fiscal situations improved, resulting in fewer budget cuts and increased investments in critical areas.16
Although once again there were more improvements than cutbacks between 2015 and 2016, the improvements states made were generally modest and too small to close persistent gaps in families’ access to assistance and the level of assistance available. In addition, the number of states in which families were worse off in 2016 than in 2001 was greater than the number of states in which families were better off under three of the four policies for which there are comparison data for 2001.17
The Child Care and Development Block Grant Act of 2014, which reauthorized the major federal child care assistance program, does not establish specific new requirements for most of the key policy areas covered in this report.18 The Act does establish a new
requirement that affects one of these key policy areas, however—states must allow families receiving child care assistance to continue to receive that assistance for at least three months while a parent searches for a job.19 Although states had until at least September 30, 2016, to implement this requirement,20 several states had done so or planned to do so before the deadline.
The staggered effective dates of the Act, with some extending until 2019,21 mean that both the direct and indirect effects of its provisions cannot be fully assessed at this time. The Act creates opportunities for states, as it makes important changes to the CCDBG program intended to improve the health and safety of child care, enhance the quality of care, and make it easier for families to obtain and retain child care assistance. It also creates challenges for states, as it was not accompanied by substantial new resources. This lack of resources will make it difficult for states to cover the additional costs of both implementing the changes required by the Act and making improvements in policy areas that are not directly addressed by the Act—including those covered in this report. It is essential to continue to monitor the key policies that determine families’ access to child care assistance and the extent of help that assistance provides, as well as the federal and state resources available to states for their child care assistance programs, to ensure that the Act achieves its goal of improving families’ access to stable, high-quality child care.
Changes between February 2015 and February 2016 and between 2001 and February 2016 are described in more detail below, but in summary:
• Income eligibility limits reveal how generous a state is in determining whether families qualify for child care assistance.22 Four states increased their income limits for child care assistance by a dollar amount that exceeded inflation between 2015 and 2016. Thirty states increased their income limits as a dollar amount to adjust for inflation between 2015 and 2016, as measured against the change in the state median income or federal poverty level.23 Sixteen states kept their income limits the same as a dollar amount between 2015 and 2016. One state lowered its income limit for child care assistance as a dollar amount

NatioNal WomeN’s laW CeNter
reD lIGhT Green lIGhT: STaTe chIlD care aSSISTance POlIcIeS 2016 3
between 2015 and 2016. In twenty-six states, the income limits were lower as a percentage of the federal poverty level in 2016 than in 2001.24
• Waiting lists help reveal whether families who qualify for child care assistance actually receive it. Twenty states had waiting lists or frozen intake for child care assistance in 2016, slightly lower than the twenty-one states with waiting lists or frozen intake in 2015 and in 2001. Among the seventeen states that had waiting lists in both 2015 and 2016 and for which comparable data are available, the number of children on the waiting list decreased in seven states and increased in ten states between 2015 and 2016. Among the eleven states that had waiting lists in both 2001 and 2016 and for which there are comparable data, the number of children on the waiting list decreased in six states and increased in five states between 2001 and 2016.
• Parent copayment levels reveal whether low-income parents receiving child care assistance have significant out-of-pocket costs for child care. In all but a few states, families receiving child care assistance paid the same percentage of their income in copayments in 2016 as in 2015. For a family at 150 percent of poverty, copayments as a percentage of income increased in one state and decreased in three states. For a family at 100 percent of poverty, copayments as a percentage of income increased in three states and decreased in one state. In approximately one-quarter to half of the states, depending on income, individual families were required to pay more in copayments as a percentage of income in 2016 than the nationwide average amount that families who pay for child care spend on child care. In nearly half to over half of the states, depending on income, families paid a higher percentage of their income in copayments in 2016 than in 2001.
• Reimbursement rates reveal the extent to which families receiving child care assistance may be limited in their choice of child care providers and providers serving families receiving assistance may be limited in the quality of care they can offer to families. Eighteen states increased at least some of their reimbursement rates for providers serving families receiving child care
assistance, and no state reduced its reimbursement rates, between 2015 and 2016. Yet, only one state had reimbursement rates at the federally recommended level in 2016, the same number of states as in 2015, and a significant decrease from the twenty-two states with rates at the recommended level in 2001. Thirty-eight states had higher reimbursement rates for higher-quality care (tiered rates) in 2016—a slight decrease from thirty-nine states in 2015.25 However, in over three-quarters of these states, even the higher rates were below the federally recommended level in 2016.
• Eligibility policies for parents searching for work reveal whether families can receive child care assistance while a parent seeks employment, so as to avoid disrupting a child’s care arrangement and have child care available as soon as the parent finds a job. Forty-eight states allowed families receiving child care assistance to continue receiving it while a parent searched for a job in 2016, two more states than in 2015. Between 2015 and 2016, five of these states increased the length of time families could receive child care assistance while a parent searched for a job. Fourteen states allowed families not receiving child care assistance to qualify for assistance while a parent searched for a job in 2016, two more states than in 2015.26
although there were more improvements than cutbacks between 2015 and 2016,
the improvements states made were generally modest and too small to close
persistent gaps in families’ access to child care assistance and the level
of assistance available.
NatioNal WomeN’s laW CeNter
4 reD lIGhT Green lIGhT: STaTe chIlD care aSSISTance POlIcIeS 2016
methodology
The naTIOnal WOmen’S laW cenTer cOllecTeD The DaTa In ThIS rePOrT from state child care administrators in the fifty states and the District of Columbia (counted as a state in this report). The Center sent the state child care administrators a survey in the spring of 2016 requesting data on policies as of February 2016 in five key areas—income eligibility limits, waiting lists, parent copayments, reimbursement rates, and eligibility for child care assistance for parents searching for a job. The survey also asked state administrators to report on any policy changes that the state had made since February 2015 or expected to make after February 2016 in each of the five areas. The survey questions were largely the same as in previous years, although there were additional questions about policy changes in response to the CCDBG Act of 2014; the data collected from these additional questions will be used for a separate analysis. Center staff contacted state administrators for follow-up information as necessary. The Center obtained supplementary information about states’ policies from documents available on state agencies’ websites.
The Center collected the 2015 data used in this report for comparison purposes through a similar process and analyzed these data in the Center’s October 2015 report, Building Blocks: State Child Care Assistance Policies 2015. The Children’s Defense Fund (CDF) collected the 2001 data used in this report and analyzed these data in CDF’s report, State Developments in Child Care, Early Education and School-Age Care 2001. CDF staff collected the data through surveys and interviews with state child care advocates and verified the data with state child care administrators. The CDF data reflect policies in effect as of June 1, 2001, unless otherwise indicated. The Center uses 2001 as a basis for comparison because it was the year between the peak year for Temporary Assistance for Needy Families (TANF) funding for child care, FY 2000, and what was the peak year for CCDBG funding, FY 2002, until FY 2010, when ARRA provided a temporary boost in CCDBG funding (see the section below on funding for child care assistance).

NatioNal WomeN’s laW CeNter
reD lIGhT Green lIGhT: STaTe chIlD care aSSISTance POlIcIeS 2016 5
funding for child care assistance for low-income families
TOTal feDeral funDInG fOr chIlD care aSSISTance haS DeclIneD SInce 2001. The primary source of funding for child care assistance is the federal CCDBG program. CCDBG funding was $5.678 billion in FY 2016.27 CCDBG funding in FY 2016 was higher than funding in FY 2015 even after adjusting for inflation ($5.446 billion in FY 2016 dollars).28 However, CCDBG funding in FY 2016 was significantly lower than in FY 2010, when ARRA boosted funding, even before adjusting for inflation—$6.044 billion (including the additional $2 billion in CCDBG funding for states to obligate in FY 2009 and FY 2010 provided through ARRA, assuming $1 billion of ARRA funds each year for FY 2009 and FY 2010),29 or $6.770 billion in FY 2016 dollars.30 The FY 2010 level represented a peak for CCDBG, exceeding the previous peak for CCDBG funding after adjusting for inflation ($6.582 billion in FY 2016 dollars31), which occurred in FY 2002. However, the ARRA funding that contributed to the FY 2010 peak funding level was temporary.
Another important source of child care funding is the TANF block grant. States may transfer up to 30 percent of their TANF block grant funds to CCDBG, or use TANF funds directly for child care without first transferring the money. States’ use of TANF dollars for child care (including both transfers and direct funding) was $2.570 billion in FY 2015 (the most recent year for which data are available),32 below the high of $3.966 billion in FY 200033 even without adjusting for inflation. (In FY 2016 dollars, use of TANF funds for child care was $2.615 billion in FY 2015 compared to $5.749 billion in FY 2000.34)
Total federal child care funding from CCDBG and TANF in FY 2016, assuming use of TANF funds was the same as the FY 2015 inflation-adjusted amount, was $8.293 billion, which was significantly below funding in FY 2001 after adjusting for inflation —$11.355 billion in FY 2016 dollars.35

NatioNal WomeN’s laW CeNter
6 reD lIGhT Green lIGhT: STaTe chIlD care aSSISTance POlIcIeS 2016
income eligibility limits
a famIly’S acceSS TO chIlD care aSSISTance DePenDS On a STaTe’S IncOme elIGIbIlITy lImIT. The family’s ability to obtain child care assistance is affected not only by a state’s income limit in a given year, but also by whether the state adjusts the limit for inflation each year so that the family does not become ineligible for assistance simply because its income keeps pace with inflation.
Between 2015 and 2016, approximately two-thirds of the states increased their income eligibility limits as a dollar amount by enough to keep pace with or exceed inflation, as measured against the change in the federal poverty level or state median income, depending on which benchmark the state used.36 However, nearly one-third of the states did not increase their income limits, and one state reduced its income limit. Between 2001 and 2016, most states increased their income limits as a dollar amount; however, slightly over half of the states reduced their income limits as a dollar amount or did not increase their income limits sufficiently to keep pace with inflation, as measured against the change in the federal poverty level.37 Moreover, over three-quarters of the states had income limits at or below 200 percent of poverty in 2016.
•Four states increased their income eligibility limits by a dollar amount that exceeded inflation between 2015 and 2016 (see Table 1a).38
•Thirty states increased their income eligibility limits as a dollar amount to adjust for inflation between 2015 and 2016, including twenty-seven states that adjusted for one year of inflation,39 as well as three states that adjusted for two years of inflation to make up for previous years in which they had not adjusted for inflation.40
•Sixteen states kept their income eligibility limits the same as a dollar amount between 2015 and 2016.
• One state lowered its income eligibility limit as a dollar amount between 2015 and 2016.41
• Forty-six states increased their income eligibility limits as a dollar amount between 2001 and 2016 (see Table 1b). In thirteen of these states, the increase was great enough that the income limit was higher as a percentage of the federal poverty level in 2016 than in 2001. In twelve of these states, the increase was great enough that the income limit stayed the same, or nearly the same, as a percentage of the federal poverty level in 2016 as in 2001.42 However, in twenty-one of these states, the increase was not sufficient to keep pace with the federal poverty level, so the income limit was lower as a percentage of the federal poverty level in 2016 than in 2001.
• Five states lowered their income eligibility limits as a dollar amount between 2001 and 2016. In these states, the income limit decreased as a percentage of the federal poverty level, bringing to twenty-six the total number of states in which the income limit failed to keep pace with the increase in the federal poverty level between 2001 and 2016.
•A family with an income above 100 percent of the federal poverty level ($20,160 a year for a family of three in 2016) could qualify for child care assistance in all states in 2016. However, a family with an income above 150 percent of poverty ($30,240 a year for a family of three in 2016) could not qualify for assistance in seventeen states. A family with an income above 200 percent of poverty ($40,320 a year for a family of three in 2015) could not qualify for assistance in a total of thirty-nine states. Yet, in most communities across the country, a family needs an income equal to at least 200 percent of poverty to meet its basic needs, including housing, food, child care, transportation, health care, and other necessities, based on a study by the Economic Policy Institute.43

NatioNal WomeN’s laW CeNter
reD lIGhT Green lIGhT: STaTe chIlD care aSSISTance POlIcIeS 2016 7
waiting lists
even If famIlIeS are elIGIble fOr chIlD care aSSISTance, They may nOT neceSSarIly receIve IT. Instead, their state may place eligible families on a waiting list or freeze intake (turn away eligible families without adding their names to a waiting list). Families on the waiting list may wait a long time to receive child care assistance, or may never receive it. Families on the waiting list must make extremely difficult choices. According to several studies,44 many of these families struggle to pay for reliable, good-quality child care along with other necessities, or use low-cost—and frequently low-quality—care. Some families simply cannot afford child care at all, which can make it impossible for parents to work.
In 2016, approximately three-fifths of the states were able to serve eligible families who applied for child care assistance without placing any on waiting lists or freezing intake, but nearly two-fifths of the states had waiting lists or frozen intake for at least some families applying for assistance. The number of states with waiting lists or frozen intake in 2016 was slightly lower than the number in 2015 or 2001. However, among states that had waiting lists in both years, more states’ waiting lists increased than decreased between 2015 and 2016. In contrast, slightly more states’ waiting lists decreased than increased between 2001 and 2016.45
The amount of time families spend on the waiting list for child care assistance ranges widely across states, from as little as a few weeks or months to as much as a year or more.
• Twenty states had waiting lists or frozen intake in 2016,46 compared to twenty-one states in 2015 and in 2001 (see Table 2).
• Of the twenty states that had waiting lists or frozen intake in both 2015 and 2016, seven states had shorter waiting lists in 2016 than in 2015, and ten states had longer waiting lists. In the remaining three states with waiting lists or frozen intake in both 2015 and 2016, it was not possible to compare the length of waiting lists based on the available data.
• Of the fifteen states that had waiting lists or frozen intake in both 2001 and 2016, six states had shorter waiting lists in 2016 than in 2001, and five states had longer waiting lists. In the remaining four states with waiting lists or frozen intake in both 2001 and 2016, it was not possible to compare the length of waiting lists based on the available data.
• Among the ten states with waiting lists that reported data on the length of time families spent on the waiting list for 2016, the average length of time families spent on the waiting list before receiving child care assistance was less than six months in four states,47 between six months and a year in three states,48 and more than a year in three states.49 Among the eight states that reported data for both years, the average length of time on the waiting list was shorter in 2016 than in 2015 in three states, the same in 2016 as in 2015 in two states, and longer in 2016 than in 2015 in three states.50
In 2016, nearly two-fifths of the states had waiting lists or frozen intake for at least some families applying for assistance.
NatioNal WomeN’s laW CeNter
8 reD lIGhT Green lIGhT: STaTe chIlD care aSSISTance POlIcIeS 2016
copayments
mOST STaTeS requIre famIlIeS receIvInG chIlD care aSSISTance to contribute toward their child care costs based on a sliding fee scale that is designed to charge progressively higher copayments to families at progressively higher income levels. Some states also take into account the cost of care used by a family in determining the amount of the family’s copayment. Copayment levels are important because if they are high, they can create a significant financial strain for families or may discourage families from participating in the child care assistance program.
This report analyzes state copayment policies by considering two hypothetical families: a family of three with an income at 100 percent of the federal poverty level and a family of three with an income at 150 percent of the federal poverty level.51 In all but a few states, families paid the same percentage of their income in copayments in 2016 as in 2015. In only one to three states, depending on income, families paid a higher percentage of their income in copayments in 2016 than in 2015, and in only one to three states, families paid a lower percentage of their income in copayments in 2016 than in 2015. However, in nearly half to over half of the states, depending on income, families paid a higher percentage of their income in copayments in 2016 than in 2001.
Many states set relatively high copayments in 2016. In approximately one-quarter to half of the states, depending on income, a family was required to pay more in copayments as a percentage of income than the nationwide average amount that families who pay for child care (including those who receive child care assistance and those who do not) spent on child care—7.2 percent of income.52
• In one state, copayments for a family of three at 150 percent of poverty53 increased as a percentage of income between 2015 and 2016 (see Table 3a). In thirty-six states, copayments remained the same as
a percentage of income. In three states, copayments decreased as a percentage of income. In four states, a family at 150 percent of poverty was eligible for child care assistance in 2016 but not 2015, and in seven states, a family at 150 percent of poverty was not eligible in either 2015 or 2016.54
• In twenty-five states, copayments for a family of three at 150 percent of poverty55 increased as a percentage of income between 2001 and 2016. In five states, copayments remained the same as a percentage of income. In thirteen states, copayments decreased as a percentage of income. In five states, a family at 150 percent of poverty was eligible for child care assistance in 2001 but not 2016, in one state, a family at 150 percent of poverty was eligible in 2016 but not 2001, and in two states, a family at 150 percent of poverty was not eligible in either 2001 or 2016.
• In three states, copayments for a family of three at 100 percent of poverty increased as a percentage of income between 2015 and 2016 (see Table 3b). In forty-seven states, copayments remained the same as a percentage of income. In one state, copayments decreased as a percentage of income.
• In twenty-eight states, copayments for a family of three at 100 percent of poverty increased as a percentage of income between 2001 and 2016. In ten states, copayments remained the same as a percentage of income. In thirteen states, copayments decreased as a percentage of income.
• In twenty-six states, the copayment for a family of three at 150 percent of poverty was above $181 per month (7.2 percent of income) in 2016. In an additional seven states, a family at this income level was not eligible for child care assistance.
• In thirteen states, the copayment for a family of three at 100 percent of poverty was above $121 per month (7.2 percent of income) in 2016.

NatioNal WomeN’s laW CeNter
reD lIGhT Green lIGhT: STaTe chIlD care aSSISTance POlIcIeS 2016 9
reimbursement rates
STaTeS SeT reImburSemenT raTeS fOr chIlD care PrOvIDerS who care for children receiving child care assistance. The reimbursement rate is a ceiling on the amount the state will pay providers, and a provider will be reimbursed at that rate if the provider charges private-paying parents a fee that is equal to or greater than the rate. If a provider charges private-paying parents a fee that is below the reimbursement rate, the state will reimburse the provider an amount equal to the private-pay fee. Reimbursement rates may vary by geographic region, age of the child, type of care, and other factors.
In 2016, just one state set its reimbursement rates at the 75th
percentile of current market rates, a sharp decline from 2001, when
twenty-two states set their reimbursement rates at this level.
Reimbursement rates help determine whether child care providers have sufficient resources to sustain their businesses, offer salaries high enough to attract and retain qualified staff, have low child-staff ratios, maintain facilities, and buy materials and supplies for activities that encourage children’s learning and development. Inadequate reimbursement rates deprive child care providers of the resources needed to offer high-quality care and may discourage high-quality providers from enrolling families who receive child care assistance.
Federal regulations recommend, but do not mandate, that rates be set at the 75th percentile of current market rates,56 a rate that is designed to allow families access to 75 percent of the providers in their
communities. In 2016, just one state set its reimbursement rates at the 75th percentile of current market rates, the same number of states that set their rates at this recommended level in 2015, and a sharp decline from 2001, when twenty-two states set their reimbursement rates at this level.57 In 2016, the remaining fifty states set their reimbursement rates below the 75th percentile of current market rates, including many states that set their rates significantly below the 75th percentile. In addition, over two-fifths of the states had not updated their reimbursement rates in the previous two years. Without regular updates to reimbursement rates to at least keep pace with increases in the cost of care, the gap between reimbursement rates and the 75th percentile of current market rates expands.
When the reimbursement rate is below the fee a child care provider charges private-paying parents, over three-quarters of the states allow providers to ask parents receiving child care assistance to cover the difference (beyond any required copayment). Although this approach may prevent child care providers from losing income, it shifts the financial burden to low-income families who struggle to afford the additional charge.
• One state set its reimbursement rates at the 75th percentile of current market rates (rates from 2014 or 2015) in 2016 (see Table 4a).58 This was the same as the number of states that set their reimbursement rates at this level in 2015 (see Table 4b). However, it was substantially lower than the number of states—twenty-two—that set their reimbursement rates at this level in 2001.
•Twenty-eight states increased at least some of their reimbursement rates between 2014 and 2016,59 including eighteen states that increased their rates between 2015 and 2016.60 No state reduced its rates between 2014 and 2016. The remaining twenty-three

NatioNal WomeN’s laW CeNter
10 reD lIGhT Green lIGhT: STaTe chIlD care aSSISTance POlIcIeS 2016
states did not update their reimbursement rates between 2014 and 2016. All states except one updated their reimbursement rates between 2001 and 2016.
•In thirty-one states, reimbursement rates for center care for a four-year-old in 2016 were at least 20 percent below the 75th percentile of market rates (based on the state’s most recent market survey for which it reported data) for this type of care (see Table 4c).61
• In twenty-two states, reimbursement rates for center care for a one-year-old in 2016 were at least 20 percent below the 75th percentile of market rates (based on the state’s most recent market survey for which it reported data) for this type of care.62
• Thirty-nine states allowed child care providers to charge parents receiving child care assistance the difference between the reimbursement rate and the fee that the provider charged private-paying parents if the reimbursement rate was lower in 2016—the same number of states as in 2015.63
Thirty-eight states had higher reimbursement rates (tiered rates) for child care providers that met higher-quality standards in 2016,64 one fewer state than in 2015.65 Some states had a single higher reimbursement rate; other states had progressively higher reimbursement rates for progressively higher levels of quality. Tiered reimbursement rates can offer child care providers incentives and support to improve the quality of their care. However, a minimal rate differential may not cover the additional costs entailed in raising quality sufficiently to qualify for a higher rate. These costs include expenses for additional staff in order to reduce child-staff ratios, increased salaries for staff with advanced education in early childhood development, staff training, facilities upgrades, and/or new equipment and materials. Yet, in more than three-quarters of states with tiered rates, the highest rate fell below the 75th percentile of current market rates. In over two-fifths of the states with tiered rates, the highest reimbursement rate was also less than 20 percent above the base rate.
• Thirty-eight states paid higher reimbursement rates for higher-quality care in 2016, a slight decrease from thirty-nine states in 2015 (see Table 4d).66 While most of these states had tiered rates that applied across different age groups, one state only paid tiered rates for providers caring for children from two years of age to kindergarten entry67 and one state only paid tiered rates for providers caring for children up to 2.9 years of age.68
• Eight of the thirty-eight states with tiered rates in 2016 had two rate levels (including the base level),69 six states had three levels, twelve states had four levels, eight states had five levels, two states had six levels, and two states had seven levels.70
• In over three-quarters of the thirty-seven states with tiered rates for center care for a four-year-old in 2016, the reimbursement rate for this type of care at the highest quality level was below the 75th percentile of current market rates (which includes providers at all levels of quality) for this type of care.71
• In twenty-nine of the thirty-seven states, the reimbursement rate at the highest quality level was below the 75th percentile of market rates (based on the state’s most recent market survey for which it reported data).72 In sixteen of these states, the reimbursement rate at the highest quality level was at least 20 percent below the 75th percentile.
• In eight of the thirty-seven states, the reimbursement rate at the highest quality level was above the 75th percentile of market rates. In four of these states, the reimbursement rate at the highest quality level was at least 10 percent above the 75th percentile.
• Among the thirty-seven states with tiered rates for center care for a four-year-old, the difference between a state’s lowest rate and highest rate for this type of care ranged from 5 percent to 74 percent in 2016.73 The states with a greater percentage difference between the lowest and highest rate were somewhat more likely than other states to have their highest rate exceed the 75th

NatioNal WomeN’s laW CeNter
reD lIGhT Green lIGhT: STaTe chIlD care aSSISTance POlIcIeS 2016 11
percentile of market rates (based on the state’s most recent market survey for which it reported data).
• In four of the thirty-seven states, the highest rate was 5 percent to 9 percent greater than the lowest rate. In all of these four states, the highest rate was below the 75th percentile of market rates.
• In twelve of the thirty-seven states, the highest rate was 10 percent to 19 percent greater than the lowest rate. In ten of these twelve states, the highest rate was below the 75th percentile of market rates.
• In nine of the thirty-seven states, the highest rate was 20 percent to 29 percent greater than the lowest rate. In six of these nine states, the highest rate was below the 75th percentile of market rates.
• In twelve of the thirty-seven states, the highest rate was at least 30 percent greater than the lowest rate. In nine of these twelve states, the highest rate was below the 75th percentile of market rates.
•In five states, the amount of the differential between the lowest and highest rates for center care for a four-year-old was greater in 2016 than in 2015.74 In two states, the amount of the differential between the lowest and highest rates was smaller in 2016 than in 2015.75
Inadequate reimbursement rates deprive child care providers of the
resources needed to offer high-quality care and may discourage high-quality providers from enrolling families who
receive child care assistance.
NatioNal WomeN’s laW CeNter
12 reD lIGhT Green lIGhT: STaTe chIlD care aSSISTance POlIcIeS 2016
eligibility for families with parents searching for a jobchIlD care aSSISTance can helP ParenTS get or keep the child care they need while searching for an initial job or a new job. Parents can more readily start work if they can make their child care arrangements before they find a job rather than having to wait until after they find a job to make those arrangements. In addition, children can have greater stability if they can remain in the same child care arrangement without disruption when a parent loses one job and is searching for another job.
As previously described, the CCDBG Act of 2014 requires states to allow families receiving child care assistance to continue receiving it for at least three months while a parent searches for a job, but states had until at least September 30, 2016, to implement this provision.76 Some states changed their policies prior to February 2016 to comply with this requirement and, as discussed in the following section on changes after February 2016, some additional states changed their policies after that date. Neither the law nor the federal regulations require states to allow families to qualify for and begin receiving child care assistance while a parent searches for a job.
Forty-eight states allowed families receiving child care assistance to continue receiving it for at least some amount of time while a parent searched for a job in 2016, two more states than in 2015.77 Yet only fourteen states allowed families to qualify for and begin receiving child care assistance while a parent searched for a job in 2016,78 two more states than in 2015.79
Among states setting a limit by the number of days, weeks, or months, the amount of time families could continue receiving or qualify for and begin receiving
child care assistance while a parent searched for a job ranged from twenty-one days to ninety-two days in 2016. Five states increased the length of time families could continue receiving child care assistance while a parent searched for a job between 2015 and 2016.80
• Forty-eight states allowed families receiving child care assistance to continue receiving it while a parent searched for a job in 2016, compared to forty-six states in 2015 (see Table 5).
• Three states allowed families to continue receiving child care assistance until the end of the month in which a parent lost his or her job in 2016. One state allowed families to continue receiving child care assistance until the end of the month following the month in which a parent lost his or her job in 2016. In these states, the amount of time a parent had to search for a new job depended on when during the month s/he lost a job.
• Two states allowed families to continue receiving child care assistance while a parent searched for a job for up to a certain number of hours, including one state for up to 80 hours and one state for up to 240 hours in 2016.
• One state allowed families to continue receiving child care assistance while a parent searched for a job for up to twenty-one days in 2016.
• Fifteen states allowed families to continue receiving child care assistance while a parent searched for a job for up to either thirty days, four weeks, or one month in 2016.
• One state allowed families to continue receiving child care assistance while a parent searched for a job for up to forty days in 2016.

NatioNal WomeN’s laW CeNter
reD lIGhT Green lIGhT: STaTe chIlD care aSSISTance POlIcIeS 2016 13
• One state allowed families to continue receiving child care assistance while a parent searched for a job for up to fifty-six days in 2016.
• Ten states allowed families to continue receiving child care assistance while a parent searched for a job for up to either sixty days, eight weeks, or two months in 2016.
• Ten states allowed families to continue receiving child care assistance while a parent searched for a job for up to either ninety, ninety-one, or ninety-two days, twelve or thirteen weeks, or three months in 2016, including two states that increased the length of time from thirty days, one state that increased the length of time from eight weeks, and one state that only allowed families to continue receiving child care assistance until the end of the month following the month in which the parent lost his or her job in 2015.
• Four states allowed families to continue receiving child care assistance while a parent searched for a job until the end of the family’s twelve-month eligibility period in 2016, including one state that changed the length of time from three months and two states that did not allow families to continue receiving child care assistance while a parent searched for a job in 2015.
•Three states did not allow families receiving child care assistance to continue receiving it while a parent searched for a job in 2016, compared to five states in 2015.
• Fourteen states allowed families not receiving child care assistance to qualify for assistance while a parent searched for a job in 2016, compared to twelve states in 2015.81
• Three states allowed families to receive child care assistance while a parent searched for a job for up to a certain number of hours in 2016, including one state that did not allow families to qualify for assistance while a parent searched for a job in 2015.
One of these three states allowed families to receive child care assistance while a parent searched for a job for up to 80 hours, one state for up to 150 hours, and one state for up to 240 hours in 2016.
• Four states allowed families to receive child care assistance while a parent searched for a job for up to either thirty days, four weeks, or one month in 2016.
• One state allowed families to receive child care assistance while a parent searched for a job for up to forty days in 2016.
• Five states allowed families to receive child care assistance while a parent searched for a job for up to either sixty days, eight weeks, or two months in 2016.
• One state allowed families to receive child care assistance while a parent searched for a job for up to ninety days in 2016, a state that did not allow families to qualify for child care assistance while a parent searched for a job in 2015.
•Two states permitted localities to determine whether to allow families not receiving child care assistance to qualify for assistance while a parent searched for a job in 2016, the same as in 2015.
• One state permitted localities to allow families to qualify for child care assistance while a parent searched for a job for up to six months (if funds were available) in 2016.
• One state permitted localities to allow families to qualify for child care assistance while a parent searched for a job; if localities chose to do so, they had to allow families to receive child care assistance while a parent searched for a job for at least sixty days in 2016.
• Thirty-five states did not allow families not receiving child care assistance to qualify for assistance while a parent searched for a job in 2016, compared to thirty-seven states in 2015.
children can have greater stability if they can remain in the same child care arrangement without disruption when a parent loses one job
and is searching for another job.
NatioNal WomeN’s laW CeNter
14 reD lIGhT Green lIGhT: STaTe chIlD care aSSISTance POlIcIeS 2016
alThOuGh ThIS rePOrT PrImarIly fOcuSeS On chanGeS beTWeen february 2015 anD february 2016, states reported on some changes they made or expected to make after February 2016. Thirty states reported they had made or expected to make improvements in one or more of the policies covered in this report after February 2016. The most common improvement was extending the amount of time families can continue receiving child care assistance while a parent searches for a job to at least three months—as previously described, a policy required by the CCDBG Act of 2014, but not required to be implemented before September 30, 2016, at the earliest. Three states reported they had made cutbacks in one or more of the policies covered in this report since February 2016.82
•One state increased its income eligibility limit for child care assistance by an amount that exceeded inflation after February 2016.83
• Kentucky increased its income limit to qualify for assistance from 150 percent of the 2011 federal poverty level ($27,795 a year for a family of three) to 160 percent of the 2016 federal poverty level ($32,256 a year for a family of three) as of September 2016.84
• One state reduced its income eligibility limit for child care assistance after February 2016.85
•North Dakota reduced its income limit for assistance from 85 percent of state median income ($63,348 a year for a family of three) to 60 percent of state median income ($44,724 a year for a family of three) as of April 2016.
•One state reduced the number of children on the waiting list for child care assistance, and one state
opened intake for child care assistance to a group of families to which intake had previously been closed, after February 2016.
• Oregon, which had 5,675 children on the waiting list as of July 2016, was serving families who had been on the waiting list as well as new applicants, and had no children on the waiting list, as of August 2016.
•Tennessee, which in February 2016 was generally not providing child care assistance to families or children applying and eligible for child care assistance under its eligibility criteria unless they were families receiving or transitioning from TANF, teen-parent families, foster families, or families with children receiving protective services, expanded the categories of applicants able to receive child care assistance by launching a new program for families in which a parent is working or attending a postsecondary education program as of June 2016.86
• One state started placing families who applied for child care assistance on a waiting list and one state increased the number of children on the waiting list after February 2016.87
• Connecticut, which served all eligible families who applied as of February 2016, started a waiting list as of August 2016.
• Nevada’s waiting list increased from 30 children as of February 2016 to 1,262 children as of September 2016.
• Three states reduced copayments for families receiving child care assistance after February 2016.
• Arizona reduced copayments for families as of September 2016. For example, the monthly
looking ahead: developments since february 2016
NatioNal WomeN’s laW CeNter
reD lIGhT Green lIGhT: STaTe chIlD care aSSISTance POlIcIeS 2016 15
copayment for a family at 150 percent of poverty ($30,240 a year for a family of three) was reduced from $152 to $65, and the monthly copayment for a family at 100 percent of poverty ($20,160 a year for a family of three) was reduced from $65 to $43.
•Nebraska reduced copayments for families as of July 2016. For example, the monthly copayment for a family at 150 percent of poverty was reduced from $190 to $82.
• Utah eliminated copayments for families with incomes up to 100 percent of poverty as of April 2016, and reduced copayments for families at all income levels as of October 2016. For example, the monthly copayment for a family at 150 percent of poverty was reduced from $221 to $167, and the monthly copayment for a family with an income at 100 percent of poverty was reduced from $17 to $0.
• One state increased copayments for families receiving child care assistance after February 2016.
• North Dakota increased copayments for families as of April 2016. For example, the monthly copayment for a family at 150 percent of poverty was increased from $109 to $218, and the monthly copayment for a family at 100 percent of poverty was increased from $38 to $75.
•Eight states increased their reimbursement rates88 for providers serving families receiving child care assistance after February 2016.89
•Alabama increased its reimbursement rates by 6 percent as of August 2016. For example, the monthly reimbursement rate for center care for a four-year-old in Birmingham increased from $442 to $468.
• Idaho increased its reimbursement rates from the 75th percentile of 2001 market rates to the 65th percentile of 2015 market rates as of October 2016. For example, the monthly reimbursement rate for center care for a four-year-old in Region IV (which includes Boise and three other counties) increased from $492 to $623.
• Maine increased its reimbursement rates from the 50th percentile of 2013 market rates to the 50th percentile of 2015 market rates as of June 2016. For example, the monthly reimbursement rate for center care for a four-year-old in Cumberland County increased from $810 to $909.
•Missouri increased its reimbursement rates by 10 percent as of July 2016. For example, the monthly reimbursement rate for center care for a four-year-old in St. Louis County increased from $369 to $406.
Thirty states reported they had made or expected to make improvements in
one or more of the policies covered in this report after february 2016.
• New York increased its reimbursement rates from the 69th percentile of 2013 market rates to the 69th percentile of 2015 market rates as of June 2016. For example, the monthly reimbursement rate for center care for a four-year-old in New York City increased from $1,009 to $1,048.
• South Dakota increased its reimbursement rates from the 75th percentile of 2013 market rates to the 75th percentile of 2015 market rates as of June 2016. For example, the monthly reimbursement rate for center care for a four-year-old in Pennington County increased from $546 to $585.90
•Washington increased its reimbursement rates for centers and license-exempt family child care providers by 2 percent, and increased its rates for licensed family child care providers by 2 percent to 25 percent (depending on the age of the child in care and the region of the state), as of July 2016.91 For example, the monthly reimbursement rate for center care for a four-year-old in King County increased from $743 to $758.

NatioNal WomeN’s laW CeNter
16 reD lIGhT Green lIGhT: STaTe chIlD care aSSISTance POlIcIeS 2016
• West Virginia increased its reimbursement rates—which ranged from the 20th to 85th percentile of 2013 market rates, depending on the type of care and age of the child in care, as of February 2016—to the 75th percentile of 2015 market rates as of March 2016. For example, the monthly reimbursement rate for center care for a four-year-old statewide increased from $498 to $606.
• Six states increased their tiered reimbursement rates, or began implementing tiered rates, after February 2016.92
•Colorado, which had previously allowed counties to determine whether to pay tiered rates, began requiring all counties to pay such rates as of September 2016.
• Georgia increased its tiered rates for providers with ratings of one star or higher in the state’s quality rating and improvement system (which has three star levels) as of October 2016. The state increased rates from 2 percent to 5 percent above the base rate for one-star providers, from 5 percent to 10 percent above the base rate for two-star providers, and from 10 percent to 25 percent above the base rate for three-star providers. For example, the monthly reimbursement rate for care for a four-year-old in Zone 1 (which includes Fulton and thirteen other counties) increased from $504 to $519 for a one-star center, from $519 to $543 for a two-star center, and from $543 to $618 for a three-star center, compared to the base rate of $494.
• Iowa, which previously did not have tiered rates, began paying higher rates for providers with five stars in the state’s quality rating and improvement system (which has five star levels) as of July 2016. The state set reimbursement rates for five-star providers at the 75th percentile of 2014 market rates. For example, the monthly reimbursement rate for care for a four-year-old statewide is $770 for a five-star center, compared to the base rate of $595.
• North Carolina increased its tiered rates for providers with ratings of three stars or higher in the state’s quality rating and improvement system (which has five star levels) and serving children ages three to five in eighty of the state’s 100 counties as of October 2016.93 For example, the monthly reimbursement rate for care for a four-year-old in Alamance County increased from $545 to $645 for a three-star center, from $576 to $694 for a four-star center, and from $629 to $757 for a five-star center, compared to the base rate of $356.94
• Ohio increased its tiered rates for providers with ratings of two stars or higher in the state’s quality rating and improvement system (which has five star levels) as of June 2016, and implemented additional rate increases for all star-rated providers as of September 2016.95 For example, the monthly reimbursement rate for care for a four-year-old in Cuyahoga County increased from $598 to $622 for a one-star center, from $627 to $699 for a two-star center, from $655 to $717 for a three-star center, from $684 to $764 for a four-star center, and from $712 to $800 for a five-star center, compared to the base rate of $570.
• Oregon, which previously did not have tiered rates, began paying higher rates for providers with ratings of three stars or higher in the state’s quality rating and improvement system (which has five star levels) as of April 2016. Three-star providers receive an additional $54 per month above the base rate, four-star providers receive an additional $72 per month above the base rate, and five-star providers receive an additional $90 per month above the base rate. For example, the monthly reimbursement rate for care for a four-year-old statewide is $1,019 for a three-star center, $1,037 for a four-star center, and $1,055 for a five-star center, compared to the base rate of $965.
• Twenty-five states increased, or planned to increase, the amount of time families can receive child care assistance while a parent searches for a job, or began allowing families to qualify or continue to receive child

NatioNal WomeN’s laW CeNter
reD lIGhT Green lIGhT: STaTe chIlD care aSSISTance POlIcIeS 2016 17
Twenty-five states increased, or planned to increase, the amount of time families can receive child care assistance while a parent searches for a job, or began allowing families to receive child care
assistance while a parent searches for a job, after february 2016.
care assistance while a parent searches for a job, after February 2016.96
• Alabama, which did not allow families to receive child care assistance while a parent searched for a job as of February 2016, began allowing families to continue receiving child care assistance while a parent searches for a job for ninety days as of August 2016.
•Arizona extended the amount of time families could continue receiving child care assistance while a parent searches for a job from sixty days to three months as of September 2016.
•Colorado extended the amount of time counties had to allow families to continue receiving child care assistance while a parent searches for a job from sixty days to thirteen weeks, as of June 2016.97 The state also began requiring all counties to allow families to qualify for child care assistance while a parent searches for a job for thirteen weeks as of June 2016.98
•Connecticut extended the amount of time families could continue receiving child care assistance while a parent searches for a job from until the end of the month following the month in which s/he lost his or her job to three months as of April 2016.
•Florida extended the amount of time families could continue receiving child care assistance while a parent searches for a job from sixty days to ninety days as of July 2016.
• Georgia extended the amount of time families could continue receiving child care assistance while a parent searches for a job from eight weeks to twelve weeks as of October 2016.
•Idaho extended the amount of time families could continue receiving child care assistance while a parent searches for a job from through the end of the month in which s/he lost his or her job to three months as of October 2016.
• Iowa extended the amount of time families could continue receiving child care assistance while a parent searches for a job from thirty days to three months as of July 2016.
• Kansas extended the amount of time families could continue receiving child care assistance while a parent searches for a job from through the end of the month in which s/he lost his or her job to three months as of July 2016.
• Kentucky extended the amount of time families could continue receiving child care assistance while a parent searches for a job from four weeks to ninety days as of September 2016. In addition, the state, which did not allow families to qualify to receive child care assistance while a parent searched for a job as of February 2016, began allowing families to qualify for child care assistance while a parent searches for a job for ninety days as of September 2016.
•Missouri extended the amount of time families could continue receiving child care assistance while a parent searches for a job from thirty days (twice per calendar year) to ninety days as of July 2016.
•Nevada changed the amount of time families could continue receiving child care assistance while a parent searches for a job from four weeks to until the end of their twelve-month eligibility period as of March 2016.
• New Mexico extended the amount of time families could continue receiving child care assistance while a parent searches for a job from thirty days (twice per calendar year) to ninety days as of October 2016.

NatioNal WomeN’s laW CeNter
18 reD lIGhT Green lIGhT: STaTe chIlD care aSSISTance POlIcIeS 2016
• North Carolina extended the amount of time families could continue receiving child care assistance while a parent searches for a job from thirty days to ninety days as of June 2016.99
• Oklahoma changed the amount of time families could continue receiving child care assistance while a parent searches for a job from ninety days to until the end of their twelve-month eligibility period as of October 2016.
• Rhode Island planned to extend the amount of time families could continue receiving child care assistance while a parent searches for a job from twenty-one days to three months by the end of 2016.
• South Carolina extended the amount of time families could continue receiving child care assistance while a parent searches for a job from thirty days to ninety days as of March 2016.
• South Dakota extended the amount of time families could continue receiving child care assistance while a parent searches for a job from thirty days to three months as of September 2016.
• Tennessee extended the amount of time families could continue receiving child care assistance while a parent searches for a job from thirty days to ninety days as of September 2016.
• Texas extended the amount of time families could continue receiving child care assistance while a parent searches for a job from four weeks to three months as of October 2016.
• Utah extended the amount of time families could continue receiving child care assistance while a parent searches for a job from two months to three months as of September 2016.
• Vermont extended the amount of time families could continue receiving child care assistance while a parent searches for a job from one month to three months as of September 2016. Similarly,
the state extended the amount of time families could qualify to receive child care assistance while a parent searches for a job from one month to three months as of September 2016.100
•Washington changed the amount of time families could continue receiving child care assistance while a parent searches for a job from twenty-eight days twice per calendar year or fifty-six days once per calendar year to until the end of their twelve-month eligibility period as of July 2016.
•West Virginia extended the amount of time families could continue receiving child care assistance while a parent searches for a job from thirty days to ninety days as of September 2016. In addition, the state, which did not allow families to qualify to receive child care assistance while a parent searched for a job as of February 2016, began allowing families to qualify for child care assistance while a parent searches for a job for ninety days as of September 2016.
• Wyoming, which did not allow families to receive child care assistance while a parent searched for a job as of February 2016, began allowing families to continue receiving child care assistance while a parent searches for a job for ninety days as of September 2016.
•One state stopped allowing families to qualify to receive child care assistance while a parent searches for a job after February 2016.
• North Dakota, which allowed families to qualify to receive child care assistance while a parent searched for a job for eight weeks as of February 2016, limited this ability to families receiving or transitioning from TANF as of April 2016.

NatioNal WomeN’s laW CeNter
reD lIGhT Green lIGhT: STaTe chIlD care aSSISTance POlIcIeS 2016 19
conclusion
famIlIeS’ acceSS TO chIlD care aSSISTance anD/Or The exTenT Of aSSISTance They cOulD receIve IncreaSeD under one or more key child care assistance policies in approximately three-fifths of the states—compared to less than one-third of states in which families’ access to assistance and/or the extent of assistance decreased—between February 2015 and February 2016. This year marks the fourth straight year in which families experienced improvements in more states than they experienced cutbacks.
Although the key indicators in this report show positive developments, another important indicator reflects a troubling trend. The number of children receiving child care assistance in 2014 (the most recent year for which data are available) was 1.41 million,101 slightly lower than the 1.45 million children receiving child care assistance in 2013,102 and significantly below the peak of 1.81 million children in 2001,103 even though the number of children living in low-income families in 2014 was higher than in 2013 or 2001.104 The number of children
living in low-income families in 2015 (the most recent year for which data are available) was lower than in 2014, but still higher than in 2001,105 and data are not yet available on the number of children receiving child care assistance in 2015. The available measures show that far too many children in low-income families are not receiving the help they need, as fewer than one in six children eligible for federal child care assistance receives it.106
It will only be possible to expand the number of children and families who have access to child care assistance, to make further improvements in the key policy areas examined in this report, and to achieve the important goals of the CCDBG program if federal and state funding for child care is significantly increased. With greater investments, parents can have the affordable, reliable child care they need to work, children can have the early learning opportunities that start them on a path to success in school and life, and our nation can have the strong workforce required for a prosperous economy now and in the future.
NatioNal WomeN’s laW CeNter
20 reD lIGhT Green lIGhT: STaTe chIlD care aSSISTance POlIcIeS 2016
1 Research demonstrates the important role that high-quality child care plays in giving children a strong start. Suzanne Helburn, Mary L. Culkin, Carollee Howes, Donna Bryant, Richard Clifford, Debby Cryer, Ellen Peisner-Feinberg, and Sharon Lynn Kagan, Cost, Quality, and Child Outcomes in Child Care Centers (Denver, CO: University of Colorado, 1995); Ellen S. Peisner-Feinberg, Richard M. Clifford, Mary L. Culkin, Carollee Howes, Sharon Lynn Kagan, et al., The Children of the Cost, Quality, and Outcomes Study Go to School (Chapel Hill, NC: University of North Carolina, Frank Porter Graham Child Development Center, 1999); Eric Dearing, Kathleen McCartney, and Beck A. Taylor, Does Higher Quality Early Child Care Promote Low-Income Children’s Math and Reading Achievement in Middle Childhood?, Child Development, 80 (5), 2009, 1329-1349; National Research Council and the Institute of Medicine, From Neurons to Neighborhoods: The Science of Early Childhood Development (Washington, DC: National Academy Press, 2000).
2 In 2015 (the most recent year for which data are available), 6.9 million families with children under age six (41.9 percent) had incomes under 200 percent of poverty. U.S. Census Bureau, Current Population Survey, 2016 Annual Social and Economic Supplement, Detailed Table POV08: Families With Related Children Under 6 by Number of Working Family Members and Family Structure: 2015, available at http://www.census.gov/data/tables/time-series/demo/income-poverty/cps-pov/pov-08.html.
3 Child Care Aware of America, Parents and the High Cost of Child Care: 2015 Report (Arlington, VA: Child Care Aware of America, 2015), 30, available at http://usa.childcareaware.org/wp-content/uploads/2016/05/Parents-and-the-High-Cost-of-Child-Care-2015-FINAL.pdf.
4 See note 18 and accompanying text.5 These thirty-one states are Arkansas, California, Colorado, Connecticut, District of Columbia, Florida, Georgia, Indiana, Kansas, Kentucky,
Louisiana, Maine, Massachusetts, Michigan, Missouri, Montana, Nebraska, Nevada, New Hampshire, New Mexico, North Carolina, Ohio, Oklahoma, Oregon, Pennsylvania, Rhode Island, South Carolina, Texas, Utah, Virginia, and Washington. Families were considered better off under state child care assistance policies between 2015 and 2016 if during that time period the state increased its income eligibility limit to qualify for child care assistance by an amount that exceeded an annual inflation adjustment; reduced its waiting list, served all families on the waiting list, or unfroze intake; reduced parent copayments for families at 100 percent of poverty and/or 150 percent of poverty as a percentage of income; increased provider reimbursement rates as a dollar amount; increased or began implementing reimbursement rate differentials for higher-quality care; and/or increased the amount of time families could receive child care assistance while a parent searched for a job or started allowing families to qualify for or continue receiving child care assistance while a parent searched for a job.
6 These fifteen states are Alabama, Arizona, District of Columbia, Illinois, Maryland, Massachusetts, Minnesota, Mississippi, New Mexico, Oregon, Pennsylvania, Rhode Island, South Dakota, Texas, and Virginia. Eight of these states are also included in the list of thirty-one states above because in these states, families were worse off under some policies, but better off under other policies. Families were considered worse off under state child care assistance policies between 2015 and 2016 if during that time period the state reduced its income eligibility limit to qualify for child care assistance as a dollar amount; implemented a waiting list, increased its waiting list, or froze intake; increased parent copayments for families at 100 percent of poverty and/or 150 percent of poverty as a percentage of income; reduced provider reimbursement rates as a dollar amount or stopped reimbursing providers at the federally recommended level, the 75th percentile of current market rates; reduced reimbursement rate differentials for higher-quality care; and/or reduced the length of time families could receive child care assistance while a parent searched for a job or stopped allowing families to qualify for or continue receiving child care assistance while a parent searched for a job.
7 Karen Schulman and Helen Blank, Building Blocks: State Child Care Assistance Policies 2015 (Washington, DC: National Women’s Law Center, 2015), available at https://nwlc.org/wp-content/uploads/2015/11/CC_RP_Building_Blocks_Assistance_Policies_2015.pdf. These counts include eleven states in which families were better off under some policies and worse off under others.
8 Karen Schulman and Helen Blank, Turning the Corner: State Child Care Assistance Policies 2014 (Washington, DC: National Women’s Law Center, 2014), available at http://www.nwlc.org/sites/default/files/pdfs/nwlc_2014statechildcareassistancereport-final.pdf. These counts include eight states in which families were better off under some policies and worse off under others.
9 Karen Schulman and Helen Blank, Pivot Point: State Child Care Assistance Policies 2013 (Washington, DC: National Women’s Law Center, 2013), available at http://www.nwlc.org/sites/default/files/pdfs/final_nwlc_2013statechildcareassistancereport.pdf. These counts include twelve states in which families were better off under some policies and worse off under others.
10 Karen Schulman and Helen Blank, Downward Slide: State Child Care Assistance Policies 2012 (Washington, DC: National Women’s Law Center, 2012), available at http://www.nwlc.org/sites/default/files/pdfs/NWLC2012_StateChildCareAssistanceReport.pdf. These counts include six states in which families were better off under some policies and worse off under others.
11 Karen Schulman and Helen Blank, State Child Care Assistance Policies 2011: Reduced Support for Families in Challenging Times (Washington, DC: National Women’s Law Center, 2011), available at http://www.nwlc.org/sites/default/files/pdfs/state_child_care_assistance_policies_ report2011_final.pdf. These counts include seven states in which families were better off under some policies and worse off under others.
12 American Recovery and Reinvestment Act, Pub. L. No. 111–8, 123 Stat. 524 (2009).13 Program Instruction (CCDF-ACF-PI-2009-03), Issued April 9, 2009, available at http://www.acf.hhs.gov/sites/default/files/occ/pi2009_03.
pdf.14 Budget Control Act of 2011, Pub. L. No. 112–25, 125 Stat. 240 (2011).15 CCDBG funding was $5.140 billion in FY 2011 ($5.636 billion in FY 2016 dollars), $5.195 billion in FY 2012 ($5.579 billion in FY 2016 dollars),
$5.123 billion in FY 2013 ($5.410 billion in FY 2016 dollars), $5.275 billion in FY 2014 ($5.470 billion in FY 2016 dollars), $5.352 billion in FY 2015 ($5.446 billion in FY 2016 dollars), and $5.678 billion in FY 2016. FY 2011 and FY 2012 funding levels from U.S. Department of Health and Human Services, Fiscal Year 2013 Budget in Brief (Washington, DC: U.S. Department of Health and Human Services, 2012), 88, 92, available at http://www.hhs.gov/about/agencies/asfr/budget/budgets-in-brief-performance-reports/index.html#. FY 2013 funding level from U.S. Department of Health and Human Services, Fiscal Year 2015 Budget in Brief (Washington, DC: U.S. Department of Health and Human Services, 2014), 108, 113, available at http://www.hhs.gov/sites/default/files/budget/fy2015/fy-2015-budget-in-brief.pdf. FY 2014 and FY 2015 funding levels from U.S. Department of Health and Human Services, FY 2016 President’s Budget for HHS (Washington, DC: U.S. Department of Health and Human Services, 2015), 120, 125, available at http://www.hhs.gov/sites/default/files/budget/fy2016/fy-2016-budget-in-brief.pdf. FY 2016 funding level from U.S. Department of Health and Human Services, FY 2017 President’s Budget for HHS (Washington, DC: U.S. Department of Health and Human Services, 2016), 132, 139, available at http://www.hhs.gov/sites/default/files/fy2017-budget-in-brief.pdf. Inflation adjustments calculated by National Women’s Law Center using Congressional Budget Office, The Budget and Economic Outlook report series; figures are adjusted for inflation using the average of the Consumer Price Index and the Employment Cost Index. See section on funding for child care assistance for more details.
endnotes

NatioNal WomeN’s laW CeNter
reD lIGhT Green lIGhT: STaTe chIlD care aSSISTance POlIcIeS 2016 21
16 National Association of State Budget Officers, The Fiscal Survey of States: Spring 2016 (Washington, DC: NASBO, 2016), available at http://www.nasbo.org/reports-data/fiscal-survey-of-states; National Association of State Budget Officers, The Fiscal Survey of States: Spring 2015 (Washington, DC: NASBO, 2015), available at http://www.nasbo.org/mainsite/reports-data/fiscal-survey-of-states/fiscal-survey-archives; National Association of State Budget Officers, The Fiscal Survey of States: Spring 2014 (Washington, DC: NASBO, 2014), available at http://www.nasbo.org/mainsite/reports-data/fiscal-survey-of-states/fiscal-survey-archives; National Conference of State Legislatures, State Budget Update: Spring 2014 (Denver, CO: NCSL, 2014), available at http://www.ncsl.org/documents/fiscal/SPRING_SBU_2014_free.pdf; National Conference of State Legislatures, State Budget and Tax Actions: Preliminary Report (August 2013) (Denver, CO: NCSL, 2013), available at http://www.ncsl.org/Portals/1/Documents/fiscal/SBTA_PreliminaryReport_final.pdf; Elizabeth McNichol, States Should React Cautiously to Recent Income Tax Growth: April Surge Provides Opportunity to Invest in Infrastructure, Boost Reserves (Washington, DC: Center on Budget and Policy Priorities, 2013), available at http://www.cbpp.org/files/6-13-13sfp.pdf.
17 This report uses 2001 policies as the basis for comparison because, until 2010, it was the year between the peak year for CCDBG funding, 2002, and the peak year for Temporary Assistance for Needy Families (TANF) funding used for child care, 2000. See section on funding for child care assistance.
18 Child Care and Development Block Grant Act of 2014, Pub. L. 113-186, 128 Stat. 1971 (2014). The National Women’s Law Center collected data on states’ policies in a few critical areas more directly affected by the Act, which will be analyzed in a forthcoming report.
19 See Child Care and Development Block Grant Act of 2014, Pub. L. 113-186, 128 Stat. 1971, 1979 (2014). 20 The federal Office of Child Care allowed states until September 30, 2016, to implement provisions in the law for which an effective date is
not specified, including this provision. See U.S. Department of Health and Human Services, Administration for Children and Families, Office of Child Care, Draft Child Care and Development Fund Plan Preprint for Public Comment, September 14, 2015, 5, available at https://www.acf.hhs.gov/sites/default/files/occ/fy2016_2018_ccdf_plan_preprin_draft_for_public_comment_91415.pdf. In addition, the Office of Child Care granted waivers to a number of states for certain provisions, including this provision. See National Women’s Law Center, Child Care and Development Fund Plans FY 2016-2018: State Waivers and Corrective Actions (2016), available at https://nwlc.org/resources/child-care-and-development-fund-plans-fy-2016-2018-state-waivers-and-corrective-actions/.
21 See Child Care and Development Block Grant Act of 2014, Pub. L. 113-186, 128 Stat. 1971 (2014).22 This study focuses on the income criteria used to determine a family’s eligibility when it first applies for assistance, because this traditionally
has been used as the measure of access to benefit programs and determines whether a family can enter the program. However, some states allow families to continue to receive assistance up to a higher income level than the initial eligibility limit. Information about states that have different entrance and exit income eligibility limits is provided in the notes to Tables 1a and 1b.
23 The federal poverty level for a family of three was $20,160 in 2016. U.S. Department of Health and Human Services, 2016 Poverty Guidelines, available at https://aspe.hhs.gov/poverty-guidelines. The federal poverty level for a family of three was $20,090 in 2015. U.S. Department of Health and Human Services, 2015 Poverty Guidelines, available at http://aspe.hhs.gov/2015-poverty-guidelines.
24 The federal poverty level for a family of three was $14,630 in 2001. U.S. Department of Health and Human Services, The 2001 HHS Poverty Guidelines, available at http://aspe.hhs.gov/2001-hhs-poverty-guidelines.
25 Comparable data were not collected for 2001.26 Comparable data were not collected for 2001.27 U.S. Department of Health and Human Services, FY 2017 President’s Budget for HHS (Washington, DC: U.S. Department of Health and
Human Services, 2016), 132, 139, available at http://www.hhs.gov/sites/default/files/fy2017-budget-in-brief.pdf. This amount includes $2.761 billion in discretionary funding and $2.917 billion in mandatory (entitlement) funding.
28 CCDBG funding in FY 2015, before adjusting for inflation, was $5.352 billion. This amount includes $2.435 billion in discretionary funding and $2.917 billion in mandatory (entitlement) funding. U.S. Department of Health and Human Services, FY 2016 President’s Budget for HHS (Washington, DC: U.S. Department of Health and Human Services, 2015), 120, 125, available at http://www.hhs.gov/sites/default/files/budget/fy2016/fy-2016-budget-in-brief.pdf. Inflation adjustment calculated by National Women’s Law Center using Congressional Budget Office, The Budget and Economic Outlook report series; figures are adjusted for inflation using the average of the Consumer Price Index and the Employment Cost Index.
29 U.S. Department of Health and Human Services, Fiscal Year 2011 Budget in Brief (Washington, DC: U.S. Department of Health and Human Services, 2010), 75, 79, available at http://www.hhs.gov/asfr/ob/budgets-in-brief-performance-reports.html. In addition to the $1 billion in ARRA funding, this total of $6.044 billion in CCDBG funding includes $2.127 billion in discretionary funding and $2.917 billion in mandatory (entitlement) funding.
30 National Women’s Law Center calculations using Congressional Budget Office, The Budget and Economic Outlook report series. Figures are adjusted for inflation using the average of the Consumer Price Index and the Employment Cost Index.
31 CCDBG funding in FY 2002, before adjusting for inflation, was $4.817 billion. This amount includes $2.1 billion in discretionary funding and $2.717 billion in mandatory (entitlement) funding. U.S. Department of Health and Human Services, FY 2003 President’s Budget for HHS (Washington, DC: U.S. Department of Health and Human Services, 2002), 83, 92, available at http://www.hhs.gov/asfr/ob/budgets-in-brief-performance-reports.html. Inflation adjustment calculated by National Women’s Law Center using Congressional Budget Office, The Budget and Economic Outlook report series; figures are adjusted for inflation using the average of the Consumer Price Index and the Employment Cost Index.
32 National Women’s Law Center analysis of data from U.S. Department of Health and Human Services, Administration for Children and Families, Fiscal Year 2015 TANF Financial Data, Table A.1.: Federal TANF and State MOE Expenditures Summary by ACF-196 Spending Category, FY 2015, available at http://www.acf.hhs.gov/ofa/resource/tanf-financial-data-fy-2015. Total includes $1.320 billion transferred to CCDBG and $1.250 billion spent directly on child care (including both that categorized as “assistance” and “non-assistance”).
33 National Women’s Law Center analysis of data from U.S. Department of Health and Human Services, Administration for Children and Families, Fiscal Year 2000 TANF Financial Data, Table A. Combined Federal Funds Spent in FY 2000 Through the Fourth Quarter, available at http://archive.acf.hhs.gov/programs/ofs/data/tanf_2000.html. Total includes $2.413 billion transferred to CCDBG, $353 million spent on child care categorized as “assistance,” and $1.200 billion spent on child care categorized as “non-assistance.”
34 National Women’s Law Center calculations using Congressional Budget Office, The Budget and Economic Outlook report series. Figures are adjusted for inflation using the average of the Consumer Price Index and the Employment Cost Index.
35 In FY 2001, CCDBG funding was $4.567 billion ($6.396 billion in FY 2016 dollars) and TANF funding used for child care was $3.541 billion ($4.959 billion in FY 2016 dollars). The CCDBG funding amount includes $2.0 billion in discretionary funding and $2.567 billion in mandatory (entitlement) funding. U.S. Department of Health and Human Services, FY 2002 President’s Budget for HHS (Washington, DC: U.S. Department of Health and Human Services, 2001), 89-90, available at http://archive.hhs.gov/budget/pdf/hhs2002.pdf. The TANF funding amount includes $1.899 billion transferred to CCDBG, $285 million spent on child care categorized as “assistance,” and $1.357 billion spent

NatioNal WomeN’s laW CeNter
22 reD lIGhT Green lIGhT: STaTe chIlD care aSSISTance POlIcIeS 2016
on child care categorized as “non-assistance.” National Women’s Law Center analysis of data from U.S. Department of Health and Human Services, Administration for Children and Families, Fiscal Year 2001 TANF Financial Data, Table A. Combined Federal Funds Spent in FY 2001 Through the Fourth Quarter, available at http://archive.acf.hhs.gov/programs/ofs/data/tanf_2001.html. CCDBG and TANF amounts in FY 2016 dollars calculated by National Women’s Law Center using Congressional Budget Office, The Budget and Economic Outlook report series; figures are adjusted for inflation using the average of the Consumer Price Index and the Employment Cost Index.
36 In states that allow localities to set their income limits within a state-specified range, the maximum of that range is used for the analysis in this report.
37 State median income is not used to measure inflation between 2001 and 2016 because variations among states in state median income adjustments and in the benchmark states use to set their income eligibility limits are more difficult to track than changes in the federal poverty level over a long-term period.
38 These four states are Kentucky (which increased its income limit from 140 percent to 150 percent of the 2011 federal poverty level), Maine (which increased its income limit from 250 percent of the 2014 federal poverty level to 85 percent of the 2016 state median income), Missouri (which increased its income limit from 123 percent of the 2013 federal poverty level to 138 percent of the 2015 federal poverty level), and Ohio (which increased its income limit from 125 percent of the 2014 federal poverty level to 130 percent of the 2015 federal poverty level). In most instances, the states included in the counts referenced in the text of this report are discernible from the tables following the endnotes. When the states are not easily discernible from the tables, the endnotes identify the states referenced.
39 These twenty-seven states include one state (Florida) that set its income limit based on the federal poverty level and adjusted its income limit for the 2016 federal poverty level; twenty states (Alabama, Arizona, Delaware, Idaho, Indiana, Iowa, Kansas, Montana, Nebraska, New Hampshire, New Mexico, New York, North Carolina, Pennsylvania, Rhode Island, South Carolina, South Dakota, Washington, Wisconsin, and Wyoming) that set their income limits based on the federal poverty level and adjusted their income limits for the 2015 federal poverty level; and six states (Connecticut, Massachusetts, Minnesota, North Dakota, Texas, and Utah) that set their income limits based on state median income and adjusted their income limits for the 2016 state median income between February 2015 and February 2016.
40 These three states include two states (Nevada and Virginia) that set their income limits based on the federal poverty level and adjusted their income limits from the 2013 to 2015 federal poverty level; and one state (Colorado) that set its income limit based on state median income and adjusted its income limit from the 2014 to 2016 state median income between February 2015 and February 2016.
41 This state is Illinois (which reduced its income limit from 185 percent of the 2014 federal poverty level to 162 percent of the 2015 federal poverty level).
42 These twelve states include two states in which the income limit decreased by four percentage points, two states in which the income limit decreased by three percentage points, five states in which the income limit decreased by one percentage point, one state in which the income limit stayed the same, one state in which the income limit increased by four percentage points, and one state in which the income limit increased by five percentage points as a percentage of the federal poverty level.
43 National Women’s Law Center analysis of data from Elise Gould, Tanyell Cooke, and Will Kimball, What Families Need to Get By: EPI’s 2015 Family Budget Calculator (Washington, DC: Economic Policy Institute, 2015), available at http://www.epi.org/publication/what-families-need-to-get-by-epis-2015-family-budget-calculator/; and from Sylvia Allegretto, Basic Family Budgets: Working Families’ Incomes Often Fail to Meet Living Expenses Around the U.S. (Washington, DC: Economic Policy Institute, 2005), available at http://www.epi.org/page/-/old/ briefingpapers/165/bp165.pdf.
44 See, e.g., Karen Schulman and Helen Blank, In Their Own Voices: Parents and Providers Struggling with Child Care Cuts (Washington, DC: National Women’s Law Center, 2005), 10; Children’s Action Alliance, The Real Reality of Arizona’s Working Families—Child Care Survey Highlights (Phoenix, AZ: Children’s Action Alliance, 2004); Deborah Schlick, Mary Daly, and Lee Bradford, Faces on the Waiting List: Waiting for Child Care Assistance in Ramsey County (Ramsey County, MN: Ramsey County Human Services, 1999) (Survey conducted by the Minnesota Center for Survey Research at the University of Minnesota); Philip Coltoff, Myrna Torres, and Natasha Lifton, The Human Cost of Waiting for Child Care: A Study (New York, NY: Children’s Aid Society, 1999); Jennifer Gulley and Ann Hilbig, Waiting List Survey: Gulf Coast Workforce Development Area (Houston, TX: Neighborhood Centers, Inc., 1999); Jeffrey D. Lyons, Susan D. Russell, Christina Gilgor, and Amy H. Staples, Child Care Subsidy: The Costs of Waiting (Chapel Hill, NC: Day Care Services Association, 1998); Casey Coonerty and Tamsin Levy, Waiting for Child Care: How Do Parents Adjust to Scarce Options in Santa Clara County? (Berkeley, CA: Policy Analysis for California Education, 1998); Philadelphia Citizens for Children and Youth, et al., Use of Subsidized Child Care by Philadelphia Families (Philadelphia, PA: Philadelphia Citizens for Children and Youth, 1997); Greater Minneapolis Day Care Association, Valuing Families: The High Cost of Waiting for Child Care Sliding Fee Assistance (Minneapolis, MN: Greater Minneapolis Day Care Association, 1995).
45 Waiting lists are not a perfect measure of unmet need, however. For example, waiting lists may increase due to expanded outreach efforts that make more families aware of child care assistance programs, and may decrease due to a state’s adoption of more restrictive eligibility criteria.
46 Tennessee is characterized in this report as a state with frozen intake because as of February 2016 it generally did not serve families that are eligible for child care assistance under its eligibility criteria unless they were families receiving or transitioning from TANF, teen-parent families, foster families, or families with children receiving protective services.
47 These four states are Indiana, Nevada, Pennsylvania, and Texas.48 These three states are Arizona, Colorado, and Florida.49 These three states are Alabama, Arkansas, and Massachusetts.50 Comparable data were not collected for 2001.51 If a state determines its copayment based on the cost of care, this report assumes that the family had a four-year-old in a licensed center
charging the state’s maximum base reimbursement rate. If a state allows localities to set their copayments within a state-specified range, the maximum of that range is used for the analysis in this report.
52 U.S. Census Bureau, Who’s Minding the Kids? Child Care Arrangements: 2011, Detailed Tables, Table 6: Average Weekly Child Care Expenditures of Families with Employed Mothers that Make Payments, by Age Groups and Selected Characteristics: Spring 2011 (2013), available at http://www.census.gov/data/tables/2008/demo/2011-tables.html.
53 For a family of three, 150 percent of the federal poverty level was equal to an income of $30,135 in 2015 and $30,240 in 2016.54 These eleven states do not include states that had income eligibility limits to initially qualify for assistance at or below 150 percent of poverty
but allowed families already receiving assistance to remain eligible with incomes above 150 percent of poverty, as was the case for six states in 2015 (Florida, Indiana, Missouri, Ohio, South Carolina, and West Virginia) and ten states in 2016 (Florida, Indiana, Kentucky, Michigan, Missouri, Nebraska, Nevada, Ohio, South Carolina, and West Virginia).
55 For a family of three, 150 percent of the federal poverty level was equal to an income of $21,945 in 2001.56 This recommendation to set reimbursement rates at the 75th percentile of current market rates is in the preamble to both the previous
regulations, see Child Care and Development Fund (Preamble to Final Rule), 63 Fed. Reg. 142 (July 24, 1998), available at http://www.gpo.gov/fdsys/pkg/FR-1998-07-24/pdf/98-19418.pdf, and the new regulations issued in September 2016, see Child Care and Development Fund

NatioNal WomeN’s laW CeNter
reD lIGhT Green lIGhT: STaTe chIlD care aSSISTance POlIcIeS 2016 23
(Preamble to Final Rule), 81 Fed. Reg. 190 (September 30, 2016), available at https://www.federalregister.gov/ documents/2016/09/30/2016-22986/child-care-and-development-fund-program. Under the CCDBG Act of 2014, which codified the ways in which states must set reimbursement rates, states must set their rates using a market rate survey or alternative methodology that they have “developed and conducted (not earlier than 2 years before the date of the submission of the application containing the State plan).” Child Care and Development Block Grant Act of 2014, Pub. L. 113-186, 128 Stat. 1971, 1985-1986 (2014). Since the law also requires states to submit their plans only once every three years, Child Care and Development Block Grant Act of 2014, Pub. L. 113-186, 128 Stat. 1971, 1972 (2014), the effect of the statutory language is to permit rates to be set based on a market rate survey older than two years. However, this report, as in previous years, considers rates to be current if based on a market rate survey conducted no more than two years earlier.
57 For this analysis, a state’s reimbursement rates are not considered to be at the 75th percentile of market rates if only some of its rates—for example, for certain regions, age groups, or higher-quality care—are at the 75th percentile.
58 Montana, South Carolina, and South Dakota are not counted as setting their reimbursement rates at the 75th percentile of market rates, even though some of their reimbursement rates—including the rates shown in Table 4c—are at or above the 75th percentile of market rates, because the states’ reimbursement rates for some other categories fell below the 75th percentile of market rates.
59 These twenty-eight states are California, Colorado, Connecticut, Florida, Illinois, Indiana, Kansas, Kentucky, Louisiana, Maryland, Massachusetts, Missouri, Montana, Nebraska, New Hampshire, New Jersey, New Mexico, New York, North Carolina, Oregon, Rhode Island, South Carolina, South Dakota, Texas, Utah, Virginia, Washington, and Wisconsin. Colorado is included because some of its counties—which set rates and determine when to update them—increased their rates. Florida is included because some of its local early learning coalitions—which set rates and determine when to update them—increased their rates. Texas is included because twenty-two of its twenty-eight local boards—which set rates and determine when to update them—increased at least some of their rates. Illinois and New Jersey are included because they increased their rates for family child care, although not for centers. States are generally not included here if they increased only their higher rates for higher-quality care (tiered rates) and not their base rates; see note 74 and accompanying text for discussion of increases in tiered rates. However, North Carolina, which increased rates only for providers with three stars or higher in the state’s quality rating and improvement system (which has five star levels), is included here because the state requires all providers serving families receiving child care assistance (except religious-sponsored providers and providers with a temporary license) to have a rating of three stars or higher. Differences between rates shown in Table 4c of this report and rates shown in Table 4c of the State Child Care Assistance Policies 2014 and 2015 reports for any states other than those identified in this and the following endnote are due to revisions or recalculations of the data or changes in the category for which data are reported rather than policy changes.
60 These eighteen states are California, Connecticut, Florida, Kansas, Kentucky, Louisiana, Massachusetts, Missouri, Montana, Nebraska, New Hampshire, New Mexico, North Carolina, Oregon, Rhode Island, South Carolina, Texas, and Utah. Connecticut is included because it increased its rates for family child care, although not for centers. Florida is included because some of its local early learning coalitions increased their rates. New Mexico is included because it increased rates for care for preschool- and school-age children. North Carolina is included because it increased rates for care for infants and toddlers in eighty of the state’s 100 counties. Texas is included because nine of its twenty-eight local boards increased at least some of their rates. These states do not include Colorado because it did not report whether any counties updated their rates between February 2015 and February 2016.
61 States were asked to report data from their most recent market rate survey, and most states reported data from 2014 or more recent surveys. However, nine states—Arkansas, District of Columbia, Georgia, Kentucky, Montana, Nevada, New Jersey, New York, and Virginia—reported data from 2011, 2012, or 2013. The District of Columbia, Georgia, Nevada, and New Jersey are included in these thirty-one states because their reimbursement rates were 20 percent or more below the 75th percentile of market rates based on their outdated surveys, and so presumably their reimbursement rates would be 20 percent or more below the 75th percentile of current market rates. Arkansas, Kentucky, Montana, New York, and Virginia are not included in the thirty-one states because their reimbursement rates were less than 20 percent below the 75th percentile of market rates based on their outdated surveys, and thus it is not possible to calculate whether their reimbursement rates were 20 percent or more below the 75th percentile of current market rates.
62 The District of Columbia, Georgia, Nevada, and New Jersey are included in these twenty-two states because their reimbursement rates were 20 percent or more below the 75th percentile of market rates based on their outdated surveys, and so presumably their reimbursement rates would be 20 percent or more below the 75th percentile of current market rates. Arkansas, Kentucky, Montana, New York, and Virginia are not included in the twenty-two states because their reimbursement rates were less than 20 percent below the 75th percentile of market rates based on their outdated surveys, and thus it is not possible to calculate whether their reimbursement rates were 20 percent or more below the 75th percentile of current market rates.
63 Comparable data were not collected for 2001. However, comparable data were collected for 2000 and 2005. In each of these years, thirty-seven states permitted child care providers to charge parents the difference between the state reimbursement rate and the provider’s private fee. Karen Schulman and Helen Blank, Child Care Assistance Policies 2005: States Fail to Make Up Lost Ground, Families Continue to Lack Critical Supports (Washington, DC: National Women’s Law Center, 2005), 5, 18; Karen Schulman, Helen Blank, and Danielle Ewen, A Fragile Foundation: State Child Care Assistance Policies (Washington, DC: Children’s Defense Fund, 2001), 103.
64 This analysis is based on tiered rates in each state’s most populous city, county, or region. Within each state, the use and structure of tiered rates may vary across cities, counties, or regions.
65 Comparable data on tiered rates were not collected for 2001.66 The state that had higher reimbursement for higher-quality providers in 2015 but not 2016 is Rhode Island, which had provided the
additional reimbursement, in the form of monthly awards, for higher-quality care for infants and toddlers when at least 10 percent of the children enrolled by the provider were receiving child care assistance.
67 This state is Hawaii.68 This state is Massachusetts.69 This analysis is based on the number of different rate levels, not based on the number of quality levels. The base rate refers to the lowest rate
level, regardless of whether the base level is incorporated into the state’s quality rating and improvement system (for example, a base rate that is the initial one-star rate in a five-star rating system) or is not a level of the quality rating and improvement system (for example, a base rate that is the rate for providers not participating in a voluntary five-star rating system).
70 Between 2015 and 2016, three states changed how many rate levels they used. Arkansas reduced the number of its rate levels from four to three. Michigan increased the number of its rate levels from four to five. Texas increased the number of its rate levels from two to four.
71 Massachusetts is not included in this analysis because it does not have higher rates for higher-quality care for four-year-olds. Massachusetts’ highest rate for center care for a one-year-old was 22 percent below the 75th percentile of current market rates for this type of care.
72 These twenty-nine states include Florida and North Carolina, which determined a separate 75th percentile of current market rates for child care providers at each quality level. In North Carolina, the reimbursement rate at the highest quality level was lower than the 75th percentile
NatioNal WomeN’s laW CeNter
24 reD lIGhT Green lIGhT: STaTe chIlD care aSSISTance POlIcIeS 2016
for each of the state’s quality levels. Similarly, in Florida, the reimbursement rate at the highest quality was lower than the 75th percentile for each of the state’s quality levels.
73 Massachusetts’ highest rate for center care for a one-year-old was 3 percent above its lowest rate for this type of care.74 These five states are Michigan, Nebraska, New Mexico, Pennsylvania, and Texas. In addition, North Carolina increased the differential between
the lowest and highest rates for care for infants and toddlers in eighty of its 100 counties.75 These two states are Arkansas, which did not change its highest rate but had a reduction in the differential because it eliminated its previous
base rate; and South Carolina, which increased its highest rate but had a reduction in the differential because it increased its base rate as well.
76 See note 20 and accompanying text.77 These two states are Louisiana and Michigan. See the notes for Table 5 for more details about these and other states’ policy changes.78 This analysis is based on policies for families not connected to the TANF program. Additional states allowed families receiving or
transitioning from TANF to qualify for child care assistance while a parent searched for a job.79 These two states are the District of Columbia and Utah.80 These five states are the District of Columbia, Maine, Oklahoma, Oregon, and Pennsylvania.81 The total reported here for the number of states that allowed families to qualify for and begin receiving child care assistance while a parent
searched for a job in 2015 differs from that reported in the Building Blocks: State Child Care Assistance Policies 2015 due to a correction in data for Colorado.
82 These states include two states (Connecticut and Nevada) that improved their policies in one area and had cutbacks in another area.83 States are only counted here if they increased their income limit to qualify for assistance since, as discussed in the methodology section
above, this report focuses on the income criteria used to determine a family’s eligibility when it first applies for assistance. Some states have a separate exit eligibility limit for families already receiving child care assistance. The state that increased its income limit to qualify for child care assistance (Kentucky) established a separate exit eligibility limit as well, as described in the following endnote. In addition, Arkansas, which did not increase its income limit to qualify for assistance beyond an adjustment for inflation, began allowing families already receiving assistance to continue doing so until their income reached 85 percent of the 2016 state median income ($43,812 a year for a family of three) as of March 2016; previously, the state did not have a separate exit eligibility limit. Montana, which did not increase its income limit to qualify for assistance beyond an adjustment for inflation, began allowing families already receiving assistance to continue doing so until their income reached 185 percent of the 2016 federal poverty level ($37,296 a year for a family of three) as of July 2016; previously, the state did not have a separate exit eligibility limit. South Carolina, which did not increase its income limit to qualify for assistance beyond an adjustment for inflation, increased its exit eligibility limit for families already receiving child care assistance from 175 percent of the 2015 federal poverty level ($35,158 a year for a family of three) to 85 percent of the 2016 state median income ($45,492 a year for a family of three) as of May 2016. (The CCDBG Act of 2014 requires states to allow families to continue receiving child care assistance until the end their twelve-month eligibility period, regardless of temporary changes in their participation in work, training, or education or changes in their income, as long as their income does not exceed 85 percent of state median income, Child Care and Development Block Grant Act of 2014, Pub. L. 113-186, 128 Stat. 1978, 1979 (2014), and some states began implementing this provision after February 2016. However, states are not cited in this endnote if they started allowing families to remain eligible for child care assistance with incomes up to 85 percent of state median income until the end of their eligibility period, but did not change the income limit used to determine whether to renew the family’s eligibility at the beginning of a new period.)
84 Kentucky also increased its exit eligibility limit for families already receiving child care assistance from 165 percent of the 2011 federal poverty level ($30,574 a year for a family of three) to 165 percent of the 2016 federal poverty level ($33,264 a year for a family of three), to adjust for multiple years of inflation, as of September 2016.
85 Connecticut, which reduced its income limit to qualify for child care assistance from 50 percent of state median income ($44,601 a year for a family of three) to 30 percent of state median income ($26,761 a year for a family of three) from July 1, 2016 to July 31, 2016, is not counted here because this income limit reduction was temporary.
86 To be eligible for the new program (Smart Steps), parents must be employed at least thirty hours per week, or be enrolled and attending a postsecondary education program full time, or participate in a combination of employment and postsecondary education activities; must have a child between the ages of six weeks and five years; must live in a county that does not have a state-funded prekindergarten program or that has a waiting list for the prekindergarten program; and must have an income below 85 percent of state median income ($47,857 a year for a family of three).
87 Oklahoma, which froze intake from June 1, 2016 to July 31, 2016, is not counted here because this freeze on intake was temporary.88 For states that pay tiered rates, only if the state increased its base rate (the lowest rate) is it included here, and the reimbursement rate
increase described is an increase in the base rate. See notes 92 to 95 and accompanying text for discussion of increases in tiered rates.89 These eight states do not include Connecticut, which planned to increase its rates for licensed and license-exempt family child care (but not
centers) as of January 2017, or Oregon, which increased its rates for registered and certified family child care (but not centers) as of March 2016.
90 This example uses rates for Pennington County rather than Minnehaha County, which is the state’s most populous county and whose rates are shown in Table 4c, because Minnehaha County’s rates for center care for children under age three and children ages three to five were not changed in June 2016, since those rates already exceeded the 75th percentile of 2015 market rates. The state kept rates the same when the existing rates for a county or category were equal to or higher than the 75th percentile of 2015 market rates.
91 Washington increased base rates and tiered rates for licensed family child care providers by amounts sufficient for licensed family child care at levels three and higher of the state’s quality rating and improvement system to equal the 75th percentile of 2014 market rates.
92 These six states do not include Washington, which increased tiered rates for family child care providers (but not centers) at levels three and higher of the state’s quality rating and improvement system (which has five levels) as of July 2016.
93 The state’s 100 counties are ranked based on economic well-being and assigned a tier designation, with the forty most distressed counties designated as tier one, the next forty as tier two, and the twenty least distressed as tier three. The state increased reimbursement rates in tier one and tier two counties.
94 This example uses rates for Alamance County rather than Mecklenberg County, which is the state’s most populous county and whose rates are shown in Table 4d, because Mecklenberg County is in tier three and therefore did not have its tiered rates increased.
95 In June 2016, Ohio increased its rates from 10 percent to 18 percent above the base rate for two-star providers, from 15 percent to 18 percent above the base rate for three-star providers, from 20 percent to 25 percent above the base rate for four-star providers, and from 25 percent to 31 percent above the base rate for five-star providers; the rate for one-star providers remained at 5 percent above the base rate. In September 2016, Ohio increased the base amount used for calculating rates for star-rated providers by 4 percent, and then increased the enhancement added to that base amount to 21 percent for three-star providers, 29 percent for four-star providers, and 35 percent for five-star providers.

NatioNal WomeN’s laW CeNter
reD lIGhT Green lIGhT: STaTe chIlD care aSSISTance POlIcIeS 2016 25
96 A number of states reported that they planned to extend the amount of time families receiving child care assistance could continue to receive it while a parent searches for a job to three months to comply with the requirements of the CCDBG Act of 2014. States are only counted here if they reported that they planned to implement the change before February 2017.
97 Under the previous policy, Colorado gave counties the option of allowing families to continue receiving child care assistance while a parent searched for a job for more than sixty days. Under the new policy, Colorado gives counties the option of allowing families to continue receiving child care assistance while a parent searches for a job for more than thirteen weeks.
98 Under the previous policy, Colorado did not require counties to allow families to qualify for child care assistance while a parent searched for a job, but if a county chose to do so, it had to allow families to receive child care assistance for sixty days, and could allow parents to receive child care assistance for a longer period of time, while a parent searched for a job. Under the new policy, Colorado gives counties the option of allowing families to qualify for child care assistance while a parent searches for a job for more than thirteen weeks.
99 As of February 2016, North Carolina allowed families to receive an additional thirty days of child care assistance while a parent searched for a job, beyond the initial thirty days allowed, but only if the parent requested it and received approval.
100 As of February 2016, Vermont allowed families to receive an additional two months of child care assistance while a parent searched for a job, beyond the initial month allowed, but only if the parent requested it and received approval.
101 U.S. Department of Health and Human Services, Administration for Children and Families, Office of Child Care, FY 2014 CCDF Data Tables (Preliminary), Table 1 - Average Monthly Adjusted Number of Families and Children Served, available at http://www.acf.hhs.gov/programs/occ/resource/fy-2014-preliminary-data-table-1.
102 U.S. Department of Health and Human Services, Administration for Children and Families, Office of Child Care, FY 2013 CCDF Data Tables, Table 1 - Average Monthly Adjusted Number of Families and Children Served, available at http://www.acf.hhs.gov/programs/occ/resource/fy-2013-final-data-table-1-average-monthly-adjusted-number-of-families-and-children-served.
103 U.S. Department of Health and Human Services, Administration for Children and Families, Office of Child Care, FY 2001 CCDF Data Tables and Charts, Table 1 - Child Care and Development Fund Average Monthly Adjusted Number of Families and Children Served, available at http://www.acf.hhs.gov/sites/default/files/occ/fy2001tables1.pdf.
104 The number of related children under age six living in low-income families (families with incomes below 200 percent of poverty) increased from 9.5 million in 2001 to 10.6 million in 2013 and 10.8 million in 2014. U.S. Census Bureau, Current Population Survey, March 2002, Detailed Poverty Table 22. Age, Gender, Household Relationship, Race and Hispanic Origin - Poverty Status of People by Selected Characteristics in 2001, available at http://www.census.gov/hhes/www/cpstables/macro/032002/pov/new22_008.htm; Carmen DeNavas-Walt and Bernadette D. Proctor, U.S. Census Bureau, Current Population Reports, P60-249, Income and Poverty in the United States: 2013 (Washington, DC: U.S. Government Printing Office, 2014), 17, available at https://www.census.gov/content/dam/Census/library/publications/2014/demo/p60-249.pdf; Carmen DeNavas-Walt and Bernadette D. Proctor, U.S. Census Bureau, Current Population Reports, P60-252, Income and Poverty in the United States: 2014 (Washington, DC: U.S. Government Printing Office, 2015), 17, available at https://www.census.gov/content/dam/Census/library/publications/2015/demo/p60-252.pdf.
105 The number of related children under age six living in low-income families (families with incomes below 200 percent of poverty) was 10.3 million in 2015. Bernadette D. Proctor, Jessica L. Semega, and Melissa A. Kollar, U.S. Census Bureau, Current Population Reports, P60-256(RV), Income and Poverty in the United States: 2015 (Washington, DC: U.S. Government Printing Office, 2016), 17, available at http://www.census.gov/content/dam/Census/library/publications/2016/demo/p60-256.pdf.
106 U.S. Department of Health and Human Services, Office of Human Services Policy, Office of the Assistant Secretary for Planning and Evaluation, Estimates of Child Care Eligibility and Receipt for Fiscal Year 2012 (Washington, DC: U.S. Department of Health and Human Services, 2015), available at https://aspe.hhs.gov/pdf-report/estimates-child-care-eligibility-and-receipt-fiscal-year-2012.

NatioNal WomeN’s laW CeNter
26 reD lIGhT Green lIGhT: STaTe chIlD care aSSISTance POlIcIeS 2016
Alabama* $26,112 130% 47% $25,728 128% 47% $384 1% 0%Alaska* $54,288 269% 72% $54,288 270% 73% $0 -1% -1%Arizona* $33,168 165% 61% $32,676 163% 61% $492 2% -1%Arkansas* $29,760 148% 61% $29,760 148% 60% $0 -1% 1%California* $42,216 209% 65% $42,216 210% 65% $0 -1% 0%Colorado* $33,149-$61,343 164%-304% 46%-85% $25,727-$60,288 128%-300% 36%-84% $1,055-$7,422 4%-36% 1%-10%Connecticut* $44,601 221% 50% $43,770 218% 50% $831 3% 0%Delaware* $40,188 199% 56% $39,588 197% 55% $600 2% 0%District of Columbia* $45,775 227% 65% $45,775 228% 54% $0 -1% 11%Florida* $30,240 150% 55% $30,135 150% 55% $105 0% 0%Georgia* $28,160 140% 49% $28,160 140% 49% $0 0% 0%Hawaii $47,124 234% 65% $47,124 235% 66% $0 -1% -1%Idaho* $26,124 130% 50% $25,728 128% 49% $396 2% 1%Illinois* $32,544 161% 47% $36,612 182% 53% -$4,068 -21% -6%Indiana* $25,512 127% 42% $25,128 125% 42% $384 1% 0%Iowa* $29,136 145% 44% $28,716 143% 44% $420 2% -1%Kansas* $37,164 184% 58% $36,612 182% 58% $552 2% 1%Kentucky* $27,795 138% 48% $25,942 129% 46% $1,853 9% 2%Louisiana $31,860 158% 53% $31,860 159% 55% $0 -1% -2%Maine $54,589 271% 85% $49,475 246% 76% $5,114 25% 9%Maryland $29,990 149% 33% $29,990 149% 34% $0 -1% 0%Massachusetts* $44,593 221% 50% $43,909 219% 50% $684 3% 0%Michigan* $23,880 118% 38% $23,880 119% 38% $0 0% -1%Minnesota* $36,365 180% 47% $35,462 177% 47% $903 4% 0%Mississippi $34,999 174% 73% $34,999 174% 74% $0 -1% -1%Missouri* $27,720 138% 45% $24,036 120% 40% $3,684 18% 6%Montana* $30,132 149% 52% $29,688 148% 51% $444 2% 1%Nebraska* $26,112 130% 40% $25,728 128% 41% $384 1% -1%Nevada* $26,124 130% 47% $25,392 126% 46% $732 3% 1%New Hampshire* $50,225 249% 61% $49,475 246% 60% $750 3% 0%New Jersey* $39,580 196% 45% $39,580 197% 45% $0 -1% 0%New Mexico* $40,180 199% 79% $39,580 197% 81% $600 2% -2%New York* $40,180 199% 55% $39,580 197% 56% $600 2% 0%North Carolina* $40,180 199% 71% $39,576 197% 70% $604 2% 0%North Dakota* $63,348 314% 85% $61,524 306% 85% $1,824 8% 0%Ohio* $26,124 130% 40% $24,732 123% 39% $1,392 6% 1%Oklahoma* $35,100 174% 64% $35,100 175% 65% $0 -1% -1%Oregon* $37,188 184% 63% $37,188 185% 64% $0 -1% -1%Pennsylvania* $40,180 199% 57% $39,580 197% 58% $600 2% 0%Rhode Island* $36,162 179% 48% $35,622 177% 47% $540 2% 1%South Carolina* $30,135 149% 56% $29,685 148% 56% $450 2% 0%South Dakota* $36,625 182% 59% $36,075 180% 58% $550 2% 0%Tennessee $32,268 160% 58% $32,268 161% 60% $0 -1% -2%Texas* $37,167-$49,635 184%-246% 64%-85% $34,629-$48,384 172%-241% 61%-85% $1,251-$2,538 5%-12% 0%-3%Utah* $35,676 177% 60% $34,404 171% 60% $1,272 6% 0%Vermont $39,576 196% 57% $39,576 197% 58% $0 -1% -1%Virginia* $30,144-$50,232 150%-249% 39%-65% $29,295-$48,828 146%-243% 38%-64% $849-$1,404 4%-6% 1%Washington* $40,200 199% 56% $39,576 197% 56% $624 2% 0%West Virginia* $29,688 147% 52% $29,688 148% 53% $0 -1% -1%Wisconsin* $37,164 184% 54% $36,612 182% 54% $552 2% 0%Wyoming* $37,560 186% 56% $37,032 184% 58% $528 2% -2%
Table 1a: IncOme elIGIbIlITy lImITS fOr a famIly Of Three In 2016 anD 2015
Change in income limit 2015 to 2016
As As percent of As As As percent of As As As As annual 2016 federal percent of annual 2015 federal percent of annual percent percent of State dollar poverty level state median dollar poverty level state median dollar of state median amount ($20,160 a year) income amount ($20,090 a year) income amount poverty income
Income limit in 2016 Income limit in 2015

NatioNal WomeN’s laW CeNter
reD lIGhT Green lIGhT: STaTe chIlD care aSSISTance POlIcIeS 2016 27
Alabama* $26,112 130% 47% $18,048 123% 41% $8,064 6% 6%Alaska* $54,288 269% 72% $44,328 303% 75% $9,960 -34% -4%Arizona* $33,168 165% 61% $23,364 160% 52% $9,804 5% 8%Arkansas* $29,760 148% 61% $23,523 161% 60% $6,237 -13% 1%California* $42,216 209% 65% $35,100 240% 66% $7,116 -31% -1%Colorado* $33,149-$61,343 164%-304% 46%-85% $19,020-$32,000 130%-219% 36%-61% $14,129-$29,343 34%-86% 10%-24%Connecticut* $44,601 221% 50% $47,586 325% 75% -$2,985 -104% -25%Delaware* $40,188 199% 56% $29,260 200% 53% $10,928 -1% 3%District of Columbia* $45,775 227% 65% $34,700 237% 66% $11,075 -10% -1%Florida* $30,240 150% 55% $20,820 142% 45% $9,420 8% 10%Georgia* $28,160 140% 49% $24,278 166% 50% $3,882 -26% -1%Hawaii* $47,124 234% 65% $46,035 315% 83% $1,089 -81% -18%Idaho* $26,124 130% 50% $20,472 140% 51% $5,652 -10% -1%Illinois* $32,544 161% 47% $24,243 166% 43% $8,301 -4% 3%Indiana* $25,512 127% 42% $20,232 138% 41% $5,280 -12% 1%Iowa* $29,136 145% 44% $19,812 135% 41% $9,324 9% 3%Kansas* $37,164 184% 58% $27,060 185% 56% $10,104 -1% 2%Kentucky* $27,795 138% 48% $24,140 165% 55% $3,655 -27% -7%Louisiana* $31,860 158% 53% $29,040 205% 75% $2,820 -47% -22%Maine $54,589 271% 85% $36,452 249% 75% $18,137 22% 10%Maryland $29,990 149% 33% $25,140 172% 40% $4,850 -23% -7%Massachusetts* $44,593 221% 50% $28,968 198% 48% $15,625 23% 2%Michigan* $23,880 118% 38% $26,064 178% 47% -$2,184 -60% -10%Minnesota* $36,365 180% 47% $42,304 289% 76% -$5,939 -109% -29%Mississippi $34,999 174% 73% $30,999 212% 77% $4,000 -38% -4%Missouri* $27,720 138% 45% $17,784 122% 37% $9,936 16% 8%Montana* $30,132 149% 52% $21,948 150% 51% $8,184 -1% 1%Nebraska* $26,112 130% 40% $25,260 173% 54% $852 -43% -14%Nevada* $26,124 130% 47% $33,420 228% 67% -$7,296 -99% -20%New Hampshire* $50,225 249% 61% $27,797 190% 50% $22,428 59% 10%New Jersey* $39,580 196% 45% $29,260 200% 46% $10,320 -4% -2%New Mexico* $40,180 199% 79% $28,300 193% 75% $11,880 6% 4%New York* $40,180 199% 55% $28,644 202% 61% $11,536 -3% -6%North Carolina* $40,180 199% 71% $32,628 223% 69% $7,552 -24% 1%North Dakota* $63,348 314% 85% $29,556 202% 69% $33,792 112% 16%Ohio* $26,124 130% 40% $27,066 185% 57% -$942 -55% -17%Oklahoma* $35,100 174% 64% $29,040 198% 66% $6,060 -24% -2%Oregon* $37,188 184% 63% $27,060 185% 60% $10,128 0% 3%Pennsylvania* $40,180 199% 57% $29,260 200% 58% $10,920 -1% -1%Rhode Island* $36,162 179% 48% $32,918 225% 61% $3,244 -46% -12%South Carolina* $30,135 149% 56% $21,225 145% 45% $8,910 4% 11%South Dakota* $36,625 182% 59% $22,826 156% 52% $13,799 26% 7%Tennessee $32,268 160% 58% $24,324 166% 56% $7,944 -6% 2%Texas* $37,167-$49,635 184%-246% 64%-85% $21,228-$36,516 145%-250% 47%-82% $13,119-$15,939 -3%-39 3%-17%Utah* $35,676 177% 60% $28,248 193% 59% $7,428 -16% 1%Vermont $39,576 196% 57% $31,032 212% 64% $8,544 -16% -7%Virginia* $30,144-$50,232 150%-249% 39%-65% $21,948-$27,060 150%-185% 41%-50% $8,196-$23,172 0-64% -2%-15%Washington* $40,200 199% 56% $32,916 225% 63% $7,284 -26% -6%West Virginia* $29,688 147% 52% $28,296 193% 75% $1,392 -46% -22%Wisconsin* $37,164 184% 54% $27,060 185% 51% $10,104 -1% 3%Wyoming* $37,560 186% 56% $21,948 150% 47% $15,612 36% 9%
Table 1b: IncOme elIGIbIlITy lImITS fOr a famIly Of Three In 2016 anD 2001
As As percent As As As percent of As As As As annual of 2016 federal percent of annual 2001 federal percent of annual percent percent of State dollar poverty level state median dollar poverty level state median dollar of state median amount ($20,160 a year) income amount ($14,630 a year) income amount poverty income
Income limit in 2016 Income limit in 2001 Change in income limit 2001 to 2016

NatioNal WomeN’s laW CeNter
28 reD lIGhT Green lIGhT: STaTe chIlD care aSSISTance POlIcIeS 2016
nOTeS fOr TableS 1a anD 1b: IncOme elIGIbIlITy lImITSThe income eligibility limits shown in the tables represent the maximum income families can have when they apply for child care assistance. Some states allow families, once receiving assistance, to continue receiving assistance up to a higher income level than that initial limit. These higher exit eligibility limits are reported below for states that have them. (The CCDBG Act of 2014 requires states to allow families receiving assistance to continue doing so until the end of their 12-month eligibility period, regardless of temporary changes in participation in work, training, or education or increases in income, unless their income exceeds 85 percent of state median income. However, exit eligibility limits are only reported below if they apply not solely prior to the end of the eligibility period, but also when determining whether a family can renew its eligibility for assistance at the beginning of a new certification period.)
Changes in income limits were calculated using raw data, rather than the rounded numbers shown in the table.
All income limits given as dollar amounts below are for a family of three.
Data in the tables for 2016 reflect policies as of February 2016, data in the tables for 2015 reflect policies as of February 2015, and data in the tables for 2001 reflect policies as of June 2001, unless otherwise indicated. Certain changes in policies since February 2016 are noted below.
Alabama: In 2001, families already receiving assistance could continue doing so until their income reached $27,756. In 2015, the exit eligibility limit was $29,688, and in 2016, it was $30,132. As of October 2016, the income limit to qualify for assistance was increased to $26,208 (130
percent of poverty), and the exit eligibility limit was increased to $30,240 (150 percent of poverty), to adjust for the 2016 federal poverty level.
Alaska: The Alaska Permanent Fund Dividend (PFD) payment, which the majority of families in the state receive, is not counted when determining eligibility.
Arizona: As of September 2016, the income limit was increased to $33,264 (165 percent of poverty) to adjust for the 2016 federal poverty level.
Arkansas: As of March 2016, the income limit to qualify for assistance was increased to $30,926 (60 percent of state median income) to adjust for the updated state median income estimate. In addition, as of March 2016, a separate exit eligibility limit was established to allow
families already receiving assistance to continue doing so until their income reached $43,812 (85 percent of state median income). Also note that the income limit shown in Table 1b for 2001 takes into account a deduction of $100 per month ($1,200 per year) that was allowed for an adult household member who worked at least 30 hours per week, assuming there was one working parent. The stated income limit, in policy, was $22,323 in 2001. The state no longer used the deduction in 2015 or 2016.
California: Under policies in effect in 2001, families that had been receiving assistance as of January 1, 1998 could continue doing so until their income reached $46,800 since they were subject to higher income limits previously in effect. Also note that two counties (San Mateo and San
Francisco) allowed families already receiving assistance to continue doing so up to an income of $53,556 in 2015 and $56,904 in 2016.
Colorado: Counties set their income limits to qualify for assistance within state guidelines; the ranges in the tables reflect the minimum and maximum income limits allowed by the state. Counties may allow families to continue receiving assistance up to an exit eligibility limit that is
higher than the county’s initial eligibility limit. As of October 2016, the maximum level at which counties are allowed to set their income limits was increased to $62,781 (85 percent of state median income) to adjust for the updated state median income estimate.
Connecticut: Between July 1, 2016 and July 31, 2016, the income limit to qualify for assistance was temporarily reduced to $26,761 (30 percent of state median income). During this time, families already receiving assistance could continue doing so until their income reached $44,601 (50
percent of state median income), the income limit in effect before and after the temporary reduction.
Delaware: As of October 2016, the income limit was increased to $40,320 (200 percent of poverty) to adjust for the 2016 federal poverty level.
District of Columbia: In 2001, families already receiving assistance could continue doing so until their income reached $41,640. In 2015 and 2016, the exit eligibility limit was $51,101.
Florida: In 2015, families already receiving assistance could continue doing so until their income reached $40,180. In 2016, the exit eligibility limit was $40,320 (200 percent of poverty).
Georgia: As of October 2016, the income limit to qualify for assistance was increased to $28,748 (50 percent of state median income).
Hawaii: The income limit shown in Table 1b for 2001 takes into account a 20 percent deduction of all countable income. The stated income limit, in policy, was $36,828. The state no longer used the deduction in 2015 or 2016.
Idaho: As of October 2016, the income limit was increased to $26,208 (130 percent of poverty) to adjust for the 2016 federal poverty level.
Illinois: In 2016, families already receiving assistance could continue doing so until their income reached $37,176 (185 percent of the 2015 federal poverty level). The state did not have a separate exit eligibility limit in 2001 or 2015. Also note that the income limit shown in Table 1b
for 2001 takes into account a 10 percent earned income deduction. The stated income limit, in policy, was $21,819. The state no longer used the deduction in 2015 or 2016.
Indiana: In February 2015, families already receiving assistance could continue doing so until their income reached $33,648. As of May 2015, the exit eligibility limit was increased to $34,152 (170 percent of poverty) to adjust for the 2015 federal poverty level. As of February 2016, the
exit eligibility limit was increased to $50,736. As of May 2016, the income limit to qualify for assistance was increased to $25,608 (127 percent of poverty) to adjust for the 2016 federal poverty level, and the exit eligibility limit was increased to $51,624 (85 percent of state median income) to adjust for the updated state median income estimate.
Iowa: For special needs care, the income limit was $39,600 in 2015 and $40,188 in 2016. As of July 2016, the income limit for standard care was increased to $29,232 (145 percent of poverty), and the income limit for special needs care was increased to $40,320 (200 percent of
poverty), to adjust for the 2016 federal poverty level.
Kansas: As of May 2016, the income limit was increased to $37,296 (185 percent of poverty) to adjust for the 2016 federal poverty level.

NatioNal WomeN’s laW CeNter
reD lIGhT Green lIGhT: STaTe chIlD care aSSISTance POlIcIeS 2016 29
Kentucky: In 2016, families already receiving assistance could continue doing so until their income reached $30,574. The state did not have a separate exit eligibility limit in 2001 or 2015. As of September 2016, the income limit to qualify for assistance was increased to $32,256 (160
percent of poverty). In addition, as of September 2016, the exit eligibility limit was increased to $33,264 (165 percent of poverty) to adjust from the 2011 to the 2016 federal poverty level.
Louisiana: Data on the state’s policies as of 2001 are not available, so data on policies as of March 15, 2000 are used instead.
Massachusetts: In 2001, families already receiving assistance could continue doing so until their income reached $49,248. In 2015, the exit eligibility limit was $74,645, and in 2016, it was $75,808. Also note that, for special needs care, the income limit to qualify for assistance was
$74,645 in 2015 and $75,808 in 2016, and the exit eligibility limit was $87,818 in 2015 and $89,185 in 2016. As of October 2016, for standard care, the income limit to qualify for assistance was increased to $45,771 (50 percent of state median income), and the exit eligibility limit was increased to $77,810 (85 percent of state median income), to adjust for the updated state median income estimate.
Michigan: In 2016, families already receiving assistance could continue doing so until their income reached $48,828 (250 percent of the 2013 federal poverty level). The state did not have a separate exit eligibility limit in 2001 or 2015.
Minnesota: In 2015, families already receiving assistance could continue doing so until their income reached $50,554. In 2016, the exit eligibility limit was $51,840. The state did not have a separate exit eligibility limit in 2001. As of October 2016, the income limit to qualify for assistance
was increased to $37,264 (47 percent of state median income), and the exit eligibility limit was increased to $53,121 (67 percent of state median income), to adjust for the updated state median income estimate.
Missouri: In 2015, families already receiving assistance could continue doing so until their income reached $34,188. In 2016, the exit eligibility limit was $43,188. The state did not have a separate exit eligibility limit in 2001. As of April 2016, the income limit to qualify for assistance
was increased to $27,816 (138 percent of poverty), and the exit eligibility limit was increased to $43,344 (215 percent of poverty), to adjust for the 2016 federal poverty level.
Montana: As of July 2016, the income limit to qualify for assistance was increased to $30,240 (150 percent of poverty) to adjust for the 2016 federal poverty level. In addition, as of July 2016, a separate exit eligibility limit was established to allow families already receiving assistance to
continue doing so until their income reached $37,296 (185 percent of poverty).
Nebraska: In 2016, families already receiving assistance could continue doing so until their income reached $37,164. The state did not have a separate exit eligibility limit in 2001 or 2015; however, as of July 2014, the state began disregarding 10 percent of a family’s income at
redetermination if the family had been continuously eligible for assistance for 12 months. As of July 2016, the income limit to qualify for assistance was increased to $26,208 (130 percent of poverty), and the exit eligibility limit was increased to $37,296 (185 percent of poverty), to adjust for the 2016 federal poverty level. Also note that for families transitioning from TANF, the income limit was $36,612 in 2015 and $37,164 in 2016.
Nevada: For contracted slots (which are mostly used for before- and after-school programs) and wrap-around services (which are services provided before and after Head Start programs), the income limit to qualify for assistance was $43,764 (75 percent of the 2014 state median
income) in 2015 and $47,448 (85 percent of the 2016 state median income) in 2016. Also note that in 2016, families already receiving assistance (through either certificates or contracts) could continue doing so until their income reached $47,448. The state did not have a separate exit eligibility limit in 2001 or 2015.
New Hampshire: As of July 2016, the income limit was increased to $50,400 (250 percent of poverty) to adjust for the 2016 federal poverty level.
New Jersey: In 2001, families already receiving assistance could continue doing so until their income reached $36,575. In 2015 and 2016, the exit eligibility limit was $49,475. As of March 2016, the income limit to qualify for assistance was increased to $40,320 (200 percent of poverty), and
the exit eligibility limit was increased to $50,400 (250 percent of poverty), to adjust for the 2016 federal poverty level.
New Mexico: As of April 2016, the income limit was increased to $40,320 (200 percent of poverty) to adjust for the 2016 federal poverty level.
New York: Data on the state’s policies as of 2001 are not available, so data on policies as of March 15, 2000 are used instead. As of June 2016, the income limit was increased to $40,320 (200 percent of poverty) to adjust for the 2016 federal poverty level. Also note that a few small
demonstration projects set the income limit at $50,465 in 2015 and $51,230 in 2016.
North Carolina: The income limits shown in the tables for 2015 and 2016 apply to families with children birth through age five and families with children of any age who have special needs; the income limit for families with children ages six to 13 without special needs was $26,316 (133
percent of the 2014 federal poverty level) in 2015 and $26,720 (133 percent of the 2015 federal poverty level) in 2016. This separate income limit for families with older children went into effect in October 2014.
North Dakota: The income limit for assistance was reduced to $44,724 (60 percent of state median income) as of April 2016.
Ohio: In 2015, families already receiving assistance could continue doing so until their income reached $39,576 (200 percent of the 2014 federal poverty level). In 2016, the exit eligibility limit was $60,264 (300 percent of the 2015 federal poverty level). The state did not have a separate exit
eligibility limit in 2001.
Oklahoma: The income limit depends on how many children are in child care. The income limits shown in the tables assume that the family was receiving assistance for two children in care. The income limit for a family receiving assistance for only one child in care was $29,100 in 2015
and 2016.
Oregon: In 2016, families already receiving assistance could continue doing so until their income reached $52,344. The state did not have a separate exit eligibility limit in 2001 or 2015. As of March 2016, the income limit to qualify for assistance was increased to $37,296 (185 percent
of poverty), and the exit eligibility limit was changed to $50,400 (250 percent of poverty), to adjust for the 2016 federal poverty level. (The exit eligibility limit is set at 85 percent of state median income or 250 percent of poverty, whichever is higher.)

NatioNal WomeN’s laW CeNter
30 reD lIGhT Green lIGhT: STaTe chIlD care aSSISTance POlIcIeS 2016
Pennsylvania: In 2001, families already receiving assistance could continue doing so until their income reached $34,381. In 2015, the exit eligibility limit was $46,507, and in 2016, it was $47,212. As of May 2016, the income limit to qualify for assistance was increased to $40,320 (200
percent of poverty), and the exit eligibility limit was increased to $47,376 (235 percent of poverty), to adjust for the 2016 federal poverty level.
Rhode Island: In 2015, families already receiving assistance could continue doing so until their income reached $44,528, under a pilot program begun in October 2013 and extended through September 2017. In 2016, the exit eligibility limit was $45,203. As of April 2016, the income limit to
qualify for assistance was increased to $36,208 (180 percent of poverty), and the exit eligibility limit was increased to $45,360 (225 percent of poverty), to adjust for the 2016 federal poverty level.
South Carolina: In 2001, families already receiving assistance could continue doing so until their income reached $24,763. In 2015, the exit eligibility limit was $34,633, and in 2016, it was $35,158 (175 percent of the 2015 federal poverty level). As of May 2016, the exit eligibility limit was
increased to $45,492. As of October 2016, the income limit to qualify for assistance was increased to $30,240 (150 percent of poverty) to adjust for the 2016 federal poverty level, and the exit eligibility limit was increased to $47,511 (85 percent of state median income) to adjust for the updated state median income estimate.
South Dakota: The income limits shown in the tables take into account that the state disregards 4 percent of earned income. The stated income limits, in policy, were $21,913 in 2001, $34,632 in 2015, and $35,160 in 2016. As of March 2016, the stated income limit was increased to $35,280
(175 percent of poverty) to adjust for the 2016 federal poverty level.
Tennessee: In 2016, the income limit for teen parents and families receiving assistance through Smart Steps—a program launched in June 2016 that serves parents who are working or pursuing postsecondary education and who are not receiving or transitioning from TANF—was $47,172. As of October 2016, the income limit for teen parents and families receiving assistance through Smart Steps was increased to $47,857 (85 percent
of state median income), and the income limit for other families was increased to $33,780 (60 percent of state median income), to adjust for the updated state median income estimate.
Texas: Local workforce development boards set their income limits within state guidelines; the ranges shown in the tables indicate the lowest and highest income limits set by local boards. In addition, some local boards allow families an extended year of assistance up to a higher
income than the initial eligibility limit; however, this exit eligibility limit cannot exceed 85 percent of state median income ($48,384 in 2015 and $49,635 in 2016). As of October 2016, the maximum income at which local boards can set their eligibility limits was increased to $50,913 (85 percent of state median income) to adjust for the updated state median income estimate.
Utah: The income limits shown in the tables take into account a standard deduction of $100 per month ($1,200 per year) for each working parent, assuming there is one working parent in the family, and a standard deduction of $100 per month ($1,200 per year) for all families to help
cover any medical expenses. The stated income limits, in policy, were $25,848 in 2001, $32,004 in 2015, and $33,276 (56 percent of state median income) in 2016. Also note that in 2015, families already receiving assistance could continue doing so up to a stated income limit of $40,008. In 2016, the stated exit eligibility limit was $41,592 (70 percent of state median income). The stated income limit to qualify for special needs care was $48,576 in 2015 and $50,508 (85 percent of state median income) in 2016.
Virginia: The state has different income limits for different regions of the state. In 2001, the state had three separate regional income limits, which were: $21,948, $23,400, and $27,060. In 2015, the state had four separate regional income limits: $29,295, $31,248, $36,132, and $48,828. In
2016, the state also had four separate regional income limits: $30,144, $32,148, $37,176, and $50,232. As of October 2016, the income limits were increased to $30,240 (150 percent of poverty), $32,256 (160 percent of poverty), $37,296 (185 percent of poverty), and $50,400 (250 percent of poverty) to adjust for the 2016 federal poverty level.
Washington: As of April 2016, the income limit was increased to $40,320 (200 percent of poverty) to adjust for the 2016 federal poverty level.
West Virginia: In 2015 and 2016, families already receiving assistance could continue doing so until their income reached $36,612 (185 percent of the 2014 federal poverty level). The state did not have a separate exit eligibility limit in 2001.
Wisconsin: In 2001, families already receiving assistance could continue doing so until their income reached $29,256. In 2015, the exit eligibility limit was $39,576, and in 2016, it was $40,176. As of March 2016, the income limit to qualify for assistance was increased to $37,296 (185
percent of poverty), and the exit eligibility limit was increased to $40,320 (200 percent of poverty), to adjust for the 2016 federal poverty level.
Wyoming: The income limits shown in the tables for 2015 and 2016 take into account a standard deduction of $200 per month ($2,400 per year) for each working parent, assuming there is one working parent in the family. The stated income limits, in policy, were $34,632 in 2015 and
$35,160 in 2016. Also note that in 2001, families already receiving assistance could continue doing so until their income reached $27,060. In 2015, the stated exit eligibility limit was $44,532, and in 2016, it was $45,204. As of April 2016, the stated income limit to qualify for assistance was increased to $35,280 (175 percent of poverty), and the stated exit eligibility limit was increased to $45,360 (225 percent of poverty), to adjust for the 2016 federal poverty level.

NatioNal WomeN’s laW CeNter
reD lIGhT Green lIGhT: STaTe chIlD care aSSISTance POlIcIeS 2016 31
Table 2: WaITInG lISTS fOr chIlD care aSSISTance
Number of children Number of children Number of children State or families on waiting lists or families on waiting lists or families on waiting lists as of early 2016 as of early 2015 as of December 2001
Alabama* 8,363 children 7,887 children 5,089 childrenAlaska No waiting list No waiting list 588 childrenArizona* 4,865 children 1,064 children No waiting listArkansas* 2,703 children 4,409 children 8,000 childrenCalifornia* Waiting lists at local level Waiting lists at local level 280,000 children (estimated)Colorado* 24 children 45 children Waiting lists at county levelConnecticut* No waiting list No waiting list No waiting listDelaware No waiting list No waiting list No waiting listDistrict of Columbia* No waiting list No waiting list 9,124 childrenFlorida* 25,774 children 51,397 children 46,800 childrenGeorgia* No waiting list Frozen intake at local level 16,099 childrenHawaii No waiting list No waiting list No waiting listIdaho No waiting list No waiting list No waiting listIllinois* No waiting list No waiting list No waiting listIndiana* 6,226 children 9,120 children 11,958 childrenIowa No waiting list No waiting list No waiting listKansas No waiting list No waiting list No waiting listKentucky No waiting list No waiting list No waiting listLouisiana No waiting list No waiting list No waiting listMaine No waiting list No waiting list 2,000 childrenMaryland* 3,407 children 3,196 children No waiting listMassachusetts* 24,243 children 25,436 children 18,000 childrenMichigan No waiting list No waiting list No waiting listMinnesota* 7,200 families 4,417 families 4,735 childrenMississippi* 9,444 children 2,200 children 10,422 childrenMissouri No waiting list No waiting list No waiting listMontana No waiting list No waiting list Varies by resource and referral districtNebraska No waiting list No waiting list No waiting listNevada* 30 children 908 children No waiting listNew Hampshire No waiting list No waiting list No waiting listNew Jersey* No waiting list No waiting list 9,800 childrenNew Mexico* 1,085 children 126 children No waiting listNew York* Waiting lists at local level Waiting lists at local level Waiting lists at local levelNorth Carolina 20,330 children 31,359 children 25,363 childrenNorth Dakota No waiting list No waiting list No waiting listOhio No waiting list No waiting list No waiting listOklahoma* No waiting list No waiting list No waiting listOregon* 5,675 children 5,595 children No waiting listPennsylvania* 6,473 children 1,811 children 540 childrenRhode Island No waiting list No waiting list No waiting listSouth Carolina No waiting list No waiting list No waiting listSouth Dakota No waiting list No waiting list No waiting listTennessee* See notes See notes 9,388 children (and frozen intake)Texas* 20,412 children 17,730 children 36,799 childrenUtah No waiting list No waiting list No waiting listVermont No waiting list No waiting list No waiting listVirginia* 17,516 children 7,196 children 4,255 childrenWashington No waiting list No waiting list No waiting listWest Virginia No waiting list No waiting list No waiting listWisconsin No waiting list No waiting list No waiting listWyoming No waiting list No waiting list No waiting list
NatioNal WomeN’s laW CeNter
32 reD lIGhT Green lIGhT: STaTe chIlD care aSSISTance POlIcIeS 2016
nOTeS fOr Table 2: WaITInG lISTS fOr chIlD care aSSISTanceData in the tables for 2016 reflect policies as of February 2016, and data in the tables for 2015 reflect policies as of February 2015, unless otherwise indicated.
Alabama: Families receiving TANF that are participating in the JOBS employment program, families that have transitioned from TANF assistance within the past 6 months and are employed, minor parents working toward the completion of a high school diploma or a GED, families receiving protective services, and foster families are served without being placed on the waiting list. Also note that data for December 2001 are not available so data from November 2001 are used instead.
Arizona: Families receiving or transitioning from TANF who need child care for employment, families receiving TANF and participating in the state’s employment and training program, families referred by the Department of Child Safety, and foster families whose need for child care is
documented in their case plan are served without being placed on the waiting list.
Arkansas: Foster families, foster care transition families, families receiving protective services, families receiving TANF, families receiving Extended Support Services (which are available to certain families who lose eligibility for TANF due to earnings), homeless families, children with
special needs, and deployed parents are served without being placed on the waiting list.
California: The waiting list total for 2001 is an estimated figure. The state no longer has a centralized waiting list; most local contractors and some counties maintain waiting lists.
Colorado: Waiting lists are kept at the county level, rather than at the state level. Four counties had waiting lists in 2001, but data on the total number of children on waiting lists in counties that had them are not available. In addition, four counties had frozen intake in 2001. The
waiting list totals for 2015 and 2016 are the totals of reported county waiting lists. Counties determine whether to serve any groups of families without placing them on the waiting list; counties typically allow families receiving TANF and teen parents to be served without being placed on the waiting list. Families receiving child welfare services are also served without being placed on the waiting list.
Connecticut: The state started a waiting list as of August 2016.
District of Columbia: The waiting list total for 2001 may include some children living in the wider metropolitan area that encompasses parts of Maryland and Virginia.
Florida: The waiting list total for 2015 is from March 2015. Families receiving TANF and subject to federal work requirements and children up to age nine receiving protective services are not statutorily exempt from the waiting list, but they are prioritized for child care assistance.
Georgia: As of February 2015, certain counties froze intake for families who did not meet priority criteria. Children and families that receive priority for child care assistance include families participating in TANF activities, families transitioning from TANF, children with medically
documented special needs, grandparents raising grandchildren under age five, children with court-ordered supervision, families receiving child protective services, children in Division of Family and Children Services (DFCS) custody, parents under age 18, children participating in the state-funded prekindergarten program, and victims of state- or federally declared natural disasters. No counties had frozen intake as of February 2016.
Illinois: Between July 2015 and November 2015, the state temporarily froze intake for all families applying for assistance with incomes above 50 percent of poverty, unless the family was receiving TANF, had a child with special needs, or was headed by a teen parent attending high
school or a GED program full time.
Indiana: In addition to the waiting list, some counties froze intake in 2001. Families receiving TANF and participating in the state’s employment and training program are served without being placed on the waiting list.
Maryland: The waiting list total for 2015 is from July 31, 2015. Families receiving or transitioning from TANF, families receiving Supplemental Security Income (SSI), and children with documented disabilities are served without being placed on the waiting list.
Massachusetts: The figures reported in the table represent the number of applications received; the state does not determine families’ eligibility at the time they are added to the waiting list. Also note that families receiving TANF and participating in the employment services program and
families referred by the child welfare agency based on open cases of abuse or neglect are served without being placed on the waiting list.
Minnesota: The waiting list total for 2015 is from March 2015. Families receiving TANF, families transitioning from TANF (for up to one year after their TANF case closes), and parents under 21 years of age pursuing a high school degree or GED are served without being placed on the
waiting list.
Mississippi: The figures reported in the table for 2015 and 2016 represent the number of applications received; the state does not determine families’ eligibility at the time they are added to the waiting list. Also note that the total for 2016 is from July 2016.
Nevada: Families receiving or transitioning from TANF and families with foster care or child protective services placements are served without being placed on the waiting list.
New Jersey: Data for 2001 are not available, so data from March 2002 are used instead.
New Mexico: In 2015 and 2016, families with incomes at or below 150 percent of poverty were served without being placed on the waiting list. In addition, families receiving or transitioning from TANF, teen parents in school, families with children who have special needs, and homeless
families are served without being placed on the waiting list.
New York: Waiting lists are kept at the local district level and statewide data are not available. Each local district also has the authority to freeze intake and stop adding names to its waiting list.

NatioNal WomeN’s laW CeNter
reD lIGhT Green lIGhT: STaTe chIlD care aSSISTance POlIcIeS 2016 33
Oklahoma: The state temporarily froze intake from June 1, 2016 to July 31, 2016. During this time, children receiving child welfare services, children adopted through the Department of Human Services who met certain criteria, children in trial reunification, and families receiving TANF
and participating in approved work activities were served and not subject to the freeze.
Oregon: Families with at least one member who has received TANF in the state in the current or previous three months; caretakers reapplying after a break of less than two months; families referred from child welfare services when an ongoing safety plan states that child care is needed
to keep (or return) a child home, with a relative, or other known adult; families with a member who is currently eligible or has been eligible for domestic violence survivor benefits in any of the preceding three months; and families applying for an open slot with a contracted child care program are served without being placed on the waiting list. The waiting list total for 2016 is from July 2016. As of August 2016, the state deactivated the waiting list, serving families who had been on the waiting list and serving new applicants without placing them on the waiting list.
Pennsylvania: The waiting list total for 2016 is from December 2015. Families receiving or transitioning from TANF, or receiving Supplemental Nutrition Assistance Program (SNAP) benefits, are served without being placed on the waiting list.
Tennessee: When the state reported its data in 2001, intake was frozen for all families other than those receiving or transitioning from TANF. The waiting list total for 2001 represents the number of children on the waiting list when intake was closed. In 2015 and 2016, the state did
not serve any families or children other than families receiving or transitioning from TANF, teen-parent families, children in foster care or receiving protective services, children receiving TANF and being cared for by someone other than their parents, and families qualifying for Diversion Child Care (families that meet TANF eligibility criteria, have an identifiable one-time financial need, have not received cash assistance in any state in the last two years, and have a recent work history); however, the state no longer refers to this policy as frozen intake. As of June 2016, the state launched a new program, Smart Steps, that provides child care assistance to families not receiving or transitioning from TANF. To be eligible, parents must be employed at least 30 hours per week, or be enrolled in and attending a postsecondary education program full time, or participate in a combination of employment and postsecondary education activities; must have a child between ages six weeks and five years; must live in a county that does not have a state-funded prekindergarten program or that has a waiting list for the prekindergarten program; and must have an income below 85 percent of state median income ($47,857 a year for a family of three).
Texas: Local workforce development boards maintain waiting lists. The totals in the table represent the aggregate number of children on waiting lists across all of the state’s 28 boards. In addition, some boards have frozen intake. In 2015, 14 boards had a waiting list and 3 boards had frozen
intake (including some of which may have had both a waiting list and frozen intake). In 2016, 17 boards had a waiting list and 7 boards had frozen intake (including some of which may have had both a waiting list and frozen intake). Families in the TANF work program (Choices), families in the SNAP Employment and Training program, families transitioning from TANF, and children receiving protective services are served without being placed on the waiting list.
Virginia: Data for December 2001 are not available, so data from January 2001 are used instead. Families receiving TANF and families with children enrolled in Head Start are served without being placed on the waiting list.

NatioNal WomeN’s laW CeNter
34 reD lIGhT Green lIGhT: STaTe chIlD care aSSISTance POlIcIeS 2016
Alabama* Not eligible Not eligible Not eligible Not eligible $215 12% N/A N/A N/A N/AAlaska* $124 5% $124 5% $71 4% $0 0% $53 1%Arizona* $152 6% $152 6% $217 12% $0 0% -$65 -6%Arkansas* Not eligible Not eligible Not eligible Not eligible $224 12% N/A N/A N/A N/ACalifornia* $128 5% $128 5% $0 0% $0 0% $128 5%Colorado* $277 11% $276 11% $185 10% $1 0% $92 1%Connecticut* $151 6% $151 6% $110 6% $0 0% $41 0%Delaware* $264 10% $264 11% $159 9% $0 0% $105 2%District of Columbia* $118 5% $118 5% $91 5% $0 0% $27 0%Florida* $217 9% $217 9% $104 6% $0 0% $113 3%Georgia* Not eligible Not eligible Not eligible Not eligible $139 8% N/A N/A N/A N/AHawaii* $473 19% $473 19% $38 2% $0 0% $435 17%Idaho* Not eligible Not eligible Not eligible Not eligible Not eligible Not eligible N/A N/A N/A N/AIllinois* $221 9% $191 8% $134 7% $30 1% $87 1%Indiana* $227 9% $227 9% $154 8% $0 0% $73 1%Iowa* Not eligible Not eligible Not eligible Not eligible Not eligible Not eligible N/A N/A N/A N/AKansas* $207 8% $207 8% $162 9% $0 0% $45 -1%Kentucky $281 11% Not eligible Not eligible $177 10% N/A N/A $104 1%Louisiana* $65 3% $227 9% $114 6% -$162 -6% -$49 -4%Maine $226 9% $226 9% $183 10% $0 0% $43 -1%Maryland* Not eligible Not eligible Not eligible Not eligible $236 13% N/A N/A N/A N/AMassachusetts* $325 13% $325 13% $160 9% $0 0% $165 4%Michigan* $54 2% Not eligible Not eligible $24 1% N/A N/A $30 1%Minnesota $82 3% $82 3% $53 3% $0 0% $29 0%Mississippi* $180 7% $180 7% $105 6% $0 0% $75 1%Missouri* $201 8% $287 11% Not eligible Not eligible -$87 -3% N/A N/AMontana* Not eligible Not eligible Not eligible Not eligible $256 14% N/A N/A N/A N/ANebraska* $190 8% Not eligible Not eligible $129 7% N/A N/A $61 0%Nevada* $149 6% Not eligible Not eligible $281 15% N/A N/A -$132 -9%New Hampshire* $315 13% $314 12% $2 0% $1 0% $313 12%New Jersey* $106 4% $106 4% $133 7% $0 0% -$27 -3%New Mexico* $171 7% $174 7% $115 6% -$3 0% $56 0%New York* $296 12% $302 12% $191 10% -$6 0% $105 1%North Carolina* $252 10% $251 10% $159 9% $1 0% $93 1%North Dakota* $109 4% $106 4% $293 16% $3 0% -$184 -12%Ohio* $227 9% $216 9% $88 5% $11 0% $139 4%Oklahoma* $226 9% $226 9% $146 8% $0 0% $80 1%Oregon* $460 18% $455 18% $319 17% $5 0% $141 1%Pennsylvania* $229 9% $229 9% $152 8% $0 0% $77 1%Rhode Island* $201 8% $201 8% $19 1% $1 0% $182 7%South Carolina* $87 3% $87 3% $77 4% $0 0% $10 -1%South Dakota* $363 14% $362 14% $365 20% $1 0% -$2 -6%Tennessee* $173 7% $178 7% $112 6% -$5 0% $61 1%Texas* $125-$270 5%-11% $125-$270 5%-11% $165-$256 9%-14% $0 0% -$40-$14 -4%- -3%Utah* $221 9% $213 8% $220 12% $8 0% $1 -3%Vermont* $260 10% $260 10% $123 7% $0 0% $137 4%Virginia* $201 8% $201 8% $183 10% $0 0% $18 -2%Washington $174 7% $187 7% $87 5% -$13 -1% $87 2%West Virginia* $119 5% $119 5% $54 3% $0 0% $65 2%Wisconsin* $247 10% $247 10% $160 9% $0 0% $87 1%Wyoming $43 2% $43 2% $98 5% $0 0% -$55 -4%
Table 3a: ParenT cOPaymenTS fOr a famIly Of Three WITh an IncOme aT 150 PercenT Of POverTy anD One chIlD In care
Monthly fee in 2016 Monthly fee in 2015 Monthly fee in 2001 Change 2015 to 2016 Change 2001 to 2016
StateAs
a dollar amount
As a percent of income
As a dollar amount
As a percent of income
As a dollar amount
As a percent of income
In dollar
amount
In percent
of income
In dollar
amount
In percent
of income

NatioNal WomeN’s laW CeNter
reD lIGhT Green lIGhT: STaTe chIlD care aSSISTance POlIcIeS 2016 35
Alabama* $67 4% $67 4% $65 5% $0 0% $2 -1%Alaska* $49 3% $49 3% $14 1% $0 0% $35 2%Arizona* $65 4% $65 4% $65 5% $0 0% $0 -1%Arkansas* $31 2% $37 2% $0 0% -$6 0% $31 2%California* $0 0% $0 0% $0 0% $0 0% $0 0%Colorado* $34 2% $33 2% $113 9% $0 0% -$79 -7%Connecticut* $67 4% $67 4% $49 4% $0 0% $18 0%Delaware* $120 7% $120 7% $55 5% $0 0% $65 3%District of Columbia* $53 3% $44 3% $32 3% $9 1% $21 1%Florida* $130 8% $130 8% $69 6% $0 0% $61 2%Georgia* $143 9% $143 9% $21 2% $0 0% $122 7%Hawaii* $270 16% $270 16% $0 0% $0 0% $270 16%Idaho * $50 3% $50 3% $65 5% $0 0% -$15 -2%Illinois* $86 5% $75 4% $65 5% $11 1% $21 0%Indiana* $84 5% $84 5% $0 0% $0 0% $84 5%Iowa* $9 1% $9 1% $22 2% $0 0% -$13 -1%Kansas* $58 3% $58 3% $22 2% $0 0% $36 2%Kentucky $132 8% $130 8% $97 8% $2 0% $35 0%Louisiana* $43 3% $152 9% $49 4% -$108 -6% -$6 -1%Maine $100 6% $100 6% $97 8% $0 0% $3 -2%Maryland* $244 15% $244 15% $90 7% $0 0% $154 7%Massachusetts* $162 10% $141 8% $40 3% $22 1% $122 6%Michigan* $32 2% $24 1% $24 2% $8 0% $8 0%Minnesota $48 3% $45 3% $5 0% $2 0% $43 2%Mississippi* $97 6% $97 6% $47 4% $0 0% $50 2%Missouri* $108 6% $108 6% $43 4% $0 0% $65 3%Montana* $67 4% $67 4% $49 4% $0 0% $18 0%Nebraska* $63 4% $63 4% $30 2% $0 0% $33 1%Nevada* $50 3% $50 3% $0 0% $0 0% $50 3%New Hampshire* $126 8% $126 7% $0 0% $0 0% $126 8%New Jersey* $77 5% $77 5% $71 6% $0 0% $6 -1%New Mexico* $75 4% $76 5% $47 4% -$1 0% $28 1%New York* $4 0% $9 1% $4 0% -$5 0% $0 0%North Carolina* $168 10% $167 10% $106 9% $1 0% $62 1%North Dakota* $38 2% $37 2% $158 13% $1 0% -$120 -11%Ohio* $123 7% $119 7% $43 4% $4 0% $80 4%Oklahoma* $139 8% $139 8% $54 4% $0 0% $85 4%Oregon* $176 10% $173 10% $90 7% $3 0% $86 3%Pennsylvania* $134 8% $134 8% $65 5% $0 0% $69 3%Rhode Island* $34 2% $33 2% $0 0% $0 0% $34 2%South Carolina* $61 4% $61 4% $43 4% $0 0% $18 0%South Dakota* $0 0% $0 0% $0 0% $0 0% $0 0%Tennessee* $117 7% $113 7% $39 3% $4 0% $78 4%Texas* $55-$180 3%-11% $55-$180 3%-11% $109-$170 9%-14% $0 0% -$54-$10 -6%- -3%Utah* $17 1% $16 1% $36 3% $1 0% -$19 -2%Vermont* $6 0% $6 0% $0 0% $0 0% $6 0%Virginia* $100 6% $100 6% $122 10% $0 0% -$22 -4%Washington $65 4% $65 4% $20 2% $0 0% $45 2%West Virginia* $76 5% $76 5% $27 2% $0 0% $49 2%Wisconsin* $113 7% $108 6% $61 5% $5 0% $52 2%Wyoming $0 0% $0 0% $10 1% $0 0% -$10 -1%
Table 3b: ParenT cOPaymenTS fOr a famIly Of Three WITh an IncOme aT 100 PercenT Of POverTy anD One chIlD In care
Monthly fee in 2016 Monthly fee in 2015 Monthly fee in 2001 Change 2015 to 2016 Change 2001 to 2016
As a dollar amount
As a percent of income
As a dollar amount
As a percent of income
As a dollar amount
As a percent of income
In dollar
amount
In percent
of income
In dollar
amount
In percent
of incomeState
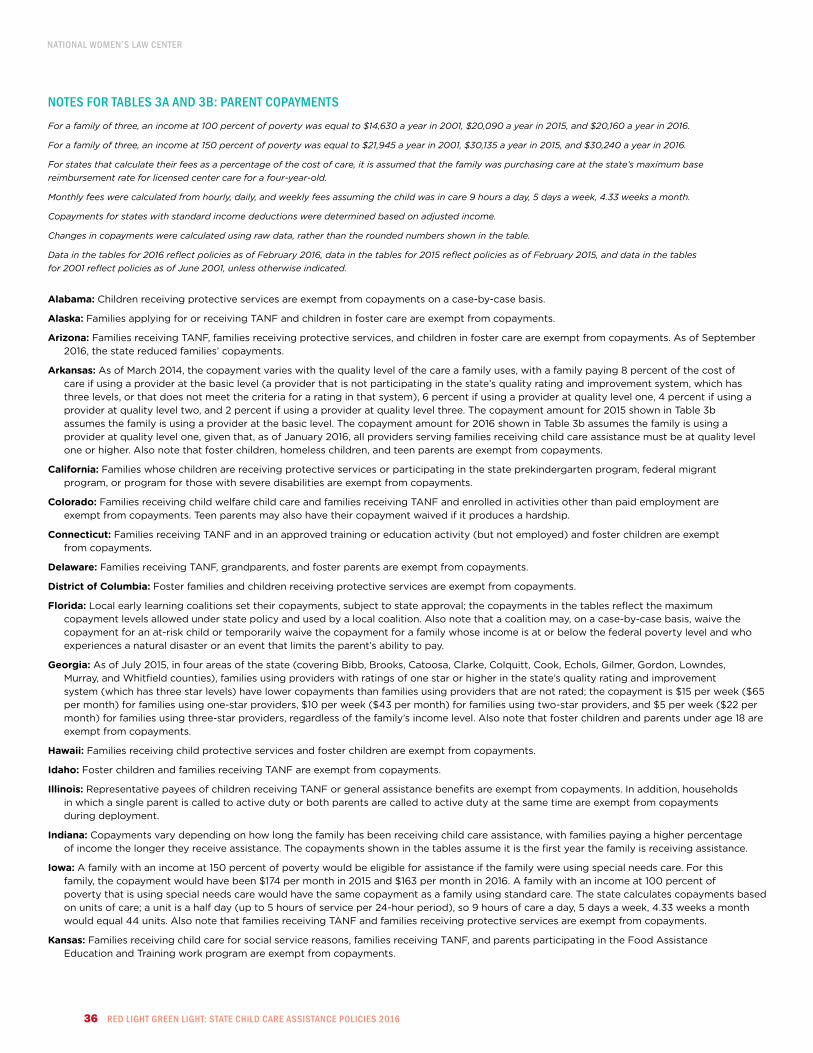
NatioNal WomeN’s laW CeNter
36 reD lIGhT Green lIGhT: STaTe chIlD care aSSISTance POlIcIeS 2016
nOTeS fOr TableS 3a anD 3b: ParenT cOPaymenTSFor a family of three, an income at 100 percent of poverty was equal to $14,630 a year in 2001, $20,090 a year in 2015, and $20,160 a year in 2016.
For a family of three, an income at 150 percent of poverty was equal to $21,945 a year in 2001, $30,135 a year in 2015, and $30,240 a year in 2016.
For states that calculate their fees as a percentage of the cost of care, it is assumed that the family was purchasing care at the state’s maximum base reimbursement rate for licensed center care for a four-year-old.
Monthly fees were calculated from hourly, daily, and weekly fees assuming the child was in care 9 hours a day, 5 days a week, 4.33 weeks a month.
Copayments for states with standard income deductions were determined based on adjusted income.
Changes in copayments were calculated using raw data, rather than the rounded numbers shown in the table.
Data in the tables for 2016 reflect policies as of February 2016, data in the tables for 2015 reflect policies as of February 2015, and data in the tables for 2001 reflect policies as of June 2001, unless otherwise indicated.
Alabama: Children receiving protective services are exempt from copayments on a case-by-case basis.
Alaska: Families applying for or receiving TANF and children in foster care are exempt from copayments.
Arizona: Families receiving TANF, families receiving protective services, and children in foster care are exempt from copayments. As of September 2016, the state reduced families’ copayments.
Arkansas: As of March 2014, the copayment varies with the quality level of the care a family uses, with a family paying 8 percent of the cost of care if using a provider at the basic level (a provider that is not participating in the state’s quality rating and improvement system, which has
three levels, or that does not meet the criteria for a rating in that system), 6 percent if using a provider at quality level one, 4 percent if using a provider at quality level two, and 2 percent if using a provider at quality level three. The copayment amount for 2015 shown in Table 3b assumes the family is using a provider at the basic level. The copayment amount for 2016 shown in Table 3b assumes the family is using a provider at quality level one, given that, as of January 2016, all providers serving families receiving child care assistance must be at quality level one or higher. Also note that foster children, homeless children, and teen parents are exempt from copayments.
California: Families whose children are receiving protective services or participating in the state prekindergarten program, federal migrant program, or program for those with severe disabilities are exempt from copayments.
Colorado: Families receiving child welfare child care and families receiving TANF and enrolled in activities other than paid employment are exempt from copayments. Teen parents may also have their copayment waived if it produces a hardship.
Connecticut: Families receiving TANF and in an approved training or education activity (but not employed) and foster children are exempt from copayments.
Delaware: Families receiving TANF, grandparents, and foster parents are exempt from copayments.
District of Columbia: Foster families and children receiving protective services are exempt from copayments.
Florida: Local early learning coalitions set their copayments, subject to state approval; the copayments in the tables reflect the maximum copayment levels allowed under state policy and used by a local coalition. Also note that a coalition may, on a case-by-case basis, waive the
copayment for an at-risk child or temporarily waive the copayment for a family whose income is at or below the federal poverty level and who experiences a natural disaster or an event that limits the parent’s ability to pay.
Georgia: As of July 2015, in four areas of the state (covering Bibb, Brooks, Catoosa, Clarke, Colquitt, Cook, Echols, Gilmer, Gordon, Lowndes, Murray, and Whitfield counties), families using providers with ratings of one star or higher in the state’s quality rating and improvement
system (which has three star levels) have lower copayments than families using providers that are not rated; the copayment is $15 per week ($65 per month) for families using one-star providers, $10 per week ($43 per month) for families using two-star providers, and $5 per week ($22 per month) for families using three-star providers, regardless of the family’s income level. Also note that foster children and parents under age 18 are exempt from copayments.
Hawaii: Families receiving child protective services and foster children are exempt from copayments.
Idaho: Foster children and families receiving TANF are exempt from copayments.
Illinois: Representative payees of children receiving TANF or general assistance benefits are exempt from copayments. In addition, households in which a single parent is called to active duty or both parents are called to active duty at the same time are exempt from copayments
during deployment.
Indiana: Copayments vary depending on how long the family has been receiving child care assistance, with families paying a higher percentage of income the longer they receive assistance. The copayments shown in the tables assume it is the first year the family is receiving assistance.
Iowa: A family with an income at 150 percent of poverty would be eligible for assistance if the family were using special needs care. For this family, the copayment would have been $174 per month in 2015 and $163 per month in 2016. A family with an income at 100 percent of
poverty that is using special needs care would have the same copayment as a family using standard care. The state calculates copayments based on units of care; a unit is a half day (up to 5 hours of service per 24-hour period), so 9 hours of care a day, 5 days a week, 4.33 weeks a month would equal 44 units. Also note that families receiving TANF and families receiving protective services are exempt from copayments.
Kansas: Families receiving child care for social service reasons, families receiving TANF, and parents participating in the Food Assistance Education and Training work program are exempt from copayments.
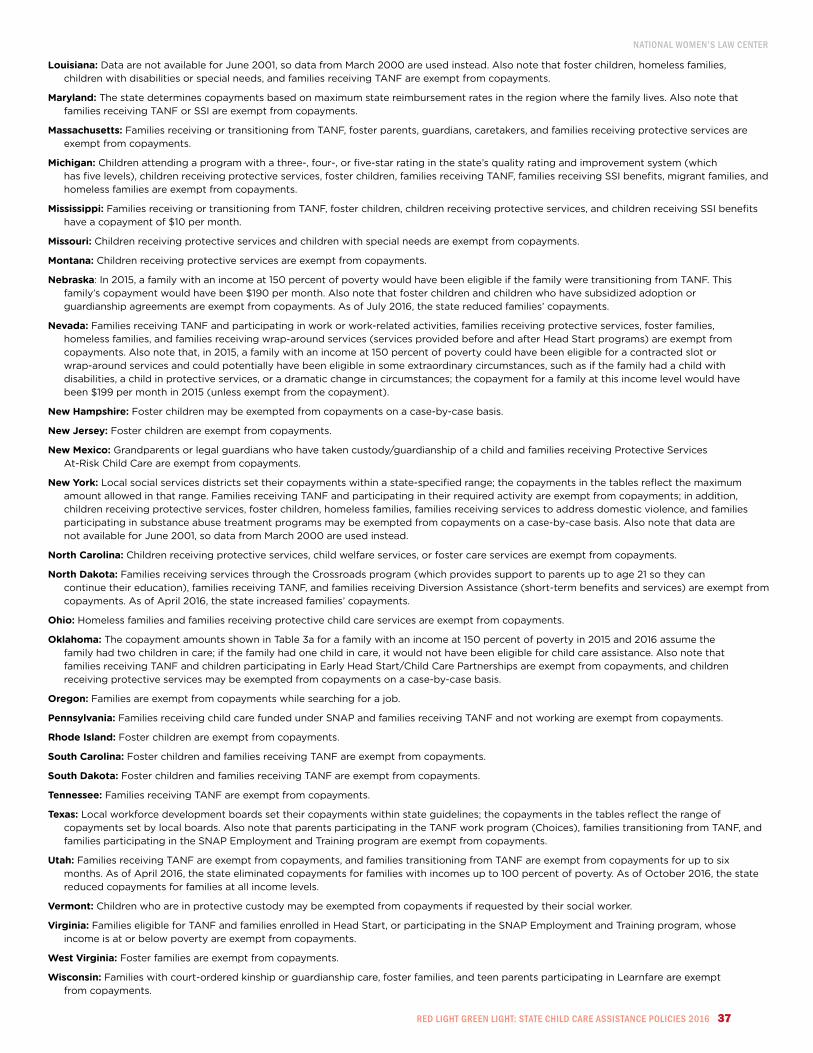
NatioNal WomeN’s laW CeNter
reD lIGhT Green lIGhT: STaTe chIlD care aSSISTance POlIcIeS 2016 37
Louisiana: Data are not available for June 2001, so data from March 2000 are used instead. Also note that foster children, homeless families, children with disabilities or special needs, and families receiving TANF are exempt from copayments.
Maryland: The state determines copayments based on maximum state reimbursement rates in the region where the family lives. Also note that families receiving TANF or SSI are exempt from copayments.
Massachusetts: Families receiving or transitioning from TANF, foster parents, guardians, caretakers, and families receiving protective services are exempt from copayments.
Michigan: Children attending a program with a three-, four-, or five-star rating in the state’s quality rating and improvement system (which has five levels), children receiving protective services, foster children, families receiving TANF, families receiving SSI benefits, migrant families, and
homeless families are exempt from copayments.
Mississippi: Families receiving or transitioning from TANF, foster children, children receiving protective services, and children receiving SSI benefits have a copayment of $10 per month.
Missouri: Children receiving protective services and children with special needs are exempt from copayments.
Montana: Children receiving protective services are exempt from copayments.
Nebraska: In 2015, a family with an income at 150 percent of poverty would have been eligible if the family were transitioning from TANF. This family’s copayment would have been $190 per month. Also note that foster children and children who have subsidized adoption or
guardianship agreements are exempt from copayments. As of July 2016, the state reduced families’ copayments.
Nevada: Families receiving TANF and participating in work or work-related activities, families receiving protective services, foster families, homeless families, and families receiving wrap-around services (services provided before and after Head Start programs) are exempt from
copayments. Also note that, in 2015, a family with an income at 150 percent of poverty could have been eligible for a contracted slot or wrap-around services and could potentially have been eligible in some extraordinary circumstances, such as if the family had a child with disabilities, a child in protective services, or a dramatic change in circumstances; the copayment for a family at this income level would have been $199 per month in 2015 (unless exempt from the copayment).
New Hampshire: Foster children may be exempted from copayments on a case-by-case basis.
New Jersey: Foster children are exempt from copayments.
New Mexico: Grandparents or legal guardians who have taken custody/guardianship of a child and families receiving Protective Services At-Risk Child Care are exempt from copayments.
New York: Local social services districts set their copayments within a state-specified range; the copayments in the tables reflect the maximum amount allowed in that range. Families receiving TANF and participating in their required activity are exempt from copayments; in addition,
children receiving protective services, foster children, homeless families, families receiving services to address domestic violence, and families participating in substance abuse treatment programs may be exempted from copayments on a case-by-case basis. Also note that data are not available for June 2001, so data from March 2000 are used instead.
North Carolina: Children receiving protective services, child welfare services, or foster care services are exempt from copayments.
North Dakota: Families receiving services through the Crossroads program (which provides support to parents up to age 21 so they can continue their education), families receiving TANF, and families receiving Diversion Assistance (short-term benefits and services) are exempt from
copayments. As of April 2016, the state increased families’ copayments.
Ohio: Homeless families and families receiving protective child care services are exempt from copayments.
Oklahoma: The copayment amounts shown in Table 3a for a family with an income at 150 percent of poverty in 2015 and 2016 assume the family had two children in care; if the family had one child in care, it would not have been eligible for child care assistance. Also note that
families receiving TANF and children participating in Early Head Start/Child Care Partnerships are exempt from copayments, and children receiving protective services may be exempted from copayments on a case-by-case basis.
Oregon: Families are exempt from copayments while searching for a job.
Pennsylvania: Families receiving child care funded under SNAP and families receiving TANF and not working are exempt from copayments.
Rhode Island: Foster children are exempt from copayments.
South Carolina: Foster children and families receiving TANF are exempt from copayments.
South Dakota: Foster children and families receiving TANF are exempt from copayments.
Tennessee: Families receiving TANF are exempt from copayments.
Texas: Local workforce development boards set their copayments within state guidelines; the copayments in the tables reflect the range of copayments set by local boards. Also note that parents participating in the TANF work program (Choices), families transitioning from TANF, and
families participating in the SNAP Employment and Training program are exempt from copayments.
Utah: Families receiving TANF are exempt from copayments, and families transitioning from TANF are exempt from copayments for up to six months. As of April 2016, the state eliminated copayments for families with incomes up to 100 percent of poverty. As of October 2016, the state
reduced copayments for families at all income levels.
Vermont: Children who are in protective custody may be exempted from copayments if requested by their social worker.
Virginia: Families eligible for TANF and families enrolled in Head Start, or participating in the SNAP Employment and Training program, whose income is at or below poverty are exempt from copayments.
West Virginia: Foster families are exempt from copayments.
Wisconsin: Families with court-ordered kinship or guardianship care, foster families, and teen parents participating in Learnfare are exempt from copayments.
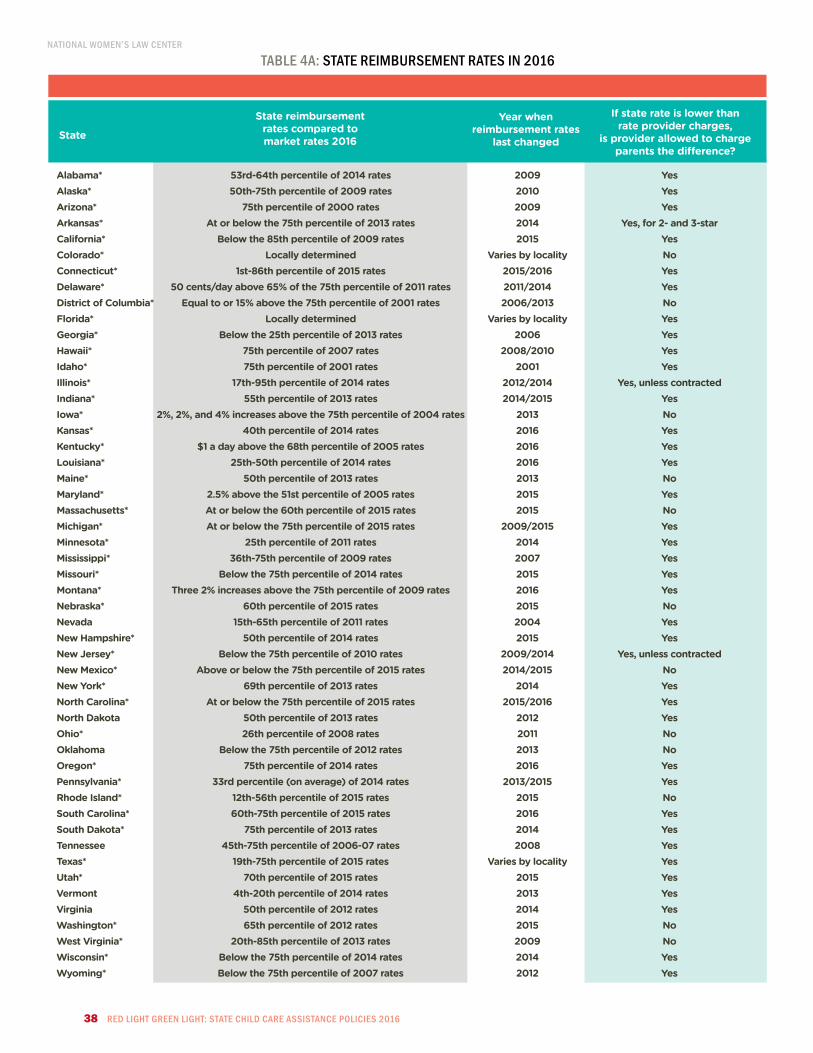
NatioNal WomeN’s laW CeNter
38 reD lIGhT Green lIGhT: STaTe chIlD care aSSISTance POlIcIeS 2016
Alabama* 53rd-64th percentile of 2014 rates 2009 YesAlaska* 50th-75th percentile of 2009 rates 2010 YesArizona* 75th percentile of 2000 rates 2009 YesArkansas* At or below the 75th percentile of 2013 rates 2014 Yes, for 2- and 3-starCalifornia* Below the 85th percentile of 2009 rates 2015 YesColorado* Locally determined Varies by locality NoConnecticut* 1st-86th percentile of 2015 rates 2015/2016 YesDelaware* 50 cents/day above 65% of the 75th percentile of 2011 rates 2011/2014 YesDistrict of Columbia* Equal to or 15% above the 75th percentile of 2001 rates 2006/2013 NoFlorida* Locally determined Varies by locality YesGeorgia* Below the 25th percentile of 2013 rates 2006 YesHawaii* 75th percentile of 2007 rates 2008/2010 YesIdaho* 75th percentile of 2001 rates 2001 YesIllinois* 17th-95th percentile of 2014 rates 2012/2014 Yes, unless contractedIndiana* 55th percentile of 2013 rates 2014/2015 YesIowa* 2%, 2%, and 4% increases above the 75th percentile of 2004 rates 2013 NoKansas* 40th percentile of 2014 rates 2016 YesKentucky* $1 a day above the 68th percentile of 2005 rates 2016 YesLouisiana* 25th-50th percentile of 2014 rates 2016 YesMaine* 50th percentile of 2013 rates 2013 NoMaryland* 2.5% above the 51st percentile of 2005 rates 2015 YesMassachusetts* At or below the 60th percentile of 2015 rates 2015 NoMichigan* At or below the 75th percentile of 2015 rates 2009/2015 YesMinnesota* 25th percentile of 2011 rates 2014 YesMississippi* 36th-75th percentile of 2009 rates 2007 YesMissouri* Below the 75th percentile of 2014 rates 2015 YesMontana* Three 2% increases above the 75th percentile of 2009 rates 2016 YesNebraska* 60th percentile of 2015 rates 2015 NoNevada 15th-65th percentile of 2011 rates 2004 YesNew Hampshire* 50th percentile of 2014 rates 2015 YesNew Jersey* Below the 75th percentile of 2010 rates 2009/2014 Yes, unless contractedNew Mexico* Above or below the 75th percentile of 2015 rates 2014/2015 NoNew York* 69th percentile of 2013 rates 2014 YesNorth Carolina* At or below the 75th percentile of 2015 rates 2015/2016 YesNorth Dakota 50th percentile of 2013 rates 2012 YesOhio* 26th percentile of 2008 rates 2011 NoOklahoma Below the 75th percentile of 2012 rates 2013 NoOregon* 75th percentile of 2014 rates 2016 YesPennsylvania* 33rd percentile (on average) of 2014 rates 2013/2015 YesRhode Island* 12th-56th percentile of 2015 rates 2015 NoSouth Carolina* 60th-75th percentile of 2015 rates 2016 YesSouth Dakota* 75th percentile of 2013 rates 2014 YesTennessee 45th-75th percentile of 2006-07 rates 2008 YesTexas* 19th-75th percentile of 2015 rates Varies by locality YesUtah* 70th percentile of 2015 rates 2015 YesVermont 4th-20th percentile of 2014 rates 2013 YesVirginia 50th percentile of 2012 rates 2014 YesWashington* 65th percentile of 2012 rates 2015 NoWest Virginia* 20th-85th percentile of 2013 rates 2009 NoWisconsin* Below the 75th percentile of 2014 rates 2014 YesWyoming* Below the 75th percentile of 2007 rates 2012 Yes
Table 4a: STaTe reImburSemenT raTeS In 2016
If state rate is lower than rate provider charges,
is provider allowed to charge parents the difference?
State
Year when reimbursement rates
last changed
State reimbursement rates compared to market rates 2016
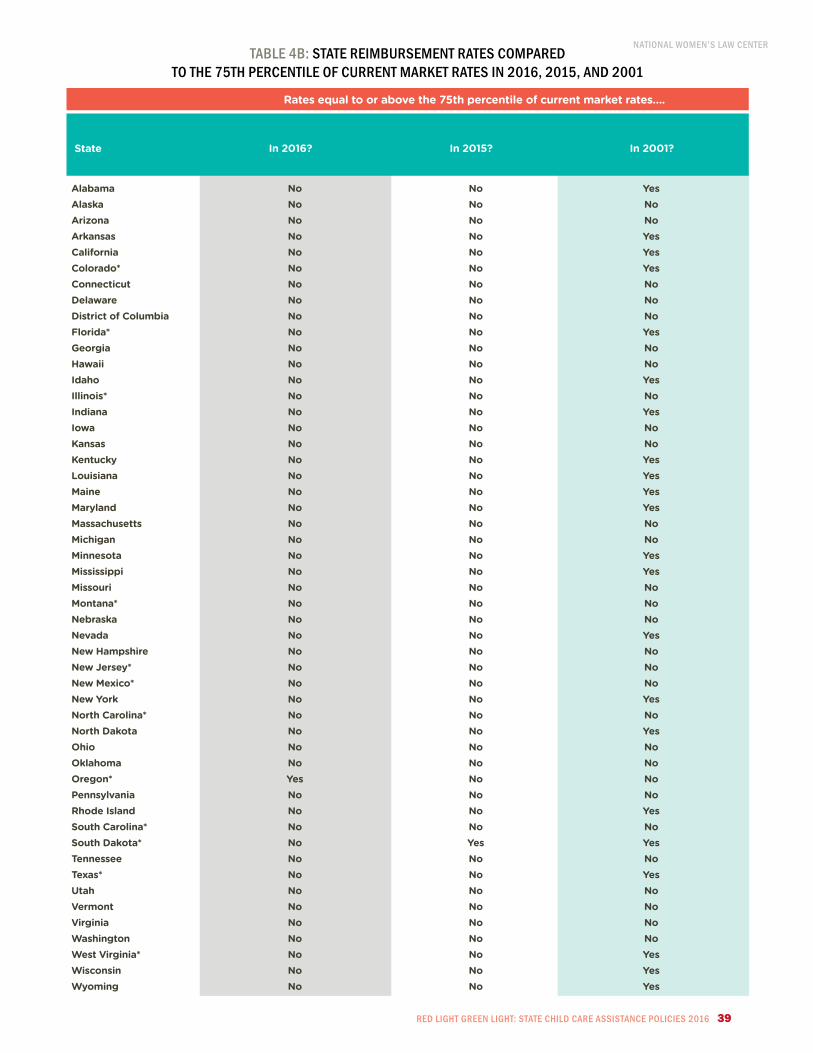
NatioNal WomeN’s laW CeNter
reD lIGhT Green lIGhT: STaTe chIlD care aSSISTance POlIcIeS 2016 39
Alabama No No YesAlaska No No NoArizona No No NoArkansas No No YesCalifornia No No YesColorado* No No YesConnecticut No No NoDelaware No No NoDistrict of Columbia No No NoFlorida* No No YesGeorgia No No NoHawaii No No NoIdaho No No YesIllinois* No No NoIndiana No No YesIowa No No NoKansas No No NoKentucky No No YesLouisiana No No YesMaine No No YesMaryland No No YesMassachusetts No No NoMichigan No No NoMinnesota No No YesMississippi No No YesMissouri No No NoMontana* No No NoNebraska No No NoNevada No No YesNew Hampshire No No NoNew Jersey* No No NoNew Mexico* No No NoNew York No No YesNorth Carolina* No No NoNorth Dakota No No YesOhio No No NoOklahoma No No NoOregon* Yes No NoPennsylvania No No NoRhode Island No No YesSouth Carolina* No No NoSouth Dakota* No Yes YesTennessee No No NoTexas* No No YesUtah No No NoVermont No No NoVirginia No No NoWashington No No NoWest Virginia* No No YesWisconsin No No YesWyoming No No Yes
Table 4b: STaTe reImburSemenT raTeS cOmPareD TO The 75Th PercenTIle Of currenT marKeT raTeS In 2016, 2015, anD 2001
In 2016? In 2015? In 2001?State
Rates equal to or above the 75th percentile of current market rates….
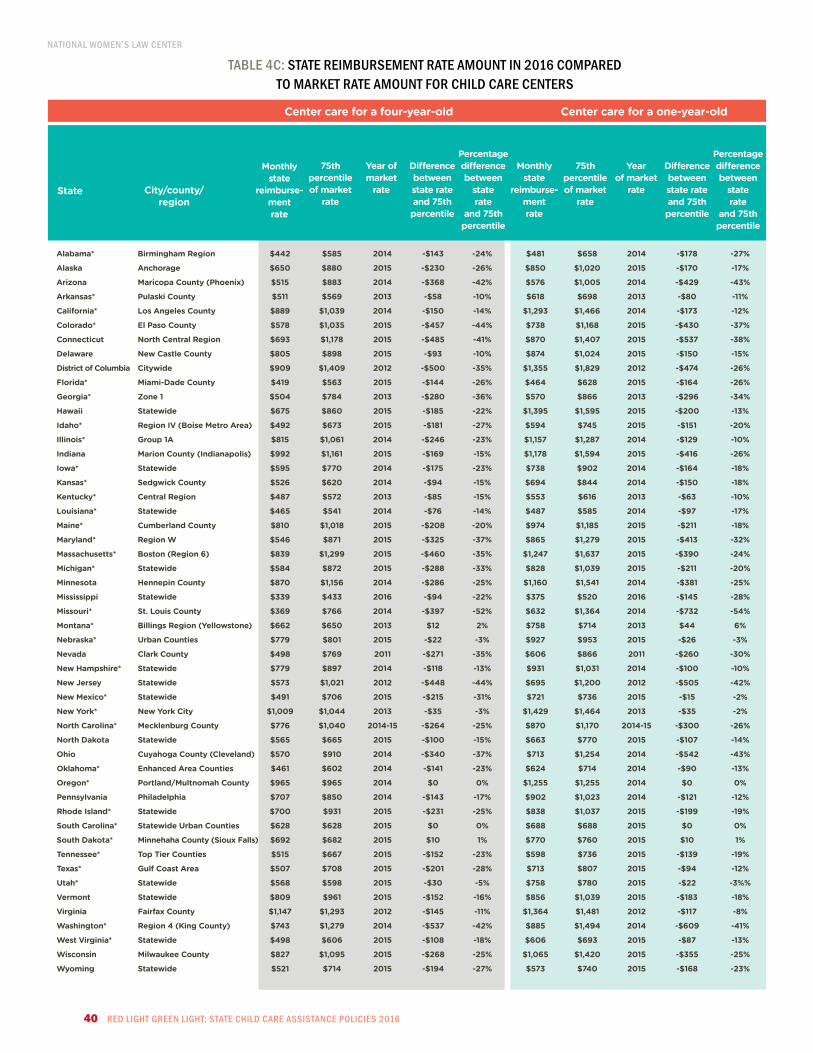
NatioNal WomeN’s laW CeNter
40 reD lIGhT Green lIGhT: STaTe chIlD care aSSISTance POlIcIeS 2016
Alabama* Birmingham Region $442 $585 2014 -$143 -24% $481 $658 2014 -$178 -27%
Alaska Anchorage $650 $880 2015 -$230 -26% $850 $1,020 2015 -$170 -17%
Arizona Maricopa County (Phoenix) $515 $883 2014 -$368 -42% $576 $1,005 2014 -$429 -43%
Arkansas* Pulaski County $511 $569 2013 -$58 -10% $618 $698 2013 -$80 -11%
California* Los Angeles County $889 $1,039 2014 -$150 -14% $1,293 $1,466 2014 -$173 -12%
Colorado* El Paso County $578 $1,035 2015 -$457 -44% $738 $1,168 2015 -$430 -37%
Connecticut North Central Region $693 $1,178 2015 -$485 -41% $870 $1,407 2015 -$537 -38%
Delaware New Castle County $805 $898 2015 -$93 -10% $874 $1,024 2015 -$150 -15%
District of Columbia Citywide $909 $1,409 2012 -$500 -35% $1,355 $1,829 2012 -$474 -26%
Florida* Miami-Dade County $419 $563 2015 -$144 -26% $464 $628 2015 -$164 -26%
Georgia* Zone 1 $504 $784 2013 -$280 -36% $570 $866 2013 -$296 -34%
Hawaii Statewide $675 $860 2015 -$185 -22% $1,395 $1,595 2015 -$200 -13%
Idaho* Region IV (Boise Metro Area) $492 $673 2015 -$181 -27% $594 $745 2015 -$151 -20%
Illinois* Group 1A $815 $1,061 2014 -$246 -23% $1,157 $1,287 2014 -$129 -10%
Indiana Marion County (Indianapolis) $992 $1,161 2015 -$169 -15% $1,178 $1,594 2015 -$416 -26%
Iowa* Statewide $595 $770 2014 -$175 -23% $738 $902 2014 -$164 -18%
Kansas* Sedgwick County $526 $620 2014 -$94 -15% $694 $844 2014 -$150 -18%
Kentucky* Central Region $487 $572 2013 -$85 -15% $553 $616 2013 -$63 -10%
Louisiana* Statewide $465 $541 2014 -$76 -14% $487 $585 2014 -$97 -17%
Maine* Cumberland County $810 $1,018 2015 -$208 -20% $974 $1,185 2015 -$211 -18%
Maryland* Region W $546 $871 2015 -$325 -37% $865 $1,279 2015 -$413 -32%
Massachusetts* Boston (Region 6) $839 $1,299 2015 -$460 -35% $1,247 $1,637 2015 -$390 -24%
Michigan* Statewide $584 $872 2015 -$288 -33% $828 $1,039 2015 -$211 -20%
Minnesota Hennepin County $870 $1,156 2014 -$286 -25% $1,160 $1,541 2014 -$381 -25%
Mississippi Statewide $339 $433 2016 -$94 -22% $375 $520 2016 -$145 -28%
Missouri* St. Louis County $369 $766 2014 -$397 -52% $632 $1,364 2014 -$732 -54%
Montana* Billings Region (Yellowstone) $662 $650 2013 $12 2% $758 $714 2013 $44 6%
Nebraska* Urban Counties $779 $801 2015 -$22 -3% $927 $953 2015 -$26 -3%
Nevada Clark County $498 $769 2011 -$271 -35% $606 $866 2011 -$260 -30%
New Hampshire* Statewide $779 $897 2014 -$118 -13% $931 $1,031 2014 -$100 -10%
New Jersey Statewide $573 $1,021 2012 -$448 -44% $695 $1,200 2012 -$505 -42%
New Mexico* Statewide $491 $706 2015 -$215 -31% $721 $736 2015 -$15 -2%
New York* New York City $1,009 $1,044 2013 -$35 -3% $1,429 $1,464 2013 -$35 -2%
North Carolina* Mecklenburg County $776 $1,040 2014-15 -$264 -25% $870 $1,170 2014-15 -$300 -26%
North Dakota Statewide $565 $665 2015 -$100 -15% $663 $770 2015 -$107 -14%
Ohio Cuyahoga County (Cleveland) $570 $910 2014 -$340 -37% $713 $1,254 2014 -$542 -43%
Oklahoma* Enhanced Area Counties $461 $602 2014 -$141 -23% $624 $714 2014 -$90 -13%
Oregon* Portland/Multnomah County $965 $965 2014 $0 0% $1,255 $1,255 2014 $0 0%
Pennsylvania Philadelphia $707 $850 2014 -$143 -17% $902 $1,023 2014 -$121 -12%
Rhode Island* Statewide $700 $931 2015 -$231 -25% $838 $1,037 2015 -$199 -19%
South Carolina* Statewide Urban Counties $628 $628 2015 $0 0% $688 $688 2015 $0 0%
South Dakota* Minnehaha County (Sioux Falls) $692 $682 2015 $10 1% $770 $760 2015 $10 1%
Tennessee* Top Tier Counties $515 $667 2015 -$152 -23% $598 $736 2015 -$139 -19%
Texas* Gulf Coast Area $507 $708 2015 -$201 -28% $713 $807 2015 -$94 -12%
Utah* Statewide $568 $598 2015 -$30 -5% $758 $780 2015 -$22 -3%%
Vermont Statewide $809 $961 2015 -$152 -16% $856 $1,039 2015 -$183 -18%
Virginia Fairfax County $1,147 $1,293 2012 -$145 -11% $1,364 $1,481 2012 -$117 -8%
Washington* Region 4 (King County) $743 $1,279 2014 -$537 -42% $885 $1,494 2014 -$609 -41%
West Virginia* Statewide $498 $606 2015 -$108 -18% $606 $693 2015 -$87 -13%
Wisconsin Milwaukee County $827 $1,095 2015 -$268 -25% $1,065 $1,420 2015 -$355 -25%
Wyoming Statewide $521 $714 2015 -$194 -27% $573 $740 2015 -$168 -23%
Table 4c: STaTe reImburSemenT raTe amOunT In 2016 cOmPareD TO marKeT raTe amOunT fOr chIlD care cenTerS
Center care for a four-year-old Center care for a one-year-old
Monthly state
reimburse-ment rate
75th percentile of market
rate
Year of market
rate
Difference between state rate and 75th percentile
Percentage difference between
state rate
and 75th percentile
Monthly state
reimburse-ment rate
75th percentile of market
rate
Year of market
rate
Difference between state rate and 75th percentile
Percentage difference between
state rate
and 75th percentile
State City/county/ region
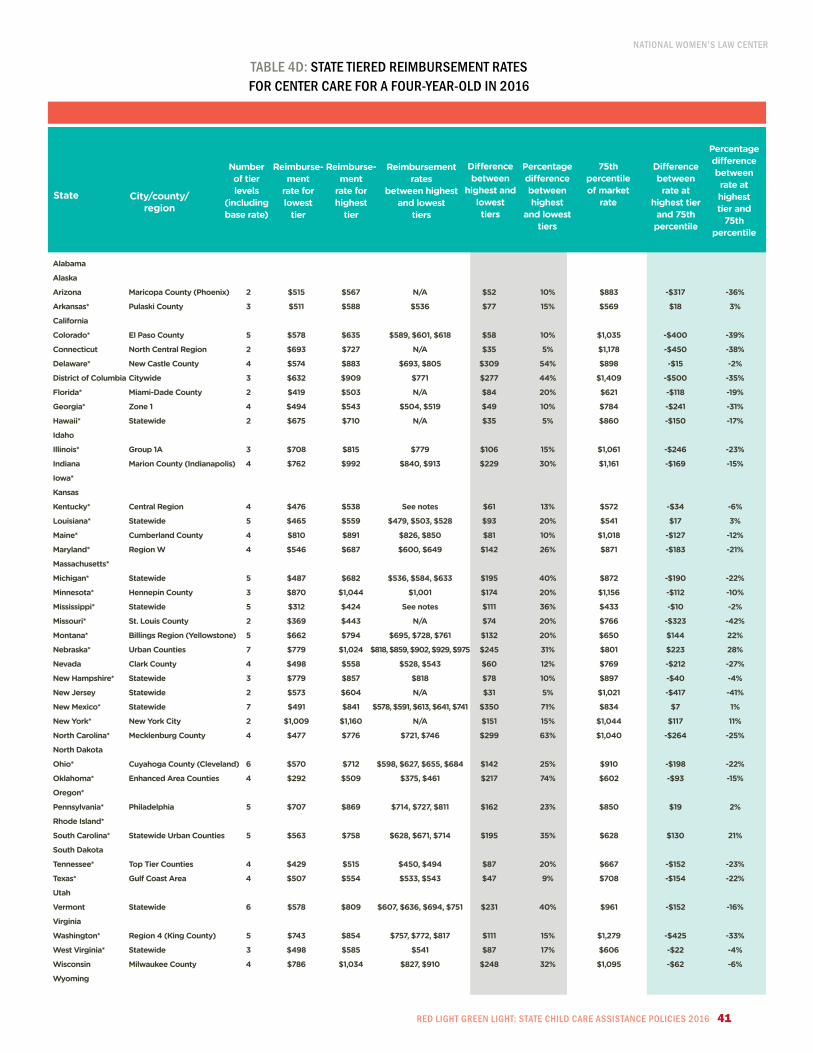
NatioNal WomeN’s laW CeNter
reD lIGhT Green lIGhT: STaTe chIlD care aSSISTance POlIcIeS 2016 41
Alabama
Alaska
Arizona Maricopa County (Phoenix) 2 $515 $567 N/A $52 10% $883 -$317 -36%
Arkansas* Pulaski County 3 $511 $588 $536 $77 15% $569 $18 3%
California
Colorado* El Paso County 5 $578 $635 $589, $601, $618 $58 10% $1,035 -$400 -39%
Connecticut North Central Region 2 $693 $727 N/A $35 5% $1,178 -$450 -38%
Delaware* New Castle County 4 $574 $883 $693, $805 $309 54% $898 -$15 -2%
District of Columbia Citywide 3 $632 $909 $771 $277 44% $1,409 -$500 -35%
Florida* Miami-Dade County 2 $419 $503 N/A $84 20% $621 -$118 -19%
Georgia* Zone 1 4 $494 $543 $504, $519 $49 10% $784 -$241 -31%
Hawaii* Statewide 2 $675 $710 N/A $35 5% $860 -$150 -17%
Idaho
Illinois* Group 1A 3 $708 $815 $779 $106 15% $1,061 -$246 -23%
Indiana Marion County (Indianapolis) 4 $762 $992 $840, $913 $229 30% $1,161 -$169 -15%
Iowa*
Kansas
Kentucky* Central Region 4 $476 $538 See notes $61 13% $572 -$34 -6%
Louisiana* Statewide 5 $465 $559 $479, $503, $528 $93 20% $541 $17 3%
Maine* Cumberland County 4 $810 $891 $826, $850 $81 10% $1,018 -$127 -12%
Maryland* Region W 4 $546 $687 $600, $649 $142 26% $871 -$183 -21%
Massachusetts*
Michigan* Statewide 5 $487 $682 $536, $584, $633 $195 40% $872 -$190 -22%
Minnesota* Hennepin County 3 $870 $1,044 $1,001 $174 20% $1,156 -$112 -10%
Mississippi* Statewide 5 $312 $424 See notes $111 36% $433 -$10 -2%
Missouri* St. Louis County 2 $369 $443 N/A $74 20% $766 -$323 -42%
Montana* Billings Region (Yellowstone) 5 $662 $794 $695, $728, $761 $132 20% $650 $144 22%
Nebraska* Urban Counties 7 $779 $1,024 $818, $859, $902, $929, $975 $245 31% $801 $223 28%
Nevada Clark County 4 $498 $558 $528, $543 $60 12% $769 -$212 -27%
New Hampshire* Statewide 3 $779 $857 $818 $78 10% $897 -$40 -4%
New Jersey Statewide 2 $573 $604 N/A $31 5% $1,021 -$417 -41%
New Mexico* Statewide 7 $491 $841 $578, $591, $613, $641, $741 $350 71% $834 $7 1%
New York* New York City 2 $1,009 $1,160 N/A $151 15% $1,044 $117 11%
North Carolina* Mecklenburg County 4 $477 $776 $721, $746 $299 63% $1,040 -$264 -25%
North Dakota
Ohio* Cuyahoga County (Cleveland) 6 $570 $712 $598, $627, $655, $684 $142 25% $910 -$198 -22%
Oklahoma* Enhanced Area Counties 4 $292 $509 $375, $461 $217 74% $602 -$93 -15%
Oregon*
Pennsylvania* Philadelphia 5 $707 $869 $714, $727, $811 $162 23% $850 $19 2%
Rhode Island*
South Carolina* Statewide Urban Counties 5 $563 $758 $628, $671, $714 $195 35% $628 $130 21%
South Dakota
Tennessee* Top Tier Counties 4 $429 $515 $450, $494 $87 20% $667 -$152 -23%
Texas* Gulf Coast Area 4 $507 $554 $533, $543 $47 9% $708 -$154 -22%
Utah
Vermont Statewide 6 $578 $809 $607, $636, $694, $751 $231 40% $961 -$152 -16%
Virginia
Washington* Region 4 (King County) 5 $743 $854 $757, $772, $817 $111 15% $1,279 -$425 -33%
West Virginia* Statewide 3 $498 $585 $541 $87 17% $606 -$22 -4%
Wisconsin Milwaukee County 4 $786 $1,034 $827, $910 $248 32% $1,095 -$62 -6%
Wyoming
Table 4D: STaTe TIereD reImburSemenT raTeS fOr cenTer care fOr a fOur-year-OlD In 2016
State City/county/ region
Number of tier levels
(including base rate)
Reimburse-ment
rate for lowest
tier
Reimburse-ment
rate for highest
tier
Reimbursement rates
between highest and lowest
tiers
Difference between
highest and lowest tiers
Percentage difference between highest
and lowest tiers
75th percentile of market
rate
Difference between rate at
highest tier and 75th percentile
Percentage difference between rate at highest tier and
75th percentile

NatioNal WomeN’s laW CeNter
42 reD lIGhT Green lIGhT: STaTe chIlD care aSSISTance POlIcIeS 2016
nOTeS fOr TableS 4a, 4b, 4c, anD 4D: reImburSemenT raTeS
State reimbursement rates are compared to the 75th percentile of market rates (the rate designed to allow families access to 75 percent of providers in their community) because federal regulations recommend that rates be set at this level.
A state is considered to have rates that were based on current market prices if the market survey used to set its rates was conducted no more than two years earlier (so, for example, rates used in 2016 are considered current if set at the 75th percentile of 2014 or more recent market rates).
States were asked to report reimbursement rates and the 75th percentile of market rates for their most populous city, county, or region. Monthly rates were calculated from hourly, daily, and weekly rates assuming the child was in care 9 hours a day, 5 days a week, 4.33 weeks a month. Differences between state reimbursement rates and the 75th percentile were calculated using raw data, rather than the rounded numbers shown in the table.
For states that pay higher rates for higher-quality care, the most common rate level (the level representing the greatest number of providers) for each state is used for the data analysis in Tables 4a, 4b, and 4c, unless otherwise indicated. The rates analyzed in the tables do not reflect other types of higher rates or rate enhancements, such as higher rates paid for care for children with special needs or care during non-traditional hours.
Data in the tables for 2016 reflect policies as of February 2016, data in the tables for 2015 reflect policies as of February 2015, and data in the tables for 2001 reflect policies as of June 2001, unless otherwise indicated. Certain changes in policies since February 2016 are noted below.
Alabama: The state increased reimbursement rates by 6 percent as of August 2016.
Alaska: Reimbursement rates are set at the 75th percentile of 2009 market rates for infant and toddler care and at the 50th percentile for all other categories of care.
Arizona: Reimbursement rates were set at the 75th percentile of 2000 market rates in 2006. On July 1, 2007, the state implemented a 5 percent increase in rates. As of April 2009, the state reversed this 5 percent increase and rates reverted to the level at which they had been set in 2006.
Arkansas: The state began providing higher reimbursement rates for higher-quality care under a quality rating and improvement system (which has three star levels) in June 2014. As of January 2016, all providers serving families receiving child care assistance must have a rating of one star
or higher. The previous base rate, which had not been increased since 2007 and was paid to providers that did not meet the criteria for a star rating, was eliminated. The reimbursement rates in Tables 4c and 4d reflect that the base rate is now the rate for one-star providers. Also note that providers with two- or three-star ratings are allowed to charge parents the difference between the state reimbursement rate and the rate charged to private-paying parents; however, providers cannot charge the difference to foster families or families receiving TANF.
California: In January 2015, the state set reimbursement rates at 10.11 percent below the 85th percentile of 2009 market rates. The state increased rates for licensed care by 4.5 percent as of October 2015; the reimbursement rates in Table 4c reflect this increase. In addition, the
state increased rates for license-exempt family child care from 60 percent to 65 percent of licensed family child care rates as of October 2015.
Colorado: Counties determine their reimbursement rates and when to update them; El Paso last increased its rates in February 2015. Counties also determine whether to offer higher rates for higher-quality care. While only some counties (including El Paso) had higher rates for
higher-quality care in 2016, all counties were required to have such tiered rates by September 2016.
Connecticut: The state last increased reimbursement rates for centers in January 2015 and for licensed and license-exempt family child care in January 2016. The state planned to increase rates by 3 percent for licensed family child care and by 5 percent for license-exempt family child care as of January 2017.
Delaware: Providers are allowed to charge parents the difference between the state reimbursement rate and the rate charged to private-paying parents under the Purchase of Care Plus option. Also note that the state has five quality rating levels, but only four different reimbursement rate
tiers; providers at both quality level one and quality level two (as well as providers that do not have a quality rating) receive the base rate. The state last increased rates for providers at the top two quality levels as of July 2014; the remaining rates were last increased in 2011.
District of Columbia: The District increased reimbursement rates for infant and toddler care by 15 percent in October 2013; the remaining rates were last changed in 2006.
Florida: Local early learning coalitions determine their reimbursement rates and when to update them. The reimbursement rates in Tables 4c and 4d reflect that Miami-Dade County increased its rates as of April 2015. In addition, local coalitions may pay rates that are up to 20 percent
higher than the base rate for Gold Seal providers, a designation indicating higher-quality care and tied to accreditation. The state’s market rate survey differentiates between quality levels and the 75th percentile of market rates is obtained for providers at the base level and at the Gold Seal level; in Table 4c, the reimbursement rate for the base level (most common rate level) is compared to the 75th percentile for that same quality level, and in Table 4d, the reimbursement rate for the highest quality level (the Gold Star level) is compared to the 75th percentile for that quality level.
Georgia: Zone 1 includes Camden, Cherokee, Clayton, Cobb, DeKalb, Douglas, Fayette, Forsyth, Fulton, Gwinnett, Hall, Henry, Paulding, and Rockdale Counties. The state increased rates for providers with ratings of one star or higher in the state’s quality rating and improvement system
(which has three levels) as of October 2016. Tiered rates were increased from 2 percent to 5 percent above the base rate for one-star providers, from 5 percent to 10 percent above the base rate for two-star providers, and from 10 percent to 25 percent above the base rate for three-star providers.
Hawaii: Reimbursement rates were last updated for licensed care in 2008 and for license-exempt care in 2010. Also note that the state has higher rates for accredited center care for children over age 24 months through the time the children are eligible to enroll in kindergarten or
junior kindergarten (usually age five by the end of the calendar year, depending on the child’s birth date). The state does not have accredited rates for care for infants and toddlers or for family child care.

NatioNal WomeN’s laW CeNter
reD lIGhT Green lIGhT: STaTe chIlD care aSSISTance POlIcIeS 2016 43
Idaho: Region IV includes Ada, Boise, Elmore, and Valley Counties. The state increased reimbursement rates to the 65th percentile of 2015 market rates as of October 2016.
Illinois: Reimbursement rates vary by the age of the child, type of care, and region of the state. Rates for centers range from the 17th to 62nd percentile of 2014 market rates and rates for family child care range from the 57th to 95th percentile. The state last increased rates for child care
centers in January 2012 and for family child care in December 2014. Reimbursement rates are reported for the Metropolitan Region (referred to as Group 1A), which includes Cook, DeKalb, DuPage, Kane, Kendall, Lake, and McHenry Counties. Also note that a provider that has a contract with the state is not permitted to charge parents the difference between the state reimbursement rate and the rate charged to private-paying parents.
Indiana: The state increased reimbursement rates for license-exempt providers in September 2015. All other rates were last increased in May 2014.
Iowa: The state set its reimbursement rates at the 75th percentile of 2004 market rates in 2007, and then increased its rates by 2 percent in 2008, by another 2 percent in January 2013, and by 4 percent in July 2013. The state began implementing higher rates for providers at level
five of the state’s quality rating and improvement system (which has five levels) as of July 2016; these rates are set at the 75th percentile of 2014 market rates. Also note that the state calculates reimbursements based on units of care; a unit is a half day (up to 5 hours of service per 24-hour period), so 9 hours of care a day, 5 days a week, 4.33 weeks a month would equal 44 units.
Kansas: The reimbursement rates in Tables 4c reflect that the state increased rates from the 65th percentile of 2000 rates to the 40th percentile of 2014 market rates for each county group as of January 2016. (Rates for individual counties range from below the 5th percentile to
above the 100th percentile of market rates.)
Kentucky: The reimbursement rates shown in Tables 4c and 4d reflect that the state increased base rates by $1 per day as of February 2016. Also note that the amount of the bonus above the base rate at each star level of the state’s quality rating and improvement system—for
four-year-olds, $7 to $11 per month for two-star providers, $11 to $15 per month for three-star providers, and $14 to $18 per month for four-star providers—depends on the percentage of children served by the provider who are receiving child care assistance. (All providers serving children receiving child care assistance must participate in the state’s quality rating and improvement system. One-star providers do not receive a bonus above the base rate.) For all levels, a licensed or certified provider may receive, to the extent funds are available, $2 per day beyond the maximum rate if the provider is accredited. The highest rate shown in Table 4d assumes that the provider receives the maximum allowable bonus at the four-star level and is accredited.
Louisiana: The reimbursement rates shown in Tables 4c and 4d reflect that the state increased rates as of February 2016; for example, rates for center care for infants, toddlers, and preschoolers were increased from at or below the 10th percentile of 2012 market rates to nearly the 50th
percentile of 2014 market rates, and rates for family child care for infants, toddlers, and preschoolers were increased from between the 15th and 50th percentile of 2012 market rates to the 25th percentile of 2014 market rates. Also note that, although shown in Table 4d as incorporated into the monthly reimbursement rate, bonuses for higher-quality care are paid quarterly.
Maine: The state increased its reimbursement rates to the 50th percentile of 2015 market rates as of June 2016.
Maryland: The state last increased its reimbursement rates in January 2015. Also note that Region W includes Anne Arundel, Calvert, Carroll, Charles, and Prince George’s Counties.
Massachusetts: The reimbursement rates in Table 4c reflect that the state increased rates for center care by 1.4 percent as of July 2015; the state increased rates for family child care by 3 percent as of July 2015 as well. Also note that the state pays higher rates (3 percent above the
base rate) for center care and family child care at level two or above of the state’s quality rating and improvement system (which has four levels) for children up to 2.9 years old.
Michigan: The reimbursement rates in Tables 4c and 4d reflect that the state increased rates for providers with ratings of two stars or higher in the state’s voluntary quality rating and improvement system (which has five star levels) as of July 2015. Previously, two-star providers had
received the base rate, which is still paid to providers that do not meet the standards necessary to achieve a rating in the state’s quality rating and improvement system, do not participate in that system, or are at the one-star level of the system. Base rates were last changed in 2009, with the exception of a reduction in reimbursement rates for legally exempt family child care providers at tier one (providers that do not complete the additional training required to achieve tier two) in October 2011.
Minnesota: Base reimbursement rates were set at the 25th percentile of 2011 market rates or left at the existing level (the level that went into effect as of November 28, 2011, following a 2.5 percent rate reduction), whichever was higher, as of February 2014. The state increased the
number of reimbursement rate tiers and the differential between the lowest and highest tiers as of March 2014.
Mississippi: Reimbursement rates for licensed centers are at the 51st percentile of 2009 market rates for infants, 49th percentile for toddlers, 56th percentile for preschoolers, 62nd percentile for school-age care during the summer, and 75th percentile for special needs care.
Reimbursement rates for family child care are at the 36th percentile for infants, 65th percentile for toddlers, 64th percentile for preschoolers, 75th percentile for school-age care during the summer, and 42nd percentile for special needs care. Also note that the state has two separate tiers for providers: tier two for those meeting basic licensing/regulatory requirements and tier one for those that are accredited or have a director who meets certain educational and/or experience criteria; tier one providers receive a higher rate. In addition, the state has a quality rating and improvement system (with five levels) that provides bonuses equal to 7 percent of the total payment for two-star centers, 17 percent for three-star centers, 22 percent for four-star centers, and 25 percent for five-star centers. The highest rate shown in Table 4d assumes that the provider qualifies for the tier one rate level and five-star bonus.
Missouri: The state does not allow parents receiving child protective services to be charged the difference between the state reimbursement rate and the rate charged to private-paying parents. Also note that the reimbursement rates in Tables 4c and 4d reflect that the state
increased rates by 3 percent as of July 2015. The state increased rates by an additional 10 percent as of July 2016.

NatioNal WomeN’s laW CeNter
44 reD lIGhT Green lIGhT: STaTe chIlD care aSSISTance POlIcIeS 2016
Montana: While some of the state’s reimbursement rates in 2016—including the rates shown in Table 4c—were at or above the 75th percentile of 2013 market rates, some rates for other age groups, regions, and types of care were below the 75th percentile. Reimbursement rates were set
at the 75th percentile of 2009 market rates in 2009, and then increased by 2 percent as of August 2013, an additional 2 percent as of July 2014, and another 2 percent as of January 2016. The reimbursement rates in Tables 4c and 4d reflect the increase that occurred in January 2016. Also note that data on the state’s policies as of 2001 are not available, so data on policies as of March 2000 are used instead.
Nebraska: Providers are not allowed to charge parents or caretakers receiving child care assistance the difference between the state reimbursement rate and the provider’s private pay rate, except in the case of a foster parent or subsidized adoptive parent or guardian. Also
note that Urban Counties include Dakota, Douglas, Lancaster, and Sarpy Counties. The reimbursement rates in Tables 4c and 4d reflect that the state increased base rates from the 60th percentile of 2013 market rates to the 60th percentile of 2015 market rates, and increased rates for accredited care, as of July 2015. Under the state’s tiered rates system, non-accredited providers are reimbursed at the base rate if they do not participate in the state’s quality rating and improvement system (which has five levels) or are at step one or two of the system, 5 percent above the base rate once they reach step three, 5 percent above the rate for step three once they reach step four, and 5 percent above the rate for step four once they reach step five; accredited providers are reimbursed at the accredited rate if they do not participate in the quality rating and improvement system or are at step one, two, or three, 5 percent above the accredited rate once they reach step four, and 5 percent above the accredited rate for step four once they reach step five.
New Hampshire: The reimbursement rates in Tables 4c and 4d reflect that the state increased base rates from the 50th percentile of 2011 market rates to the 50th percentile of 2014 market rates as of June 2015.
New Jersey: The percentile of the market rate at which reimbursement rates are set depends on the age of the child and category of care. The state increased rates for approved home providers and registered family child care providers represented by the Child Care Workers Union
in April 2014 and again in August 2014; rates for centers were last changed in 2009. Also note that centers that have direct contracts with the state are not allowed to charge parents receiving child care assistance the difference between the state reimbursement rate and the rate charged to private-paying parents. Data on the state’s policies as of 2001 are not available, so data on policies as of March 2000 are used instead.
New Mexico: The state increased rates for care for infants and toddlers and established new quality tiers, with rates at the highest quality levels exceeding the previous highest rates, as of July 2014. (Rates in Table 4d reflect tiered rates for the new quality rating and improvement
system as well as the older quality rating and improvement system, which will be phased out by the end of 2017. The older system has four rate tiers and the new system has five rate tiers; the rates at each of the bottom two tiers are the same for both systems.) The state raised reimbursement rates for rural areas so that they equaled rates for metro areas as of January 2015, and now uses a single set of rates statewide. The state increased base rates for licensed care for preschoolers and school-age children, as well as rate differentials at the top two levels of the new quality rating system for center-based care for infants, toddlers, and preschoolers, as of October 2015; these rate increases are reflected in Tables 4c and 4d. Also note that the state’s market rate survey differentiated between quality levels and the 75th percentile of market rates was obtained for providers at each quality level of the older quality rating and improvement system and one of the levels of the new system (the new system was not yet fully implemented at the time of the last survey); in Table 4c, the reimbursement rate for the most common rate level is compared to the 75th percentile for that same quality level, and in Table 4d, the reimbursement rate for the highest quality level is compared to the 75th percentile for the highest quality level under the older system.
New York: The state updated base rates to the 69th percentile of 2015 market rates as of June 2016. Also note that local social services districts may set reimbursement rates for accredited providers that are up to 15 percent higher than base rates.
North Carolina: The state’s market rate survey differentiates between quality levels and the 75th percentile of market rates is obtained for providers at each quality level; in Table 4c, the reimbursement rate for the most common rate level is compared to the 75th percentile for that
same quality level, and in Table 4d, the reimbursement rate for the highest quality level is compared to the 75th percentile for that quality level. There are five star levels in the state’s quality rating and improvement system, which is mandatory for all licensed providers, except those that are religious sponsored. One- and two-star providers are no longer eligible to serve children receiving child care assistance. Religious-sponsored providers not participating in the quality rating and improvement system and new providers with a temporary license are reimbursed at the rate previously used for one-star providers; this rate was set based on 2003 market rate survey data. The state increased reimbursement rates for three-, four-, and five-star licensed providers in all counties as of January 2015. The state increased rates for three-, four-, and five-star licensed providers serving infants and toddlers in tier one and tier two counties as of January 2016. The state increased rates for three-, four-, and five-star licensed providers serving children ages three to five in tier one and tier two counties as of October 2016. (The state’s 100 counties are ranked based on economic well-being and assigned a tier designation, with the 40 most distressed counties designated as tier one, the next 40 as tier two, and the 20 least distressed as tier three. Note that Mecklenberg County is a tier three county, so the increase that occurred in January 2016 is not reflected in Table 4c or 4d.)
Ohio: The state reduced base reimbursement rates to the 26th percentile of 2008 market rates (from the 35th percentile of 2008 market rates) as of July 2011. The state increased rates for providers with ratings of two stars or higher in the state’s quality rating and improvement system
(which has five levels) as of June 2016, and implemented additional rate increases for all star-rated providers as of September 2016. In June 2016, the state increased rates from 10 percent to 18 percent above the base rate for two-star providers; from 15 percent to 18 percent above the base rate for three-star providers; from 20 percent to 25 percent above the base rate for four-star providers; and from 25 percent to 31 percent above the base rate for five-star providers. In September 2016, the state increased the base amount used for calculating rates for star-rated providers by 4 percent, and then increased the enhancement added to that base amount to 21 percent for three-star providers, 29 percent for four-star providers, and 35 percent for five-star providers.
Oklahoma: Enhanced Area rates apply to 19 out of 77 counties in the state (Caddo, Canadian, Cherokee, Cleveland, Comanche, Creek, Garfield, Kay, Logan, McCurtain, Oklahoma, Ottawa, Payne, Pittsburg, Pottawatomie, Tulsa, Wagoner, Washington, and Woods); Standard Area rates apply
to the remaining counties.

NatioNal WomeN’s laW CeNter
reD lIGhT Green lIGhT: STaTe chIlD care aSSISTance POlIcIeS 2016 45
Oregon: The reimbursement rates in Table 4c reflect that the state increased rates for licensed centers (as well as license-exempt family child care providers) from the 75th percentile of 2012 market rates to at least the 75th percentile of 2014 market rates as of January 2016. The state
increased reimbursement rates for registered and certified family child care providers to at least the 75th percentile of 2014 market rates as of March 2016. In addition, the state began paying higher reimbursements for providers with ratings of three stars or higher in the state’s quality rating and improvement system (which has five levels) as of April 2016.
Pennsylvania: The state has five reimbursement rate tiers, including the base rate and a rate for each level of the state’s quality rating and improvement system, which has four star levels. The state lowered base rates for providers with no star rating as of January 2013. The rates for
one-star providers, which previously were reimbursed at the base level, and for two-star providers were not changed. The rates for three- and four-star providers were increased in January 2013, August 2013, and again in August 2015. The state also implemented additional rate increases for two-, three-, and four-star providers serving infants and toddlers as of August 2015. The reimbursement rates in Table 4d reflect these rates increases.
Rhode Island: The state increased reimbursement rates by $10 per week for licensed family child care and license-exempt care, and then by 3 percent for all providers as of July 2015; the reimbursement rates in Tables 4c and 4d reflect this increase. Also note that the state
temporarily provided higher reimbursement, in the form of monthly awards, for higher-quality providers serving infants and toddlers (when at least at least 10 percent of the children enrolled by the provider were receiving child care assistance) between August 2013 and December 2015; the state did not provide these awards in 2016.
South Carolina: The reimbursement rates in Tables 4c and 4d reflect that the state increased base rates as well as tiered rates for higher-quality care as of February 2016. The state’s quality rating and improvement system, which is mandatory for all providers serving families receiving child care assistance, has five levels—C (which receives the base rate), B, B+, A, and A+. In February 2016, for most age groups, rates for providers at level B (the most common level) were set at the 75th percentile of 2015 market rates, and rates for providers at higher quality levels were set above the 75th percentile of 2015 market rates.
South Dakota: While some of the state’s reimbursement rates in February 2016—including the rates for Minnehaha County shown in Table 4c— were at or above the 75th percentile of 2015 market rates, some rates for other age groups, counties, and types of care were below the 75th
percentile of 2015 market rates. The state increased rates to the 75th percentile of 2015 market rates for all categories of care as of June 2016.
Tennessee: Top Tier Counties are those with the 20 highest average populations in 2007 and/or 20 highest per capita incomes in 2005-2007; these counties include: Anderson, Blount, Bradley, Cheatham, Coffee, Davidson, Fayette, Greene, Hamilton, Knox, Loudon, Madison, Maury,
Montgomery, Putnam, Roane, Robertson, Rutherford, Sevier, Shelby, Sullivan, Sumner, Washington, and Williamson.
Texas: Local workforce development boards set their reimbursement rates and determine when to update them. Average rates across board areas range from the 19th to 75th percentile of 2015 market rates. Twenty-two of the 28 boards have updated base rates in at least one category
of care within the last two years; the Gulf Coast Workforce Development Area last updated some of its base rates in March 2015 (although it did not update its rates for the categories of care shown in Table 4c). As of September 2015, the state requires that boards set their rates at 5 percent above the base rate or higher for providers at the two-star level of the state’s quality rating and improvement system and providers participating in the Texas School Ready project (a comprehensive preschool teacher training program); 7 percent above the base rate or higher for three-star providers; and 9 percent above the base rate or higher for four-star providers. The reimbursement rates in Table 4d reflect that the Gulf Coast Workforce Development Area, which previously had two rate tiers, added two higher reimbursement tiers for three-star and four-star providers as of September 2015. Also note that providers are allowed to charge parents the difference between the reimbursement rate and the rate charged to private-paying parents, unless specifically prohibited by the local board or when the parent is exempt from having to pay a copayment or the parent’s copayment is calculated to be zero.
Utah: The reimbursement rates in Table 4c reflect that the state increased rates as of October 2015.
Washington: The state increased base reimbursement rates by 4 percent as of July 2014 and by another 4 percent as of January 2015. The state increased base rates for centers and license-exempt family child care by an additional 2 percent as of July 2016. The state also increased base
rates and tiered rates for licensed family child care providers as of July 2016, so that rates for licensed family child care at level three of the state’s quality rating and improvement system (which has five levels) would be at the 75th percentile of 2014 market rates. Rates were increased from 4 percent to 10 percent above the base rate for family child care providers at quality level three, from 10 percent to 15 percent above the base rate for family child care providers at quality level four, and from 15 percent to 20 percent above the base rate for family child care providers at quality level five.
West Virginia: In February 2016, the percentile of the market rate for reimbursement rates varied by the type of care, age of the child, and quality tier. The state increased base rates for all types of care and age groups to the 75th percentile of 2015 market rates as of March 2016.
Also note that data on the state’s policies as of 2001 are not available, so data on policies as of March 2000 are used instead.
Wisconsin: The state increased reimbursement rates as of November 2014 to ensure that all rates were within 18 percent of the 75th percentile of 2014 market rates.
Wyoming: The state reduced reimbursement rates as of July 2012. Prior to that, rates had last been updated in 2007.

NatioNal WomeN’s laW CeNter
46 reD lIGhT Green lIGhT: STaTe chIlD care aSSISTance POlIcIeS 2016
Alabama* No N/A No N/AAlaska* Yes 80 hours Yes 80 hoursArizona* Yes 60 days No N/AArkansas* Yes Until end of 12-month eligibility period No N/ACalifornia* Yes 60 days Yes 60 daysColorado* Yes 60 days Local decision See notesConnecticut* Yes Until end of following month No N/ADelaware Yes 90 days No N/ADistrict of Columbia* Yes Until end of 12-month eligibility period Yes 90 daysFlorida* Yes 60 days No N/AGeorgia* Yes 8 weeks No N/AHawaii* Yes 30 days Yes 30 daysIdaho* Yes Until end of month No N/AIllinois* Yes 90 days No N/AIndiana* Yes 13 weeks No N/AIowa* Yes 30 days Yes 30 daysKansas* Yes Until end of month No N/AKentucky* Yes 4 weeks No N/ALouisiana* Yes Until end of 12-month eligibility period No N/AMaine* Yes 12 weeks No N/AMaryland* Yes 30 days No N/AMassachusetts* Yes 8 weeks Yes 8 weeksMichigan* Yes Until end of 12-month eligibility period No N/AMinnesota* Yes 240 hours Yes 240 hoursMississippi* Yes 60 days Yes 60 daysMissouri* Yes 30 days No N/AMontana Yes 90 days No N/ANebraska* Yes 2 months Yes 2 monthsNevada* Yes 4 weeks Yes 4 weeksNew Hampshire* Yes 40 days Yes 40 daysNew Jersey Yes 90 days No N/ANew Mexico* Yes 30 days No N/ANew York* Yes 4 weeks Local decision See notesNorth Carolina* Yes 30 days No N/ANorth Dakota* Yes 8 weeks Yes 8 weeksOhio* Yes 91 days No N/AOklahoma* Yes 90 days No N/AOregon* Yes 3 months No N/APennsylvania* Yes 3 months No N/ARhode Island* Yes 21 days No N/ASouth Carolina* Yes 30 days No N/ASouth Dakota* Yes 30 days No N/ATennessee* Yes 30 days No N/ATexas* Yes 4 weeks No N/AUtah* Yes 2 months Yes 150 hoursVermont* Yes 1 month Yes 1 monthVirginia* No N/A No N/AWashington* Yes 56 days No N/AWest Virginia* Yes 30 days No N/AWisconsin Yes Until end of month No N/AWyoming* No N/A No N/A
Table 5: elIGIbIlITy fOr chIlD care aSSISTance WhIle ParenTS Search fOr a JOb In 2016
Can they continue receiving assistance?
For how much time? Can they qualify for assistance?
For how much time?State
Parents receiving child care assistance when they lose a job
Parents applying for child care assistance while searching for a job
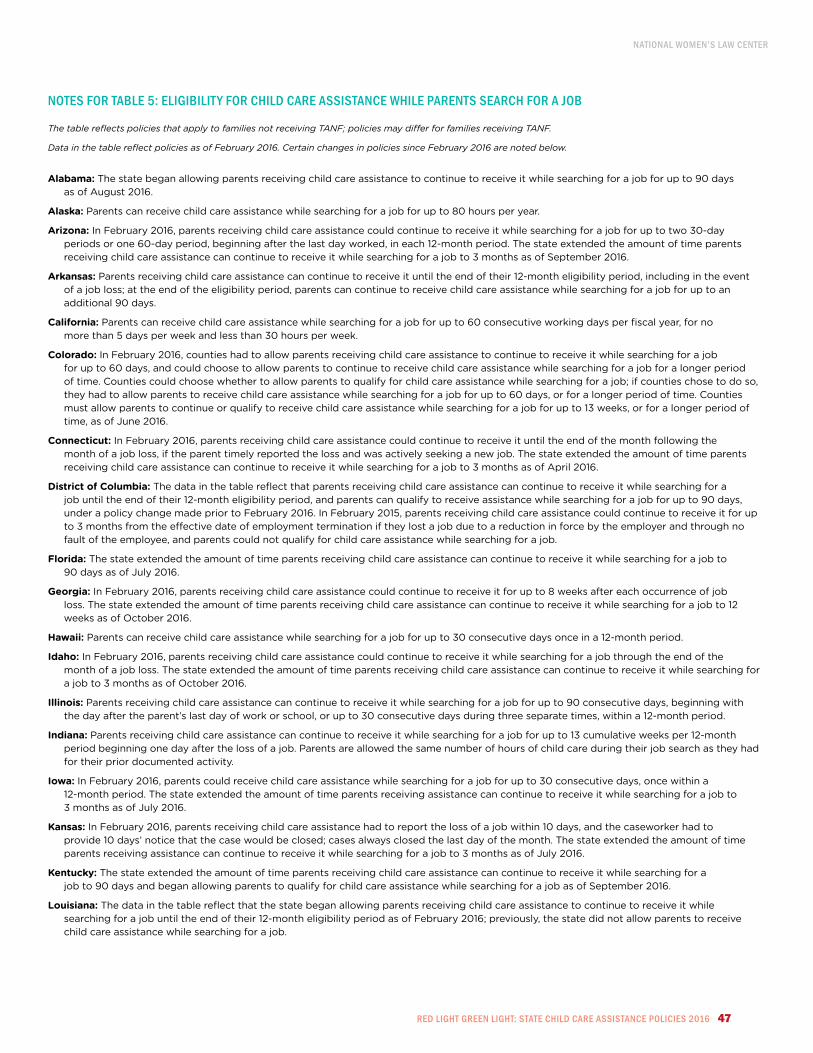
NatioNal WomeN’s laW CeNter
reD lIGhT Green lIGhT: STaTe chIlD care aSSISTance POlIcIeS 2016 47
nOTeS fOr Table 5: elIGIbIlITy fOr chIlD care aSSISTance WhIle ParenTS Search fOr a JOb
The table reflects policies that apply to families not receiving TANF; policies may differ for families receiving TANF.
Data in the table reflect policies as of February 2016. Certain changes in policies since February 2016 are noted below.
Alabama: The state began allowing parents receiving child care assistance to continue to receive it while searching for a job for up to 90 days as of August 2016.
Alaska: Parents can receive child care assistance while searching for a job for up to 80 hours per year.
Arizona: In February 2016, parents receiving child care assistance could continue to receive it while searching for a job for up to two 30-day periods or one 60-day period, beginning after the last day worked, in each 12-month period. The state extended the amount of time parents
receiving child care assistance can continue to receive it while searching for a job to 3 months as of September 2016.
Arkansas: Parents receiving child care assistance can continue to receive it until the end of their 12-month eligibility period, including in the event of a job loss; at the end of the eligibility period, parents can continue to receive child care assistance while searching for a job for up to an
additional 90 days.
California: Parents can receive child care assistance while searching for a job for up to 60 consecutive working days per fiscal year, for no more than 5 days per week and less than 30 hours per week.
Colorado: In February 2016, counties had to allow parents receiving child care assistance to continue to receive it while searching for a job for up to 60 days, and could choose to allow parents to continue to receive child care assistance while searching for a job for a longer period
of time. Counties could choose whether to allow parents to qualify for child care assistance while searching for a job; if counties chose to do so, they had to allow parents to receive child care assistance while searching for a job for up to 60 days, or for a longer period of time. Counties must allow parents to continue or qualify to receive child care assistance while searching for a job for up to 13 weeks, or for a longer period of time, as of June 2016.
Connecticut: In February 2016, parents receiving child care assistance could continue to receive it until the end of the month following the month of a job loss, if the parent timely reported the loss and was actively seeking a new job. The state extended the amount of time parents
receiving child care assistance can continue to receive it while searching for a job to 3 months as of April 2016.
District of Columbia: The data in the table reflect that parents receiving child care assistance can continue to receive it while searching for a job until the end of their 12-month eligibility period, and parents can qualify to receive assistance while searching for a job for up to 90 days,
under a policy change made prior to February 2016. In February 2015, parents receiving child care assistance could continue to receive it for up to 3 months from the effective date of employment termination if they lost a job due to a reduction in force by the employer and through no fault of the employee, and parents could not qualify for child care assistance while searching for a job.
Florida: The state extended the amount of time parents receiving child care assistance can continue to receive it while searching for a job to 90 days as of July 2016.
Georgia: In February 2016, parents receiving child care assistance could continue to receive it for up to 8 weeks after each occurrence of job loss. The state extended the amount of time parents receiving child care assistance can continue to receive it while searching for a job to 12
weeks as of October 2016.
Hawaii: Parents can receive child care assistance while searching for a job for up to 30 consecutive days once in a 12-month period.
Idaho: In February 2016, parents receiving child care assistance could continue to receive it while searching for a job through the end of the month of a job loss. The state extended the amount of time parents receiving child care assistance can continue to receive it while searching for
a job to 3 months as of October 2016.
Illinois: Parents receiving child care assistance can continue to receive it while searching for a job for up to 90 consecutive days, beginning with the day after the parent’s last day of work or school, or up to 30 consecutive days during three separate times, within a 12-month period.
Indiana: Parents receiving child care assistance can continue to receive it while searching for a job for up to 13 cumulative weeks per 12-month period beginning one day after the loss of a job. Parents are allowed the same number of hours of child care during their job search as they had
for their prior documented activity.
Iowa: In February 2016, parents could receive child care assistance while searching for a job for up to 30 consecutive days, once within a 12-month period. The state extended the amount of time parents receiving assistance can continue to receive it while searching for a job to
3 months as of July 2016.
Kansas: In February 2016, parents receiving child care assistance had to report the loss of a job within 10 days, and the caseworker had to provide 10 days’ notice that the case would be closed; cases always closed the last day of the month. The state extended the amount of time
parents receiving assistance can continue to receive it while searching for a job to 3 months as of July 2016.
Kentucky: The state extended the amount of time parents receiving child care assistance can continue to receive it while searching for a job to 90 days and began allowing parents to qualify for child care assistance while searching for a job as of September 2016.
Louisiana: The data in the table reflect that the state began allowing parents receiving child care assistance to continue to receive it while searching for a job until the end of their 12-month eligibility period as of February 2016; previously, the state did not allow parents to receive
child care assistance while searching for a job.
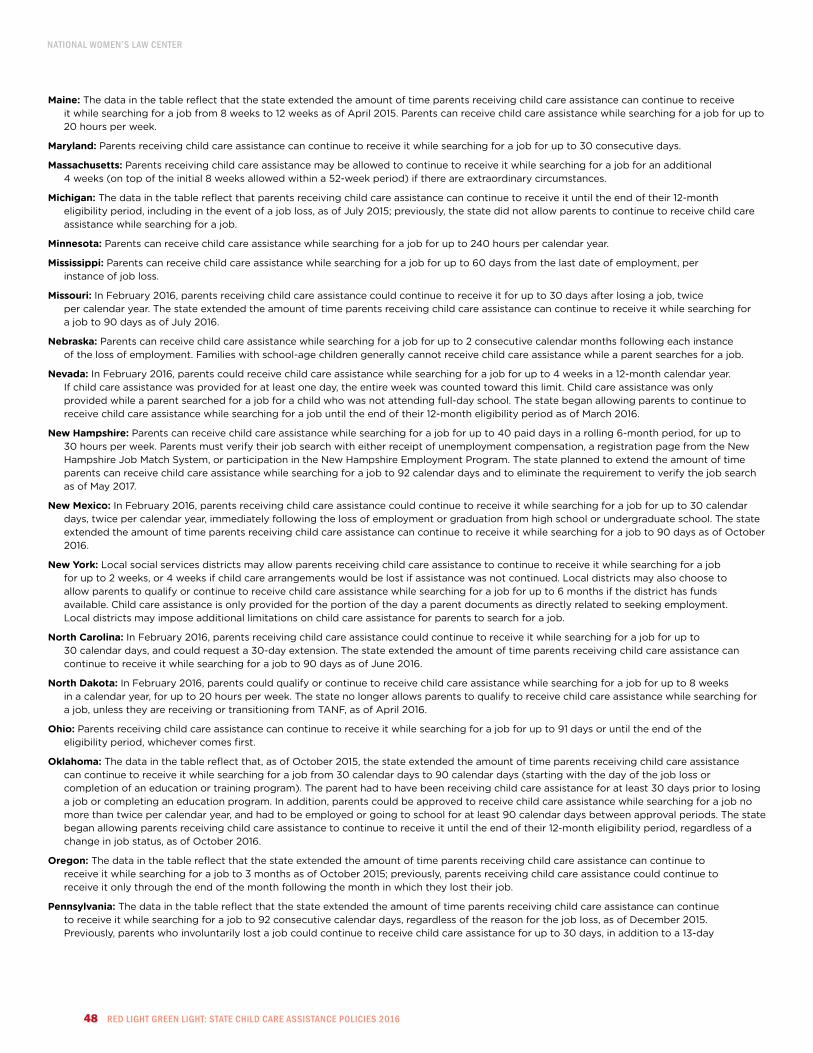
NatioNal WomeN’s laW CeNter
48 reD lIGhT Green lIGhT: STaTe chIlD care aSSISTance POlIcIeS 2016
Maine: The data in the table reflect that the state extended the amount of time parents receiving child care assistance can continue to receive it while searching for a job from 8 weeks to 12 weeks as of April 2015. Parents can receive child care assistance while searching for a job for up to
20 hours per week.
Maryland: Parents receiving child care assistance can continue to receive it while searching for a job for up to 30 consecutive days.
Massachusetts: Parents receiving child care assistance may be allowed to continue to receive it while searching for a job for an additional 4 weeks (on top of the initial 8 weeks allowed within a 52-week period) if there are extraordinary circumstances.
Michigan: The data in the table reflect that parents receiving child care assistance can continue to receive it until the end of their 12-month eligibility period, including in the event of a job loss, as of July 2015; previously, the state did not allow parents to continue to receive child care
assistance while searching for a job.
Minnesota: Parents can receive child care assistance while searching for a job for up to 240 hours per calendar year.
Mississippi: Parents can receive child care assistance while searching for a job for up to 60 days from the last date of employment, per instance of job loss.
Missouri: In February 2016, parents receiving child care assistance could continue to receive it for up to 30 days after losing a job, twice per calendar year. The state extended the amount of time parents receiving child care assistance can continue to receive it while searching for
a job to 90 days as of July 2016.
Nebraska: Parents can receive child care assistance while searching for a job for up to 2 consecutive calendar months following each instance of the loss of employment. Families with school-age children generally cannot receive child care assistance while a parent searches for a job.
Nevada: In February 2016, parents could receive child care assistance while searching for a job for up to 4 weeks in a 12-month calendar year. If child care assistance was provided for at least one day, the entire week was counted toward this limit. Child care assistance was only
provided while a parent searched for a job for a child who was not attending full-day school. The state began allowing parents to continue to receive child care assistance while searching for a job until the end of their 12-month eligibility period as of March 2016.
New Hampshire: Parents can receive child care assistance while searching for a job for up to 40 paid days in a rolling 6-month period, for up to 30 hours per week. Parents must verify their job search with either receipt of unemployment compensation, a registration page from the New
Hampshire Job Match System, or participation in the New Hampshire Employment Program. The state planned to extend the amount of time parents can receive child care assistance while searching for a job to 92 calendar days and to eliminate the requirement to verify the job search as of May 2017.
New Mexico: In February 2016, parents receiving child care assistance could continue to receive it while searching for a job for up to 30 calendar days, twice per calendar year, immediately following the loss of employment or graduation from high school or undergraduate school. The state
extended the amount of time parents receiving child care assistance can continue to receive it while searching for a job to 90 days as of October 2016.
New York: Local social services districts may allow parents receiving child care assistance to continue to receive it while searching for a job for up to 2 weeks, or 4 weeks if child care arrangements would be lost if assistance was not continued. Local districts may also choose to
allow parents to qualify or continue to receive child care assistance while searching for a job for up to 6 months if the district has funds available. Child care assistance is only provided for the portion of the day a parent documents as directly related to seeking employment. Local districts may impose additional limitations on child care assistance for parents to search for a job.
North Carolina: In February 2016, parents receiving child care assistance could continue to receive it while searching for a job for up to 30 calendar days, and could request a 30-day extension. The state extended the amount of time parents receiving child care assistance can
continue to receive it while searching for a job to 90 days as of June 2016.
North Dakota: In February 2016, parents could qualify or continue to receive child care assistance while searching for a job for up to 8 weeks in a calendar year, for up to 20 hours per week. The state no longer allows parents to qualify to receive child care assistance while searching for
a job, unless they are receiving or transitioning from TANF, as of April 2016.
Ohio: Parents receiving child care assistance can continue to receive it while searching for a job for up to 91 days or until the end of the eligibility period, whichever comes first.
Oklahoma: The data in the table reflect that, as of October 2015, the state extended the amount of time parents receiving child care assistance can continue to receive it while searching for a job from 30 calendar days to 90 calendar days (starting with the day of the job loss or
completion of an education or training program). The parent had to have been receiving child care assistance for at least 30 days prior to losing a job or completing an education program. In addition, parents could be approved to receive child care assistance while searching for a job no more than twice per calendar year, and had to be employed or going to school for at least 90 calendar days between approval periods. The state began allowing parents receiving child care assistance to continue to receive it until the end of their 12-month eligibility period, regardless of a change in job status, as of October 2016.
Oregon: The data in the table reflect that the state extended the amount of time parents receiving child care assistance can continue to receive it while searching for a job to 3 months as of October 2015; previously, parents receiving child care assistance could continue to
receive it only through the end of the month following the month in which they lost their job.
Pennsylvania: The data in the table reflect that the state extended the amount of time parents receiving child care assistance can continue to receive it while searching for a job to 92 consecutive calendar days, regardless of the reason for the job loss, as of December 2015.
Previously, parents who involuntarily lost a job could continue to receive child care assistance for up to 30 days, in addition to a 13-day

NatioNal WomeN’s laW CeNter
reD lIGhT Green lIGhT: STaTe chIlD care aSSISTance POlIcIeS 2016 49
notification period; after the 30-day period, parents could remain eligible for child care assistance for up to 30 additional days, but their case was suspended and they could not receive child care assistance to help pay for child care during that time. Under the previous policy, parents who voluntarily left a job could continue to receive child care assistance only during the 13-day notification period.
Rhode Island: Parents receiving child care assistance can continue to receive it for up to 21 consecutive days from the beginning of a period of unemployment. Parents must report the change in employment within 10 days. Parents are not eligible for continued assistance if they quit
without good cause. The state planned to extend the amount of time parents receiving child care assistance can continue to receive it while searching for a job to 3 months by the end of 2016.
South Carolina: In February 2016, parents receiving child care assistance could continue to receive it while searching for a job for up to 30 days from the date of the employment loss. The state extended the amount of time parents receiving child care assistance can continue to
receive it while searching for a job to 90 days as of March 2016.
South Dakota: In February 2016, parents receiving child care assistance could continue to receive it while searching for a job for up to 30 days from the last date of employment. The state extended the amount of time parents receiving child care assistance can continue to
receive it while searching for a job to 3 months as of September 2016.
Tennessee: The state extended the amount of time parents receiving child care assistance can continue to receive it while searching for a job to 90 days as of September 2016.
Texas: In February 2016, parents receiving child care assistance could continue to receive it while searching for a job for up to 4 weeks in a federal fiscal year. The state extended the amount of time parents receiving child care assistance can continue to receive it while searching for
a job to 3 months as of October 2016.
Utah: In February 2016, parents receiving child care assistance could continue to receive it while searching for a job for up to 2 months once in a 12-month period, if they were employed at least 32 hours per week at the time of the job loss. To receive the first month of child care
assistance while searching for a job, the parent had to report the change in employment status within 10 days and request child care assistance for job search; to receive the second month of child care assistance while searching for a job, the parent had to verify the job termination. The state extended the amount of time parents receiving child care assistance can continue to receive it while searching for a job to 3 months as of September 2016. Also note that under the state’s separate Kids-In-Care Program, parents can qualify or continue to receive child care assistance while searching for a job for up to 150 hours in a 6-month period; this program was suspended in June 2014 but reinstated as of September 2015.
Vermont: In February 2016, parents could request and be approved to receive child care assistance while searching for a job for an additional 2 months (beyond the initial month). Parents had to complete a log documenting their work search activities. The state extended the amount
of time parents can receive child care assistance while searching for a job to 3 months, and eliminated the requirement for them to request the additional months of child care assistance while searching for a job, as of September 2016.
Virginia: Parents cannot receive child care assistance while searching for a job, but families must be provided at least 10 days’ advance notice before their case is closed.
Washington: In February 2016, parents receiving child care assistance could continue to receive it while searching for a job for up to 28 days twice per calendar year or up to 56 days once per calendar year. The state began allowing parents receiving child care assistance to continue
to receive it, regardless of any changes in their employment status, until the end of their 12-month eligibility period as of July 2016.
West Virginia: The state extended the amount of time parents receiving child care assistance can continue to receive it while searching for a job to 90 days, and began allowing parents to qualify for child care assistance while searching for a job, as of September 2016.
Wyoming: The state began allowing parents receiving child care assistance to continue to receive it while searching for a job for up to 90 days as of September 2016.

NatioNal WomeN’s laW CeNter
50 reD lIGhT Green lIGhT: STaTe chIlD care aSSISTance POlIcIeS 2016

DRAFT & EMBARGOED UNTIL OCT.25, 2016

11 Dupont Circle, Suite 800Washington, DC 20036202.588.5180 | fax 202.588.5185www.nwlc.org