PRESENTATION OF Q3 2015 RESULTS - Grupa...
53
PRESENTATION OF Q3 2015 RESULTS November 9th 2015
Transcript of PRESENTATION OF Q3 2015 RESULTS - Grupa...

PRESENTATION OF Q3 2015 RESULTS
November 9th 2015

Agenda Page
41
2
Overview of Grupa Azoty 3
Market overview 8
Grupa Azoty Group 14
Grupa Azoty PUŁAWY Group 23
Grupa Azoty POLICE Group 31
Grupa Azoty KĘDZIERZYN Group 39
Appendix 1 – Parent 45
OVERVIEW OF GRUPA AZOTY

1,016 1,322 1,899 2,767 517
0% 100%
Grupa Azoty S.A. Grupa Azoty ZAK Group Grupa Azoty POLICE Group Grupa Azoty PUŁAWY Group Other
4
FINANCIAL HIGHLIGHTS
JAN–SEP 2015 CONSOLIDATED REVENUE STRUCTURE
PERFORMANCE DRIVERS
OVERVIEW OF GRUPA AZOTY
↗ Higher production/sales of nitrogen and NPK
fertilizers as a result of effective sales policy
↗ Favourable trends in compound fertilizer prices
↗ Fall in prices of energy carriers
(gas, coal)
↗ Higher realised benzene-polyamide spread
↗ Stronger USD/PLN exchange rate
↗ AZOTY PRO Operational Excellence Programme
REVENUE PLN 7.5bn
REVENUE PLN 2.4bn
EBITDA PLN 1bn
EBITDA PLN 223m
NET PROFIT PLN 540m
NET PROFIT PLN 82m
3Q 2015 Jan–Sep 2015
EPS PLN 4.80
EPS PLN 4.80

NEW FERTILIZER COMPLEX
AT GRUPA AZOTY
PUŁAWY
5TH SCIENCE–BUSINESS–
AGRICULTURE
CONFERENCE
5
KEY DEVELOPMENTS IN Q3 2015
IMPLEMENTATION OF
STRATEGIC INVESTMENT
PROJECTS
10 YEARS OF
POLICE AND PUŁAWY
ON THE WSE
OVERVIEW OF GRUPA AZOTY
PARTNERSHIP WITH AGH
UNIVERSITY OF SCIENCE
AND TECHNOLOGY IN THE
DEVELOPMENT OF CLEAN
COAL-BASED
TECHNOLOGIES
EUROPEAN PARLIAMENT'S
RECOMMENDATIONS ON
THE TRANSATLANTIC
TRADE AND INVESTMENT
PARTNERSHIP (TTIP)

PIPELINE OF STRATEGIC INVESTMENT PROJECTS
CHP Plant
– PLN 600m (2019)
UAN production unit
– PLN 29.5m (2015)
Polyamide plant – PLN 320m (2016)
Mineral fertilizer granulation plant – PLN 140m (2016)
Puławy Power Plant
- PLN 1,125m (2019)
Extension of nitric acid unit
– PLN 695m (2021)
Nitrate mechanical granulation plant
two lines – PLN 385m (line 1 by 2018, line 2 by 2020)
Propylene production plant – PLN 1.7bn (2019)
Upgrade of the ammonia unit
- PLN 156m (by 2016)
Flue gas purification unit
and upgrade of the EC II CHP plant
- PLN 164m (by 2016)
2014–2020 PLN 7bn 68 investment projects
6 OVERVIEW OF GRUPA AZOTY
GRUPA AZOTY POLICE
GRUPA AZOTY KĘDZIERZYN
GRUPA AZOTY PUŁAWY
GRUPA AZOTY S.A.

KEY COMPANY DEVELOPMENTS IN Q3 2015
GRUPA AZOTY POLICE
Compared to Q3 2014:
• EBIT and net profit more than doubled
• net margin and ROCE up by over 100%
• revenue up by 19%
Establishment of PDH Polska S.A. in connection
with a project to construct Europe's largest and
most advanced PDH unit for propylene
production
GRUPA AZOTY S.A.
Launch of the new Mechanical Fertilizer
Granulation Plant project
Setting the groundbreaking plaque for the
New Polyamide 6 Production Plant
Grupa Azoty chosen the Best Investor of 2015
at the Tarnów Investment Forum
7 OVERVIEW OF GRUPA AZOTY
GRUPA AZOTY PUŁAWY
Launch of a unit for producing new solid
fertilizers – PULGRAN/PULGRAN S
Further work on the Puławy Power Plant project
Diversification of natural gas supply sources at
62% in Q3 2015
Publication of a report entitled ‘Poland as an
Attractive Food Producer and Food Supplier’
GRUPA AZOTY KĘDZIERZYN
WIKTORIA Business Quality award received in the
‘Heavy and Chemical Industry’ category
Diamond of the Polish Chemical Industry received
in the ‘Innovation Leader of the Year’ category
Fertilizer granulation technology transferred to
Grupa Azoty PUŁAWY
Oxoviflex® recognised at the 13th International
Oil, Gas and Chemicals Conference

MARKET OVERVIEW

STRONG POSITION IN TARGET MARKETS
90% of revenue derived from sales to EU markets
9
Poland
54%
+2%
Jan–Sep 2014
Jan–Sep 2015
South America
4%
+0.1%
Africa
2%
+0.1%
European Union 1
34%
-1% Asia
5%
-0.1%
Other Europe
1%
-1%
North America
0,3%
+0.1%
1 Excluding Poland
9 GRUPA AZOTY – MARKET OVERVIEW

Q3 2015 EXTERNAL FACTORS
PRICING TRENDS
0
200
400
600
DAP Ammonia Urea ASUSD/t
Q3 2014 Q3 2015
-10% -21%
-17%
-3%
0
500
1 000
1 500
2 000
2 500
CPL PA6 BenzeneEUR/t
Q3 2014 Q3 2015
-14% -17%
-35%
Source: EUROSTAT as at October 29th 2015.
0
500
1 000
1 500
2 000
2 500
3 000
Urea DAP NPK AS AN CAN UAN'000 tonnes
Jan–Aug 2014 Jan–Aug 2015
IMPORTS TO EU (28)
GRUPA AZOTY – MARKET OVERVIEW 10
EXTERNAL FACTORS
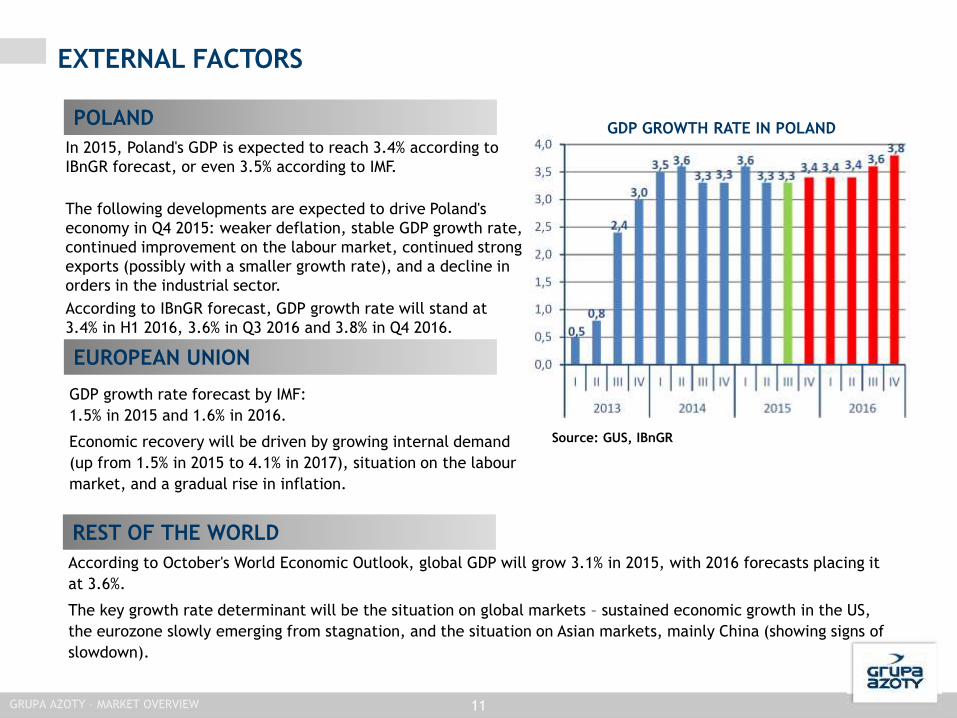
In 2015, Poland's GDP is expected to reach 3.4% according to
IBnGR forecast, or even 3.5% according to IMF.
The following developments are expected to drive Poland's
economy in Q4 2015: weaker deflation, stable GDP growth rate,
continued improvement on the labour market, continued strong
exports (possibly with a smaller growth rate), and a decline in
orders in the industrial sector.
According to IBnGR forecast, GDP growth rate will stand at
3.4% in H1 2016, 3.6% in Q3 2016 and 3.8% in Q4 2016.
According to October's World Economic Outlook, global GDP will grow 3.1% in 2015, with 2016 forecasts placing it
at 3.6%.
The key growth rate determinant will be the situation on global markets – sustained economic growth in the US,
the eurozone slowly emerging from stagnation, and the situation on Asian markets, mainly China (showing signs of
slowdown).
11
GDP GROWTH RATE IN POLAND
GRUPA AZOTY – MARKET OVERVIEW
POLAND
EUROPEAN UNION
GDP growth rate forecast by IMF:
1.5% in 2015 and 1.6% in 2016.
Economic recovery will be driven by growing internal demand
(up from 1.5% in 2015 to 4.1% in 2017), situation on the labour
market, and a gradual rise in inflation.
REST OF THE WORLD
Source: GUS, IBnGR

MARKET OUTLOOK FOR Q4 2015
12
FERTILIZERS
↗ Rise in food prices forecast from December 2015 – 1–2% higher than previous year's
↗ Direct subsidy payments to farmers give hopes of higher fertilizer demand in Q4 2015
↗ Urea prices on a growth trend until December 2015
↘ DAP market prices affected by weak demand ↗ The prices may grow driven by low stocks of DAP in
China
CHEMICALS
↘ Cautious procurement policy of customers purchasing OXO alcohols and plasticizers due to declining
raw material prices and stock optimisation measures
↘ Further decline in prices of alcohols and plasticizers caused by a downward trend in propylene prices
Average melamine price broadly flat on Q3 2015
↘ Usual decrease in titanium white demand and prices in Q4 – price adjustments depending on
macroeconomic conditions and stock reduction by customers
RAW
MATERIALS
↗ Average monthly TTF gas price forecast at around EUR 19/MWh, down year on year (according to
IHS)
↗ Forecast drop in crude oil prices and expected decline or stagnation in petroleum product prices
↘ Ammonia and sulfur prices expected to fall by ca. USD 16/t and USD 5-15/t, respectively
↘ Coal prices expected to grow by USD 2/t, to USD 57/t (according to IHS)
↗ Possible downward trend in prices of raw materials for titanium white production, with a larger
decline expected for titanium slag and smaller for ilmenite
PLASTICS ↘ Prices of plastics under pressure from seasonal stock optimisation in Q4
↗ Demand on target markets expected to grow, particularly in the automotive and textile sectors
GRUPA AZOTY – MARKET OVERVIEW

15
17
19
21
23
25
27
29
31
EUR/MWh
PGNiG tariff Average natural gas price paid by the Group TTF DA*
DIVERSIFICATION OF GAS SOURCES
GAS PRICES (EUR/MWh)
NATURAL GAS DEMAND
(BCM)
2015 Q3 2015
2.1 0.4
FROM OUTSIDE THE SYSTEM
Q3 2014 Q3 2015
60% 47%
13 GRUPA AZOTY – MARKET OVERVIEW
PGNIG'S NEW PRICING POLICY
The PGNiG Tariff sets a maximum gas price
The new discount scheme is linked to quoted
market prices of gas
Increased pricing differentiation, with prices
depending on the volumes and stability of gas
consumption over a gas year, reduces
diversification of gas sources
Source: ICIS.
* Day Ahead prices at Title Transfer Facility, a virtual trading point for natural gas in the Netherlands, no transfer costs.

GRUPA AZOTY
GROUP

GRUPA AZOTY GROUP: KEY FINANCIALS
* Adjusted for impairment loss on the phthalic anhydride unit recognised in 2014.
15 GRUPA AZOTY GROUP
2,269 2,556 2,839 2,281 2,401
Q3 2014 Q4 2014 Q1 2015 Q2 2015 Q3 2015
REVENUE
7,342
7,521
Jan–Sep 2014 Jan–Sep 2015
128 132
485
293 223
172
5.6% 5.2%
17.1%
12.9%
9.3
Q3 2014 Q4 2014 Q1 2015 Q2 2015 Q3 2015
EBITDA
EBITDA(adjusted)*
EBITDA MARGIN 695
1,001
Jan–Sep 2014 Jan–Sep 2015
9 21
306
152 82 54
Q3 2014 Q4 2014 Q1 2015 Q2 2015 Q3 2015
NET PROFIT
NET PROFIT* (adjusted) 250
540
Jan–Sep 2014 Jan–Sep 2015 (PLNm)

GRUPA AZOTY GROUP: EBITDA – KEY DRIVERS
16
695
1,001
342
198 26 3 6 51 89
111
positive effect on EBITDA
negative effect on EBITDA
GRUPA AZOTY GROUP
↘ lower selling prices of key products
↗ higher sales volume
↗ fall in prices of petroleum products and energy carriers
(PLNm)

GRUPA AZOTY GROUP: PERFORMANCE BY SEGMENT
CHANGE IN EBITDA – Q3 2014 VS. Q3 2015
Agro Fertilizers 61%
Plastics 12%
Chemicals 22%
Energy 2% Other
Activities 3%
REVENUE IN Q3 2015
17
SEGMENT (PLNm)
REVENUE EBITDA REVENUE EBITDA
Q3 2014 Q3 2015 Q3 2014 Q3 2015 Jan–Sep
2014
Jan–Sep
2015
Jan–Sep
2014
Jan–Sep
2015
Agro Fertilizers 1,210 1,468 73 169 4,066 4,522 459 725
Plastics 375 292 -6 -7 1,106 967 -17 8
Chemicals 602 534 19 19 1,915 1,744 110 112
Energy 47 49 15 16 142 151 56 58
Other 35 58 27 26 113 137 87 98
GRUPA AZOTY GROUP
-30
20
70
120
170
AgroFertilizers
Plastics Chemicals Energy Other(PLNm)

GRUPA AZOTY GROUP: AGRO FERTILIZERS
VOLUMES
18
GRAIN PRICES
'000 tonnes
Source: Ministry of Agriculture and Rural Development.
NITROGEN PRODUCT PRICES
Source: Profercy, ICIS.
(PLNm) Q3
2014
Q3
2015
Jan–
Sep
2014
Jan–
Sep
2015
CHANGE
Segment revenue,
including: 1,210 1,468 4,066 4,522 11% ↗
Nitrogen fertilizers
and ammonia 782 854 2,716 2,791 3% ↗
Compound
fertilizers 354 487 1,088 1,423 30% ↗
EBITDA 73 169 459 725 57% ↗
EBITDA margin 6% 12% 11% 16% ↗
0
1 000
2 000
3 000
Compound fertilizers Nitrogen fertilizersand ammonia
Jan–Sep 2014 Jan–Sep 2015
GRUPA AZOTY GROUP
200
250
300
100
300
500
700
EUR/t USD/t Ammonia USD/t
Urea USD/t
Ammonium sulfate AS USD/t
Calcium ammonium nitrate CAN EUR/t
0
1
2
3
4
5
6
0
500
1 000
1 500
2 000
2 500
1 kg N/1 kg milling wheat milling wheat (PLN/t)
fodder corn (PLN/t) rapeseed (PLN/t)
PLN/t 1 kgN
/1 kg

0
10
20
30
40
50
60
70
80
90
Polyamide Caprolactam
Jan-Sep 2014 Jan-Sep 2015
GRUPA AZOTY GROUP: PLASTICS
'000 tonnes
19
PRICES OF BENZENE, PHENOL, CPL, PA6
(PLNm) Q3
2014
Q3
2015
Jan–
Sep
2014
Jan–
Sep
2015
CHANGE
Segment revenue,
including: 375 292 1,106 967 -13% ↘
Polyamide 207 187 612 589 -4% ↘
Caprolactam 131 72 399 288 -28% ↘
EBITDA -6 -7 -17 8 147% ↗
EBITDA margin -2% -2% -2% 1% ↗
GRUPA AZOTY GROUP
400
900
1 400
1 900
2 400
EUR/t
Benzene EUR/t Liquid caprolactam EUR/t PA6 EUR/t Phenol EUR/t
VOLUMES
Source: ICIS, TECNON

0
100
200
300
400
Jan-Sep 2014 Jan-Sep 2015
GRUPA AZOTY GROUP: CHEMICALS
20
'000 tonnes
PRICES OF DEHP, 2-EH AND PROPYLENE
Source: ICIS.
(PLNm) Q3
2014
Q3
2015
Jan–
Sep
2014
Jan–
Sep
2015
CHANGE
Segment revenue
including: 602 534 1,915 1,744 -9% ↘
OXO products 179 93 552 352 -36% ↘
Urea (technical grade) 120 128 393 404 3% ↗
Melamine 85 99 274 294 7% ↗
Titanium white 74 55 236 205 -13% ↘
EBITDA 19 19 110 112 2% ↗
EBITDA margin 3% 3% 6% 6% ↗
GRUPA AZOTY GROUP
600
800
1 000
1 200
1 400
1 600
1 800
EUR/t
Propylene EUR/t DEHP EUR/t 2-EH EUR/t
VOLUMES

RATIOS Jan–Sep
2014
Jan–Sep
2015
Profitability ratios
EBIT margin (%) 4.0 8.5
EBITDA margin (%) 9.5 13.3
ROCE (%) 3.8 7.3
ROE (%) 3.9 7.7
Liquidity ratios
Current ratio 1.6 2.0
Debt ratios
Total debt ratio (%) 33.6 33.1
Net debt (PLNm) 455 410
Debt to equity ratio (%) 50.5 49.4
Sep 30
2014
Sep 30
2015 CHANGE
Non-current
assets 6,608 7,020 +6% ↗
Current
assets 3,142 3,434 +9% ↗
incl. cash and
cash equivalents
581 768 +32% ↗
TOTAL ASSETS 9,750 10,454 +7% ↗
GRUPA AZOTY GROUP: STATEMENT OF FINANCIAL POSITION
Sep 30
2014
Sep 30
2015 CHANGE
Equity 6,477 6,998 +8% ↗
Liabilities 3,273 3,455 +6% ↗
incl. borrowings 927 1,083 +17% ↗
other financial
liabilities 108 95 -12% ↘
TOTAL EQUITY AND
LIABILITIES 9,750 10,454 +7% ↗
(PLNm)
(PLNm)
21 GRUPA AZOTY GROUP
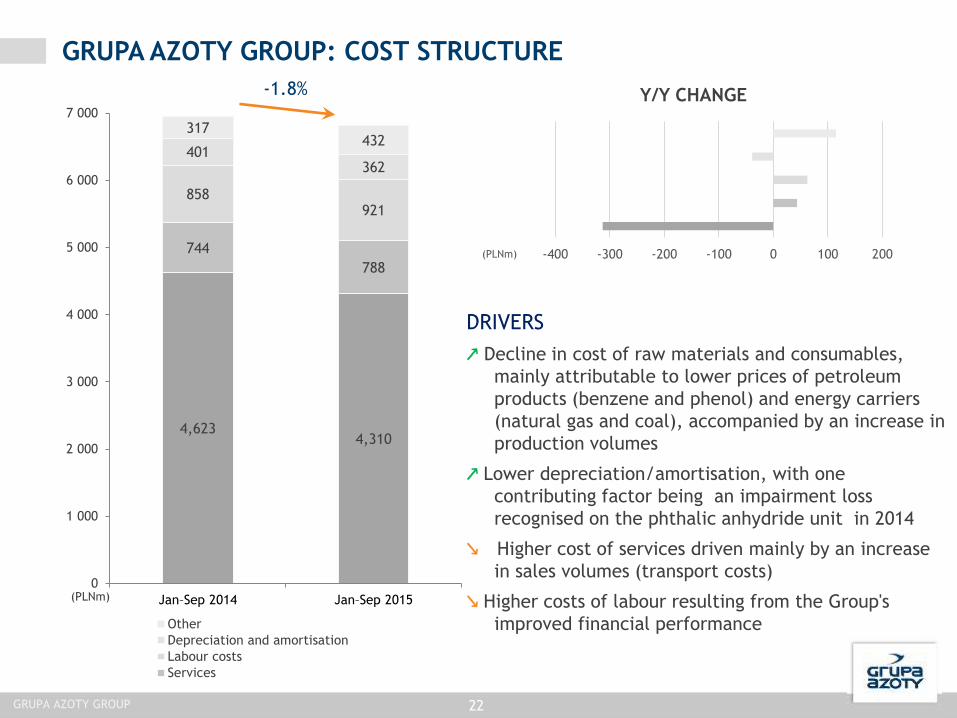
4,623 4,310
744
788
858 921
401 362
317 432
0
1 000
2 000
3 000
4 000
5 000
6 000
7 000
Jan–Sep 2014 Jan–Sep 2015
Other
Depreciation and amortisation
Labour costs
Services
GRUPA AZOTY GROUP: COST STRUCTURE
(PLNm)
DRIVERS
↗ Decline in cost of raw materials and consumables,
mainly attributable to lower prices of petroleum
products (benzene and phenol) and energy carriers
(natural gas and coal), accompanied by an increase in
production volumes
↗ Lower depreciation/amortisation, with one
contributing factor being an impairment loss
recognised on the phthalic anhydride unit in 2014
↘ Higher cost of services driven mainly by an increase
in sales volumes (transport costs)
↘ Higher costs of labour resulting from the Group's
improved financial performance
22
-400 -300 -200 -100 0 100 200(PLNm)
Y/Y CHANGE -1.8%
GRUPA AZOTY GROUP

GRUPA AZOTY PUŁAWY GROUP

GRUPA AZOTY PUŁAWY GROUP: KEY FINANCIALS
846 955 1,070 848 935
Q3 2014 Q4 2014 Q1 2015 Q2 2015 Q3 2015
REVENUE
40 86
227
144 118 4.8%
9.1%
21.3%
17.0%
12.6%
Q3 2014 Q4 2014 Q1 2015 Q2 2015 Q3 2015
EBITDA
EBITDA MARGIN
3 51
175
95 65
Q3 2014 Q4 2014 Q1 2015 Q2 2015 Q3 2015
NET PROFIT
PUŁAWY Group
174
334
9M 2014 9M 2015
308
490 11.3%
17.2%
0,0%
5,0%
10,0%
15,0%
20,0%
25,0%
30,0%
0
100
200
300
400
500
600
9M 2014 9M 2015
2,709 2,854
0
500
1 000
1 500
2 000
2 500
3 000
9M 2014 9M 2015
24
(PLNm)

GRUPA AZOTY PUŁAWY GROUP: EBITDA – KEY DRIVERS
↗ increased sales volume
↗ lower prices of key strategic raw materials at the Parent
308 308 464 516 504 492 490 490
156
126 -74 -12 -12 -2
positive effect on EBITDA
negative effect on EBITDA
25
*Only the Parent.
PUŁAWY Group
(PLNm)

GRUPA AZOTY PUŁAWY GROUP: PERFORMANCE BY SEGMENT
Agro 67%
Chemicals 28%
Energy 2%
Other Activities
3%
26 PUŁAWY Group
SEGMENT (PLNm)
REVENUE EBITDA REVENUE EBITDA
Q3 2014 Q3 2015 Q3 2014 Q3 2015 Jan–Sep
2014
Jan–Sep
2015
Jan–Sep
2014
Jan–Sep
2015
Agro 508 629 63 121 1,698 1,871 341 461
Chemicals 308 264 6 17 910 875 41 92
Energy 13 17 6 8 44 51 26 31
Other 16 25 2 8 51 53 3 11
63
6 6 2
121
17 8 8
Agro Chemicals Energy Other
REVENUE IN Q3 2015
(PLNm)
CHANGE IN EBITDA – Q3 2014 VS. Q3 2015

0
400
800
1 200
1 600
Nitrogenfertilizers
Phosphate andcompoundfertilizers
Other Merchandise andmaterials
Jan–Sep 2014 Jan–Sep 2015
GRUPA AZOTY PUŁAWY GROUP: AGRO
Volumes (PLNm) Q3
2014
Q3
2015
Jan–
Sep
2014
Jan–
Sep
2015
CHANGE
Revenue 508 629 1,698 1,871 10.2%
Nitrogen fertilizers 380 464 1,378 1,507 9.4%
Phosphate and
compound
fertilizers
68 91 158 220 39.2%
Other goods and
services 32 18 55 40 -27.3%
Merchandise and
materials 28 56 107 104 -2.8%
EBITDA 63 121 341 461 35.2%
EBITDA margin 12.4% 19.3% 20.1% 24.7% 4.6
27
PRICES OF AN, UAN AND UREA
'000 tonnes
PUŁAWY Group
Source: Argus FMB
200
400
100
200
300
400
USD/t EUR/t
Ammonium nitrate AN EUR/t UAN EUR/t Urea USD/t
VOLUMES

0
50
100
150
200
Melamine Caprolactam Urea(PULREA®,PULNOX®for 100%solution
equivalent)
Other Merchandiseand
materials
Jan–Sep 2014 Jan–Sep 2015
GRUPA AZOTY PUŁAWY GROUP: CHEMICALS
(PLNm) Q3
2014
Q3
2015
Jan–Sep
2014
Jan–Sep
2015 CHANGE
Revenue 308 264 910 875 -3.8%
Melamine 85 99 274 294 7.3%
Caprolactam 131 64 366 279 -23.8%
Urea 62 67 191 208 8.9%
Other goods and
services 28 33 75 88 17.3%
Merchandise and
materials 2 1 4 6 50.0%
EBITDA 6 17 41 92 124.4%
EBITDA margin 1.9% 6.4% 4.5% 10.5% 6.0
28
'000
tonnes
PRICES OF MELAMINE AND CAPROLACTAM
GRUPA AZOTY PUŁAWY
0
1000
2000
3000
0
400
800
1200
1600
USD/t EUR/t
Melamine EUR/t Crystalline caprolactam USD/t
VOLUMES
Source: ICIS.

RATIOS
Jan-
Sep
2014
Jan-
Sep
2015
Profitability ratios
EBIT margin (%) 7.1 12.9
EBITDA margin (%) 11.3 17.2
ROCE (%) 6.6 11.6
ROE (%) 6.5 11.4
Liquidity ratios
Current ratio 2.4 2.6
Debt ratios
Total debt ratio (%) 22.5 21.8
Net debt (PLNm) -250 -281
Debt to equity ratio (%) 29.0 27.9
GRUPA AZOTY PUŁAWY GROUP: STATEMENT OF FINANCIAL POSITION
(PLNm) Sep 30
2014
Sep 30
2015 CHANGE
Equity 2,680 2,927 9.2%
Liabilities 778 817 5.0%
incl. borrowings
11 24 118.2%
other financial
liabilities 767 793 3.4%
TOTAL EQUITY AND
LIABILITIES 3,457 3,744 8.3%
29
(PLNm) Sep 30
2014
Sep 30
2015 CHANGE
Non-current
assets 2,106 2,204 4.7 %
Current
assets 1,351 1,540 14.0%
incl. cash and
cash equivalents
261 306 17.2%
TOTAL ASSETS 3,457 3,744 8.3 %
GRUPA AZOTY PUŁAWY

1,621 1,561
283 277
274 294
115 122
192 209
0
500
1 000
1 500
2 000
2 500
Jan–Sep 2014 Jan–Sep 2015
Other
Depreciation and amortisation
Employee benefits expense
Services
Raw materials and consumables used
GRUPA AZOTY PUŁAWY GROUP: COST STRUCTURE
PLNm
DRIVERS
In January-September 2015, total costs fell slightly
year on year, by approximately 1.0% (or PLN 24m).
The main changes included:
lower cost of gas consumption (down by ca. PLN
48m)
lower cost of other raw material and
consumables used (down by ca. PLN 12m)
higher cost of labour (up by ca. PLN 20m)
higher cost of advertising and entertainment
(up by ca. PLN 15m)
-1%
30 Grupa Azoty PUŁAWY
-80 -60 -40 -20 0 20 40(PLNm)
Y/Y CHANGE

GRUPA AZOTY POLICE GROUP
6 7
51 56
15
1.2% 1.0%
6.8% 8.0%
2.5%
0
10
20
30
40
50
60
Q3 2014 Q4 2014 Q1 2015 Q2 2015 Q3 2015
NET PROFIT
NET MARGIN
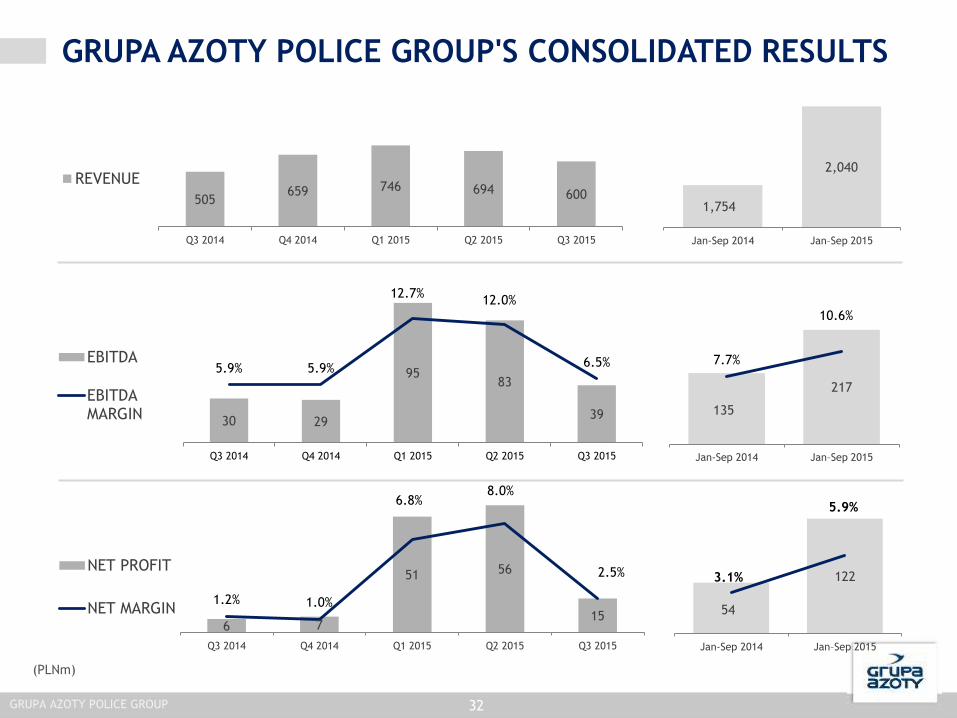
GRUPA AZOTY POLICE GROUP'S CONSOLIDATED RESULTS
(PLNm)
505 659 746 694 600
Q3 2014 Q4 2014 Q1 2015 Q2 2015 Q3 2015
REVENUE
30 29
95 83
39
5.9% 5.9%
12.7% 12.0%
6.5%
0102030405060708090
100
Q3 2014 Q4 2014 Q1 2015 Q2 2015 Q3 2015
EBITDA
EBITDAMARGIN
1,754
2,040
Jan-Sep 2014 Jan–Sep 2015
135
217
7.7%
10.6%
0
50
100
150
200
250
Jan-Sep 2014 Jan–Sep 2015
54
122 3.1%
5.9%
0
20
40
60
80
100
120
140
Jan-Sep 2014 Jan–Sep 2015
GRUPA AZOTY POLICE GROUP 32

GRUPA AZOTY POLICE GROUP: EBITDA – KEY DRIVERS
↗ Higher volume of sales and more favourable prices of compound fertilizers
↗ Increased production of compound fertilizers
135
217
166
101 99 20
37
28
EBITDA Jan–Sep 2014
Sales volumes Product prices Raw materialvolumes
Selling anddistribution
expenses, fixedcosts
Raw materialprices
other EBITDA Jan–Sep 2015
positive effect on EBITDA
negative effect on EBITDA
33 GRUPA AZOTY POLICE GROUP
(PLNm)

GRUPA AZOTY POLICE: PERFORMANCE BY SEGMENT
EBITDA
34
Fertilizers 88%
Pigments 9%
Other 3%
SEGMENT (PLNm)
REVENUE EBITDA REVENUE EBITDA
Q3 2014 Q3 2015 Q3 2014 Q3 2015 Jan–Sep
2014
Jan–Sep
2015
Jan–Sep
2014
Jan–Sep
2015
Fertilizers 416 528 18 37.2 1,481 1,789 95 206
Pigments 77 57 7 0.4 243 213 28 5
Other 12 15 5 1.4 30 38 12 6
GRUPA AZOTY POLICE GROUP
18
7 5
37
0.4 1.4
Fertilizers Pigments Other
REVENUE IN Q3 2015 CHANGE IN EBITDA – Q3 2014 VS. Q3 2015
(PLNm)

0
300
600
900
Compound fertilizers Urea Ammonia Other
Jan–Sep 2014 Jan–Sep 2015
GRUPA AZOTY POLICE: FERTILIZERS
(PLNm) Q3
2014
Q3
2015
Jan–
Sep
2014
Jan–
Sep
2015
CHANGE
Revenue 416 528 1,481 1,789 21%
Compound
fertilizers 297 414 957 1,251 31%
Urea 71 60 292 270 -8%
Ammonia 37 35 205 216 5%
Other 11 19 26 52 101%
EBITDA 18 37 95 206 117%
EBITDA margin 4% 7% 6% 12% 6% '000
tonnes
50
100
150
200
250
300
350
400
450
200
300
400
500
600
700
USD/t USD/t
NPK DAP Phosphate rock Potassium chloride
Source: WFM, FERTECON, Profercy.
PRICES OF NPK, DAP, PHOSPHATES, POTASSIUM CHLORIDE
GRUPA AZOTY POLICE GROUP
VOLUMES
35

0
10
20
30
Titanium white Other
Jan–Sep 2014 Jan–Sep 2015
GRUPA AZOTY POLICE: PIGMENTS
Volumes
(PLNm)
Q3
2014
Q3
2015
Jan–
Sep
2014
Jan–
Sep
2015
CHANGE
Revenue 77 57 243 213 -12%
Titanium white 74 55 235 204 -13%
Other 3 2 8 9 13%
EBITDA 7 0.4 28 5 -82%
EBITDA margin 9% 1% 12% 2% -10%
36
'000
tonnes
0
500
1000
1500
2000
0
1000
2000
3000
USD/t EUR/t
Titanium white Ilmenite Titanium slag
Source: ICIS, CCM
PRICES OF TITANIUM WHITE, ILMENITE AND TITANIUM SLAG
GRUPA AZOTY POLICE GROUP

RATIOS Jan–Sep
2014
Jan–Sep
2015
Profitability ratios
EBIT margin 4% 8%
EBITDA margin 8% 11%
Return on capital employed 5% 10%
ROE 5% 10%
Liquidity ratios
Current ratio 1.3 1.3
Debt ratios
Total debt ratio 44% 42%
Net debt (PLNm) 189 241
Equity-to-debt ratio 128% 137%
(PLNm) Sep 30
2014
Sep 30
2015 CHANGE
Non-current
assets 1,313 1,459 11% ↗
Current
assets 641 595 -7% ↘
incl. cash and
cash equivalents
45 52 15% ↗
TOTAL ASSETS 1,955 2,053 5% ↗
GRUPA AZOTY POLICE: STATEMENT OF FINANCIAL POSITION
(PLNm) Sep 30
2014
Sep 30
2015 CHANGE
Equity 1,098 1,186 8% ↗
Liabilities 856 867 1% ↗
incl. borrowings
225 285 27% ↗
other financial
liabilities 9 8 -14% ↘
TOTAL EQUITY
AND
LIABILITIES
1,955 2,053 5% ↗
37 GRUPA AZOTY POLICE GROUP

1,143
1,297
116
130 207
229 68
63
96
114
0
200
400
600
800
1 000
1 200
1 400
1 600
1 800
2 000
Jan–Sep 2014 Jan–Sep 2015
Other Depreciation and amortisation
Labour costs Services
Raw materials and consumables used
GRUPA AZOTY POLICE: COST STRUCTURE
(PLNm)
12.4%
38
DRIVERS
↘ Increased production of compound fertilizers
↗ Lower gas consumption costs following price
reduction
↘ Higher cost of services due to increased sales to
own unit responsible for transport operations
-10 30 70 110 150(PLNm)
Y/Y CHANGE
GRUPA AZOTY POLICE GROUP

GRUPA AZOTY
ZAKŁADY AZOTOWE KĘDZIERZYN S.A.
39

491 522 543 397 435
Q3 2014 Q4 2014 Q1 2015 Q2 2015 Q3 2015
REVENUE
GRUPA AZOTY KĘDZIERZYN: KEY FINANCIALS
31 20
93
27 35
60
6.3
11.5
17.2
6.8 8.1
0,0
2,0
4,0
6,0
8,0
10,0
12,0
14,0
16,0
18,0
20,0
Q3 2014 Q4 2014 Q1 2015 Q2 2015 Q3 2015
EBITDA
AdjustedEBITDA*
EBITDA MARGIN
9
0
60 12 14 33
Q3 2014 Q4 2014 Q1 2015 Q2 2015 Q3 2015
NET PROFIT
Adjusted NET PROFIT*
* One-off item: impairment loss on phthalic anhydride unit of PLN 40m
40 GRUPA AZOTY KĘDZIERZYN
1,534 1,375
Jan–Sep 2014 Jan–Sep 2015
78 87
Jan–Sep 2014 Jan–Sep 2015
155 156
Jan–Sep 2014 Jan–Sep 2015
(PLNm)

RATIOS
Jan–
Sep
2014
Jan–
Sep
2015
Profitability ratios
EBIT margin (%) 5.9% 7.2%
EBITDA margin (%) 10.1% 11.3%
ROCE (%) 7.5% 7.5%
ROE (%) 7.4% 8.0%
Liquidity ratios
Current ratio 1.47 1.43
Debt ratios
Total debt ratio 31.5% 34.5%
Net debt (PLNm) -45 -33
Debt to equity ratio (%) 46.1% 52.7%
(PLNm) Sep 30
2014
Sep 30
2015 CHANGE
Non-current
assets 1,027 1,168 141 ↗
Current
assets 523 492 -31 ↘
incl. cash and
cash equivalents
99 145 46 ↘
TOTAL ASSETS 1,550 1,660 110 ↘
GRUPA AZOTY KĘDZIERZYN: STATEMENT OF FINANCIAL POSITION
(PLNm) Sep 30
2014
Sep 30
2015 CHANGE
Equity 1,061 1,087 26 ↗
Liabilities 489 573 84 ↘
incl. borrowings 50 108 58 ↘
other financial
liabilities 4 4 -0.3 ↘
TOTAL EQUITY AND
LIABILITIES 1,550 1,660 110 ↘
41 GRUPA AZOTY KĘDZIERZYN
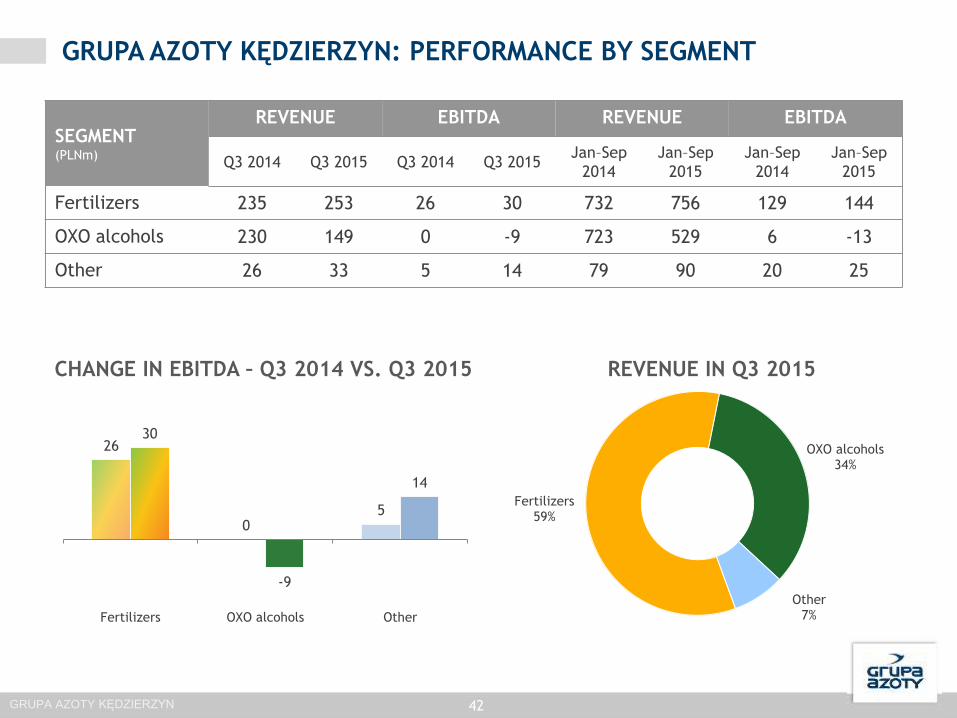
GRUPA AZOTY KĘDZIERZYN: PERFORMANCE BY SEGMENT
Fertilizers 59%
OXO alcohols 34%
Other 7%
42
SEGMENT (PLNm)
REVENUE EBITDA REVENUE EBITDA
Q3 2014 Q3 2015 Q3 2014 Q3 2015 Jan–Sep
2014
Jan–Sep
2015
Jan–Sep
2014
Jan–Sep
2015
Fertilizers 235 253 26 30 732 756 129 144
OXO alcohols 230 149 0 -9 723 529 6 -13
Other 26 33 5 14 79 90 20 25
GRUPA AZOTY KĘDZIERZYN
26
0 5
30
-9
14
Fertilizers OXO alcohols Other
REVENUE IN Q3 2015 CHANGE IN EBITDA – Q3 2014 VS. Q3 2015

DISCLAIMER
The information presented below has been prepared by the Grupa Azoty Group (the “Group”) solely for the purpose of presentation to investors and market analysts on
November 9th 2015 (the “Presentation”). By participating in the meeting at which the Presentation is presented or by referring to the following Presentation, you agree to
the following specific restrictions and disclaimers.
This presentation does not constitute or form any part of, and should not be considered as, an offer to sell or as an offer to subscribe for, or as a guarantee to purchase or
acquire in other way, any securities of any company of the Group. Neither this Presentation nor any part hereof may form the basis of, or be relied upon in connection with,
any subscription for any securities of the Group, or their acquisition. Neither this Presentation nor any part hereof may form the basis of, or be relied upon in connection
with, any investment agreement, commitment or decision relating to securities of the Group companies. This Presentation does not constitute a recommendation regarding
any securities of the Group companies.
No statement or assurance, expressed or implied, has been made by or on behalf of the Group or any of its shareholders, members of its bodies, officers, employees, agents
or advisers or any other person, as to the accuracy, completeness or reliability of information or opinions contained in this Presentation.
This Presentation may contain forward-looking statements. Forward-looking statements are different from statements of historical facts. Statements containing such words as
"expects", "intends", "plans", "believes", "anticipates", "will", "aims", "can", "would", "could", "continues" or similar words are examples of such forward-looking statements.
Forward-looking statements include statements about the financial performance, business strategy, plans and objectives of the Group (including development plans relating
to the Group). All forward-looking statements contained in this Presentation relate to matters involving known and unknown risks, issues that are impossible to predict, and
other factors. Actual results and achievements of the Group may be materially different from those described in statements concerning the past, and from the results and
achievements of the Group in the past. Forward-looking statements are made based on various assumptions of future events, including numerous assumptions regarding
present and future business strategies of the Group and its future business environment. Although the Group believes that its estimates and assumptions are reasonable, they
may prove to be incorrect. The information, opinions and forward-looking statements contained herein are valid only on the date of this Presentation and are subject to
change without notice. The Group and its advisers are not obliged to publish any updates or modify any information, data or statements contained in this Presentation in the
event of a change of strategy or the intentions of the Group, or of facts or circumstances that will have an impact on the strategy or intentions of the Group, unless such an
obligation arises under law. Please note that the only reliable source of data on the Group's financial results, forecasts, events and indicators of the Group are the current
and periodic reports released by the Group as part of its disclosure obligations under Polish law.
Neither the Group nor any of its shareholders, members of its bodies, officers, employees, agents or advisers nor any other person shall be liable for any loss arising from the
use of this Presentation or its contents or otherwise arising in connection with this Presentation.
Neither the Group nor any of its shareholders, members of its bodies, officers, employees, agents or advisers nor any other person shall be required to provide the recipients
of this Presentation with any additional information or to update this Presentation.
This Presentation contains information on the chemical industry in Poland and globally, including information on market shares of the Company and some of its competitors.
The source of this information is always provided in this Presentation and the Group or any other entity acting on behalf of the Group has independently verified the
information referred to above.
This Presentation is not intended for distribution to or use by any person or any entity in any jurisdiction where such distribution or use would be contrary to local law or
oblige the Group or any of its affiliates to obtain an authorization or licence, or to comply with the registration requirements under applicable laws. Neither this Presentation
nor any part hereof may be copied or transmitted into the United States of America, and cannot be disseminated, directly or indirectly, in the United States of America.
Failure to comply with this restriction may constitute a violation of U.S. securities laws. Persons who come into possession of this Presentation are required to inform
themselves of, and to observe all of the above restrictions. None of the securities referred to herein have been or will be registered under the U.S. Securities Act of 1933.
Any such securities may not be offered or sold in the United States of America, except pursuant to an exemption or in a transaction not required to be registered under the
Act.
43
Thank you for your attention. For more information, visit www.grupaazoty.com.

APPENDIX 1
PARENT

-200
-100
0
100
200
300
400
500
600
700
Q12008
Q22008
Q32008
Q42008
Q12009
Q22009
Q32009
Q42009
Q12010
Q22010
Q32010
Q42010
Q12011
Q22011
Q32011
Q42011
Q12012
Q22012
Q32012
Q42012
Q12013
Q22013
Q32013
Q42013
Q12014
Q22014
Q32014
Q42014
Q12015
Q22015
Q32015
EBITDA AND NET DEBT
Net debt EBITDA
KEY RATIOS SINCE IPO 2008, QUARTERLY*
*Grupa Azoty Group
-100
0
100
200
300
400
500
-500
0
500
1 000
1 500
2 000
2 500
Q12008
Q22008
Q32008
Q42008
Q12009
Q22009
Q32009
Q42009
Q12010
Q22010
Q32010
Q42010
Q12011
Q22011
Q32011
Q42011
Q12012
Q22012
Q32012
Q42012
Q12013
Q22013
Q32013
Q42013
Q12014
Q22014
Q32014
Q42014
Q12015
Q22015
Q32015
REVENUE AND NET PROFIT
Revenue Net profit (right axis)(PLNm)
(PLNm)
46 GRUPA AZOTY S.A.

GRUPA AZOTY S.A.: KEY FINANCIALS
464 470 500 371 468
Q3 2014 Q4 2014 Q1 2015 Q2 2015 Q3 2015
REVENUE
9 5
53
17 21 2% 1%
11%
5% 5%
Q3 2014 Q4 2014 Q1 2015 Q2 2015 Q3 2015
EBITDA
EBITDA MARGIN
-18 -23
18
218
-6 -12
Q3 2014 Q4 2014 Q1 2015 Q2 2015 Q3 2015
NET PROFIT/LOSS
NET PROFIT/LOSS (adjusted)
NET PROFIT was adjusted for dividend received (in all periods)
47
1,377
1,339
Jan–Sep 2014 Jan–Sep 2015
238 230
-32 -1
Jan–Sep 2014 Jan–Sep 2015
58
92
Jan–Sep 2014 Jan–Sep 2015
GRUPA AZOTY S.A.
(PLNm)

GRUPA AZOTY S.A.: RESULTS BY SEGMENT
Fertilizers 50%
Plastics 47%
Energy 1%
Other Activities
2%
48
SEGMENT (PLNm)
REVENUE EBITDA REVENUE EBITDA
Q3 2014 Q3 2015 Q3 2014 Q3 2015 Jan–Sep
2014
Jan–Sep
2015
Jan–Sep
2014
Jan–Sep
2015
Fertilizers 195 236 -5 7 586 608 11 43
Plastics 258 219 9 10 753 690 29 33
Energy 7 5 3 2 18 16 10 9
Other 5 8 2 2 21 25 8 7
GRUPA AZOTY S.A.
-5
9
3 2
7
10
2 2
Fertilizers Plastics Energy Other
(PLNm)
REVENUE IN Q3 2015 CHANGE IN EBITDA – Q3 2014 VS. Q3 2015

GRUPA AZOTY S.A.: FERTILIZERS
PRICES OF AMMONIA, AMMONIUM SULFATE AND CALCIUM AMMONIUM NITRATE
VOLUMES
49
Source: Argus FMB, ICIS
(PLNm) 32Q
2014
32Q
2015
Jan–
Sep
2014
Jan–
Sep
2015
CHANGE
Segment revenue
including 195 236 586 608 4%
Nitrogen fertilizers 178 218 517 546 6%
EBITDA -5 7 11 43 291%
EBITDA margin -3% 3% 2% 7% 0
100
200
300
400
500
600
700
Nitrogen fertilizers
Jan–Sep 2014 Jan–Sep 2015
'000
tonnes
GRUPA AZOTY S.A.
200
220
240
260
280
100
200
300
400
500
600
700
EUR/t USD/t
Ammonia USD/t Ammonium sulfate AS USD/t Calcium ammonium nitrate CAN EUR/t

GRUPA AZOTY S.A.: PLASTICS
VOLUMES
50
PRICES OF BENZENE, PHENOL, CPL, PA6
(PLNm) Q3
2014
Q3
2015
Jan–
Sep
2014
Jan–
Sep
2015
CHANGE
Segment revenue
including 258 219 753 690 -8% ↘
Polyamide 183 159 506 498 -2% ↘
Caprolactam 19 13 89 41 -54% ↘
EBITDA 9 10 29 33 14% ↗
EBITDA margin 3% 5% 4% 5% ↗
GRUPA AZOTY S.A.
400
900
1 400
1 900
2 400
EUR/t
Benzene EUR/t Liquid caprolactam EUR/t PA6 EUR/t Phenol EUR/t
0
20
40
60
80
Polyamide Caprolactam
Jan–Sep 2014 Jan–Sep 2015
Source: ICIS, TECNON

GRUPA AZOTY S.A.: COST STRUCTURE
(PLNm)
51
901
789
203
220
127
141
68
68
44
58
0
200
400
600
800
1 000
1 200
1 400
Jan–Sep 2014 Jan–Sep 2015 Other
Depreciation and amortisation
Labour costs
Services
Raw materials and consumables used
-150 -100 -50 0 50(PLNm)
Y/Y CHANGE
DRIVERS
↘ Decline in cost of raw materials and
consumables attributable to lower prices of
petroleum products (benzene down 37%
and phenol down 30%) and energy carriers
(natural gas down 6% and coal down 12%)
↗ Higher cost of services driven by a change in
terms of sale (transport costs)
↗ Increase in the 'Other' line item following
reclassification of the cost of rights to CO2
emissions (last year disclosed under 'Raw
materials and consumables used')
-5%
GRUPA AZOTY S.A.

STOCK PRICE – NEW HIGH
0,00
10,00
20,00
30,00
40,00
50,00
60,00
70,00
80,00
90,00
100,00
0
500
1 000
1 500
2 000
2 500
3 000
Jun 08 Dec 08 Jun 09 Dec 09 May 10 Nov 10 May 11 Oct 11 Apr 12 Oct 12 Apr 13 Oct 13 Apr 14 Sep 14 Mar 15 Sep 15
Trading volume Price
Growth from Jun 30 2008:
Growth from Jan 1 2015:
High (Aug 11 2015)
Low (Feb 3 2009)
475 %
45%
PLN 96.90
PLN 6.00
52 GRUPA AZOTY S.A.