INVESTOR PRESENTATION November 2016 - Grupa...
24
INVESTOR PRESENTATION November 2016
Transcript of INVESTOR PRESENTATION November 2016 - Grupa...

INVESTOR PRESENTATION
November 2016
GRUPA AZOTY AT A GLANCE 2
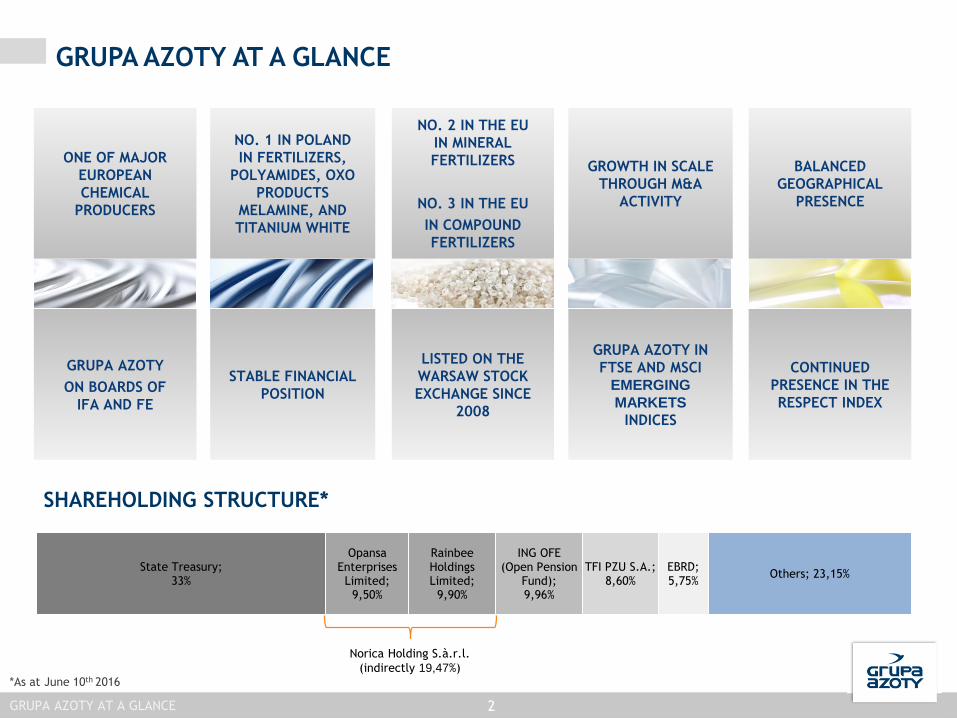
GRUPA AZOTY AT A GLANCE
ONE OF MAJOR
EUROPEAN
CHEMICAL
PRODUCERS
NO. 1 IN POLAND
IN FERTILIZERS,
POLYAMIDES, OXO
PRODUCTS
MELAMINE, AND
TITANIUM WHITE
NO. 2 IN THE EU
IN MINERAL
FERTILIZERS
NO. 3 IN THE EU
IN COMPOUND
FERTILIZERS
GROWTH IN SCALE
THROUGH M&A
ACTIVITY
BALANCED
GEOGRAPHICAL
PRESENCE
GRUPA AZOTY
ON BOARDS OF
IFA AND FE
STABLE FINANCIAL
POSITION
LISTED ON THE
WARSAW STOCK
EXCHANGE SINCE
2008
GRUPA AZOTY IN
FTSE AND MSCI
EMERGING
MARKETS
INDICES
CONTINUED
PRESENCE IN THE
RESPECT INDEX
State Treasury; 33%
OpansaEnterprises Limited;
9,50%
RainbeeHoldings Limited;
9,90%
ING OFE (Open Pension
Fund); 9,96%
TFI PZU S.A.; 8,60%
EBRD; 5,75%
Others; 23,15%
Norica Holding S.à.r.l.
(indirectly 19,47%)
SHAREHOLDING STRUCTURE*
*As at June 10th 2016

3
DIVISION OF RESPONSIBILITIES AMONG MANAGEMENT BOARD MEMBERS
Vice President of the
Management BoardP. Łapiński
Finance
Planning and controlling
IT
Investor relations
Management and HR
President of the
Management BoardM. Bober
Audit and risk
Communication
CSR
President of the Management Board
Grupa Azoty PUŁAWY
Memberof the
Management BoardA. Kopeć
Production assets
Technical safety and infrastructure
Environmental protection
Social dialogue
Vice President of the
Management BoardW. Szczypiński
Director General Grupa Azoty S.A.
Agro Segment
Plastics Segment
Organic Synthesis Segment
Production integration
Vice President of the
Management BoardT. Hinc
Logistics
Procurement strategy
Strategic and technical
procurement
Vice President of the
Management BoardJ. Rojek
Investments
Development strategy
Research and development
GRUPA AZOTY AT A GLANCE
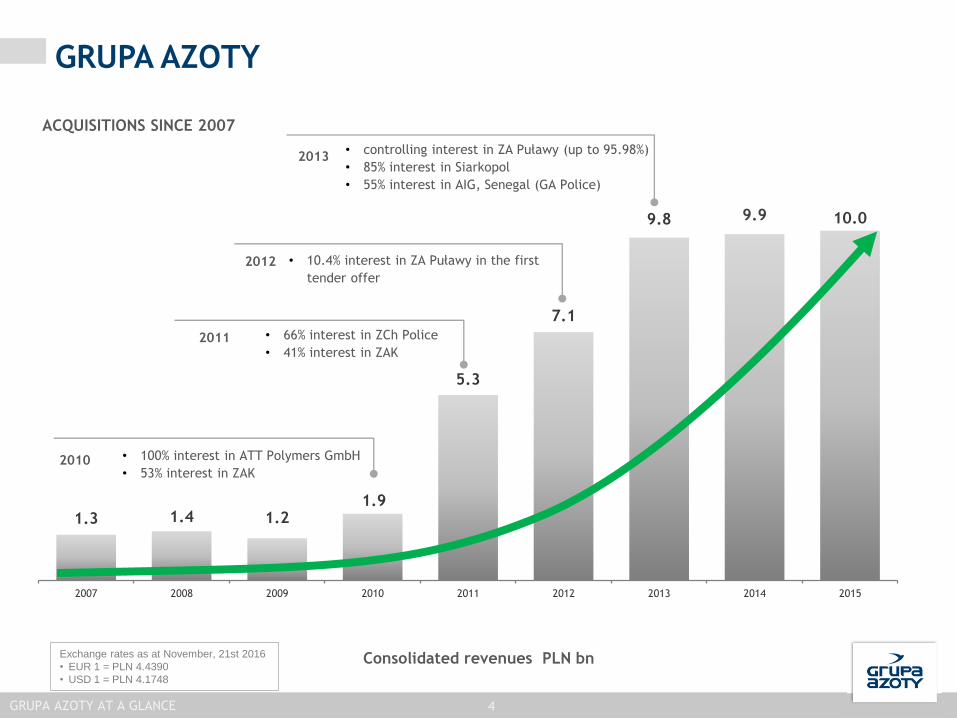
1.3 1.4 1.21.9
5.3
7.1
9.8 9.9 10.0
2007 2008 2009 2010 2011 2012 2013 2014 2015
2011 • 66% interest in ZCh Police
• 41% interest in ZAK
• 100% interest in ATT Polymers GmbH
• 53% interest in ZAK2010
4
GRUPA AZOTY
Consolidated revenues PLN bn
• controlling interest in ZA Puławy (up to 95.98%)
• 85% interest in Siarkopol
• 55% interest in AIG, Senegal (GA Police)
2013
• 10.4% interest in ZA Puławy in the first
tender offer
2012
ACQUISITIONS SINCE 2007
Exchange rates as at November, 21st 2016
• EUR 1 = PLN 4.4390
• USD 1 = PLN 4.1748
GRUPA AZOTY AT A GLANCE

5
CORE BUSINESS
Logistics
Production
ZMPPPort
Grupa Azoty PoliceUrea, NPK, NP, NS, Ammonia, TiO2
BBMTerminal
FosforyNPK, P
Grupa Azoty
ATT PolymersPA 6
Grupa Azoty PuławyAN, UAN, Urea, Melamine, CPL
Grupa Azoty SiarkopolSulfur
Grupa Azoty S.A.AN, CAN, ASN, AS, CPL, PA 6, POM
Compounding
AfriG S.A.Phosphorites
Grupa Azoty KędzierzynAN, CAN, Urea, OXO, Plasticizers
Z. A. Chorzów S.A.NPK, N, P, K
GRUPA AZOTY AT A GLANCE
GRUPA AZOTY AT A GLANCE

60%Fertilizers - Agro
6
BROAD PORTFOLIO – REVENUES
GRUPA AZOTY AT A GLANCE
AN,CAN, NPK, AS, ASN
UREA
UAN, AMMONIA
MINING: SULFUR, PHOSPHORITES
POLYAMIDE
CAPROLACTAM
OXO PRODUCTS
MELAMINE
TECHNICAL GRADE UREA
ELECTRICITY AND HEAT
LABORATORY SERVICES
CATALYSTS, OTHER ACTIVITY 2%Other
13%Plastics
23%Chemicals
2%Energy
2015 1-3Q 2016
54%
13%
28%
2%
3%
GRUPA AZOTY AT A GLANCE

BUSINESS

BUSINESS 8
Notes: ¹ Compound fertilizers in total (AP, NPK, PK); ² Compound fertilizers + nitrogen fertilizers; ³ Among integrated producers
GRUPA AZOTY IS AN IMPORTANT PRODUCER IN THE REGION
Anwil Ciech Synthos
LARGEST CHEMICAL COMPANIES IN POLANDbased on 2015 revenues
FERTILIZERS
• No. 1 in compound fertilizers¹
• No. 1 in mineral fertilizers²
• No. 1 in fertilizers containing sulfur
• No. 1 in nitrogen fertilizers
FERTILIZERS
• No. 3 in compound fertilizers
• No. 2 in mineral fertilizers
PLASTICS, OXO, PIGMENTS, MELAMINE
• No. 1 in Polyamides
• No. 1 in OXO Alcohols and Plasticizers
• No. 1 in Titanium White
• No. 1 in Melamine
PLASTICS, OXO, MELAMINE
• No. 5 in Plasticizers
• No. 5 in OXO Alcohols
• No. 5 in Polyamide 6³
• No. 3 in Melamine

STRONG POSITION IN TARGET MARKETS
90% of revenue derived from sales to EU markets
9
Poland
54%
+0.2pp
Q3 2015
Q3 2016
South America
3.61%
+0.4pp
Africa
2.08%
+0.2pp
European Union 1
34%
-1.4ppAsia
4.73%
-1.5pp
Other Europe
1.19%
+0.1pp
North America
0.25%
+0.02pp
1 Excluding Poland
9BUSINESS

10
AGRO - FERTILIZERS
EXTENSIVE PORTFOLIO OF FERTILIZERS
[tt]
CAPACITIES
EU
2
Poland
1
Source: Fertilizers Europe
BUSINESS
2015: 60%
Q1-Q3 2016: 58%
REVENUES
0 5 000 10 000 15 000
Azomures S.A.
Timac Agro(Groupe Roullier)
Achema JSC
Eurochem
Fertiberia
Borealis
Agrofert
(GK) Grupa Azoty
YARA
MANUFACTURER AS UREA AN CAN ASN UAN
AP/
NPK/
MIX
YARA
GRUPA AZOTY
Argofert
Borealis
FERTIBERIA
EuroChem
ACHEMA
TIMAC AGRO
AZOMURES

0 5 10 15 20 25 30 35 40
Automotive
Films and coatings
Machine building
Electrical and electronic applications
Consumer goods
Household appliances
Other
0 50 100 150 200 250
Savinesti
Caffaro FP
Nexis Fibers
Nurel
Ube*
Beaulieu Nylon
Rhodia
Julon*
Aquafil*
Grupa Azoty*
Domo*
Radici
DSM*
Lanxess*
BASF*
11
PLASTICS
Source: PCI Nylon, YellowBook 2015
*Integrated
[tt]
POLYAMIDE 6
Poland
1
EU
5*
APPLICATIONS IN KEY SEGMENTS
%
• Polyamide 6 (PA6)
• Polyacetal (POM)
• Caprolactam
• Cyclohexanone
BUSINESS
Q1-Q3 2016: 13%
2015: 13%
REVENUES

12
CHEMICALS
Melamine
OXO**Plasticizers*
Poland
1
EU
3
Poland
1
EU
5
Poland
1
EU
5
[tt]
[tt]
[tt]
Source: Plasticizers Alkohols 2013 and Plasticizers (UE) 2013
* Production capacities for phthalate plasticizers and terephthalate plasticizers
** Production capacities for 2-EH, N-butanol, isobutanol
BUSINESS
2015: 23%
Q1-Q3 2016: 25%
REVENUES
0 100 200 300 400 500
Boryszew S.A.
Perstorp Oxo AB
DEZA
Oltchim SA
OXEA GROUP
Grupa Azoty
Polynt
Evonik
BASF
ExxonMobil
0 20 40 60 80 100 120 140 160
Azomures S.A.
BASF SE
Grupa Azoty
Grupa Borealis
OCI Melamine
0 100 200 300 400 500
Oltchim SA
Grupa Azoty
Perstorp Oxo AB
Oxochimie
Oxea Group
BASF

STRATEGY

VISION FOR GRUPA AZOTY
Organic
growth
Operational
excellence
Mergers
and
acquisitions
Grupa Azoty to remain one of the three leading players in
the European fertilizer market
Grupa Azoty to deliver industry-leading rates of return for
shareholders
14
Grupa Azoty to join the blue-chip index of the Warsaw
Stock Exchange
STRATEGY
2020 ROCE ≥ 14%
2014−2020
PLN 7bn to be spent on organic
growth
Consolidating a top-three position
in fertilizer manufacturing in EU
2020 EBIT MARGIN > 8%
2020 EBITDA MARGIN > 14%
CORPORATE OBJECTIVES
STRATEGY

15
CORPORATE
PROJECTS
68 CAPEX PROJECTS
PLASTICSENERGYFERTILIZERS OXOPLASTS MELAMINE PIGMENTS
ORGANIC GROWTHINVESTMENTS
2014−2020 CAPEX BUDGET: PLN 7bn
32 % 11 %19 %30 % 4 % 2 % 2 %
CAPITAL EXPENDITURE IN JANUARY−SEPTEMBER 2016
CAPEX IN 2016
PLN 1.6bnTOTAL
PLN 875m
BUSINESS DEVELOPMENT INVESTMENTS 425.0
BUSINESS MAINTENANCE INVESTMENTS 227.2
MANDATORY INVESTMENTS 86.5
PURCHASE OF FINISHED GOODS 35.4
OTHER (COMPONENTS, MAJOR OVERHAULS) 101.0
ACTUAL EXPENDITURE AGAINST CAPEX BUDGET SINCE 2014
0% 10% 20% 30% 40% 50% 60% 70% 80% 90% 100%
(PLNm)
STRATEGY
16
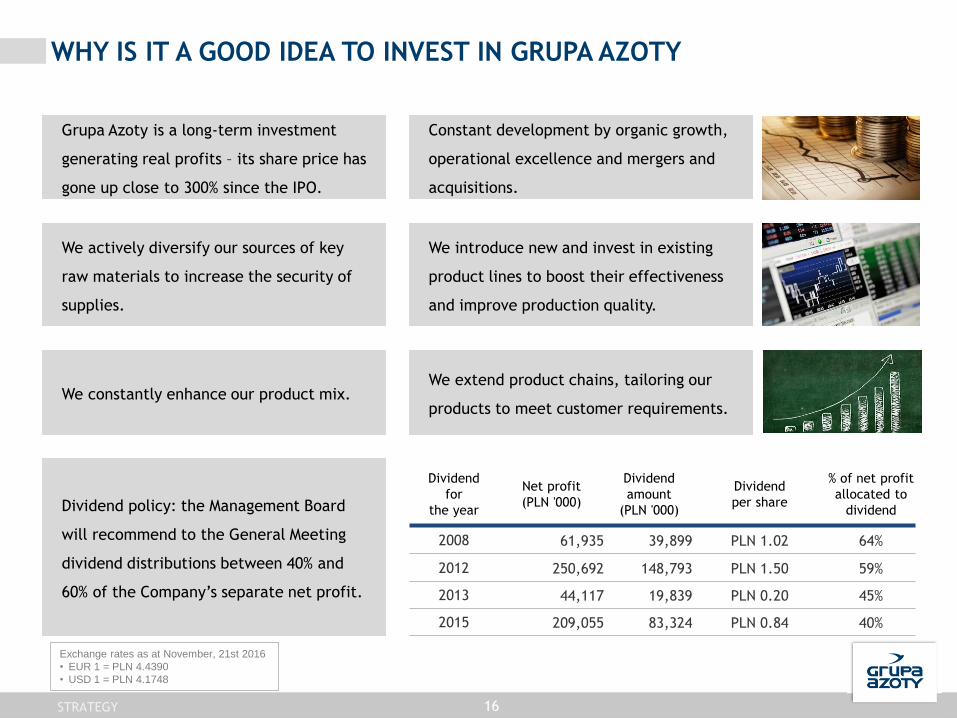
WHY IS IT A GOOD IDEA TO INVEST IN GRUPA AZOTY
Grupa Azoty is a long-term investment
generating real profits – its share price has
gone up close to 300% since the IPO.
Dividend policy: the Management Board
will recommend to the General Meeting
dividend distributions between 40% and
60% of the Company’s separate net profit.
Constant development by organic growth,
operational excellence and mergers and
acquisitions.
We introduce new and invest in existing
product lines to boost their effectiveness
and improve production quality.
We constantly enhance our product mix.We extend product chains, tailoring our
products to meet customer requirements.
We actively diversify our sources of key
raw materials to increase the security of
supplies.
STRATEGY
Dividend
for
the year
Net profit
(PLN '000)
Dividend
amount
(PLN '000)
Dividend
per share
% of net profit
allocated to
dividend
2008 61,935 39,899 PLN 1.02 64%
2012 250,692 148,793 PLN 1.50 59%
2013 44,117 19,839 PLN 0.20 45%
2015 209,055 83,324 PLN 0.84 40%
Exchange rates as at November, 21st 2016
• EUR 1 = PLN 4.4390
• USD 1 = PLN 4.1748

FINANCIAL HIGHLIGHTS

GRUPA AZOTY GROUP: Q1−Q3 FINANCIAL HIGHLIGHTS
18
Q1-Q3
2013
Q1-Q3
2014
Q1-Q3
2015**
Q1-Q3
2016
Q1−Q3 change
2016/2015(PLNm)
Revenue 7,473 7,342 7,507 6,633 -12% (
EBIT 780 294 641 439 -32% (
EBIT margin 10% 4% 9% 7%
EBITDA 1,196 695 1,003 826 -18% (
EBITDA margin 16% 9% 13% 12%
Net profit 771 250 540 346 -36% (
1,196
695
1,003826750
869
16.0%
9.5%
13.4%12.5%
Q1-Q3 2013 Q1-Q3 2014 Q1-Q3 2015 Q1-Q3 2016
EBITDA
EBITDA(adjusted)*
EBITDA MARGIN
* In 2013 adjusted for gain on bargain purchase of Grupa Azoty PUŁAWY
In 2016, adjusted for estimated impairment loss recognised by African Investment Group S.A.
** Restated following application of uniform accounting policies across Grupa Azoty (see Section 2.2.c of the Supplementary information to the financial
statements)
(PLNm)
FINANCIAL HIGHLIGHTS
Exchange rates as at November, 21st 2016
• EUR 1 = PLN 4.4390
• USD 1 = PLN 4.1748

PERFORMANCE BY SEGMENT
19
REVENUE Q1-Q3 2016
FINANCIAL HIGHLIGHTS
SEGMENT
(PLNm)
REVENUE EBITDA EBITDA
MARGIN
REVENUE EBITDA EBITDA
MARGIN
Q1-Q3
2015*
Q1-Q3
2016
Q1-Q3
2015*
Q1-Q3
2016
Q1-Q3
20162015 2015 2015
Agro Fertilizers 4,522 3,830 725 505 13% 6,058 998 16%
Plastics 967 834 8 -35 -4% 1,248 -10 -1%
Chemicals 1,744 1,684 112 234 14% 2,302 135 6%
Energy 49 161 18 58 n.a. 209 78 n.a.
Other Activities 53 125 20 40 n.a. 207 114 n.a.
* Restated following adoption of uniform accounting policies across the Group (see Section 2.2.c of the Supplementary
information to the financial statements)
Plastics13%
Fertilizers54%
Chemicals28%
Energy2%
Other3%
Exchange rates as at November, 21st 2016
• EUR 1 = PLN 4.4390
• USD 1 = PLN 4.1748

GRUPA AZOTY GROUP FINANCIALS
(PLNm)
(PLNm)
20
68%
17%
15%
FINANCING STRUCTURE
1,150
462 5
AVAILABLE FUNDS
Corporate credit facilities
Overdraft and multi-purpose facilities
Other financing sources
(PLNm)
RATIOSQ1-Q3
2015*
Q1-Q3
2016
Profitability ratios
EBIT margin (%) 8.5 6.6
EBITDA margin (%) 13.4 12.5
ROCE (%) 7.3 4.7
ROE (%) 7.7 4.7
Liquidity ratios
Current ratio 2.0 1.9
Debt ratios
Total debt ratio (%) 33.0 33.7
Net debt (PLNm) 1 281
Net debt/12M EBITDA ratio 0 0.2
Debt to equity ratio (%) 49.3 50.9
* Restated following application of uniform accounting policies across Grupa Azoty (see Section 2.2.c of the Supplementary information to the financial statements)
FINANCIAL HIGHLIGHTS
Exchange rates as at November, 21st 2016
• EUR 1 = PLN 4.4390
• USD 1 = PLN 4.1748

0
1 000
2 000
3 000
4 000
5 000
6 000
7 000
8 000
9 000
10 000
2014 2015OtherDepreciation and amortisationLabour costsServicesRaw materials and consumables used
GRUPA AZOTY GROUP: COST STRUCTURE
PLNm
-5%
40%
22%
7%
7%
6%
5%
4%
4%
4%
Natural gas
Other Activities
Potassiumchloride
Electricity
Coal
Propylene
Phosphate rock
Phenol
Benzene
21FINANCIAL HIGHLIGHTS
Exchange rates as at November, 21st 2016
• EUR 1 = PLN 4.4390
• USD 1 = PLN 4.1748

0
20
40
60
80
100
120
0
10000
20000
30000
40000
50000
60000
70000
WIG Grupa Azoty S.A.
STOCK PRICE
Growth from Jun 30 2008: 239%
High (Dec 8 2015) PLN 113.00
Low (Feb 3 2009) PLN 6.00
GRUPA AZOTY S.A. 22

DISCLAIMER
DISCLAIMERThe information contained herein has been prepared by the Grupa Azoty Group (“the Group”) solely for the purpose of presentation to investors (“the
Presentation”). By participating in the meeting at which this Presentation is given or by referring to this Presentation you agree to the restrictions and disclaimers
presented below.
This Presentation does not constitute, or form any part of, and should not be considered as, an offer to sell or invitation to subscribe for, or as a guarantee of
purchase or other acquisition of any securities of any of the Group companies. Neither this presentation nor any part hereof may form the basis of, or be relied
upon in connection with, any subscription for or acquisition of any securities of the Group companies. Neither this Presentation nor any part hereof may form the
basis of, or be relied upon in connection with, any contract or commitment or investment decision relating to any securities of the Group companies. This
Presentation does not constitute a recommendation regarding any securities of the Group companies.
No statement or assurance, express or implied, has been made by or on behalf of the Group or any of its shareholders, members of its bodies, officers, employees,
agents or advisers or any other person as to the accuracy, completeness or reliability of the information or opinions contained in this Presentation. The discussion
of various subjects in this Presentation may include forward-looking statements. Forward-looking statements are different from statements of historical fact. They
can be identified by the use of such words as "expect", "intend", "plan", "believe", "anticipate", "will", "aim", "can", "would", "could", "continue" or similar
expressions. Forward-looking statements include statements about the financial performance, business strategy, plans and objectives of the Group (including
development plans relating to the Group). All forward-looking statements contained in this Presentation relate to matters involving known and unknown risks,
issues that are impossible to predict, and other factors. Actual results and achievements of the Group may materially differ from those given in past declarations,
and from the Company’s past performance and achievements. Forward-looking statements are made based on various assumptions about future events, including
assumptions regarding the current and future business strategies of the Group and its future business environment. Although the Group believes that its estimates
and assumptions are reasonable, they may prove to be incorrect. The information, opinions and forward-looking statements contained herein are valid only on the
date of this Presentation and are subject to change without notice. Unless required by law, the Group and its advisors are not obliged to publish any updates or
modify any information, data or statements contained in this Presentation in the event of a change to the Group’s strategy or plans or the occurrence of any facts
or circumstances that will have an effect on the Group’s strategy or plans. Please note that the only reliable source of data on the Group's and Group companies’
financial performance, as well as forecasts, events and indicators relating to the Group and the Group companies, are the current and periodic reports released by
the Group companies to comply with the applicable disclosure requirements under Polish law.
Neither the Group nor any of its shareholders, members of its bodies, officers, employees, agents or advisers nor any other person shall be liable for any loss arising
due to the use of this Presentation or its contents, or otherwise in connection with this Presentation.
Neither the Group nor any of its shareholders, members of its bodies, officers, employees, agents or advisers nor any other person is required to provide the
recipients of this Presentation with any additional information or to update this Presentation.
This Presentation contains information on the chemical industry in Poland and abroad, including information on the market share of the Company and some of its
competitors. In each case the source of such information is provided, and such information has not been subject to independent verification by or on behalf of the
Group.
This Presentation is not for distribution to or use by any person or entity in any jurisdiction where such distribution or use would be contrary to local law or would
oblige the Group or any of its affiliates to obtain an authorisation, license or exemption from the registration requirements under applicable laws. Neither this
Presentation nor any part hereof may be copied or transmitted into the United States, and cannot be disseminated, directly or indirectly in the United States.
Failure to comply with this restriction may constitute a violation of US securities laws. Persons who come into possession of this Presentation should observe all the
above limitations. Any securities referred to herein have not been and will not be registered under the US Securities Act of 1933. Any such securities may not be
offered or sold in the United States, except pursuant to an exemption or in a transaction not subject to the registration requirements of the Act.
23

THANK YOU FOR YOUR ATTENTIONFor more information visit www.grupaazoty.com
Contact: [email protected]