
Post-low bouncing in Mandarin Chinese: Acoustic analysis and ...
12
Post-low bouncing in Mandarin Chinese: Acoustic analysis and computational modeling Santitham Prom-on a) Department of Speech, Hearing and Phonetic Sciences, University College London, London WC1N 1PF, United Kingdom Fang Liu Center for the Study of Language and Information, Stanford University, Stanford, California 94305-4101 Yi Xu Department of Speech, Hearing and Phonetic Sciences, University College London, London WC1N 1PF, United Kingdom (Received 18 October 2011; revised 29 February 2012; accepted 28 April 2012) Post-low bouncing is a phenomenon whereby after reaching a very low pitch in a low lexical tone, F 0 bounces up and then gradually drops back in the following syllables. This paper reports the results of an acoustic analysis of the phenomenon in two Mandarin Chinese corpora and presents a simple mechanical model that can effectively simulate this bouncing effect. The acoustic analysis shows that most of the F 0 dynamic features profiling the bouncing effect strongly correlate with the amount of F 0 lowering in the preceding low-tone syllable, and that the additional F 0 raising com- mences at the onset of the first post-low syllable. Using the quantitative Target Approximation model, this bouncing effect was simulated by adding an acceleration adjustment to the initial F 0 state of the first post-low syllable. A highly linear relation between F 0 lowering and estimated acceleration adjustment was found. This relation was then used to effectively simulate the bouncing effect in both the neutral tone and the full tones. The results of the analysis and simulation are consistent with the hypothesis that the bouncing effect is due to a temporary perturbation of the bal- ance between antagonistic forces in the laryngeal control in producing a very low pitch. V C 2012 Acoustical Society of America. [http://dx.doi.org/10.1121/1.4725762] PACS number(s): 43.70.Bk, 43.70.Fq, 43.70.Gr, 43.72.Ja [MAH] Pages: 421–432 I. INTRODUCTION Fundamental frequency (F 0 ) carries important communi- cative information in speech, but much of its variability also comes from articulatory factors. The classic work of Lehiste and Peterson (1961) has established the importance of recog- nizing specific articulatory effects in the understanding of F 0 contours in speech. They have demonstrated the effects of vowel intrinsic F 0 and consonantal perturbation on the intona- tion contours of English declarative sentences, which have later been shown to be generalizable to other languages (Francis et al., 2006; Hombert et al., 1979; Silverman, 1986; Whalen and Levitt, 1995; Xu and Xu, 2003). Other works have further identified additional articulatory-based effects on F 0 realization, including carryover assimilation (Gandour et al., 1994; Han and Kim, 1974; Xu, 1997, 1999), maximum speed of pitch change (Sundberg, 1979; Xu and Sun, 2002), anticipatory dissimilation (Gandour et al., 1994; Laniran and Clements, 2003; Xu, 1997, 1999), and total pitch range (Honorof and Whalen, 2005). There has also been evidence of syllable-synchronized pitch target approximation (Xu, 1998; Xu and Wang 2001), although the generality of this mecha- nism is still in dispute (Arvaniti and Ladd, 2009). All these findings suggest that in order to understand how F 0 conveys communicative information, it is necessary to recognize the contributions of specific articulatory mechanisms. The present study is concerned with a much lesser known articulation-based effect that so far has been observed only for Mandarin and Cantonese. The effect raises F 0 after the Low (L) tone, especially when the following syllables carry the Neutral (N) tone (Chen and Xu, 2006; Gu and Lee, 2009; Shen, 1994). The raised pitch of the N tone after the L tone in Mandarin has been long known, but the effect has been considered mostly as a tonal phenomenon, limited to the first N tone after the L tone (Chao, 1968; Lin and Yan, 1980; Shen, 1992; Shih, 1988). A somewhat similar effect was also reported for Cantonese (Gu and Lee, 2009). Chen and Xu (2006) observed that the F 0 rising after the L tone continued into the subsequent N-tone syllables, and that the effect became even stronger when the L tone was under pro- sodic focus. Similar patterns were again observed in Liu and Xu (2007). An example is shown in Fig. 1, where the third syllable carries four alternating full tones, including High (H), Rising (R), Low (L) and Falling (F), as indicated by the different line patterns. In the case of the L tone (3rd sylla- ble), F 0 drops sharply within the L-tone syllable, but starts to rise from the beginning of the next syllable, which carries the N tone, and continues to rise further in the next N tone. By the second N tone, the F 0 height has surpassed those of all the other tone sequences whose F 0 contours nearly a) Also at: Department of Computer Engineering, King Mongkut’s University of Technology Thonburi, Bangkok 10140, Thailand. Author to whom corre- spondence should be addressed. Electronic mail: [email protected] J. Acoust. Soc. Am. 132 (1), July 2012 V C 2012 Acoustical Society of America 421 0001-4966/2012/132(1)/421/12/$30.00 Downloaded 10 Jul 2012 to 144.82.108.120. Redistribution subject to ASA license or copyright; see http://asadl.org/journals/doc/ASALIB-home/info/terms.jsp
Transcript of Post-low bouncing in Mandarin Chinese: Acoustic analysis and ...

Post-low bouncing in Mandarin Chinese: Acoustic analysisand computational modeling
Santitham Prom-ona)
Department of Speech, Hearing and Phonetic Sciences, University College London, London WC1N 1PF,United Kingdom
Fang LiuCenter for the Study of Language and Information, Stanford University, Stanford, California 94305-4101
Yi XuDepartment of Speech, Hearing and Phonetic Sciences, University College London, London WC1N 1PF,United Kingdom
(Received 18 October 2011; revised 29 February 2012; accepted 28 April 2012)
Post-low bouncing is a phenomenon whereby after reaching a very low pitch in a low lexical tone,
F0 bounces up and then gradually drops back in the following syllables. This paper reports the
results of an acoustic analysis of the phenomenon in two Mandarin Chinese corpora and presents a
simple mechanical model that can effectively simulate this bouncing effect. The acoustic analysis
shows that most of the F0 dynamic features profiling the bouncing effect strongly correlate with the
amount of F0 lowering in the preceding low-tone syllable, and that the additional F0 raising com-
mences at the onset of the first post-low syllable. Using the quantitative Target Approximation
model, this bouncing effect was simulated by adding an acceleration adjustment to the initial F0
state of the first post-low syllable. A highly linear relation between F0 lowering and estimated
acceleration adjustment was found. This relation was then used to effectively simulate the bouncing
effect in both the neutral tone and the full tones. The results of the analysis and simulation are
consistent with the hypothesis that the bouncing effect is due to a temporary perturbation of the bal-
ance between antagonistic forces in the laryngeal control in producing a very low pitch.VC 2012 Acoustical Society of America. [http://dx.doi.org/10.1121/1.4725762]
PACS number(s): 43.70.Bk, 43.70.Fq, 43.70.Gr, 43.72.Ja [MAH] Pages: 421–432
I. INTRODUCTION
Fundamental frequency (F0) carries important communi-
cative information in speech, but much of its variability also
comes from articulatory factors. The classic work of Lehiste
and Peterson (1961) has established the importance of recog-
nizing specific articulatory effects in the understanding of F0
contours in speech. They have demonstrated the effects of
vowel intrinsic F0 and consonantal perturbation on the intona-
tion contours of English declarative sentences, which have
later been shown to be generalizable to other languages
(Francis et al., 2006; Hombert et al., 1979; Silverman, 1986;
Whalen and Levitt, 1995; Xu and Xu, 2003). Other works
have further identified additional articulatory-based effects on
F0 realization, including carryover assimilation (Gandour
et al., 1994; Han and Kim, 1974; Xu, 1997, 1999), maximum
speed of pitch change (Sundberg, 1979; Xu and Sun, 2002),
anticipatory dissimilation (Gandour et al., 1994; Laniran and
Clements, 2003; Xu, 1997, 1999), and total pitch range
(Honorof and Whalen, 2005). There has also been evidence of
syllable-synchronized pitch target approximation (Xu, 1998;
Xu and Wang 2001), although the generality of this mecha-
nism is still in dispute (Arvaniti and Ladd, 2009). All these
findings suggest that in order to understand how F0 conveys
communicative information, it is necessary to recognize the
contributions of specific articulatory mechanisms.
The present study is concerned with a much lesser
known articulation-based effect that so far has been observed
only for Mandarin and Cantonese. The effect raises F0 after
the Low (L) tone, especially when the following syllables
carry the Neutral (N) tone (Chen and Xu, 2006; Gu and Lee,
2009; Shen, 1994). The raised pitch of the N tone after the L
tone in Mandarin has been long known, but the effect has
been considered mostly as a tonal phenomenon, limited to
the first N tone after the L tone (Chao, 1968; Lin and Yan,
1980; Shen, 1992; Shih, 1988). A somewhat similar effect
was also reported for Cantonese (Gu and Lee, 2009). Chen
and Xu (2006) observed that the F0 rising after the L tone
continued into the subsequent N-tone syllables, and that the
effect became even stronger when the L tone was under pro-
sodic focus. Similar patterns were again observed in Liu and
Xu (2007). An example is shown in Fig. 1, where the third
syllable carries four alternating full tones, including High
(H), Rising (R), Low (L) and Falling (F), as indicated by the
different line patterns. In the case of the L tone (3rd sylla-
ble), F0 drops sharply within the L-tone syllable, but starts to
rise from the beginning of the next syllable, which carries
the N tone, and continues to rise further in the next N tone.
By the second N tone, the F0 height has surpassed those of
all the other tone sequences whose F0 contours nearly
a)Also at: Department of Computer Engineering, King Mongkut’s University
of Technology Thonburi, Bangkok 10140, Thailand. Author to whom corre-
spondence should be addressed. Electronic mail: [email protected]
J. Acoust. Soc. Am. 132 (1), July 2012 VC 2012 Acoustical Society of America 4210001-4966/2012/132(1)/421/12/$30.00
Downloaded 10 Jul 2012 to 144.82.108.120. Redistribution subject to ASA license or copyright; see http://asadl.org/journals/doc/ASALIB-home/info/terms.jsp

converge by the end of the third N-tone syllable. The behav-
ior of F0 in the L-N sequence in Fig. 1 (thick line) is like
that of a bouncing ball after hitting the ground, hence the
name, post-low bouncing.
Such an F0 bouncing, although occurring between tones,
is different from the known carryover effect that has been
extensively studied in Thai (Gandour et al., 1994) and Man-
darin Chinese (Xu, 1997, 1999). As found in these studies, the
initial F0 of a syllable is heavily assimilated to the final F0 of
the preceding tone, but over the course of the current syllable,
F0 gradually approaches its own tonal target. To account for
such assimilatory effect, Xu and Wang (2001) proposed the
Target Approximation model, which represents the production
of successive tones as a process of asymptotically approach-
ing each tonal target within the time interval of the respective
syllable. In such a process, carryover assimilation results from
the articulation of each tone having to start from the offset F0
of the preceding syllable. The Target Approximation model
has been computationally implemented with simple mechani-
cal dynamics as the quantitative Target Approximation (qTA)
model (Prom-on et al., 2009). In the qTA model, the carry-
over effect results from the transfer of the final F0 dynamic
states (F0 level, velocity, and acceleration) of one syllable to
the next as the initial conditions. However, the qTA model, in
its original form, cannot simulate the post-low bouncing effect
because it generates only a carryover lowering, rather than
raising effect after an L tone.
Chen and Xu (2006) have reported that post-low bounc-
ing also occurs in the full tones in Mandarin, but the effect is
smaller and lasts shorter than in the N tone. They suggested
that this could be due to the difference in target approxima-
tion strength between these tones. That is, the stronger
strength of the full tones may be more effective in restoring
the muscular balance in the laryngeal control after the articu-
lation of the L tone. As a result, it is only when the L tone is
focused, which pushes F0 to an even lower level (Xu, 1999),
is the effect of post-low bouncing clearly observable (Chen
and Xu, 2006).
Based on the observational evidences, Chen and Xu
(2006) proposed that post-low bouncing could be a by-
product of the laryngeal activity in producing a very low
pitch. The production of low F0 below the mid-level is
known to involve the activation of extrinsic laryngeal
muscles such as the sternohyoids, sternothyroids, and thyro-
hyoids (Atkinson, 1978; Erickson, 1993, 2011; Erickson
et al., 1995; Halle, 1994; Ohala, 1972). A possible main
function of these muscles is to control the vertical position of
the larynx (Atkinson, 1978; Shipp, 1975). It has been sug-
gested that the lowering of the larynx pulls the cricoid carti-
lages across a curvature of the cervical spine (Honda et al.,1999), which tilts the top of the cricoids forward, thus further
shortening the vocal folds by an extra amount (Atkinson,
1978; Honda et al., 1999; Shipp, 1975). Given these findings,
it is possible that after producing a very low F0, the extrinsic
laryngeal muscles, especially the sternohyoids (Atkinson,
1978; Ohala, 1972), stop contracting and thus temporarily tip
the balance between the two antagonistic forces maintained
by the intrinsic laryngeal muscles, resulting in a sudden
increase of the vocal fold tension. If this is the case, post-low
bouncing could be modeled by adding an extra F0 raising
force after F0 is lowered beyond a certain threshold. The gen-
eral goal of the present study is to test this balance-perturba-tion account of post-low bouncing. Specifically, we will try
to answer two questions: (1) Is there acoustic evidence in
support of the balance-perturbation account of post-low
bouncing? (2) Is it possible to computationally model post-
low bouncing based on the balance-perturbation account? To
answer the first question, we conducted a multifactor correla-
tion analysis to identify the factors most closely related to
post-low bouncing. To answer the second question, we tested
the effectiveness of adjusting the initial condition of the post-
low tone in the qTA model to simulate the extra force.
II. MULTIFACTOR CORRELATION ANALYSIS
A. Corpus
The corpus was originally collected for a study of the
Neutral tone in question intonation (Liu and Xu, 2007). It
consisted of 1280 eight-syllable utterances recorded by four
male and four female native Mandarin speakers. Table I
shows the sentence structure of the N-tone corpus. In each
utterance, the first and second syllables always have the H
and L tones, respectively. The third and fourth syllables form
disyllabic words with the tone of the third syllable varying
FIG. 1. Mean time-normalized F0 contours, by eight native Mandarin
speakers, with four different full tones on the third syllable. The gray arrow
indicates the post-low bouncing phenomenon which occurs only in the utter-
ances with the L tone prior to the N-tone sequence. This figure is adapted
from Liu and Xu (2007).
TABLE I. Sentence structure of the Neutral tone corpus (Liu and Xu,
2007). N, H, R, L, and F represent Neutral, High, Rising, Low, and Falling
tones, respectively. The numbers at the end of each syllable also represent
the tones: 0, 1, 2, 3, and 4 for N, H, R, L, and F, respectively.
Syllables 1–2 Syllables 3–4 Syllables 5–6 Syllables 7–8
ta1 mai3
H L
“He bought”
ma1 ma0
H N
“mother”
men0 de0
N N
“s’”
le0 ma0
N N
“goody”ye2 ye0
R N
“grandpa”
nai3 nai0
L N
“grandma”mao1 mi1
H H
“kitten”mei4 mei0
F N
“sister”
422 J. Acoust. Soc. Am., Vol. 132, No. 1, July 2012 Prom-on et al.: Post-low bouncing: Acoustic analysis and modeling
Downloaded 10 Jul 2012 to 144.82.108.120. Redistribution subject to ASA license or copyright; see http://asadl.org/journals/doc/ASALIB-home/info/terms.jsp

across all full tones, H, R, L, and F. The tone of the fourth,
fifth, and sixth syllables is always N. The last two syllables,
the seventh and eighth, both have either N or H tone. Having
at least three consecutive N-tone syllables after the L tone cre-
ates an ideal condition for studying the aftereffect of a very
low F0 level. Because the corpus was originally designed for
studying the interaction between question intonation and
focus on the N tone, each utterance was spoken as either a
question or a statement, with prosodic focus either on the sec-
ond syllable, mai3, or the third syllable, ma1/ye2/nai3/mei4.
Each utterance was repeated five times by each speaker. The
F0 contours of the N-tone corpus were already extracted and
processed in previous studies (Liu and Xu, 2007; Liu, 2009)
by an earlier version of ProsodyPro (Xu, 2005–2011).
In analyzing the effect of post-low bouncing, only those
utterances with the L tone on the third syllable were used
(320 utterances). However, when assessing the accuracy of
the model-based synthesis, the entire corpus was used (1280
utterances).
B. Analysis
Our strategy is to identify, through a multifactor cor-
relation analysis, the acoustic features that can best repre-
sent and predict post-low bouncing. We first assembled a
set of F0 dynamic features, shown in Table II with corre-
sponding abbreviations and descriptions. These features,
all of which were independently measured except for vav,
which was derived, were related to the dynamic variations
of F0 contours either prior to or during post-low bouncing.
Velocity and acceleration measurements were calculated
using a two-point central differentiation algorithm (Bahill
et al., 1982), based on F0 contours with a sampling rate of
100 Hz and smoothed with a 50-ms triangular window.
The reliability of the extraction of F0 contours was
ensured by manual rectification of every vocal pulse mark-
ing using ProsodyPro (Xu, 2005–2011). Figure 2 illustrates
the locations where the measurements of the features were
taken from an F0 track. The measurements can be
TABLE II. List of F0 dynamic features used for profiling post-low bouncing.
Name Symbol Unit Description
Trigger (F0 dynamic features in a L-tone syllable preceding the post-low bouncing event)
F0 lowering fL st Magnitude of F0 lowering measured at the end of the syllable relative to the F0 mean of each speaker
F0 excursion fE st Magnitude of F0 lowering measured at the end of the syllable relative to the initial F0 value of each syllable
Peak velocity vP st/s Maximum rate of F0 lowering
Peak velocity time tvP s Elapsed time from the point of peak velocity to the end of the syllable
Average velocity vav st/s Average rate of F0 movement in each syllable: vav¼ fE/syllable duration
Peak acceleration aP st/s2 Maximum rate of velocity change
Peak acceleration time taP s Elapsed time from the point of peak acceleration to the end of the syllable
Final velocity vF st/s Rate of F0 change at the end of the syllable
Final acceleration aF st/s2 Rate of velocity change at the end of the syllable
Event (F0 dynamic features of the post-low bouncing event)
Peak time TP s Elapsed time from the beginning of the syllable to the post-low peak
F0 overshoot FOS st Magnitude of post-low peak relative to the final settling F0 value
F0 rising excursion FE st Magnitude of post-low peak relative to the initial F0 value of the first post-low syllable
Peak rising velocity VP st/s Maximum rate of F0 bouncing
Peak rising velocity time TVP s Elapsed time from the beginning of the syllable to the point of rising peak velocity
Peak rising acceleration AP st/s2 Maximum rate of velocity increment
Peak rising acceleration time TAP s Elapsed time from the beginning of the syllable to the point of maximum rising acceleration
Initial velocity VI st/s Initial rate of F0 change at the beginning of the N-tone sequence
Initial acceleration AI st/s2 Initial rate of velocity change at the beginning of the N-tone sequence
FIG. 2. Illustration of F0 dynamic
features of the triggering L-tone
syllable and the subsequent N-tone
syllables in which post-low bouncing
occurs. Abbreviations and explana-
tions of the features are shown in
Table II. The thick black line repre-
sents the F0 contour. The vertical
gray lines demarcate syllable boun-
daries. The dashed gray lines mark
the measurement locations and
dimensions.
J. Acoust. Soc. Am., Vol. 132, No. 1, July 2012 Prom-on et al.: Post-low bouncing: Acoustic analysis and modeling 423
Downloaded 10 Jul 2012 to 144.82.108.120. Redistribution subject to ASA license or copyright; see http://asadl.org/journals/doc/ASALIB-home/info/terms.jsp
categorized into two groups, the trigger and the event,
depending on whether they were made on the L-tone syl-
lable immediately preceding the bouncing or the N-tone
sequence following the L-tone syllable.
The association between the features were calculated
using Pearson’s correlation coefficients (hereafter correla-
tion, or r). In this study, correlation strength between two F0
dynamic features was defined as none-to-weak if jrj < 0.4,
moderate if 0.4� jr j< 0.7, or strong if jrj � 0.7. While cor-
relation is not necessarily equivalent to causation, a signifi-
cant correlation of F0 dynamic features between the trigger
syllable and the post-low bouncing event would suggest the
possibility of a causal relation while a significant association
within groups would indicate an interdependency between
the features.
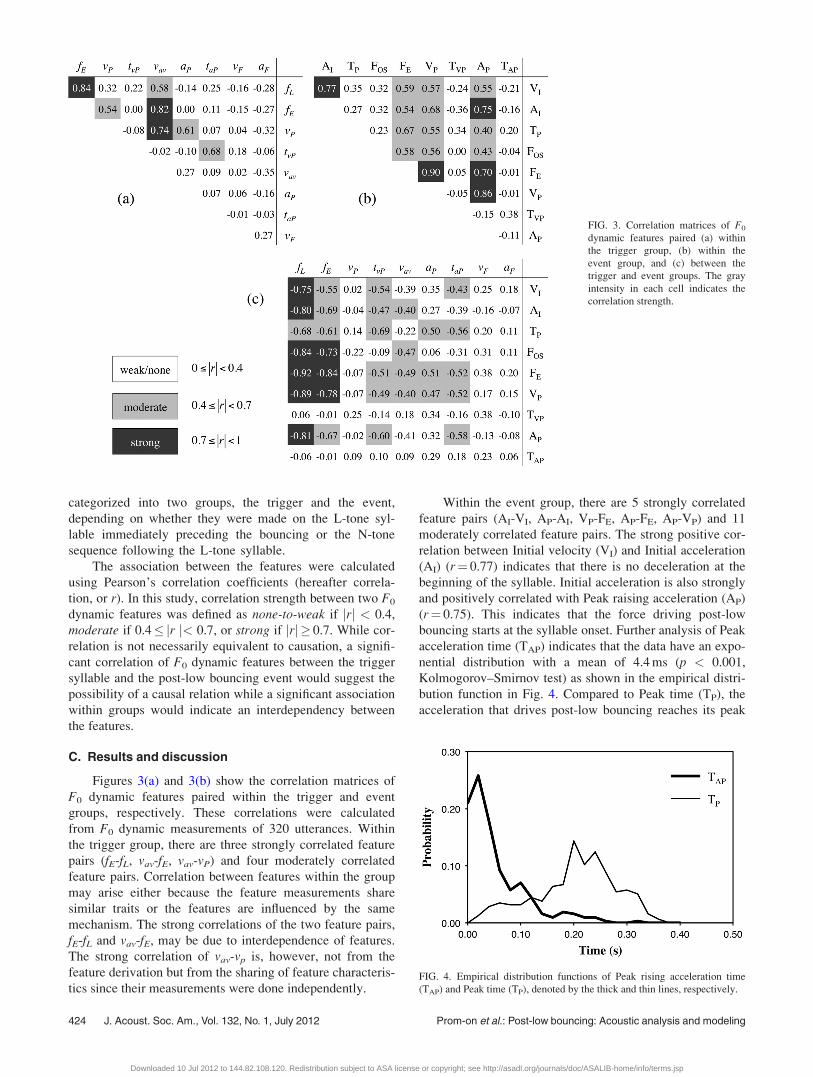
C. Results and discussion
Figures 3(a) and 3(b) show the correlation matrices of
F0 dynamic features paired within the trigger and event
groups, respectively. These correlations were calculated
from F0 dynamic measurements of 320 utterances. Within
the trigger group, there are three strongly correlated feature
pairs (fE-fL, vav-fE, vav-vP) and four moderately correlated
feature pairs. Correlation between features within the group
may arise either because the feature measurements share
similar traits or the features are influenced by the same
mechanism. The strong correlations of the two feature pairs,
fE-fL and vav-fE, may be due to interdependence of features.
The strong correlation of vav-vp is, however, not from the
feature derivation but from the sharing of feature characteris-
tics since their measurements were done independently.
Within the event group, there are 5 strongly correlated
feature pairs (AI-VI, AP-AI, VP-FE, AP-FE, AP-VP) and 11
moderately correlated feature pairs. The strong positive cor-
relation between Initial velocity (VI) and Initial acceleration
(AI) (r¼ 0.77) indicates that there is no deceleration at the
beginning of the syllable. Initial acceleration is also strongly
and positively correlated with Peak raising acceleration (AP)
(r¼ 0.75). This indicates that the force driving post-low
bouncing starts at the syllable onset. Further analysis of Peak
acceleration time (TAP) indicates that the data have an expo-
nential distribution with a mean of 4.4 ms (p < 0.001,
Kolmogorov–Smirnov test) as shown in the empirical distri-
bution function in Fig. 4. Compared to Peak time (TP), the
acceleration that drives post-low bouncing reaches its peak
FIG. 3. Correlation matrices of F0
dynamic features paired (a) within
the trigger group, (b) within the
event group, and (c) between the
trigger and event groups. The gray
intensity in each cell indicates the
correlation strength.
FIG. 4. Empirical distribution functions of Peak rising acceleration time
(TAP) and Peak time (TP), denoted by the thick and thin lines, respectively.
424 J. Acoust. Soc. Am., Vol. 132, No. 1, July 2012 Prom-on et al.: Post-low bouncing: Acoustic analysis and modeling
Downloaded 10 Jul 2012 to 144.82.108.120. Redistribution subject to ASA license or copyright; see http://asadl.org/journals/doc/ASALIB-home/info/terms.jsp

very early and may have originated from the same force
driving Initial acceleration. It also indicates that there are no
other raising forces involved in the bouncing, otherwise
Peak acceleration time would not have an exponential distri-
bution, but would incline toward a normal distribution
instead. The distribution of Peak time is close to normal
(p¼ 0.025, Kolmogorov–Smirnov test), which indicates con-
sistency of the bouncing behavior across speakers. The
strong correlations between the F0 rising excursion, Peak ve-
locity, and Peak acceleration (VP-FE: r¼ 0.90, AP-FE:
r¼ 0.70, AP-VP: r¼ 0.86) indicate the mechanistic nature of
the F0 control.
Figure 3(c) shows the correlations between the trigger
and event groups. There are 9 strongly correlated feature
pairs (fL-VI, fL-AI, fL-FOS, fL-FE, fL-VP, fL-AP, fE-FOS, fE-FE,
fE-VP) and 23 moderately correlated feature pairs. Figure 5
shows the scatter plots of the strongly correlated feature
pairs between the trigger and event groups. Because features
in the trigger group were measured prior to the bouncing
while features in the event group were measured during the
bouncing, high correlations of the features between these
two groups would suggest possible causal relations. As can
be seen from Figs. 3 and 5, F0 lowering is predominantly
and strongly associated with almost all but the timing fea-
tures in the event group. It also has consistently stronger
associations than F0 excursion to the event group. This indi-
cates that F0 lowering is the most likely trigger of post-low
bouncing. Interestingly, only none-to-weak correlations were
observed between final and initial F0 dynamic states (vF-VI:
r¼ 0.25, aF-AI: r¼�0.07), while there were strong
FIG. 5. Scatter plots of the features of the event group that strongly correlate with F0 lowering [panels (a)–(f)] and F0 excursion [panels (g)–(i)].
J. Acoust. Soc. Am., Vol. 132, No. 1, July 2012 Prom-on et al.: Post-low bouncing: Acoustic analysis and modeling 425
Downloaded 10 Jul 2012 to 144.82.108.120. Redistribution subject to ASA license or copyright; see http://asadl.org/journals/doc/ASALIB-home/info/terms.jsp

correlations between F0 lowering and the initial F0 dynamic
state (fL-VI: r¼�0.75, fL-AI: r¼�0.80). This indicates that
there is an abrupt change in F0 dynamics at the syllable
boundary prior to the bouncing, which is closely associated
with F0 lowering in the preceding syllable (fL). It should be
noted that the strong correlation between fL and FE is partly
due to the fact that FE is the combination of fL and the F0
overshoot beyond the speaker mean. In contrast, fL and FOS
are relatively independent of each other, so the strong corre-
lation between them (r¼�0.84) further affirms the crucial
role F0 lowering (fL) plays in triggering the bouncing
behavior.
III. MODELING
A. Method
The results of the acoustic analysis suggest that the trig-
ger of post-low bouncing is the lowering of F0 in the preced-
ing L tone, which activates an F0 raising force right at the
syllable boundary. After the activation, the raising force
propagates through the N-tone sequence without any further
reinforcement until its momentum diminishes. This means
that it is possible to simulate post-low bouncing by emulat-
ing the perturbation of the balanced F0 control at the syllable
boundary after the L tone. To this end, the qTA model,
which has been effective in simulating assimilatory carry-
over effects in both Mandarin and English (Prom-on et al.,2009), was used. The basic idea of the qTA model is that F0
contours are responses of the target approximation process
to the input pitch target sequence, as illustrated in Fig. 6.
Surface F0 contours, represented by the thick curve in Fig. 6,
are the result of sequential implementation of pitch targets,
each of which is localized to the host syllable. The final F0
dynamic state (in terms of F0 level, F0 velocity, and F0
acceleration) at the end of a syllable is transferred to the
onset of the next syllable, resulting in a smooth and continu-
ous F0 trajectory across the syllable boundary.
In qTA, an F0 contour as a general form of output
of the linear system is composed of two parts: Forced
response and natural response (Prom-on et al., 2009), as rep-
resented by the following equation:
f0ðtÞ ¼ ðmtþ bÞ þ ðc1 þ c2tþ c3t2Þe�kt: (1)
The first term in parentheses is the forced response, which is
the pitch target, i.e., the desired pitch trajectory associated
with a tone. The second term, consisting of the polynomial
and the exponential, is the natural response, i.e., the transi-
tion from the current articulatory state to the pitch target.
The model has three free parameters: m and b which specify
the form of the pitch target in terms of its slope and height,
respectively, and k which represents the rate or strength of
target approximation, i.e., how rapidly the pitch target is
approached. The greater the value of k the faster F0
approaches the target. The transient coefficients c1, c2, and
c3 are jointly determined by the initial F0 dynamic state of
the syllable and the pitch target. The initial dynamic state in
this case consists of F0 level, f0(0), velocity, f00(0�), and
acceleration, f000(0�), which are transferred from the preced-
ing syllable. The transient coefficients are computed with the
following formulas:
c1 ¼ f0ð0Þ � b; (2)
c2 ¼ f00ð0�Þ þ c1k� m; (3)
c3 ¼�
f000ð0�Þ þ 2c2k� c1k
2�=2: (4)
The free parameters m, b, and k can be estimated
through automatic analysis-by-synthesis (Prom-on et al.,2009). For each utterance in a corpus, the qTA parameters
are estimated syllable-by-syllable starting from the first syl-
lable of the utterance and ending on the last syllable. For
each syllable, the parameters m, b, and k are simultaneously
estimated by searching for the parameter combination with
the lowest sum of square error between the synthesized and
the original F0 contours. At each syllable offset, the F0
dynamic state is transferred to the next syllable as the initial
condition, which is used in the parameter estimation for that
syllable. This estimation process is repeated until the end of
the utterance.
For all the Mandarin tones except the N tone, the above
process of estimating the qTA model parameters has been
shown to work effectively for both tone and intonation (Prom-
on et al., 2009, 2011). For the N tone, because its pitch target
takes several consecutive syllables to reach (Chen and Xu,
2006; Liu and Xu, 2007), the F0 contour of any single N-tone
syllable only partially reflects the underlying target. But if the
consecutive N-tone syllables are treated as all approaching the
same target, the parameter estimation process may be better
able to estimate the N-tone target in terms of slope, height, as
well as strength (Prom-on et al., 2011). Thus for each utter-
ance, all the N-tone syllables were grouped together as one
segment during parameter estimation.
To implement the hypothesized extra force that gener-
ates post-low bouncing, we added an adjustment of either
acceleration or velocity to the initial state of the first N tone
immediately after the L tone. The addition of either simu-
lated velocity adjustment (vS) or simulated acceleration
adjustment (aS) would not cause a sudden change in F0, but
would influence the subsequent F0 trajectories. Table III
shows the equations of three strategies for modifying the ini-
tial F0 state. To determine the amount of additional force
FIG. 6. Illustration of the target approximation process. The thick solid
curve represents the F0 contours that asymptotically approach two succes-
sive pitch targets represented by the dashed lines. The middle vertical gray
line represents the syllable boundary through which the final F0 dynamic
state is transferred from one syllable to the next. The gray block arrow indi-
cates the direction of the F0 dynamic state transfer.
426 J. Acoust. Soc. Am., Vol. 132, No. 1, July 2012 Prom-on et al.: Post-low bouncing: Acoustic analysis and modeling
Downloaded 10 Jul 2012 to 144.82.108.120. Redistribution subject to ASA license or copyright; see http://asadl.org/journals/doc/ASALIB-home/info/terms.jsp

needed, we modified the qTA parameter estimation algo-
rithm implemented in PENTAtrainer (Xu and Prom-on,
2010–2011) to iteratively search for the optimal extra values
of either vS or aS that would result in the lowest sum of
square errors in the parameter estimation for the syllables
following the L tone. The best strategy for modeling post-
low bouncing in the N tone was then selected by comparing
the synthesis accuracies of using different F0 dynamic
adjustments. Once the optimal F0 dynamic adjustments of
all utterances were determined, we associated them to the
possible triggering feature by using regression analysis. The
resulting relation was then used as a rule to simulate post-
low bouncing.
B. Results and discussion
The first set of results in this section is to show the inad-
equacy of the qTA model in its original form in simulating
post-low bouncing in the test corpus. Table IV shows synthe-
sis accuracies of utterances having each of the four Mandarin
full tones on the third syllable without applying any adjust-
ments for post-low bouncing. The utterances with the L tone
show both higher error and lower correlation compared to
the other tones [Root-Mean-Square Error (RMSE): L-H
t(14)¼ 3.18, p¼ 0.003; L-R t(14)¼ 2.41, p¼ 0.015; L-F
t(14)¼ 4.20, p < 0.001; Correlation: L-H t(14)¼ 5.21, p <0.001; L-R t(14)¼ 3.77, p¼ 0.001; L-F t(14)¼ 5.93, p <0.001]. The impact of post-low bouncing on the synthesis ac-
curacy thus seems significant.
The second set of results, as displayed in the top four
rows of Table V, shows the accuracies of F0 synthesis when
either estimated vS or aS is applied to the F0 dynamic state at
the syllable boundary after the L tone. These results are
based only on the utterances in the corpus that have the L
tone on the third syllable. As can be seen, implementing aS
yielded greater improvements than implementing vS, which
seems reasonable since acceleration is directly proportional
to force according to Newton’s second law of motion. Com-
pared to Table IV, with aS, the overall errors and correlations
of the utterances with the L tone on the third syllable are
now comparable to those with other full tones. Implementing
both aS and vS yielded only marginal additional improve-
ments over implementing either alone. This is probably
because velocity variations are the direct result of accelera-
tion variations and so the two are not independent of each
other. Further analysis on the distribution of the estimated vS
and aS when both were implemented is shown in Fig. 7.
Only a small proportion (3%) of all cases involves only vS,
while more than half (55%) involves only aS. This indicates
that the estimated aS adjustments dominate those of vS. Thus,
in the following, we will only discuss the results of using aS
to model post-low bouncing.
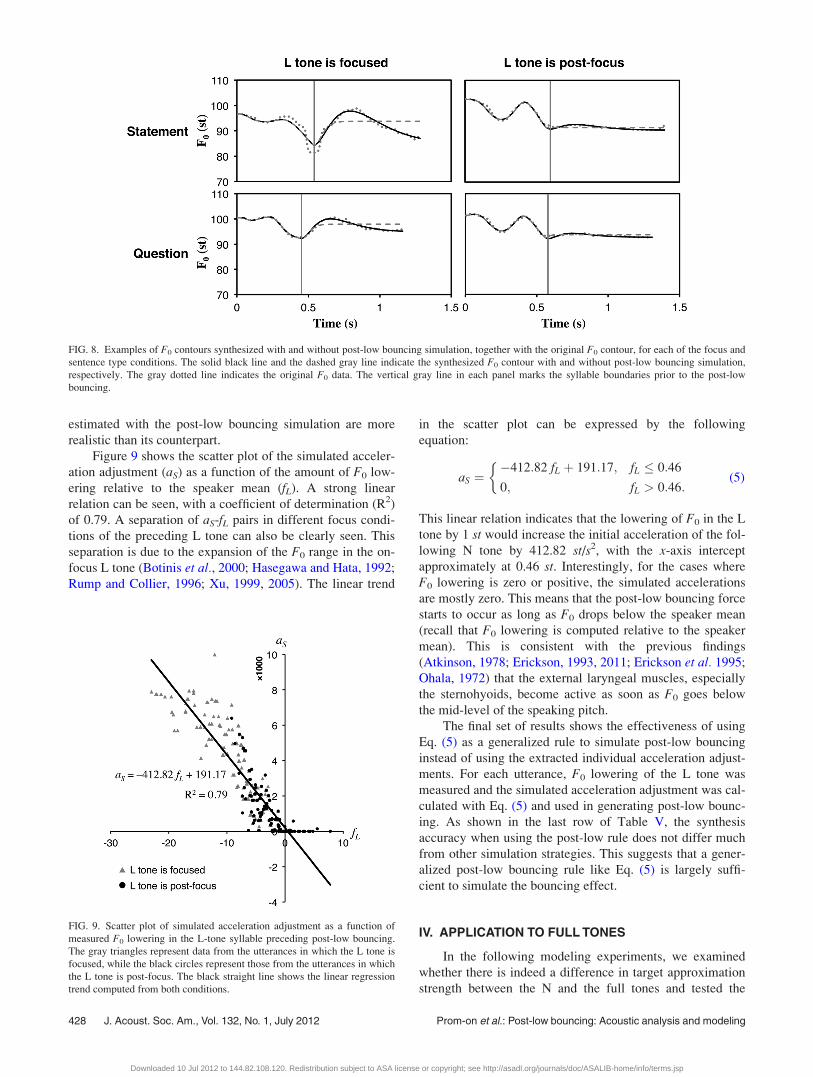
Examples of F0 contours synthesized with and without
post-low bouncing simulation, with different focus condi-
tions and sentence types, are shown in Fig. 8. With no
additional accelerations added to the initial F0 dynamic state
of the first post-low N tone (dashed line), synthesized F0
simply asymptotically approaches the pitch target of the N
tone, resulting in a contour that is very different from the
original (dotted line). With the acceleration adjustment
(solid line), the F0 contours seem to resemble the original
much better. This pattern is consistent across focus and sen-
tence type conditions. Analyzing the pitch target of N tones
in different preceding tone contexts reveals the importance
of post-low bouncing simulation. Without acceleration
adjustment, m of the post-low N tone significantly differs
from the N tone following other tones [F(3,252)¼ 4.56,
p¼ 0.04], whereas with the acceleration adjustment, it is
more consistent with the N tones following other tones
[F(3,252)¼ 1.96, p¼ 0.121]. This suggests that pitch targets
TABLE III. Strategies for F0 dynamic adjustments. vS and aS denote veloc-
ity and acceleration adjustment, respectively. The hat sign “^” indicates the
modified version of F0 dynamic states.
Strategy 1: vS Strategy 2: aS Strategy 3: vS & aS
f̂ 0ð0Þ ¼ f0ð0Þf̂00ð0�Þ ¼ f0
0ð0�Þ þ vS
f̂000ð0�Þ ¼ f̂
000ð0�Þ
f̂ 0 ð0Þ ¼ f0ð0Þf̂00ð0�Þ ¼ f0
0ð0�Þf̂000ð0�Þ ¼ f̂
000ð0�Þ þ aS
f̂ 0 ð0Þ ¼ f0ð0Þf̂00ð0�Þ ¼ f0
0ð0�Þ þ vS
f̂000ð0�Þ ¼ f̂
000ð0�Þ þ aS
TABLE IV. RMSEs and correlations of utterances having each full tone on
the third syllable. The values in each cell are mean and its standard error cal-
culated from all speakers.
Tone RMSE (st) Correlation
H 0.99 6 0.10 0.975 6 0.003
R 1.20 6 0.09 0.960 6 0.005
L 1.82 6 0.24 0.909 6 0.012
F 0.76 6 0.07 0.983 6 0.002
TABLE V. RMSEs and correlations of different simulation strategies used
for simulating post-low bouncing. The values in each cell are mean and
standard error calculated from all speakers.
Strategy RMSE (st) Correlation
Baseline 1.82 6 0.24 0.909 6 0.012
Baselineþ vS 1.12 6 0.11 0.967 6 0.004
Baselineþ aS 1.00 6 0.10 0.974 6 0.003
Baselineþ vS and aS 0.97 6 0.10 0.975 6 0.003
Baselineþ rulea 1.06 6 0.11 0.960 6 0.005
aPost-low bouncing rule as shown in Eq. (5).
FIG. 7. Distribution of the estimated velocity and acceleration adjustments
when both are included in post-low bouncing simulation.
J. Acoust. Soc. Am., Vol. 132, No. 1, July 2012 Prom-on et al.: Post-low bouncing: Acoustic analysis and modeling 427
Downloaded 10 Jul 2012 to 144.82.108.120. Redistribution subject to ASA license or copyright; see http://asadl.org/journals/doc/ASALIB-home/info/terms.jsp
estimated with the post-low bouncing simulation are more
realistic than its counterpart.
Figure 9 shows the scatter plot of the simulated acceler-
ation adjustment (aS) as a function of the amount of F0 low-
ering relative to the speaker mean (fL). A strong linear
relation can be seen, with a coefficient of determination (R2)
of 0.79. A separation of aS-fL pairs in different focus condi-
tions of the preceding L tone can also be clearly seen. This
separation is due to the expansion of the F0 range in the on-
focus L tone (Botinis et al., 2000; Hasegawa and Hata, 1992;
Rump and Collier, 1996; Xu, 1999, 2005). The linear trend
in the scatter plot can be expressed by the following
equation:
aS ¼�412:82 fL þ 191:17; fL � 0:46
0; fL > 0:46:
�(5)
This linear relation indicates that the lowering of F0 in the L
tone by 1 st would increase the initial acceleration of the fol-
lowing N tone by 412.82 st/s2, with the x-axis intercept
approximately at 0.46 st. Interestingly, for the cases where
F0 lowering is zero or positive, the simulated accelerations
are mostly zero. This means that the post-low bouncing force
starts to occur as long as F0 drops below the speaker mean
(recall that F0 lowering is computed relative to the speaker
mean). This is consistent with the previous findings
(Atkinson, 1978; Erickson, 1993, 2011; Erickson et al. 1995;
Ohala, 1972) that the external laryngeal muscles, especially
the sternohyoids, become active as soon as F0 goes below
the mid-level of the speaking pitch.
The final set of results shows the effectiveness of using
Eq. (5) as a generalized rule to simulate post-low bouncing
instead of using the extracted individual acceleration adjust-
ments. For each utterance, F0 lowering of the L tone was
measured and the simulated acceleration adjustment was cal-
culated with Eq. (5) and used in generating post-low bounc-
ing. As shown in the last row of Table V, the synthesis
accuracy when using the post-low rule does not differ much
from other simulation strategies. This suggests that a gener-
alized post-low bouncing rule like Eq. (5) is largely suffi-
cient to simulate the bouncing effect.
IV. APPLICATION TO FULL TONES
In the following modeling experiments, we examined
whether there is indeed a difference in target approximation
strength between the N and the full tones and tested the
FIG. 8. Examples of F0 contours synthesized with and without post-low bouncing simulation, together with the original F0 contour, for each of the focus and
sentence type conditions. The solid black line and the dashed gray line indicate the synthesized F0 contour with and without post-low bouncing simulation,
respectively. The gray dotted line indicates the original F0 data. The vertical gray line in each panel marks the syllable boundaries prior to the post-low
bouncing.
FIG. 9. Scatter plot of simulated acceleration adjustment as a function of
measured F0 lowering in the L-tone syllable preceding post-low bouncing.
The gray triangles represent data from the utterances in which the L tone is
focused, while the black circles represent those from the utterances in which
the L tone is post-focus. The black straight line shows the linear regression
trend computed from both conditions.
428 J. Acoust. Soc. Am., Vol. 132, No. 1, July 2012 Prom-on et al.: Post-low bouncing: Acoustic analysis and modeling
Downloaded 10 Jul 2012 to 144.82.108.120. Redistribution subject to ASA license or copyright; see http://asadl.org/journals/doc/ASALIB-home/info/terms.jsp
effectiveness of directly applying the post-low bouncing rule
learned from the N tone to the full tones.
A. Corpus
The full tone corpus was originally collected for a study
of tone and focus in Mandarin (Xu, 1999). It consisted of
3840 five-syllable utterances recorded by four male and four
female native Mandarin speakers. Table VI shows the sen-
tence structure of the full tone corpus. In each utterance, the
first and last syllables always have the H tone. The tone of
the second syllable varies across all four full tones. The tone
of the third syllable varies across H, R, and F. For this posi-
tion, the L tone was omitted in the corpus to avoid the tone
sandhi which changes an L tone to an R tone before another
L tone (Chao, 1968). The tone of the fourth syllable was ei-
ther H or L. Each utterance was spoken with focus on the
first two syllables, the middle syllable, the last two syllables,
or without focus. Each utterance was repeated five times for
each tone and focus condition.
For the purpose of comparing the target approximation
strengths of the N and full tones, we trained the qTA model
on the full tone corpus and compared the values of the pa-
rameter k to those of the N tone obtained in Sec. III. To test
the effectiveness of the post-low bouncing rule in full tones
[Eq. (5)], which was derived from the N-tone simulation, the
F0 contour of each utterance in the full tone corpus was syn-
thesized using the qTA model with the rule and compared to
the original. Due to a severe creaky voice of two of the
female speakers that may cause the errors in measuring F0
lowering, their data were excluded from the analysis. Thus,
there were 720 utterances in total with the L tone on the
second syllable, and 2160 utterances in total with the other
full tones on the second syllable. The effectiveness of the
simulation was evaluated by both numerical assessment of
synthesis accuracy and visual inspection.
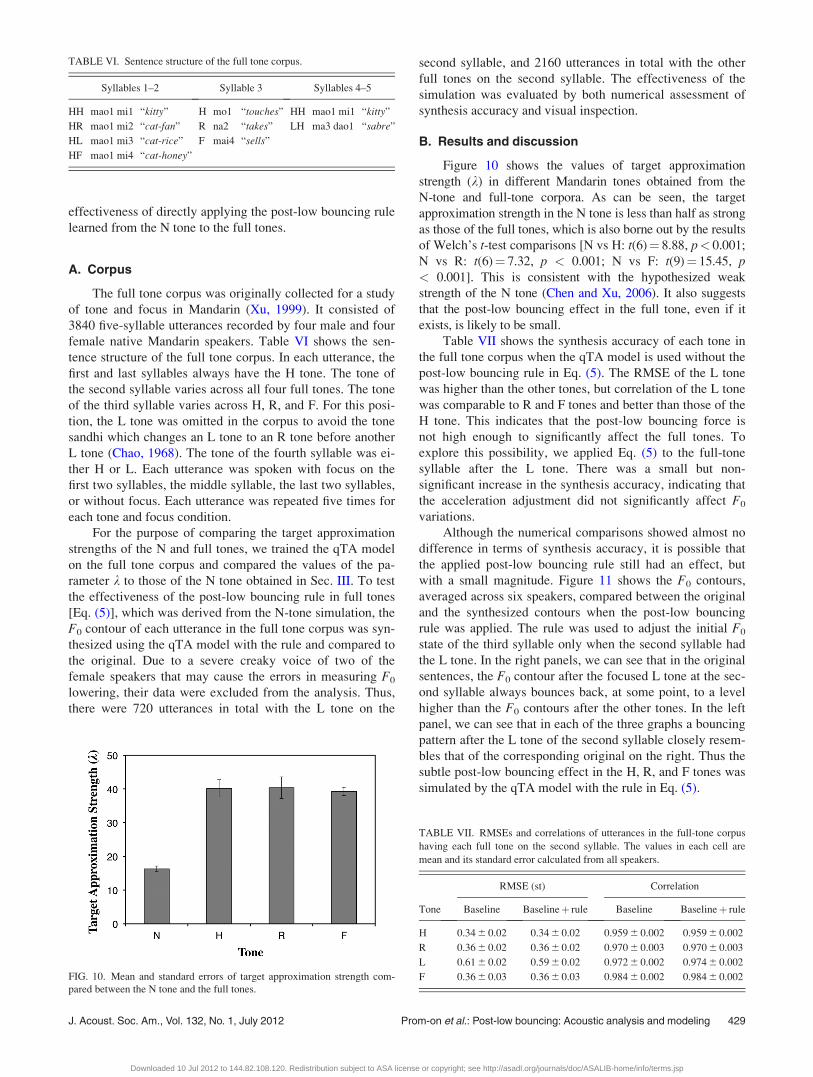
B. Results and discussion
Figure 10 shows the values of target approximation
strength (k) in different Mandarin tones obtained from the
N-tone and full-tone corpora. As can be seen, the target
approximation strength in the N tone is less than half as strong
as those of the full tones, which is also borne out by the results
of Welch’s t-test comparisons [N vs H: t(6)¼ 8.88, p< 0.001;
N vs R: t(6)¼ 7.32, p < 0.001; N vs F: t(9)¼ 15.45, p< 0.001]. This is consistent with the hypothesized weak
strength of the N tone (Chen and Xu, 2006). It also suggests
that the post-low bouncing effect in the full tone, even if it
exists, is likely to be small.
Table VII shows the synthesis accuracy of each tone in
the full tone corpus when the qTA model is used without the
post-low bouncing rule in Eq. (5). The RMSE of the L tone
was higher than the other tones, but correlation of the L tone
was comparable to R and F tones and better than those of the
H tone. This indicates that the post-low bouncing force is
not high enough to significantly affect the full tones. To
explore this possibility, we applied Eq. (5) to the full-tone
syllable after the L tone. There was a small but non-
significant increase in the synthesis accuracy, indicating that
the acceleration adjustment did not significantly affect F0
variations.
Although the numerical comparisons showed almost no
difference in terms of synthesis accuracy, it is possible that
the applied post-low bouncing rule still had an effect, but
with a small magnitude. Figure 11 shows the F0 contours,
averaged across six speakers, compared between the original
and the synthesized contours when the post-low bouncing
rule was applied. The rule was used to adjust the initial F0
state of the third syllable only when the second syllable had
the L tone. In the right panels, we can see that in the original
sentences, the F0 contour after the focused L tone at the sec-
ond syllable always bounces back, at some point, to a level
higher than the F0 contours after the other tones. In the left
panel, we can see that in each of the three graphs a bouncing
pattern after the L tone of the second syllable closely resem-
bles that of the corresponding original on the right. Thus the
subtle post-low bouncing effect in the H, R, and F tones was
simulated by the qTA model with the rule in Eq. (5).
TABLE VI. Sentence structure of the full tone corpus.
Syllables 1–2 Syllable 3 Syllables 4–5
HH mao1 mi1 “kitty” H mo1 “touches” HH mao1 mi1 “kitty”
HR mao1 mi2 “cat-fan” R na2 “takes” LH ma3 dao1 “sabre”
HL mao1 mi3 “cat-rice” F mai4 “sells”
HF mao1 mi4 “cat-honey”
FIG. 10. Mean and standard errors of target approximation strength com-
pared between the N tone and the full tones.
TABLE VII. RMSEs and correlations of utterances in the full-tone corpus
having each full tone on the second syllable. The values in each cell are
mean and its standard error calculated from all speakers.
RMSE (st) Correlation
Tone Baseline Baselineþ rule Baseline Baselineþ rule
H 0.34 6 0.02 0.34 6 0.02 0.959 6 0.002 0.959 6 0.002
R 0.36 6 0.02 0.36 6 0.02 0.970 6 0.003 0.970 6 0.003
L 0.61 6 0.02 0.59 6 0.02 0.972 6 0.002 0.974 6 0.002
F 0.36 6 0.03 0.36 6 0.03 0.984 6 0.002 0.984 6 0.002
J. Acoust. Soc. Am., Vol. 132, No. 1, July 2012 Prom-on et al.: Post-low bouncing: Acoustic analysis and modeling 429
Downloaded 10 Jul 2012 to 144.82.108.120. Redistribution subject to ASA license or copyright; see http://asadl.org/journals/doc/ASALIB-home/info/terms.jsp

V. GENERAL DISCUSSION
Two questions were raised at the beginning of the pres-
ent study: (1) Is there acoustic evidence in support of the
balance-perturbation account of post-low bouncing? (2) Is it
possible to computationally model post-low bouncing based
on the balance-perturbation account? Regarding the first
question, results of the acoustic analysis in Sec. II show
strong linear relations between F0 lowering and a number of
F0 dynamic features that profile post-low bouncing, as
depicted in Fig. 5. Moreover, the abrupt change between the
final and initial F0 dynamic state across the syllable bound-
ary as shown in the correlation matrices in Fig. 3 indicates
that post-low bouncing is very likely triggered at the end of
the L-tone syllable. This suggests that the state of very low
F0 at the end of the syllable plays an important role in trig-
gering post-low bouncing in the subsequent N-tone syllables.
This is consistent with the proposals of Chen and Xu (2006)
that post-low bouncing is due to an added articulatory force
introduced by the sudden cessation of the contraction of the
extrinsic laryngeal muscles after producing a low F0 (Atkin-
son, 1978; Erickson, 1976, 1993; Erickson et al., 1995;
Halle, 1994; Ohala, 1972), which temporarily tips the bal-
ance in the antagonistic control of the vocal fold tension by
the intrinsic and extrinsic laryngeal muscles.
Further support for this balance-perturbation account
was demonstrated by our modeling tests, which also
addressed the second question. By translating the balance-
perturbation account into F0 dynamic adjustment strategies
as shown in Table III, we trained the qTA model with a pro-
cedure that allowed the identification of an additional force
in terms of either a velocity or acceleration adjustment added
to the initial state of the first post-low N tone. The modeling
results in Secs. III and IV support the balance-perturbation
account in two ways. The first is a highly linear relation
between the amount of F0 lowering in the L tone and the
simulated acceleration adjustment, as shown in Fig. 9. This
linear relation can be conceptualized if we link Hooke’s law
of elasticity with Newton’s second law of motion. In such a
relation, the acceleration as part of the restoring force is line-
arly proportional to displacement of one end of a spring
from its equilibrium position. The second support is in the
fact that the application of the generalized post-low bounc-
ing rule based on Eq. (5) led to an almost equal performance
FIG. 11. Mean time-normalized F0 contours, by six native Mandarin speakers, with four different tones on the second syllable. Utterances with different tones
on the second syllable are represented by different line patterns as shown in the legend. A bold font indicates that the syllable is focused. The y-axis is the F0
value in semitones.
430 J. Acoust. Soc. Am., Vol. 132, No. 1, July 2012 Prom-on et al.: Post-low bouncing: Acoustic analysis and modeling
Downloaded 10 Jul 2012 to 144.82.108.120. Redistribution subject to ASA license or copyright; see http://asadl.org/journals/doc/ASALIB-home/info/terms.jsp

as that of applying utterance-specific acceleration adjust-
ments, as shown in Table V.
The relatively subtle post-low bouncing effect in the full
tones, when compared to the N tone, indicates that target
approximation strength is an important factor influencing the
effect. This complicates the situation further as focus also
interacts with post-low bouncing (Chen and Xu, 2006). That
is, a focus on an L tone generates two direct effects. The first
is the lowering of the L tone itself, which is the source of post-
low bouncing. The second effect, known as post-focus com-
pression, lowers the F0 of all the post-focus syllables (Cooper
et al., 1985; Xu, 1999; Xu and Xu, 2005). Because the two
effects are in opposite directions, part of the post-low bouncing
effect could be neutralized. Such neutralization is more likely
to occur in a post-focus full tone than an N tone, because the
latter has weaker target approximation strength as shown in
Fig. 10. The post-low bouncing effect in the full tones can
therefore be easily masked by noise in analysis and modeling.
With regard to the second question, we demonstrated in
Secs. II and III the effectiveness and generalizability of the
post-low bouncing rule in F0 synthesis. This rule, when
applied in adjusting the F0 acceleration at the beginning of the
first syllable after the post-low syllable, can effectively simu-
late post-low bouncing in both the neutral and full tones.
The evidence in the present study suggests that post-low
bouncing is an articulatory-based phenomenon. As such it is
potentially applicable to other languages. The current results
also suggest, however, that certain requirements need to be
met for post-low bouncing to be observable. The first is the
presence of a low pitch target such as in the L tone in Man-
darin, and the lower the actual F0 associated with it, the more
likely the bouncing effect may occur. The second is the
strength of the post-low target as shown in Fig. 10. The lower
the strength, the more likely the bouncing effect may occur.
But it is the relative weight of the two factors that would even-
tually determine how observable the bouncing effect is. A case
in point is Cantonese. As reported by Gu and Lee (2009), in
Cantonese, unlike in Mandarin, a subtle post-low bouncing
can be observed in non-weak tones after the low-falling tone
(Tone 4) even without focus. As they suggested, it is possible
that it is the need to clearly distinguish Tone 4 from Tone 6,
which is also low (low-level), that pushes F0 even lower than
in the Mandarin L tone. Being articulatory in nature, post-low
bouncing may also occur in non-tonal languages. For example,
as suggested by Chen and Xu (2006), English may also meet
these requirements, i.e., in situations where an L* pitch accent
on a stressed syllable is followed by a number of unstressed
syllables (Pierrehumbert, 1980). Erickson et al. (1995) have
found that L* in English has the highest sternohyoid activity
compared to other pitch accents. It is thus possible that post-
low bouncing also occurs in these sequences in English, which
could explain the constant valley-to-peak interval reported by
Pierrehumbert (1980) and discussed in Chen and Xu (2006).
Two caveats need to be mentioned. First, acoustic data
have been used in this study to infer a hypothetical articula-
tory mechanism. Although such practice is not uncommon in
the study of F0, formant or duration (Lehiste and Peterson,
1961; Linblom, 1963; Moon and Linblom, 1994; Xu and
Sun, 2002; Xu, 2009), ultimately it is desirable to corrobo-
rate the acoustic data with articulatory evidence. Further
studies of this phenomenon at the articulatory level are there-
fore needed. Second, our informal listening during the
course of the study clearly suggested the need to address
post-low bouncing in modeling and the advantage of simu-
lating it with the strategy used in the study. However, formal
perceptual tests have not yet been conducted. It therefore
awaits future research to conduct perceptual evaluations of
the present modeling approach.
VI. CONCLUSION
Post-low bouncing is a subtle phenomenon in speech
prosody that has only recently been recognized as an isolata-
ble effect (Chen and Xu, 2006; Gu and Lee, 2009). But its
understanding is crucial for explaining such long-known
phenomena as the rising contour of the neutral tone after the
Low tone in Mandarin (Chao, 1968) or possibly the F0 peak
after a low pitch accent in English (Pierrehumbert, 1980).
The present study investigated post-low bouncing by means
of multifactor acoustic analysis and computational modeling.
The results of this study provided evidence in support of the
balance-perturbation hypothesis, which describes post-low
bouncing as a temporary loss of balance in the antagonistic
laryngeal control right after the production of a very low
pitch (Chen and Xu, 2006). In addition, the modeling results
demonstrate the ability of the qTA model, which is based on
the idea of balanced antagonistic laryngeal control (Prom-on
et al., 2009), to simulate not only normal contextual tonal
variations, but also post-low bouncing after the addition of a
very simple adjustment in the initial state of the first post-
low syllable. It will be interesting to explore the applicability
of this approach to other languages.
ACKNOWLEDGMENT
The authors would like to thank the Royal Society and
the Royal Academy of Engineering for financial support
through the Newton International Fellowship Scheme, and the
Thai Research Fund through the TRF-CHE Research Grant
for New Scholar (Grant No. MRG5380038 to S.P.). This
work was also supported in part by the Economic and Social
Research Council (Grant No. PTA-026-27-2480-A to F.L.).
Arvaniti, A., and Ladd, D. R. (2009). “Greek wh-questions and the phonol-
ogy of intonation,” Phonology 26, 43–74.
Atkinson, J. E. (1978). “Correlation analysis of the physiological factors con-
trolling fundamental voice frequency,” J. Acoust. Soc. Am. 63, 211–222.
Bahill, A. T., Kallman, J. S., and Lieberman, J. E. (1982). “Frequency limi-
tations of two-point central difference differentiation algorithm,” Biol.
Cybern. 45, 1–4.
Botinis, A., Bannert, R., and Tatham, M. (2000). “Contrastive tonal analysis
of focus perception in Greek and Swedish,” in Intonation: Analysis, Mod-elling and Technology, edited by A. Botinis (Kluwer Academic, Boston),
pp. 97–116.
Chao, Y. R. (1968). A Grammar of Spoken Chinese (University of California
Press, Berkeley), pp. 55–56.
Chen, Y., and Xu, Y. (2006). “Production of weak elements in speech—evi-
dence from F0 patterns of neutral tone in Standard Chinese,” Phonetica 63,
47–75.
Cooper, W. E., Eady, S. J., and Mueller, P. R. (1985). “Acoustical aspects of
contrastive stress in question-answer contexts,” J. Acoust. Soc. Am. 77,
2142–2156.
J. Acoust. Soc. Am., Vol. 132, No. 1, July 2012 Prom-on et al.: Post-low bouncing: Acoustic analysis and modeling 431
Downloaded 10 Jul 2012 to 144.82.108.120. Redistribution subject to ASA license or copyright; see http://asadl.org/journals/doc/ASALIB-home/info/terms.jsp

Erickson, D. (1976). “A physiological analysis of the tones of Thai,” Ph.D.
dissertation, University of Connecticut, pp. 49–83.
Erickson, D. (1993). “Laryngeal muscle activity in connection with Thai
tones,” Ann. Bull. Res. Inst. Logoped. Phoniatr. Univ. Tokyo 27,
135–149.
Erickson, D. (2011). “Thai tones revisited,” J. Phon. Soc. Jpn. 15, 74–82.
Erickson, D., Honda, K., Hirai, H., and Beckman, M. (1995). “The produc-
tion of low tones in English intonation,” J. Phonetics 23, 179–188.
Francis, A. L., Ciocca, V., Wong, V. K., and Chan, J. K. (2006). “Is funda-
mental frequency a cue to aspiration in initial stops?,” J. Acoust. Soc. Am.
120, 2884–2895.
Gandour, J., Potisuk, S., and Dechongkit, S. (1994). “Tonal coarticulation in
Thai,” J. Phonetics 22, 477–492.
Gu, W., and Lee, T. (2009). “Effects of tone and emphatic focus on F0 con-
tours of Cantonese speech—A comparison with standard Chinese,” Chin.
J. Phonetics 2, 133–147.
Halle, P. A. (1994). “Evidence for tone-specific activity of the sternohyoid
muscle in modern standard Chinese,” Lang. Speech 37, 103–123.
Han, M. S., and Kim, K.-O. (1974). “Phonetic variation of Vietnamese tones
in disyllable utterances,” J. Phonetics 2, 223–232.
Hasegawa, Y., and Hata, K. (1992). “Fundamental frequency as an acoustic
cue to accent perception,” Lang. Speech 35, 87–98.
Hombert, J. M., Ohala, J. J., and Ewan, W. G. (1979). “Phonetic explana-
tions for the development of tones,” Language 55, 37–58.
Honda, K., Hirai, H., Masaki, S., and Shimada, Y. (1999). “Role of vertical
larynx movement and vertical lordosis in F0 control,” Lang. Speech 42,
401–411.
Honorof, D. N., and Whalen, D. H. (2005). “Perception of pitch location
within a speaker’s F0 range,” J. Acoust. Soc. Am. 117, 2193–2200.
Laniran, Y. O., and Clements, G. N. (2003). “Downstep and high raising:
Interacting factors in Yoruba tone production,” J. Phonetics 31, 203–250.
Lehiste, I., and Peterson, G. E. (1961). “Some basic considerations in analy-
sis of intonation,” J. Acoust. Soc. Am. 33, 419–425.
Lin, M., and Yan, J. (1980). “Beijinghua qingsheng de shengxue xingzhi
(The acoustic nature of the Mandarin neutral tone),” Fangyan (Dialect) 3,
166–178.
Linblom, B. (1963). “Spectrographic study of vowel reduction,” J. Acoust.
Soc. Am. 35, 1773–1781.
Liu, F. (2009). “Intonation systems of Mandarin and English: A functional
approach,” Ph.D. dissertation, University of Chicago.
Liu, F., and Xu, Y. (2007). “The neutral tone in question intonation in Man-
darin,” in Proceedings of INTERSPEECH2007, Antwerp, pp. 630–633.
Moon, S. J., and Linblom, B. (1994). “Interaction between duration, context,
and speaking style in English stressed vowels,” J. Acoust. Soc. Am. 96,
40–55.
Ohala, J. J. (1972). “How is pitch lowered?,” J. Acoust. Soc. Am. 52, 124.
Pierrehumbert, J. B. (1980). “The phonology and phonetics of English
intonation,” Ph.D. dissertation, MIT, pp. 60–115.
Prom-on, S., Liu, F., and Xu, Y. (2011). “Functional modeling of tone, focus
and sentence type in Mandarin Chinese,” in Proceedings of the 17th Inter-national Congress of Phonetic Sciences, Hong Kong, pp. 1638–1641.
Prom-on, S., Xu, Y., and Thipakorn, B. (2009). “Modeling tone and intona-
tion in Mandarin and English as a process of target approximation,”
J. Acoust. Soc. Am. 125, 405–424.
Rump, H. H., and Collier, R. (1996). “Focus conditions and the prominence
in pitch-accented syllables,” Lang. Speech 39, 1–17.
Shen, J. (1994). “Hanyu yudiao gouzao he yudiao leixing (Intonation struc-
tures and patterns in Mandarin),” Fangyan (Dialect) 3, 221–228.
Shen, S. S. (1992). “Mandarin neutral tone revisited,” Acta Linguistica Haf-
niensia 24, 405–424.
Shih, C. (1988). “Tone and intonation in Mandarin” in Working Papers of the
Cornell Phonetics Laboratory, edited by N. Clements, No. 3, pp. 83–109.
Shipp, T. (1975). “Vertical laryngeal position during continuous and discrete
vocal frequency change,” J. Speech Hear. Res. 18, 707–718.
Silverman, K. (1986). “F0 segmental cues depend on intonation—the case of
the rise after voiced stops,” Phonetica 43, 76–91.
Sundberg, J. (1979). “Maximum speed of pitch changes in singers and
untrained subjects,” J. Phonetics 7, 71–79.
Whalen, D. H., and Levitt, A. G. (1995). “The universality of intrinsic F0 of
vowels,” J. Phonetics 23, 349–366.
Xu, C. X., and Xu, Y. (2003). “Effects of consonantal aspiration on
Mandarin tones,” J. Int. Phonetic Assoc. 33, 165–181.
Xu, Y. (1997). “Contextual tonal variations in Mandarin,” J. Phonetics 25,
61–83.
Xu, Y. (1998). “Consistency of tone-syllable alignment across different
syllable structures and speaking rates,” Phonetica 55, 179–203.
Xu, Y. (1999). “Effects of tone and focus on the formation and alignment of
F0 contours,” J. Phonetics 27, 55–105.
Xu, Y. (2005–2011). ProsodyPro.praat, http://www.phon.ucl.ac.uk/home/yi/
ProsodyPro (Last viewed 02/29/12).
Xu, Y. (2009). “Timing and coordination in tone and intonation—An
articulatory-functional perspective,” Lingua 119, 906–927.
Xu, Y., and Prom-on, S. (2010–2011). PENTAtrainer.praat, http://
www.phon.ucl.ac.uk/home/yi/PENTAtrainer (Last viewed 02/29/12).
Xu, Y., and Sun, X. J. (2002). “Maximum speed of pitch change and how it
may relate to speech,” J. Acoust. Soc. Am. 111, 1399–1413.
Xu, Y., and Wang, Q. E. (2001). “Pitch targets and their realization:
Evidence from Mandarin Chinese,” Speech Commun. 33, 319–337.
Xu, Y., and Xu, C. X. (2005). “Phonetic realization of focus in English
declarative intonation,” J. Phonetics 33, 159–197.
432 J. Acoust. Soc. Am., Vol. 132, No. 1, July 2012 Prom-on et al.: Post-low bouncing: Acoustic analysis and modeling
Downloaded 10 Jul 2012 to 144.82.108.120. Redistribution subject to ASA license or copyright; see http://asadl.org/journals/doc/ASALIB-home/info/terms.jsp