Bouncing back or bouncing forward? Simulating urban resiliencepluto.huji.ac.il/~msdfels/pdf/Bouncing...
10
Bouncing back or bouncing forward? Simulating urban resilience & 1 A. Yair Grinberger Department of Geography, Hebrew University of Jerusalem, Israel & 2 Daniel Felsenstein PhD Department of Geography, Hebrew University of Jerusalem, Israel 1 2 While the direct physical effects of an urban catastrophe are relatively straightforward to assess, indirect and long- term impact on the urban system is more circumspect. A large-scale shock such as an earthquake derails the complex urban system from its equilibrium path onto an unknown trajectory. Consequently, assessing the effect of policy intervention that aims to mitigate this shock and increase urban resilience is fraught with complexity. This paper presents the implementation of dynamic agent-based simulation to test long-run effects of a hypothetical earthquake in Jerusalem, Israel. It focuses on investigating the effectiveness of policy choices aimed at restoring the urban equilibrium. Cities are found to have a self-organising market-based mechanism that strives to attain a new equilibrium. They therefore may not always bounce back – they may also bounce forward. Decision-makers, engineers, emergency and urban planners need to be cognizant of this tendency when designing policy interventions. Otherwise, well-intentioned efforts may inhibit urban rejuvenation and delay the onset of city recovery. 1. Introduction: understanding resilience Over the past few decades cities have been subjected to ever- increasing disastrous events resulting in casualties and extensive property damage (Wamsler, 2004). As city populations and densities continue to rise, it is reasonable to assume that the trend of increasing damage from such events will intensify (Quarantelli, 1996; UNISDR, 2012). Given the magnitude of the potential catastrophes and also the expanding availability of data, tools and knowledge, increasing multidisciplinary effort is being focused on mediating the hazards facing cities and bolstering their resilience (Zolli and Healy, 2012). Much of this interest tends to focus on restoring urban conditions and rejuvenating city life. For engineers, the ability of the city to continue to restore critical services and maintain community capital in the aftermath of a catastrophic event, is a cornerstone of resilience. However, the issue of exactly what level of rejuvenation and for what purpose is often left vague. There is a general acceptance of a direct and linear cause and effect relationship in that a larger shock necessitates a larger effort to achieve restoration, and that time to recovery is somewhat proportionate to the magnitude of the disturbance (Chang and Rose, 2012). This paper shows in the context of the long-term urban effects of an earthquake that such direct relationships are hard to justify. Efforts at promoting city resilience do not necessarily produce such causal outcomes. The reading of ‘resilience’ follows that common in ecology and engineering (Adger, 2000; Holling, 1996) and denotes the ability of a system (natural or constructed) to recover from a shock. While consciously focused on the notion of equilibrium urban growth, engineers recognise that the outcome of an unanticipated event is not predetermined, as multiple unstable equilbria may exist. Thus, a small and perhaps inocuous perturbation can tip the system from one equilibrium state to another. While shocks are invariably exogenous there is no knowing a priori which one is going to tilt the city or region onto a new growth path. It has also been noted that nuanced but important differences exist as to whether this recovery is to a previous state, thereby assuming a single stable equilibrium (bouncing back) or whether the system post-shock has various trajectories for recovery and multiple potential equilibria (bouncing forward). ‘Bouncing back’ denotes the traditional occupation with regaining pre- disaster conditions (Chang, 2010). An urban disaster derails city development and it bounces back to a new growth path. In this case the counterfactual or city-growth-without-disaster state is not known. Furthermore, it is not known whether the current bounce-back is a permanent long-term adjustment. ‘Bouncing Urban Design and Planning Volume 167 Issue DP3 Bouncing back or bouncing forward? Simulating urban resilience Grinberger and Felsenstein Proceedings of the Institution of Civil Engineers Urban Design and Planning 167 June 2014 Issue DP3 Pages 115–124 http://dx.doi.org/10.1680/udap.13.00021 Paper 1300021 Received 01/07/2013 Accepted 02/02/2014 Keywords: disaster engineering/town and city planning/ urban regeneration ice | proceedings ICE Publishing: All rights reserved 115
Transcript of Bouncing back or bouncing forward? Simulating urban resiliencepluto.huji.ac.il/~msdfels/pdf/Bouncing...

Bouncing back or bouncing forward?Simulating urban resilience
&1 A. Yair GrinbergerDepartment of Geography, Hebrew University of Jerusalem, Israel
&2 Daniel Felsenstein PhDDepartment of Geography, Hebrew University of Jerusalem, Israel
1 2
While the direct physical effects of an urban catastrophe are relatively straightforward to assess, indirect and long-
term impact on the urban system is more circumspect. A large-scale shock such as an earthquake derails the complex
urban system from its equilibrium path onto an unknown trajectory. Consequently, assessing the effect of policy
intervention that aims to mitigate this shock and increase urban resilience is fraught with complexity. This paper
presents the implementation of dynamic agent-based simulation to test long-run effects of a hypothetical earthquake
in Jerusalem, Israel. It focuses on investigating the effectiveness of policy choices aimed at restoring the urban
equilibrium. Cities are found to have a self-organising market-based mechanism that strives to attain a new
equilibrium. They therefore may not always bounce back – they may also bounce forward. Decision-makers,
engineers, emergency and urban planners need to be cognizant of this tendency when designing policy interventions.
Otherwise, well-intentioned efforts may inhibit urban rejuvenation and delay the onset of city recovery.
1. Introduction: understanding resilienceOver the past few decades cities have been subjected to ever-
increasing disastrous events resulting in casualties and extensive
property damage (Wamsler, 2004). As city populations and
densities continue to rise, it is reasonable to assume that the trend
of increasing damage from such events will intensify (Quarantelli,
1996; UNISDR, 2012). Given the magnitude of the potential
catastrophes and also the expanding availability of data, tools
and knowledge, increasing multidisciplinary effort is being
focused on mediating the hazards facing cities and bolstering
their resilience (Zolli and Healy, 2012). Much of this interest tends
to focus on restoring urban conditions and rejuvenating city life.
For engineers, the ability of the city to continue to restore critical
services and maintain community capital in the aftermath of a
catastrophic event, is a cornerstone of resilience. However, the
issue of exactly what level of rejuvenation and for what purpose is
often left vague. There is a general acceptance of a direct and
linear cause and effect relationship in that a larger shock
necessitates a larger effort to achieve restoration, and that time
to recovery is somewhat proportionate to the magnitude of the
disturbance (Chang and Rose, 2012).
This paper shows in the context of the long-term urban effects
of an earthquake that such direct relationships are hard to
justify. Efforts at promoting city resilience do not necessarily
produce such causal outcomes. The reading of ‘resilience’
follows that common in ecology and engineering (Adger, 2000;
Holling, 1996) and denotes the ability of a system (natural or
constructed) to recover from a shock. While consciously
focused on the notion of equilibrium urban growth, engineers
recognise that the outcome of an unanticipated event is not
predetermined, as multiple unstable equilbria may exist. Thus,
a small and perhaps inocuous perturbation can tip the system
from one equilibrium state to another. While shocks are
invariably exogenous there is no knowing a priori which one is
going to tilt the city or region onto a new growth path.
It has also been noted that nuanced but important differences
exist as to whether this recovery is to a previous state, thereby
assuming a single stable equilibrium (bouncing back) or whether
the system post-shock has various trajectories for recovery and
multiple potential equilibria (bouncing forward). ‘Bouncing
back’ denotes the traditional occupation with regaining pre-
disaster conditions (Chang, 2010). An urban disaster derails city
development and it bounces back to a new growth path. In this
case the counterfactual or city-growth-without-disaster state is
not known. Furthermore, it is not known whether the current
bounce-back is a permanent long-term adjustment. ‘Bouncing
Urban Design and PlanningVolume 167 Issue DP3
Bouncing back or bouncing forward?Simulating urban resilienceGrinberger and Felsenstein
Proceedings of the Institution of Civil Engineers
Urban Design and Planning 167 June 2014 Issue DP3
Pages 115–124 http://dx.doi.org/10.1680/udap.13.00021
Paper 1300021
Received 01/07/2013 Accepted 02/02/2014
Keywords: disaster engineering/town and city planning/
urban regeneration
ice | proceedings ICE Publishing: All rights reserved
115

forward’ observes how much disturbance the urban system can
endure before it changes its structure. A key feature of post-
disaster recovery is ‘time compression’ (Olshansky et al., 2012).
This expresses the knee-jerk reaction in the aftermath of an
unanticipated event. It is characterised by attempts to compress
rebuilding activities such as renewal of capital stock, rebuilding
of institutions, rejuvenating land use and commercial activity
over a short period of time and in a focused area. The
replacement of public housing with mixed affordability devel-
opments in post-Katrina New Orleans is a case in point
(Olshansky et al., 2012).
However, different urban processes rejuvenate at different speeds:
commercial activity can revive quickly while physical and social
rebuilding needs a much longer time frame. This implies multiple
and unstable urban equilibria and no linear causality between the
size of the shock and type of rejuvenation. It also suggests no
necessary congruence between the point of disaster and place of
recovery. In addition, it illustrates that disaster can (perversely)
offer opportunity for change and renewed growth. For example,
the devastation wrought by World War II bombing on cities in
Germany and Japan has been shown to have ‘bounced forward’
the economies of the devastated cities (Brakman et al., 2004;
Davis and Weinstein, 2002).
This equilibrium view of resilience has been challenged in the
context of urban recovery (Davoudi, 2012; Martin, 2012). The
first claim is that cities are not as mechanistic and predictable
as the equilibrium view purports. Second, recovery to a former
state may not be a desired goal for those urban areas whose
pre-disaster state was unattractive in the first place. Finally, the
equilibrium view ignores ‘the intentionality of human actions’
(Davoudi, 2012: p. 305) implying that human intervention
through regulation, planning and policy is effectively ignored.
Engineers acknowledge the existence of human intervention and
test its effects in the realm of policy. In this context, policies have
the potential to influence resilience. Specific policies may strive
to re-establish damaged infrastructure and services, to control
and direct flows, or initiate a change in the environment. A
shock can therefore be used as an opportunity to improve the
state of the city. Yet, cities are complex systems, which are not
easy to predict and understand, especially when thrown out of
balance by a disturbance. It is not surprising therefore that so
much policy implementation fails to achieve expected outcomes,
and sometimes even has the potential to exacerbate a disaster
situation (Chamlee-Wright and Rothschild, 2007; Williams,
2008). This paper directly addresses this issue. It presents the
results of a dynamic agent-based simulation that simulates an
earthquake in an urban area and the possible policy responses to
this shock. It highlights the direct and indirect effects of these
human interventions and assesses their role in making cities
more resilient.
The next section presents a non-technical overview of the
agent-based simulation framework that was employed and its
implementation in the real-world context of an earthquake
centered on downtown Jerusalem. It then presents the basic
indicators used to assess city resilience: time to recovery, land
use rejuvenation and central business district (CBD) shift. The
baseline conditions are simulated both with and without the
joint effect of three policy options relating to human actions
aimed at mediating the effect of the earthquake. These are tight
land-use regulation, public provision of shelter for displaced
citizens and the restoration of damaged public services. The
outcomes of the policy interventions are highlighted and their
implications for city resilience are discussed.
2. MethodologyAgent-based simulation decomposes the complexities of the urban
system into the operation of ‘agents’. These can be both individual
entities such as citizens or aggregate institutions such as markets.
In this context the key agents are households, workers, firms and
local policy-makers. Each of these operates according to certain
(programmable) behavioural rules, and in so doing affects the
behaviour of other individual agents and in the aggregate the
operation of urban institutions such as land and housing markets
and the planning system. The urban system is particularly
inflexible. This is because its morphology, which has accrued
cumulatively over time, does not respond rapidly to change and
because planned physical change is essentially a highly time-
dependent process with a long gestation lag. Furthermore, given
the interconnectedness of agents, a shock to this system
transferred through the aggregate behaviour of agents may have
random spatial impacts. Given these temporal and spatial
complexities, decision-makers have difficulty in fully comprehend-
ing the complexity of unanticipated events in urban areas.
Agent-based simulation is one way of demystifying this
process. Figure 1 graphically outlines the components of the
agent-based system serving this paper. This figure describes
the different interdependencies between citizen agents and the
urban environment. Exogenous and endogenous inputs (such
as income level and migration probabilities) are used to
characterise the decision process of the agents. This is also
based on the conditions prevailing in the external environment
and in turn affects this environment. The direct effects of both
the shock and policy decisions are highlighted and point to the
possible feedback responses as the direct effect of the shock
begins to ripple through the system. A key characteristic of
agent-based simulations is their reliance on simple behavioural
rules. These dictate the simplified specification of agent–
environment interactions outlined in Figure 1.
2.1 Simulating the urban environment
The basic agent is the individual citizen, who under the
constraints of the environment and individual attributes,
Urban Design and PlanningVolume 167 Issue DP3
Bouncing back or bouncingforward? Simulating urbanresilienceGrinberger and Felsenstein
116

strives for a ‘normal’ existence; that is, an existence that
satisfies certain predefined, behavioural objectives. These
include maximising utility in terms of residence and participat-
ing in activities such as work, leisure, commercial and other
social activities. Land use, which is represented by individual
buildings, acts as a quasi-agent. While not mobile or able to act
autonomously, it still reacts to actions of other agents, thereby
changing the urban system. A shock to the system (such as an
earthquake) and policy decisions to deal with this shock are
exogenous (see Figure 1). While the spatial scale of the
simulation can vary according to the needs of the task at
hand, the temporal scale of the simulation is set to one
iteration (i.e. the equivalent of 1 day). The simulation tool runs
on the Repast Simphony platform, which is a popular Java-
based development environment for agent-based simulations
(Crooks and Castle, 2012).
2.2 Citizen agents
Figure 1 illustrates that agent behaviour consists of two kinds
of decision-making – residential decisions and activity
participation decisions. This paper attempts to make these
as realistic as possible. Residence decisions are the first
process undertaken each iteration (day). The citizen can
decide to leave the current place of residence in favour of a
location outside the city, or choose a different location within
the city. These decisions are probabilistic and are based on the
existing intra-urban movements and relocation probabilities
at the neighbourhood scale. Out-migration rates are derived
from the citywide out-migration/total population ratio. The
choice of new building of residence is dependent on the
availability of housing space and utility-maximising behaviour
– the willingness to allocate one third of household income
(derived from the average income in a spatial unit) to housing.
The price of residential buildings is generated using a dynamic
pricing system, in which the monthly cost of an apartment is
derived from the value of the individual building in which it is
located, which in turn is dependent on building floor space
and average housing price in its neighbourhood. The latter
changes with change in demand, supply and level of services.
If an agent is unsuccessful in relocating within the city, due to
lack of space or a high price/income ratio, it relocates outside
the city.
Once all residential decisions are made, agents who out-
migrate are removed from the simulation database, and the
others continue to the second phase of decision-making. This
relates to participation in activities. At each iteration, an agent
may participate in up to three different activities, all of them
located in one of the buildings in the study area with at least
one being non-residential. Activities are associated with types
of land use (residential or non-residential) and the choice of
activity location is also probabilistic in nature. Each building
has an attractiveness index based on its distance from the
agent, the nature of its environment (the percentage of non-
occupied buildings in its surrounding area) and its floor space
size (for non-residential uses only). If the attractiveness index
exceeds a random value assigned to the agent (representing
agent preference), then the building is visited. Agents sequence
their activities and move between them on the road network,
using a non-optimising, aerial distance-based route selection
criteria. This results in satisficing behaviour (Simon, 1952) and
reduces computing loads with respect to the alternative (i.e.
optimisation). Agent behaviour also represents two further
behavioural assumptions. The first is risk aversion, which is
expressed in the tendency to avoid non-occupied buildings and
shock-affected areas. The second relates to a preference for
agglomeration, which is represented by a higher propensity to
visit land uses that have greater floor space area.
2.3 Urban dynamics
Changes in land use are effected as follows: as commercial
land-use is dependent on consumer flows and residential use on
the presence of citizens, a deficit or surplus of agents may lead
buildings to change their land use or to become unoccupied.
The only use that is considered to be stable and insensitive to
change is public use. The freedom of a building to switch land
uses can be controlled by the user.
Four land-use change dynamics are considered: residential to
commercial; commercial to unoccupied; residential to unoccu-
pied; unoccupied to residential. The first two are dependent on
consumer flows, represented by the volume of traffic (citizen
Citizen agents
Riskevasiveness
Activitylocation
decisions
Availablehousing space
New citizenagents
Intra urbanmovementprobabilities
In-migrationratio
Movementroutes
Urbanmorphology
CBD location
MSatisficingbehaviour
Residentiallocation
decisions
Housing stock
g
g
ons
Housing prices
Income level
Exogenous inputsAgentsBehavioural process
Shock (earthquake) effectsPolicy effects
Environmental attributes
Commercialstock
ttial
Relocationprobabilities
N
City average income
Non-residential
clusters Nature of
environment
Figure 1. Agent-based conceptualisation of urban life. CBD,
central business district
Urban Design and PlanningVolume 167 Issue DP3
Bouncing back or bouncingforward? Simulating urbanresilienceGrinberger and Felsenstein
117

agents per day) on the road nearest to the location. This
implies that revenue is proportionate to the number of visits,
which is proportionate to nearby traffic volume. The traffic
volume needed to sustain a commercial use is commensurate
with floor space, so that larger buildings need to be near higher
traffic loads. If the traffic volume does not satisfy this
condition the building sheds its original use and is eligible for
new uses. High traffic volumes may induce a change towards
commercial use, again in proportion to floor space and nearby
traffic volume. Citizens of buildings that become commercial
make the choice between relocating and migrating. The third
and fourth dynamics (residential to unoccupied and vice versa)
are dependent on the number of residents within a building –
citizen agents may decide to move into an unoccupied building
thereby changing its land use, or may leave a residential
building, to the extent that it becomes abandoned.
Agents can also affect urban dynamics through the creation of
available housing, which induces in-migration. The city starts
initially as fully occupied and the volume of in-migration is
dependent on changes in residential stock, as housing space
becomes available. The volume of in-migration is proportional
to the amount of available housing spaces, through the in-
migration/total population ratio, but some variance is allowed
in order to facilitate changes in migration trends. Each
potential citizen is added to the database only if they succeed
in locating suitable available housing (where the monthly price
is lower than a third of the agents’ randomly generated, city
average income).
2.4 Exogenous inputs to urban dynamics
Two key exogenous factors influence urban dynamics (Figure 1).
The first is the single urban shock (i.e. the earthquake), which
occurs on the fifth iteration of the simulation and is located
randomly in space. The effect of the shock spreads outwards
from the epicentre and decays exponentially. A resilience index is
calculated for each building, in relation to its distance from the
epicentre and its height. If a random number that is assigned to
the building exceeds its resilience index, the building collapses. Its
land use is annulled, residents lose their home and the nearest
road becomes blocked for as long as the building remains in
ruins. The duration of re-establishment is dependent on floor
space size. Thus, although the earthquake is a one-time, static
event, it directly impacts the land-use system and citizen
behaviour.
Three exogenous policy options are also considered. These are
all of a binary yes/no nature and relate to land-use regulation,
sheltering policy and service replacement.
& Land-use regulation policy: defines the freedom with which
land use may change. In the absence of regulation, land-
use changes are freely driven by the market. With
regulation, no land-use change is allowed (with the
exception of abandonment) and all rejuvenating land use
simply replaces previous land use.
& Sheltering policy: in the absence of policy, citizens who lose
their homes have an equal chance of migrating or
relocating. In the presence of policy, they are concentrated
in public buildings where they remain until their home is
rebuilt. They can decide to relocate/migrate before this
happens or may be displaced from their homes and will thus
relocate/migrate.
& Service replacement policy: this is aimed at maintaining
public services in the aftermath of the earthquake. When
exercised, a similar sized commercial building replaces
each public building that becomes damaged and remains
as such until the original building is restored. In the
absence of policy the level of services in the city decreases
considerably.
The policies serve as a heuristic tool for testing the extent of
urban resilience in the baseline (no-policy) case. They span the
gamut of possible public intervention ranging from status quo
to heavy-handed regulation. On this basis, it can be discerned
whether resilience is expressed as bouncing back or bouncing
forward. In principle, other more subtle policies could be
articulated. However, the aim of this simulation exercise is
demonstrative not exhaustive.
2.5 Case study: earthquake in Jerusalem
The simulation tool described above is demonstrated in
respect to an earthquake in downtown Jerusalem (Figure 2).
The city of Jerusalem, located 30 km southeast of the active
Dead Sea fault line, has witnessed several major earthquakes,
the last of which occurred in 1927. Although the centre of the
Land use
500 250 0 500 mResidentialCommercialPublic
Figure 2. Study area. CBD, central business district
Urban Design and PlanningVolume 167 Issue DP3
Bouncing back or bouncingforward? Simulating urbanresilienceGrinberger and Felsenstein
118
city lies in a relatively stable area, thereby reducing natural
hazard, the fact that many of the buildings within it were
constructed before anti-seismic codes were established makes
it prone to earthquake-related damage (Salamon et al., 2010).
This is a unique mixed land-use area covering 1?45 km2 and
characterised by low-rise buildings punctuated by high-rise
structures. The area encompasses two major commercial
spaces: the Mahaneh Yehuda enclosed street market and the
city CBD. Three major transportation artery roads traverse
the area with Agripas and Jaffa Streets (light railway route)
running north–west to the south east, and King George Street
running north–south. The area exhibits a heterogeneous mix
of residential, commercial governmental and public land use
and high traffic volumes.
Geographical information system (GIS) shapefiles are the basic
input for the simulation and include disaggregate data for each
building (i.e. floor space, land use, height). In order to assign
agents and their socioeconomic attributes to buildings and
obtain a spatially accurate representation of their distribution,
statistical area (SA) data were disaggregated for population,
income and household size to a per square metre base. (An SA is
the finest level of spatial resolution for which census data are
made available by the Israel Central Bureau of Statistics. It is a
small homogenous unit containing approximately 3000 inhabi-
tants.) The case study area comprises 19 SAs. Socioeconomic
characteristics were then reassigned to the buildings based on
their proportional floor sizes within the SA (see Lichter and
Felsenstein (2012) for a detailed description of the method). The
variables reassigned using this method are listed in Table 1.
Two scenarios were simulated: a no-intervention scenario
(policy variables set to ‘false’) and a full intervention scenario
(variables set to ‘true’). The no-policy scenario generated the
baseline conditions against which policy interventions were
assessed. As the simulation requires intense computing
resources, each scenario was simulated only 35 times, with
each run consisting of 1000 iterations (1000 d). This rather
arbitrary number of simulations was selected in order to
balance computing requirements with the convergence of the
results. For each run, the earthquake occurs randomly in space
at day 5 in order to characterise effects that are not location
dependent. The 5-d period was chosen in order to let non-
earthquake-related urban mechanisms to reach full activity
when the earthquake occurs. The results below relate to the
averages for each scenario.
3. Results
As noted above, citizens are the main force driving urban
dynamics in the model by moving, populating and affecting
land uses. Accordingly, the sole purpose of a sheltering policy
is to maintain original population levels in order to mitigate the
loss of economic activity and to help residential stock to
recover quickly. The first measure tested relates to change in
total population size (Figure 3). Implementing policy inter-
vention allows the city to return to close to pre-shock levels
within a year but the no-policy simulation presents very similar
outcomes and a return to a slightly higher equilibrium level.
Over the long run, the two scenarios converge towards a trend
of population decline, probably driven by the slow recovery
rate of the residential stock and the concomitant rise in house
prices that this generates.
Gross patterns of population change in the city do not,
however, offer many insights into spatial change at the micro
level and the way incremental actions by agents can lead to
structural urban change. The effects of such change can be seen
in Figures 4 and 5 and Table 2. Except for a few vulnerable
large non-residential units, policy implementation stabilises the
land-use system by regulating change and aiding the popula-
tion. In contrast, the no-policy scenario presents a picture of a
much more vulnerable commercial stock and an unstable
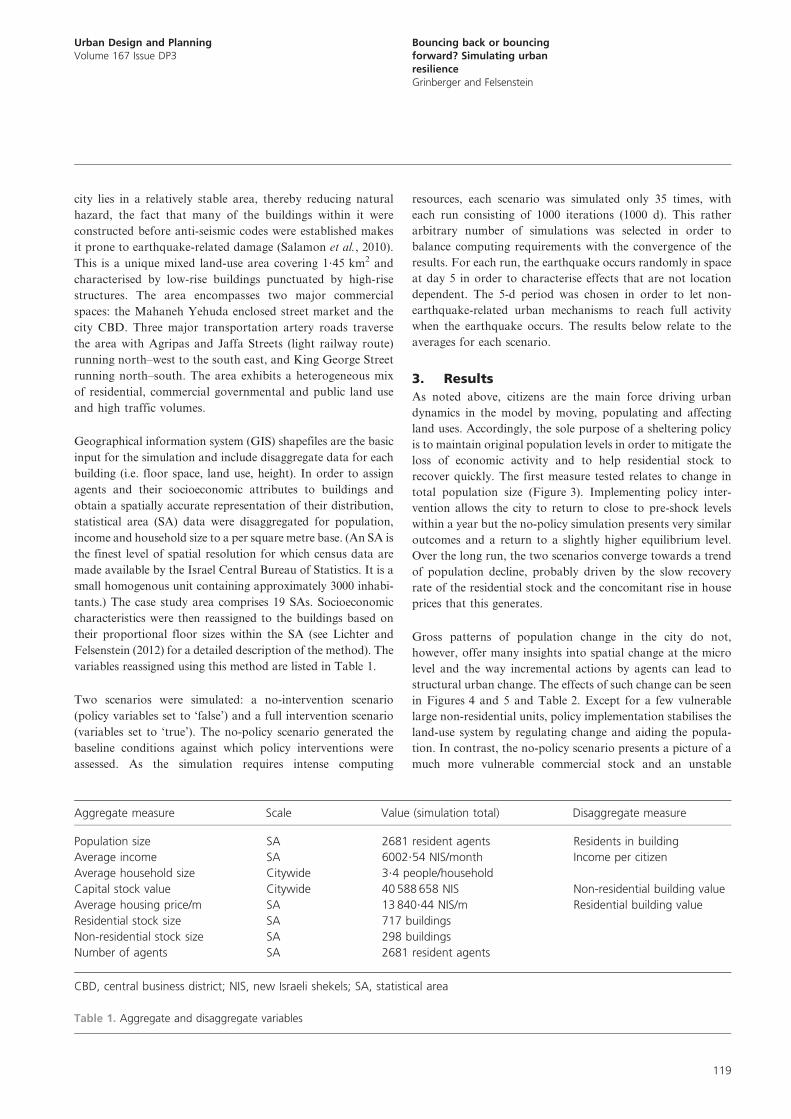
Aggregate measure Scale Value (simulation total) Disaggregate measure
Population size SA 2681 resident agents Residents in building
Average income SA 6002?54 NIS/month Income per citizen
Average household size Citywide 3?4 people/household
Capital stock value Citywide 40 588 658 NIS Non-residential building value
Average housing price/m SA 13 840?44 NIS/m Residential building value
Residential stock size SA 717 buildings
Non-residential stock size SA 298 buildings
Number of agents SA 2681 resident agents
CBD, central business district; NIS, new Israeli shekels; SA, statistical area
Table 1. Aggregate and disaggregate variables
Urban Design and PlanningVolume 167 Issue DP3
Bouncing back or bouncingforward? Simulating urbanresilienceGrinberger and Felsenstein
119

residential stock more prone to high turnover rates, as reflected
in the high frequencies of building use change (Figure 4).
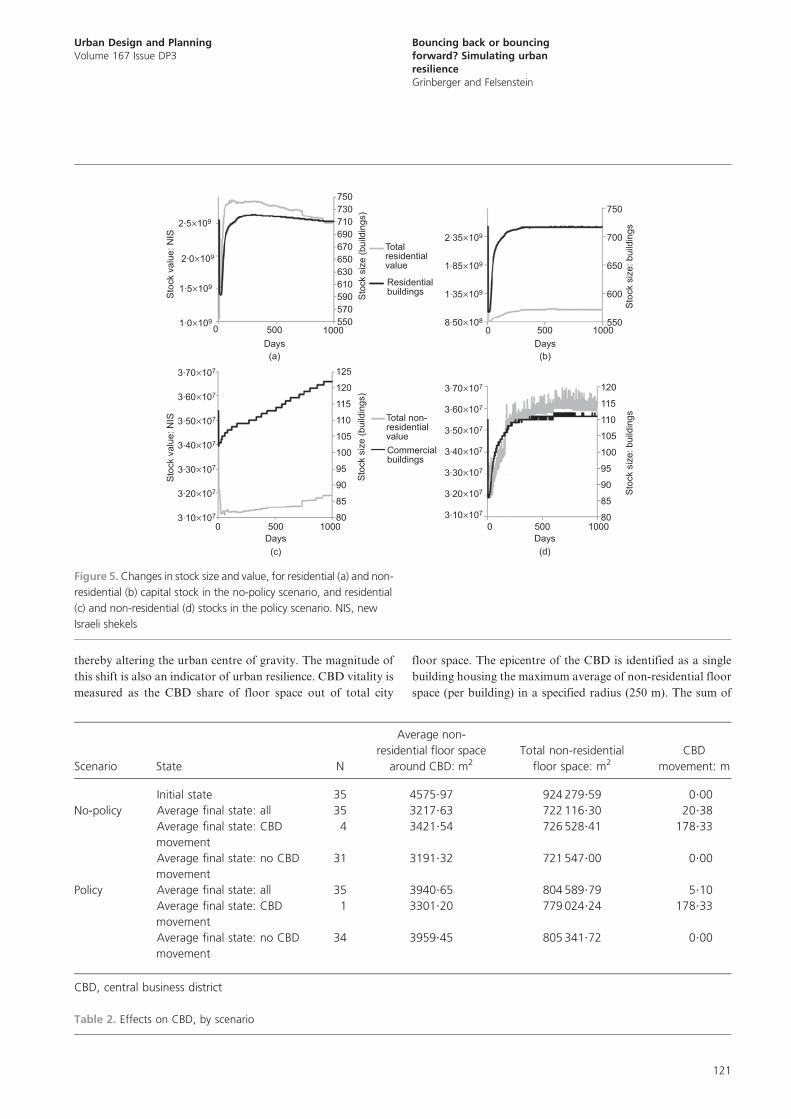
The difference between the scenarios is more profound than
mere destabilisation, as seen in changes to stock sizes and total
values (Figure 5). While the policy scenario presents high levels
of total non-residential stock value and low levels of residential
stock value due to the lack of demand and to lower levels of
services, the no-policy scenario presents an opposite picture,
with a slow increase in stock size accompanying the decrease in
non-residential values. Translated to average values, these
results point to a decrease in average non-residential values
and an increase in residential values in the no-policy scenario.
As floor space is one of the dominant elements in the
calculation of building value, this finding is tantamount to
stating that the average floor space size of non-residential
buildings decreases and the opposite occurs in residential
stock. This can be interpreted as evidence of the city bouncing
forward to a new equilibrium in which commercial uses with
abundant floor space cannot sustain themselves and become
residential, while smaller residential uses identify the opportu-
nity and switch to commercial use.
These changes reflect the change in the behaviour of individual
agents. Change in commercial and housing stock is driven by
the changing nature of traffic volumes. Agents who react to the
shock change their travel patterns, thereby changing traffic
volumes around the city and consequently affecting the ability
of large commercial uses to sustain themselves. This leads to a
new pattern of land use in the process of economic rejuvena-
tion: in the aftermath of an earthquake small-scale convenience
stores replace large commercial structures (malls) and apart-
ment buildings replace family homes in the residential sector.
Anecdotal empirical evidence of this tendency can be found in
newspaper and internet media reports describing the aftermath
of missile attacks on cities in southern Israel in 2012. See for
example: ‘Empty malls as consumers shop close to home’,
www.ynet.co.il, 18 November 2012.
A further issue relates not just to the form and pattern of land-
use rejuvenation but whether an earthquake can affect urban
function. A key indicator here is whether the magnitude of a
shock causes shifts in the function and location of the CBD,
2650
2600
2550
2500
2450
2400
2350
2300
2250
2200
2700
800600Days
Pop
ulat
ion
size
No-policy
Policy
4002000 1000
Figure 3. Change in population size, by time and scenario
(a) (b)
Figure 4. Frequency of change in land use for (a) no-policy scenario
and (b) policy scenario. Height represents the number of simulation
runs for each building in which the final land use was different
from the initial one. Colour represents initial use: residential (light
grey) and non-residential (dark grey)
Urban Design and PlanningVolume 167 Issue DP3
Bouncing back or bouncingforward? Simulating urbanresilienceGrinberger and Felsenstein
120
thereby altering the urban centre of gravity. The magnitude of
this shift is also an indicator of urban resilience. CBD vitality is
measured as the CBD share of floor space out of total city
floor space. The epicentre of the CBD is identified as a single
building housing the maximum average of non-residential floor
space (per building) in a specified radius (250 m). The sum of
2.5×10⁹
3.60×10⁷
3.50×10⁷
3.40×10⁷
3.30×10⁷
3.20×10⁷
3.70×10⁷
3.10×10⁷
3.60×10⁷
3.50×10⁷
3.40×10⁷
3.30×10⁷
3.20×10⁷
3.70×10⁷
3.10×10⁷
2.35×10⁹
1.85×10⁹
1.35×10⁹
8.50×10⁸
2.0×10⁹
1.5×10⁹
1.0×10⁹
Sto
ck v
alue
: NIS
Sto
ck v
alue
: NIS
Sto
ck s
ize
(bui
ldin
gs)
Sto
ck s
ize
(bui
ldin
gs)
Sto
ck s
ize:
bui
ldin
gsS
tock
siz
e: b
uild
ings
0 1000500 0 1000500Days(a) (b)
Days(c)
Days(d)
Days
0 1000500 0 1000500
730710
Totalresidentialvalue
Residentialbuildings
Total non-residentialvalueCommercialbuildings
690670650630610590570
750
120
115
110
105
100
95
90
85
125
80
120
115
110
105
100
95
90
85
80
750
700
650
600
550550
Figure 5. Changes in stock size and value, for residential (a) and non-
residential (b) capital stock in the no-policy scenario, and residential
(c) and non-residential (d) stocks in the policy scenario. NIS, new
Israeli shekels
Scenario State N
Average non-
residential floor space
around CBD: m2
Total non-residential
floor space: m2
CBD
movement: m
Initial state 35 4575?97 924 279?59 0?00
No-policy Average final state: all 35 3217?63 722 116?30 20?38
Average final state: CBD
movement
4 3421?54 726 528?41 178?33
Average final state: no CBD
movement
31 3191?32 721 547?00 0?00
Policy Average final state: all 35 3940?65 804 589?79 5?10
Average final state: CBD
movement
1 3301?20 779 024?24 178?33
Average final state: no CBD
movement
34 3959?45 805 341?72 0?00
CBD, central business district
Table 2. Effects on CBD, by scenario
Urban Design and PlanningVolume 167 Issue DP3
Bouncing back or bouncingforward? Simulating urbanresilienceGrinberger and Felsenstein
121

the non-residential floor space in a radius of 250 m around the
epicentre (FS(b)) is taken to denote CBD floor space.
FS bð Þ~
Pn
i~1
FS ið Þ
n
FS(b) is the average amount of non-residential floor space in a
distance of 250 m from building b, FS(i) is the non-residential
floor space of building i, n is the number of buildings in a
distance of 250 m from building b. A change in the identity of
the building representing the CBD epicentre is indicative of the
dispersal of commercial activity and a shift in the urban centre
of gravity. Table 2 shows that while the urban system may
reach a new state, such a change is rare and the basic
functionality of the CBD is not easily shifted (maximum
shifting of 20 m on average). CBD movement may be induced
by an overall loss of commercial activity through migration of
economic functions. The average floor space size measure
shows that in the absence of policy there is rising average size
around the CBD, while in the policy case a decrease is
witnessed in average size around the CBD. Therefore, only in
the no-policy scenario is there evidence of a significant shift in
the urban centre of gravity.
Finally, the paper attempts to test the nature of urban
resilience. Does the city bounce back to a previous single state
equilibrium or does it bounce forward to one of multiple
potential equilibria? Evidence presented so far shows ambig-
uous trends, but these results only present a snapshot of a final
state and do not tell the story in relation to stability and
permanency of change. To investigate this issue various
indicators of equilibrium are presented (Table 3). These
estimate the ability to bounce back by returning to pre-shock
values, and to bounce forward by attaining a new equilibrium.
This is defined as preserving the same level of value for at least
the last 50 simulated days.
These measures are presented in Table 3. They show the greatest
divergence across the two scenarios and may represent the most
significant findings. The role of policy as conceived here is to
‘force’ the city back to its pre-shock state. In other words,
policies are designed to induce bouncing back. Success in this
instance is indicated by the speed and frequency with which pre-
shock values are restored. However, the equilibrium measures in
Table 3 suggest that this recovery is not stable at all. With the
exception of population size, equilibrium is rarely reached, with
the highest frequency being nine of 35 times (25?7%) in the case
of the effect of policy on average residential values. Even when it
is attained, it appears much later than the return to previous
values, with the minimum time lag being 670 d. The no-policy
scenario presents an opposite picture. While bouncing back isSce
nario
No-p
olic
yPolic
y
Measu
re
No.
of
tim
es
pre
vious
valu
es
rest
ore
d
Ave
rage
dura
tion
to
rest
ore
valu
es
No.of
tim
es
new
equili
brium
reach
ed
Ave
rage
dura
tion
tonew
equili
brium
No.
of
tim
es
pre
vious
valu
es
rest
ore
d
Ave
rage
dura
tion
to
rest
ore
valu
e
No.of
tim
es
new
equili
brium
reach
ed
Ave
rage
dura
tion
tonew
equili
brium
Tota
lpopula
tion
valu
e0/3
5—
35/3
5858
0/3
5—
35/3
5860
Tota
lre
sidentialva
lue
0/3
5—
20/3
5835
33/3
5246
8/3
5916
Ave
rage
resi
dentialva
lue
0/3
5—
22/3
5843
33/3
554
9/3
5918
Tota
lnon-r
esi
dentialva
lue
1/3
512
35/3
5324
31/3
5122
2/3
5937
Ave
rage
non-r
esi
dentialva
lue
22/3
5145
32/3
5819
24/3
540
1/3
5940
Tab
le3.
Equili
brium
measu
res,
by
scenario
Urban Design and PlanningVolume 167 Issue DP3
Bouncing back or bouncingforward? Simulating urbanresilienceGrinberger and Felsenstein
122

rarely achieved, with three measures reaching equilibrium one
time or less, stabilisation by bouncing forward is much more
frequently attained and requires a shorter span of time with a
minimal frequency of 20 times (57?1%).
These findings suggest that the city has an inherent market-
based tendency to bounce forward to a new state. Well-
intentioned policies aimed at changing this trajectory and
restoring pre-shock conditions may ironically serve to inhibit
urban resilience. The policy message from these results is that
the one-size-fits-all policy prescription may not be suitable.
Trying to force the city into some preferred recovery pattern
may just retard the rejuvenation process. Policy implementa-
tion should try and avoid ready-made handbook solutions, and
should rather focus on the specifics of the city, the nature of the
shock and the likely growth trajectories derived from these.
4. ConclusionsTargeting policy is difficult to achieve at the best of times
(Hansen, 1989). The situation is all the more complex when
policy is harnessed to redirect an urban development
trajectory in the aftermath of a disaster. Complex spatial
dependencies between agents and markets mean that the
effects of focused intervention may not end up where
intended, and may even unintentionally generate a second
round of ‘recovery disaster’ (Tierney, 2008). However, this
does not mean that policy intervention should be eschewed.
This paper presents a subtle message to the effect that cities
are not helpless entities in the wake of a catastrophe. The
results of the simulations, relating to impacts on the CBD,
land-use and stock value changes, and the stability of different
equilibria, suggest that cities harbour an inherent self-
organising mechanism that presupposes an ability for self-
recovery and promoting resilience. This mechanism does not
necessarily direct the city back to its pre-shock state. As
demonstrated above, a shock can result in bouncing forward
to a new, commercially dispersed equilibrium.
In terms of urban planning and management praxis the
implications are clear. Just as ‘bouncing back’ may not be the
best recovery path for the city, ‘bouncing forward’ may also
not offer an optimal strategy. Policy-makers and planners need
to be able to assess potential bounce forward trajectories and
to harness the self-organising mechanism that facilitates
recovery. Policy decisions, therefore, should not be purely
reactive to immediate needs. Intervention needs to be carefully
and idiosyncratically crafted. In this respect, making cities
more resilient is the thoughtful process of understanding urban
dynamics and designing a tailor-made recovery process.
AcknowledgementThis research is based on work done in the Desurbs (Designing
Safer Urban Spaces) research project funded by the European
Commission Seventh Framework Programme 2007–2013
under Grant Agreement No. 261652.
REFERENCES
Adger WN (2000) Social and ecological resilience: are they
related? Progress in Human Geography 24(3): 247–364.
Brakman S, Garretsen H and Schramm M (2004) The strategic
bombing of German cities during World War II and its
impact on city growth. Journal of Economic Geography
4(2): 201–218.
Chamlee-Wright E and Rothschild D (2007) Disastrous
Uncertainty: How Government Disaster Policy Undermines
Community Rebound. Mercatus Policy Series, Policy
Comment no. 9, Mercatus Center, George Mason
University, VA, USA.
Chang SE (2010) Urban disaster recovery: a measurement
framework and its application to the 1995 Kobe
earthquake. Disasters 34(2): 303–327.
Chang SE and Rose AZ (2012) Towards a theory of economic
recovery from a disaster. International Journal of Mass
Emergencies and Disasters 32(2): 171–181.
Crooks AT and Castle CJ (2012) The integration of agent-based
modeling and geographical information for geospatial
simulation. In Agent-Based Models of Geographical
Systems (Heppenstall AJ, Crooks AT, See LM and
Batty M (eds)). Springer, The Netherlands, pp. 219–251.
Davis DR and Weinstein DE (2002) Bones, bombs and break
points: the geography of economic activity. American
Economic Review 92(5): 1269–1289.
Davoudi S (2012) Resilience: a bridging concept or a dead end?
Planning Theory & Practice 13(2): 299–307.
Hansen SB (1989) Targeting in economic development:
comparative state perspectives. Publius 19(2): 47–62.
Holling CS (1996) Engineering resilience versus ecological
resilience. In Engineering Within Ecological Constraints
(Schulze PC (ed.)). National Academy Press, Washington,
DC, USA, pp. 31–44.
Lichter M and Felsenstein D (2012) Assessing the costs of sea level
rise and extreme flooding at the local level: a GIS-based
approach. Ocean & Coastal Management 59: 47–62.
Martin R (2012) Regional economic resilience, hysteresis and
recessionary shocks. Journal of Economic Geography 12(1):
1–32.
Olshansky RB, Hopkins LD and Johnson L (2012) Disaster and
recovery: processes compressed in time. Natural Hazards
Review 13(3): 173–178.
Quarantelli EL (1996) The future is not the past repeated:
projecting disasters in the 21st century from current trends.
Journal of Contingencies and Crisis Management 4(4): 228–
240.
Salamon A, Katz O and Crouvi O (2010) Zones of required
investigation for earthquake-related hazards in Jerusalem.
Natural Hazards 53(2): 375–406.
Urban Design and PlanningVolume 167 Issue DP3
Bouncing back or bouncingforward? Simulating urbanresilienceGrinberger and Felsenstein
123

Simon H (1952) A behavioral model of rational choice.
Quarterly Journal of Economics 69(1): 99–118.
Tierney K (2008) Hurricane in New Orleans? Who knew?
Anticipating Katrina and its devastation. Sociological
Inquiry 78(2): 179–183.
UNISDR (United Nations International Strategy for Disaster
Reduction) (2012) How to Make Cities More Resilient – A
Handbook for Local Government Leaders. UNISDR,
Geneva, Switzerland.
Vale LJ and Campanella TJ (2005) The Resilient City: How
Modern Cities Recover from Disaster. Oxford University
Press, New York, USA.
Wamsler C (2004) Managing urban risk: perceptions of housing
and planning as a tool for reducing disaster risk. Global
Built Environmental Review 4(2): 11–28.
Williams S (2008) Rethinking the nature of disaster: from failed
instruments of learning to a post-social understanding.
Social Forces 87(2): 1115–1138.
Zolli A and Healy AM (2012) Resilience: Why Things Bounce
Back. Free Press, NY, USA.
WHAT DO YOU THINK?
To discuss this paper, please email up to 500 words to the
editor at [email protected]. Your contribution will be
forwarded to the author(s) for a reply and, if considered
appropriate by the editorial panel, will be published as
discussion in a future issue of the journal.
Proceedings journals rely entirely on contributions sent in
by civil engineering professionals, academics and stu-
dents. Papers should be 2000–5000 words long (briefing
papers should be 1000–2000 words long), with adequate
illustrations and references. You can submit your paper
online via www.icevirtuallibrary.com/content/journals,
where you will also find detailed author guidelines.
Urban Design and PlanningVolume 167 Issue DP3
Bouncing back or bouncingforward? Simulating urbanresilienceGrinberger and Felsenstein
124