NORTH AMERICA B2C E-COMMERCE MARKET 2017 - … · NORTH AMERICA B2C E-COMMERCE MARKET 2017 ......
14
NORTH AMERICA B2C E-COMMERCE MARKET 2017 PUBLICATION DATE: DECEMBER 2017 PAGE 2 GENERAL INFORMATION I PAGE 3 KEY FINDINGS I PAGE 4-6 TABLE OF CONTENTS I PAGE 7 REPORT-SPECIFIC SAMPLE CHARTS I PAGE 8 METHODOLOGY I PAGE 9 RELATED REPORTS I PAGE 10 CLIENTS I PAGE 11-12 FREQUENTLY ASKED QUESTIONS PAGE 13 ORDER FORM I PAGE 14 TERMS AND CONDITIONS
-
Upload
dangnguyet -
Category
Documents
-
view
214 -
download
0
Transcript of NORTH AMERICA B2C E-COMMERCE MARKET 2017 - … · NORTH AMERICA B2C E-COMMERCE MARKET 2017 ......

NORTH AMERICA B2C E-COMMERCE MARKET 2017 PUBLICATION DATE: DECEMBER 2017
PAGE 2 GENERAL INFORMATION I PAGE 3 KEY FINDINGS I PAGE 4-6 TABLE OF CONTENTS I PAGE 7 REPORT-SPECIFIC SAMPLE
CHARTS I PAGE 8 METHODOLOGY I PAGE 9 RELATED REPORTS I PAGE 10 CLIENTS I PAGE 11-12 FREQUENTLY ASKED QUESTIONS
PAGE 13 ORDER FORM I PAGE 14 TERMS AND CONDITIONS

2
2
PRODUCT DETAILS Title:
Type of Product:
Category:
Covered Regions:
Covered Countries:
Language:
Formats:
Number of Charts:
North America B2C E-Commerce Market 2017
Report
B2C E-Commerce
North America
Canada, USA
English
PDF & PowerPoint
88
PRICES* Single User License:
Site License:
Global Site License:
€ 950 (exc. VAT)
€ 1,425 (exc. VAT)
€ 1,900 (exc. VAT)
We occasionally offer a discount on selected reports as newer reports are published.
Please see the most up-to-date pricing on our website www.ystats.com.
QUESTIONS
ANSWERED
IN THIS REPORT
What is the size and the growth projections for B2C E-Commerce sales in the USA and Canada?
Which important market trends affect the development of online retail in North America?
Who are leading market players in North American B2C E-Commerce?
Which product categories are purchased by U.S. and Canadian online shoppers the most?
What are the preferred payment and delivery options of North American online shoppers?
SECONDARY MARKET
RESEARCH
Our reports are exclusively based on secondary market research. Our researchers derive
information and data from a variety of reliable published sources and compile the data into
understandable and easy-to-use formats.
ADVANTAGES Maximum Objectivity
Reliable Sources
Up-To-Date Analysis
Boardroom-Ready PowerPoint Presentations
Guidance For Strategic Company Decisions
NORTH AMERICA B2C E-COMMERCE MARKET 2017

AS NORTH AMERICAN B2C E-COMMERCE CONTINUES TO ADVANCE,
RETAILERS TURN TO INNOVATION FOR GENERATING FUTURE GROWTH
B2C E-Commerce sales in North America are projected to maintain a compound annual
growth rate in the double-digits through 2021, according to market forecasts cited in this report
by yStats.com. Compared to other global regions, North America is projected to remain second
both in online retail market size and in E-Commerce’s share of total retail sales. The evolving
consumer behavior and new market trends, such as mobile commerce, web- and showrooming,
shopping via voice-enabled virtual assistants and chatbots, are expected to stimulate further
growth of B2C E-Commerce sales.
The USA accounts for the majority of North America’s online retail sales, being around 15
times larger than Canada in terms of B2C E-Commerce market size in 2017. Despite the
advancing maturity, E-Commerce revenues still outpace overall retail sales in the USA in year-on-
year growth rate, incentivizing traditional brick-and-mortar retailers to turn to digital channels for
sales expansion. Among them, Walmart targets a high double-digit increase in E-Commerce sales
for the next year following investments in marketplace and delivery offerings. With competition
increasing, established online market leaders also have to find new ways to attract digital
shoppers. For example, eBay launched a new search option where users can upload pictures
directly from their phone and search for similar items on the marketplace, while Amazon, the
leading competitor with a market share of around one-third, offers its Prime members the ability
to re-order items using voice command with virtual assistant Alexa. This service could help
Amazon’s market share grow still further, given that around one in two consumers who already
use voice-enabled assistance devices for shopping report fewer in-store purchases as a result,
according to a 2017 survey cited in yStats.com’s report.
Amazon is also leading the Canadian online retail market, which is less advanced
compared to the U.S. but is also growing at double-digit rates. Around one in two consumers in
Canada visit Amazon’s site at least on a monthly basis, and the conversion rate is significantly
higher than for Canadian retailers, according to survey results cited by yStats.com. Overall,
Canada’s B2C E-Commerce market is under the influence of imports from the USA, with more
than half of online shoppers making purchases cross-border. Nevertheless, E-Commerce sales of
Canadian retail incumbents are also rising, driven by increased investments into digital channels.
The shopping behavior of consumers in Canada also points to potential cross-channel synergies.
For example, around one-third of online shoppers frequently do their product research online
before making a purchase in-store, while a double-digit share at least occasionally browses
products in-store prior to buying them over the Internet.
NORTH AMERICA B2C E-COMMERCE MARKET 2017
3

MANAGEMENT SUMMARY
REGIONAL
Breakdown of Global B2C E-Commerce Sales by Region, in %, incl. North America, 2016 & 2021f
Global B2C E-Commerce Sales, in USD billion, B2C E-Commerce Share of Total Retail Sales, in %, and CAGR, in %, by
Region, incl. North America, 2011, 2016 & 2021f
Online Travel Sales in North America, in USD billion, and Year-on-Year Change, in %, 2016-2021f
Retail E-Commerce Sales, in USD billion, Year-on-Year Change, in %, and Share of Total Retail Sales, in %, by Canada
and the USA, 2016 - 2020f
Share of Consumers Shopping Online At Least Monthly, in % of Consumers, by Canada and the USA, 2016
Average Annual Online Spending per Shopper, in CAD, by Canada and USA, 2016
Overview of Aggregate Website Draw and Sales Conversion Rates for Leading Canadian Retail Websites and Leading
U.S. Retail Websites, by Selected Product Categories, 2016
Breakdown of Online Shoppers, by Domestic Shoppers Only, Domestic and Cross-Border Shoppers, and Cross-
Border Shoppers Only, in %, by Canada and the USA, October 2016
USA
3.1. OVERVIEW
B2C E-Commerce Market Overview, November 2017
3.2. TRENDS
Smartphone Penetration, in % of Adults, by Age Group and Total, November 2016
Mobile Shopper Penetration, in % of Online Shoppers Who Use Smartphone, Q1 2016 & Q1 2017
M-Commerce Sales, in USD billion, and Share of Total Retail E-Commerce Sales, in %, 2017f & 2021f
Product Categories Purchased via Smartphone, in % of Mobile Shoppers, October 2016
Preference for Apps and Mobile Websites When Performing Shopping-Related Activities via Smartphone, in % of
Mobile Shoppers, October 2016
Breakdown of Channels Preferred for Doing Most of Shopping for Non-Grocery Items, by Mobile, Online and In-
Store, in % of Consumers, by Age Group, March 2017
Breakdown of Search and Purchase Channels Used, in % of Online Shoppers, Q1 2017
Awareness and Usage of Emerging Technologies in Shopping, in % of Consumers, July 2017
Top Uses of Voice-Activated Virtual Assistance Devices, in % of Users, by Gender, April 2017
Perceived Influence of Voice-Activated Virtual Assistance Devices on Shopping Behavior, in % of Users, by Gender,
April 2017
Breakdown of Likelihood of Purchasing Products/Services from Brands Using a Chatbot, in % of Millennial Internet
Users, December 2016
Breakdown of Attitude to Cross-Border Online Shopping, in % of Online Shoppers in the USA, and Breakdown of
Time of the Last Cross-Border Purchase, in % of Cross-Border Online Shoppers, 2016 Product Categories Purchased in Cross-Border Online Shopping, in % of Cross-Border Online Shoppers in the USA,
October 2016
Breakdown of the Latest Cross-Border Online Purchase by Country, in % of Cross-Border Online Shoppers in the
USA, October 2016
2
NORTH AMERICA B2C E-COMMERCE MARKET 2017
TABLE OF CONTENTS (1 OF 3)
4
1
3

5
5
USA (CONT.)
3.3. SALES & SHARES
Total Retail Sales and E-Commerce Sales, in USD million, E-Commerce Share of Total Retail Sales, in %, and Change
from Same Quarter a Year Ago, in %, Q1 2014 - Q2 2017
B2C E-Commerce Sales Forecasts, in USD billion, and CAGR, in %, by Six Comparative Estimates, 2016 – 2021f & 2027f
B2C E-Commerce Share of Total Retail Sales, in %, by Five Comparative Estimates, 2016 – 2022f & 2027f
3.4. INTERNET USERS & ONLINE SHOPPERS
Internet Penetration, in % of Individuals, 2011 - 2016
Online Shopper Penetration, in % of Internet Users, 2016
Online and Mobile Shopper Penetration, in % of Internet Users, by Age Group, by Online and Mobile, October 2016
3.5. PRODUCTS
Breakdown of Retail E-Commerce Sales by Product Category, in %, 2017f
Retail E-Commerce Sales Growth Rate by Product Category, in %, 2016 - 2021f
Breakdown of Preference for Buying Selected Product Categories by Online and In-Store, in % of Consumers, March
2017
B2C E-Commerce’s Share of Total Retail Sales by Selected Product Categories, in %, 2011, 2016 & 2021f
Breakdown of Channels Used to Purchase Selected Product Categories, in % of Consumers, July 2017
3.6. PAYMENT
Payment Methods Perceived as Safest for In-Store and Online Purchases, in % of Consumers, 2016
Digital and Mobile Payment Methods Used, in % of Online Shoppers, by Generation Y and Generation Z, March 2017
3.7. DELIVERY
Breakdown of E-Commerce Parcel Delivery Market by Players, in % and in USD billion, 2016e
Top Reasons for Shopping Cart Abandonment, in % of Online Shoppers, Q4 2016
Top Reasons To Buy From Marketplaces Instead of a Retailer, incl. Shipping, in % of Online Shoppers, Q1 2017
3.8. PLAYERS
B2C E-Commerce Players Overview, November 2017
Amazon’s Market Share, in % of B2C E-Commerce Sales and Total Retail Sales, 2016
Top 10 Publicly Traded Companies by Retail E-Commerce Market Share*, in %, 2016 & 2017f
Number of Unique Monthly Visitors of Retail Sites of Amazon, Kroger, Target and Walmart, in millions, and
Intersection of Visitors, in %, October 2017
Breakdown of Frequency of Shopping on Amazon, in %, and Share of Primary Household Shoppers Who Are Amazon
Prime Members by Age Group, in %, March 2017
Breakdown of the Likelihood of Trying Amazon Go, in % of Consumers, by Gender, Age Group and Total, December
2016
Top 10 Online Retailers Ranked by Global E-Commerce Sales, in USD billion, 2016
3
NORTH AMERICA B2C E-COMMERCE MARKET 2017
TABLE OF CONTENTS (2 OF 3)

6
6
CANADA
4.1. OVERVIEW
B2C E-Commerce Market Overview, November 2017
4.2. TRENDS
Devices Used to Access the Internet, in % of Internet users, 2016 & 2017
Devices Used to Make Purchases Online, in % of Online Shoppers, 2016 & 2017
Product Categories Purchased via Mobile Devices, in % of Mobile Shoppers, October 2016
Breakdown of Frequency of Showrooming and Webrooming, in % of Online Shoppers, March 2017
Cross-Border Online Shopper Penetration, in % of Online Shoppers in Canada, March 2016
Top 3 Regions/Countries Purchased From, in % of Cross-Border Online Shoppers in Canada, March 2016
4.3. SALES & SHARES
Monthly Retail E-Commerce Sales Compared to Total Retail Sales and Sales of E-Commerce and Mail Order Houses,
in CAD million, Jan - Dec 2016 & Jan - Aug 2017
B2C E-Commerce Share of Monthly Total Retail Sales, in %, Jan - Dec 2016 & Jan - Aug 2017
Retail E-Commerce Sales, in CAD billion, and Share of Total Retail Sales, in %, 2015-2020f
4.4. INTERNET USERS & ONLINE SHOPPERS
Internet Penetration, in % of Individuals, 2011 - 2016
Online Shopper Penetration, in % of Internet Users, March 2017
Breakdown of the Number of Online Purchases Made per Year, in % of Online Shoppers, March 2016
4.5. PRODUCTS
Product Categories Purchased Online, in % of Online Shoppers, 2016 & 2017
Product Categories Purchased Online, in % of Online Shoppers, and Average Basket Spending per Category, in CAD,
March 2016
4.6. PAYMENT
Top 3 Payment Methods Preferred in E-Commerce, in % of Respondents, March 2017
Share of Internet Users Who Store Personal Credit Card Information with a Mobile App or E-Commerce Site, in %, by
Age Group, April 2017
4.7. DELIVERY
Delivery Methods Used in E-Commerce, by Selected Product Categories, in % of Online Shoppers, 2016
Share of Online Shoppers Who Received Free Shipping on Their Last Purchase, in %, 2016
4.8. PLAYERS
B2C E-Commerce Players Overview, November 2017
Top 20 Retailers by E-Commerce Sales, in CAD million, 2016
Overview of Website Draw and Sales Conversion Rates for Amazon.ca and Aggregate for Canadian Incumbents, by
Selected Product Categories, 2016
Top 10 Retail Sites by Unique Visitors, in millions, February 2017
NORTH AMERICA B2C E-COMMERCE MARKET 2017
TABLE OF CONTENTS (3 OF 3)
4

7
7
NORTH AMERICA B2C E-COMMERCE MARKET 2017
REPORT-SPECIFIC SAMPLE CHARTS
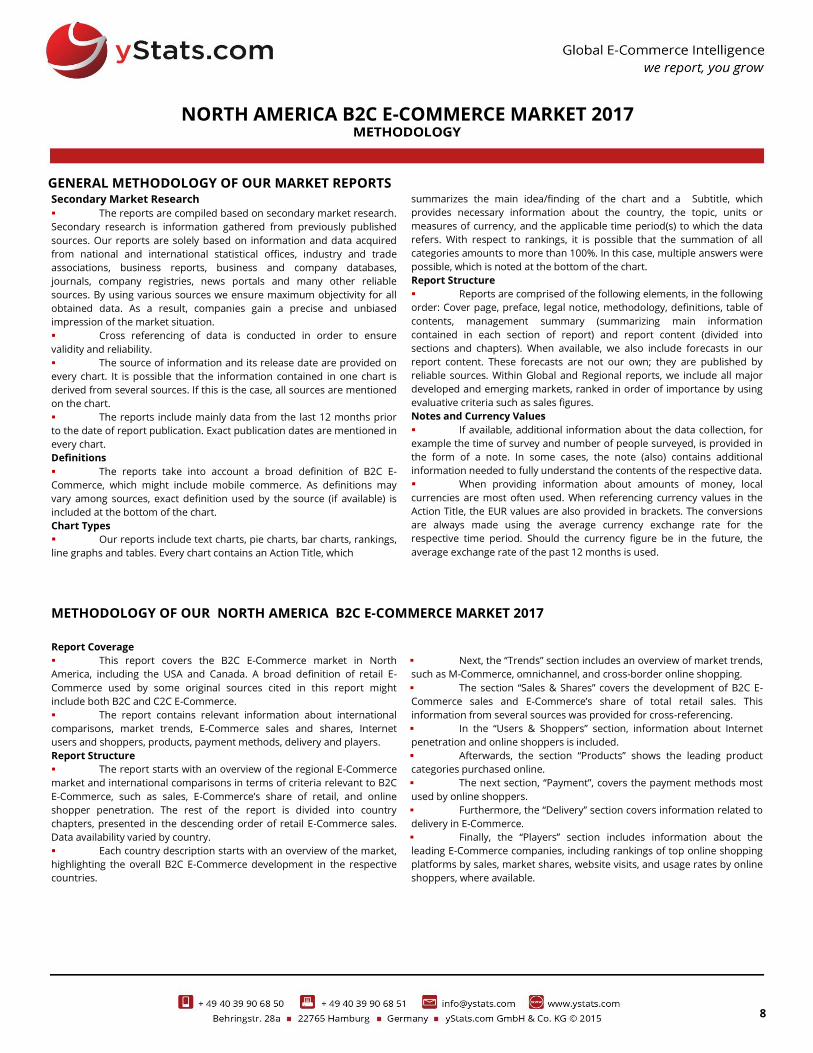
GENERAL METHODOLOGY OF OUR MARKET REPORTS Secondary Market Research
The reports are compiled based on secondary market research.
Secondary research is information gathered from previously published
sources. Our reports are solely based on information and data acquired
from national and international statistical offices, industry and trade
associations, business reports, business and company databases,
journals, company registries, news portals and many other reliable
sources. By using various sources we ensure maximum objectivity for all
obtained data. As a result, companies gain a precise and unbiased
impression of the market situation.
Cross referencing of data is conducted in order to ensure
validity and reliability.
The source of information and its release date are provided on
every chart. It is possible that the information contained in one chart is
derived from several sources. If this is the case, all sources are mentioned
on the chart.
The reports include mainly data from the last 12 months prior
to the date of report publication. Exact publication dates are mentioned in
every chart.
Definitions
The reports take into account a broad definition of B2C E-
Commerce, which might include mobile commerce. As definitions may
vary among sources, exact definition used by the source (if available) is
included at the bottom of the chart.
Chart Types
Our reports include text charts, pie charts, bar charts, rankings,
line graphs and tables. Every chart contains an Action Title, which
summarizes the main idea/finding of the chart and a Subtitle, which
provides necessary information about the country, the topic, units or
measures of currency, and the applicable time period(s) to which the data
refers. With respect to rankings, it is possible that the summation of all
categories amounts to more than 100%. In this case, multiple answers were
possible, which is noted at the bottom of the chart.
Report Structure
Reports are comprised of the following elements, in the following
order: Cover page, preface, legal notice, methodology, definitions, table of
contents, management summary (summarizing main information
contained in each section of report) and report content (divided into
sections and chapters). When available, we also include forecasts in our
report content. These forecasts are not our own; they are published by
reliable sources. Within Global and Regional reports, we include all major
developed and emerging markets, ranked in order of importance by using
evaluative criteria such as sales figures.
Notes and Currency Values
If available, additional information about the data collection, for
example the time of survey and number of people surveyed, is provided in
the form of a note. In some cases, the note (also) contains additional
information needed to fully understand the contents of the respective data.
When providing information about amounts of money, local
currencies are most often used. When referencing currency values in the
Action Title, the EUR values are also provided in brackets. The conversions
are always made using the average currency exchange rate for the
respective time period. Should the currency figure be in the future, the
average exchange rate of the past 12 months is used.
METHODOLOGY OF OUR NORTH AMERICA B2C E-COMMERCE MARKET 2017
Report Coverage
This report covers the B2C E-Commerce market in North
America, including the USA and Canada. A broad definition of retail E-
Commerce used by some original sources cited in this report might
include both B2C and C2C E-Commerce.
The report contains relevant information about international
comparisons, market trends, E-Commerce sales and shares, Internet
users and shoppers, products, payment methods, delivery and players.
Report Structure
The report starts with an overview of the regional E-Commerce
market and international comparisons in terms of criteria relevant to B2C
E-Commerce, such as sales, E-Commerce’s share of retail, and online
shopper penetration. The rest of the report is divided into country
chapters, presented in the descending order of retail E-Commerce sales.
Data availability varied by country.
Each country description starts with an overview of the market,
highlighting the overall B2C E-Commerce development in the respective
countries.
Next, the “Trends” section includes an overview of market trends,
such as M-Commerce, omnichannel, and cross-border online shopping.
The section “Sales & Shares” covers the development of B2C E-
Commerce sales and E-Commerce’s share of total retail sales. This
information from several sources was provided for cross-referencing.
In the “Users & Shoppers” section, information about Internet
penetration and online shoppers is included.
Afterwards, the section “Products” shows the leading product
categories purchased online.
The next section, “Payment”, covers the payment methods most
used by online shoppers.
Furthermore, the “Delivery” section covers information related to
delivery in E-Commerce.
Finally, the “Players” section includes information about the
leading E-Commerce companies, including rankings of top online shopping
platforms by sales, market shares, website visits, and usage rates by online
shoppers, where available.
NORTH AMERICA B2C E-COMMERCE MARKET 2017
8

USA B2C E-Commerce Sales Forecasts: 2017 to 2021
Top 5 Country B2C E-Commerce Sales Forecasts: 2017 to 2021
Innovation Trends in Global Retail and Payments 2017
Global Online Payment Methods: First Half 2017
North America Online Payment Methods: Full Year 2016
Global Mobile Payment Methods: First Half 2017
Global Mobile Wallets 2017: Competitors and Market Opportunities
Global M-Commerce 2017
Global Cross-Border B2C E-Commerce Market 2017
Global Digital Gaming Market 2017
Latin America B2C E-Commerce Market 2017
Europe B2C E-Commerce Market 2017
Western Europe B2C E-Commerce Market 2017
Asia-Pacific B2C E-Commerce Market 2017
Southeast Asia B2C E-Commerce Market 2017
November 2017
December 2017
October 2017
August 2017
March 2017
August 2017
January 2017
June 2016
February 2017
August 2017
October 2017
July 2017
July 2017
June 2017
May 2017
€ 450
€ 1,950
€ 950
€ 1,950
€ 950
€ 950
€ 1,950
€ 1,950
€ 2,950
€ 1,450
€ 1,950
€ 3,950
€ 2,950
€ 3,950
€ 1,950
UPCOMING RELATED REPORTS
REPORT PUBLICATION
DATE
PRICE*
Global Online Payment Methods: Second Half 2017
North America Online Payment Methods: Full Year 2017
January 2018
February 2018
€ 1,950
€ 950
NORTH AMERICA B2C E-COMMERCE MARKET 2017
9

10

11

12

13

14