LIBRARY SYSTEM, STURGIS LIBRARY...
21
LIBRARY SYSTEM, STURGIS LIBRARY REPORT APPENDICES
-
Upload
trinhtuong -
Category
Documents
-
view
234 -
download
1
Transcript of LIBRARY SYSTEM, STURGIS LIBRARY...

LIBRARY SYSTEM, STURGIS LIBRARY
REPORT
APPENDICES
1
TABLE OF CONTENTS
APPENDIX I: METHODOLOGY .................................................................................................................... 2
INTRODUCTION ......................................................................................................................................... 2
Sections I and II Methodology .............................................................................................................. 2
APPENDIX II: DASHBOARD TABLES OF STAFF COMPARISONS ................................................................ 14
Table 1. Summary of Comparisons on All General Response Items – Sturgis Library Staff to All Other
KSU Staff .............................................................................................................................................. 14
Table 2. Comparison on All General Response Items, Sturgis Library Staff to Benchmarks ............... 15
APPENDIX III: DATA TABLE FOR GENERAL CLIMATE SCALES – STURGIS LIBRARY STAFF COMPARED TO
ALL OTHER KSU STAFF ............................................................................................................................. 16
Table 1. Comparison of Sturgis Library Staff to All KSU Staff Based on Mean Score of General
Climate Scale Ratings .......................................................................................................................... 16
LIBRARY SYSTEM, STURGIS LIBRARY REPORT
appendix i: methodology

2
APPENDIX I: METHODOLOGY
INTRODUCTION
This analysis presents findings for staff in the Library System, Sturgis Library (Sturgis Library). Findings
are presented under the headings of “strengths” and “challenges.” The assignment of findings to these
categories depends on the method of analysis and basis of comparison, as further described here.
Sections I and II Methodology
The report consists of two sections, each with a different analytical focus. The analysis in Section I
consists of a series of cross tabulations to present descriptive data, and chi square tests to assess the
significance of comparative findings. Chi square tests were conducted to compare responses from
Sturgis Library staff to those of all other Kennesaw Campus staff. For these comparisons, no statistically
significant differences were found where numbers were sufficient to establish validity.
The second type of comparison in Section I is to an established value that is considered a desired
threshold of achievement in the short term. This value is referred to as a “benchmark” in this report. A
benchmark comparison is an absolute comparison, rather than a comparison to the norm of any
particular population.
Benchmark comparisons provided another perspective from which to interpret results. For example,
responses of Sturgis Library staff to a climate assessment item may be categorized as a challenge when
compared to all other KSU staff. However, the same responses may be categorized as a strength when
compared to a benchmark that is exceeded. The reverse can also be the case, where responses are
categorized as strengths when compared to all other KSU staff but as challenges when compared to a
benchmark.
Overall average responses from KSU faculty/instructors/staff and KSU students formed the basis for
establishing benchmarks. Items from the Campus Culture and Climate Assessment that had the same
response choices (e.g., yes or no, strongly agree – strongly disagree, etc.) were grouped together. For
items where the response choice was “strongly agree – strongly disagree,” positive statements were
grouped separately from negative statements. The frequency distribution of responses for each item
type grouping was calculated for all KSU faculty/instructors/staff, faculty/instructors only (for faculty-
specific items), and students. Benchmarks were based on these frequency distributions and the
percentage who selected a desired response based on the item type. Benchmarks were set according to
one of these rationales:
to exceed the existing desired response percentages (such as percentage of “agree” or “strongly
agree”) by a small increment
to be consistent with similar item types
to exceed the existing desired response percentages (such as percentage of “agree” or “strongly
agree”) by a larger increment when these seemed to be more out of line with what would be
expected or desired
3
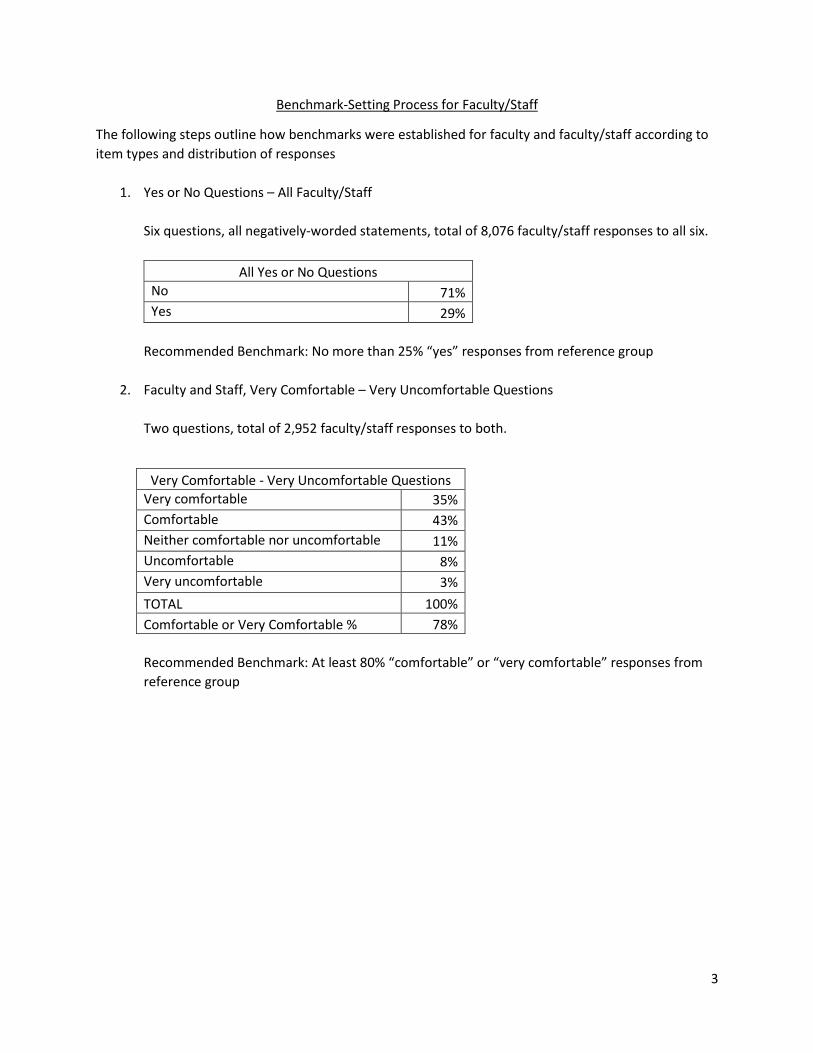
Benchmark-Setting Process for Faculty/Staff
The following steps outline how benchmarks were established for faculty and faculty/staff according to
item types and distribution of responses
1. Yes or No Questions – All Faculty/Staff
Six questions, all negatively-worded statements, total of 8,076 faculty/staff responses to all six.
All Yes or No Questions
No 71%
Yes 29%
Recommended Benchmark: No more than 25% “yes” responses from reference group
2. Faculty and Staff, Very Comfortable – Very Uncomfortable Questions
Two questions, total of 2,952 faculty/staff responses to both.
Very Comfortable - Very Uncomfortable Questions
Very comfortable 35%
Comfortable 43%
Neither comfortable nor uncomfortable 11%
Uncomfortable 8%
Very uncomfortable 3%
TOTAL 100%
Comfortable or Very Comfortable % 78%
Recommended Benchmark: At least 80% “comfortable” or “very comfortable” responses from
reference group

4
3. Faculty Only, Very Comfortable – Very Uncomfortable Questions
One question - “Overall, how comfortable are you with the climate in your courses?” total of
622 instructors responses
Very Comfortable - Very Uncomfortable Questions - Faculty Only
Very comfortable 49%
Comfortable 42%
Neither comfortable nor uncomfortable 7%
Uncomfortable 3%
Very uncomfortable 0%
TOTAL 100%
Comfortable or Very Comfortable % 91%
Recommended Benchmark: At least 90% “comfortable” or “very comfortable” responses from
reference group
4. Faculty and Staff, Strongly Agree – Strongly Disagree (with Positive Statements)
12 statements, total of 15,005 faculty/staff responses to all statements
Strongly Agree - Strongly Disagree, Positive Statements
Strongly agree 22%
Agree 54%
Disagree 18%
Strongly disagree 6%
TOTAL 100%
Agree or Strongly Agree % 76%
Recommended Benchmark: At least 80% “agree” or “strongly agree” responses from reference
group
5
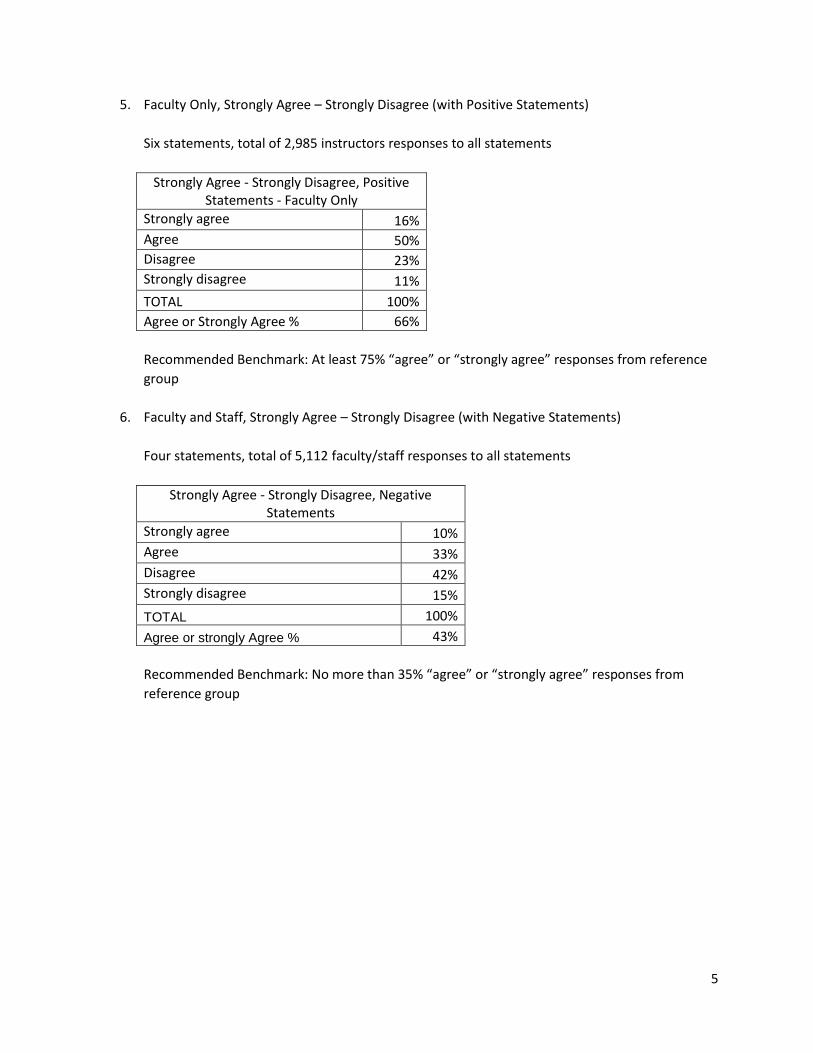
5. Faculty Only, Strongly Agree – Strongly Disagree (with Positive Statements)
Six statements, total of 2,985 instructors responses to all statements
Strongly Agree - Strongly Disagree, Positive Statements - Faculty Only
Strongly agree 16%
Agree 50%
Disagree 23%
Strongly disagree 11%
TOTAL 100%
Agree or Strongly Agree % 66%
Recommended Benchmark: At least 75% “agree” or “strongly agree” responses from reference
group
6. Faculty and Staff, Strongly Agree – Strongly Disagree (with Negative Statements)
Four statements, total of 5,112 faculty/staff responses to all statements
Strongly Agree - Strongly Disagree, Negative Statements
Strongly agree 10%
Agree 33%
Disagree 42%
Strongly disagree 15%
TOTAL 100%
Agree or strongly Agree % 43%
Recommended Benchmark: No more than 35% “agree” or “strongly agree” responses from
reference group
6
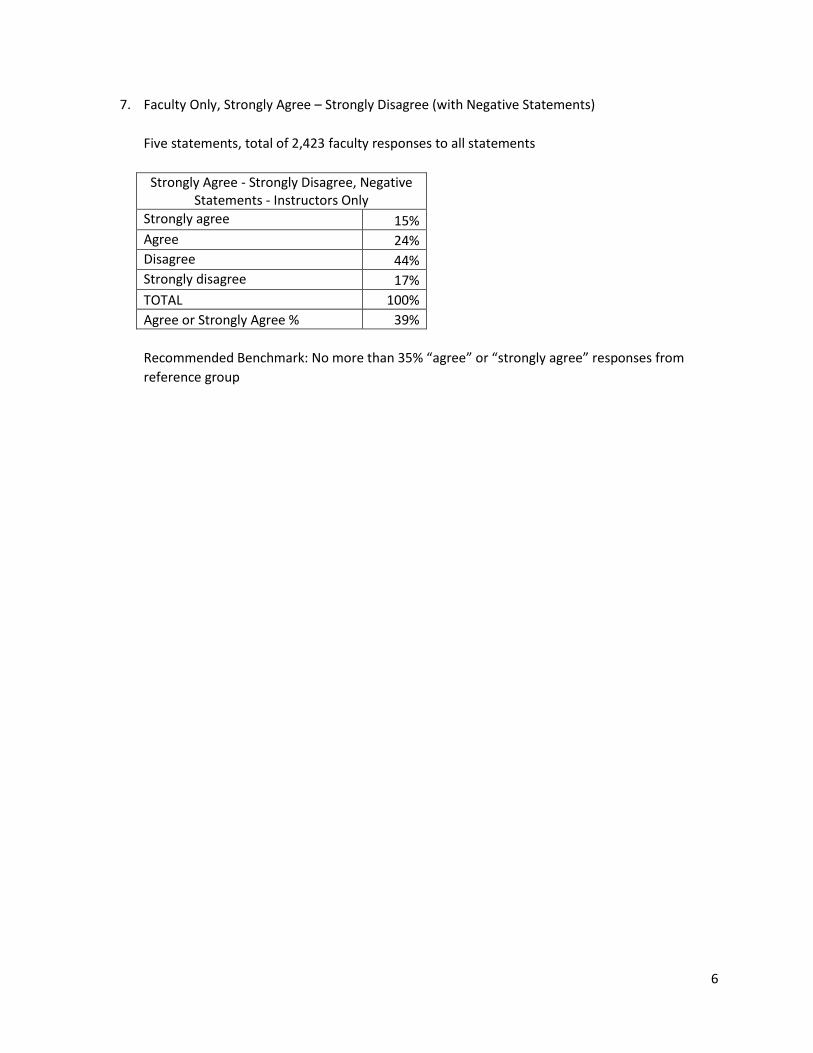
7. Faculty Only, Strongly Agree – Strongly Disagree (with Negative Statements)
Five statements, total of 2,423 faculty responses to all statements
Strongly Agree - Strongly Disagree, Negative Statements - Instructors Only
Strongly agree 15%
Agree 24%
Disagree 44%
Strongly disagree 17%
TOTAL 100%
Agree or Strongly Agree % 39%
Recommended Benchmark: No more than 35% “agree” or “strongly agree” responses from
reference group
7
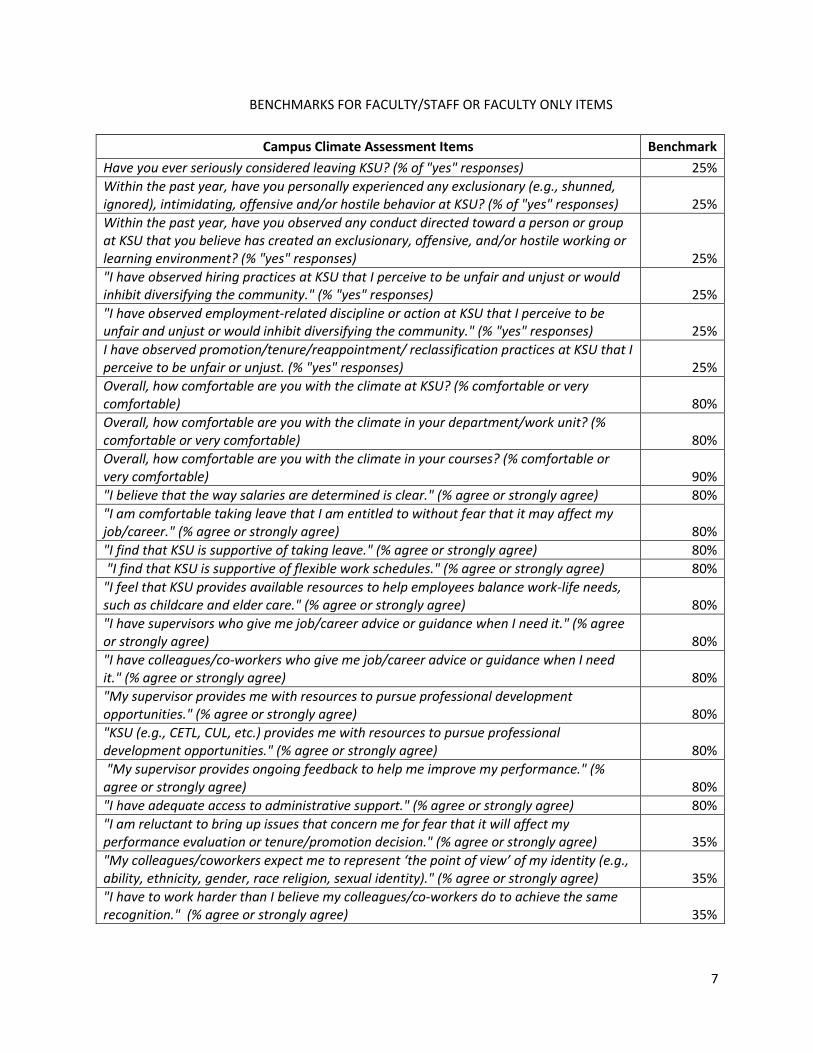
BENCHMARKS FOR FACULTY/STAFF OR FACULTY ONLY ITEMS
Campus Climate Assessment Items Benchmark
Have you ever seriously considered leaving KSU? (% of "yes" responses) 25%
Within the past year, have you personally experienced any exclusionary (e.g., shunned, ignored), intimidating, offensive and/or hostile behavior at KSU? (% of "yes" responses) 25%
Within the past year, have you observed any conduct directed toward a person or group at KSU that you believe has created an exclusionary, offensive, and/or hostile working or learning environment? (% "yes" responses) 25%
"I have observed hiring practices at KSU that I perceive to be unfair and unjust or would inhibit diversifying the community." (% "yes" responses) 25%
"I have observed employment-related discipline or action at KSU that I perceive to be unfair and unjust or would inhibit diversifying the community." (% "yes" responses) 25%
I have observed promotion/tenure/reappointment/ reclassification practices at KSU that I perceive to be unfair or unjust. (% "yes" responses) 25%
Overall, how comfortable are you with the climate at KSU? (% comfortable or very comfortable) 80%
Overall, how comfortable are you with the climate in your department/work unit? (% comfortable or very comfortable) 80%
Overall, how comfortable are you with the climate in your courses? (% comfortable or very comfortable) 90%
"I believe that the way salaries are determined is clear." (% agree or strongly agree) 80%
"I am comfortable taking leave that I am entitled to without fear that it may affect my job/career." (% agree or strongly agree) 80%
"I find that KSU is supportive of taking leave." (% agree or strongly agree) 80%
"I find that KSU is supportive of flexible work schedules." (% agree or strongly agree) 80%
"I feel that KSU provides available resources to help employees balance work-life needs, such as childcare and elder care." (% agree or strongly agree) 80%
"I have supervisors who give me job/career advice or guidance when I need it." (% agree or strongly agree) 80%
"I have colleagues/co-workers who give me job/career advice or guidance when I need it." (% agree or strongly agree) 80%
"My supervisor provides me with resources to pursue professional development opportunities." (% agree or strongly agree) 80%
"KSU (e.g., CETL, CUL, etc.) provides me with resources to pursue professional development opportunities." (% agree or strongly agree) 80%
"My supervisor provides ongoing feedback to help me improve my performance." (% agree or strongly agree) 80%
"I have adequate access to administrative support." (% agree or strongly agree) 80%
"I am reluctant to bring up issues that concern me for fear that it will affect my performance evaluation or tenure/promotion decision." (% agree or strongly agree) 35%
"My colleagues/coworkers expect me to represent ‘the point of view’ of my identity (e.g., ability, ethnicity, gender, race religion, sexual identity)." (% agree or strongly agree) 35%
"I have to work harder than I believe my colleagues/co-workers do to achieve the same recognition." (% agree or strongly agree) 35%
8
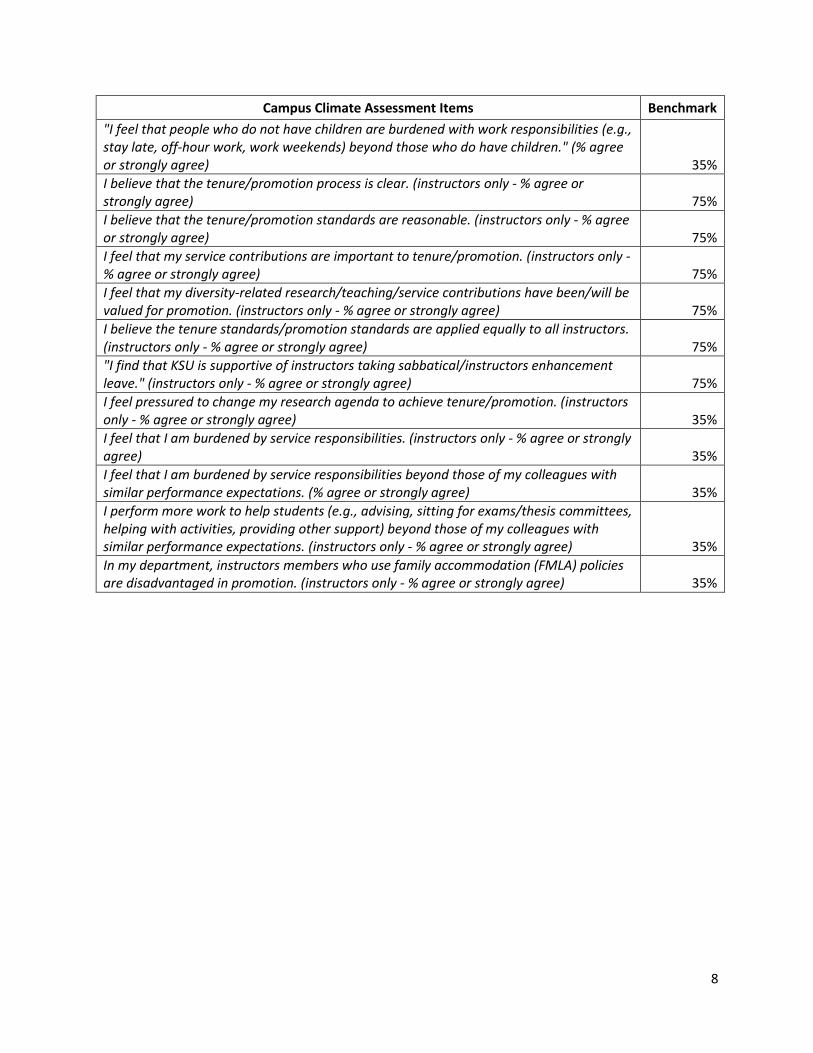
Campus Climate Assessment Items Benchmark
"I feel that people who do not have children are burdened with work responsibilities (e.g., stay late, off-hour work, work weekends) beyond those who do have children." (% agree or strongly agree) 35%
I believe that the tenure/promotion process is clear. (instructors only - % agree or strongly agree) 75%
I believe that the tenure/promotion standards are reasonable. (instructors only - % agree or strongly agree) 75%
I feel that my service contributions are important to tenure/promotion. (instructors only - % agree or strongly agree) 75%
I feel that my diversity-related research/teaching/service contributions have been/will be valued for promotion. (instructors only - % agree or strongly agree) 75%
I believe the tenure standards/promotion standards are applied equally to all instructors. (instructors only - % agree or strongly agree) 75%
"I find that KSU is supportive of instructors taking sabbatical/instructors enhancement leave." (instructors only - % agree or strongly agree) 75%
I feel pressured to change my research agenda to achieve tenure/promotion. (instructors only - % agree or strongly agree) 35%
I feel that I am burdened by service responsibilities. (instructors only - % agree or strongly agree) 35%
I feel that I am burdened by service responsibilities beyond those of my colleagues with similar performance expectations. (% agree or strongly agree) 35%
I perform more work to help students (e.g., advising, sitting for exams/thesis committees, helping with activities, providing other support) beyond those of my colleagues with similar performance expectations. (instructors only - % agree or strongly agree) 35%
In my department, instructors members who use family accommodation (FMLA) policies are disadvantaged in promotion. (instructors only - % agree or strongly agree) 35%
9
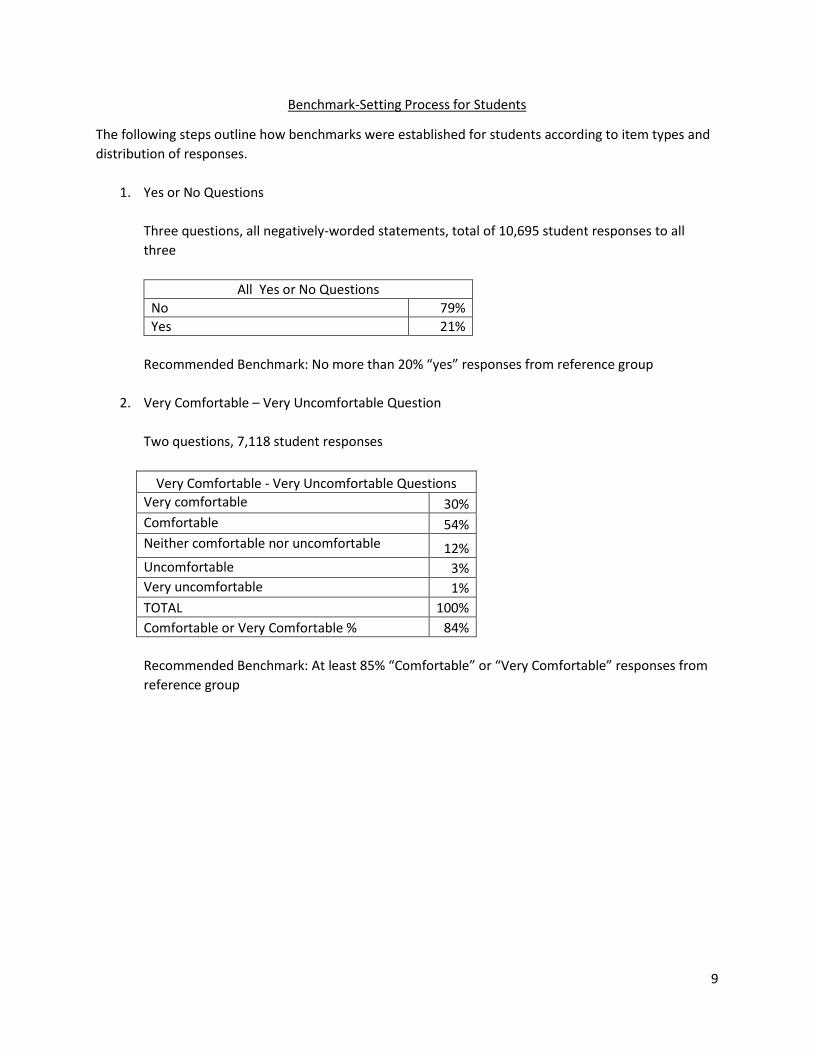
Benchmark-Setting Process for Students
The following steps outline how benchmarks were established for students according to item types and
distribution of responses.
1. Yes or No Questions
Three questions, all negatively-worded statements, total of 10,695 student responses to all
three
All Yes or No Questions
No 79%
Yes 21%
Recommended Benchmark: No more than 20% “yes” responses from reference group
2. Very Comfortable – Very Uncomfortable Question
Two questions, 7,118 student responses
Very Comfortable - Very Uncomfortable Questions
Very comfortable 30%
Comfortable 54%
Neither comfortable nor uncomfortable 12%
Uncomfortable 3%
Very uncomfortable 1%
TOTAL 100%
Comfortable or Very Comfortable % 84%
Recommended Benchmark: At least 85% “Comfortable” or “Very Comfortable” responses from
reference group
10
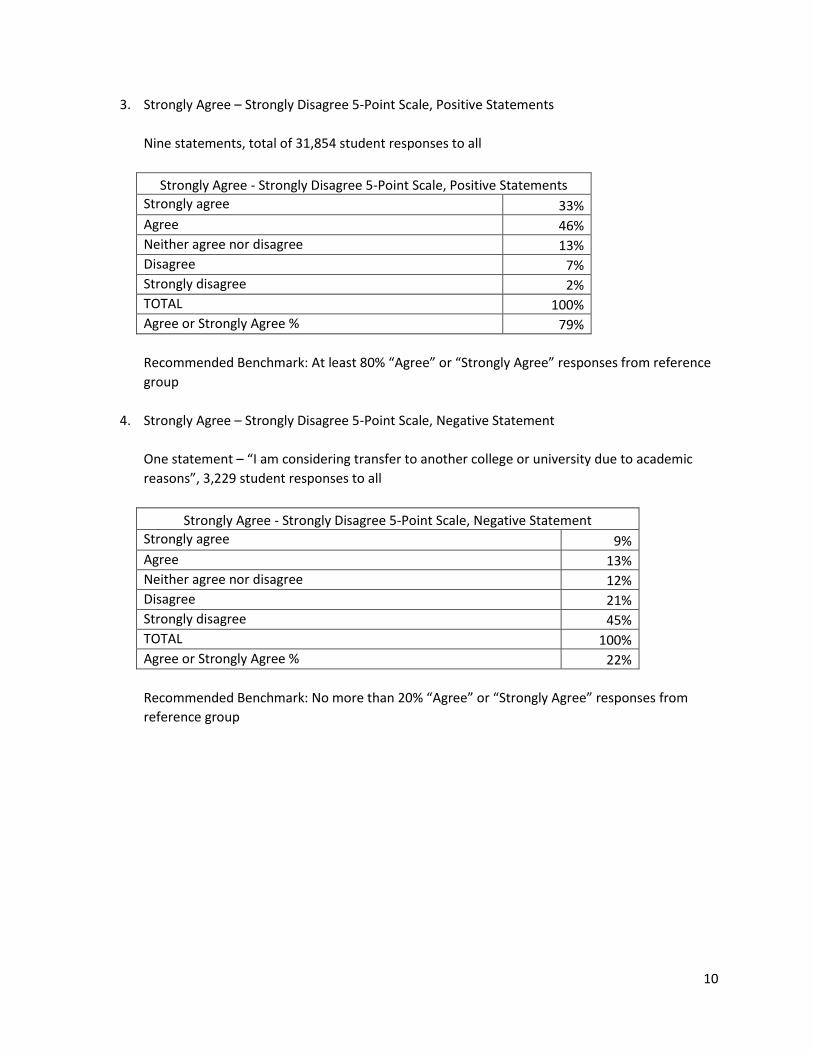
3. Strongly Agree – Strongly Disagree 5-Point Scale, Positive Statements
Nine statements, total of 31,854 student responses to all
Strongly Agree - Strongly Disagree 5-Point Scale, Positive Statements
Strongly agree 33%
Agree 46%
Neither agree nor disagree 13%
Disagree 7%
Strongly disagree 2%
TOTAL 100%
Agree or Strongly Agree % 79%
Recommended Benchmark: At least 80% “Agree” or “Strongly Agree” responses from reference
group
4. Strongly Agree – Strongly Disagree 5-Point Scale, Negative Statement
One statement – “I am considering transfer to another college or university due to academic
reasons”, 3,229 student responses to all
Strongly Agree - Strongly Disagree 5-Point Scale, Negative Statement
Strongly agree 9%
Agree 13%
Neither agree nor disagree 12%
Disagree 21%
Strongly disagree 45%
TOTAL 100%
Agree or Strongly Agree % 22%
Recommended Benchmark: No more than 20% “Agree” or “Strongly Agree” responses from
reference group
11
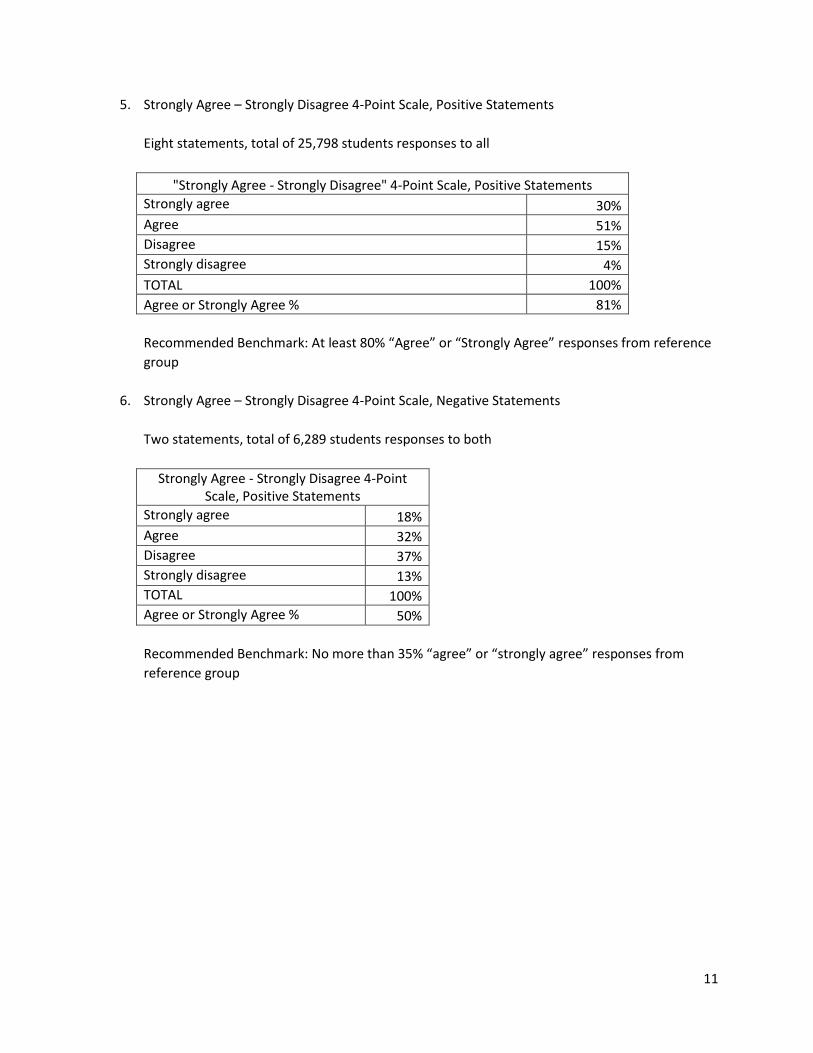
5. Strongly Agree – Strongly Disagree 4-Point Scale, Positive Statements
Eight statements, total of 25,798 students responses to all
"Strongly Agree - Strongly Disagree" 4-Point Scale, Positive Statements
Strongly agree 30%
Agree 51%
Disagree 15%
Strongly disagree 4%
TOTAL 100%
Agree or Strongly Agree % 81%
Recommended Benchmark: At least 80% “Agree” or “Strongly Agree” responses from reference
group
6. Strongly Agree – Strongly Disagree 4-Point Scale, Negative Statements
Two statements, total of 6,289 students responses to both
Strongly Agree - Strongly Disagree 4-Point Scale, Positive Statements
Strongly agree 18%
Agree 32%
Disagree 37%
Strongly disagree 13%
TOTAL 100%
Agree or Strongly Agree % 50%
Recommended Benchmark: No more than 35% “agree” or “strongly agree” responses from
reference group
12
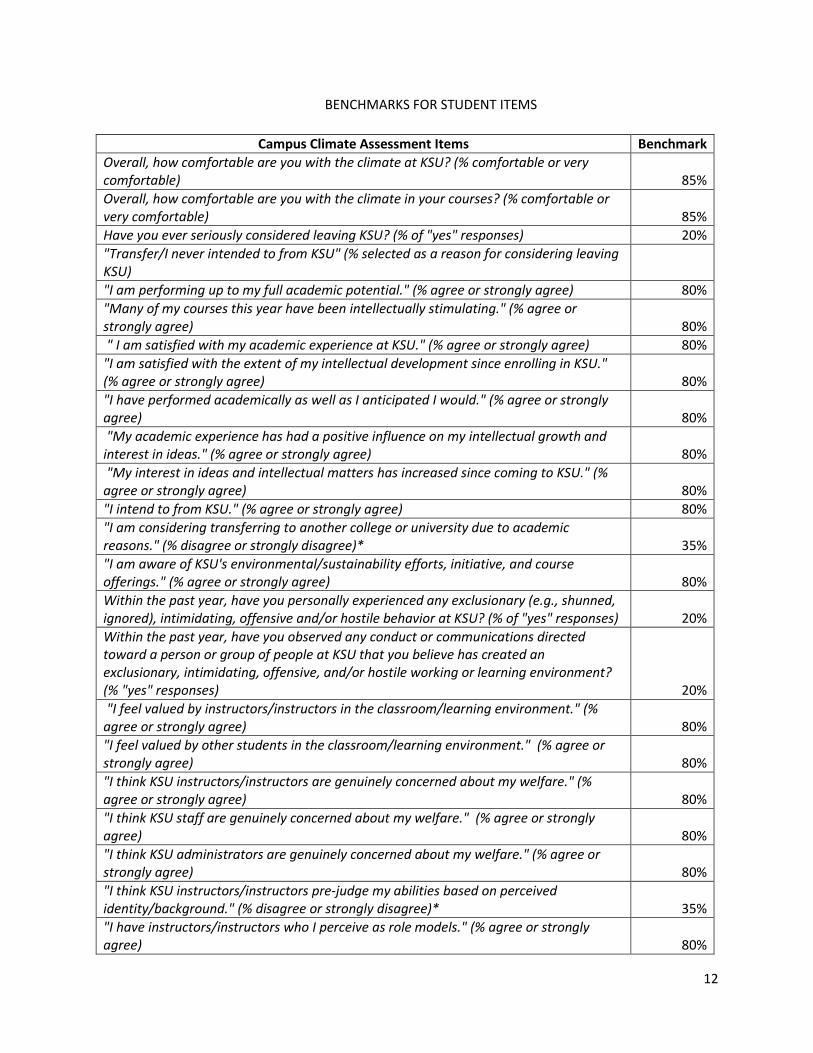
BENCHMARKS FOR STUDENT ITEMS
Campus Climate Assessment Items Benchmark
Overall, how comfortable are you with the climate at KSU? (% comfortable or very comfortable) 85%
Overall, how comfortable are you with the climate in your courses? (% comfortable or very comfortable) 85%
Have you ever seriously considered leaving KSU? (% of "yes" responses) 20%
"Transfer/I never intended to from KSU" (% selected as a reason for considering leaving KSU)
"I am performing up to my full academic potential." (% agree or strongly agree) 80%
"Many of my courses this year have been intellectually stimulating." (% agree or strongly agree) 80%
" I am satisfied with my academic experience at KSU." (% agree or strongly agree) 80%
"I am satisfied with the extent of my intellectual development since enrolling in KSU." (% agree or strongly agree) 80%
"I have performed academically as well as I anticipated I would." (% agree or strongly agree) 80%
"My academic experience has had a positive influence on my intellectual growth and interest in ideas." (% agree or strongly agree) 80%
"My interest in ideas and intellectual matters has increased since coming to KSU." (% agree or strongly agree) 80%
"I intend to from KSU." (% agree or strongly agree) 80%
"I am considering transferring to another college or university due to academic reasons." (% disagree or strongly disagree)* 35%
"I am aware of KSU's environmental/sustainability efforts, initiative, and course offerings." (% agree or strongly agree) 80%
Within the past year, have you personally experienced any exclusionary (e.g., shunned, ignored), intimidating, offensive and/or hostile behavior at KSU? (% of "yes" responses) 20%
Within the past year, have you observed any conduct or communications directed toward a person or group of people at KSU that you believe has created an exclusionary, intimidating, offensive, and/or hostile working or learning environment? (% "yes" responses) 20%
"I feel valued by instructors/instructors in the classroom/learning environment." (% agree or strongly agree) 80%
"I feel valued by other students in the classroom/learning environment." (% agree or strongly agree) 80%
"I think KSU instructors/instructors are genuinely concerned about my welfare." (% agree or strongly agree) 80%
"I think KSU staff are genuinely concerned about my welfare." (% agree or strongly agree) 80%
"I think KSU administrators are genuinely concerned about my welfare." (% agree or strongly agree) 80%
"I think KSU instructors/instructors pre-judge my abilities based on perceived identity/background." (% disagree or strongly disagree)* 35%
"I have instructors/instructors who I perceive as role models." (% agree or strongly agree) 80%
13
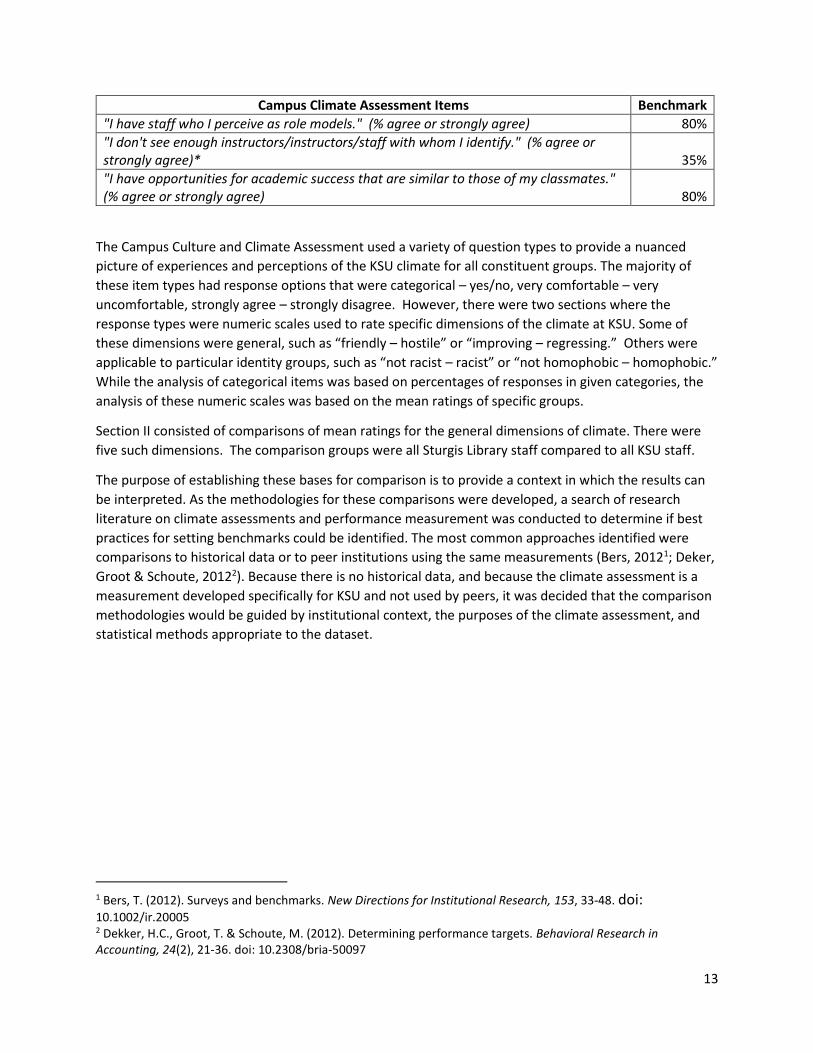
Campus Climate Assessment Items Benchmark
"I have staff who I perceive as role models." (% agree or strongly agree) 80%
"I don't see enough instructors/instructors/staff with whom I identify." (% agree or strongly agree)* 35%
"I have opportunities for academic success that are similar to those of my classmates." (% agree or strongly agree) 80%
The Campus Culture and Climate Assessment used a variety of question types to provide a nuanced
picture of experiences and perceptions of the KSU climate for all constituent groups. The majority of
these item types had response options that were categorical – yes/no, very comfortable – very
uncomfortable, strongly agree – strongly disagree. However, there were two sections where the
response types were numeric scales used to rate specific dimensions of the climate at KSU. Some of
these dimensions were general, such as “friendly – hostile” or “improving – regressing.” Others were
applicable to particular identity groups, such as “not racist – racist” or “not homophobic – homophobic.”
While the analysis of categorical items was based on percentages of responses in given categories, the
analysis of these numeric scales was based on the mean ratings of specific groups.
Section II consisted of comparisons of mean ratings for the general dimensions of climate. There were
five such dimensions. The comparison groups were all Sturgis Library staff compared to all KSU staff.
The purpose of establishing these bases for comparison is to provide a context in which the results can
be interpreted. As the methodologies for these comparisons were developed, a search of research
literature on climate assessments and performance measurement was conducted to determine if best
practices for setting benchmarks could be identified. The most common approaches identified were
comparisons to historical data or to peer institutions using the same measurements (Bers, 20121; Deker,
Groot & Schoute, 20122). Because there is no historical data, and because the climate assessment is a
measurement developed specifically for KSU and not used by peers, it was decided that the comparison
methodologies would be guided by institutional context, the purposes of the climate assessment, and
statistical methods appropriate to the dataset.
1 Bers, T. (2012). Surveys and benchmarks. New Directions for Institutional Research, 153, 33-48. doi: 10.1002/ir.20005 2 Dekker, H.C., Groot, T. & Schoute, M. (2012). Determining performance targets. Behavioral Research in Accounting, 24(2), 21-36. doi: 10.2308/bria-50097
LIBRARY SYSTEM, STURGIS LIBRARY
REPORT
appendix ii: DASHBOARD TABLES
OF STAFF COMPARISONS

Keys to Color Coding:
Strength Challenge
14
APPENDIX II: DASHBOARD TABLES OF STAFF COMPARISONS
Table 1. Summary of Comparisons on All General Response Items – Sturgis Library Staff to All
Other KSU Staff
Campus Climate Assessment Items
Sturgis Library Staff
All Other KSU Staff
% # % #
"I believe that the way salaries are determined is clear." (% agree or strongly agree) 55% 6 34% 227
"I find that KSU is supportive of flexible work schedules." (% agree or strongly agree) 91% 10 75% 503
"I have supervisors who give me job/career advice or guidance when I need it." (% agree or strongly agree) 90% 9 75% 495
"I have observed employment-related discipline or action up to and including termination at KSU that I perceive to be unfair and unjust or would inhibit diversifying the community." (% of "yes" responses) 0% 0 13% 80
"I have colleagues/co-workers who give me job/career advice or guidance when I need it." (% agree or strongly agree) 90% 9 82% 537
Overall, how comfortable are you with the climate in your department/work unit? (% comfortable or very comfortable) 73% 8 80% 566
Keys to Color Coding:
Strength Challenge
15
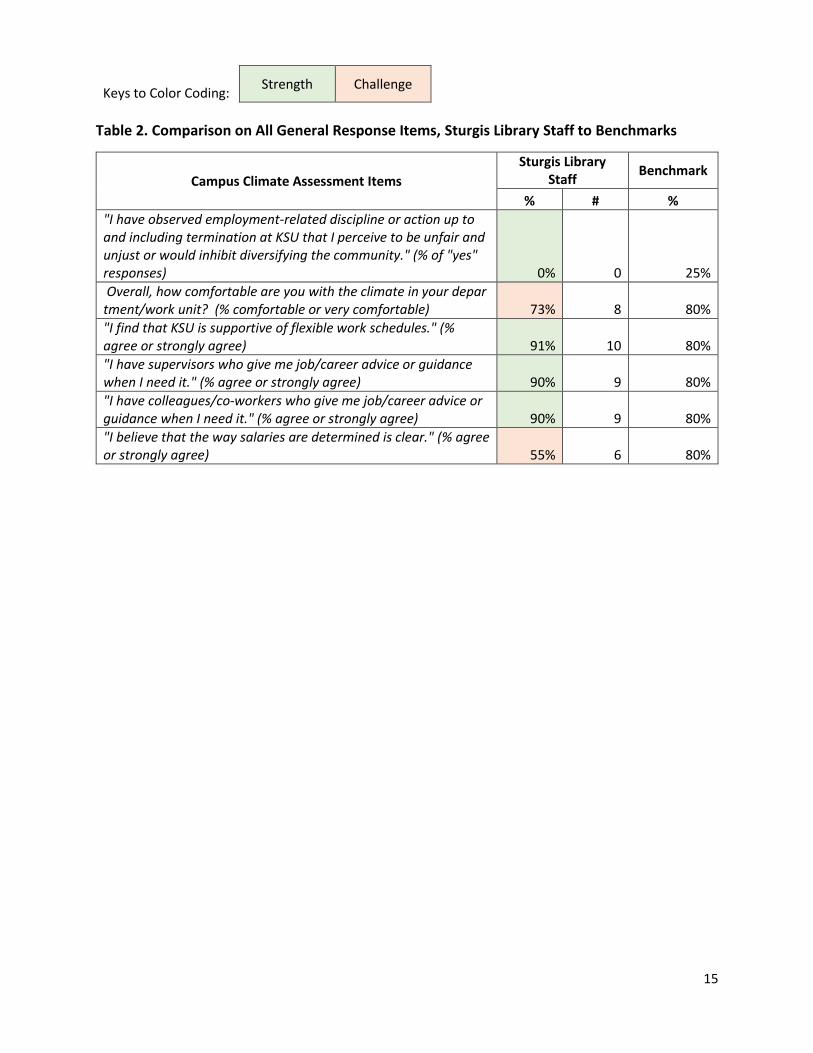
Table 2. Comparison on All General Response Items, Sturgis Library Staff to Benchmarks
Campus Climate Assessment Items
Sturgis Library Staff
Benchmark
% # %
"I have observed employment-related discipline or action up to and including termination at KSU that I perceive to be unfair and unjust or would inhibit diversifying the community." (% of "yes" responses) 0% 0 25%
Overall, how comfortable are you with the climate in your department/work unit? (% comfortable or very comfortable) 73% 8 80%
"I find that KSU is supportive of flexible work schedules." (% agree or strongly agree) 91% 10 80%
"I have supervisors who give me job/career advice or guidance when I need it." (% agree or strongly agree) 90% 9 80%
"I have colleagues/co-workers who give me job/career advice or guidance when I need it." (% agree or strongly agree) 90% 9 80%
"I believe that the way salaries are determined is clear." (% agree or strongly agree) 55% 6 80%

LIBRARY SYSTEM, STURGIS LIBRARY
REPORT
appendix iii: DATATABLE FOR GENERAL
CLIMATE SCALES
16
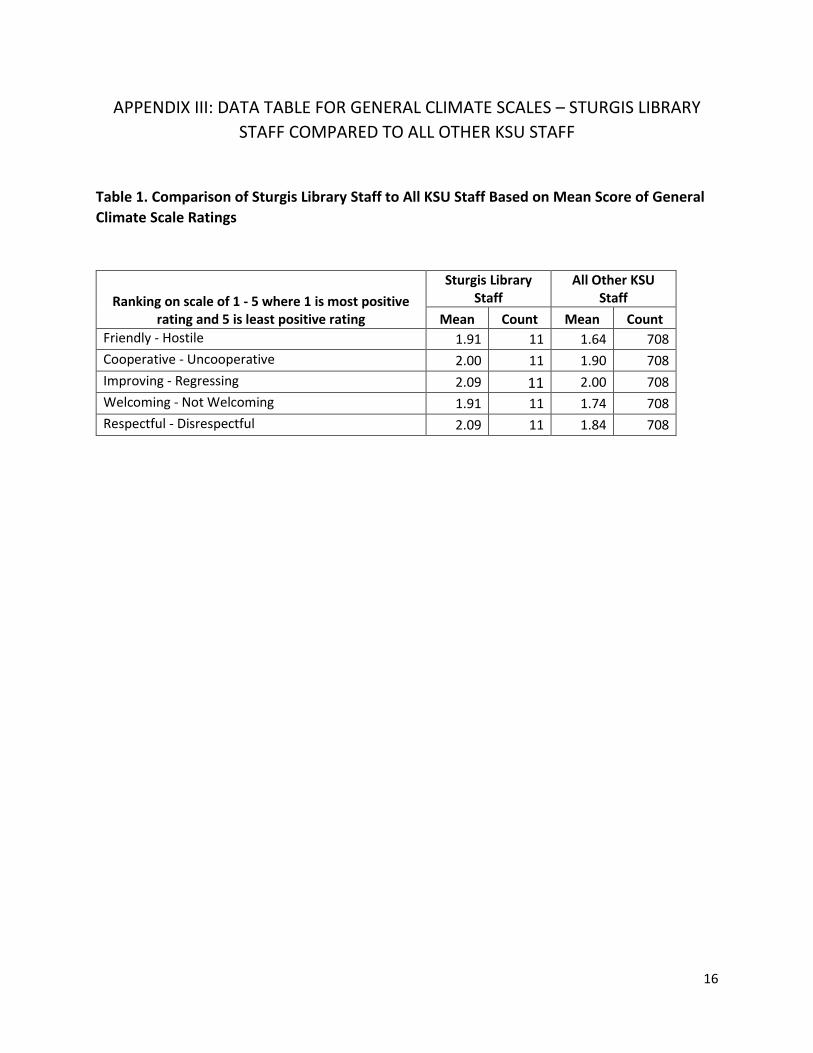
APPENDIX III: DATA TABLE FOR GENERAL CLIMATE SCALES – STURGIS LIBRARY
STAFF COMPARED TO ALL OTHER KSU STAFF
Table 1. Comparison of Sturgis Library Staff to All KSU Staff Based on Mean Score of General
Climate Scale Ratings
Ranking on scale of 1 - 5 where 1 is most positive rating and 5 is least positive rating
Sturgis Library Staff
All Other KSU Staff
Mean Count Mean Count
Friendly - Hostile 1.91 11 1.64 708
Cooperative - Uncooperative 2.00 11 1.90 708
Improving - Regressing 2.09 11 2.00 708
Welcoming - Not Welcoming 1.91 11 1.74 708
Respectful - Disrespectful 2.09 11 1.84 708
440 Bartow Avenue NW, MD #2702English Bldg., Suite 202
Kennesaw, GA 30144-5591470-578-2614
diversity.kennesaw.edu
WE ARE stronger together.