Keynote Speech- Jim O’Neil - Texas A&M...
18
Jim O’Neil CEO & President October 2014 Grid of the Future Symposium CIGRE U.S. National Committee & EPRI
Transcript of Keynote Speech- Jim O’Neil - Texas A&M...

Copyright © 2014 Quanta Services Inc. Confidential & Proprietary 1 .
Jim O’Neil CEO & President
October 2014
Grid of the Future Symposium
CIGRE U.S. National Committee & EPRI

Copyright © 2014 Quanta Services Inc. Confidential & Proprietary 2 .
Who is Quanta Services?
Largest Electric T&D
and Gas Pipeline Specialty
Contractor in North America
More than 40 Companies &
25,000 Employees
Providing Full Range of Services

Copyright © 2014 Quanta Services Inc. Confidential & Proprietary 3 .
The Grid of the Future Depends on Striving for ZERO Harm Every Day
Safety: Our Highest Priority
Quanta Services is Founding Member,
OSHA National Safety Partnership

Copyright © 2014 Quanta Services Inc. Confidential & Proprietary 4 .
2011 2012 2013 2014 Est.
($ in millions) Revenue
$4,194
$5,920 $6,523
(1) Represents the midpoint of guidance range
* * $7,700(1)
Our Financials: Strong Indicator of Grid Modernization & Growth
Electric Power 69%
Oil & Gas Infrastructure
29%
Fiber Optic Licensing &
Other 2%
2013 Consolidated Revenue = $6.5 Billion

Copyright © 2014 Quanta Services Inc. Confidential & Proprietary 5 .
Large investment required for: Aging Infrastructure Reliability, Hardening,
Resiliency, Security U.S. Electricity Fuel
Transformation Smart Grid Demand Side Innovations
21st Century Grid Requires "Smart”
Solutions
Grid Transformation Driver: Electricity Vital to U.S. Economy
U.S. Outage Cost = $125 Billion/Year (DOE)
U.S. Outage Events Increasing

Copyright © 2014 Quanta Services Inc. Confidential & Proprietary 6 .
With limited resources for wholesale asset replacement in the near term, holistic strategies are required to manage cost and reliability to acceptable 21st century performance levels.
Grid Transformation Driver: Holistic Approach Required
System Reliability & Capability
Business Goals
Capital/O&M Budgets
Aging Infrastructure
Grid Hardening
Asset Management: Predictability of Cost
& Reliability
The Grid is 40 to 60 years old on average, with 25% of the Grid a
performance concern.

Copyright © 2014 Quanta Services Inc. Confidential & Proprietary 7 .
Grid Transformation Driver: Game Changing Events
Super Storm Sandy
Grid Vulnerabilities Revealed White House, Congress, FERC, NERC focused
Metcalf Substation Gunshot Damage

Copyright © 2014 Quanta Services Inc. Confidential & Proprietary 8 .
Grid Transformation Driver: U.S. Fuel Transformation
Natural Gas
Renewables
Nuclear
Coal Petroleum liquids and other
1990 2000 2010 2020 2030 2040
2012 History Projections
6
5
4
3
2
1
0
GAS Exceeds COAL in 2035; 50+ GW COAL Retired More COAL Retirements Probable; NUCLEAR Stressed
Source: EIA.GOV
Trillion kWhs

Copyright © 2014 Quanta Services Inc. Confidential & Proprietary 9 .
Grid Transformation Driver: Shale Gas Impacts Energy Prices
1990 2000 2010 2020 2030 2040
2012 History Projections 12
10
8
6
4
2
0
Market Prices Stress Coal and Nuclear Economics Lower Prices Create Headroom For Grid Modernization
Henry Hub Spot
Natural Gas Prices
2012
$/MBtu
Source: EIA.GOV

Copyright © 2014 Quanta Services Inc. Confidential & Proprietary 10 .
Grid Transformation Driver: Renewable Surge
Geothermal
Biomass
MSW/LFG
Wind
Solar
Conventional hydropower
2000 2010 2020 2030 2040
2012 History Projections 600
500
400
300
200
100
0
Non-Hydro Renewable Sources Grow 3.2% Annually Game Changer – Solar Grows 7.5% Annually
Source: EIA.GOV
Billion kWhs
Includes
Distributed Resources

Copyright © 2014 Quanta Services Inc. Confidential & Proprietary 11 .
Grid Transformation Driver: Competitive Transmission
FERC Order 1000 in 2011 and clarified in 2012 enabled competitive transmission:
• Ensures regional and transparent planning • Reinforces "beneficiary pays" cost allocation • Eliminates rights of first refusal (ROFR) or monopoly
status for building transmission unless states mandate ROFR − Affects higher voltage, regionally allocated transmission
FERC Order 1000 will lead to increased transmission development and developers

Copyright © 2014 Quanta Services Inc. Confidential & Proprietary 12 .
Grid Transformation Driver: Smart Grid & Distributed Resources
Smart Grid investments • Transmission made smarter
with enhanced monitoring, protection, and control with synchrophasors
• Distribution being transformed with automation and feeder optimization
• Demand response with smart meters • Utility grade battery storage introduced
Microgrids and "behind the meter" distributed energy resources require a robust, hybrid T&D grid • Grid connection required for reliability and market reach
Source: NASPI

Copyright © 2014 Quanta Services Inc. Confidential & Proprietary 13 .
Grid Transformation Headwind: Stagnant (Net) Demand
Trendline
3-year moving average
1950 1970 1990 2010 2030
2012 History Projections 12
10
8
6
4
2
0
-2 1960 1980 2000 2020 2040
2012 to 2040 > Typical Home Down 4% (to 11.6 MWh/yr) 2012 to 2040 > Lighting Down 65%
% Growth
Source: EIA.GOV

Copyright © 2014 Quanta Services Inc. Confidential & Proprietary 14 .
Grid Transformation Headwind: Rate Fatigue Average Residential Customer Monthly
Bill Today Approx. $110 (Source: EPRI)
• Energy = $70; Distribution = $30, Transmission = $10
Utility Model based on kWh sales, but with stagnant sales, rates will go up to pay for needed grid investments • Result = Rate Fatigue unless VALUE
demonstrated • BUT, energy prices have dropped creating some
relief

Copyright © 2014 Quanta Services Inc. Confidential & Proprietary 15 .
Perfect Storm: Aging Workforce + Aging Assets = Reliability Decline Requirement: Programs to attract, train and develop engineers, linemen,
station electricians, P&C resources, and other technical resources
5
16
232222
9
2
19
31
2321
4
0
5
10
15
20
25
30
35
The U.S. utility workforce is getting old … % of workers by age group, 2011
…limiting the labor pool for utilities
▪ Utility workforce not adequately replenished
▪ Recession has hurt development effort
▪ Long training lead times ▪ Limited utility labor supply
~50% of workers will be eligible for retirement in the next 5-10 years
20-24 25-34
35-44 45-54 55-64 65+ U.S. average Electric power generation and T&D
Grid Transformation Headwind: Aging Workforce
Copyright © 2014 Quanta Services Inc. Confidential & Proprietary 16 .
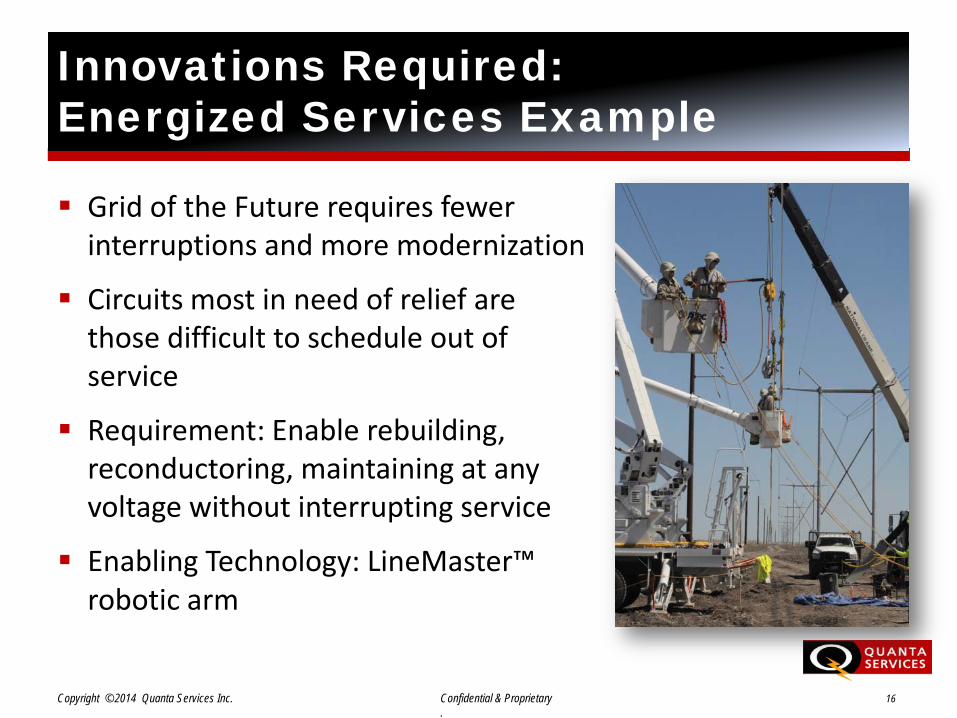
Grid of the Future requires fewer interruptions and more modernization
Circuits most in need of relief are those difficult to schedule out of service
Requirement: Enable rebuilding, reconductoring, maintaining at any voltage without interrupting service
Enabling Technology: LineMaster™ robotic arm
Innovations Required: Energized Services Example

Copyright © 2014 Quanta Services Inc. Confidential & Proprietary 17 .
Demand For Electricity Will Increase Population growth, electric vehicles, use of renewable
energy, etc.
U.S. Fuel Transformation Will Occur Dash to gas, renewable surge, plant retirements
G, T & D Investment Will Increase Infrastructure Investment - Electric utility industry will
require up to $2 trillion by 2030, including generation (EEI) Grid Will Be Made Smarter, Reliable, Resilient, Secure
Advancements in technology and skilled workforce Customers Will See Value Beyond Commodity
Increased choices, digital age reliability, comfort value
Societal and U.S. Economic Goals Met Sustainability and support of growing U.S. economy
Grid of the Future: Roadmap
Copyright © 2014 Quanta Services Inc. Confidential & Proprietary 18 .
The 21st Century Customer must see Electricity beyond a Commodity and be informed on the Societal and Personal Comfort Benefits that Electricity provides…
We need to create the Electricity Value Proposition with Digital Age Reliability built with Grid Investment, Technology and "Smart Services" for Customer Choices and Comfort…
The Next Generation, some among us here today, will develop the Breakthrough Strategies and Technologies needed for the Grid of their Future.
U.S. Grid of the Future