Jj Taboada C Rays Climate
25
Cosmic Rays: Influences on Climate and Meteorology Juan J. Taboada MeteoGalicia
-
Upload
miguel-morales -
Category
Technology
-
view
278 -
download
0
Transcript of Jj Taboada C Rays Climate

Cosmic Rays: Influences onClimate and Meteorology
Juan J. TaboadaMeteoGalicia

Outline of the talk
• First part: A new arising (and controversial) paradigm: Cosmoclimatology.
• Second part: Interactions between sun activity (thatmodulates cosmic rays) and different patterns thatinfluences climate and meteorology:
•Modes of low-frequency variability (NAO)•Weather types•Artic Oscillation•Blocking activity.


¿What is the link between climate/meteorology and cosmicrays?
Solar wind modulates the flux of high energy particles coming from outside the solar system. Theseparticles, the cosmic rays, are the dominant source of ionization in the troposphere. A more active sun implies lower tropospheric ionization.

¿How does it work the link between clouds and cosmicrays?

¿How does it work the link between clouds and cosmicrays?
Electrons set free in the air by cosmic rays help to assemble molecules of sulfuric acid for cloudcondensaion nuceli on which watervapour condenses to make clouds.

¿Does this mechanism work in the real atmosphere?
Forbush Decreases: Sudden reduction in the influx of GCR as a result ofexplosive events on the sun. These events provide a natural experiment fortesting hypothesis about solar influences on the Earth.

¿Does this mechanism work in the real atmosphere?
Decrease of cloud water content over the world’s ocean as a result of the 5 strongest FD over the period 1987-2007. (From Special Sounder MicrowaveImager (SSM/I).
Svensmark H., Bondo T. and Svensmark J. Cosmic ray decreases affect atmospheric aerosols and clouds. GRL, 2009
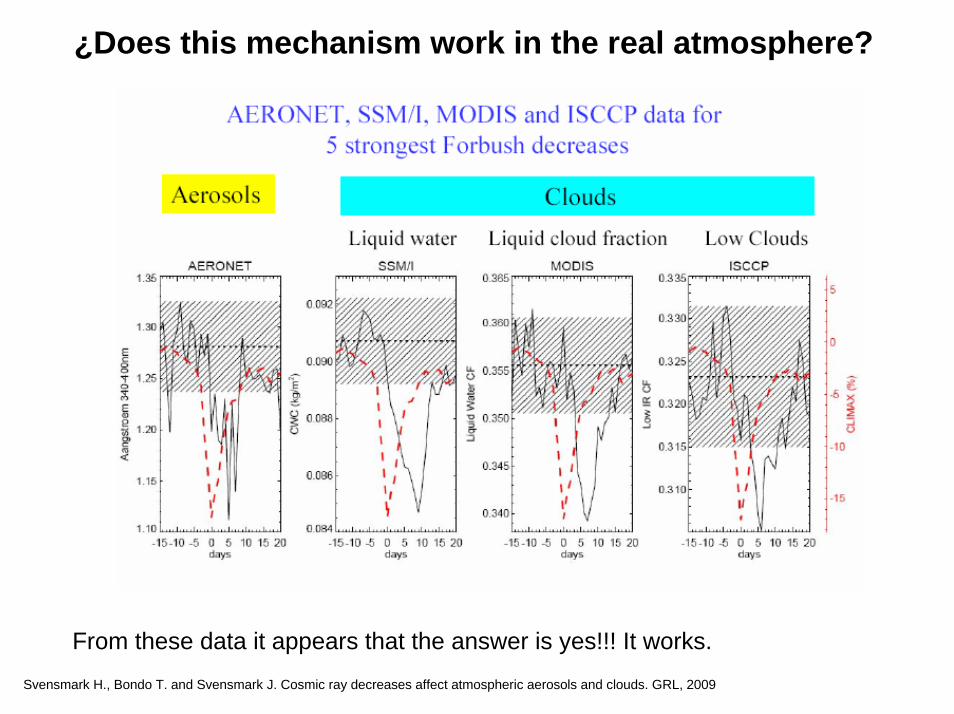
¿Does this mechanism work in the real atmosphere?
From these data it appears that the answer is yes!!! It works.
Svensmark H., Bondo T. and Svensmark J. Cosmic ray decreases affect atmospheric aerosols and clouds. GRL, 2009

Observations
Clouds have been observed from space since the beginning of the 1980's. Using the satellite data, Henrik Svensmark of the Danish National Space Center in Copenhagen has shown that cloudcover varies in sync with the variable cosmic ray flux reaching the Earth. More cosmic raysmean more low level clouds.

¿Is this modulation important for climate? Concept ofradiative forcing
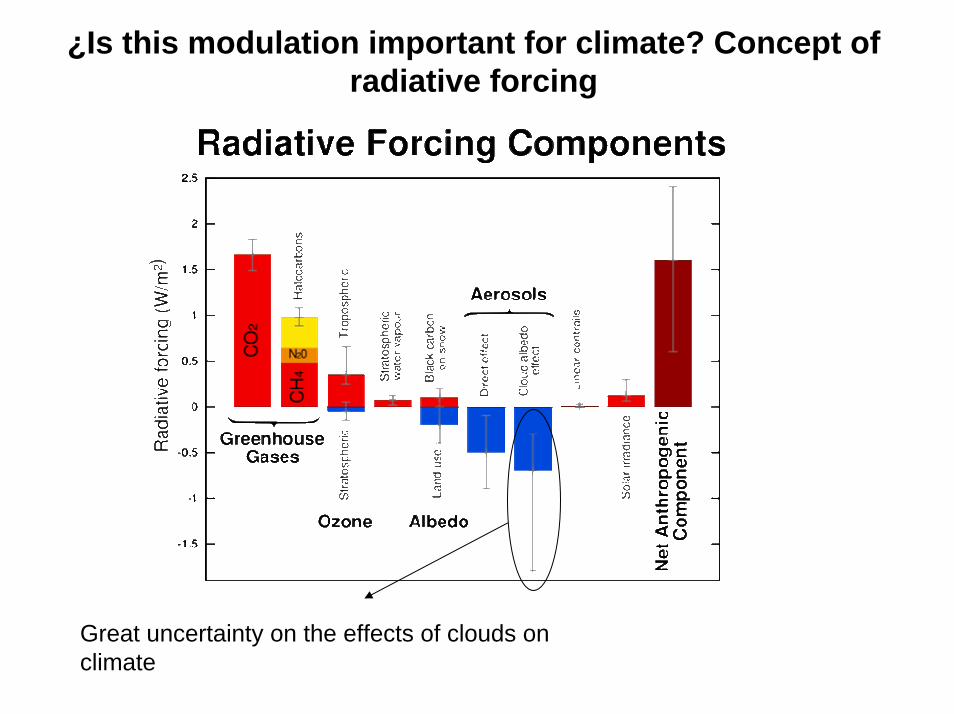
¿Is this modulation important for climate? Concept ofradiative forcing
Great uncertainty on the effects of clouds onclimate

Cosmoclimatology: Reconstruction of past climatechanges
The solar system periodically crosses the spiral arms of the Milky Way. Each time it does so, it should witness an elevated level of cosmic rays. In fact, the cosmic ray flux variations arising from our galactic journey are ten times larger than the cosmic ray flux variations due to solar activity modulations, at the energies responsible for the tropospheric ionization (of order 10 GeV).
Shaviv & J. Veizer, "A Celestial driver of Phanerozoic Climate?", GSA Today 13, No. 7, 4, 2003.N. Shaviv, "Cosmic Ray Diffusion from the Galactic Spiral Arms, Iron Meteorites, and a Possible Climatic Connection", Physical Review Letters 89, 051102, (2002).

Interactions betwen solar activity and climate variability

Modes of low frequecy variability
EANAO
EA/WR
15
SCA

Correlations of different patterns with rainfall (DJF) in Galicia (1980-2006)Lorenzo and Taboada, JAOS, 2005 16
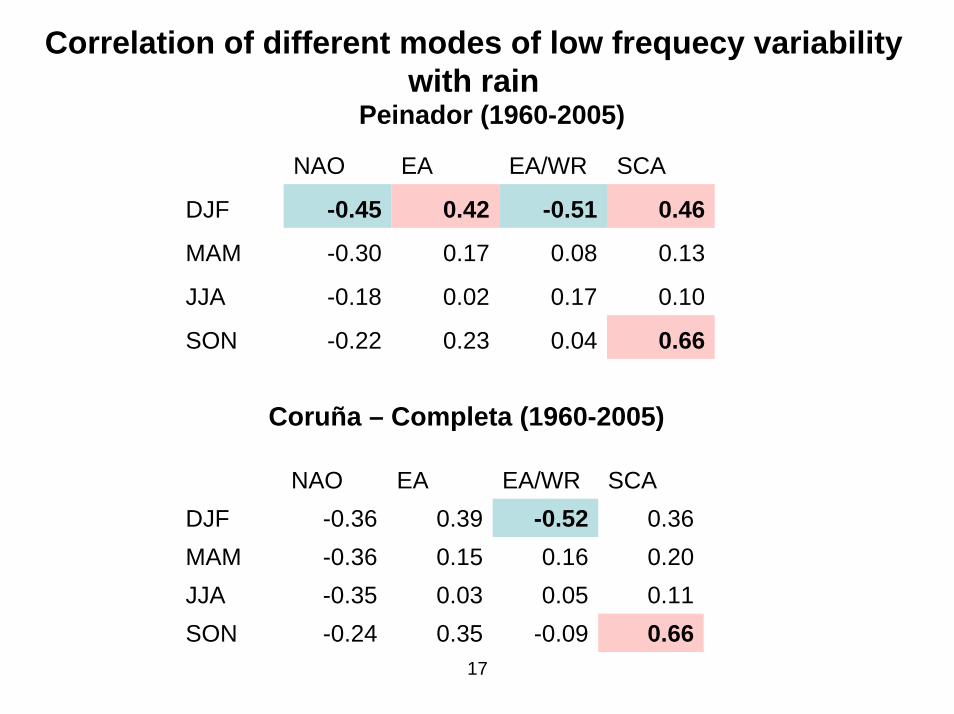
Peinador (1960-2005)
NAO EA EA/WR SCA
DJF -0.45 0.42 -0.51 0.46
MAM -0.30 0.17 0.08 0.13
JJA -0.18 0.02 0.17 0.10
SON -0.22 0.23 0.04 0.66
Coruña – Completa (1960-2005)
NAO EA EA/WR SCADJF -0.36 0.39 -0.52 0.36MAM -0.36 0.15 0.16 0.20JJA -0.35 0.03 0.05 0.11SON -0.24 0.35 -0.09 0.66
Correlation of different modes of low frequecy variabilitywith rain
17

Variariability of the correlation over time: Influence ofsolar activity
18
High correlation between theinteraction of NAO withclimate variability in Galicia and solar activity
Estación Peinador (Vigo)
-0.7-0.6-0.5-0.4-0.3-0.2-0.1
00.10.20.30.4
1955 1960 1965 1970 1975 1980 1985 1990
Media SS 20 años corr. NAO-Lluvia (20 años)
¿Change of circulationregime in North Hemisphereat mid 70´s?

Peinador (1960-2005)
NAO EA EA/WR SCA
DJF 0.15 0.70 0.10 -0.24
MAM 0.17 0.15 0.16 -0.57
JJA 0.04 0.13 -0.37 -0.46
SON -0.08 0.20 0.16 -0.61
Coruña – Completa (1960-2005)
NAO EA EA/WR SCADJF 0.25 0.73 0.08 -0.24MAM 0.12 0.29 0.26 -0.50JJA 0.03 0.15 -0.27 -0.33SON -0.31 0.35 0.08 -0.51
Correlation of different modes of low frequecy variabilitywith temperature
19

20
• Automatic clasification of weather types
ZWZSZWFSFF
ppppppppZWppp
pppppppppZSppppWF
ppppppSF
+=+=
+−+−+−+=+++
++−++−++=+−+=
++−++=
21222198981615
1173
1284139514106
541312
12841395
)(
)](5.0)(5.0[91.0)](5.0)(5.0[12.1)]2(25.0
)2(25.0)2(25.0)2(25.0[85.0)](5.0)(5.0[
)]2(25.0)2(25.0[350.1
1. Direction of flow was given by tan-1(WF/SF), 180° being added if WF is positive. The appropriate direction was computed using an eight-point compass, allowing 45° per sector.
2. If |Z|<F, flow is essentially straight and considered to be of a pure directional type (eight different cases, according to the directions of the compass).
3. If |Z|>2F, the pattern was considered to be of a pure cyclonic type if Z>0, or of a pure anticyclonic type if Z<0.
4. If F<|Z|<2F, flow was considered to be of a hybrid type and is therefore characterized by both direction and circulation (8 x 2 different types).
Weather types

0%
20%
40%
60%
80%
100%
1 2 3 4 5 6 7 8 9 10 11 12
NNWWSWSSEENEAC
Frequency of appearance of different weather types in Galicia in differentmonths.
21
M.N. Lorenzo, J.J. Taboada and L. Gimeno. “Links between circulation weather types and teleconnection patterns and their influence on precipitation patterns in Galicia (NW Spain)”. International Journal of Climatology 2008.

Each weather type explains different quantities of rain
Tipo Annual Winter Spring Summer Autumn
NE 0.91 1.22 0.77 0.87 1.06
E 1.86 3.18 1.94 0.74 1.69
SE 2.36 2.94 1.82 0.33 2.45
S 3.02 5.00 2.70 0.43 2.61
SW 10.31 13.64 9.26 3.48 9.61
W 11.80 14.63 9.79 4.35 14.05
NW 5.37 8.99 4.86 2.43 5.86
N 1.70 3.47 1.57 1.05 2.01
C 13.41 15.34 13.57 6.63 17.22
A 0.21 0.31 0.28 0.08 0.21
22
Outlook
•¿Does sun activity correlate with frequency of appearance of different WeatherTypes?. Work in progress – Diego Ramos
Preliminary results for other areas of Europe (Huth et al. 2002) shows interestingresults.
• ¿Does the effects on blocking activity (BarrioPedro et al., 2008) has aninfluence on Galician climate variability?• ¿Does the effects on modes of oscillation has an influence on Galician climatevariability?
The whole picture until now shows an enhanced zonalityunder solar maxima


Thank you very much for yourattention